for personal use only - asx · this presentation has been prepared by tfs corporation ltd (tfs)....
TRANSCRIPT
TFS Corporation Ltd
FY14 Full Year Results Frank Wilson, CEO
Alistair Stevens, CFO/COO
For
per
sona
l use
onl
y

TFS CORPORATION LTD | 2
Important Notice and Disclaimer
This presentation has been prepared by TFS Corporation Ltd (TFS).
This presentation is not a product disclosure statement or prospectus for the purposes of the Australian Corporations Act 2001 (Cth), nor does it
constitute financial product or investment advice or a recommendation, offer or invitation by any person or to any person to sell, purchase or
otherwise invest in securities in TFS in any jurisdiction. Neither this presentation nor anything in it shall form the basis of any contract or commitment.
This presentation contains general information only and does not take into account the investment objectives, financial situation and particular needs
of individual investors. Investors should make their own independent assessment of the information in this presentation and obtain their own
independent advice from a qualified financial adviser, lawyer, accountant, tax or such other adviser as considered appropriate having regard to their
objectives, financial situation and needs before taking any action.
The information in this presentation contains historic information about the performance of TFS and securities in TFS (or any other financial product).
That information is historic only, and is not an indication or representation about the future performance of TFS or securities in TFS (or any other
financial product). You should not place undue reliance on any such information.
No representation or warranty, express or implied, is given as to the accuracy, completeness, reliability or adequacy of any statements, estimates,
opinions or other information, or the reasonableness of any assumption or other statement, contained in this presentation. Nor is any representation
or warranty, express or implied, given as to the accuracy, completeness, likelihood of achievement or reasonableness of any forecasts, prospective
statements or potential returns contained in this presentation. Such forecasts, prospective statements or potential returns only reflect subjective views
held by TFS, and are based on certain assumptions made by TFS, as at the date specified in the relevant information and are by their nature subject
to significant uncertainties and contingencies, many of which are outside the control of TFS. Actual events and results may vary from the events or
results expressed or implied in such statements. Given theses uncertainties, you should not place undue reliance on any such statements.
To the maximum extent permitted by law, TFS and its related bodies corporate, directors, officers, employees, advisers and agents disclaim all
liability and responsibility (including without limitation any liability arising in negligence, statute or otherwise) for any direct or indirect loss or damage
which may arise or be suffered by any person through use or reliance on anything contained in, or omitted from, this presentation.
An investment in TFS securities is subject to investment and other known and unknown risks, some of which are beyond the control of TFS. TFS
does not guarantee any particular rate of return or the performance of TFS securities.
The distribution of this presentation including in jurisdictions outside Australia, may be restricted by law. Any person who receives this presentation
must seek advice on and observe any such restrictions.
For
per
sona
l use
onl
y

Section 1:
OVERVIEW
For
per
sona
l use
onl
y

TFS CORPORATION LTD | 4
Financial Results – Record Results
NPAT
$82.5m
-1%
Dividend
3¢ p/s
-
NTA
$363.3m
+61%
Cash EBITDA
$51.4m
YOY Change:
+48%
For
per
sona
l use
onl
y

TFS CORPORATION LTD | 5
Operational Results – Strong Growth
TFS Owned1
3,167ha
+52%
FY14 Planting
1,587ha
+34%
Total Estate
9,085ha
YOY change:
+19%
Note 1: TFS Owned = direct ownership plus effective indirect ownership
For
per
sona
l use
onl
y

TFS CORPORATION LTD | 6
A Year of Significant Progress
Record profitability
Strong increase in direct plantation ownership
Landmark supply agreement with Galderma
Completion of first harvest
Record sales value of financial product, including new institutional investors
Successful institutional placement
Appointment of new independent Non-Executive Chairman and new CFO
For
per
sona
l use
onl
y

Section 2:
FINANCIAL RESULTS
For
per
sona
l use
onl
y

TFS CORPORATION LTD | 8
Financial Results
+ 48% on FY13
- 1% on FY13
+ 61% on FY13
Dividend
of 3¢
20.2
25.9
55.7
82.5
2011
2012
2013
2014
NPAT ($m)
169.3
177.4
225.6
363.3
2011
2012
2013
2014
NTA ($m)
4.75
0.00
3.00
3.00
2011
2012
2013
2014
Dividend Per Share (¢)
23.9
23.8
51.8
51.4
2011
2012
2013
2014
Cash EBITDA ($m)
For
per
sona
l use
onl
y

TFS CORPORATION LTD | 9
Operational Results
+ 19% on FY13
+ 52% on FY13
+ 6% on FY13
+ 34% on FY13
63.5
43.1
84.9
89.8
2011
2012
2013
2014
Financial Product Sales
($m)
Note 1: TFS Owned = direct ownership plus effective indirect ownership
979
1,377
2,083
3,167
2011
2012
2013
2014
TFS Owned Estate1
at 30 June (Ha)
1,204
1,426
1,181
1,587
2011
2012
2013
2014
Total New Plantings
(Ha)
5,000
6,426
7,607
9,085
2011
2012
2013
2014
Total Estate Size
at 30 June (Ha)
For
per
sona
l use
onl
y

TFS CORPORATION LTD | 10
Plantation Assets
Kingston Rest
Area: 1,900 ha
Tree Age: 2 - 4 year old
Ownership: Institutional / TFS
Kununurra
Area: 3,800 ha
Tree Age: 0 - 14 year old
Ownership: MIS / TFS
Douglas Daly
Area: 700 ha
Tree Age: 0 - 1 year old
Ownership: Institutional / MIS
/ TFS
Katherine
Area: 1,800 ha
Tree Age: 0 - 2 year old
Ownership: Institutional / TFS
Burdekin
Area: 900 ha
Tree Age: 0 - 2 year old
Ownership: Institutional /
MIS / TFS
Owner (ha) FY14 FY13 FY12
Institutional 3,188 2,818 2,455
MIS + High Net Worth 3,588 3,441 3,325
TFS (direct ownership only) 2,309 1,348 646
Total 9,085 7,607 6,426
For
per
sona
l use
onl
y

TFS CORPORATION LTD | 11
Biological Asset Valuation
• Biological assets increased to $348m, up 82% on FY13, reflecting increased investment in
direct tree ownership and increased tree maturity
• Directly owned plantations increased by 71% to 2,309ha mainly due to the acquisitions of
354ha in July 13 from retail growers and 364ha in June 14 from an institutional grower
• No changes were made to TFS's valuation methodology in FY14
Key Assumptions Assumption
at 30 June 2014 Comments
Number of TFS owned trees 1,015,485 From annual inventory count
Expected heartwood at
harvest TFS projections Based on extensive TFS and industry research
Oil content 3.7% Based on research and actual results
Oil price US$2,500 Based on latest public ledger – not inflated
FY14 oil sales: average of AU$4,742
FX US$0.93c : AU$1.00 Actual at 30 June 2014
Harvest and processing
costs $16,000 per kg and $207 per kg of oil Expected costs inflated at 3.0% pa
Discount rate 12-14% Rate applied is dependent on tree age
For
per
sona
l use
onl
y

TFS CORPORATION LTD | 12
Revenue Up 13%
• Total revenue up 13% to $212m primarily due to higher sales and services ($116m, up
30%) and the revaluation (SGARA) of TFS's biological assets ($65m1, up 3%)
• FY14 financial product sales increased by 6% due to a more accretive mix - average
establishment fee increased by 21% and volume of hectares sold decreased by 12%
• Strong pipeline of financial product sales for FY15
+ 13% on FY13
- 12% on FY13
Note 1: Being the gains on revaluation of plantations ($63.3m) and settlement of trade debtors ($1.3m)
111,037
126,838
187,688
212,221
2011
2012
2013
2014
Total Revenue ($000)
1,120
694
1,675
1,477
2011
2012
2013
2014
Financial
Product Sales (Ha)
For
per
sona
l use
onl
y

TFS CORPORATION LTD | 13
Mount Romance ("MRA") Processing Facility
• Increasing contribution from MRA due to the first sales of oil from TFS grown trees
• Indian sandalwood oil sales in FY14 totalled 514kg with no sales in FY13
• Both sales and contribution from MRA are expected to increase strongly in FY15
o Sales of Indian sandalwood expected to more than double
+ 11% on FY13
+ 37% on FY13
18,809
16,887
18,991
21,154
2011
2012
2013
2014
Revenue ($000)
4,339
2,288
2,493
3,424
2011
2012
2013
2014
Contribution ($000)
For
per
sona
l use
onl
y

TFS CORPORATION LTD | 14
Higher Operating Costs
• Increase in plantation costs (up 47%) due to increase in owned plantations (up 71%)
• Salary costs up 19% due to investment in human resources
• Benefits of scale expected to be evident in FY15 as TFS has invested ahead of the
growth curve to maintain its industry leading forestry capability
+ 1% on FY13
+ 47% on FY13
14.3
21.5
16.7
24.6
2011
2012
2013
2014
Plantation Expenses ($m)
6.1
11.0
12.8
12.9
2011
2012
2013
2014
Corporate Costs ($m)
For
per
sona
l use
onl
y

TFS CORPORATION LTD | 15
Cash-Flow
86.8
18.4
13.0 19.1
6.4
56.5
104.9
64.4
6.3 88.6
$0
$50
$100
$150
$200
$250
Cash at 01/07/13
Receipts from Operations
Equity Issue Operating Costs
Plant and Equipment
Payments for own
Plantations
Finance Charges
Dividend Other Cash at 30/06/14
$m
For
per
sona
l use
onl
y
TFS CORPORATION LTD | 16
Sources of Capital
• Gearing ratio (net debt / equity + net debt) reduced to 13.1% (FY13: 24.9%)
o Settlement of tree and land acquisition occurred in July ($35m) – gearing ratio at
30 June 14 is 18.5% after adjusting for this transaction
• TFS’s debt funding is US$150m of 11% senior secured notes (issued in 2011) with a
maturity date of July 2018
• From July 2015, some or all of the notes can be redeemed at a premium of 8%, the
premium reduces further to 4% from July 2016
• High yield bond market has recently seen record levels of issuance at historically low
levels of interest
• During FY15, TFS will assess the refinancing of the corporate bond, taking into
consideration cost and expected capital requirements
For
per
sona
l use
onl
y

Section 3:
BUSINESS UPDATE
For
per
sona
l use
onl
y
TFS CORPORATION LTD | 18
Strategic Overview
• TFS is a vertically integrated business that creates value by participating in the "soil to
oil" cycle
• The supply and demand characteristics of the Indian sandalwood market continue to
move in favour of TFS - both demand for wood and, in particular, oil and TFS's share of
supply are increasing
• Developments in 2014, in particular the contract for pharmaceutical oil at US$4,500 per
kg with Galderma, point to an enhanced value chain of soil to oil - to skin
• TFS intends to continue to increase its direct ownership of trees, by both establishing
new plantations and acquiring established plantations
For
per
sona
l use
onl
y
TFS CORPORATION LTD | 19
Sale of First MIS Harvest
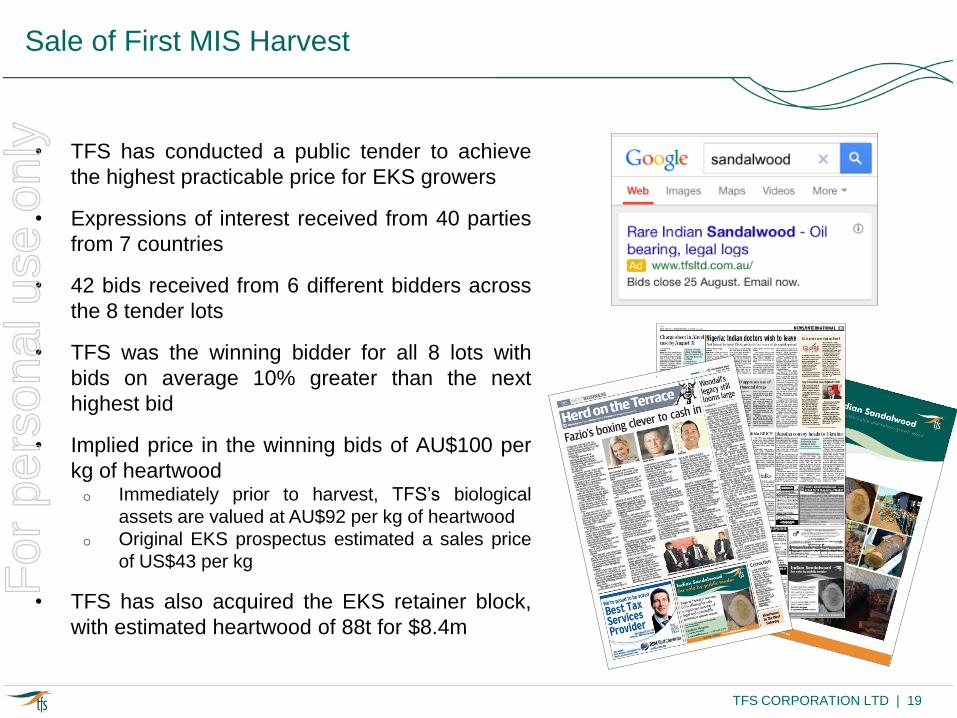
• TFS has conducted a public tender to achieve
the highest practicable price for EKS growers
• Expressions of interest received from 40 parties
from 7 countries
• 42 bids received from 6 different bidders across
the 8 tender lots
• TFS was the winning bidder for all 8 lots with
bids on average 10% greater than the next
highest bid
• Implied price in the winning bids of AU$100 per
kg of heartwood o Immediately prior to harvest, TFS’s biological
assets are valued at AU$92 per kg of heartwood
o Original EKS prospectus estimated a sales price
of US$43 per kg
• TFS has also acquired the EKS retainer block,
with estimated heartwood of 88t for $8.4m
For
per
sona
l use
onl
y

TFS CORPORATION LTD | 20
Strong Sales Pipeline for FY15
• Good progress with financial product sales up 6% from a broader investor base
o Sales to high net worth investors up 33%, with untapped demand identified for FY15
o Two new Beyond Carbon investors – institutions from UK and Australia
o Institutional sales down 12% but average establishment fee up 34%
• Performance fee income will be a significant source of future value creation
o TFS earns a performance fee on all Beyond Carbon and high net worth sales
o No value attributed to this future income stream in the FY14 results
• Continued evolution of products in FY15
o Put options included in certain FY14 products - to reduce the investment risk and
provide TFS with a potential path to increased tree ownership
o Opportunity to increase establishment fees in FY15
• Strong pipeline of demand for FY15
o FY14 sales did not include sales to either of TFS’s original institutional investors
o Both investors intend to exercise options in FY15 – one conditional agreement for
545ha already signed
o Strong interest from high net worth individuals in Australia
For
per
sona
l use
onl
y

TFS CORPORATION LTD | 21
Forestry Results
• Annual inventory count completed in June and included in FY14 results
• Total trees managed by TFS of 3.9m (FY13: 3.3m)
• Good survival rate of 92% for 2013 plantings
• Low annualised mortality of < 1%
For
per
sona
l use
onl
y

TFS CORPORATION LTD | 22
Continuing Forestry Improvement - Planting
• Largest ever planting year in FY14 with
1,587ha established, up 34% on FY13
• New tree guards allow hybridised broad-
acre spraying machinery to be used in the
plantations – significantly reducing spraying
costs and the volume of herbicide required
• Guards also provide a micro environment
that protects the seedlings during the crucial
period after transplanting
For
per
sona
l use
onl
y

TFS CORPORATION LTD | 23
Continuing Forestry Improvement - Seedlings
• Since 2009 TFS has invested in clonal seed
orchards with a view to improving the quality of
the seedlings used in plantings
• In 2009 progeny from select trees were
established in a controlled trial at TFS’s Chapman
plantations. Measurements in 2013 indicated that
progeny from selected trees were 18% larger in
diameter than the control group
• Seed orchards provided their first significant
harvest in FY13
• Around 50% of sandalwood seedlings in FY14
were genetically selected (compared to c10% in
FY13) For
per
sona
l use
onl
y

TFS CORPORATION LTD | 24
Significant Potential of Pharmaceutical Market
• Unique botanical substance with multiple clinically important dermatological attributes:
o Anti-inflammatory (acne, eczema/dermatitis and actinic keratosis)
o Anti-bacterial (acne, eczema, wound care)
o Anti-fungal (toenails, athletes foot, dandruff, eczema)
o Anti-proliferative (actinic keratosis, skin warts)
• Several products being developed by Santalis Pharmaceuticals Inc (TFS: 50% equity)
o FDA Phase II clinical studies initiated for prescription uses for eczema (pediatric),
actinic keratosis and acne
• US based ViroXis Corporation Inc is developing anti-viral products
o TFS has options over 7% of ViroXis for US$1.5m
o First OTC product licensed to Galderma (targeting near term launch in USA)
o FDA Phase II completed for prescription drug candidate for HPV/ warts
o Initiating FDA pediatric Phase II study for molluscum contagiosum
For
per
sona
l use
onl
y

TFS CORPORATION LTD | 25
Supply Agreement with Galderma
• In February, a landmark deal was finalised with global
dermatology leader Galderma, wholly owned by Nestle,
for the supply of pharmaceutical grade oil
• Long-term supply agreement for TFS pharmaceutical
grade oil at a price of US$4,500 per kg
• Galderma has the potential to consume a large proportion of TFS’s future oil
o Total orders to date of 470 kg (AU$2.3m)
o Wood acquired from EKS growers is likely to be sold to Galderma as
pharmaceutical grade oil in H2CY15
• First consumer product launch planned in the near term for a number of OTC products
o Global launches expected to follow
For
per
sona
l use
onl
y

TFS CORPORATION LTD | 26
Strong Core End Markets
• TFS has strong demand from its core end markets
in China, India and Europe/USA for its range of
natural and sustainable wood and oil products
• From FY15 TFS will supply oil to European fine
fragrance and Chinese body care markets
• From FY16 TFS expects to commence supplying
Chinese wood market with its superior wood
manufacturing logs – none available from early
harvests
• These markets will bid for product at pricing equal
to or in excess of pharmaceutical market
For
per
sona
l use
onl
y

TFS CORPORATION LTD | 27
Strategic Priorities for FY15
• Continue to expand direct ownership of plantations
• Continue development of new end markets
• Continue development of pharmaceutical products
and partners
• New institutional investors in Beyond Carbon
• Develop plans for NT as a long-term operational
hub
• Build land bank for establishment of medium and
long term plantations
• Review refinancing of the bond – significant
opportunity
• Continue Board refresh and expansion
Guidance for FY15:
• NPAT: at least $70m
• Cash EBITDA: improvement of
10% on FY14
• New planting of 1,500ha
For
per
sona
l use
onl
y

TFS CORPORATION LTD | 28
Q&A
For
per
sona
l use
onl
y

APPENDIX
For
per
sona
l use
onl
y
TFS CORPORATION LTD | 30
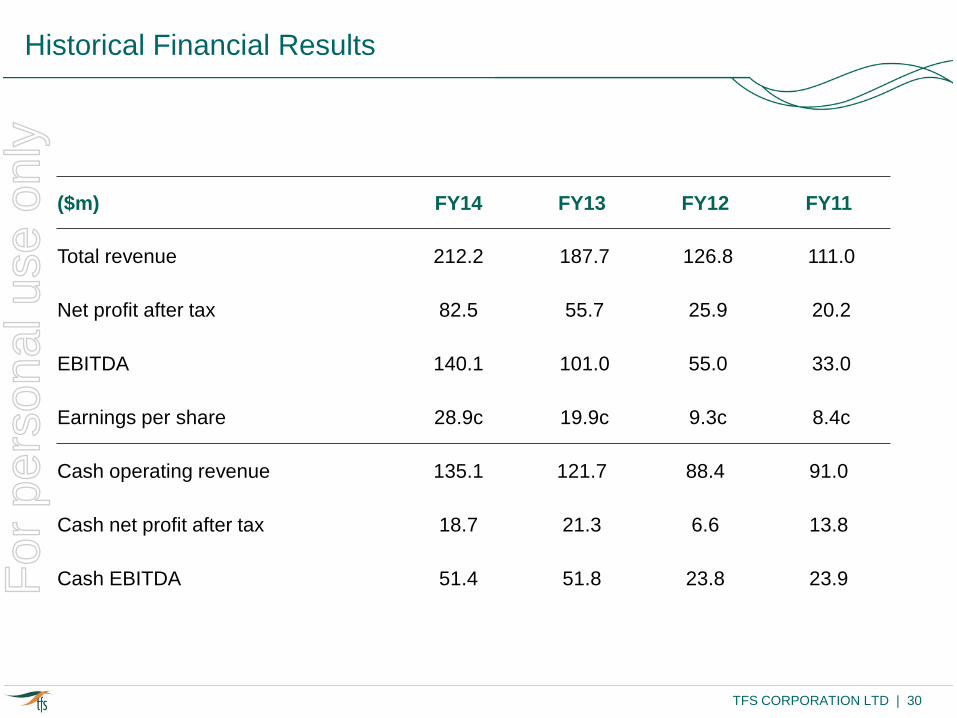
Historical Financial Results
($m) FY14 FY13 FY12 FY11
Total revenue 212.2 187.7 126.8 111.0
Net profit after tax 82.5 55.7 25.9 20.2
EBITDA 140.1 101.0 55.0 33.0
Earnings per share 28.9c 19.9c 9.3c 8.4c
Cash operating revenue 135.1 121.7 88.4 91.0
Cash net profit after tax 18.7 21.3 6.6 13.8
Cash EBITDA 51.4 51.8 23.8 23.9 For
per
sona
l use
onl
y