for personal use only minerals industry. · 2 greenland minerals and energy limited annual reor t...
TRANSCRIPT

AnnUAlRePORT2013
At the forefront of Greenland’s emerging minerals industry.
For
per
sona
l use
onl
y

4 Greenland Minerals and enerGy liMited – AnnuAl RepoRt 2013
direcTorsMichael Hutchinson non-executive ChairmanRoderick McIllree Managing DirectorSimon Cato executive DirectorJohn Mair executive DirectorAnthony Ho non-executive DirectorJeremy Whybrow non-executive Director
CHIef fInAnCIAl OffICeR/ COMPAny SeCRetARyMiles Guy
ReGISteRed And HeAd OffICeUnit 6, 100 Railway Road Subiaco WA 6008Greenland nuugaarmiunt B-847 3921 narsaq, Greenland
HOMe StOCk exCHAnGeAustralian Securities exchange, Perth Code: GGG GGGO
audiTors Deloitte Touche Tohmatsu
SHARe ReGIStRy Advanced Share Registry 150 Stirling Highway nedlands WA 6009
COMPAny WeBSIte www.ggg.gl
Introduction 1Highlights of 2013 2Review of Operations 4
The Historical Backdrop to the Repeal of the Zero-Tolerance Policy 6The Modern era 7The next Steps 8Project Developments in 2013 9Advances to the Refinery Circuit 102013 Field Work in Greenland 11Background Radiation Monitoring 12Geotechnical Mapping 12Stakeholder engagement Program 12Update on the eURARe Project 142013 Summary 14Table of Identified Mineral Resources 16
Annual financial Report 17Corporate Governance Statement 18directors’ report 22Auditor’s independence declaration 47Independent auditor’s report 48director’s declaration 50Statement of profit and loss and comprehensive income 51Statement of financial position 52Statements of changes in equity 53Statement of cash flows 54notes to the accounts 55
1 General information 552 Significant accounting policies 553 Critical accounting estimates and judgments 644 Segmented information 655 Revenue 656 expenditure 657 Income tax expense 678 Cash and equivalents 689 Trade and receivables 68
10 Other assets 6911 Property plant and equipment 6912 Capitalised exploration and evaluation expenditure 7013 Trade and other payables 7214 Other liabilities 7215 Provisions 7216 Issued capital 7317 Reserves 7318 Dividends 7519 Accumulated loss 7520 loss per share 7521 Commitments for expenditure 7622 Subsidiaries 7623 Notes to the statement of cash flows 7724 Share based payments 7725 Financial instruments 8626 Key management personnel compensation 8927 Key management personnel equity holdings 9028 Transactions with related parties 9429 Parent company information 9430 Remuneration of auditors 9531 Subsequent events 95
Additional stock exchange information 96
Contents Corporate DirectoryGreenland Minerals and enerGy lTd - AnnUAl RePORT 2013
For
per
sona
l use
onl
y

Greenland Minerals and energy (“GMe”, or “the Company”) is positioned at the forefront of Greenland’s emerging minerals industry. the Company has been operating in southern Greenland since 2007, with a primary focus on the kvanefjeld rare earth - uranium project.
the kvanefjeld project is unique; ideally located amongst the fjords of southern Greenland, the project area offers direct year-round shipping access, and has an international airport nearby. the mineral resources are world-class. drilling to date has established a 956Mt JORC-code compliant resource base that contains one of the world’s largest resources of both rare earth elements and uranium in near-surface, bulk ore bodies. Clear scope remains to expand this resource base several fold.
feasibility studies on kvanefjeld are well-advanced, with an advantageous and highly effective metallurgical flow-sheet developed by a respected metallurgical team. A prefeasibility study on kvanefjeld (2012), highlighted that the project could be developed as a long-life, cost-competitive specialty metals project, with strong growth potential. Subsequent studies have reinforced the Company’s confidence in kvanefjeld, with multiple revenue streams standing to deliver a robust economic proposition.
kvanefjeld is now recognised as a priority project by the Greenland government, and will be entering the permitting pipeline at the start of 2015.
Introduction
1Greenland Minerals and enerGy lTd - AnnUAl RePORT 2013
For
per
sona
l use
onl
y

2 Greenland Minerals and enerGy liMited – AnnuAl RepoRt 2013
In late October Greenland’s parliament voted in favour of removing a long-standing zero-tolerance policy against the exploitation of radioactive materials. this landmark decision places Greenland on the path to uranium-producer status, and thereby opens up coincident resources of rare earth elements to exploitation. the parliamentary decision received broad coverage in the international press, and sent a strong message that Greenland is prepared to make the important and sometimes difficult decisions that are required to advance the quest of establishing a minerals industry.
As announced in January 2014, Greenland and denmark are working to have a cooperation agreement in place in 2014 to map out the regulatory responsibilities associated with uranium production. Greenland is aiming to be positioned to issue a mining license for kvanefjeld in early 2016. this is in line the Company’s forward schedule and ongoing feasibility program.
technical work programs continued to advance the kvanefjeld project through 2013, and served to progress the de-risking of the project, and build confidence in the advantageous process flow sheet.
test work for the concentrator circuit was completed in late-2012, with the second of two highly successful pilot plant operations. An updated study was then released in March 2013 (the Mine and Concentrator Study), that captured the technical advances to the beneficiation circuit, and the initial 3Mtpa start-up capacity.
An effective hydrometallurgical process route has been developed for the treatment of the rare earth- and uranium-rich mineral concentrates generated via froth flotation. the refinery circuit utilises simple equipment and elegant chemistry, with scaled-up test work in 2013 demonstrating the production of a high purity rare earth intermediate product.
HIGHlIGHTS2013
For
per
sona
l use
onl
y

3Greenland Minerals and enerGy liMited – AnnuAl RepoRt 2013
the Company has been conducting extensive environmental baseline studies in the kvanefjeld project area for several years, as a basis to evaluate the potential environmental impacts of a mining operation. the baseline studies provide an indication of the natural chemistry of the broader project area, and the background concentrations of many chemical elements in soil, water, dust and biological matter.
Comprehensive background radiation monitoring was also undertaken in the broader project area along with the town of narsaq, and builds on data gathered over several years.
2014In 2014, GME is focussed on finalising a mining (exploitation) license for the Kvanefjeld project; the next key milestone. In parallel, the Company is looking to progress relations with potential development partners. With continued de-risking of the world-class Kvanefjeld project, GMe remains focussed on delivering share-holder value.
Greenland’s world class mining opportunity.
For
per
sona
l use
onl
y

4 Greenland Minerals and enerGy liMited – AnnuAl RepoRt 2013
Review of OperationsIn 2013, much of the attention on Greenland Minerals and energy related to political events in Greenland, and the impact that these events would have on how the Company’s Kvanefjeld multi-element project would proceed. Specifically, in late October Greenland’s parliament voted in favour of removing a long-standing zero-tolerance policy against the exploitation of radioactive materials. This landmark decision places Greenland on the path to uranium-producer status, and thereby opens up coincident resources of rare earth elements to exploitation. The parliamentary decision received broad coverage in the international press, and sent a strong message that Greenland is prepared to make the important and sometimes difficult decisions that are required to advance the quest of establishing a minerals industry.
In many respects, Greenland’s removal of the political impedance that had otherwise hindered the development of one of the world’s most prolific resources of both rare earth elements and uranium punctuates 2013 as the most important year in GMel’s history.
The internationally mining community’s strong endorsement of Greenland’s positive uranium vote was highlighted in December at europe’s largest mining conference, hosted in london, where Greenland received the 2013 Country Award under the Mining Journal’s ‘Outstanding Achievements Awards’.
The parliamentary vote on zero-tolerance took place on October 24th, and represented the culmination of several years of discussion and debate in Greenland on whether such a significant step should be taken. As in many places, the viewpoints in Greenland on the exploitation of radioactive materials and nuclear power have been varied, with the topic generating emotive debate in both political and community forums. However, the positive vote represented the critical event that would see Greenland and Denmark progress in earnest to establish the regulatory framework required to responsibly manage the exploitation of radioactive minerals in Greenland. never before, in its multi-decade history, has the Kvanefjeld project had a clearer path to mine development.
Greenland’s push for the development of mining projects accelerated in 2009, when it took the official step of assuming increased self-governance with the move from ‘Home Rule’ to ‘Self Rule’. This major political step provided Greenland with authority to preside over the exploitation of natural resources; an authority that had previously been managed jointly with Denmark. ‘Self Rule’ in Greenland has brought a strong focus on pushing toward a stronger economy, with the aim of establishing a new generation of mining operations to provide the cornerstone. In time, there is a desire for
revenues generated from mining operations to replace and exceed those from Danish block grants that have subsidised Greenland’s economic viability, and to complement revenues from the ailing fishing industry.
This agenda has brought a number of key issues and decisions to the political fore as Greenland prepares the rules and regulations that are required to effectively interface with the international resources industry. Of the key issues, the long-standing zero-tolerance policy against the exploitation of radioactive minerals had been undoubtedly significant, and its repeal would mark another major step by Greenland in its committed quest to establishing quality mining projects, a viable economy, and greater independence.
For
per
sona
l use
onl
y

5Greenland Minerals and enerGy liMited – AnnuAl RepoRt 2013
figure 1. An overview of the Arctic region highlighting renowned major mining operations. It stands as an obvious anomaly that Greenland does not yet have a significant mining operation, particularly in consideration of Greenland’s prospective geology. However, with several large-scale projects now moving through the permitting process, this is expected to change in the coming years. The opening up of the Arctic shipping lanes provides increased access to the Asia-Pacific markets, enhancing Greenland’s appeal to Asian investors.
Greenland - the gateway to the Arctic. F
or p
erso
nal u
se o
nly

6 Greenland Minerals and enerGy liMited – AnnuAl RepoRt 2013
Review of Operations (continued)
the Historical Backdrop to the Repeal of the Zero-tolerance Policy
The presence of significant quantities of uranium resources in southern Greenland has been known for several decades. The Danish government had conducted initial evaluations into extracting uranium from the unique rocks and minerals of the Ilimaussaq complex located near Greenland’s southern tip, between the 1960’s and early 1980’s, largely driven by the consideration of establishing civil nuclear power in Denmark.
The pursuit of nuclear power fell out of political favour in Denmark in the early 1980s, and investigations into establishing a uranium mine in Greenland were halted. In 1988, the zero-tolerance policy concerning radioactive materials was introduced. However, the studies had highlighted the potential for vast resources. Internationally renowned geoscientist Henning Sørensen, who had played a key role in driving the investigations, had put forward geological
resource estimations for well over a billion pounds of uranium oxide to be hosted within the northern portion of the Ilimaussaq complex; the potential for globally-significant resources was clear.
When Denmark ceased the investigations into uranium mining in southern Greenland in the early 1980’s, scientific studies on the extraordinary rocks of the Ilimaussaq complex continued, largely driven by Sørensen and his colleagues. Continued studies led to the recognition that aside from uranium (and thorium), the unique minerals were also strongly enriched in a variety of specialty metals, in particular rare earth elements. This recognition led to the concept of multi-element exploitation; a thesis that has been the focus of the new era of investigations conducted by GMel since 2007.
figure 2. Since 2007, drill programs conducted by Greenland Minerals and Energy have defined one of the largest resources of rare earth elements and ura-nium globally within the northern Ilimaussaq Complex.
For
per
sona
l use
onl
y

7Greenland Minerals and enerGy liMited – AnnuAl RepoRt 2013
the Modern era
Initial drill programs conducted by GMEL in 2007 and 2008 confirmed that resources in the northern Ilimaussaq Complex were indeed polymetallic and were increasingly expansive, as scientists had previously forecast. Drill programs initially focussed on an area known as Kvanefjeld – a broad plateau near the headwaters of the narsaq valley that had been the focal point of historic investigations.
The reinvigoration of mineral exploration at Kvanefjeld led to the zero-tolerance policy and its potential removal being raised for discussion in Greenland’s parliament in late 2008; approximately 25 years since previous evaluations of Kvanefjeld had ceased.
As work programs continued to advance Kvanefjeld, new licensing requirements were necessary to effectively evaluate the project. In September 2010, the Greenland Government, led by the Inuit Ataqatigiit (IA) Party, introduced an amendment to the ‘Standard Terms for exploration licenses in Greenland’. This allowed for organizations to apply for approval from the Bureau of Minerals and Petroleum (BMP) to conduct feasibility studies on potential mining projects which contain elevated concentrations of radioactive elements. At the direction of the government, information briefs on uranium were produced by technical agencies and made available to the populous. A delegation of politicians and government officials then made study tour of Canada to learn more about the Canadian uranium mining industry and its governance.
In november, 2011 the BMP then amended GMel’s exploration license over Kvanefjeld to include uranium. This move provided the Company with the right to apply to exploit uranium along with other economic minerals. This licensing development was important as it created a framework in which a mining application could be submitted for processing by regulators for a project that includes uranium. However, despite these developments, the zero-tolerance policy remained, shrouding Kvanefjeld in political uncertainty.
In the 2012 autumn session of parliament, the Greenland Government initiated a series of reports to address the consequences of removing the zero-tolerance policy. These reports, conducted by independent experts, set out to address the regulatory roles of both Greenland and Denmark in managing uranium exploitation, identify all international conventions that would need to be adhered to, as well as investigating the potential environmental and health risks. The series of reports were completed through the course of 2013, and provided a solid information basis for Greenland to remove the zero-tolerance policy and map out a path to uranium producer status, in accordance with best international practice.
In March, 2013, a national election in Greenland saw the Siumut Party return to power, with a clear intent to remove the zero-tolerance policy, and move to effectively regulate uranium production. The election took place just prior to the time window in which the ‘spring sitting’ of parliament would traditionally take place. With the election result bringing a change of government, the sitting of parliament was deferred until late in 2013, with matters that required parliamentary address being placed on hold until that point.
The debate surrounding uranium exploitation in Greenland has largely been ideological. Interest in the topic has led to an increased awareness of the facts involved in uranium production, nuclear power, and the regulation of the nuclear fuel cycle. This understanding has led to a growing awareness that nuclear power offers the main base-load energy source that does not contribute to carbon-fuelled climate change. The Arctic regions are already feeling the environmental and societal changes that are presented by a changing climate. In this context, Kvanefjeld’s relevance is heightened, with uranium providing an efficient energy source free of carbon emissions, and rare earths being utilised in both efficient energy generation and usage.
Whilst uranium has largely been the political focus on Kvanefjeld, the potential for Kvanefjeld to become a major new supplier of rare earth elements has driven much of the commercial interest. Revenues from uranium have the potential to cover a significant portion of Kvanefjeld’s operating costs, making for cost-competitive rare earth production; an attribute that differentiates Kvanefjeld from other emerging projects slated to have significant rare earth production.
With a growing awareness that the northern Ilimaussaq Complex is host to one of the most significant resources of both rare earth elements and uranium globally, Greenland’s decision to repeal the zero-tolerance policy could ultimately influence the global supply of these important elements for many decades.
For
per
sona
l use
onl
y

8 Greenland Minerals and enerGy liMited – AnnuAl RepoRt 2013
Review of Operations (continued)
the next Steps
With the zero-tolerance policy removed, Green-land and Denmark are now progressing toward the establishment of a cooperation agreement to map out the responsibilities required to ef-fectively regulate uranium production. In early January, the Danish Prime Minister outlined that both parties were aiming to have the cooperation agreement in place in 2014. In early February, a delegation of Greenlandic officials conducted another fact-finding visit, this time to Australia where they visited Olympic Dam, the rehabili-tated uranium mine Mary Kathleen (Queens-land), and the Australian nuclear Science and Technology Organisation (AnSTO) in Sydney. While there remains further work to ensure all regulations are in place, Greenland has indicated a desire to be positioned to grant exploitation licenses for projects that include radioactive materials in 2016.
These developments bring increased clarity to the forward timeline for the Kvanefjeld project, which has been otherwise hindered whilst the zero-tolerance policy remained. In parallel to the establishment of regulations, GMel can now work to finalise an exploitation license applica-tion. This involves finalising the development strategy in close consultation with Greenland stakeholders, with the key decision being wheth-er refining of mineral concentrates takes place in Greenland, or offshore. The Company will then work to complete the environmental and social impact assessments, which build on many years of extensive data generation for the base lines studies. Subject to financing, the Company is aiming to be in a position to lodge an exploitation license application in early 2015, and Greenland should be positioned to award an exploitation license in 2016.
figure 3. GME has looked to support community initiatives in south Greenland, and has worked to ensure local participation and employment opportunities.
For
per
sona
l use
onl
y

9Greenland Minerals and enerGy liMited – AnnuAl RepoRt 2013
Project developments in 2013
Technical work programs continued to advance the Kvanefjeld project through 2013, and served to progress the de-risking of the project, and build confidence in the advantageous process flow sheet. In May, 2012 GMEL released a prefeasibility study on the Kvanefjeld rare earth – uranium project. The prefeasibility study (PFS) was based upon substantial test work and technical studies, and involved a rigorous flow-sheet selection process to determine the optimal means of treating Kvanefjeld ores. The PFS outcomes indicated the clear potential for Kvanefjeld to be developed as a long-life, cost-competitive producer of rare earth concentrates and uranium oxide.
Since the release of the Kvanefjeld PFS, further technical advances were made that served to improve the PFS outcomes significantly. A PFS update was released in August 2012 outlining simplifications to the proposed processing circuit that result in a reduction in capital costs, and a 27% increase in the output of rare earth concentrate. The substantial increase in rare earth recovery and output drove the Company to evaluate a smaller start-up capacity for Kvanefjeld than the 7.2 Mt capacity evaluated in the PFS. A reduction in the initial rare earth production capacity would reduce the market risk brought about by the material improvements in rare earth recovery, and also serves to significantly reduce the capital costs of project development.
For these reasons, the Company looked to a staged development strategy with an initial mine-throughput of 3Mtpa, expanding to 6Mtpa. This provides a low-risk path to ultimately reach a large-scale production capacity.
Test work for the concentrator circuit was completed in late-2012, with the second of two highly successful pilot plant operations. An updated study was then released in March 2013 (the Mine and Concentrator Study), that captured the technical advances to the beneficiation circuit, and the initial 3Mtpa start-up capacity. With a high degree of confidence in the ability to produce a low-mass, high-grade mineral concentrate, the Company commenced assessing the potential to export the mineral concentrate from Greenland, for processing offshore. There are many points to consider in the assessment of this scenario. Through 2013 workshops were held with representatives of Greenland’s government and regulatory bodies, the outcomes of which indicated a general position to see as much processing take place in Greenland as possible. Ultimately, the Company is looking to firm-up the best scenario over the longer term, and the optimal outcome for Greenland stakeholders.
figure 4. Pilot plant operation of the Kvanefjeld concentrator circuit proved to be highly successful, and came as a precursor to the completion of the Mine and Concentrator Study, released in 2013. F
or p
erso
nal u
se o
nly

10 Greenland Minerals and enerGy liMited – AnnuAl RepoRt 2013
Review of Operations (continued)
Advances to the Refinery Circuit
An effective hydrometallurgical process route has been developed for the treatment of the rare earth- and uranium-rich mineral concentrates generated via froth flotation. The refinery circuit utilises simple equipment and elegant chemistry, with scaled-up test work in 2013 demonstrating the production of a high purity rare earth intermediate product. The refinery flow sheet utilises a sulphuric acid leach that achieves high extraction levels of both uranium and rare earth elements from the Re and uranium-rich minerals; in particular the heavy Rees. The uranium is stable in solution in the leach liquor, whereas the rare earths react to form solid Ree salts that remain with the leach residue. This creates a very effective break between the uranium recovery, and further treatment steps to generate a clean, high purity rare earth product. In Q3, 2013 a full flow sheet laboratory test run on the Kvanefjeld mineral concentrate produced 1.1 kg’s of a high-purity mixed rare earth carbonate.The rare earth intermediate product is a chemical precipitate formed by the addition of sodium carbonate to a purified rare earth chloride stream. This produces a mixed rare earth carbonate intermediate product. It is low in impurities and contains >95% rare earth oxide (ReO) after calcination. The rare earth carbonate product has a favourable ReO distribution with 14.75% of the contained rare earths being the more valuable heavy Re elements (see Table 1).The concentrate also contains a significant quantity of the major light RE magnet components in praseodymium and neodymium.low levels of calcium (1.26%), aluminium (0.12%) and silica (0.5%) were the most significant impurities. Very low levels of uranium (11 ppm), lead (1.4 ppm) and thorium (2.5 ppm) were measured in the sample by tests conducted by AnSTO, which reveals how well these radionuclides were controlled by the impurity removal processes.A subsequent program involved a 100 hour weak acid leach test on 20 kg’s of mineral concentrate. This aimed to ensure that silica could be effectively managed through the weak acid leach as the key ore minerals at Kvanefjeld are phospho-silicate minerals. The management of silica in the leach process remains a challenge for many proposed Ree producing operations that are dealing with silicate minerals; most of which involve significantly lower-grade minerals than steenstrupine; the dominant Ree and uranium bearing mineral at Kvanefjeld. Importantly, the 100 hour leach test has confirmed that silica can be effectively managed throughout the leach process on the Ree-uranium mineral concentrates from Kvanefjeld.
The testwork program also demonstrated that high extractions of Rees and uranium can be readily achieved with the weak acid leaching stage only, owing to the non-refractory nature of the value minerals. A pregnant leach solution containing uranium can be produced which is free of solids providing a suitable feed to uranium solvent extraction. This is achieved using an optimised combination of flocculating chemicals and standard thickeners.The highly successful test work programs on the leach circuit through 2013 served to confirm the effectiveness of the Kvanefjeld refining process in producing a high quality product, with an excellent distribution of the important, or critical, Ree’s. All process steps in the refining stage have now been tested at small continuous scale. The process engineering for the refinery is well advanced with key process design documents completed. The unique non-refractory nature of the Kvanefjeld ore minerals allows for simple, atmospheric acid leach circuits, without the complex high-temperature acid bake or caustic cracking processes that are required in many Re operations.Kvanefjeld is now emerging from peer projects, on the basis of the systematic development of an effective process flowsheet. In contrast, numerous other companies that are pursuing Re production continue to reassess their processing options, which can be partly attributed to complex, highly-refractory styles of mineralisation.
table 1. Distribution of rare earth elements in the intermediate rare earth carbonate produced from Greenland’s Kvanefjeld project. The product contains a favourable distribution of the important heavy REO’s (Eu – Y).
element % ReO distributionla 27.19Ce 37.15Pr 4.57nd 13.42Sm 2.92eu 0.20
14.75% HReO
Distribution
Gd 1.76Tb 0.31Dy 1.36Ho 0.23er 0.60Tm 0.07Yb 0.30lu 0.02Y 9.89
For
per
sona
l use
onl
y

11Greenland Minerals and enerGy liMited – AnnuAl RepoRt 2013
2013 field Work in Greenland
GMel has been conducting extensive environmental baseline studies in the Kvanefjeld project area for several years, as a basis to evaluate the potential environmental impacts of a mining operation. The baseline studies provide an indication of the natural chemistry of the broader project area, and the background concentrations of many chemical elements in soil, water, dust and biological matter. The Ilimaussaq Alkaline Complex is the geological entity that hosts defined mineral resources, and is renowned for its unusual minerals and chemistry. Rocks of the Ilimaussaq Complex are actively eroded into the narsaq valley and surrounding areas, resulting in naturally elevated levels of many trace elements in the surrounding environment. Such an environment
is therefore well-suited for mining and the establishment of processing infrastructure.
The environmental baseline studies have been conducted in conjunction with Orbicon, GMel’s primary environmental consultant. In 2013 a botanical survey was completed and marine biota along the fjord at the base of the narsaq valley were sampled for analysis of ecotoxicological and radioactivate components. Freshwater and stream sediment sampling stations were revisited to build on data gathered in previous years, with samples also to be analysed for ecotoxicology and radioactivity. Terrestrial sampling stations were also revisited with samples of both soils and lichens collected.
figure 5. An overview of the Narsaq Peninsula, south Greenland, and the broader Kvanefjeld project area. Infrastructure to support the proposed mining operation would mostly be located within the Narsaq valley. The Ilimaussaq Complex is comprised of extremely alkaline and unusual rock types that have been actively eroded into the surrounding environment. JORC-code compliant mineral resources have been established at Kvanefjeld, Sørensen and Zone 3. Mining is proposed to commence at the Kvanefjeld deposit which is conducive to simple open-pit mining methods.
For
per
sona
l use
onl
y

12 Greenland Minerals and enerGy liMited – AnnuAl RepoRt 2013
Review of Operations (continued)
Background Radiation Monitoring
Comprehensive background radiation monitoring was also undertaken in the broader project area along with the town of narsaq, and builds on data gathered over several years.
Short term (several days) passive monitoring of radon and thoron was conducted and long term (three month) monitoring devices will be collected sequentially over the coming months. Water and soil samples were also collected for radionuclide analyses. High volume air samplers have recently been installed for the purpose of dust and air monitoring.
A gamma radiation survey was also conducted to repeat the surveys carried out in previous years. new additional points in the narsaq valley were included to provide more detailed coverage from the town of narsaq to where ore material outcrops on the Kvanefjeld plateau.
Geotechnical Mapping
Geological and geotechnical mapping programs were undertaken in areas that are currently being investigated as potential infrastructure sites. These programs set out to assess foundation conditions including rock and soil types, as well as identifying potential geohazards and areas that require further geotechnical drilling. The outcomes provide important information to support the selection of infrastructure locations.
Stakeholder engagement Program
GMel has maintained an active stakeholder engagement program in relation to the Kvanefjeld project since 2008. This has primarily focussed on participating in community hall meetings in the main townships of south Greenland, which includes narsaq, Qaqortoq, and nanortalik. The aim of these meetings is to provide updates on the Kvanefjeld project and potential development scenarios, and importantly to identify the key areas of interest from the local populace. These forums provide the opportunity for local stakeholders to put forward questions, voice concerns and identify areas where they would like further information.
large, outcropping ore bodies allow for simple, low cost, open pit mining.
For
per
sona
l use
onl
y
13Greenland Minerals and enerGy liMited – AnnuAl RepoRt 2013
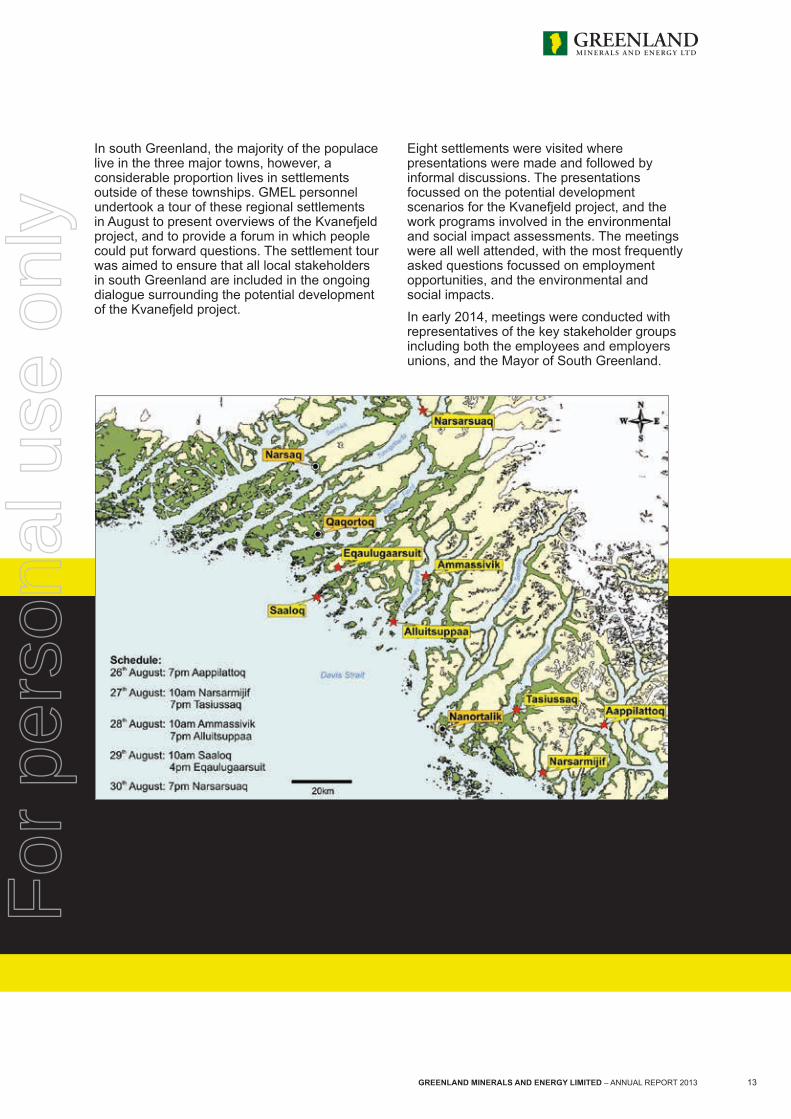
In south Greenland, the majority of the populace live in the three major towns, however, a considerable proportion lives in settlements outside of these townships. GMel personnel undertook a tour of these regional settlements in August to present overviews of the Kvanefjeld project, and to provide a forum in which people could put forward questions. The settlement tour was aimed to ensure that all local stakeholders in south Greenland are included in the ongoing dialogue surrounding the potential development of the Kvanefjeld project.
eight settlements were visited where presentations were made and followed by informal discussions. The presentations focussed on the potential development scenarios for the Kvanefjeld project, and the work programs involved in the environmental and social impact assessments. The meetings were all well attended, with the most frequently asked questions focussed on employment opportunities, and the environmental and social impacts.
In early 2014, meetings were conducted with representatives of the key stakeholder groups including both the employees and employers unions, and the Mayor of South Greenland.
figure 6. An overview of southern Greenland highlighting the three major towns of Qaqortoq, narsaq and nanortalik, and the communities visited on GMel’s settlement tour in August 2013. The Kvanefjeld project is located approximately 10km to the northeast of narsaq. The exercise represented an important part of the Company’s broader stakeholder engagement program, and ensures that efforts have been made to provide forums to discuss the Kvanefjeld project with the majority of the south Greenland populace. F
or p
erso
nal u
se o
nly
14 Greenland Minerals and enerGy liMited – AnnuAl RepoRt 2013
Review of Operations (continued)
Update on the eURARe Project
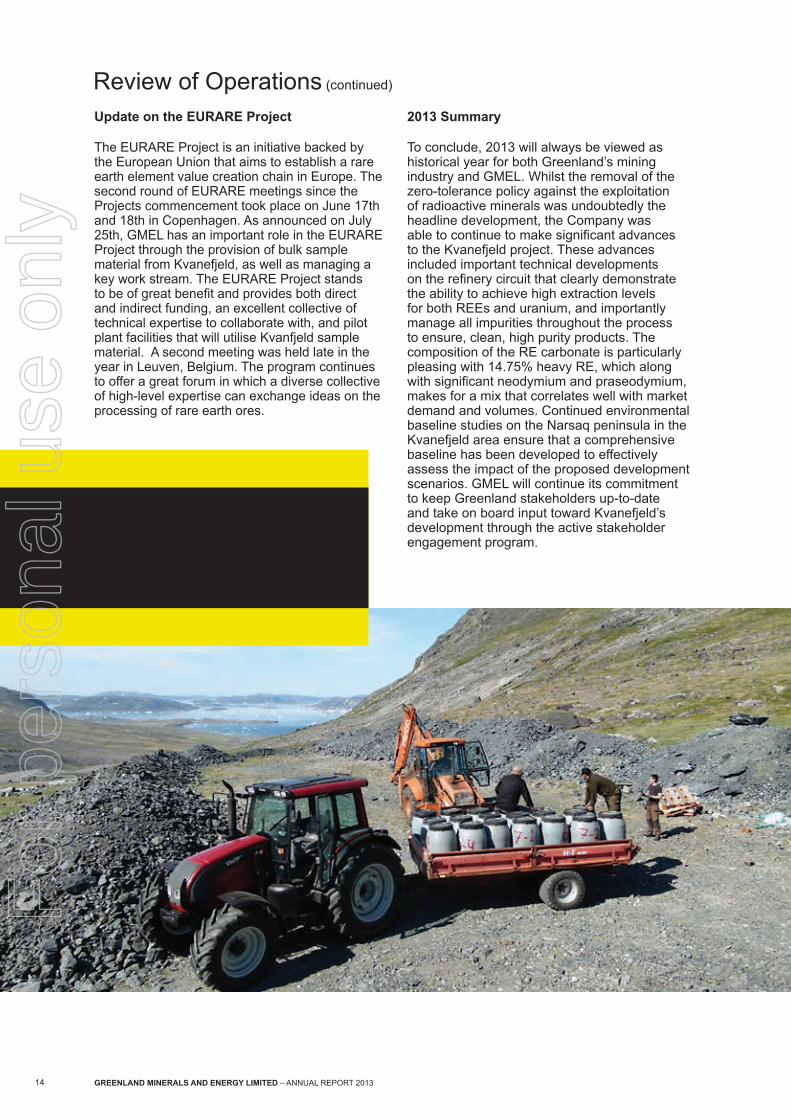
The eURARe Project is an initiative backed by the european Union that aims to establish a rare earth element value creation chain in europe. The second round of eURARe meetings since the Projects commencement took place on June 17th and 18th in Copenhagen. As announced on July 25th, GMel has an important role in the eURARe Project through the provision of bulk sample material from Kvanefjeld, as well as managing a key work stream. The eURARe Project stands to be of great benefit and provides both direct and indirect funding, an excellent collective of technical expertise to collaborate with, and pilot plant facilities that will utilise Kvanfjeld sample material. A second meeting was held late in the year in leuven, Belgium. The program continues to offer a great forum in which a diverse collective of high-level expertise can exchange ideas on the processing of rare earth ores.
2013 Summary
To conclude, 2013 will always be viewed as historical year for both Greenland’s mining industry and GMel. Whilst the removal of the zero-tolerance policy against the exploitation of radioactive minerals was undoubtedly the headline development, the Company was able to continue to make significant advances to the Kvanefjeld project. These advances included important technical developments on the refinery circuit that clearly demonstrate the ability to achieve high extraction levels for both Rees and uranium, and importantly manage all impurities throughout the process to ensure, clean, high purity products. The composition of the Re carbonate is particularly pleasing with 14.75% heavy Re, which along with significant neodymium and praseodymium, makes for a mix that correlates well with market demand and volumes. Continued environmental baseline studies on the narsaq peninsula in the Kvanefjeld area ensure that a comprehensive baseline has been developed to effectively assess the impact of the proposed development scenarios. GMel will continue its commitment to keep Greenland stakeholders up-to-date and take on board input toward Kvanefjeld’s development through the active stakeholder engagement program.
figure 7. The collection of bulk sample material for ongoing metallurgical testwork on the Kvanefjeld project. Ore extracted from the historic adit provides excellent material for scaled-up testwork and pilot plant operations.
For
per
sona
l use
onl
y

15Greenland Minerals and enerGy liMited – AnnuAl RepoRt 2013
Finally, the Company would like to acknowledge shareholders that have made possible the progression of the Kvanefjeld project from a concept in 2007, to what is now recognised globally as quality emerging mining project of strategic significance.
figure 8. Exploration licenses held by Greenland Minerals and Energy over the northern Ilmaussaq Complex, and surrounding areas. JORC-code compliant mineral resource estimates have been established at Kvanefjeld, Sørensen and Zone 3.
figure 9. Exploration license 2010/02 covers the northern Ilimaussaq Complex that is host to REE-U resources. Drilling to date has only evaluated a small part of the prospective area.
For
per
sona
l use
onl
y

16 Greenland Minerals and enerGy liMiTed – AnnUAl RePORT 2013
Table of Identified Mineral ResourcesStatement of Identified Mineral Resources, Kvanefjeld Multi-Element Project (Independently Prepared by SRK Consulting)
Multi-Element Resources Classification, Tonnage and Grade Contained Metal
Cut-off Classification M
tonnes Treo2 u3o8 lreo HReO reo y2o3 Zn Treo HReO y2o3 u3o8 Zn
(U3O8 ppm)1 Mt ppm ppm ppm ppm ppm ppm ppm Mt Mt Mt M lbs Mt
Kvanefjeld - March 2011150 Indicated 437 10929 274 9626 402 10029 900 2212 4.77 0.18 0.39 263 0.97150 Inferred 182 9763 216 8630 356 8986 776 2134 1.78 0.06 0.14 86 0.39150 Grand total 619 10585 257 9333 389 9721 864 2189 6.55 0.24 0.53 350 1.36
200 Indicated 291 11849 325 10452 419 10871 978 2343 3.45 0.12 0.28 208 0.68200 Inferred 79 11086 275 9932 343 10275 811 2478 0.88 0.03 0.06 48 0.20200 Grand total 370 11686 314 10341 403 10743 942 2372 4.32 0.15 0.35 256 0.88
250 Indicated 231 12429 352 10950 443 11389 1041 2363 2.84 0.10 0.24 178 0.55250 Inferred 41 12204 324 10929 366 11319 886 2598 0.46 0.02 0.03 29 0.11250 Grand total 272 12395 347 10947 431 11378 1017 2398 3.33 0.12 0.27 208 0.65
300 Indicated 177 13013 374 11437 469 11906 1107 2414 2.30 0.08 0.20 146 0.43300 Inferred 24 13120 362 11763 396 12158 962 2671 0.31 0.01 0.02 19 0.06300 Grand total 200 13025 373 11475 460 11935 1090 2444 2.61 0.09 0.22 164 0.49
350 Indicated 111 13735 404 12040 503 12543 1192 2487 1.52 0.06 0.13 98 0.27350 Inferred 12 13729 403 12239 436 12675 1054 2826 0.16 0.01 0.01 10 0.03350 Grand total 122 13735 404 12059 497 12556 1179 2519 1.68 0.06 0.14 108 0.31
Sørensen - March 2012150 Inferred 242 11022 304 9729 398 10127 895 2602 2.67 0.10 0.22 162 0.63200 Inferred 186 11554 344 10223 399 10622 932 2802 2.15 0.07 0.17 141 0.52250 Inferred 148 11847 375 10480 407 10887 961 2932 1.75 0.06 0.14 123 0.43300 Inferred 119 12068 400 10671 414 11084 983 3023 1.44 0.05 0.12 105 0.36350 Inferred 92 12393 422 10967 422 11389 1004 3080 1.14 0.04 0.09 85 0.28
Zone 3 - May 2012150 Inferred 95 11609 300 10242 396 10638 971 2768 1.11 0.04 0.09 63 0.26200 Inferred 89 11665 310 10276 400 10676 989 2806 1.03 0.04 0.09 60 0.25250 Inferred 71 11907 330 10471 410 10882 1026 2902 0.84 0.03 0.07 51 0.2300 Inferred 47 12407 358 10887 433 11319 1087 3008 0.58 0.02 0.05 37 0.14350 Inferred 24 13048 392 11392 471 11864 1184 3043 0.31 0.01 0.03 21 0.07
Project total
Cut-off Classification M
tonnes Treo2 u3o8 lreo HReO reo y2o3 Zn Treo HReO y2o3 u3o8 Zn
(U3O8 ppm)1 Mt ppm ppm ppm ppm ppm ppm ppm Mt Mt Mt M lbs Mt
150 Indicated 437 10929 274 9626 402 10029 900 2212 4.77 0.18 0.39 263 0.97150 Inferred 520 10687 272 9437 383 9820 867 2468 5.55 0.20 0.45 312 1.28150 Grand total 956 10798 273 9524 392 9915 882 2351 10.33 0.37 0.84 575 2.25
1 There is greater coverage of assays for uranium than other elements owing to historic spectral assays. U3O8 has therefore been used to define the cut-off grades to maximise the confidence in the resource calculations.2 Total Rare earth Oxide (TReO) refers to the rare earth elements in the lanthanide series plus yttrium.note: Figures quoted may not sum due to rounding.
JORC Code Compliance – Consent of Competent PersonsThe information in this report that relates to exploration targets, exploration results, geological interpretations, appropriateness of cut-off grades, and reasonable expectation of potential viability of quoted rare earth element, uranium, and zinc resources is based on information compiled by Mr Jeremy Whybrow. Mr Whybrow is a director of the Company and a Member of the Australasian Institute of Mining and Metallurgy (AusIMM). Mr Whybrow has sufficient experience relevant to the style of mineralisation and type of deposit under consideration and to the activity which he is undertaking to qualify as a Competent Person as defined by the 2004 edition of the “Australasian Code for Reporting of Exploration Results, Mineral Resources and Ore Reserves”. Mr Whybrow consents to the reporting of this information in the form and context in which it appears.
The geological model and geostatistical estimation for the Kvanefjeld, Sorensen and Zone 3 deposits were prepared by Robin Simpson of SRK Consulting. Mr Simpson is a Member of the Australian Institute of Geoscientists (AIG), and has sufficient experience relevant to the style of mineralisation and type of deposit under consideration and to the activity which he is undertaking to qualify as a Competent Person as defined by the 2004 edition of the “Australasian Code for Reporting of Exploration Results, Mineral Resources and Ore Reserves”. Mr Simpson consents to the reporting of information relating to the geological model and geostatistical estimation in the form and context in which it appears.
This information was prepared and first disclosed under the JORC Code 2004. It has not been updated since to comply with the JORC Code 2012 on the basis that the information has not materially changed since it was last reported.
For
per
sona
l use
onl
y

17 Greenland Minerals and enerGy liMited – AnnuAl RepoRt 2013 17
ACn 118 463 004
2013
ASX listed, Greenland-focussed mineral explorer and developer.
Greenland Minerals and energy limited and Controlled entities –
FInAnCIAl RePORT for the year ended 31 december 2013.
For
per
sona
l use
onl
y

18 Greenland Minerals and enerGy liMited – AnnuAl RepoRt 2013
Greenland Minerals and Energy Limited And Controlled Entities
31 December 2013 Financial Report
| 1 P a g e
CORPORATE GOVERNANCE
Principles of Best Practice Recommendations commentary The Board of Directors is responsible for the overall strategy, governance and performance of Greenland Minerals & Energy Limited (hereafter GMEL or the Company). The Company is an exploration company whose strategy is to add substantial shareholder value through the acquisition, exploration, development and commercialisation of projects in Greenland with a focus on the Kvanefjeld project. The Board has adopted a corporate governance framework which it considers to be suitable given the size, history and strategy of the Company. Principles of Best Practice Recommendations In accordance with ASX Listing Rule 4.10, GMEL is required to disclose the extent to which it has followed the Principles of Best Practice Recommendations during the financial period. Where GMEL has not followed a recommendation, this has been identified and an explanation for the departure has been given. Principle 1: Lay solid foundations for management and oversight The Board has established a framework within the Group that:
� enables it to provide strategic guidance and effective supervision of management; � clarifies the respective roles and responsibilities of Board members and senior executives; � ensures a balance of authority so that no single individual has unfettered powers; and � identifies significant business risks and ensures that those risks are well managed.
The day-to-day management of the Consolidated Group has been delegated to the Managing Director, Mr Roderick McIllree. The executives (whether or not a director) have clearly identified areas of responsibility and report directly to an executive director or the Managing Director who monitors their role. The Board has also adopted a Board Charter which details the functions and responsibilities of the Board and those delegated to management. In addition, each executive director and senior executive has signed an employment agreement. A copy of the Board Charter has been placed on the Company’s website. Principle 2: Structure the Board to add value The Board has been structured so that it has effective composition, size and commitment to adequately discharge its responsibilities and duties. The names and qualifications of the Directors are stated in the annual report along with the date of appointment. With the prior consultation with the Chairman, each Director is entitled to receive independent professional advice at the Company’s expense. Mr Michael Hutchinson, Mr Anthony Ho and Mr Jeremy Whybrow are non-executive Directors, with Mr Hutchinson and Mr Ho fulfilling the independence criteria outlined in the guidelines, Jeremy Whybrow is not an independent non-executive director. The Board believes that it is able to exercise independence and judgment and does possess the necessary skills, expertise and experience required to effectively discharge their duties. The focus has been on the ability of the Board to add value by effectively exercising independence and discharging their duties, rather than on meeting the independence test in the guidelines. The role of the Chairman is fulfilled by Mr Michael Hutchinson and Mr Roderick McIllree fills the role of Managing Director and Chief Executive Officer.
For
per
sona
l use
onl
y

19Greenland Minerals and enerGy liMited – AnnuAl RepoRt 2013
Greenland Minerals and Energy Limited And Controlled Entities
31 December 2013 Financial Report
| 2 P a g e
CORPORATE GOVERNANCE The Board has convened an Audit and Risk Committee as well as a Remuneration Committee. The Board maintains the role of Nomination to itself as it considers that the Company is not of a size to justify this as a separate committee. The executive director board members have full time, executive responsibility for the operations of the Company. The responsibilities are split into 3 sections:
� In Conjunction with the Chairman, the Managing Director’s role includes allocating priorities and tasks to the executives of the Company, leading the Company generally, raising capital as required and public relations at all levels.
� Business and strategic development.
� Other corporate support.
The executive directors are responsible for business strategic development and other corporate support, report on their activities to the Managing Director, who monitors their role and then reports to the board as required. The board as a whole monitors the Chairman’s and the Managing Director’s performance. Principle 3: Promote ethical and responsible decision-making Ethical and responsible decision-making is promoted by the Board in a top-down approach. The Board has adopted a Code of Conduct to guide the Directors, the Chairman, the Managing Director and other key executives as to practices necessary to maintain confidence in the Company’s integrity and to the responsibility and accountability of individuals for reporting and investigating reports of unethical behavior. The Board recognises legal ethical and other obligations to all legitimate stakeholders and the requirement to act in accordance with these obligations. The Company has formalised its policies accordingly. The Board has also adopted a Securities Trading Policy, to guide investment decisions. The Company has not adopted compliance standards and procedures to facilitate the implementation and assessment of the Code of Conduct and Securities Trading Policy. Given the Company’s size, history and strategy it was not considered appropriate to adopt these policies during the reporting period. The Company will largely comply with these recommendations during future reporting periods. The Company has formalised its policy accordingly. The Board has adopted a Diversity Policy as part of the Company’s commitment to workplace diversity and to ensure a diverse mix of skills and talent exists amongst its directors, senior management and employees, the policy can be viewed on the Company’s website. Diversity includes, but is not limited to, diversity in gender, age, ethnicity and cultural backgrounds. No Measurable Objectives were specifically set by the Board during the year, other than the recruitment of the most suitable candidate for a position, regardless of the individual’s gender or background.
For
per
sona
l use
onl
y

20 Greenland Minerals and enerGy liMited – AnnuAl RepoRt 2013
Greenland Minerals and Energy Limited And Controlled Entities
31 December 2013 Financial Report
| 3 P a g e
CORPORATE GOVERNANCE As a result of the developing nature of the project and associated works program, there has been a reduction in staff numbers across the Consolidated Group. Decisions regarding the retaining of staff were based solely on the skills required for the project development and future work programs and not on an individual’s age, gender or background. At 31 December 2013 there were 18 employees including directors in the Consolidated Group and 28% of these employees were women. This compares to 31 December 2012, when there were 28 employees including directors, of which 32% were women. The positions held by women in the Consolidated Group at 31 December 2013 include one senior corporate position and two senior positions within the project team. There are currently no women holding board or senior management positions (as defined in the remuneration report). Principle 4: Safeguard integrity in financial reporting The integrity of the Company’s financial reporting is a critical aspect of GMEL’s corporate governance and structures are in place to verify and safeguard the integrity of the Company’s financial reporting, which is overseen by the Audit and Risk Committee. The Company’s financial statements are reviewed or audited, each half year. The financial statements are reviewed by the Board which operates under formal terms of reference. The Board Charter is placed on the website. The Board has requested that the Managing director as the Chief Executive Officer and the Chief Financial Officer to state in writing that the financial statements present a true and fair view, in all material respects, of the Company’s financial condition and operational results and that,
� The financial records have been properly maintained in accordance with s286 of the Corporations Act 2001
� The financial statements are in accordance with the Corporations Act 2001, comply with relevant Accounting Standards and Corporation Regulations 2001.
� The financial statements are founded on sound system of risk management, as outlined in principle 7.
Principle 5: Make timely and balanced disclosure The Board promotes timely and balanced disclosure of all material matters concerning the Company. The Company has formalised its policy to promote a culture whereby all senior management understands the processes in relation to the timely disclosure of information. A copy of the Reporting Policy has been placed on the Company’s website. Principle 6: Respect the rights of shareholders The Board respects the rights of all shareholders and, to facilitate the effective exercise of those rights, the Company is committed to effective communication with shareholders. This occurs by electronic ASX releases to the market, through GMEL e-list email communications (registration is available via the Company’s website) and by the provision to shareholders of balanced and understandable information in relation to corporate proposals.
F
or p
erso
nal u
se o
nly

21Greenland Minerals and enerGy liMited – AnnuAl RepoRt 2013
Greenland Minerals and Energy Limited And Controlled Entities
31 December 2013 Financial Report
| 4 P a g e
CORPORATE GOVERNANCE Shareholders generally participate in shareholder meetings, in person or through the appointment of a proxy. The Company’s external Auditor is invited to attend these meetings. Principle 7: Recognise and manage risk The Company recognises the importance of managing risk and has established systems to assess monitor and manage risk based on the Company’s size, history and strategy. The exploration and development of natural resources is a speculative activity that involves a high degree of financial risk. The Company has formalised its policy to identify, monitor and manage risk. The Company as part of its risk management, formally established an Audit and Risk Committee The Company’s executives and senior management, through the Managing Director are responsible for the identification of material risks to the business and the design and implementation of internal control systems to manage the identified risks. The Board has received from management, reports on the effectiveness of the Company’s management of its material business risks. The Board has obtained a written confirmation from the Managing Director and the Chief Financial Officer that the statement in relation to principle 4, that the financial reports are founded on a sound system of risk management and internal compliance and control and the Company’s risk management and internal compliance control systems are operating efficiently and effectively in all material respects. The principle areas of risk for the Company are in the areas of:
� Occupational health and safety and work related safety risks � Environment risks � Security of tenure over tenements � Financial risk in the areas of maintaining sufficient funding for the continuation of operations and
risks related to fraud, misappropriation and errors. The Company has implemented and maintains adequate policies to monitor these areas and to reduce risk exposure. Principle 8: Remunerate fairly and responsibly The Board is committed to ensuring that the level and composition of remuneration is sufficient and reasonable and that its relationship to corporate and individual performance is defined. Executive Remuneration Policy The Company remunerates its senior executives in a manner that is market competitive, consistent with best practice and aligned to the interests of shareholders. Remuneration comprises a fixed salary, determined from a market review, to reflect core performance requirements and expectations of the relevant position and statutory superannuation where applicable, as well as stock options and rights issues.
Non-Executive Remuneration Policy Non-Executive Directors are paid a fixed fee out of the maximum aggregate amount which has been approved by shareholders. Non-executive Directors are entitled to statutory superannuation where applicable. There are no schemes for retirement benefits, other than statutory superannuation, for any non-executive Director. A copy of the Code of Conduct has been placed on the Company’s website.
For
per
sona
l use
onl
y

22 Greenland Minerals and enerGy liMited – AnnuAl RepoRt 2013
Greenland Minerals and Energy Limited And Controlled Entities
31 December 2013 Financial Report
| 5 P a g e
DIRECTORS’ REPORT
The directors of Greenland Minerals and Energy Limited submit herewith the annual financial report for the financial year ended 31 December 2013, pursuant to the provisions of the Corporations Act 2001. The directors report the following: Directors The names of directors in office at any time during or since the end of the financial year are:
Michael Hutchinson, Non-Executive Chairman Roderick Claude McIllree, Managing Director Simon Kenneth Cato, Executive Director John Mair, Executive Director Anthony Ho, Non-Executive Director Jeremy Sean Whybrow, Non-Executive Director
Chief Financial Officer/Company Secretary The following person held the position of Company secretary at the end of the financial year: Miles Simon Guy – M. Com(PA) is an accountant with 17 years’ experience in both public practice and commercial environments. Mr Guy is also currently the Chief Financial Officer for Greenland Minerals and Energy Limited. Principal Activities The principal activity of the Consolidated Group during the financial year was mineral exploration and project evaluation. Specifically the continued evaluation of the Consolidated Group’s Kvanefjeld project, located in Southern Greenland. There were no significant changes in the nature of the Consolidated Group’s principal activities during the financial year. Operating Results The net loss after providing for income tax amounted to $8,768,670 (2012: loss $17,344,249) Significant Changes in State of Affairs During the financial year, there were no significant changes in the state of affairs of the Consolidated Group. Subsequent Events In March 2014 the Consolidated Group entered a non-binding Memorandum of Understanding (“MoU”) with China Non-Ferrous Metal Industry’s Foreign Engineering and Construction Co Limited (“NFC”). The MoU sets out a framework for both parties to cooperate in aligning the rare earth concentrates from the Consolidated Group’s Kvanefjeld project, with NFC’s substantial rare earth separation experience and capacity. Please refer to the Company announcement released to the ASX on 24 March 2014. Other than the matter above, there have been no matters or circumstances occurring subsequent to the financial period that has significantly affected, or may significantly affect, the operations of the Consolidated Group, the results of those operations, or the state of affairs of the Consolidated Group in future years.
For
per
sona
l use
onl
y

23Greenland Minerals and enerGy liMited – AnnuAl RepoRt 2013
Greenland Minerals and Energy Limited And Controlled Entities
31 December 2013 Financial Report
| 6 P a g e
DIRECTORS’ REPORT Future Developments The Consolidated Group will continue to evaluate the Kvanefjeld project and the development alternatives for the project, as referred to elsewhere in this report, particularly in the Review of Operations on pages 7 to 9. Environmental Regulations The Consolidated Group operates within the resources sector and conducts its business activities with respect for the environment while continuing to meet the expectations of shareholders, customers, employees and suppliers. The Consolidated Group’s exploration activities are currently regulated by significant environmental regulation under laws of Greenland and the Commonwealth and states and territories of Australia. The Consolidated Group aims to ensure that the highest standard of environmental care is achieved, and that it complies with all relevant environmental legislation. The directors are not aware of any particular or significant environmental issues, which have been raised in relation to the Consolidated Group’s operations during the period covered by this report. Dividends In respect of the financial year ended 31 December 2013, no dividends have been paid or declared since the start of the financial year and the directors do not recommend the payment of a dividend in respect of the financial year. No dividends were paid in the comparative period ended 31 December 2012. Shares During the year ended 31 December 2013, the following ordinary shares of Greenland Minerals and Energy Limited were issued, as detailed in Note 16 to the financial report. The total number of ordinary shares on issue at 31 December 2013 was 574,572,911 (31 December 2012: 567,937,409). The total number of shares issued during the current financial year was 6,635,502. . There is no other class of shares issued by the Company and the Company has no un-issued shares, other than those registered to options and performance rights which are disclosed in the next section. Details of shares issued during the year or shares issued since the end of the financial year as a result of exercised options are:
Issuing entity
Number of shares issued
Class of share
Amount paid for/ fair value of
shares
Amount unpaid on shares
Greenland Minerals and Energy limited
3,287,854
Ordinary shares
$0.39
-
Greenland Minerals and Energy limited
750,000
Ordinary shares
$0.25
-
Greenland Minerals and Energy limited
744,833
Ordinary shares
$0.29
-
Greenland Minerals and Energy limited
897,344
Ordinary shares
$0.37
-
Greenland Minerals and Energy limited
955,471
Ordinary shares
$0.28
-
For
per
sona
l use
onl
y

24 Greenland Minerals and enerGy liMited – AnnuAl RepoRt 2013
Greenland Minerals and Energy Limited And Controlled Entities
31 December 2013 Financial Report
| 7 P a g e
DIRECTORS’ REPORT Options and performance rights During the year ended 31 December 2013 the number of options and performance rights of Greenland Minerals and Energy Limited that were issued are detailed in Note 24 to the financial report. Details of unissued shares or interests under option and performance rights at the date of this report are:
Issuing entity
Number of shares under option
Number of shares under performance/
employee rights
Class of shares
Exercise price of option
Expiry date of option
Greenland Minerals and Energy Limited (i) - 12,000,000
Ordinary shares NA 15 May 2014
Greenland Minerals and Energy Limited (i) - 9,685,500
Ordinary shares NA 4 October 2016
Greenland Minerals and Energy Limited (ii) 4,999,520 -
Ordinary shares $0.75 15 October 2014
Greenland Minerals and Energy Limited (ii) 25,769,191 -
Ordinary shares $0.60 5 October 2014
(i) 12,000,000 employee rights were issued in the current year and 1,000,000 performance
rights were issued in the previous financial year. In addition 4,860,000 performance rights issued in a previous financial year and were cancelled in the current year.
(ii) Options were issued in a previous financial year and remain outstanding at 31 December 2013.
The holders of these options and performance rights do not have the right, by virtue of being holders, to participate in any share issue or interest issue of the Consolidated Group or of any other body corporate. Review of operations The Consolidated Group’s principal activity is a mineral exploration and project evaluation in southern Greenland. The Company is primarily focused on advancing the 100% owned Kvanefjeld multi-element project (both light and heavy rare earth elements, uranium, and zinc) through the feasibility and permitting phase and into mine development. The Kvanefjeld project is centred on the northern Ilimaussaq Intrusive Complex in southern Greenland. The project includes several large scale multi-element deposits including Kvanefjeld, Sørensen and Zone 3. The deposits are characterised by thick, persistent mineralisation hosted within sub-horizontal lenses that can exceed 100m in true thickness. Highest grades generally occur in the uppermost portions of deposits, with overall low waste-ore ratios. While the resources are extensive, a key advantage to the Kvanefjeld project is the unique rare earth and uranium-bearing minerals. These minerals can be effectively beneficiated into a low-mass, high value concentrate, then leached with conventional acidic solutions under atmospheric conditions to achieve particularly high extraction levels of both heavy rare earths and uranium. This contrasts to the highly refractory minerals that are common in many rare earth deposits.
For
per
sona
l use
onl
y

25Greenland Minerals and enerGy liMited – AnnuAl RepoRt 2013
Greenland Minerals and Energy Limited And Controlled Entities
31 December 2013 Financial Report
| 8 P a g e
DIRECTORS’ REPORT Review of operations (cont’d) The Kvanefjeld project area is located adjacent to deep-water fjords that allow for shipping access directly to the project area, year round. An international airport is located 35km away, and a nearby lake system has been positively evaluated for hydroelectric power. The Consolidated Group released a feasibility-level study for the mine and concentrator circuit in 2013. Ongoing feasibility studies are focussed on the refinery circuit that has been evaluated up to stage of pilot plant operation. The study outcomes have been positive and reiterate the potential for Kvanefjeld to become one of the largest rare earth producing mines globally, occupying a dominant position at the low end of the future production cost-curve. A large heavy REE output and significant uranium output differentiate Kvanefjeld from many other emerging RE projects. Rare earth elements (REEs) are now recognised as being critical to the global manufacturing base of many emerging consumer items and green technologies. Uranium forms an important part of the global base-load energy supply, with demand set to grow in coming years as developing nations expand their energy capacity. A detailed report on the Consolidated Group’s activities and project achievements will included in the Annual Report. Key highlights for the Consolidated Group during the financial year included:
� In late October Greenland’s parliament voted in favour of removing a long-standing zero-tolerance policy against the exploitation of radioactive materials. This landmark decision places Greenland on the path to uranium-producer status, and thereby opens up coincident resources of rare earth elements to exploitation. The parliamentary decision received broad coverage in the international press, and sent a strong message that Greenland is prepared to make the important decisions that are required to advance the quest of establishing a minerals industry.
� Technical work programs continued to advance the Kvanefjeld project through 2013, and served
to progress the de-risking of the project, and build confidence in the advantageous process flow sheet.
� Test work for the concentrator circuit was completed in late-2012, with the second of two highly
successful pilot plant operations. An updated study was then released in March 2013 (the Mine and Concentrator Study), that captured the technical advances to the beneficiation circuit, and the initial 3Mtpa start-up capacity. With a high degree of confidence in the ability to produce a low-mass, high-grade mineral concentrate, the Consolidated Group commenced assessing the potential to export the mineral concentrate from Greenland, for processing offshore.
� An effective hydrometallurgical process route has been developed for the treatment of the rare earth- and uranium-rich mineral concentrates generated via froth flotation. The refinery circuit utilises simple equipment and elegant chemistry, with scaled-up test work in 2013 demonstrating the production of a high purity rare earth intermediate product.
� The Consolidated Group has been conducting extensive environmental baseline studies in the Kvanefjeld project area for several years, as a basis to evaluate the potential environmental impacts of a mining operation. The baseline studies provide an indication of the natural chemistry of the broader project area, and the background concentrations of many chemical elements in soil, water, dust and biological matter.
For
per
sona
l use
onl
y

26 Greenland Minerals and enerGy liMited – AnnuAl RepoRt 2013
Greenland Minerals and Energy Limited And Controlled Entities
31 December 2013 Financial Report
| 9 P a g e
DIRECTORS’ REPORT Review of operations (cont’d)
� Comprehensive background radiation monitoring was also undertaken in the broader project area along with the town of Narsaq, and builds on data gathered over several years.
� The Consolidated Group has maintained an active stakeholder engagement program in relation
to the Kvanefjeld project since 2008. This has primarily focussed on participating in community hall meetings in the main townships of south Greenland, which includes Narsaq, Qaqortoq, and Nanortalik. The aim of these meetings is to provide updates on the Kvanefjeld project and potential development scenarios, and importantly to identify the key areas of interest from the local populace. These forums provide the opportunity for local stakeholders to put forward questions, voice concerns and identify areas where they would like further information.
The Consolidated Group’s strategy for future financial years includes:
� The continued evaluation of development alternatives for the Kvanefjeld project, including the potential engagement of strategic partners.
� Continue to prudently control cash flow and implement operational and project cost reductions
where possible.
� Retain key staff vital to the future development of the project.
� Maintain an open dialogue with the Greenland Government, communities and other stakeholder groups.
� Continue to evaluate the project to ensure the future development in carried out in a manner that
will ensure the enhancement of value to shareholders and other stakeholders. Financial Position The net assets of the Consolidated Group were $71,230,107 as at 31 December 2013 (2012: $64,991,703). The information in this report that relates to exploration targets, exploration results, geological interpretations, appropriateness of cut-off grades, and reasonable expectation of potential viability of quoted rare earth element, uranium, and zinc resources is based on information compiled by Mr Jeremy Whybrow. Mr Whybrow is a director of the Company and a Member of the Australasian Institute of Mining and Metallurgy (AusIMM). Mr Whybrow has sufficient experience relevant to the style of mineralisation and type of deposit under consideration and to the activity which he is undertaking to qualify as a Competent Person as defined by the 2004 edition of the “Australasian Code for Reporting of Exploration Results, Mineral Resources and Ore Reserves”. Mr Whybrow consents to the reporting of this information in the form and context in which it appears. The geological model and geostatistical estimation for the Kvanefjeld, Sorensen and Zone 3 deposits were prepared by Robin Simpson of SRK Consulting. Mr Simpson is a Member of the Australian Institute of Geoscientists (AIG), and has sufficient experience relevant to the style of mineralisation and type of deposit under consideration and to the activity which he is undertaking to qualify as a Competent Person as defined by the 2004 edition of the “Australasian Code for Reporting of Exploration Results, Mineral Resources and Ore Reserves”. Mr Simpson consents to the reporting of information relating to the geological model and geostatistical estimation in the form and context in which it appears. This information was prepared and first disclosed under the JORC Code 2004. It has not been updated since to comply with the JORC Code 2012 on the basis that the information has not materially changed since it was last reported.
For
per
sona
l use
onl
y

27Greenland Minerals and enerGy liMited – AnnuAl RepoRt 2013
Greenland Minerals and Energy Limited And Controlled Entities
31 December 2013 Financial Report
| 10 P a g e
DIRECTORS’ REPORT Information on Directors Michael Hutchinson - Non-Executive Chairman – Appointed 25 November 2008 Special responsibilities Member of the Remuneration Committee (Chairman) Member of the Audit Committee Qualifications BSc (Hons) Geography Experience Mr Michael Hutchinson has had a distinguished career in resources and commodity trading, having served as Director of the London Metal Exchange, the world's largest market in options and futures contracts on base and other metals. Mr Hutchinson was previously Chairman of RBS Sempra Metals Limited, and Wogen PLC; a trader of off-exchange metals that sources metals worldwide for industrial end users. In addition, Mr Hutchinson previously served as a director of MG PLC. Interest in shares, options and performance rights 210,638 Ordinary shares 1,400,000 Unvested performance rights Directorships held in other listed entities Non-executive chairman – Noricum Gold Limited – since November 2013 Non-executive director - Mecom Plc – since April 2009 Former directorships in other- listed entities in the last 3 years Nil Roderick McIllree - Managing Director – Appointed 23 March 2007 Qualifications B.Sc. (Mineral Exploration and Mining Geology), G.Cert. (Mineral Economics) MAusIMM. Experience Mr McIllree is a corporate geologist. A graduate of Curtin University School of Mines he has global experience from grassroots discovery through mine finance and production. This broad base of experience both in capital markets and the global minerals space provides the platform necessary to implement operations in remote and difficult locations. He was an active and early member of a number of successful mining ventures including Medusa Mining (Philippines), Anvil Mining (Congo) and Kingsrose Mining Ltd (Sumatra) where he was involved in the process of de-risking mining operations in frontier jurisdictions. Roderick was a founding Director of Greenland Minerals and Energy Ltd and identified and executed the Greenland opportunity with the acquisition of Kvanefjeld in 2007 being the result.
For
per
sona
l use
onl
y

28 Greenland Minerals and enerGy liMited – AnnuAl RepoRt 2013
Greenland Minerals and Energy Limited And Controlled Entities
31 December 2013 Financial Report
| 11 P a g e
DIRECTORS’ REPORT Information on Director (cont’d) Roderick McIllree (cont’d) Interest in shares, options and performance rights 13,346,956 Ordinary Shares 2,700,000 Unvested performance rights Directorships held in other listed entities Non-executive Director – Noricum Gold Limited – 11 April 2012 Other board positions held in the last 3 years Convergent Minerals Limited – July 2006, Resigned 19 Dec 2011 Simon Cato - Executive Director – Appointed 21 February 2006 Qualifications B.A. (USYD) Experience Mr Simon Cato has had over 30 years capital markets experience in broking, regulatory roles and as director of listed companies. He initially was employed by the ASX in Sydney and then in Perth. From 1991 until 2006 he was an executive director and/or responsible executive of three stockbroking firms and in those roles he has been involved in many aspects of broking including management issues such as credit control and reporting to regulatory bodies in the securities industry. As a broker he was also involved in the underwriting of a number of IPO’s and has been through the process of IPO listing in the dual role of broker and director. Currently he holds a number of executive and non-executive roles with listed companies in Australia. Interest in shares, options and performance rights 4,762,198 Ordinary shares 600,000 Unvested performance rights Other board positions held Chairman - Advanced Share Registry Limited - since August 2007. Positions held in the last 3 Years Queste Communications Limited – February 2008 to 3 April 2013 Transaction Solutions International Limited – February 2010 to 30 September 2013 Convergent Minerals Limited - July 2006 to 19 December 2011
For
per
sona
l use
onl
y

29Greenland Minerals and enerGy liMited – AnnuAl RepoRt 2013
Greenland Minerals and Energy Limited And Controlled Entities
31 December 2013 Financial Report
| 12 P a g e
DIRECTORS’ REPORT Information on Directors (cont’d) Dr John Mair – Executive Director – Appointed 7 October 2011 Qualifications PhD (Geol), MAus IMM Experience Dr John Mair completed a Bachelor of Science with Honours, majoring in geology, at the University of Western Australia, before commencing a career in the minerals sector, working in gold exploration and mining in Western Australia's goldfields. He returned to the university system to undertake a PhD study on the gold and base metal deposits of Canada's Yukon Territory and east-central Alaska. After completing the PhD in 2004, John returned to the minerals industry working in exploration for porphyry Cu-Au deposits in New South Wales, and gold deposits in China. In mid-2005 John took the position of Post-Doctoral Research Fellow at the University of British Columbia, with a focus on the metallogeny of southwest Alaska. At completion of the project in 2006, John returned to the minerals industry as a project co-coordinator for Vancouver-based exploration group Geoinformatics Exploration Inc., who in alliance with Kennecott, were exploring for Cu-Mo-Au deposits in western North America from Mexico to Alaska. During this period, John planned and implemented large-scale exploration programs through remote northern British Columbia, as well as providing technical expertise to exploration programs in Alaska and Mexico. In mid-2008 John returned to Australia to join Greenland Minerals and Energy Limited as General Manager. John has published several papers in leading international scientific journals on tectonics, structural geology, mineral deposit geology, igneous petrology and mineralogy. He has also presented at Masters short courses on ore deposit geology. Of particular relevance is his understanding of the behavior of rare earth elements, and is experienced in separating pure rare earth elements from a wide variety of rock types from start to finish. He is a member of the Society of Economic Geologists and the Australian Institute of Mining and Metallurgy. Since 2008, John has been instrumental in the technical development of the Kvanefjeld project, and also in the corporate evolution of the company. He presents on the Company's behalf in commercial, technical and political forums internationally. Interest in shares, options and performance rights 5,564,166 Ordinary Shares 2,100,000 Unvested performance rights Other board positions held Nil
For
per
sona
l use
onl
y

30 Greenland Minerals and enerGy liMited – AnnuAl RepoRt 2013
Greenland Minerals and Energy Limited And Controlled Entities
31 December 2013 Financial Report
| 13 P a g e
DIRECTORS’ REPORT Information on Directors (cont’d) Anthony Ho - Non-Executive Director - Appointed 9 August 2007 Special responsibilities Member of the Audit Committee (Chairman) Member of the Remuneration Committee Qualifications B.Comm, CA, FAICD, FCIS, FGIA Experience Mr Tony Ho is an experienced company director having held executive directorships and chief financial officer roles with a number of publicly listed companies. Tony was executive director of Arthur Yates & Co Limited, retiring from that position in April 2002. His corporate and governance experience include being chief financial officer/finance director of M.S. McLeod Holdings Limited, Galore Group Limited, the Edward H O'Brien group of companies and Volante Group Limited. Mr Ho was the past non-executive chairman of St. George Community Housing Limited (November 2002 to December 2009) where he was also a member of the Audit and Remuneration Committees. Prior to joining commerce, Mr Ho was a partner of Cox Johnston & Co, Chartered Accountants, which has since merged with Ernst & Young. Mr Ho holds a Bachelor of Commerce degree from the University of New South Wales and is a member of the Institute of Chartered Accountants in Australia and a fellow of the Institute of Chartered Secretaries, Governance Institute of Australia and the Australian Institute of Company Directors. Interest in shares & options 550,000 Ordinary Shares 1,600,000 Unvested performance rights Other board positions held Chairman - Apollo Minerals Limited, July 2009 and chairman of the Audit Committee Non-executive director - Hastings Rare Metals Limited, March 2011 and chairman of the Audit Committee Non-executive Chairman – Bioxyne Limited – November 2012 Board positions held in the last 3 years Non-executive Chairman – Metal Bank Limited, October 2011 to August 2013 Non-executive director - DoloMatrix International Limited, April 2007 – August 2012
For
per
sona
l use
onl
y

31Greenland Minerals and enerGy liMited – AnnuAl RepoRt 2013
Greenland Minerals and Energy Limited And Controlled Entities
31 December 2013 Financial Report
| 14 P a g e
DIRECTORS’ REPORT Information on Directors (cont’d) Jeremy Sean Whybrow – Non-executive director – Appointed 21 February 2006 Qualifications B.Sc. (Mineral Exploration and Mining Geology), G.Cert(Minerals Economics), M.Aus.I.M.M Experience Mr Jeremy Whybrow graduated from Curtin University of Technology in 1996 with a Bachelor of Science degree (Mineral Exploration and Mining Geology), and has had over 15 years experience in the minerals industry both domestically and internationally. Jeremy has worked for companies such as Sons of Gwalia Ltd, PacMin Ltd, Teck Australia Ltd, Mount Edon Gold Mines Ltd and Croesus Mining NL. His experience has been mainly in the operational environment and includes significant exposure to exploration and mining operations, project evaluation and feasibility studies. Jeremy also has extensive international exploration experience having worked in China, Africa and the Philippines as well as numerous localities in Australia. As a founding director of Greenland Minerals and Energy, Jeremy has been instrumental in conducting the exploration programs that have seen the Kvanefjeld project emerge as the world's largest resource of rare earth elements (as defined by internationally recognized reporting standards). Drawing on his solid foundation of operational experience Jeremy put in place many of the systems critical to generating the high-quality datasets that underpin the projects mineral resources. Interest in Shares, options and performance rights 6,010,200 Ordinary shares 1,000,000 Unvested performance rights
Directorships held in other listed entities Noricom Gold Limited – November 2010, Executive director Positions held in the last 3 Years Convergent Minerals Limited. – January 2006 to 19 December 2011 Remuneration Report – Audited This remuneration report, which forms part of the directors’ report, details the nature and amount of remuneration for each director of Greenland Minerals and Energy Limited and senior management, for the financial year ended 31 December 2013. Director and senior management details The following persons acted as directors of the Company during or since the end of the financial year:
Michael Hutchinson, Chairman Roderick Claude McIllree, Managing Director Simon Kenneth Cato, Executive Director John Mair, Executive Director Anthony Ho, Non-Executive Director Jeremy Sean Whybrow, Non-Executive Director
For
per
sona
l use
onl
y

32 Greenland Minerals and enerGy liMited – AnnuAl RepoRt 2013
Greenland Minerals and Energy Limited And Controlled Entities
31 December 2013 Financial Report
| 15 P a g e
DIRECTORS’ REPORT Remuneration Report – Audited (cont’d) The term ‘senior management’ is used in this remuneration report to refer to the following persons. Except as noted above, the named persons held their current position for the whole of the financial year and since the end of the financial period:
Shaun Bunn, Chief Operations Officer Miles Guy, Chief Financial Officer and Company Secretary
Remuneration Policy The remuneration policy of Greenland Minerals and Energy Limited has been designed to align director and senior management objectives with shareholder and business objectives by providing a fixed remuneration component and offering specific long-term incentives based on meeting service period requirements and share price vesting hurdles. It is the Board’s opinion that significant project advancements would be required for the share price vesting hurdles to be met and therefore increasing value to all stakeholders. The board of Greenland Minerals and Energy Limited believes the remuneration policy to be appropriate and effective in its ability to attract and retain the best senior management and directors to run and manage the Consolidated Group, as well as create alignment of interests between directors, senior management and shareholders. The board’s policy for determining the nature and amount of remuneration for board members and senior executives of the Consolidated Group is as follows: All senior management receive a market rate base salary (which is based on factors such as length of service and experience) and superannuation. The directors and senior management, where applicable receive a superannuation guarantee contribution required by the government, which is currently 9.25% and do not receive any other retirement benefits. All remuneration paid to directors and senior management is valued at the cost to the Consolidated Group and expensed. Options and rights granted to directors and senior management as part of remuneration are valued at grant date using appropriate valuation techniques. The board policy is to remunerate non-executive directors with a base fee and, for special exertion, at market rates for time, commitment and responsibilities. The board as a whole determines payments to the non-executive directors and reviews their remuneration annually, based on market rates, their specific duties and responsibilities. Additional consultancy fees may be payable where the non-executive director has had additional responsibilities associated with specific tasks or responsibilities outside their normal duties. The maximum aggregate amount of fees that can be paid to non-executive directors is subject to approval by shareholders at the Annual General Meeting. The current shareholder approved cap on these fees is $400,000 per annum. Fees for non-executive directors are not linked to the performance of the Consolidated Group. However, to align directors’ interests with shareholder interests, the directors are encouraged to hold shares in the Company. Remuneration –Cash payment Cash payments is the recognition of short term remuneration and the provision for long term remuneration that has or will be settled in cash payments. Remuneration – Share based payments Share based payments is the recognition of shares that have been issued and are to be issued to directors and senior management as compensation for the directors and senior management agreeing to a reduction in salaries and other employment entitlements that would have otherwise been payable in cash.
For
per
sona
l use
onl
y

33Greenland Minerals and enerGy liMited – AnnuAl RepoRt 2013
Greenland Minerals and Energy Limited And Controlled Entities
31 December 2013 Financial Report
| 16 P a g e
DIRECTORS’ REPORT Remuneration Report – Audited (cont’d) The share based payments are also the recognition of long term remuneration that does not provide a present value to the directors and senior management. The value of the long term remuneration has been realised over the service vesting period and are subject to the satisfying of vesting and other conditions. At 31 December 2013, all of the outstanding performance rights remained un-vested as the share price vesting conditions had not been satisfied. The performance options expired on 31 August 2013 being the expiry date of the options and as a result of the share price vesting conditions not being satisfied by the expiry date. Short term incentives The Consolidated Group does not have a short term incentive scheme that is in addition to the short term employee benefits. The Consolidated Group considers that short term incentive schemes would not be consistent with shareholder value at the Consolidated Group’s current stage of development. Details of Remuneration The remuneration for the directors and senior management of the Company during the current financial year was as follows:
Remuneration – Cash payments
Year ended 31 Dec 2013
Short term employee benefits Post-
employment
Long-term Remuneration Provision for long service
leave
TOTAL REMUNERATION
PAID OR PAYABLE IN
CASH
Salary/
consultancy fees Director fees Allowances
Super- annuation
$
$
$
$ $
Executive Directors Roderick McIllree 238,750 - 86,612(i) 11,812 (18,668) (ii) 318,506 Simon Cato 52,916 - - 4,866 (11,084) (ii) 46,698 John Mair 235,417 - - 21,469 - 256,886 Non-executive Directors
-
4,500
Anthony Ho 50,000 - - 54,500 Michael Hutchinson - 139,317 - - 139,317 Jeremy Whybrow 59,583 45,000 1,875 - 106,458 Senior Management Shaun Bunn 242,167 - - 14,719 - 256,886 Miles Guy 181,667 - - 16,575 - 198,242 TOTAL 1,010,500 234,317 86,612 75,816 (29,752) 1,377,493
(i) Allowance for the payment of expenses related to R McIllree relocating to the UK. (ii) A reduction in salaries has resulted in a lower salary base for the calculation of long service leave and
other statutory entitlements. This has resulted in a reduction in the provision for long service leave recognised in prior years.
For
per
sona
l use
onl
y

34 Greenland Minerals and enerGy liMited – AnnuAl RepoRt 2013
Greenland Minerals and Energy Limited And Controlled Entities
31 December 2013 Financial Report
| 17 P a g e
DIRECTORS’ REPORT Remuneration Report – Audited (cont’d)
Remuneration – Share based payments at fair value
Shares in lieu of salary
Long term remuneration
Total share based
payments
TOTAL REMUNER-
ATION
% Consisting of share based
payments
Shares (i) Rights (ii) Options (iii) Year ended 31 Dec 2013 $ $
$ $ $
Executive Directors Roderick McIllree 453,044 206,302 121,852 781,198 1,099,704 71% Simon Cato - 24,610 - 24,610 71,308 34% John Mair 198,703 160,457 91,674 450,834 707,720 64% Non-executive Directors
188,545 -
Anthony Ho - 188,545 243,045 77% Michael Hutchinson 123,228 60,357 - 183,585 322,902 57% Jeremy Whybrow - 42,831 - 42,831 149,289 29% Senior Management Shaun Bunn 609,578 249,182 91,674 950,434 1,207,320 79% Miles Guy 217,444 65,567 - 283,011 481,253 59% TOTAL 1,601,997 997,851 305,200 2,905,048 4,282,541 68%
(i) Shares were issued to directors and senior management as compensation for the directors and senior
management agreeing to a reduction in salary and other employment entitlements that would have otherwise been payable in cash. The shares are to be issued in up to four tranches over a two year period, the values stated above represent the fair value of all four tranches granted in the current year. This includes the tranches where shares were issued in the current year as well as a proportion of the value of tranches that will vest during the year ended 31 December 2014. This vesting profile results in 79% of the total fair value of the four tranches being recognised in the current year. Refer to note 24 for further details.
(ii) All rights are Long Term Incentives that are subject to service period and share price vesting conditions
which are detailed further in note 24 to the financial statements. The rights do not vest into fully paid shares unless the vesting conditions are satisfied. At 31 December 2013 all rights remain unvested and as a result the rights represent no immediate monetary value to the holder of the rights, at this date, with a monetary benefit only arising if the vesting conditions are satisfied prior to the expiry date. The above share based payment values are for reporting purposes only.
(iii) All options are Long Term Incentives that are subject to service period and share price vesting
conditions which are detailed further in note 24 to the financial statements. The options expired in August 2013 due to failing to satisfy market based (share-price) vesting conditions consequently this will result in no monetary value being realised by the holders of the options.
(iv) The value of the options and rights granted to management personnel as part of their remuneration is
calculated on the grant date using an appropriate pricing model. The amounts disclosed as part of remuneration for the financial year have been determined by allocating the grant date value on a straight-line basis over the service vesting period.
For
per
sona
l use
onl
y

35Greenland Minerals and enerGy liMited – AnnuAl RepoRt 2013
Greenland Minerals and Energy Limited And Controlled Entities
31 December 2013 Financial Report
| 18 P a g e
DIRECTORS’ REPORT Remuneration Report – Audited (cont’d) The remuneration for the directors and senior management of the Company during the prior financial year was as follows:
Remuneration – Cash payments
Short term employee benefits Post-
employment
Long-term Remuneration Provision for long service
leave
TOTAL REMUNERATION
PAID OR PAYABLE IN
CASH
Salary/
consultancy fees Director fees Allowances
Super- annuation
Year ended 31 Dec 2012
$
$
$
$ $
Executive Directors Roderick McIllree 520,000 - - 46,800 43,752 610,552 Simon Cato 140,000 - - 12,600 16,334 168,934 John Mair 350,000 - - 31,500 - 381,500 Non-executive Directors
42,025
4,500
Anthony Ho 50,000 - - 96,525 Michael Hutchinson - 150,323 - - 150,323 Jeremy Whybrow 205,000 45,000 22,500 29,168 301,668 Senior Management Shaun Bunn 350,000 - - 31,500 - 381,500 Miles Guy 200,000 - - 18,000 - 218,000 TOTAL 1,807,025 245,323 - 167,400 89,254 2,309,002
Remuneration – Share based payments at fair value
Shares in lieu of salary
Long term remuneration
Total share based
payments
TOTAL REMUNER-
ATION
% Consisting of share based
payments
Shares Rights (i) Options (ii) Year ended 31 Dec 2012 $ $
$ $ $
Executive Directors Roderick McIllree - 825,210 487,409 1,312,619 1,923,171 68% Simon Cato - 94,422 - 94,422 263,356 36% John Mair - 641,830 366,695 1,008,525 1,390,025 72% Non-executive Directors
402,417 -
Anthony Ho - 402,417 498,942 80% Michael Hutchinson - 241,429 - 241,429 391,752 62% Jeremy Whybrow - 171,323 - 171,323 472,991 36% Senior Management Shaun Bunn - 641,830 366,695 1,008,525 1,390,025 72% Miles Guy - 59,469 - 59,469 277,469 21% TOTAL - 3,077,930 1,220,799 4,298,729 6,607,731 65% (i) All rights are Long Term Incentives that are subject to service period and share price vesting conditions
which are detailed further in note 24 to the financial statements. The rights do not vest into fully paid shares unless the vesting conditions are satisfied. At 31 December 2012 all rights remain unvested and as a result the rights represent no immediate monetary value to the holder of the rights, at this date, with a monetary benefit only arising if the vesting conditions are satisfied prior to the expiry date.
(ii) All options are Long Term Incentives that are subject to service period and share price vesting
conditions which are detailed further in note 24 to the financial statements. At 31 December 2012 all options remain unvested and as a result the options represent no immediate monetary value to the holder of the options, at this date, with a monetary benefit only arising if the vesting conditions are satisfied prior to the expiry date.
For
per
sona
l use
onl
y

36 Greenland Minerals and enerGy liMited – AnnuAl RepoRt 2013
Greenland Minerals and Energy Limited And Controlled Entities
31 December 2013 Financial Report
| 19 P a g e
DIRECTORS’ REPORT Remuneration Report – Audited (cont’d) No director or senior management person appointed during the current or prior period received a payment as part of his consideration for agreeing to hold the position. No cash bonuses were paid to any directors or senior management during the current or prior period. Shares in lieu of salaries In February 2013 as part of a strategy to preserve cash reserves, directors, senior management and a number of other staff agreed to a reduction in salary and other employment entitlements that would have been payable by the Company in cash. As compensation for agreeing to these reductions, the Company agreed to issue shares to the individuals concerned. The number of shares to be issued was established by calculating the dollar value of foregone employment entitlements and issuing the equivalent value in shares based on a share price of $0.30. The shares are to vest four tranches over a two year period except for Michael Hutchinson who will be issued shares over three tranches. The shares that have been and are to be issued to directors were approved by shareholders at the Company’s Annual General Meeting on 15 May 2013. In accordance with AASB2, the value of the shares in lieu of salaries has been recognised as the fair value of the shares issued in the first two tranches during the year ended 31 December 2013 and a proportion of the fair value of the remaining two trances to be issued in the year ended 31 December 2014. All four tranches require continuous service through to the respective vesting date. As a result of this vesting profile, 79% of the total fair value of the four tranches has been recognised at 31 December 2013, with the balance to be recognised during the year ended 31 December 2015. The following shares were issued in the current year or will be issued in the year ended 31 December 2014 and have been issued in lieu of salaries and other employment entitlements.
Director/ senior management Grant date Number
Fair value @ grant date
$ Issue Date
Share value @date
of issue $
R McIllree
Tranche 1 15/05/2013 517,750 150,147 15/05/2013 150,147 Tranche 2 15/05/2013 517,750 145,022 31/10/2013 155,325 Tranche 3 15/05/2013 517,750 145,073 30/04/2014 - Tranche 4 15/05/2013 517,500 145,177 31/10/2014 -
Total 2,071,000 585,419 305,472 J Mair
Tranche 1 15/05/2013 227,083 65,854 15/05/2013 65,854 Tranche 2 15/05/2013 227,083 63,609 31/10/2013 68,125 Tranche 3 15/05/2013 227,083 63,637 30/04/2014 - Tranche 4 15/05/2013 227,083 63,665 31/10/2014 -
908,333 256,765 133,979 M Hutchinson
Tranche 1 15/05/2013 210,638 59,003 31/10/2013 63,191 Tranche 2 15/05/2013 210,637 59,028 30/04/2014 - Tranche 3 15/05/2013 210,633 59,053 31/10/2014 -
631,908 177,084 63,191
For
per
sona
l use
onl
y

37Greenland Minerals and enerGy liMited – AnnuAl RepoRt 2013
Greenland Minerals and Energy Limited And Controlled Entities
31 December 2013 Financial Report
| 20 P a g e
DIRECTORS’ REPORT Remuneration Report – Audited (cont’d)
Director/ senior management Grant date Number
Fair value @ grant date
$ (i) Issue Date
Share value @date
of issue $
S Bunn
Tranche 1 25/02/2013 480,758 185,092 25/02/2013 185,092 Tranche 2 25/02/2013 485,586 182,192 30/09/2013 121,396 Tranche 3 25/02/2013 490,462 184,070 31/03/2014 - Tranche 4 25/02/2013 495,387 185,968 30/09/2014 -
Total 1,952,193 737,322 306,488 M Guy
Tranche 1 25/02/2013 171,492 66,024 25/02/2013 66,024 Tranche 2 25/02/2013 173,214 64,990 30/09/2013 43,303 Tranche 3 25/02/2013 174,954 65,660 31/03/2014 - Tranche 4 25/02/2013 176,711 66,337 30/09/2014 -
696,371 263,011 109,327 (i) Fair value for shares issued or to be issued to directors has been based on the Company share
price on 15 May 2013 and the Company shares price on 25 February 2013 for senior management, given that these tranches vested immediately on the grant date, with no future service conditions. The fair value has been established for the later tranches by applying a Black Scholes model and taking into account the future service period requirements (refer to note 24).
Employee rights plan In September 2013 the Remuneration Committee and the Board approved the Employee Rights Plan (“ERP”) and approved the issue of Employee Rights under the plan. All employees of the Consolidated Group were invited to participate in the ERP. The number of rights being offered to employees was determined by the seniority of the employee, with three levels of seniority being established and a factor based on the seniority being applied to the employee’s base salary. The Employee Rights will convert to Ordinary fully paid shares on subject to a twelve month continuous service period vesting condition and in three tranches subject to share price vesting conditions. The Employee Rights were offered to assist in retaining and to further incentivise employees. In accepting the offer of the Employee Rights, employees agreed that the Employee Performance Rights issued in 2011 would be cancelled. At the time the Employee Performance Rights were cancelled the fair value of the cancelled rights had been fully expensed. The Employee Rights were not offer to directors and no directors participated in the Employee Rights Issue. The market based vesting hurdles are based on the Company’s share price based on a 5 day Volume Weighted Average Price (“VWAP”) as detailed in the following table.
Tranche
5 Day VWAP share price hurdle
Tranche 1 $0.50 Tranche 2 $0.75 Tranche 3 $1.00
For
per
sona
l use
onl
y

38 Greenland Minerals and enerGy liMited – AnnuAl RepoRt 2013
Greenland Minerals and Energy Limited And Controlled Entities
31 December 2013 Financial Report
| 21 P a g e
DIRECTORS’ REPORT Remuneration Report – Audited (cont’d) No amounts are paid or payable by the recipient on receipt of the performance right. The performance rights carry neither rights to dividends nor voting rights and are non-transferrable. The following un-vested performance rights were issued to senior management during the current financial year.
Senior management Grant date Number
Fair value @ grant date
$ Expiry date
Vesting
date S Bunn
Tranche 1 4/10/2013 700,000 151,410 30/09/2016 Refer above Tranche 2 4/10/2013 700,000 119,770 30/09/2016 Refer above Tranche 3 4/10/2013 700,000 96,810 30/09/2016 Refer above
Total 2,100,000 367,990
M Guy
Tranche 1 4/10/2013 400,000 86,520 30/09/2016 Refer above Tranche 2 4/10/2013 400,000 68,440 30/09/2016 Refer above Tranche 3 4/10/2013 400,000 55,320 30/09/2016 Refer above
1,200,000 210,280 (i) Fair value at grant date has been calculated using a binominal model (refer to note 24) the
value will be recognised in remuneration on a pro-rata basis over the service vesting period in accordance with Australian Accounting Standards.
Performance rights On the 23 January 2012, shareholders approved the issue of 1,000,000 un-vested performance rights to Anthony Ho. These rights were issued to Mr Ho in recognition of the work and his valuable input in securing the settlement to acquire the remaining 39% interest in the Kvanefjeld project. The performance rights will vest in three tranches based on the Company’s Volume Weighted Average Share Price (“VWAP”) exceeding price hurdles for 10 consecutive trading days. In addition Mr Ho was required to remain an employee of the Company until 30 June 2013. Upon satisfying the clearly pre-determined vesting conditions, each right issued will be convertible into one fully paid ordinary share of the Company.
Tranche
10 Day VWAP share price hurdle
Tranche 1 $0.75 Tranche 2 $1.00 Tranche 3 $1.50
No amounts are paid or payable by the recipient on receipt of the performance right. The performance rights carry neither rights to dividends nor voting rights and are non-transferrable. No Performance Rights were issued during the year ended 31 December 2013.
For
per
sona
l use
onl
y

39Greenland Minerals and enerGy liMited – AnnuAl RepoRt 2013
Greenland Minerals and Energy Limited And Controlled Entities
31 December 2013 Financial Report
| 22 P a g e
DIRECTORS’ REPORT Remuneration Report – Audited (cont’d) The following un-vested performance rights were issued to Anthony Ho during the previous financial year.
Director/ senior management Grant date Number
Fair value @ grant date
$ Expiry date
Vesting
date A Ho
Tranche 1 23/01/2012 500,000 242,000 15/05/2014 Refer above Tranche 2 23/01/2012 250,000 114,500 15/05/2014 Refer above Tranche 3 23/01/2012 250,000 103,500 15/05/2014 Refer above
Total 1,000,000 460,000 (ii) Fair value at grant date has been calculated using a binominal model (refer to note 24)
the value will be recognised in remuneration on a pro-rata basis over the service vesting period in accordance with Australian Accounting Standards.
Employee performance rights plan At the Company’s Annual General Meeting, on 12 May 2011, members approved the implementation of an Employee Performance Rights Plan (“EPRP”). The plan is a result of a comprehensive remuneration review the Company conducted. The aim of the plan is to assist in the retention of existing staff and the recruitment of future employees. Under the EPRP, the Company will issue incentive shares to employees as part of their total remuneration package. The plan will result in a direct cash saving to the Company through a reduction in the salary component payable in remuneration packages. Upon satisfying clearly pre-determined vesting conditions, each right issued under the EPRP will be convertible into one fully paid ordinary share of the Company. To meet the vesting criteria, the employee must remain an employee of the Company for a minimum of two years (service period). In addition the performance rights will vest in three tranches based on the Company’s Volume Weighted Average Share Price (“VWAP”) exceeding price hurdles for 10 consecutive trading days. Details of these hurdles are included in the following table.
Tranche
10 Day VWAP share price hurdle
Tranche 1 $1.50 Tranche 2 $1.85 Tranche 3 $2.50
No amounts are paid or payable by the recipient on receipt of the performance right. The performance rights carry neither rights to dividends nor voting rights and are non-transferrable. There were no performance rights issued under the EPRP during the financial year ended 31 December 2013 or the previous year ended 31 December 2012. At 31 December 2013, all of the Rights remained un-vested as the vesting conditions had not been satisfied.
For
per
sona
l use
onl
y

40 Greenland Minerals and enerGy liMited – AnnuAl RepoRt 2013
Greenland Minerals and Energy Limited And Controlled Entities
31 December 2013 Financial Report
| 23 P a g e
DIRECTORS’ REPORT Remuneration Report – Audited (cont’d) Options exercised The following options issued to directors and senior management, were exercised during the financial year ended 31 December 2013. Each options converts into one ordinary share of Greenland Minerals and Energy Limited:
(i) The number of options exercised relates only to options exercised that were granted as
compensation and recognised in remuneration in prior years. There were no options were exercised by directors of senior management during the year ended 31 December 2012. Lapsed options During the current financial year the following options issued to directors and senior management lapsed as a result of vesting conditions not being satisfied. Director/senior management
Number
Value @ grant date
Lapse date
Value @ lapse date
R McIllree (i) 2,800,000 974,819 31/08/2013 - J Mair (i) 2,100,000 733,390 31/08/2013 - S Bunn (i) 2,100,000 733,390 31/08/2013 -
(i) Options lapsed as a result of not meeting vesting conditions prior to the option expiry date. During the previous financial year no options issued to directors or senior management lapsed. Rights cancelled During the current financial year the following un-vested Employee Performance Rights were cancelled upon acceptance of participation in the Employee Rights Plan offered during the year.
Senior management
Number
Value @ grant date
Cancellation date
Value @ Cancellation
date S Bunn (i) 2,100,000 1,283,660 04/10/2013 - M Guy (i) 350,000 118,938 04/10/2013 - On the date the Employee performance Rights were cancelled, the service period vesting condition had been satisfied but the market price vesting conditions had not been met, therefore the rights were un-vested at the time of cancellation. The fair value of the cancelled rights had been fully expensed prior to the cancellation.
Date
Number Exercised
(i) Exercise
Price
Share price @ exercise
date
Amount Paid
$
Amount unpaid
$
Option value at date of
exercise $
S Bunn 28/03/2013 750,000 $0.25 $0.30 187,500 - 225,000
For
per
sona
l use
onl
y

41Greenland Minerals and enerGy liMited – AnnuAl RepoRt 2013
Greenland Minerals and Energy Limited And Controlled Entities
31 December 2013 Financial Report
| 24 P a g e
DIRECTORS’ REPORT Remuneration Report – Audited (cont’d) During the financial year, the following share-based payment arrangements were applicable;
Options series Grant date Expiry date
Grant date fair value
$ Vesting date Performance rights 15/05/2011 15/05/2014 5,568,606 (i) Performance options 15/05/2011 31/08/2013 2,441,599 (ii) Employee options 21/10/2011 30/06/2013 261,587 21/10/2011 Performance rights 23/01/2012 15/05/2014 460,000 (iii) Shares in lieu of salary (employees) 25/02/2013 - 1,000,333 (iv) Share in lieu of salary (directors) 15/05/2013 - 1,019,268 (iv) Employee Rights 04/10/2013 30/09/2016 578,270 (v)
(i) The performance rights are subject to a 2 year service period vesting requirement and Company share price hurdles. The performance rights will vest in 3 tranches subject to the Company share price based on the volume weighted average price (‘VWAP’) exceeding the following price hurdles:
10 Day VWAP share
price hurdle Tranche 1 $1.50 Tranche 2 $1.85 Tranche 3 $2.50
(ii) The performance options are subject to continued employment until 30 June 2013 and
Company share price hurdles. The performance options will vest in 3 tranches subject to the Company Share price based on the volume weighted average price (‘VWAP’) exceeding the following price hurdles:
Tranche 10 Day VWAP share
price hurdle Tranche 1 $3.75 Tranche 2 $5.00 Tranche 3 $6.25
There are no further service or performance criteria that need to be met in relation to any of the above option series. (iii) The performance rights are subject to continued employment until 30 June 2013 and Company
share price hurdles. The performance rights will vest in 3 tranches subject to the Company share price based on the
volume weighted average price (‘VWAP’) exceeding the following price hurdles:
Tranche
10 Day VWAP share price hurdle
Tranche 1 $0.75 Tranche 2 $1.00 Tranche 3 $1.50
(iv) The shares issued in lieu of salary will be issued in four tranches (three tranches in the case of
M Hutchinson), the issue of the shares is subject to continued employment at the date of the tranche issue. If the director or employee resigns or their employment is terminated with cause prior to a tranche date, there will not be any entitlement to un-issued/vested tranches.
For
per
sona
l use
onl
y

42 Greenland Minerals and enerGy liMited – AnnuAl RepoRt 2013
Greenland Minerals and Energy Limited And Controlled Entities
31 December 2013 Financial Report
| 25 P a g e
DIRECTORS’ REPORT Remuneration Report – Audited (cont’d)
If the director or employee is terminated as a result of redundancy, all unissued tranches will be issued on the date of termination.
(v) The employee rights are subject to a 1 year service period vesting requirement and Company
share price hurdles. The performance rights will vest in 3 tranches subject to the Company share price based on the volume weighted average price (‘VWAP’) exceeding the following price hurdles:
Consolidated Group performance, shareholder wealth and director and senior management remuneration The remuneration policy has been tailored to align the interests of shareholders, directors and senior management. To achieve this aim, the entity may issue options to directors and senior management. Any issue of options is based on the performance of the Consolidated Group and or individual and is limited to the achievement of clearly defined bench marks and milestones. These bench marks and milestones may include:
� Share price and or the market capitalisation of the Company exceeding pre-determined levels.
� Completion of specific projects or pre-determined stages of projects. � Periods of service with the Company. � Accretion of shareholder value.
The following table shows the gross revenue and profits for the period from 31 December to 31 December 2013 for the listed entity, as well as the share price at the end of each financial period. Remuneration Report
12 month period ended
31 Dec 2013
12 Month period ended
31 Dec 2012
12 Month period ended
31 Dec 2011
12 Month period ended
31 Dec 2010
6 Month period ended
31 Dec 2009
Revenue $297,067 $351,106 $1,116,879 $717,276 $387,977 Net loss before and after tax ($8,768,670) $(17,344,250) $(14,209,550) $(7,163,998) $(3,823,380) Share price at beginning of period $0.27
$0.46
$1.20
$0.58
$0.36
Share price at end of period $0.21 $0.27 $0.46 $1.20 $0.58 Dividend - - - - - Basic loss per share $0.02 $0.04 $0.04 $0.03 $0.02 Diluted loss per share $0.02 $0.04 $0.04 $0.03 $0.02
Tranche
5 Day VWAP share price hurdle
Tranche 1 $0.50 Tranche 2 $0.75 Tranche 3 $1.00
For
per
sona
l use
onl
y

43Greenland Minerals and enerGy liMited – AnnuAl RepoRt 2013
Greenland Minerals and Energy Limited And Controlled Entities
31 December 2013 Financial Report
| 26 P a g e
DIRECTORS’ REPORT Remuneration Report – Audited (cont’d) Key terms of employment contracts Directors Michael Hutchinson, Non-executive Chairman
� Director fee excluding superannuation of $100,000 per annum reduced from £100,000 per annum on 1 July 2013.
� Entitled to shares equal in value to the reduction in director fees based on a $0.30 share price.
� Entitled to be reimbursed for all out of pocket expenses necessarily incurred in the performance of his duties including relating to travel, entertainment, accommodation, meals and telephone.
� No fixed term. Roderick McIllree, Managing Director
� Term and type of contract – service agreement subject to annual review. � Base salary of $215,000 per annum per annum and is paid monthly two weeks in advance
and two weeks in arrears, reduced from $500,000 per annum on 1 February 2013. � Entitled to shares equal in value to the reduction in salary based on a $0.30 share price. � Superannuation at 9% is payable on the base salary up to 30 June 2013, there is no
entitlement to superannuation post this date. � Rental expenses while residing in the UK. � Entitled to be reimbursed for all out of pocket expenses necessarily incurred in the
performance of their duties including relating to travel, entertainment, meals and telephone. � Either the Company or the director may terminate their engagement without cause by
giving the other party twelve months written notice, there are no other specific payout clauses.
� Remuneration will be reviewed every 12 months or as otherwise agreed between the parties.
Simon Cato, Executive Director
� Term and type of contract – service agreement limited to a maximum of 26 hours per month subject to annual review.
� Base salary, of $45,000 and is paid monthly two weeks in advance and two weeks in arrears.
� Superannuation at 9.25% is payable on the base salary. � Entitled to be reimbursed for all out of pocket expenses necessarily incurred in the
performance of his duties including relating to travel, entertainment, accommodation, meals and telephone.
� Either the Company or the director may terminate their engagement without cause by giving the other party twelve months written notice, there are no other specific payout clauses.
� Remuneration will be reviewed every 12 months or as otherwise agreed between the parties.
John Mair, Executive Director � Term and type of contract – service agreement subject to annual review. � Base salary, of $225,000 per annum and is paid monthly two weeks in advance and two
weeks in arrears, reduced from $350,000 on 1 February 2013. � Entitled to shares equal in value to the reduction in salary based on a $0.30 share price � Superannuation at 9.25% is payable on the base salary. � Entitled to be reimbursed for all out of pocket expenses necessarily incurred in the
performance of his duties including relating to travel, entertainment, accommodation, meals and telephone.
For
per
sona
l use
onl
y

44 Greenland Minerals and enerGy liMited – AnnuAl RepoRt 2013
Greenland Minerals and Energy Limited And Controlled Entities
31 December 2013 Financial Report
| 27 P a g e
DIRECTORS’ REPORT Remuneration Report – Audited (cont’d) John Mair, Executive Director (cont’d)
� Either the Company or the employee may terminate his engagement without cause by giving the other party twelve months written notice, there are no other specific payout clauses.
� Remuneration will be reviewed every 12 months or as otherwise agreed between the parties.
Anthony Ho, Non-Executive Director
� No fixed term. � $50,000 per annum. � Superannuation at 9.25% is payable on the director’s fee � Entitled to be reimbursed for all out of pocket expenses necessarily incurred in the
performance of his duties including relating to travel, entertainment, accommodation, meals and telephone.
Jeremy Whybrow, Non-Executive Director
� Term and type of contract – service agreement subject to annual review. � Director fees $45,000 per annum � Entitled to be reimbursed for all out of pocket expenses necessarily incurred in the
performance of his duties including relating to travel, entertainment, accommodation, meals and telephone.
� Either the Company or the employee may terminate his engagement without cause by giving the other party twelve months written notice, there are no other specific payout clauses.
� Remuneration will be reviewed every 12 months or as otherwise agreed between the parties.
Senior Management Shaun Bunn, Chief Operations Officer
� Term and type of contract – service agreement subject to annual review. � Base salary, of $225,000 per annum and is paid monthly two weeks in advance and two
weeks in arrears, reduced from $350,000 on 1 February 2013. � Entitled to shares equal in value to the reduction in salary and notice period, based on a
$0.30 share price. � Superannuation at 9.25% is payable on the base salary. � Entitled to be reimbursed for all out of pocket expenses necessarily incurred in the
performance of his duties including relating to travel, entertainment, accommodation, meals and telephone.
� Either the Company or the employee may terminate his engagement without cause by giving the other party three months written notice, there are no other specific payout clauses.
� Remuneration will be reviewed every 12 months or as otherwise agreed between the parties.
Miles Guy, Chief Financial Officer and Company Secretary
� Term and type of contract – service agreement subject to annual review. � Base salary, of $180,000 per annum and is paid monthly two weeks in advance and two
weeks in arrears, reduced from $200,000 per annum on 1 February 2013. � Entitled to shares equal in value to the reduction in salary and notice period, based on a
$0.30 share price. � Superannuation at 9.25% is payable on the base salary.
For
per
sona
l use
onl
y

45Greenland Minerals and enerGy liMited – AnnuAl RepoRt 2013
Greenland Minerals and Energy Limited And Controlled Entities
31 December 2013 Financial Report
| 28 P a g e
DIRECTORS’ REPORT Remuneration Report – Audited (cont’d) Miles Guy, Chief Financial Officer and Company Secretary (cont’d)
� Entitled to be reimbursed for all out of pocket expenses necessarily incurred in the
performance of his duties including relating to travel, entertainment, accommodation, meals and telephone.
� Either the Company or the employee may terminate his engagement without cause by giving the other party twelve months written notice, there are no other specific payout clauses. (Notice period has been reduced to 3 months from 1 Feb 2013)
� Remuneration will be reviewed every 12 months or as otherwise agreed between the parties.
Meetings of Directors During the financial year, 15 meetings of directors were held. Attendances by each director during the year were as follows:
Directors Meetings Director
Number of meetings eligible to attend
Number attended
M Hutchinson 15 15 R McIllree 15 15 S Cato 15 15 J Mair 15 15 A Ho 15 15 J Whybrow 15 15 Audit and Risk Committee The audit and risk committee was convened at the Directors’ Board Meeting on the 22 April 2009. The audit committee members are Anthony Ho (Chairman), Michael Hutchinson and Jeremy Whybrow. The audit and risk committee is to meet at least twice a year and must have a quorum of two members. There were 2 audit and risk committee meetings held during the current financial year, as follows:
Audit Committee Meetings Member
Number of meetings eligible to attend
Number Attended
A Ho 2 2 M Hutchinson 2 1 J Whybrow 2 2 Remuneration Committee The remuneration committee was convened at the Directors’ Board Meeting on the 22 April 2009. The audit committee members are Michael Hutchinson (Chairman), Anthony Ho and Jeremy Whybrow. The remuneration committee meeting must have a quorum of two members. There were 2 remuneration committee meetings held during the current financial year, as follows:
Audit Committee Meetings Member
Number of meetings eligible to attend
Number Attended
M Hutchinson 2 2 A Ho 2 2 J Whybrow 2 2
For
per
sona
l use
onl
y

46 Greenland Minerals and enerGy liMited – AnnuAl RepoRt 2013
Greenland Minerals and Energy Limited And Controlled Entities
31 December 2013 Financial Report
| 29 P a g e
DIRECTORS’ REPORT Indemnifying Officers During or since the end of the financial period the Company has given an indemnity or entered into an agreement to indemnify, or paid or agreed to pay insurance premium to insure the directors against liabilities for costs and expenses incurred by them in defending any legal proceedings arising out of their conduct while acting in the capacity of the director of the Consolidated Group, other than conduct involving a willful breach of duty in relation to the Consolidated Group. Proceedings on Behalf of Consolidated Group No person has applied for leave of court to bring proceedings on behalf of the Consolidated Group or intervene in any proceedings to which the Consolidated Group is a party for the purpose of taking responsibility on behalf of the Consolidated Group for all or any part of those proceedings. The Consolidated Group was not a party to any such proceedings during the period. Non-audit Services Details of amounts paid to the auditors of the Company, Deloitte Touche Tohmatsu and its related practices for audit and any non audit services for the year, are set out in note 30. Auditor’s Independence Declaration The auditor’s independence declaration for the year ended 31 December 2012 has been received and is included on page 30 the financial report. Rounding off of amounts The Consolidated Group is a Consolidated Group of the kind referred to in ASIC Class Order 98/0100, dated 10 July 1998. In accordance with that Class Order amounts in the directors’ report and the financial report are rounded off to the nearest thousand dollars, unless otherwise indicated. Signed in accordance with a resolution of directors, made pursuant to section 298(2) of the Corporations Act 2001. On behalf of the Directors. Roderick McIllree Managing Director
472013
For
per
sona
l use
onl
y

47Greenland Minerals and enerGy liMited – AnnuAl RepoRt 2013
Liability limited by a scheme approved under Professional Standards Legislation.
Member of Deloitte Touche Tohmatsu Limited.
Deloitte Touche TohmatsuABN 74 490 121 060
Woodside PlazaLevel 14240 St Georges TerracePerth WA 6000GPO Box A46Perth WA 6837 Australia
Tel: +61 8 9365 7000Fax: +61 (0) 9365 7007www.deloitte.com.au
26 March 2014
Dear Board MembersGreenland Minerals and Energy Limited
In accordance with section 307C of the Corporations Act 2001, I am pleased to provide the following declaration of independence to the directors of Greenland Minerals and EnergyLimited.
As lead audit partner for the audit of the financial statements of Greenland Minerals and EnergyLimited for the financial year ended 31 December 2013, I declare that to the best of my knowledge and belief, there have been no contraventions of:
(i) the auditor independence requirements of the Corporations Act 2001 in relation to the audit; and
(ii) any applicable code of professional conduct in relation to the audit.
Yours sincerely
DELOITTE TOUCHE TOHMATSU
David NewmanPartnerChartered Accountants
The Board of DirectorsGreenland Minerals and Energy LimitedGround Floor, Unit 6, 100 Railway Road,Subiaco WA 6008
For
per
sona
l use
onl
y

48 Greenland Minerals and enerGy liMited – AnnuAl RepoRt 2013
Liability limited by a scheme approved under Professional Standards Legislation.
Member of Deloitte Touche Tohmatsu Limited
Independent Auditor’s Report to themembers of Greenland Minerals and Energy LimitedReport on the Financial Report
We have audited the accompanying financial report of Greenland Minerals and Energy Limited, which comprises the statement of financial position as at 31 December 2013, the statement of profit or loss and other comprehensive income, the statement of cash flows and the statement of changes in equity for the year ended on that date, notes comprising a summary of significant accounting policies andother explanatory information, and the directors’ declaration of the consolidated entity comprising the company and the entities it controlled at the year’s end or from time to time during the financial yearas set out on pages 33 to 78.
Directors’ Responsibility for the Financial Report
The directors of the company are responsible for the preparation of the financial report that gives a true and fair view in accordance with Australian Accounting Standards and the Corporations Act 2001and for such internal control as the directors determine is necessary to enable the preparation of the financial report that is free from material misstatement, whether due to fraud or error. In Note 2, the directors also state, in accordance with Accounting Standard AASB 101 Presentation of Financial Statements, that the financial statements comply with International Financial Reporting Standards.
Auditor’s Responsibility
Our responsibility is to express an opinion on the financial report based on our audit. We conducted our audit in accordance with Australian Auditing Standards. Those standards require that we comply with relevant ethical requirements relating to audit engagements and plan and perform the audit toobtain reasonable assurance whether the financial report is free from material misstatement.
An audit involves performing procedures to obtain audit evidence about the amounts and disclosures in the financial report. The procedures selected depend on the auditor’s judgement, including the assessment of the risks of material misstatement of the financial report, whether due to fraud or error. In making those risk assessments, the auditor considers internal control, relevant to the entity’spreparation of the financial report that gives a true and fair view, in order to design audit procedures that are appropriate in the circumstances, but not for the purpose of expressing an opinion on the effectiveness of the entity’s internal control. An audit also includes evaluating the appropriateness of accounting policies used and the reasonableness of accounting estimates made by the directors, as well as evaluating the overall presentation of the financial report.
We believe that the audit evidence we have obtained is sufficient and appropriate to provide a basis for our audit opinion.
Deloitte Touche TohmatsuABN 74 490 121 060
Woodside PlazaLevel 14240 St Georges TerracePerth WA 6000GPO Box A46Perth WA 6837 Australia
DX 206Tel: +61 (0) 8 9365 7000Fax: +61 (0) 8 9365 7001www.deloitte.com.au
50 to 95
For
per
sona
l use
onl
y

49Greenland Minerals and enerGy liMited – AnnuAl RepoRt 2013
Auditor’s Independence Declaration
In conducting our audit, we have complied with the independence requirements of the Corporations Act 2001. We confirm that the independence declaration required by the Corporations Act 2001,which has been given to the directors of Greenland Minerals and Energy Limited would be in the same terms if given to the directors as at the time of this auditor’s report.
Opinion
In our opinion:
(a) the financial report of Greenland Minerals and Energy Limited is in accordance with the Corporations Act 2001, including:
(i) giving a true and fair view of the consolidated entity’s financial position as at 31 December 2013 and of its performance for the year ended on that date; and
(ii) complying with Australian Accounting Standards and the Corporations Regulations 2001; and
(b) the consolidated financial statements also comply with International Financial Reporting Standards as disclosed in Note 2.
Report on the Remuneration Report
We have audited the Remuneration Report included in pages 14 to 28 of the directors’ report for the year ended 31 December 2013. The directors of the company are responsible for the preparation and presentation of the Remuneration Report in accordance with section 300A of the Corporations Act 2001. Our responsibility is to express an opinion on the Remuneration Report, based on our audit conducted in accordance with Australian Auditing Standards.
Opinion
In our opinion the Remuneration Report of Greenland Minerals and Energy Limited for the year ended 31 December 2013, complies with section 300A of the Corporations Act 2001.
DELOITTE TOUCHE TOHMATSU
David NewmanPartnerChartered AccountantsPerth, 26 March 2014
31 to 45
For
per
sona
l use
onl
y

50 Greenland Minerals and enerGy liMited – AnnuAl RepoRt 2013
Greenland Minerals and Energy Limited And Controlled Entities
31 December 2013 Financial Report
| 33 P a g e
Directors’ declaration
The directors declare that: (a) in the directors’ opinion, there are reasonable grounds to believe that the Company will be able
to pay its debts as and when they become due and payable; (b) in the directors’ opinion, the attached financial statements and notes thereto are in accordance
with the Corporations Act 2001, including compliance with accounting standards and giving a true and fair view of the financial position and performance of the Consolidated Group;
(c) the attached financial statements and notes thereto, are in compliance with International Financial Reporting Standards as stated in note 2 of the financial statements; and
(d) the directors have been given the declarations required by s.295A of the Corporations Act 2001. Signed in accordance with a resolution of the directors made pursuant to s.295(5) of the Corporations Act 2001. On behalf of the Directors Roderick McIllree Managing Director Subiaco, 26 March 2014
For
per
sona
l use
onl
y

51Greenland Minerals and enerGy liMited – AnnuAl RepoRt 2013
Greenland Minerals and Energy Limited And Controlled Entities
31 December 2013 Financial Report
| 34 P a g e
Consolidated statement of profit or loss and other comprehensive income for the year ended 31 December 2013
Notes to the financial statements are included on pages 38 to 78
Dec
2013 Dec 2012
Note $' 000 $' 000 Revenue from continuing operations 5 297 351 Expenditure Director and employee benefits 6(a) (5,923) (9,205) Professional fees 6(b) (523) (1,224) Occupancy expenses 6(c) (405) (409) Listing costs 6(d) (102) (217) Write-down of royalty acquisition 6(e) - (5,075) Other expenses 6(f) (2,113) (1,565) Loss before tax (8,769) (17,344) Income tax expense 7 - - Loss for year (8,769) (17,344) Other comprehensive income Items that may be reclassified subsequently to profit and loss Exchange difference arising on translation of foreign operations 9,893 1,450 Income tax relating to components of comprehensive income 7 - - Other comprehensive income for the year 9,893 1,450 Total comprehensive income for the year 1,124 (15,894) Loss attributable to: Owners of the parent (8,769) (16,675) Non-controlling interest - (669) (8,769) (17,344) Total comprehensive income attributable to: Owners of the parent 1,124 (15,247) Non-controlling interest - (647) 1,124 (15,894) Basic loss per share – cents per share 20 1.53 3.72 Diluted loss per share – cents per share 1.53 3.72
Notes to the financial statements are included on pages 55 to 95.
For
per
sona
l use
onl
y

52 Greenland Minerals and enerGy liMited – AnnuAl RepoRt 2013
Greenland Minerals and Energy Limited And Controlled Entities
31 December 2013 Financial Report
| 35 P a g e
Consolidated statement of financial position as at 31 December 2013
Dec
2013 Dec
2012 Current Assets Note $' 000 $' 000 Cash and cash equivalents 8 5,343 10,801 Trade and other receivables 9 49 326 Other assets 10 275 311 Total Current Assets 5,667 11,438 Non-Current Assets Investments in associates 41 31 Property, plant and equipment 11 1,505 1,540 Capitalised exploration and evaluation expenditure 12 64,859 53,642 Total Non-Current Assets 66,405 55,213 Total Assets 72,072 66,651 Current Liabilities Trade and Other Payables 13 543 1,240 Other liabilities 14 125 - Provisions 15 144 331 Total Current Liabilities 812 1,571 Non-Current Liabilities Provisions 15 30 89 Total Non-Current Liabilities 30 89 Total Liabilities 842 1,660 Net Assets 71,230 64,991 Equity Issued Capital 16 336,950 334,399 Reserves 17 (10,246) (22,703) Accumulated Losses 19 (255,474) (246,705) Total Equity 71,230 64,991
Notes to the financial statements are included on pages 38 to 78
Notes to the financial statements are included on pages 55 to 95.
For
per
sona
l use
onl
y

53Greenland Minerals and enerGy liMited – AnnuAl RepoRt 2013
Greenland Minerals and Energy Limited And Controlled Entities
31 December 2013 Financial Report
| 36 P a g e
Consolidated statement of changes in equity for the year ended 31 December 2013
Notes to the financial statements are included on pages 38 to 78
Non - Foreign Controlling Attributable
currency interest to equity Non- Issued Option translation acquisition Accumulated holders of controlling capital reserve reserve reserve losses the parent interest Total
$' 000 $' 000 $' 000 $’000 $' 000 $' 000 $' 000 $' 000 Balance at 1 January 2012 291,826 14,997 (6,783) (5,611) (230,030) 64,399 (6,407) 57,992
Net loss for the year - - - - (16,675) (16,675) (669) (17,344) Other Comprehensive income - - 1,428 - - 1,428 22 1,450 Total comprehensive for the year - - 1,428 - (16,675) (15,247) (647) (15,894) Issue of shares net of transaction costs 15,046 812 - - - 15,858 - 15,858 Issue of shares for royalty acquisition 5,075 - - - - 5,075 - 5,075 Issue of shares from Recognition of share based payments 753 6,208 - - 6,961 - 6,961 Recognition acquisition of non-controlling interest 21,699 307 - (34,061) - (12,055) 7,054 (5,001) Balance at 31 December 2012 334,399 22,324 (5,355) (39,672) (246,705) 64,991 - 64,991 Balance at 1 January 2013 334,399 22,324 (5,355) (39,672) (246,705) 64,991 - 64,991
Net loss for the year - - - - (8,769) (8,769) - (8,769) Other Comprehensive income - - 9,893 - - 9,893 - 9,893 Total comprehensive for the year - - 9,893 - (8,769) 1,124 - 1,124 Issue of shares from Recognition of share based payments 2,102 2,825 - - 4,927 - 4,927 Issue of shares from option exercise 449 (261) - - - 188 - 188 Balance at 31 December 2013 336,950 24,888 4,538 (39,672) (255,474) 71,230 - 71,230
Greenland M
inerals and Energy Limited
And C
ontrolled Entities 31 D
ecember 2013 Financial R
eport
| 36 P
ag
e
Consolidated statem
ent of changes in equity for the year ended 31 D
ecember 2013
Notes to the financial statem
ents are included on pages 38 to 78
Non -
Foreign C
ontrolling A
ttributable currency
interest to equity
Non-
Issued O
ption translation
acquisition A
ccumulated
holders of controlling
capital reserve
reserve reserve
losses the parent
interest Total
$' 000 $' 000
$' 000 $’000
$' 000 $' 000
$' 000 $' 000
Balance at 1 January
2012 291,826
14,997 (6,783)
(5,611) (230,030)
64,399 (6,407)
57,992
Net loss for the year
- -
- -
(16,675) (16,675)
(669) (17,344)
Other C
omprehensive
incom
e -
- 1,428
- -
1,428 22
1,450 Total com
prehensive
for the year -
- 1,428
- (16,675)
(15,247) (647)
(15,894) Issue of shares
net of transaction costs
15,046 812
- -
- 15,858
- 15,858
Issue of shares for royalty acquisition
5,075 -
- -
- 5,075
- 5,075
Issue of shares from
R
ecognition of share based paym
ents 753
6,208 -
-
6,961 -
6,961 R
ecognition acquisition of non-controlling interest
21,699 307
- (34,061)
- (12,055)
7,054 (5,001)
Balance at 31 D
ecember
2012 334,399
22,324 (5,355)
(39,672) (246,705)
64,991 -
64,991
Balance at 1 January
2013 334,399
22,324 (5,355)
(39,672) (246,705)
64,991 -
64,991
Net loss for the year
- -
- -
(8,769) (8,769)
- (8,769)
Other C
omprehensive
income
- -
9,893 -
- 9,893
- 9,893
Total comprehensive
for the year -
- 9,893
- (8,769)
1,124 -
1,124 Issue of shares from
R
ecognition of share based paym
ents 2,102
2,825 -
-
4,927 -
4,927 Issue of shares from
option exercise
449 (261)
- -
- 188
- 188
Balance at 31 D
ecember
2013 336,950
24,888 4,538
(39,672) (255,474)
71,230 -
71,230
Notes to the financial statements are included on pages 55 to 95.
For
per
sona
l use
onl
y

54 Greenland Minerals and enerGy liMited – AnnuAl RepoRt 2013
Greenland Minerals and Energy Limited And Controlled Entities
31 December 2013 Financial Report
| 37 P a g e
Consolidated statement of cash flows for the year ended 31 December 2013
31 Dec 2013
31 Dec 2012
Note $' 000 $' 000 Cash flows from operating activities Receipts from customers 24 114 Payments to suppliers and employees (4,156) (5,890) Net cash used in operating activities 23 (4,132) (5,776) Cash flows from investing activities Interest received 267 283 Payments for property, plant and equipment (9) (38) Payments for exploration and development (2,332) (6,008) Payment related to acquisition of non-controlling interest - (5,000) Payment for investments - (245) Payment for investments in associates (10) - Proceeds from sale of property, plant and equipment 3 Proceeds from sale of investments 1 133 Proceeds from sale of investments in associates - 50 Proceeds from government grants and rebates 566 Net cash used in investing activities (1,514) (10,825) Cash flows from financing activities Proceeds from issue of shares/options 188 17,058 Payment for shares/options issue costs - (522) Net cash from financing activities 188 16,536 Net decrease in cash and equivalents (5,458) (65) Cash and equivalents at the beginning of the financial year 10,801 10,866 Cash and equivalents at the end of the Financial year 8 5,343 10,801
Notes to the financial statements are included on pages 38 to 78
Notes to the financial statements are included on pages 55 to 95.
For
per
sona
l use
onl
y

55Greenland Minerals and enerGy liMited – AnnuAl RepoRt 2013
Greenland Minerals and Energy Limited And Controlled Entities
31 December 2013 Financial Report
| 38 P a g e
Notes to the accounts 1. General information Greenland Minerals and Energy Limited is a public Company listed on the Australian Securities Exchange, incorporated in Australia and operating in Greenland with its head office in Perth. Greenland Minerals and Energy Limited registered office and its principal place of business are as follows: Registered office Principal place of business Unit 6, 100 Railway Road Subiaco WA Unit 6, 100 Railway Road Subiaco WA The Company’s principal activities are mineral exploration and evaluation. 2. Significant accounting policies Statement of compliance The financial report is a general purpose financial report which has been prepared in accordance with the Corporations Act 2001, Accounting Standards and Interpretations, and complies with other requirements of the law. The financial report includes the consolidated financial statements of the group. Accounting Standards include Australian Accounting Standards. Compliance with Australian Accounting Standards ensures that the financial statements and notes of the Consolidated Group comply with International Financial Reporting Standards (‘IFRS’). The Consolidated Group is a for-profit entity for the purpose of preparing the financial statements. The financial statements were authorised for issue by the directors on 26 March 2014. Basis of preparation The financial report has been prepared on the basis of historical cost, except for the revaluation of certain non-current assets and financial instruments. Cost is based on the fair values of the consideration given in exchange for assets. All amounts are presented in Australian dollars, unless otherwise noted. The Company is a company of the kind referred to in ASIC Class Order 98/0100, dated 10 July 1998, and in accordance with that Class Order amounts in the financial report are rounded off to the nearest thousand dollars, unless otherwise indicated. Critical accounting judgments and key sources of estimation uncertainty In the application of the Consolidated Group’s accounting policies, management is required to make judgments, estimates and assumptions about carrying values of assets and liabilities that are not readily apparent from other sources. The estimates and associated assumptions are based on historical experience and other factors that are considered to be relevant. Actual results may differ from these estimates. The estimates and underlying assumptions are reviewed on an ongoing basis. Revisions to accounting estimates are recognised in the period in which the estimate is revised if the revision affects only that period or in the period of the revision and future periods if the revision affects both current and future periods. Refer to note 3 for a discussion of critical judgements in applying the entity’s accounting policies, and key sources of estimation uncertainty. Adoption of new and revised Accounting Standards In the current period, the Consolidated Group has adopted all of the new and revised Standards and The following Standards and Interpretations have been adopted in the current year: - AASB 10 – Consolidated Financial Statements - AASB 11 – Joint arrangements - AASB 12 – Disclosure of interest in Other Entities - AASB 127 – Separate Financial Statements (2011) - AASB 128 – Investments in Associates and Joint Ventures (2011) - AASB 13 – Fair value measurement and related AASB 2011-8 Amendments to Australian
Accounting Standards arising from AASB 13
For
per
sona
l use
onl
y

56 Greenland Minerals and enerGy liMited – AnnuAl RepoRt 2013
Greenland Minerals and Energy Limited And Controlled Entities
31 December 2013 Financial Report
| 39 P a g e
Notes to the accounts - AASB 119 – Employee benefits (2011), AASB 2011-10 Amendments to Australian Accounting
Standards arising from AASB 119 (2011) and AASB 2011-11 Amendments to AASB 119 (2011)
- AASB 2011-4 – Amendments to Australian Accounting Standards arising from the Consolidation and Joint Arrangement Standards
- AASB 2011-9 – Amendments to Australian Accounting Standards - Presentation of other comprehensive income
- AASB 2012-2 – Amendments to Australian Accounting Standards - Disclosures - Offsetting financial assets and financial liabilities (Amendments to AASB 7)
- AASB 2012-5 – Amendments to Australian Accounting Standards arising from Annual Improvements 2009-2011 Cycle
The adoption of these standards did not result in changes in accounting policies or adjustments to the amounts recognised in the financial statements. The standards only affected disclosures in the notes to the financial statements. Impact of the application of AASB 10 AASB 10 changes the definition of control such that an investor has control over an investee when a) it has power of the investee b) it is exposed, or has rights, to variable returns from its involvement with the investee and c) has the ability to use its power to affect its returns. All three of these criteria must be met for an investor to have control over an investee. Previously, control was defined as the power to govern the financial and operating policies of an entity so as to obtain benefits from its activities. The application of AASB 10 has had no impact on the consolidated financial statements. Impact of the application of AASB 11 AASB 11 deals with how a joint arrangement of which two or more parties have joint control should be classified and accounted for. Under AASB 11, there are only two types of joint arrangements – joint operations and joint ventures. The classification of joint arrangements under AASB 11 is determined based on the rights and obligations of parties to the joint arrangements by considering the structure, the legal form of the arrangements, the contractual terms agreed by the parties to the arrangement, and when relevant, other facts and circumstances. A joint operation is a joint arrangement whereby the parties that have joint control of the arrangement (i.e joint operators) have rights to the assets, and obligations for the liabilities, relating to the arrangement. A joint venture is a joint arrangement whereby the parties that have joint control of the arrangement (i.e joint venturers) have rights to the net assets of the arrangement. Previously, AASB 31 contemplated three types of joint arrangements – jointly controlled entities, jointly controlled operations and jointly controlled assets. The classification of joint arrangement under AASB 31 was primarily determined based on the legal form of the arrangement. The application of AASB 11 has had no impact on the consolidated financial statements. Impact of the application of AASB 12 AASB 12 is a new disclosure standard and is applicable to entities that have interest in subsidiaries, joint arrangements, associates and/or unconsolidated structured entities. In general, the application of AASB 12 has resulted in more extensive disclosures in the consolidated financial statements but this has not had a material impact on the current year consolidated financial statements. Impact of the application of AASB 13 The Consolidated Entity has applied AASB 13 for the first time in the current year. AASB 13 establishes a single source of guidance for fair value measurement and disclosures about fair value measurements. The scope of AASB 13 is broad, the fair value measurement requirements of AASB 13 apply to both financial instrument items and non-financial instrument items for which other AASB require or permit fair value measurements and disclosures about fair value measurements, except share-based payment transactions that are within the scope of AASB 2, leasing transactions within the scope of AASB 17 and measurements that have some similarities to fair value but are not fair value.
For
per
sona
l use
onl
y

57Greenland Minerals and enerGy liMited – AnnuAl RepoRt 2013
Greenland Minerals and Energy Limited And Controlled Entities
31 December 2013 Financial Report
| 40 P a g e
Notes to the accounts AASB 13 defines fair value as the price that would be received to sell an asset or paid to transfer a liability in an orderly transaction in the principal (or most advantageous) market at the measurement date under current market conditions. Fair value under AASB 13 is an exit price regardless of whether that price is directly observable or estimated using another valuation n technique. Also, AASB 13 includes extensive disclosure requirements. AASB 13 requires prospective application from 1 January 2013. The application of AASB 13 has not had any material impact on the amounts recognised in the consolidated financial statements. Impact of the application of AASB 119 In the current year, the Consolidated Entity has applied AASB 119 (as revised in 2011) ‘Employee Benefits’ and the related consequential amendments for the first time. AASB 119 (as revised in 2011) changes the accounting for defined benefit plans and termination benefits. The application of AASB 119 has had no impact on the consolidated financial statements. Impact of the application of AASB 2012-2 The Consolidated Entity has applied the amendments to AASB 7 “Disclosures – Offsetting Financial Assets and Financial Liabilities’ for the first time in the current year. The amendments to AASB 7 require entities to disclose information about rights of offset and related arrangements (such as collateral posting requirements) for financial instruments under an enforceable master netting agreement or similar arrangement. As the Consolidated Entity does not have any offsetting arrangements in place, the application of the amendments has had no material impact on the disclosures or on the amounts recognised in the consolidated financial statements. The Consolidated Entity has not elected to early adopt any new standards or amendments. At the date of authorisation of the financial report, a number of Standards and Interpretations were on issue but not yet effective: At the date of authorisation of the financial report, a number of Standards and interpretations were on issue but not yet effective: Standard/Interpretation
Effective for annual reporting periods
beginning on or after
a) AASB 9 ‘Financial Instruments’(December 2009) and AASB 2009-11 ‘Amendments to Australian Accounting Standards arising from AASB 9’ b) AASB 2012-6 ‘Amendments to Australian Accounting Standards – Mandatory Effective Date of AASB 8 and Transition Disclosure’ AASB 2013-9 ‘Amendments to Australian Accounting Standards – Conceptual Framework, Materiality and Financial Instruments’
1 January 2017
AASB 1031 ‘Materiality’ (2013) 1 January 2014 ASB 2011-4 ‘Amendments to Australian Accounting Standards to Remove Individual Key Management Personnel Disclosure Requirements’ 1 July 2013
AASB 2012-3 ‘Amendments to Australian Accounting Standards – Offsetting Financial Assets and Financial Liabilities’ 1 January 2014
AASB 2013-3 ‘Amendments to AASB 136 - Recoverable Amount Disclosures for Non-Financial Assets’ 1 January 2014
AASB 2013-4 ‘Amendments to Australian Accounting Standards - Novation of Derivatives and Continuation of Hedge Accounting’ 1 January 2014
AASB 2013-9 ‘Amendments to Australian Accounting Standards – Conceptual Framework, Materiality and Financial Instruments’ 1 January 2014
For
per
sona
l use
onl
y

58 Greenland Minerals and enerGy liMited – AnnuAl RepoRt 2013
Greenland Minerals and Energy Limited And Controlled Entities
31 December 2013 Financial Report
| 41 P a g e
Notes to the accounts 2. Significant accounting policies (cont’d) The Directors note that the impact of the initial application of the Standards and Interpretations is not yet known or is not reasonably estimable. These Standards and Interpretations will be first applied in the financial report of the Consolidated Entity that relates to the annual reporting period beginning on or after the effective date of each pronouncement. The following significant accounting policies have been adopted in the preparation and presentation of the financial report: (a) Basis of consolidation
The consolidated financial statements incorporate the financial statements of the Company and entities (including special purpose entities) controlled by the Company (its subsidiaries). Control is achieved where the Company has the power to govern the financial and operating policies of an entity so as to obtain benefits from its activities. The results of subsidiaries acquired or disposed of during the year are included in the consolidated statement of comprehensive income from the effective date of acquisition and up to the effective date of disposal, as appropriate. Where necessary, adjustments are made to the financial statements of subsidiaries to bring their accounting policies into line with those used by other members of the Consolidated Group. All intra-group transactions, balances, income and expenses are eliminated in full on consolidation. Non-controlling interests in subsidiaries are identified separately from the Group’s equity therein. The interests of non-controlling shareholders may be initially measured either at fair value or at the non-controlling interests’ proportionate share of the fair value of the acquiree’s identifiable net assets. The choice of measurement basis is made on an acquisition-by-acquisition basis. Subsequent to acquisition, the carrying amount of non-controlling interests is the amount of those interests at initial recognition plus the non-controlling interests’ share of subsequent changes in equity. Total comprehensive income is attributed to non-controlling interests even if this results in the non-controlling interests having a deficit balance. Changes in the Consolidated Group’s interests in subsidiaries that do not result in a loss of control are accounted for as equity transactions. The carrying amounts of the Consolidated Group’s interests and the non-controlling interests are adjusted to reflect the changes in their relative interests in the subsidiaries. Any difference between the amount by which the non-controlling interests are adjusted and the fair value of the consideration paid or received is recognised directly in equity and attributed to owners of the Company.
(b) Joint venture arrangements
Jointly controlled operations Where the Consolidated Group is a venturer and so has joint control in a jointly controlled operation, the Consolidated Group recognises the assets that it controls and the liabilities and expenses that it incurs, as a party to the joint venture.
(c) Foreign currency
The individual financial statements of each group entity are presented in its functional currency being the currency of the primary economic environment in which the entity operates. For the purpose of the consolidated financial statements, the results and financial position of each entity are expressed in Australian dollars, which is the functional currency of Greenland Minerals and Energy Limited and the presentation currency for the consolidated financial statements. In preparing the financial statements of the individual entities, transactions in currencies other than the entity’s functional currency are recorded at the rates of exchange prevailing on the dates of the transactions. At each balance sheet date, monetary items denominated in foreign currencies are retranslated at the rates prevailing at the balance sheet date. Non-monetary items carried at fair value that are denominated in foreign currencies are retranslated at the rates prevailing on the date when the fair value was determined. Non-monetary items that are measured in terms of historical cost in a foreign currency are not retranslated.
For
per
sona
l use
onl
y

59Greenland Minerals and enerGy liMited – AnnuAl RepoRt 2013
Greenland Minerals and Energy Limited And Controlled Entities
31 December 2013 Financial Report
| 42 P a g e
Notes to the accounts 2. Significant accounting policies (cont’d)
Exchange differences are recognised in profit or loss in the period in which they arise except for: � exchange differences on monetary items receivable from or payable to a foreign
operation for which settlement is neither planned or likely to occur, which form part of the net investment in a foreign operation, and which are recognised in the foreign currency translation reserve and recognised in profit or loss on disposal of the net investment.
On consolidation, the assets and liabilities of the Consolidated Group’s foreign operations are translated into Australian dollars at exchange rates prevailing on the balance sheet date. Income and expense items are translated at the average exchange rates for the period, unless exchange rates fluctuated significantly during that period, in which case the exchange rates at the dates of the transactions are used. Exchange differences arising, if any, are classified as equity and transferred to the Consolidated Group’s foreign currency translation reserve. Such exchange differences are recognised in profit or loss in the period in which the foreign operation is disposed.
(d) Goods and services tax Revenues, expenses and assets are recognised net of the amount of goods and services tax (GST), except: i. where the amount of GST incurred is not recoverable from the taxation authority, it is
recognised as part of the cost of acquisition of an asset or as part of an item of expense; or
ii. for receivables and payables which are recognised inclusive of GST. The net amount of GST recoverable from, or payable to, the taxation authority is included as part of receivables or payables. Cash flows are included in the cash flow statement on a gross basis. The GST component of cash flows arising from investing and financing activities which is recoverable from, or payable to, the taxation authority is classified within operating cash flows.
(e) Revenue
Revenue is measured at the fair value of the consideration when received or receivable. Interest revenue Interest revenue is accrued on a time basis, by reference to the principal outstanding and at the effective interest rate applicable, which is the rate that exactly discounts estimated future cash receipts through the expected life of the financial asset to that asset’s net carrying amount. Rental income Revenue from operating sub-leases is recognised in accordance with the Consolidated Group’s accounting policy.
(f) Share-based payments
Equity-settled share-based payments with employees and others providing similar services are measured at the fair value of the equity instrument at the grant date. Fair value is measured by use of an appropriate valuation method. The expected life used in the model has been adjusted, based on management’s best estimate, for the effects of non-transferability, exercise restrictions, and behavioural considerations. Further details on how the fair value of equity-settled share-based transactions are in note 24. The fair value determined at the grant date of the equity-settled share-based payments is expensed on a straight-line basis over the vesting period, based on the Consolidated Group’s estimate of equity instruments that will eventually vest. At each reporting date, the Consolidated Group revises its estimate of the number of equity instruments expected to vest. The impact of the revision of the original estimates, if any, is recognised in profit or loss over the remaining vesting period, with corresponding adjustment to the equity-settled employee benefits reserve. Equity-settled share-based payment transactions with other parties are measured at the fair value of the goods and services received, except where the fair value cannot be estimated reliably, in which case they are measured at the fair value of the equity instruments granted, measured at the date the entity obtains the goods or the counterparty renders the service.
For
per
sona
l use
onl
y

60 Greenland Minerals and enerGy liMited – AnnuAl RepoRt 2013
Greenland Minerals and Energy Limited And Controlled Entities
31 December 2013 Financial Report
| 43 P a g e
Notes to the accounts 2. Significant accounting policies (cont’d)
(g) Income tax
Current tax Current tax is calculated by reference to the amount of income taxes payable or recoverable in respect of the taxable profit or tax loss for the period. It is calculated using tax rates and tax laws that have been enacted or substantively enacted by reporting date. Current tax for current and prior periods is recognised as a liability (or asset) to the extent that it is unpaid (or refundable). Deferred tax Deferred tax is accounted for using the balance sheet liability method. Temporary differences are differences between the tax base of an asset or liability and its carrying amount in the balance sheet. The tax base of an asset or liability is the amount attributed to that asset or liability for tax purposes. In principle, deferred tax liabilities are recognised for all taxable temporary differences. Deferred tax assets are recognised to the extent that it is probable that sufficient taxable amounts will be available against which deductible temporary differences or unused tax losses and tax offsets can be utilised. However, deferred tax assets and liabilities are not recognised if the temporary differences giving rise to them arise from the initial recognition of assets and liabilities (other than as a result of a business combination) which affects neither taxable income nor accounting profit. Furthermore, a deferred tax liability is not recognised in relation to taxable temporary differences arising from the initial recognition of goodwill. Deferred tax liabilities are recognised for taxable temporary differences associated with investments in subsidiaries and interests in joint ventures except where the Consolidated Group is able to control the reversal of the temporary differences and it is probable that the temporary differences will not reverse in the foreseeable future. Deferred tax assets arising from deductible temporary differences associated with these investments and interests are only recognised to the extent that it is probable that there will be sufficient taxable profits against which to utilise the benefits of the temporary differences and they are expected to reverse in the foreseeable future. Deferred tax assets and liabilities are measured at the tax rates that are expected to apply to the period(s) when the asset and liability giving rise to them are realised or settled, based on tax rates (and tax laws) that have been enacted or substantively enacted by reporting date. The measurement of deferred tax liabilities and assets reflects the tax consequences that would follow from the manner in which the Consolidated Group expects, at the reporting date, to recover or settle the carrying amount of its assets and liabilities. Deferred tax assets and liabilities are offset when they relate to income taxes levied by the same taxation authority and the Company/Consolidated Group intends to settle its current tax assets and liabilities on a net basis. Current and deferred tax for the period Current and deferred tax is recognised in profit or loss, except when it relates to items credited or debited directly to equity, in which case the deferred tax is also recognised directly in equity, or where it arises from the initial accounting for a business combination, in which case it is taken into account in the determination of goodwill or excess.
(h) Cash and cash equivalents Cash comprises cash on hand and demand deposits. Cash equivalents are short-term, highly liquid investments that are readily convertible to known amounts of cash, which are subject to an insignificant risk of changes in value and have a maturity of three months or less at the date of acquisition.
(i) Financial assets
Financial assets are recognised and derecognised on trade date where the purchase or sale of a financial asset is under a contract whose terms require delivery of the financial asset within the timeframe established by the market concerned, and are initially measured at fair value, net of transaction costs except for those financial assets classified as at fair value through profit or loss which are initially measured at fair value. Financial assets are classified into the following specified categories: ‘Financial assets at fair value through profit and loss (FVTPL)’, ‘available-for-sale’ financial assets, and ‘loans and receivables’. The classification depends on the nature and purpose of the financial assets and is determined at the time of initial recognition.
For
per
sona
l use
onl
y

61Greenland Minerals and enerGy liMited – AnnuAl RepoRt 2013
Greenland Minerals and Energy Limited And Controlled Entities
31 December 2013 Financial Report
| 44 P a g e
Notes to the accounts 2. Significant accounting policies (cont’d)
Effective interest method The effective interest method is a method of calculating the amortised cost of a financial asset and of allocating interest income over the relevant period. The effective interest rate is the rate that exactly discounts estimated future cash receipts (including all fees on points paid or received that form an integral part of the effective interest rate, transaction costs and other premiums or discounts) through the expected life of the financial asset, or, where appropriate, a shorter period. Income is recognised on an effective interest rate basis for debt instruments other than those financial assets ‘at fair value through profit or loss’. Financial assets at fair value through profit or loss Financial assets are classified as financial assets at fair value through profit or loss where the financial asset: � has been acquired principally for the purpose of selling in the near future; � is a part of an identified portfolio of financial instruments that the Consolidated Group
manages together and has a recent actual pattern of short-term profit-taking; or � is a derivative that is not designated and effective as a hedging instrument. Financial assets at fair value through profit or loss are stated at fair value, with any resultant gain or loss recognised in profit or loss. The net gain or loss recognised in profit or loss incorporates any dividend or interest earned on the financial asset. Fair value is determined in the manner described in note 10. Loans and receivables Trade receivables, loans, and other receivables that have fixed or determinable payments that are not quoted in an active market are classified as ‘loans and receivables’. Loans and receivables are measured at amortised cost using the effective interest method less impairment. Interest income is recognised by applying the effective interest rate. Impairment of financial assets Financial assets are assessed for indicators of impairment at each reporting date. Financial assets are impaired where there is objective evidence that as a result of one or more events that occurred after the initial recognition of the financial asset the estimated future cash flows of the investment have been impacted. For financial assets carried at amortised cost, the amount of the impairment is the difference between the asset’s carrying amount and the present value of estimated future cash flows, discounted at the original effective interest rate. The carrying amount of financial assets including uncollectible trade receivables is reduced by the impairment loss through the use of an allowance account. Subsequent recoveries of amounts previously written off are credited against the allowance account. Changes in the carrying amount of the allowance account are recognised in profit or loss. With the exception of available-for-sale equity instruments, if, in a subsequent period, the amount of the impairment loss decreases and the decrease can be related objectively to an event occurring after the impairment was recognised, the previously recognised impairment loss is reversed through profit or loss to the extent the carrying amount of the receivable at the date the impairment is reversed does not exceed what the amortised cost would have been had the impairment not been recognised. In respect of available-for-sale equity instruments, any subsequent increase in fair value after an impairment loss is recognised directly in equity. Derecognition of financial assets The Consolidated Group de-recognises a financial asset only when the contractual rights to the cash flows from the asset expire, or it transfers the financial asset and substantially all the risks and rewards of ownership of the asset to another entity. If the Consolidated Group neither transfers nor retains substantially all the risks and rewards of ownership and continues to control the transferred asset, the Consolidated Group recognises its retained interest in the asset and an associated liability for amounts it may have to pay. If the Consolidated Group retains substantially all the risks and rewards of ownership of a transferred financial asset, the Consolidated Group continues to recognise the financial asset and also recognises a collateralised borrowing for the proceeds received.
For
per
sona
l use
onl
y
62 Greenland Minerals and enerGy liMited – AnnuAl RepoRt 2013
Greenland Minerals and Energy Limited And Controlled Entities
31 December 2013 Financial Report
| 45 P a g e
Notes to the accounts 2. Significant accounting policies (cont’d)
(j) Property, plant and equipment
Plant and equipment and leasehold improvements are stated at cost less accumulated depreciation and impairment. Cost includes expenditure that is directly attributable to the acquisition of the item. In the event that settlement of all or part of the purchase consideration is deferred, cost is determined by discounting the amounts payable in the future to their present value as at the date of acquisition. Depreciation on plant and equipment is calculated on a diminishing value basis so as to write off the net cost or other devalued amount of each asset over its expected useful life to its estimated residual value. Leasehold improvements are depreciated over the period of the lease or estimated useful life, whichever is the shorter, using the diminishing value method. The estimated useful lives, residual values and depreciation method are reviewed at the end of each annual reporting period, with the effect of any changes recognised on a prospective basis. Assets held under finance leases are depreciated over their expected useful lives on the same basis as owned assets or, where shorter, the term of the relevant lease. The gain or loss arising on disposal or retirement of an item of property, plant and equipment is determined as the difference between the sales proceeds and the carrying amount of the asset and is recognised in profit or loss. The following useful lives are used in the calculation of depreciation: Leasehold improvements 10 – 15 years Plant and equipment 4 – 10 years Buildings 20 years
(k) Leased assets Leases are classified as finance leases when the terms of the lease transfer substantially all the risks and rewards incidental to ownership of the leased asset to the lessee. All other leases are classified as operating leases. Group as lessor Rental income from operating leases is recognised on a straight-line basis over the term of the relevant lease. However, contingent rentals arising under operating leases are recognised as income in a manner consistent with the basis on which they are determined. Initial direct costs incurred in negotiating and arranging an operating lease are added to the carrying amount of the leased asset and recognised on a straight-line basis over the lease term.
(l) Employee benefits
A liability is recognised for benefits accruing to employees in respect of wages and salaries, annual leave, long service leave, and sick leave when it is probable that settlement will be required and they are capable of being measured reliably. Liabilities recognised in respect of short-term employee benefits, are measured at their nominal values using the remuneration rate expected to apply at the time of settlement. Liabilities recognised in respect of long-term employee benefits, are measured as the present value of the estimated future cash outflows to be made by the Consolidated Group in respect of services provided by employees up to reporting date.
(m) Financial instruments issued by the Consolidated Group Debt and equity instruments Debt and equity instruments are classified as either liabilities or as equity in accordance with the substance of the contractual arrangement. An equity instrument is any contract that evidences a residual interest in the assets of an entity after deducting all of its liabilities. Equity instruments issued by the Consolidated Group are recorded at the proceeds received, net of direct issue costs. Financial liabilities Financial liabilities are classified as either financial liabilities ‘at fair value through profit or loss’ or other financial liabilities.
For
per
sona
l use
onl
y
63Greenland Minerals and enerGy liMited – AnnuAl RepoRt 2013
Greenland Minerals and Energy Limited And Controlled Entities
31 December 2013 Financial Report
| 46 P a g e
Notes to the accounts 2. Significant accounting policies (cont’d)
Other financial liabilities Other financial liabilities, including borrowings, are initially measured at fair value, net of transaction costs. Other financial liabilities are subsequently measured at amortised cost using the effective interest method, with interest expense recognised on an effective yield basis. The effective interest method is a method of calculating the amortised cost of a financial liability and of allocating interest expense over the relevant period. The effective interest rate is the rate that exactly discounts estimated future cash payments through the expected life of the financial liability, or, where appropriate, a shorter period.
(n) Impairment of long-lived assets excluding goodwill
At each reporting date, the Consolidated Group reviews the carrying amounts of its assets to determine whether there is any indication that those assets have suffered an impairment loss. If any such indication exists, the recoverable amount of the asset is estimated in order to determine the extent of the impairment loss (if any). Where the asset does not generate cash flows that are independent from other assets, the Consolidated Group estimates the recoverable amount of the cash-generating unit to which the asset belongs. Where a reasonable and consistent basis of allocation can be identified, corporate assets are also allocated to individual cash-generating units, or otherwise they are allocated to the smallest group of cash-generating units for which a reasonable and consistent allocation basis can be identified. Recoverable amount is the higher of fair value less costs to sell and value in use. In assessing value in use, the estimated future cash flows are discounted to their present value using a pre-tax discount rate that reflects current market assessments of the time value of money and the risks specific to the asset for which the estimates of future cash flows have not been adjusted. If the recoverable amount of an asset (or cash-generating unit) is estimated to be less than its carrying amount, the carrying amount of the asset (cash-generating unit) is reduced to its recoverable amount. An impairment loss is recognised immediately in profit or loss. Where an impairment loss subsequently reverses, the carrying amount of the asset (cash-generating unit) is increased to the revised estimate of its recoverable amount, but only to the extent that the increased carrying amount does not exceed the carrying amount that would have been determined had no impairment loss been recognised for the asset (cash-generating unit) in prior years. A reversal of an impairment loss is recognised immediately in profit or loss.
(o) Capitalisation of exploration and evaluation expenditure
Exploration and evaluation expenditures in relation to each separate area of interest are recognised as an exploration and evaluation asset in the year in which they are incurred where the following conditions are satisfied: (i) the rights to tenure of the area of interest are current; and (ii) at least one of the following conditions is also met:
(a) the exploration and evaluation expenditures are expected to be recouped through successful development and exploration of the area of interest, or alternatively, by its sale; or
(b) exploration and evaluation activities in the area of interest have not, at the reporting date, reached a stage which permits a reasonable assessment of the existence or otherwise of economically recoverable reserves, and active and significant operations in, or in relation to, the area of interest are continuing.
Exploration and evaluation assets are initially measured at cost and include acquisition of rights to explore, studies, exploratory drilling, trenching and sampling and associated activities and an allocation of depreciation and amortisation of assets used in exploration and evaluation activities. General and administrative costs are only included in the measurement of exploration and evaluation costs where they are related directly to operational activities in a particular area of interest.
For
per
sona
l use
onl
y

64 Greenland Minerals and enerGy liMited – AnnuAl RepoRt 2013
Greenland Minerals and Energy Limited And Controlled Entities
31 December 2013 Financial Report
| 47 P a g e
Notes to the accounts 2. Significant accounting policies (cont’d)
Exploration and evaluation assets are assessed for impairment when facts and circumstances suggest that the carrying amount of an exploration and evaluation asset may exceed its recoverable amount. The recoverable amount of the exploration and evaluation asset (or the cash-generating unit(s) to which it has been allocated, being no larger than the relevant area of interest) is estimated to determine the extent of the impairment loss (if any). Where an impairment loss subsequently reverses, the carrying amount of the asset is increased to the revised estimate of its recoverable amount, but only to the extent that the increased carrying amount does not exceed the carrying amount that would have been determined had no impairment loss been recognised for the asset in previous years. Where a decision is made to proceed with development in respect of a particular area of interest, the relevant exploration and evaluation asset is tested for impairment and the balance is then reclassified to development.
(p) Provisions
Provisions are recognised when the Consolidated Group has a present obligation (legal or constructive) as a result of a past event, it is probable that the Consolidated Group will be required to settle the obligation, and a reliable estimate can be made of the amount of the obligation. The amount recognised as a provision is the best estimate of the consideration required to settle the present obligation at reporting date, taking into account the risks and uncertainties surrounding the obligation. Where a provision is measured using the cashflows estimated to settle the present obligation, its carrying amount is the present value of those cashflows. When some or all of the economic benefits required to settle a provision are expected to be recovered from a third party, the receivable is recognised as an asset if it is virtually certain that reimbursement will be received and the amount of the receivable can be measured reliably.
3: Critical accounting estimates and judgments In preparing this Financial Report the Consolidated Group has been required to make certain estimates and assumptions concerning future occurrences. There is an inherent risk that the resulting accounting estimates will not equate exactly with actual events and results. a) Significant accounting judgments
In the process of applying the Consolidated Group's accounting policies, management has made the following judgments, apart from those involving estimations, which have the most significant effect on the amounts recognised in the financial statements: Capitalisation of exploration and evaluation expenditure The Consolidated Group has capitalised significant exploration and evaluation expenditure on the basis either that this is expected to be recouped through future successful development or alternatively sale of the Areas of Interest. If ultimately the area of interest is abandoned or is not successfully commercialised, the carrying value of the capitalised exploration and evaluation expenditure would be written down to its recoverable amount. Deferred tax assets The Consolidated Group expects to have carried forward tax losses which have not been recognised as deferred tax assets as it is not considered sufficiently probable at this point in time, that these losses will be recouped by means of future profits taxable in the relevant jurisdictions.
b) Significant accounting estimates and assumptions The carrying amounts of certain assets and liabilities are often determined based on estimates and assumptions of future events. The key estimates and assumptions that have a significant risk of causing a material adjustment to the carrying amounts of certain assets and liabilities within the next annual reporting period are:
For
per
sona
l use
onl
y

65Greenland Minerals and enerGy liMited – AnnuAl RepoRt 2013
Greenland Minerals and Energy Limited And Controlled Entities
31 December 2013 Financial Report
| 48 P a g e
Notes to the accounts 3: Critical accounting estimates and judgments (cont’d)
Impairment of capitalised exploration and evaluation expenditure The future recoverability of capitalised exploration and evaluation expenditure is dependent on a number of factors, including whether the Consolidated Group decides to exploit the related lease itself or, if not, whether it successfully recovers the related exploration and evaluation asset through sale. Factors that could impact the future recoverability include the level of reserves and resources, future technological changes, costs of drilling and production, production rates, future legal and political changes, (including obtaining the right to mine and changes to environmental restoration obligations) and changes to commodity prices. As at 31 December 2013, the carrying value of capitalised exploration expenditure is $64,859,287 (2012: $53,642,412) refer to note 12.
4: Segment information AASB8 Operating Segments requires operating segments to be identified on the basis of internal reports about components of the entity that are regularly reviewed by the managing director (chief operating decision maker) in order to allocate resources to the segment and assess performance. The Consolidated Group undertakes mineral exploration and evaluation in Greenland. Given the Consolidated Group has one reporting segment, operating results and financial information are not separately disclosed in this note. 5: Revenue
31 Dec 2013
31 Dec 2012
$' 000 $' 000 Interest - Bank deposits 256 274 Other revenue 41 77 297 351
6: Expenditure
31 Dec 2013
31 Dec 2012
$' 000 $' 000 (a) Director and employee benefits Directors’ fees (237) (245) Directors’ and employee salary and wage expense (1,218) (2,594) Directors’ and employee post-employment benefits (72) (158) Directors’ and employee share based payments (4,396) (6,208) (5,923) (9,205)
For
per
sona
l use
onl
y

66 Greenland Minerals and enerGy liMited – AnnuAl RepoRt 2013
Greenland Minerals and Energy Limited And Controlled Entities
31 December 2013 Financial Report
| 49 P a g e
Notes to the accounts 6: Expenditure (cont’d)
31 Dec 2013
31 Dec 2012
$' 000 $' 000 (b) Professional fees: Audit, accounting and taxation expense (203) (215) Legal fess (91) (388) Marketing and public relations (166) (276) Consulting (63) (345) (523) (1,224) (c) Occupancy expense: Rent (382) (375) Electricity (23) (34) (405) (409) (d) Listing costs: Stock exchange fees (65) (150) Share registry fees (37) (67) (102) (217) (e) Write-down of royalty acquisition Write-down of royalty acquisition (i) - (5,075) - (5,075) (f) Other expenses Loss on disposal of investments (15) (75) Changes in fair value of held for trading assets - (27) Gain/(Loss) on foreign currency exchange 1 1
Impairment of capitalised exploration and evaluation expenditure (871) -
Depreciation expense (188) (232) Insurance (129) (145) Operating lease rental expenses (5) (10) Travel expenses (171) (370) Payroll tax (69) (195) Printing, stationery and office costs (27) (58) Telephone (73) (111) Other expenses (566) (343) (2,113) (1,565)
(i) In October 2012 the Company finalised the acquisition of a royalty over future production from the Kvanefjeld project, through the issue of 17,500,000 shares, refer to note 16. The rights to this royalty were previously held by an external party. Any future payments under the royalty would have been a liability to the Consolidated Group and recognised as an expense in the relevant future period. The acquisition of the royalty has reduced the future potential costs to the Consolidated Group and hence satisfied the recognition criteria for intangible assets as per AASB 138 “Intangible assets”. The royalty was assessed for recoverability at the date of acquisition with a write-down recognised based on the present stage of the development of the project. Therefore the value of the royalty acquisition has been recognised as an expense in the year ended 31 December 2012.
For
per
sona
l use
onl
y

67Greenland Minerals and enerGy liMited – AnnuAl RepoRt 2013
Greenland Minerals and Energy Limited And Controlled Entities
31 December 2013 Financial Report
| 50 P a g e
Notes to the accounts 7: Income tax
31 Dec 2013
31 Dec 2012
$' 000 $' 000 (a) Tax expense - - Current tax - - Deferred tax - - - - b) The prima facie income tax benefit on pre-tax accounting
loss from operations reconciles to the income tax expenses in the financial statements as follows:
Loss for period (8,769) (17,344) Prima facie tax benefit on loss at 30% (2,631) (5,203) add: Tax effect of: other non-allowable items 1,698 3,475 provisions and accruals 43 177 accrued income 9 11 revenue loss not recognised 1,981 4,283 3,731 7,946 Less: Tax effect of: exploration, evaluation and development expenditure (818) (2,309) provisions and accruals (157) (112) capital expenditure write off (120) (319) other deductions (5) (3) (1,100) (2,743)
Income tax expense - -
The following deferred tax balances have not been recognised:
Deferred tax assets: at 30% Carry forward revenue losses 26,056 24,075 Capital expenditure costs 706 1,064 26,762 25,139 Less: offset against deferred tax liability (11,665) (10,849) 15,097 14,290
The above deferred tax assets will only be recognised if;
(i) The Consolidated Group derives future assessable income of a nature and amount sufficient to enable the benefits to be utilised,
(ii) The Consolidated Group continues to comply with the conditions of deductibility imposed by law, and
(iii) No change in income tax legislation adversely affects the Consolidated Group’s ability to utilise the benefits.
For
per
sona
l use
onl
y

68 Greenland Minerals and enerGy liMited – AnnuAl RepoRt 2013
Greenland Minerals and Energy Limited And Controlled Entities
31 December 2013 Financial Report
| 51 P a g e
Notes to the accounts 7: Income tax (cont’d)
31 Dec
2013 31 Dec 2012
$' 000 $' 000 Deferred tax liabilities (not recognised): at 30% Exploration, evaluation and development expenditure 11,656 10,838 Accrued income 9 11 11,665 10,849 less offset against deferred tax assets (11,665) (10,849) - -
8: Cash and equivalents
Dec 2013
Dec 2012
$' 000 $' 000 Cash at bank 253 123 Cash on deposit at call 4,665 10,259 Cash on deposit 425 419 5,343 10,801
The Consolidated Group’s financial risk management objectives and policies are discussed further at note 25. 9: Trade and other receivables
Dec 2013
Dec 2012
$' 000 $' 000 (a) Current Accrued interest 18 29 GST refundable 31 280 Payroll tax refund - 17 49 326
(i) Trade debtors and sundry debtors are non-interest bearing, unsecured and generally on 30 day terms. As at 31 December 2013 and 31 December 2012 no amounts were past due but not impaired. Additionally there was no allowance for doubtful debts at either 31 December 2013 or 31 December 2012.
For
per
sona
l use
onl
y

69Greenland Minerals and enerGy liMited – AnnuAl RepoRt 2013
Greenland Minerals and Energy Limited And Controlled Entities
31 December 2013 Financial Report
| 52 P a g e
Notes to the accounts 10: Other assets
Dec 2013
Dec 2012
$' 000 $' 000 Deposit bonds 96 103 Prepayments 179 193 Investments carried at fair value: Shares in listed companies – fair value (i) - 15 275 311
(i) Movement in market value is based on the closing price on the Australian Securities
Exchange, of the shares held on the reporting date. 11: Property, plant and equipment
Dec 2013
Dec 2012
$' 000 $' 000 Plant and Equipment (cost) 1,616 1,567 Accumulated depreciation (906) (734) Leasehold improvements (cost) 99 99 Accumulated depreciation (33) (26) Buildings 844 694 Accumulated depreciation (115) (60) 1,505 1,540
(a) Movements in the carrying amounts
Movement in the carrying values for each class of property, plant and equipment between the beginning and the end of the period.
For
per
sona
l use
onl
y

70 Greenland Minerals and enerGy liMited – AnnuAl RepoRt 2013
Greenland Minerals and Energy Limited And Controlled Entities
31 December 2013 Financial Report
| 53 P a g e
Notes to the accounts 11: Property, plant and equipment (cont’d)
Dec 2013
Dec 2012
$' 000 $' 000 Plant and Equipment Carrying value at beginning of year 833 985 Acquisitions 9 38 Disposals (3) - Effects of currency translation 15 - Depreciation expense (144) (190) Carrying value at end of year 710 833 Leasehold improvements Carrying value at beginning of year 73 80 Depreciation expense (7) (7) Carrying value at end of year 66 73 Buildings Acquisitions 634 669 Effects of currency translation 132 - Depreciation (37) (35) Carrying value at end of year 729 634 Total property, plant and equipment carrying value at end of period 1,505 1,540
12: Capitalised exploration and evaluation expenditure
Dec 2013
Dec 2012
$' 000 $' 000 Balance at beginning of year 53,642 46,808 Exploration and/or evaluation phase in current period: Capitalised expenses 2,728 5,368 Effects of currency translation (i) 9,360 - 65,730 52,176 Less: Impairment of capitalised expenditure (iii) (871) Effects of currency translation (i) - 1,466 Balance at end of year 64,859 53,642
(i) The Kvanefjeld Project EL 2010/02 is held by Greenland Minerals and Energy (Trading) A/S, the
100% held Greenlandic subsidiary. As a result all capitalised exploration and evaluation expenditure has been recognised in the Greenlandic subsidiary and at reporting date has been translated at the closing Australian dollar/Danish kroner exchange rate with the movement being recognised in the foreign currency translation reserve.
For
per
sona
l use
onl
y

71Greenland Minerals and enerGy liMited – AnnuAl RepoRt 2013
Greenland Minerals and Energy Limited And Controlled Entities
31 December 2013 Financial Report
| 54 P a g e
Notes to the accounts 12: Capitalised exploration and evaluation expenditure (cont’d)
(ii) During the year the Company directly held 100% interest in Greenland exploration licenses EL 2011/26 and EL 2011/27.
(iii) EL 2011/23 was relinquished during the year and the capitalised costs impaired. This exploration license was on the east coast of Greenland and unrelated to the Kvanefjeld project.
(iv) The recoverability of the Consolidated Group’s carrying value of the capitalised exploration and evaluation expenditure relating to the Kvanefjeld Project and EL 2011/26 and EL 2011/27 is subject to the successful development and exploitation of the exploration property. The Consolidated Group will carry out a feasibility study including among other areas, environmental and social impact studies, with the intention of applying for the right to mine.
(v) The Consolidated Group and the Greenland Government are currently in consultations with stakeholders, regarding the social and environmental aspects of the project. Based on this combined with the developments outlined above, the Consolidated Group has a positive outlook regarding its ability to successfully develop the project, as a multi element project including uranium. The Consolidated Group will continue to explore and evaluate the project, with the view of moving to development, subject to approval to mine rare earth elements with uranium. This will be done in a manner that is in accordance with both Greenland Government and local community expectations.
Table of exploration licenses Exploration Licence Location Ownership
EL 2010/02 Southern Greenland 100% held by Greenland Minerals and Energy (Trading) A/S
EL 2011/26 Southern Greenland 100% held by Greenland Minerals and Energy Limited
EL 2011/27 Southern Greenland 100% held by Greenland Minerals and Energy Limited
EL 2013/05 (i) Western Greenland 100% held by Greenland Minerals and Energy Limited
(i) Unrelated exploration license to the Kvanefjeld project that at the year ended 31 December
2013, the Consolidated Group had incurred no expenditure on.
For
per
sona
l use
onl
y

72 Greenland Minerals and enerGy liMited – AnnuAl RepoRt 2013
Greenland Minerals and Energy Limited And Controlled Entities
31 December 2013 Financial Report
| 55 P a g e
Notes to the accounts 13: Trade and other payables
Dec 2013
Dec 2012
$' 000 $' 000 Accrued expenses (i) 163 329 Trade creditors (ii) 282 703 Sundry creditors (ii) 98 208 543 1,240
(i) Accrued expenses related to services and goods provided to the Consolidated Group prior to
the period end, but the Consolidated Group was not charged or invoiced for these goods and services by the supplier at period end. The amounts are generally payable and paid within 30 days and are non-interest bearing.
(ii) Trade and sundry creditors are non-interest bearing with the exception of amounts owed on
corporate credit cards and after 30 days interest is charged at rates ranging between 15% and 18%. All trade and sundry creditors are generally payable on terms of 30 days.
(iii) The financial risk related to trade and other payables is managed by ensuring sufficient at call cash balances are maintained by the Consolidated Group to enable the settlement in full of all amounts as and when they become due for payment.
14: Other liabilities
Dec 2013
Dec 2012
$' 000 $' 000 EURARE grant advanced payment (i) 125 - 125 -
(i) Greenland Minerals and Energy (Trading) A/S is a participant in the EURARE Project, a
European Union initiated project to assess the development and exploitation of Europe’s rare earth deposits. As a participant in the EURARE Project Greenland Minerals and Energy (Trading) A/S has received an advanced grant payment, which is to be applied against approved EURARE Project expenses. The EURARE grant advance payment is the balance of the grant received as at 31 December 2013 that had not been applied to approved project expenses, but is expected to be applied against expenses incurred in the future period.
15: Provisions - Current
Dec 2013
Dec 2012
$' 000 $' 000 Provision for annual leave 144 331 144 331
Provisions – Non-Current
Dec 2013
Dec 2012
$' 000 $' 000 Provision for long service leave 30 89 30 89
For
per
sona
l use
onl
y

73Greenland Minerals and enerGy liMited – AnnuAl RepoRt 2013
Greenland Minerals and Energy Limited And Controlled Entities
31 December 2013 Financial Report
| 56 P a g e
Notes to the accounts 16: Issued capital Changes to the then Corporations Law abolished the authorised capital and par value concept in relation to share capital from 1 July 1998. Therefore, the Consolidated Group does not have a limited amount of authorised capital and issued shares do not have a par value. Fully paid ordinary shares carry one vote per share and carry the right to dividends. Dec 2013 Dec 2012 No No ' 000 $' 000 ' 000 $' 000 Balance brought forward 567,937 334,399 416,390 291,826 Issue of ordinary shares through capital raisings - - 50,000 15,000 Issue of ordinary shares through share purchase plan - - 6,859 2,057 Issue of ordinary shares as consideration for acquisition of royalty (refer note 6f) - - 17,500 5,075 Issue of ordinary shares as consideration for share based payments 5,885 2,102 2,363 753 Issue of ordinary shares in relation to the acquisition of the non-controlling interest in the Kvanefjeld project (refer to note 16) - - 74,825 21,700 Issue of ordinary shares as a result of exercised options: $0.25 exercise price options 750 449 - - Less costs associated with shares issued - - (2,012) Balance at end of financial year 574,572 336,950 567,937 334,399
17: Reserves
Dec 2013
Dec 2012
a) Option reserve $' 000 $' 000 Balance brought forward 22,324 14,997 Issue of options to directors (i) 213 854 Issue of options to senior management (i) 92 367 Issue of performance rights to directors (i) 683 2,381 Issue of performance rights to senior management (i) 175 701 Issue of performance rights to staff (i) 510 1,905 Issue of employee rights to senior management (i) 140 - Issue of employee rights to staff (i) 269 - Issue of $0.75 exercise price options in relation to the acquisition of the non-controlling interest in the Kvanefjeld project - 307 Issue of $0.60 exercise price options on the basis of one option for every two $0.30 shares issued - 812 Recognition of shares issued in lieu of salary 1,912 - Transfer to share capital – shares issued in lieu of salary (1,169) - Options exercised – transferred to share capital: $0.25 exercise price options (261) - Balance at end of financial year 24,888 22,324
(i) Refer to note 24 for further information.
For
per
sona
l use
onl
y

74 Greenland Minerals and enerGy liMited – AnnuAl RepoRt 2013
Greenland Minerals and Energy Limited And Controlled Entities
31 December 2013 Financial Report
| 57 P a g e
Notes to the accounts 17: Reserves (cont’d) The option reserve arises from the grant of share options and performance rights to executives, employees and consultants. Amounts are transferred out of the reserve and into issued capital when the options are exercised. Further information about share-based payments to directors and senior management is made in note 24 to the financial statements.
Dec 2013
Dec 2012
b) Foreign currency translation reserve $' 000 $' 000 Balance brought forward (5,355) (6,783) Current period adjustment from currency translation of foreign controlled entities 9,893 1,428 Balance at end of year 4,538 (5,355)
The foreign currency translation reserve records the foreign currency differences arising from the translation of the foreign subsidiary’s accounts from Danish Kroner, the functional currency of Greenland Minerals and Energy (Trading) A/S, to Australian dollars.
Dec 2013
Dec 2012
c) Non-controlling interest acquisition reserve $' 000 $' 000 Balance brought forward (39,672) (5,611) Settlement consideration – cash (i) - (5,000) Settlement consideration – shares (i) - (21,700) Settlement consideration – options (i) - (307) Transfer non-controlling interest carrying value - (7,054) Balance at end of year (39,672) (39,672)
The non-controlling interest acquisition reserve records the acquisition of the non-controlling interests in Greenland Minerals and Energy (Trading) A/S.
(i) In October 2012, the Company finalised the settlement acquisition of the outstanding 39% of the issued capital of Greenland Minerals and Energy (Trading) A/S and moved to 100% ownership of the subsidiary. As consideration for settlement and in addition to the deposit amounts recognised in the previous year, the Company paid $5,000,000, issued 74,824,997 shares and 4,999,520 options with an exercise price of $0.75.
For
per
sona
l use
onl
y
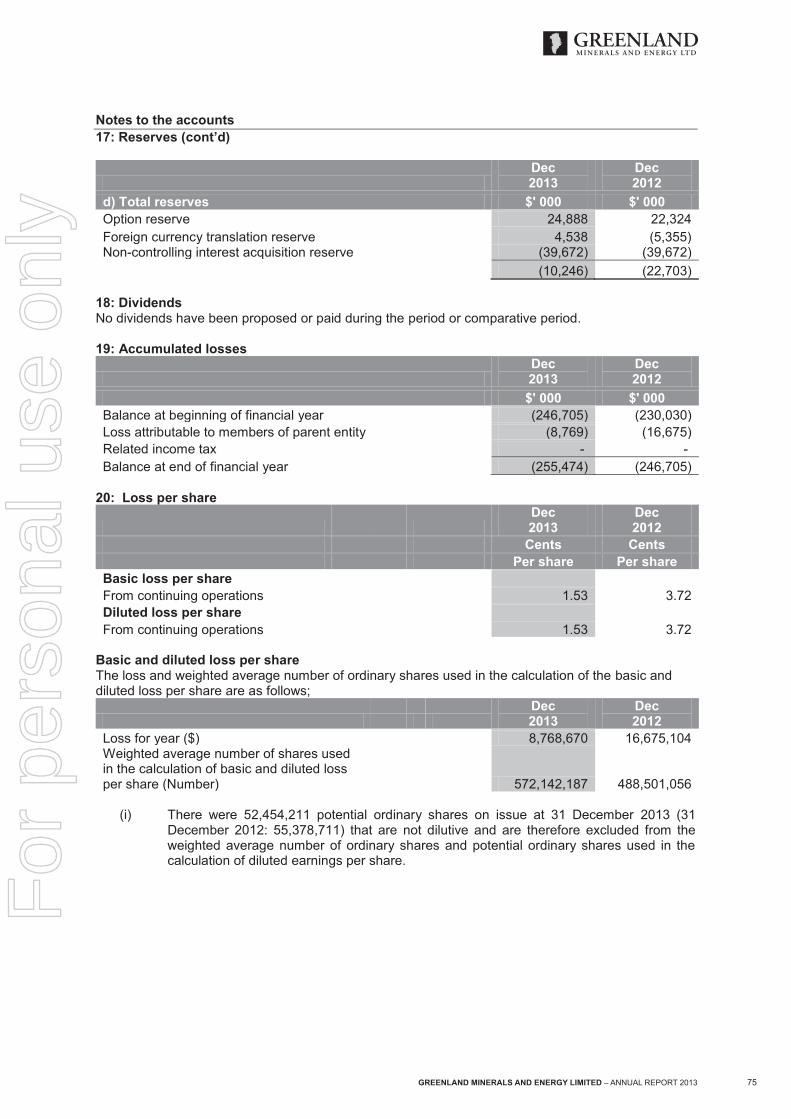
75Greenland Minerals and enerGy liMited – AnnuAl RepoRt 2013
Greenland Minerals and Energy Limited And Controlled Entities
31 December 2013 Financial Report
| 58 P a g e
Notes to the accounts 17: Reserves (cont’d)
Dec 2013
Dec 2012
d) Total reserves $' 000 $' 000 Option reserve 24,888 22,324 Foreign currency translation reserve 4,538 (5,355) Non-controlling interest acquisition reserve (39,672) (39,672) (10,246) (22,703)
18: Dividends No dividends have been proposed or paid during the period or comparative period. 19: Accumulated losses
Dec 2013
Dec 2012
$' 000 $' 000 Balance at beginning of financial year (246,705) (230,030) Loss attributable to members of parent entity (8,769) (16,675) Related income tax - - Balance at end of financial year (255,474) (246,705)
20: Loss per share
Dec 2013
Dec 2012
Cents Cents Per share Per share Basic loss per share From continuing operations 1.53 3.72 Diluted loss per share From continuing operations 1.53 3.72
Basic and diluted loss per share The loss and weighted average number of ordinary shares used in the calculation of the basic and diluted loss per share are as follows;
Dec 2013
Dec 2012
Loss for year ($) 8,768,670 16,675,104 Weighted average number of shares used in the calculation of basic and diluted loss per share (Number) 572,142,187 488,501,056
(i) There were 52,454,211 potential ordinary shares on issue at 31 December 2013 (31
December 2012: 55,378,711) that are not dilutive and are therefore excluded from the weighted average number of ordinary shares and potential ordinary shares used in the calculation of diluted earnings per share.
For
per
sona
l use
onl
y

76 Greenland Minerals and enerGy liMited – AnnuAl RepoRt 2013
Greenland Minerals and Energy Limited And Controlled Entities
31 December 2013 Financial Report
| 59 P a g e
Notes to the accounts 21: Commitments for expenditure
Exploration commitments: EL 2010/02 is located in Greenland. The tenement expenditure incurred during the year ended 31 December 2013 and prior years was in excess of the minimum expenditure required to maintain the tenement in good standing. The excess expenditure can be carried forward for 5 years. The amount carried forward will be sufficient to meet the minimum expenditure requirements over this period.
The Consolidated Group has recognised sufficient estimated expenditure to keep exploration licenses
EL 2011/23, El 2011/26 and El2011/27 in good standing.
Dec 2013 $’000
Dec 2012 $’000
Tenement commitments Not longer than 1 year - 250 Longer than 1 year but not longer than 5 years 1,000 1,000 Longer than 5 years - - 1,000 1,250 Operating leases (i) Not longer than 1 year 198 210 Longer than 1 year but not longer than 5 years 17 17 Longer than 5 years - - 215 227 Other contractual obligations (ii) Not longer than 1 year 140 - Longer than 1 year but not longer than 5 years - 160 Longer than 5 years - - 140 160
(i) The only commitments for operating leases are lease rentals on the Consolidated
Group’s Perth head office premises. The current lease expires on the 14 February 2015, and is non-cancelable, with a 2 year renewal option. No liabilities have been recognised in relation to operating leases at 31 December 2013 or 31 December 2012.
(ii) Relates to ongoing contractual obligations with Gravner Limited for corporate advisory services.
22: Subsidiaries
Name of subsidiary Country
of incorporation
Ownership interest Dec 2013
%
Dec 2012
% Chahood Capital Limited Isle of Man 100 100 Greenland Minerals and Energy (Trading) A/S (i) Greenland 100 100
For
per
sona
l use
onl
y

77Greenland Minerals and enerGy liMited – AnnuAl RepoRt 2013
Greenland Minerals and Energy Limited And Controlled Entities
31 December 2013 Financial Report
| 60 P a g e
Notes to the accounts
23: Notes to the statement of cash flows Reconciliation of loss for the period to net cash flows from operating activities.
Year ended 31 Dec 2013
Year ended 31 Dec 2012
$' 000 $' 000 Loss for the year (8,769) (17,344) (Gain) loss on sale or disposal of non-current assets 15 75 (Gain) loss on revaluation of fair value through profit and loss of financial assets - 27 Depreciation 188 231 Equity-settled share-based payments 4,806 6,207 Royalty acquisition - 5,075 Impairment of capitalised exploration and evaluation expenditure 871 - Interest income received and receivable (256) (274) (Increase)/decrease in assets Trade and other receivables 287 51 Increase (decrease) in liabilities trade and other payables (1,028) 236 in provisions (246) (60) Net cash used in operating activities (4,132) (5,776)
The Consolidated Group has not entered into any other non-cash financing or investing activities. 24: Share based payments In addition to the share based payments discussed elsewhere within this this note, the following share-based payment arrangements were entered into in the year ended 31 December 2013:
(i) Shares issued to debtors. (ii) Shares issued to employee in lieu of salary and other employment entitlements. (iii) Shares issued to employees as termination payment. (iv) Shares issued in lieu of salary. (v) No share based payments other than as discussed elsewhere within this note were entered
into during the prior year.
Date Number Issue Price Value 25/02/2013 (i) 1,128,571 $0.39 $440,143 25/02/2013 (ii) 1,261,949 $0.39 $492,160 25/02/2013 (iii) 897,334 $0.39 $349,960 15/05/2013 (iv) 744,833 $0.29 $216,001 01/10/2013 (iii) 897,344 $0.37 $335,575 01/11/2013 (iv) 955,471 $0.28 $267,642
For
per
sona
l use
onl
y

78 Greenland Minerals and enerGy liMited – AnnuAl RepoRt 2013
Greenland Minerals and Energy Limited And Controlled Entities
31 December 2013 Financial Report
| 61 P a g e
Notes to the accounts 24: Share based payments (cont’d) Shares in lieu of salaries In February 2013 as part of a strategy to preserve cash reserves, directors, senior management and a number of other staff agreed to a reduction in salary and other employment entitlements that would have been payable by the Company in cash. As compensation for agreeing to these reductions, the Company agreed to issue shares to the individuals concerned. The number of shares to be issued was established by calculating the dollar value of foregone employment entitlements and issuing the equivalent value in shares based on a share price of $0.30. The shares are to be issued in four tranches over a two year period except for Michael Hutchinson who will be issued shares over three tranches. The shares that have been and are to be issued to directors were approved by shareholders at the Company’s Annual General Meeting on 15 May 2013. In accordance with AASB2, the value of the shares in lieu of salaries has been recognised as the fair value of the shares issued in the first two tranches during the year ended 31 December 2013 and a proportion of the fair value of the remaining two trances to be issued in the year ended 31 December 2014. All four tranches require continuous service through to the respective vesting date. As a result of this vesting profile, 79% of the total fair value of the four tranches has been recognised at 31 December 2013, with the balance to be recognised during the year ended 31 December 2015. Shares issued to staff in lieu of salary and other employment entitlements during the year ended 31 December 2013
Tranche
Number
Grant date fair
value $
Pro-rata vesting period value
recognised during the year ended
31 Dec 2013 1 897,334 345,474 345,473 2 906,344 340,060 340,060 3 915,445 343,567 266,839 4 923,733 346,733 185,200 3,642,856 1,375,834 1,137,572
Shares issued to directors in lieu of salary during the year ended 31 December 2013
Tranche
Number
Grant date fair
value $
Pro-rata vesting period value
recognised during the year ended
31 Dec 2013 1 744,833 216,001 216,001 2 955,471 267,642 267,642 3 955,470 267,758 175,955 4 955,467 267,874 115,376 3,611,241 1,019,275 774,974
Employee Rights In September 2013 the Remuneration Committee and the Board approved the Employee Rights Plan (“ERP”) and approved the issue of Employee Rights under the plan. All employees of the Consolidated Group were invited to participate in the ERP. The number of rights being offered to employees was determined by the seniority of the employee, with three levels of seniority being established and a factor based on the seniority being applied to the employee’s base salary.
For
per
sona
l use
onl
y

79Greenland Minerals and enerGy liMited – AnnuAl RepoRt 2013
Greenland Minerals and Energy Limited And Controlled Entities
31 December 2013 Financial Report
| 62 P a g e
Notes to the accounts 24: Share based payments (cont’d) The Employee Rights will convert to Ordinary fully paid shares subject to a twelve month continuous service period vesting condition and in three tranches subject to share price vesting conditions. The Employee Rights were offered to assist in retaining and to further incentivise employees. In accepting the offer of the Employee Rights, employees agreed that the Employee Performance Rights issued in 2011 would be cancelled. At the time the Employee Performance Rights were cancelled, the fair value of the cancelled rights had been fully expensed. The Employee Rights were not offer to directors and no directors participated in the Employee Rights Issue. The Employee Rights will vest in three tranches based on the Company’s Volume Weighted Average Share Price (“VWAP”) exceeding price hurdles for 5 consecutive trading days. Tranche 1 - Will vest upon both the volume weighted average price of Shares being $0.50 or more
for 5 consecutive Trading Days and the employee remaining an employee of the Company until 30 September 2014.
Tranche 2 - Will vest upon both the volume weighted average price of Shares being $0.75 or more
for 5 consecutive Trading Days and the employee remaining an employee of the Company until 30 September 2014.
Tranche 3 - Will vest upon both the volume weighted average price of Shares being $1.00 or more
for 5 consecutive Trading Days and the employee remaining an employee of the Company until 30 September 2014.
No amounts are paid or payable by the recipient on receipt of the performance right. The performance rights carry neither rights to dividends nor voting rights and are non-transferrable. The value of the performance rights issued will be recognised as an expense over the expected service vesting period. The fair value has been established using a binomial model based on the following variables:
Grant date 04/10/2013 Underlying share price at grant date $0.27 Maximum life 3 Years Expected future volatility 100% Risk free rate 2.84% Tranche1 share price hurdle $0.50 Tranche2 share price hurdle $0.75 Tranche3 share price hurdle $1.00
Performance rights On the 23 January 2012, shareholders approved the issue of 1,000,000 un-vested performance rights to Anthony Ho. These rights were issued to Mr Ho in recognition of the work and his valuable input in securing the agreement to acquire the remaining 39% interest in the Kvanefjeld project. The performance rights will vest in three tranches based on the Company’s Volume Weighted Average Share Price (“VWAP”) exceeding price hurdles for 10 consecutive trading days.
For
per
sona
l use
onl
y

80 Greenland Minerals and enerGy liMited – AnnuAl RepoRt 2013
Greenland Minerals and Energy Limited And Controlled Entities
31 December 2013 Financial Report
| 63 P a g e
Notes to the accounts 24: Share based payments (cont’d) Tranche 1 - Will vest upon both the volume weighted average price of Shares being $0.75 or more
for 10 consecutive Trading Days and remain an employee of the Company until 30 June 2013.
Tranche 2 - Will vest upon both the volume weighted average price of Shares being $1.00 or more
for 10 consecutive Trading Days and remain an employee of the Company until 30 June 2013.
Tranche 3 - Will vest upon both the volume weighted average price of Shares being $1.50 or more
for 10 consecutive Trading Days and remain an employee of the Company until 30 June 2013.
No amounts are paid or payable by the recipient on receipt of the performance right. The performance rights carry neither rights to dividends nor voting rights and are non-transferrable. The Company did not issue any performance rights during the year ended 31 December 2013. The value of the performance rights issued will be recognised as an expense over the expected service vesting period. The fair value has been established using a binomial model based on the following variables:
Grant date 23/01/2012 Underlying share price at grant date $0.51 Maximum life 3 Years Expected future volatility 100% Risk free rate 3.03% Tranche1 share price hurdle $0.75 Tranche2 share price hurdle $1.00 Tranche3 share price hurdle $1.75
Employee performance rights plan At the Company’s Annual General Meeting, on 12th May 2011, members approved the implementation of an Employee Performance Rights Plan (“EPRP”). The plan is a result of a comprehensive remuneration review the Company conducted, in consultation with independent consultants. The aim of the plan is to assist in the retention of existing staff and the recruitment of future employees. Under the EPRP, the Company will issue incentive shares to employees as part of their total remuneration package. The plan will result in a direct cost saving to the Company through a reduction in the salary component payable in remuneration packages. Upon satisfying clearly pre-determined vesting conditions, each right issued under the EPRP will be convertible into one fully paid ordinary share of the Company. To meet the vesting criteria, the employee must remain an employee of the Company for a minimum of two years and will convert in three tranches based on the Company’s Volume Weighted Average Share Price (“VWAP”) exceeding price hurdles for 10 consecutive trading days. Tranche 1 - Will vest upon both the volume weighted average price of Shares being $1.50 or more
for 10 consecutive Trading Days and 2 years continuous service for the Company from 1 April 2011 save that this continuous service vesting hurdle will be deemed to be satisfied in the event of a change of control of the Company of greater than 50% of the shares in the Company.
For
per
sona
l use
onl
y

81Greenland Minerals and enerGy liMited – AnnuAl RepoRt 2013
Greenland Minerals and Energy Limited And Controlled Entities
31 December 2013 Financial Report
| 64 P a g e
Notes to the accounts 24: Share based payments (cont’d) Tranche 2 - Will vest upon both the volume weighted average price of Shares being $1.85 or more
for 10 consecutive Trading Days and 2 years continuous service for the Company from 1 April 2011 save that this continuous service vesting hurdle will be deemed to be satisfied in the event of a change of control of the Company of greater than 50% of the shares in the Company.
Tranche 3 - Will vest upon both the volume weighted average price of Shares being $2.50 or more
for 10 consecutive Trading Days and 2 years continuous service for the Company from 1 April 2011 save that this continuous service vesting hurdle will be deemed to be satisfied in the event of a change of control of the Company of greater than 50% of the shares in the Company.
No amounts are paid or payable by the recipient on receipt of the performance right. The performance rights carry neither rights to dividends nor voting rights and are non-transferrable. The Company did not issue any performance rights under the EPRP during the years ended 31 December 2013 or 31 December 2012. During the current year 4,860,000 performance rights were cancelled, the rights were cancelled on employees accepting an offer to participate in the issue of employee rights. 590,000 performance rights were cancelled in the prior year as a result of employees being terminated prior to the service period vesting condition being satisfied. The value of the performance rights issued will be recognised as an expense over the expected 2 year service vesting period. The fair value has been established using a binomial model based on the following variables:
Grant date 12/05/2011 Underlying share price at grant date $0.97 Maximum life 3 Years Expected future volatility 100% Risk free rate 5.03% Tranche1 share price hurdle $1.50 Tranche2 share price hurdle $1.85 Tranche3 share price hurdle $2.50
Performance rights granted under the EPRP for the year ended 31 December 2013
Tranche
Opening balance
1 Jan 2013
Number cancelled or
lapsed during year ended
31 Dec 2013 Balance at
31 Dec 2013
Pro-rata vesting period value
recognised during the year ended
31 Dec 2013 1 4,855,000 1,455,000 3,900,000 487,770 2 5,170,000 1,520,000 3,900,000 436,589 3 5,835,000 1,885,000 4,200,000 443,345 15,860,000 4,860,000 12,000,000 1,367,704
For
per
sona
l use
onl
y

82 Greenland Minerals and enerGy liMited – AnnuAl RepoRt 2013
Greenland Minerals and Energy Limited And Controlled Entities
31 December 2013 Financial Report
| 65 P a g e
Notes to the accounts 24: Share based payments (cont’d) Performance rights granted under the EPRP for the year ended 31 December 2012
Tranche
Opening balance
1 Jan 2012
Number cancelled or
lapsed during year ended
31 Dec 2012 Balance at
31 Dec 2012
Pro-rata vesting period value
recognised during the year ended
31 Dec 2012 1 5,000,000 145,000 4,855,000 2,816,507 2 5,325,000 155,000 5,170,000 2,859,010 3 6,125,000 290,000 5,835,000 2,966,368 16,450,000 590,000 15,860,000 8,641,885
Performance options At the Company’s Annual General Meeting, in addition to approving the EPRP, members approved the issue of unvested performance options to certain directors and senior management. The options have an exercise price of $1.75 and are subject to pre-determined vesting conditions. To meet the vesting criteria, a two year service period from the grant date must be satisfied and will vest in three tranches based on the Company’s Volume Weighted Average Share Price (“VWAP”) exceeding price hurdles for 10 consecutive trading days. Tranche 1 – Will vest upon both the volume weighted average price of shares being $3.75 or more
for 10 consecutive Trading Days and 2 years continuous service for the Company from 1 April 2011 save that this continuous service vesting hurdle will be deemed to be satisfied in the event of a change of control of the Company of greater than 50% of the shares in the Company.
Tranche 2 – will vest upon both the volume weighted average price of shares being $5.00 or more
for 10 consecutive Trading Days and 2 years continuous service for the Company from 1 April 2011 save that this continuous service vesting hurdle will be deemed to be satisfied in the event of a change of control of the Company of greater than 50% of the shares in the Company.
Tranche 3 – will vest upon both the volume weighted average price of shares being $6.25 or more
for 10 consecutive Trading Days and 2 years continuous service for the Company from 1 April 2011 save that this continuous service vesting hurdle will be deemed to be satisfied in the event of a change of control of the Company of greater than 50% of the shares in the Company.
No amounts are paid or payable by the recipient on receipt of the options. The options are unvested and unlisted, carry neither rights to dividends nor voting rights and are non-transferrable. On satisfying the vesting conditions, the options can be exercised by the payment of $1.75 per option exercise price and on exercising each option will be converted to one fully paid ordinary share in Greenland Minerals and Energy Limited. The Company did not issue any performance options during the years ended 31 December 2013 or 31 December 2012.
For
per
sona
l use
onl
y

83Greenland Minerals and enerGy liMited – AnnuAl RepoRt 2013
Greenland Minerals and Energy Limited And Controlled Entities
31 December 2013 Financial Report
| 66 P a g e
Notes to the accounts 24: Share based payments (cont’d) Performance options granted for the year ended 31 December 2013
Tranche
Opening balance
1 Jan 2013
Number cancelled or
lapsed during year ended
31 Dec 2013 Balance at
31 Dec 2013
Pro-rata vesting period value
recognised during the year ended
31 Dec 2013 1 2,300,000 2,300,000 - 117,852 2 2,350,000 2,350,000 - 104,111 3 2,350,000 2,350,000 - 83,237 7,000,000 7,000,000 - 305,200
Performance options granted for the year ended 31 December 2012
Tranche
Opening balance
1 Jan 2012
Number cancelled or
lapsed during year ended
31 Dec 2012 Balance at
31 Dec 2012
Pro-rata vesting period value
recognised during the year ended
31 Dec 2012 1 2,300,000 - 2,300,000 471,408 2 2,350,000 - 2,350,000 416,444 3 2,350,000 - 2,350,000 332,948 7,000,000 - - 305,200
Employee options The Company did not issue any employee options during the year ended 31 December 2012. The weighted average fair value of performance rights granted during the financial year is $0.46 (2011: $0.61). The following options issued to directors and senior management, were exercised during the financial year ended 31 December 2013:
(i) The number of options exercised relates only to options exercised that were granted as compensation and recognised in remuneration in prior years.
There were no options exercised by directors or senior management during the previous financial year ended 31 December 2012.
Date Number
exercised (i) Exercise
price
Share price @ exercise
date
Amount Paid
$
Amount unpaid
$ S Bunn 02/02/2011 750,000 $0.25 $0.30 187,500 -
For
per
sona
l use
onl
y

84 Greenland Minerals and enerGy liMited – AnnuAl RepoRt 2013
Greenland Minerals and Energy Limited And Controlled Entities
31 December 2013 Financial Report
| 67 P a g e
Notes to the accounts 24: Share based payments (cont’d) Lapsed options During the current financial year ended 31 December 2013, the following options issued to directors and senior management lapsed as a result of market-based vesting conditions not being satisfied. Director/senior management
Number
Value @ grant date
Lapse date
Value @ lapse date
R McIllree (i) 2,800,000 974,819 31/08/2013 - J Mair (i) 2,100,000 733,390 31/08/2013 - S Bunn (i) 2,100,000 733,390 31/08/2013 -
(ii) Options lapsed as a result of not meeting vesting conditions prior to the option expiry date. During the previous financial year ended 31 December 2012, no options issued to directors or senior management lapsed. Rights cancelled During the current financial year ended 31 December 2013, the following un-vested Employee Performance Rights were cancelled upon acceptance of participation in the Employee Rights Plan offered during the year. The fair value of the cancelled rights had been fully expensed prior to the cancellation.
Senior management
Number
Value @ grant date
Cancellation date
Value @ Cancellation
date S Bunn (i) 2,100,000 1,283,660 04/10/2013 - M Guy (i) 350,000 118,938 04/10/2013 - During the previous financial year ended 31 December 2012, no employee rights issued to directors or senior management were cancelled. The following are the terms of the Employee Rights: 1. The Employee Rights are non-transferable. 2. The rights under Employee Rights are personal and an Employee Right does not confer any
entitlement to attend or vote at meetings of the Company, to dividends, participation in new issues of securities or entitlement to participate in any return of capital.
3. The Employee Rights vest upon the satisfaction of any Employee hurdles specified at the time of issue.
4. The Employee Rights lapse upon the Eligible Employee ceasing to be employed or on
the failure to satisfy any Employee hurdles within a required time of the issue of the Employee Rights.
5. Upon vesting, one (1) Share will be issued for every one (1) Employee Right. The Shares
will rank equally in all respects with the existing Shares. 6. If the Company makes a bonus issue of Shares, then the holder of the Employee Right upon
vesting will be entitled to have issued to it the increased number of Shares that it would have received if the Employee Right had vested and the holder acquired Shares in respect of the Employee Right before the record date for the bonus issue.
For
per
sona
l use
onl
y

85Greenland Minerals and enerGy liMited – AnnuAl RepoRt 2013
Greenland Minerals and Energy Limited And Controlled Entities
31 December 2013 Financial Report
| 68 P a g e
Notes to the accounts 24: Share based payments (cont’d) 7. In the event of any reconstruction (including consolidation, sub-division, reduction or
return) of the issued capital of the Company prior to the vesting date, the number of Employee Rights will be reconstructed in a manner consistent with the ASX Listing Rules.
The following are the terms of the Performance Rights: 1. The Performance Rights are non-transferable. 2. The rights under Performance Rights are personal and a Performance Right does not confer
any entitlement to attend or vote at meetings of the Company, to dividends, participation in new issues of securities or entitlement to participate in any return of capital.
3. The Performance Rights vest upon the satisfaction of any performance hurdles specified at the time of issue.
4. The Performance Rights lapse upon the Eligible Employee ceasing to be employed or on the death, incapacity or disability of the Eligible Employee or on the failure to satisfy any performance hurdles within a required time of the issue of the Performance Rights.
5. Upon vesting, one (1) Share will be issued for every one (1) Performance Right. The Shares will rank equally in all respects with the existing Shares.
6. If the Company makes a bonus issue of Shares, then the holder of the Performance Right upon vesting will be entitled to have issued to it the increased number of Shares that it would have received if the Performance Right had vested and the holder acquired Shares in respect of the Performance Right before the record date for the bonus issue.
7. In the event of any reconstruction (including consolidation, sub-division, reduction or return) of the issued capital of the Company prior to the vesting date, the number of Performance Rights will be reconstructed in a manner consistent with the ASX Listing Rules.
The following are the terms of the Performance Options: 1. Each Option entitles the holder to one Share. 2. The Options are exercisable at any time prior to 5.00 pm Western Standard Time on 31
August 2013 ("Expiry Date"). 3. The exercise price of the Options is $1.75 per Option. 4. Upon vesting, the Options are freely transferable. 5. The Company will provide to each Option holder a notice that is to be completed when
exercising the Options ("Notice of Exercise"). Subject to vesting, the Options may be exercised wholly or in part by completing the Notice of Exercise and delivering it together with payment to the secretary of the Company to be received any time prior to the Expiry Date. The Company will process all relevant documents received at the end of every calendar month.
6. Upon the exercise of an Option and receipt of all relevant documents and payment, the holder in accordance with paragraph 5 will be allotted and issued a Share ranking pari passu with the then issued Shares.
7. There will be no participating rights or entitlements inherent in the Options and the holders will not be entitled to participate in new issues of capital which may be offered to Shareholders during the currency of the Options. However, the Company will ensure that for the purposes of determining entitlements to any such issue, the record date will be at least 7 business days after the issue is announced. This will give Optionholders the opportunity (where Options have vested) to exercise their Options prior to the date for determining entitlements to participate in any such issue.
8. If there is a bonus issue ("Bonus Issue") to Shareholders, the number of Shares over which an Option is exercisable will be increased by the number of Shares which the holder would have received if the Option had been exercised before the record date for the Bonus Issue ("Bonus Shares"). The Bonus Shares must be paid up by the Company out of profits or reserves (as the case may be) in the same manner as was applied in the Bonus Issue, and upon issue will rank equally in all respects with the other Shares on issue as at the date of issue of the Bonus Shares.
For
per
sona
l use
onl
y

86 Greenland Minerals and enerGy liMited – AnnuAl RepoRt 2013
Greenland Minerals and Energy Limited And Controlled Entities
31 December 2013 Financial Report
| 69 P a g e
Notes to the accounts 24: Share based payments (cont’d) 9. In the event of any reconstruction (including consolidation, sub-division, reduction or return) of
the issued capital of the Company prior to the Expiry Date, all rights of an Optionholder are to be changed in a manner consistent with the Listing Rules.
10. In the event that the Company makes a pro rata issue of securities, the exercise price of the Options will be adjusted in accordance with the formula set out in Listing Rule 6.22.2.
10. In the event that the Company makes a pro rata issue of securities, the exercise price of the
Options will be adjusted in accordance with the formula set out in Listing Rule 6.22.2. The following reconciles the outstanding share options granted at the beginning and end of the financial period. Dec 2013 Dec 2012 Weighted Weighted average average Number of exercise Number of exercise options price options price Balance at beginning of the financial period 7,750,000 1.60 7,750,000 1.60 Granted during financial period - - - - Forfeited during the financial period - - - - Exercised during the financial period (750,000) 0.25 - - Expired during the financial period (7,000,000) 1.75 - - Exercisable at the end of the financial period - - 7,750,000 1.60
The average share price during the current period was $0.69 (2012: $0.40). 25: Financial instruments (a) Capital risk management The Consolidated Group manages its capital in order to maintain sufficient funds are available for the Consolidated Group to meet its obligations and that the Group can fund its exploration and evaluation activities as a going concern. The Consolidated Group’s overall strategy remains unchanged from December 2012. The capital structure of the Consolidated Group consists of fully paid shares and options as disclosed in notes 17 and 17 respectively. None of the Consolidated Group’s entities are subject to externally imposed capital requirements. (b) Categories of financial instruments
Dec 2013
Dec 2012
$' 000 $' 000 Financial assets Cash and equivalents 5,343 10,801 Loans and receivables - current 49 326 Fair value through profit and loss – held for trading - 15 Financial liabilities Amortised cost 668 1,240
For
per
sona
l use
onl
y

87Greenland Minerals and enerGy liMited – AnnuAl RepoRt 2013
Greenland Minerals and Energy Limited And Controlled Entities
31 December 2013 Financial Report
| 70 P a g e
Notes to the accounts 25: Financial instruments (cont’d) (c) Financial risk management objectives The Group’s principal financial instruments comprise cash and short term deposits. The main purpose of the financial instruments is to earn the maximum amount of interest at low risk to the Consolidated Group. For the period under review, it is the Consolidated Group’s policy not to trade in financial instruments The main risks arising from the Consolidated Group’s financial instruments are interest rate risk, credit risk and liquidity risk. The board reviews and agrees policies for managing each of these risks and they are summarised below: (i) Interest Rate Risk
The Consolidated Group is exposed to movements in market interest rates on short term deposits. The policy is to monitor the interest rate yield curve out to 120 days to ensure a balance is maintained between the liquidity of cash assets and the interest rate return. The Consolidated Group does not have short or long term debt, and therefore this risk is minimal. There was no change in managing interest rate risk or the method of measuring risk from the prior year.
(ii) Credit Risk Credit risk refers to the risk that a counter party will default on its contractual obligations resulting in financial loss to the Group. The Group has adopted the policy of only dealing with credit worthy counterparties and obtaining sufficient collateral or other security where appropriate, as a means of mitigating the risk of financial loss from defaults. The Consolidated Group has no significant credit risk exposure to any single counterparty or any Consolidated Group of counterparties having similar characteristics. The credit risk on liquid funds is limited because the counterparties are banks with high credit – ratings assigned by international rating agencies. The carrying amount of financial assets recorded in the financial statements, net of any provisions for losses, represents the Consolidated Group’s maximum exposure to credit risk. There was no change in managing credit risk or the method of measuring risk from the prior year.
(iii) Liquidity Risk Liquidity risk refers to maintaining sufficient cash and equivalents to meet on going commitments, as and when they occur. The primary source of liquid funds for the Consolidated Group, are funds the Consolidated Group holds on deposit with varying maturity dates. The Consolidated Group monitors its cash flow forecast and actual cash flow to ensure that present and future commitments are provided for. As well as matching the maturity date of funds invested with the timing of future commitments. There was no change in managing credit risk or the method of measuring risk from the prior year.
(iv) Foreign Currency Risk The Consolidated Group’s risk from movements in foreign currency exchange rates, relates to funds transferred by the Company to the Greenland subsidiary and the funds are held in Danish Krone (DKK). This risk exposure is minimised by only holding sufficient funds in DKK, to meet the immediate cash requirements of the subsidiary. Once funds are converted to DKK they are only used to pay expenses in DKK.
For
per
sona
l use
onl
y

88 Greenland Minerals and enerGy liMited – AnnuAl RepoRt 2013
Greenland Minerals and Energy Limited And Controlled Entities
31 December 2013 Financial Report
| 71 P a g e
Notes to the accounts 25: Financial instruments (cont’d) (d) Liquidity risk The following table details the Consolidated Group’s expected maturity for its non-derivative financial assets. The tables below have been drawn up based on the undiscounted contractual maturities of the financial assets including interest that will be earned on those assets except where the Company/Consolidated Group anticipates that the cash flow will occur in a different period. Weighted Average Effective
interest
rate < 6
Months 6 – 12
Months 1 - 5
Years > 5
Years Total % $' 000 $' 000 $' 000 $' 000 $' 000 Dec 2013 Cash and equivalents 2.72 4,922 421 5,343 Trade and receivables - current - 49 - - - 49 4,971 421 5,392 Dec 2012 - Cash and equivalents 4.28 10,381 420 10,801 Trade and receivables - current - 326 - - - 326 10,707 420 11,438
The following table details the Consolidated Group’s remaining contractual maturity for its non-derivative financial liabilities. The tables have been drawn up based on the undiscounted cash flows of financial liabilities based on the earliest date on which the Group can be required to pay. The table includes both interest and principal cash flows. Weighted Average Effective
interest
rate < 6
Months 6 – 12
Months 1 – 5 Years
> 5 Years Total
% $' 000 $' 000 $' 000 $' 000 $' 000 Dec 2013 Trade and other payables - 543 - - - 543 Other liabilities - - 125 - - 125 543 125 - - 668 Dec 2012 Trade and other payables - 1,240 - - - 1,240 1,240 - - - 1,240
(e) Interest rate risk The Consolidated Group is exposed to interest rate risk because it places funds on deposit at variable rates. The risk is managed by the Consolidated Group by monitoring interest rates. The Consolidated Group’s exposures to interest rates on financial assets and financial liabilities are detailed in the liquidity risk management section of this note.
For
per
sona
l use
onl
y

89Greenland Minerals and enerGy liMited – AnnuAl RepoRt 2013
Greenland Minerals and Energy Limited And Controlled Entities
31 December 2013 Financial Report
| 72 P a g e
Notes to the accounts 25: Financial instruments (cont’d) The Group has performed sensitivity analysis relating to its exposure to interest rate risk at balance date. This sensitivity analysis demonstrates the effect on the current year results and equity post tax which could result from a change in these risks. In the analysis a 1% or 100 basis points movement has been applied on the assumption that interest rates are unlikely to move up more than that and less likely to fall. This is taking into account the current interest rate levels and general state of the economy. There has been no change in managing credit risk or the method of measuring risk from the prior year. Interest Rate Sensitivity Analysis At 31 December 2013, the effect on profit and equity as a result of changes in the interest rate, with all other variables remaining constant would be as follows:
Dec 2013
Dec 2012
$' 000 $' 000 Change in profit Increase in interest rate by 1% (100 basis points) 81 80 Decrease in interest rate by 1% (100 basis points) (81) (83)
A 1% or 100 basis points variable has been applied to the interest rate sensitivity analysis, after giving consideration to the current interest rate levels and general state economy. Fair value of financial instruments The carrying value of all financial instruments is the approximate fair value of the instruments. This is based on the fact that all financial instruments have either a short term date of maturity or are loans to subsidiaries. The only financial assets or liabilities carried at fair value are the investments held in listed entities as disclosed in note 10. The fair value of these assets is based on quoted market prices at the reporting date (being level 1 of the fair value hierarchy). 26: Key management personnel compensation The aggregate compensation made to key management personnel of the Consolidated Group is set out below:
Year ended 31 Dec 2013
$
Year ended 31 Dec 2012
$ Short-term employee benefits 1,331,429 2,052,348 Post-employment benefits 75,816 167,400 Other long-term benefits – provision for long service leave
(29,752) 89,254
Termination benefits - Share-based payment 2,905,048 4,298,729 4,282,541 6,607,731
Refer to the remuneration report included in pages 22 to 36 of the Directors report for more detailed remuneration disclosures.Refer to the remuneration report included in pages 31 to 45 of the Directors report for more detailed remuneration disclosures.
For
per
sona
l use
onl
y
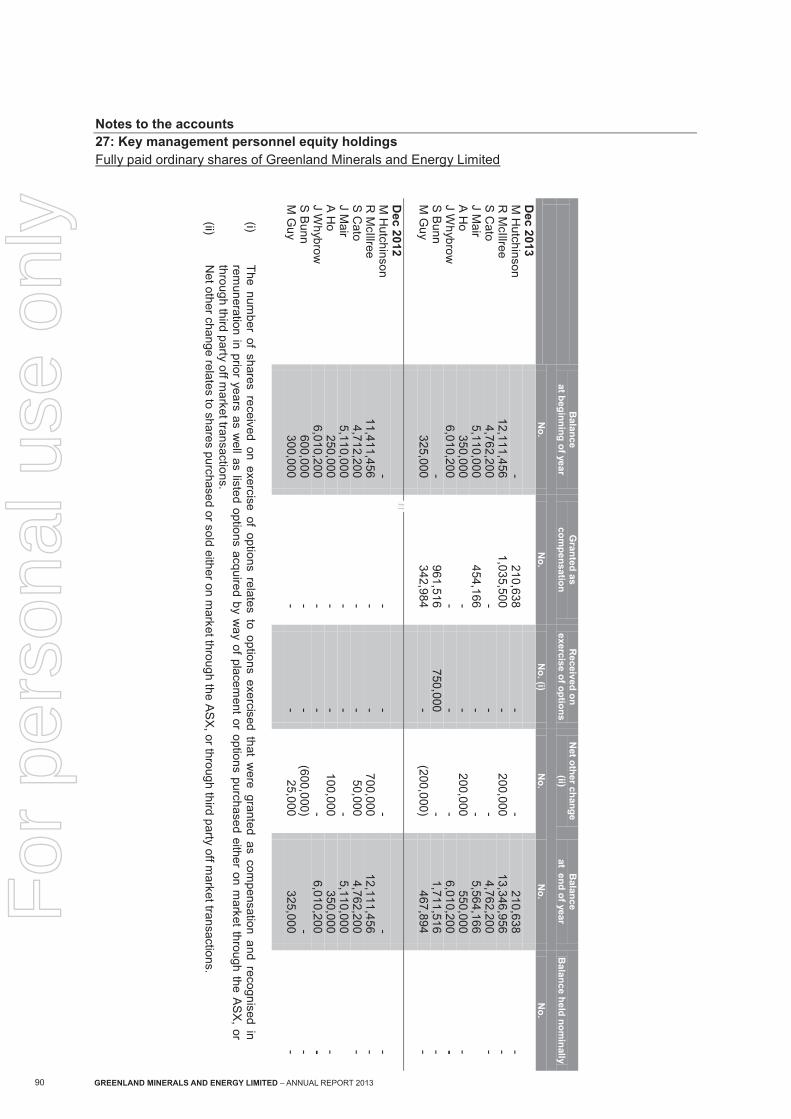
90 Greenland Minerals and enerGy liMited – AnnuAl RepoRt 2013
Greenland Minerals and Energy Limited And Controlled Entities
31 December 2013 Financial Report
| 73 P a g e
Notes to the accounts 27: Key management personnel equity holdings Fully paid ordinary shares of Greenland Minerals and Energy Limited
Balance
at beginning of year Granted as
compensation Received on
exercise of options Net other change
(ii) Balance
at end of year Balance held nominally
No. No. No. (i) No. No. No. Dec 2013 M Hutchinson - 210,638 - - 210,638 - R McIllree 12,111,456 1,035,500 - 200,000 13,346,956 - S Cato 4,762,200 - - - 4,762,200 - J Mair 5,110,000 454,166 - - 5,564,166 A Ho 350,000 - - 200,000 550,000 - J Whybrow 6,010,200 - - - 6,010,200 - S Bunn - 961,516 750,000 - 1,711,516 - M Guy 325,000 342,984 - (200,000) 467,894 - Dec 2012 M Hutchinson - - - - - - R McIllree 11,411,456 - - 700,000 12,111,456 - S Cato 4,712,200 - - 50,000 4,762,200 - J Mair 5,110,000 - - - 5,110,000 A Ho 250,000 - - 100,000 350,000 - J Whybrow 6,010,200 - - - 6,010,200 - S Bunn 600,000 - - (600,000) - - M Guy 300,000 - - 25,000 325,000 -
(i) The number of shares received on exercise of options relates to options exercised that were granted as compensation and recognised in
remuneration in prior years as well as listed options acquired by way of placement or options purchased either on market through the ASX, or through third party off market transactions.
(ii) Net other change relates to shares purchased or sold either on market through the ASX, or through third party off market transactions.
Greenland M
inerals and Energy Limited
And C
ontrolled Entities 31 D
ecember 2013 Financial R
eport
| 73 P
ag
e N
otes to the accounts 27: K
ey managem
ent personnel equity holdings Fully paid ordinary shares of G
reenland Minerals and E
nergy Limited
B
alance at beginning of year
Granted as
compensation
Received on
exercise of options N
et other change (ii)
Balance
at end of year B
alance held nominally
N
o. N
o. N
o. (i) N
o. N
o. N
o. D
ec 2013
M
Hutchinson
- 210,638
- -
210,638 -
R M
cIllree 12,111,456
1,035,500 -
200,000 13,346,956
- S C
ato 4,762,200
- -
- 4,762,200
- J M
air 5,110,000
454,166 -
- 5,564,166
A H
o 350,000
- -
200,000 550,000
- J W
hybrow
6,010,200 -
- -
6,010,200 -
S Bunn
- 961,516
750,000 -
1,711,516 -
M G
uy 325,000
342,984 -
(200,000) 467,894
-
Dec 2012
M H
utchinson -
- -
- -
- R
McIllree
11,411,456 -
- 700,000
12,111,456 -
S Cato
4,712,200 -
- 50,000
4,762,200 -
J Mair
5,110,000 -
- -
5,110,000
A Ho
250,000 -
- 100,000
350,000 -
J Whybrow
6,010,200
- -
- 6,010,200
- S B
unn 600,000
- -
(600,000) -
- M
Guy
300,000 -
- 25,000
325,000 -
(i) The num
ber of shares received on exercise of options relates to options exercised that were granted as com
pensation and recognised in rem
uneration in prior years as well as listed options acquired by w
ay of placement or options purchased either on m
arket through the AS
X, or
through third party off market transactions.
(ii) N
et other change relates to shares purchased or sold either on market through the A
SX
, or through third party off market transactions.
Greenland Minerals and Energy Limited And Controlled Entities
31 December 2013 Financial Report
| 72 P a g e
Notes to the accounts 25: Financial instruments (cont’d) The Group has performed sensitivity analysis relating to its exposure to interest rate risk at balance date. This sensitivity analysis demonstrates the effect on the current year results and equity post tax which could result from a change in these risks. In the analysis a 1% or 100 basis points movement has been applied on the assumption that interest rates are unlikely to move up more than that and less likely to fall. This is taking into account the current interest rate levels and general state of the economy. There has been no change in managing credit risk or the method of measuring risk from the prior year. Interest Rate Sensitivity Analysis At 31 December 2013, the effect on profit and equity as a result of changes in the interest rate, with all other variables remaining constant would be as follows:
Dec 2013
Dec 2012
$' 000 $' 000 Change in profit Increase in interest rate by 1% (100 basis points) 81 80 Decrease in interest rate by 1% (100 basis points) (81) (83)
A 1% or 100 basis points variable has been applied to the interest rate sensitivity analysis, after giving consideration to the current interest rate levels and general state economy. Fair value of financial instruments The carrying value of all financial instruments is the approximate fair value of the instruments. This is based on the fact that all financial instruments have either a short term date of maturity or are loans to subsidiaries. The only financial assets or liabilities carried at fair value are the investments held in listed entities as disclosed in note 10. The fair value of these assets is based on quoted market prices at the reporting date (being level 1 of the fair value hierarchy). 26: Key management personnel compensation The aggregate compensation made to key management personnel of the Consolidated Group is set out below:
Year ended 31 Dec 2013 $
Year ended 31 Dec 2012 $
Short-term employee benefits 1,331,429 2,052,348 Post-employment benefits 75,816 167,400 Other long-term benefits – provision for long service leave
(29,752) 89,254
Termination benefits - Share-based payment 2,905,048 4,298,729 4,282,541 6,607,731
Refer to the remuneration report included in pages 22 to 36 of the Directors report for more detailed remuneration disclosures.
For
per
sona
l use
onl
y

91Greenland Minerals and enerGy liMited – AnnuAl RepoRt 2013
Greenland Minerals and Energy Limited And Controlled Entities
31 December 2013 Financial Report
| 74 P a g e
Notes to the accounts 27: Key management personnel equity holdings (cont’d) Share options of Greenland Minerals and Energy Limited
Balance at beginning
of year Granted as
compensation Exercised
Expired Net other
change (ii) Balance at end of year
Balance vested at end of year
Vested and exercisable
Options vested
during year No. No. No. (i) No No. No. No. No. No.
Dec 2013 M Hutchinson - - - - - - - - R McIllree 2,800,000 - - (2,800,000) - - - - - S Cato - - - - - - - - - J Mair 2,100,000 - - (2,100,000) - - - - - A Ho - - - - - - - - - J Whybrow - - - - - - - - - S Bunn 2,850,000 - (750,000) (2,100,000) - - - - - M Guy 50,000 - - - - 50,000 - - - Dec 2012 M Hutchinson - - - - - - - - R McIllree 2,800,000 - - - - 2,800,000 - - - S Cato - - - - - - - - J Mair 2,100,000 - - - - 2,100,000 - - - A Ho - - - - - - - - J Whybrow - - - - - - - - S Bunn 2,850,000 - - - - 2,850,000 - - - M Guy - - - - 50,000 50,000 - - -
(i) The number of options exercised relates to options exercised that were granted as compensation and recognised in remuneration in prior years as well as listed options acquired by way of placement or options purchased either on market through the ASX, or through third party off market transactions
(ii) Net other change relates to options purchased or sold either on market through the ASX, or through third party off market transactions. All share options issued to key management personnel were made in accordance with the provisions of the employee share option plan. Further details of the share option plan and of options granted during the current and prior period are contained in note 24.
Greenland M
inerals and Energy Limited
And C
ontrolled Entities 31 D
ecember 2013 Financial R
eport
| 74 P
ag
e N
otes to the accounts 27: K
ey managem
ent personnel equity holdings (cont’d) S
hare options of Greenland M
inerals and Energy Lim
ited
Balance
at beginning of year
Granted as
compensation
Exercised
Expired
Net other
change (ii) B
alance at end of year
Balance vested
at end of year Vested and exercisable
Options
vested during year
No.
No.
No. (i)
No
No.
No.
No.
No.
No.
Dec 2013
M
Hutchinson
- -
-
- -
- -
- R
McIllree
2,800,000 -
- (2,800,000)
- -
- -
- S
Cato
- -
- -
- -
- -
- J M
air 2,100,000
- -
(2,100,000) -
- -
- -
A H
o -
- -
- -
- -
- -
J Whybrow
-
- -
- -
- -
- -
S B
unn 2,850,000
- (750,000)
(2,100,000) -
- -
- -
M G
uy 50,000
- -
- -
50,000 -
- -
Dec 2012
M
Hutchinson
- -
-
- -
- -
- R
McIllree
2,800,000 -
- -
- 2,800,000
- -
- S
Cato
-
- -
- -
- -
- J M
air 2,100,000
- -
- -
2,100,000 -
- -
A H
o
- -
- -
- -
- -
J Whybrow
- -
- -
- -
- -
S B
unn 2,850,000
- -
- -
2,850,000 -
- -
M G
uy -
- -
- 50,000
50,000 -
- -
(i)
The number of options exercised relates to options exercised that w
ere granted as compensation and recognised in rem
uneration in prior years as w
ell as listed options acquired by way of placem
ent or options purchased either on market through the A
SX, or through third party off m
arket transactions
(ii) N
et other change relates to options purchased or sold either on market through the A
SX
, or through third party off market transactions.
All share options issued to key m
anagement personnel w
ere made in accordance w
ith the provisions of the employee share option plan.
Further details of the share option plan and of options granted during the current and prior period are contained in note 24.
For
per
sona
l use
onl
y

92 Greenland Minerals and enerGy liMited – AnnuAl RepoRt 2013
Greenland Minerals and Energy Limited And Controlled Entities
31 December 2013 Financial Report
| 75 P a g e
Notes to the accounts 27: Key management personnel equity holdings (cont’d) Performance rights of Greenland Minerals and Energy Limited
Balance at beginning
of year Granted as
compensation Converted
Expired Net other change (i)
Balance at end of year
Balance vested at end of year
Vested and convertible
Rights vested
during year No. No. No. No No. No. No. No. No.
Dec 2013 M Hutchinson 1,400,000 - - - 1,400,000 - - - R McIllree 2,700,000 - - - - 2,700,000 - - - S Cato 600,000 - - - - 600,000 - - - J Mair 2,100,000 - - - - 2,100,000 - - - A Ho 1,600,000 - - - - 1,600,000 - - - J Whybrow 1,000,000 - - - - 1,000,000 - - - S Bunn 2,100,000 - - - (2,100,000) - - - - M Guy 350,000 - - - (350,000) - - - - Dec 2012 M Hutchinson 1,400,000 - - - 1,400,000 - - - R McIllree 2,700,000 - - - - 2,700,000 - - - S Cato 600,000 - - - - 600,000 - - - J Mair 2,100,000 - - - - 2,100,000 - - - A Ho 600,000 1,000,000 - - - 1,600,000 - - - J Whybrow 1,000,000 - - - - 1,000,000 - - - S Bunn 2,100,000 - - - - 2,100,000 - - - M Guy 350,000 - - - - 350,000 - - -
(i) Performance rights cancelled when employees accepted an offer to participate in the October 2013 Employee Rights issue All performance rights issued to key management personnel were made in accordance with the provisions of the employee performance rights plan. Further details of the employee performance rights plan and of options granted during the current and prior period are contained in note 24.
Greenland M
inerals and Energy Limited
And C
ontrolled Entities 31 D
ecember 2013 Financial R
eport
| 75 P
ag
e N
otes to the accounts 27: K
ey managem
ent personnel equity holdings (cont’d) P
erformance rights of G
reenland Minerals and E
nergy Limited
Balance
at beginning of year
Granted as
compensation
Converted
Expired
Net other
change (i) B
alance at end of year
Balance vested
at end of year Vested and convertible
Rights
vested during year
No.
No.
No.
No
No.
No.
No.
No.
No.
Dec 2013
M
Hutchinson
1,400,000 -
-
- 1,400,000
- -
- R
McIllree
2,700,000 -
- -
- 2,700,000
- -
- S
Cato
600,000 -
- -
- 600,000
- -
- J M
air 2,100,000
- -
- -
2,100,000 -
- -
A H
o 1,600,000
- -
- -
1,600,000 -
- -
J Whybrow
1,000,000
- -
- -
1,000,000 -
- -
S B
unn 2,100,000
- -
- (2,100,000)
- -
- -
M G
uy 350,000
- -
- (350,000)
- -
- -
Dec 2012
M
Hutchinson
1,400,000 -
-
- 1,400,000
- -
- R
McIllree
2,700,000 -
- -
- 2,700,000
- -
- S
Cato
600,000 -
- -
- 600,000
- -
- J M
air 2,100,000
- -
- -
2,100,000 -
- -
A H
o 600,000
1,000,000 -
- -
1,600,000 -
- -
J Whybrow
1,000,000
- -
- -
1,000,000 -
- -
S B
unn 2,100,000
- -
- -
2,100,000 -
- -
M G
uy 350,000
- -
- -
350,000 -
- -
(i)
Perform
ance rights cancelled when em
ployees accepted an offer to participate in the October 2013 E
mployee R
ights issue A
ll performance rights issued to key m
anagement personnel w
ere made in accordance w
ith the provisions of the employee perform
ance rights plan. Further details of the em
ployee performance rights plan and of options granted during the current and prior period are contained in note 24.
For
per
sona
l use
onl
y

93Greenland Minerals and enerGy liMited – AnnuAl RepoRt 2013
Greenland Minerals and Energy Limited And Controlled Entities
31 December 2013 Financial Report
| 76 P a g e
Notes to the accounts 27: Key management personnel equity holdings (cont’d) Employee Rights of Greenland Minerals and Energy Limited
Balance at beginning
of year Granted as
compensation Converted
Expired Net other change (i)
Balance at end of year
Balance vested at end of year
Vested and convertible
Rights vested
during year No. No. No. No No. No. No. No. No.
Dec 2013 M Hutchinson - - - - - - - - R McIllree - - - - - - - - - S Cato - - - - - - - - - J Mair - - - - - - - - - A Ho - - - - - - - - - J Whybrow - - - - - - - - - S Bunn - 2,100,000 - - - 2,100,000 - - - M Guy - 1,200,000 - - - 1,200,000 - - - All performance rights issued to key management personnel were made in accordance with the provisions of the employee performance rights plan. Further details of the employee performance rights plan and of options granted during the current and prior period are contained in note 24.
Greenland M
inerals and Energy Limited
And C
ontrolled Entities 31 D
ecember 2013 Financial R
eport
| 76 P
ag
e N
otes to the accounts 27: K
ey managem
ent personnel equity holdings (cont’d) E
mployee R
ights of Greenland M
inerals and Energy Lim
ited
Balance
at beginning of year
Granted as
compensation
Converted
Expired
Net other
change (i) B
alance at end of year
Balance vested
at end of year Vested and convertible
Rights
vested during year
No.
No.
No.
No
No.
No.
No.
No.
No.
Dec 2013
M
Hutchinson
- -
-
- -
- -
- R
McIllree
- -
- -
- -
- -
- S
Cato
- -
- -
- -
- -
- J M
air -
- -
- -
- -
- -
A H
o -
- -
- -
- -
- -
J Whybrow
-
- -
- -
- -
- -
S B
unn -
2,100,000 -
- -
2,100,000 -
- -
M G
uy -
1,200,000 -
- -
1,200,000 -
- -
All perform
ance rights issued to key managem
ent personnel were m
ade in accordance with the provisions of the em
ployee performance rights plan.
Further details of the employee perform
ance rights plan and of options granted during the current and prior period are contained in note 24.
For
per
sona
l use
onl
y

94 Greenland Minerals and enerGy liMited – AnnuAl RepoRt 2013
Greenland Minerals and Energy Limited And Controlled Entities
31 December 2013 Financial Report
| 77 P a g e
Notes to the accounts 28: Transactions with related parties Simon Cato is a Non-executive Director and Chairman of Advanced Share Registry Limited. Advanced Share Registry Limited provides share registry services to Greenland Minerals and Energy Limited. These services are supplied on normal commercial terms and Mr Cato does not receive any remuneration from Advanced Share Registry Limited based on the supply of share registry services to the Consolidated Group. For the year ended 31 December 2013 $36,867 was paid to Advance Share Registry Limited for services provided (Dec 2012: $67,085). 29: Parent Company information
Parent Dec 2013
Dec 2012
$' 000 $' 000 Financial position Total Current Assets 5,592 11,469 Total Non-Current Assets 74,231 63,761 Total Assets 79,823 75,230
Total Current Liabilities 586 1,429 Total non-current liabilities 30 89 Total Liabilities 616 1,518 Net Assets 79,207 73,712
Equity Issued Capital 336,950 334,339 Reserves 24,888 22,324 Accumulated Losses (282,631) (282,951) Total Equity 79,207 73,712
Financial Performance
Profit (Loss) for the year 320 (56,360) Total comprehensive income 320 (56,360)
Contingent liabilities The parent company has no contingent liabilities as at 31 December 2013 or 2012. Guarantees Greenland Minerals and Energy Limited has guaranteed the provision of funding and support to the Company’s 100% held subsidiary, Greenland Minerals and Energy Limited (Trading) A/S). This funding forms part of the Consolidated Group’s approved budgeted expenditure. Greenland Minerals and Energy Limited has placed $220,000 and $169,905 into two separate deposit accounts with the Company’s bank. These deposits are held by the bank as security over corporate credit cards issued to the Company. During the financial year ended 31 December 2011, Greenland Minerals and Energy limited provided a guarantee to the Greenland Government on the behalf of Arctic Energy Pty limited (“Arctic”). The guarantee relates to the rectification of any potential environmental damage by Arctic in relation to an on-shore oil exploration license held by Arctic. Under the guarantee Arctic is prevent from carrying out any activity on the license without the expressed approval of Greenland Minerals and Energy limited. No such approval has been granted to date. Greenland Minerals and Energy limited currently holds a 24% interest in Arctic Energy Pty Limited.
For
per
sona
l use
onl
y

95Greenland Minerals and enerGy liMited – AnnuAl RepoRt 2013
Greenland Minerals and Energy Limited And Controlled Entities
31 December 2013 Financial Report
| 78 P a g e
Notes to the accounts 30: Remuneration of auditors
Auditor of the parent entity
Dec 2013
$
Dec 2012
$ Audit or review of the financial report 87,536 88,830 Other assurance services 8,500 - Non-audit services - taxation 14,700 3,465 110,736 92,295 Related practice of the parent entity auditor
Dec 2013
$
Dec 2012
$ Audit or review of the financial report 26,661 44,698 Non-audit services – taxation 1,838 9,693 Non-audit services – other 2,942 6,691 31,441 61,074 The auditor of Greenland Minerals and Energy Limited is Deloitte Touche Tohmatsu. 31: Subsequent Events In March 2014 the Consolidated Group entered a non-binding Memorandum of Understanding (“MoU”) with China Non-Ferrous Metal Industry’s Foreign Engineering and Construction Co Limited (“NFC”). The MoU sets out a framework for both parties to cooperate in aligning the rare earth concentrates from the Consolidated Group’s Kvanefjeld project, with NFC’s substantial rare earth separation experience and capacity. Please refer to the Company announcement released to the ASX on 24 March 2014. Other than the matter above, there have been no matters or circumstances occurring subsequent to the financial period that has significantly affected, or may significantly affect, the operations of the Consolidated Group, the results of those operations, or the state of affairs of the Consolidated Group in future years.
For
per
sona
l use
onl
y

96 Greenland Minerals and enerGy liMited – AnnuAl RepoRt 2013
Greenland Minerals and Energy Limited And Controlled Entities
31 December 2013 Financial Report
| 79 P a g e
Additional stock exchange information as at 21st February 2014 Consolidated Group secretary Miles Guy Registered office Principal administration office Unit 6, 100 Railway Road, Subiaco Western Australia, 6008
Unit 6, 100 Railway Road, Subiaco Western Australia, 6008
Share registry Advanced Share Registry Services 150 Stirling Highway Nedlands, Western Australia, 6009
Number of holders of equity securities Ordinary share capital 574,572,911 fully paid ordinary shares are held by 3,690 individual shareholders. Substantial Shareholders Shareholder Number Percentage 1. Citicorp Nominees Pty Limited 100,690,410 17.5% 1. JP Morgan Nominees Australia Limited 83,056,904 14.5% 2. HSBC Custody Nominees (Australia) Limited 76,972,260 13.4% 3. Rimbal Pty Ltd 55,304,175 9.6% 4. GCM Nominees Pty Limited 35,000,000 6.1%
For
per
sona
l use
onl
y

97Greenland Minerals and enerGy liMited – AnnuAl RepoRt 2013
Greenland Minerals and Energy Limited And Controlled Entities
31 December 2013 Financial Report
| 80 P a g e
Additional stock exchange information as at 21st February 2014 Distribution of holders of quoted shares
Share Spread Holders Units Percentage 1 – 1,000 364 190,676 0.033% 1,001 – 5,000 1,077 3,285,248 0.572% 5,001 – 10,000 692 5,789,537 1.008% 10,001 – 100,000 1,285 45,017,032 7.835% 100,001 and over 272 520,290,418 90.553% 3,690 574,572,911 100% Twenty largest holders of quoted shares
Ordinary shareholders Fully paid ordinary shares
Number Percentage 1. Citicorp Nominees Pty Limited 100,690,410 17.5% 2. JP Morgan Nominees Australia Limited 83,056,904 14.5% 3. HSBC Custody Nominees (Australia) Limited 76,972,260 13.4% 4. Rimbal Pty Limited 55,304,175 9.6% 5. GCM Nominees Pty Limited 35,000,000 6.1% 6. Roderick McIllree 13,346,956 2.3% 7. Benoit Company Limited 12,200,000 2.1% 8. Pure Steel Limited 11,087,008 1.9% 9. Cameron John French 10,152,112 1.7% 10. Jeremy Sean Whybrow 6,010,200 1.5% 11. Giacobbe, Dimitri and David Iesini 5,431,505 0.9% 12. Merrill Lynch (Australia) Nominees Pty Limited 5,348,669 0.9% 13. John Mair 5,564,166 0.9% 14. Simon Cato 4,762,200 0.8% 15. Christopher and Rita Read 4,572,048 0.8% 16. National Nominees Limited 4,490,461 0.8% 17. Peter Harry Hatch 3,100,000 0.5% 18. Falfaro Investments Limited 3,000,000 0.5% 19. ABN Amro Clearing Sydney Nominees Pty Limited 2,639,283 0.4% 20. BNP Paribas Pty Limited 2,430,092 0.4% 445,158,449 77.5%
For
per
sona
l use
onl
y

98 Greenland Minerals and enerGy liMited – AnnuAl RepoRt 2013
Greenland Minerals and Energy Limited And Controlled Entities
31 December 2013 Financial Report
| 81 P a g e
Additional stock exchange information as at 21st February 2014 Distribution of holders of quoted options
Share Spread Holders Units Percentage 1 – 1,000 1 421 0.002% 1,001 – 5,000 4 15,213 0.059% 5,001 – 10,000 6 48,166 0.187% 10,001 – 100,000 57 2,281,731 8.854% 100,001 and over 19 23,423,660 90.898% 87 25,769,191 100% Twenty largest holders of quoted options
Ordinary shareholders Fully paid ordinary shares
Number Percentage 1. Pre-Emptive Trading Pty Limited 6,020,000 23.4% 2. Tracor Limited 5,500,000 21.3% 3. Zero nominees Pty Limited 4,774,235 18.5% 4. JP Morgan Nominees Australia Limited 2,448,333 9.5% 5. Twofivetwo Pty Limited 712,814 2.7% 6. USB Nominees Pty Limited 650,000 2.5% 7. Citicorp Nominees Pty Ltd 494,000 1.9% 8. National Nominees Pty Limited 450,000 1.7% 9. Nicole Yougman 437,080 1.7% 10. HSBC Custody nominees (Australia) Limited 350,661 1.4% 11. ABN Amro Clearing Sydney Nominees Pty Limited 333,334 1.3% 12. Greatside Holdings Pty limited 250,000 1.0% 13. William Jay Goodair 244,922 1.0% 14. Cameron John French 178,475 0.7% 15. John Tilney 167,500 0.6% 16. Michael Bushell 166,600 0.6% 17. Floyd Bruce Garrett 139,706 0.5% 18. Nicholas Timothy Allan 125,000 0.5% 19. Jason Dalziell 100,000 0.4% 20. James Alexander Hanson 100,000 0.4% 23,642,660 91.6%
For
per
sona
l use
onl
y

Greenland Minerals and enerGy liMiTed – AnnUAl RePORT 2013
The Kvanefjeld project area is ideally located near an international airport and existing towns that are expected to provide general labour and services.
99
For
per
sona
l use
onl
y
100 Greenland Minerals and enerGy liMiTed – AnnUAl RePORT 2013
For
per
sona
l use
onl
y

The fjord system in south Greenland provides direct shipping access to the project area, year round.
desi
gnci
ty.c
om.a
u
For
per
sona
l use
onl
y

Greenland Minerals and enerGy liMiTed
Registered Office & Principal Place of Business Unit 6, 100 Railway Road, Subiaco, Western Australia, 6008
Postal AddressPO Box 2006, Subiaco, Western Australia, 6904
Tel: +61 8 9382 2322Fax: +61 8 9382 2788
www.ggg.gl
For
per
sona
l use
onl
y