for personal use only - asxdata analytics to support new products clh is rich in historical data and...
TRANSCRIPT

for successAnnual Report 2017
For
per
sona
l use
onl
y

Collection House Limited (ASX: CLH) is Australia’s leading end-to-end receivables management company. We provide solutions to organisations and individuals that span the entire credit management lifecycle and beyond.
We enjoy strong business relationships with major Australian and international banks, financial institutions, large corporations, local Councils, public utilities, SMEs, and Government agencies.
With more than 800 staff in offices across Brisbane, Sydney, Victoria, Adelaide, New Zealand and the Philippines, the Collection House Group offers stakeholders a range of professional, ethical and effective products and services.
Our ongoing success is a result of the breadth of our service offering, our deeply ingrained approach to ethical debt recovery, and our commitment to technology to continually evolve our service and capabilities.
About Collection House Group
Debt collection and receivables management for third parties Debt purchasing and recovery
Nationally recognised training provider in financial services and leadership
Customer service outsourcing for third parties
Legal services including insolvency administration
Tailored debt collection services, specialising in Local Government
Licensed specialist finance broker for the provision of credit
Provision of financial hardship services for third parties
Collection House Limited Annual Report 2017
For
per
sona
l use
onl
y

Contents2 Chairman’s Report4 Chief Executive Officer’s Report6 FY17 Financial Results8 Our Strategic Foundation10 Board of Directors11 Executive Management Team12 Operational Management Team13 Corporate Governance14 Our Purpose Statement15 Directors’ Report37 Auditor’s Independence Declaration38 Income Statement39 Statement of Comprehensive Income40 Balance Sheet41 Statement of Changes in Equity42 Statement of Cash Flows43 Notes to the Financial Statements91 Directors’ Declaration92 Independent Auditor’s Report98 Shareholder Information100 Corporate Directory
Notice of Annual General MeetingThe AGM of Collection House Limited will be held on 28 November 2017 at 11:00am at the Emporium Hotel, 1000 Ann Street, Fortitude Valley, Brisbane, Queensland
Contents
1F
or p
erso
nal u
se o
nly
Collection House is currently 13 months into a 24 months transition period, with some early signs of improved earnings evident in the second half of the June 2017 financial year.
But there remains much to be done and there are many examples that wide-ranging organisational changes can often stretch over several years.
Nonetheless, with significant shifts in technology, higher standards of regulatory compliance and the need to constantly innovate product offerings, our people are responding to such changes and opportunities with a sense of urgency.
Data analytics to support new productsCLH is rich in historical data and owns personal financial data on more than 500,000 individuals, of whom 90,016 were paying customers in the 2017 financial year. This data can be analysed and applied for the benefit of our individual customers, enabling us to make better informed judgements and develop tailored solutions to improve their personal financial circumstances. We do this by tilting the business from a pure debt collector to a more broadly encompassing service provider focused primarily on restoring the creditworthiness of our individual customers. We rely more on empathy rather than the detached indifference of the traditional debt collection model and by doing this we build a stronger business for shareholders by establishing a deeper and lasting relationship with many people previously considered not creditworthy.
We have recently hired key personnel to further develop our skills in this area.
Chairman’s Report
The successful implementation of this key product initiative will support the next phase of our shareholder wealth creation strategy which is to build scale and to create deeper and sustained relationships with our individual customers by assisting them to more effectively service their debt obligations and restore their impaired credit status. This strategy is embodied in our ‘ThinkMe’ brand which rewards customers who demonstrate loan serviceability by establishing a consistent repayment history, and ultimately restoring a sound credit rating. Volume activity in this key product initiative is growing at around 20% per month and while this growth rate will soon moderate to a more sustainable level over the longer term, we are confident that it will make a measurable contribution to earnings growth in future years.
Improving corporate culture Importantly, we have embedded a ‘performance’ culture in the work-place where our people can expect that Collection House will be a true meritocracy (reward and promotion is based solely on merit) and where employee remuneration reflects the contribution to the achievement of our business goals. Employee satisfaction levels are important to us, because we know that people who feel good about themselves are more productive than people who feel disengaged.
Our changing work-place culture is having a positive impact on our business success.
Kerry Daly Chairman
2Collection House Limited Annual Report 2017
For
per
sona
l use
onl
y

Managing costs and enhancing productivity A deliberate focus on cost control, a $3m investment in productivity-enhancing technology and targeted training and development activities to strengthen our human capital resources and the initiation of a sales program to generate higher revenue within the Collection Services segment, have positioned the Group for ongoing earnings growth.
We continue to optimise our cost structure by developing formal processes around product procurement and out-sourcing key services and better aligning our staff rewards program with shareholder returns. We encourage our people to act always with an ownership mentality and this is why our equity participation plan now covers 74% of our employees.
These changes have contributed to an improvement in employee productivity as measured by a 26% improvement to the average amount collected per month by individual collectors, compared to the June 2016 financial year. Higher employee productivity delivers superior returns for our shareholders and this outcome in turn enables us to align our employee remuneration arrangements with the achievement of our key business goals.
ComplianceWe take our compliance obligations very seriously.
In doing so we attract new corporate and institutional clients who engage us to undertake collection activities on their behalf knowing that we can be trusted to protect their corporate brand and market reputation.
This is evidenced by the number of new corporate clients and commensurate revenue growth in our Collection Services business segment.
The futureAverage household debt is currently at 190 per cent of disposable income – the highest consumer debt level since 1988. The likelihood that we are at the bottom of the current interest rate cycle together with the highest level of household debt in 30 years provides for a fragile consumer credit environment. These circumstances suggest that patience may provide us with the opportunity to acquire higher amounts of favourably priced consumer debt at some future date.
Meanwhile, led by our indefatigable CEO, Anthony Rivas, and with the board’s sustainable return focus and a clearly defined business strategy, we anticipate superior earnings performance in the period ahead.
Kerry DalyChairman
We encourage our people to act always with an ownership
mentality
3F
or p
erso
nal u
se o
nly

I am delighted to have completed my first year as Chief Executive Officer of Collection House. FY17 has been a challenging year for the business, and we have put in place many new initiatives, people and infrastructure which will position us strongly for the years ahead.
In every part of the operation, I have been impressed by the hard work being done by colleagues at all levels, to ensure we continuously improve outcomes for our customers, clients, colleagues and shareholders. These measurable outcomes will continue to be important, and we will also continue to work on the culture of the business by means of providing opportunities, education and support across all lines of business. With the support of our dedicated and hardworking employees, I am confident we will continue to deliver the results expected of us.
FY17: A look back During the year we made improvements across all aspects of our customer offerings, and have undertaken significant initiatives across our technology, management and processes. The approach taken by the leadership team was clear: everything would be reviewed and subjected to independent scrutiny where required, to identify and implement the key areas for improvement.
We have grown our margins in both business segments, by reducing costs, developing automated processes and improving technology around essential services, as well as expanding our service delivery and reviewing our approach to PDL purchasing. This saw us bid on 112 PDL portfolios this year, successfully winning 25 in a competitive market.
We bought portfolios selectively in FY17, using a dual external and internal pricing platform to actively bid on ledgers in Australia, and also in New Zealand, a market from which we had been absent for many years.
Chief ExecutiveOfficer’s Report
In addition, we are working hard to broaden our offering and deepen our customer relationships, through extending our Collection Services platform, and developing our operations in:
– Safe Horizons, a specialist provider assisting consumers and businesses navigate financial hardship
– Business Services, both in Customer Care and Business Process Optimisation
– ThinkMe Finance (previously ThinkMe), which focuses on loan brokerage services, and has been rebranded and is expanding to form a network across Australia
– Our offshore presence in Manila and New Zealand, which has been expanded and has seen us win as a client Ebay, a NASDAQ listed company
– Collective Learning, which continues to build our banking relationships, working with our key partners on training initiatives and regulatory refreshers.
We now work closely with our clients on ways we can tie in our new strategies and technologies to emerging regulatory changes and promote ‘pilots’ to test initiatives on their behalf, taking advantage of our flattened, dynamic approval structure. Insight leadership takes many forms, from our regional offices supporting local government through our growing MCC business, to working closely with banks, where we have now expanded our relationship to all of the ‘big four’ from just two a year ago.
Your company has worked hard in 2017 to become a direct extension of each organisation we work with. Regular client feedback sessions are now run, so we can ‘own’ our results and learn to exceed expectations. Many of the initiatives that have been completed this year were accomplished as a result of champion / challenger initiatives, while others were carefully drawn pilots, with clear and actionable results.
Anthony Rivas Chief Executive Officer
4Collection House Limited Annual Report 2017
For
per
sona
l use
onl
y

TechnologyWe continue to develop our Information Technology platform. The adoption of Genesis Interactive Intelligence Dialler Technology, a true game changer in our industry, means our company is cutting edge, helping us to expand our reach into new market segments. We have also deployed real-time Voice Analytics to provide the business with the ability to recognise key words live during a call, in order to analyse specific customer behaviours, to identify hardship, and to highlight training opportunities within our team.
We have developed visual thresholds and indicators for our account representatives to ease the process of understanding a consumer’s position, and to expedite consumer resolutions. The direct result of these changes is that we have seen an increase in staff calling activity, which has risen 40% in FY17 with 100 less FTE.
Our PeopleThe past year has provided us the opportunity to decide the direction of our leadership team and employee base. Changes of roles proved successful in some instances, but over the last year we have realised significant efficiency savings and have downsized the headcount by 152, providing a platform for future expansion of the PDL workforce. Despite the difficulties always encountered during such transitions, our people have stepped up magnificently, and I am delighted to report that a marked improvement in productivity has seen us reach our targets for collections per employee hour, which have increased from $165 in FY16, to well over $200 in FY17.
Recruitment of new senior team members in recent months, to complement our existing team and newly emerging leaders, has seen industry leading talent arrive from blue-chip companies and from as far afield as the United States. Having completed much of the basic overhaul of the group, it is this insightful leadership, and the adoption of their ideas, that will allow us to attain the industry leadership and employer of choice status to which we aspire.
During FY17, we also introduced an employee share program, ensuring our staff directly benefit from their efforts throughout the year. This alignment of interest with you, our shareholders, we hope exemplifies our meritocratic approach to recognition and reward.
FY18 and beyondDuring the past year, our people have learned it is possible to be highly competitive, strategically bold, and fiscally disciplined all at the same time. We saw the emergence of great people who wanted to make a difference, which for the consumers served at Collection House, may well afford them opportunities to rehabilitate their finances, and live more fulfilled and happier lives.
With the foundations now set for 2018 and beyond, our management team will drive improvement and increase the scale of our operations in both segments. In light of the transitional improvements and opportunities outlined above, and the innovative competencies we can now bring to bear, both our Collection Services and Lion Finance segments are able to further expand, as regulatory change and market necessity drive a greater demand for our innovative solutions and services. As we progress through FY18, this means:
– Optimising returns from existing ledgers with creative and innovative products - including ThinkMe Finance
– Continually striving to leverage our new Chief Data Scientist’s global experience to further improve our models
– The continuation of agent performance improvement though training, enhanced tools, and leadership by example
– The continued growth of our CLH Business Services and Safe Horizons brands.
We will also release new innovations that will give the customer increased choice and reduce the volume of customer interactions needed with our staff, while delivering further operational efficiencies which will allow us to generate improved operational leverage as we grow the top line.
We expect both segments to continue to improve productivity and margins in FY18, through leveraging new and existing strategic partnerships, continuing to embrace new technology and instilling a mindset of continuous improvement and operational excellence across the company.
In conclusionA sincere note of gratitude to our clients for your continued business and valuable feedback.
I also wish to thank our skilled employees across the Group for their dedication and hard work and the magnificent way they have risen to the challenges we faced throughout FY17.
I would like to convey my sincere appreciation to our Board of Directors for their support and leadership this year. The Executive Leadership Team and I are grateful for their wise counsel and constructive collaboration during such a transformational period.
And finally, I would also like to thank you, our shareholders, for your continuing willingness to invest in us. As the CEO of this exceptional organisation, you can rest assured that I will continue to focus on the things which will increase shareholder value, while remaining flexible and adaptive to emerging opportunities and regulatory environment ahead.
Anthony Rivas Chief Executive Officer
5F
or p
erso
nal u
se o
nly
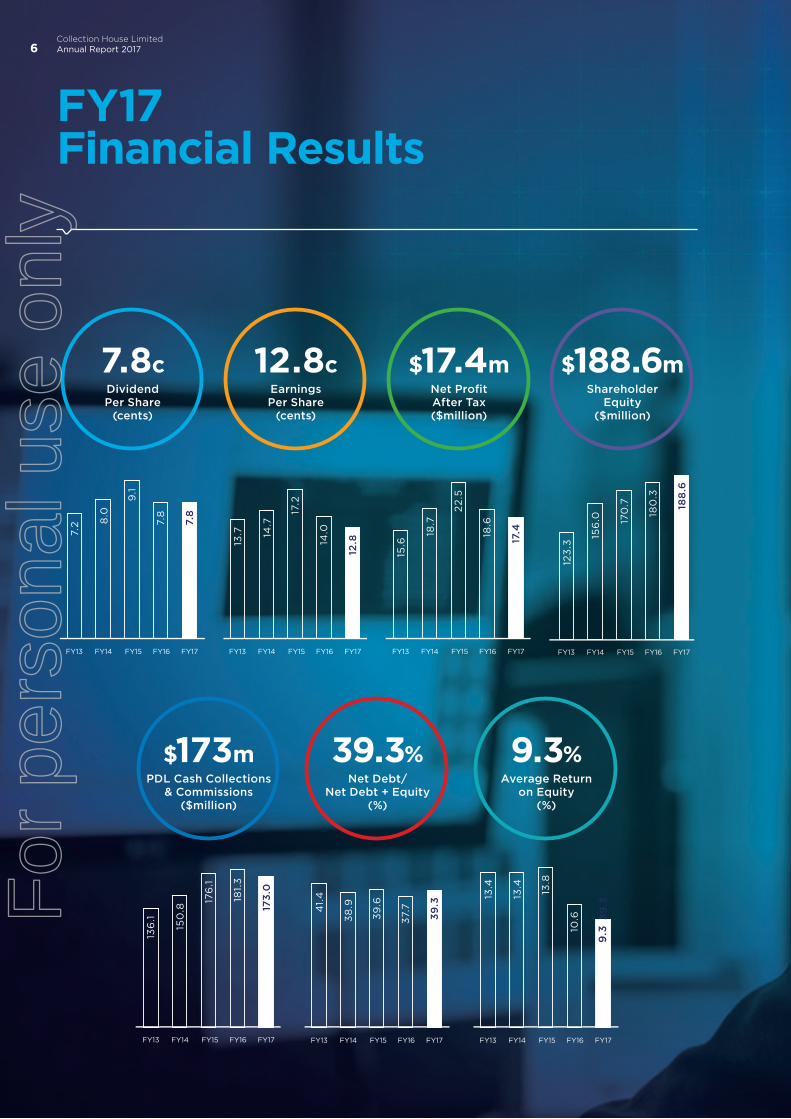
7.8c Dividend Per Share
(cents)
12.8c Earnings Per Share
(cents)
$17.4m Net ProfitAfter Tax($million)
$188.6m Shareholder
Equity($million)
$173m PDL Cash Collections
& Commissions($million)
39.3% Net Debt/
Net Debt + Equity(%)
9.3% Average Return
on Equity(%)
0
2
4
6
8
10
FY13 FY16 FY17FY14 FY15
7.8
7.8
9.1
8.0
7.2
0
50
100
150
200
FY13 FY16 FY17FY14 FY15
173
.0
181.
3
176
.1
150
.8
136
.1
0
10
20
30
40
50
FY13 FY16 FY17FY14 FY15
39.3
37.
7
39
.6
38
.941.
4
0
3
6
9
12
15
FY13 FY16 FY17FY14 FY15
39.3
10.6
13.8
13.4
13.4
0
5
10
15
20
FY13 FY16 FY17FY14 FY15
12.814
.0
17.2
14.7
13.7
0
5
10
15
20
25
FY13 FY16 FY17FY14 FY15
17.418
.6
22
.5
18.7
15.6
0
50
100
150
200
FY13 FY16 FY17FY14 FY15
188
.6
180
.3
170
.7
156
.0
123
.3
FY17 Financial Results
9.3
6Collection House Limited Annual Report 2017
For
per
sona
l use
onl
y

Helping businesses and individuals improve their
financial position.
7F
or p
erso
nal u
se o
nly

1 2 3 4 5
Our Strategic Foundation
Our FY18 Strategic Pillars & Key Goals
Purpose (Our Why)To attain excellence delivering client and consumer solutions whilst enhancing shareholder value.
Vision (Our How)People working together with clear goals to exceed expectations and achieve sustainable growth:
– Profit
– People
– Purchased Debt Ledgers
– Clients
– Consumers
Mission (Our What)To enable our people to be the leading provider of credit management solutions in Australasia.
People
Attract, develop and retain the right people who align with our values
Identify and grow our leaders
Refocus our Human Resources systems and processes
Clients
Trusted partner and preferred supplier in everything we say and do
To become an extension of our clients’ operations, being flexible and adaptable, providing them bespoke solutions
Market and sell our end to end solutions to both deepen and broaden our client relationships
Consumers
Engaging our consumers and listening
Liberating consumers through tailored solutions, improving their economic wellbeing
Supporting our people and community to connect with consumers through relationships with non-profit organisations, key to our purpose
PDL
Adding value from purchase to recovery through a strong analytics value chain
Structured and measurable collections and legal strategies
Understand and apply consumer behaviour to create unique consumer profiles and tailored solutions
Profit
Sustained growth of top line revenue through organic and in-organic opportunities
Diversification and expansion of new and existing business lines
Process and service enhancements to facilitate an enriched approach to cost management and optimisation
8Collection House Limited Annual Report 2017
For
per
sona
l use
onl
y

Our Values
Stewardship
Challenging Boundaries
Cooperative and Collaborative Spirit
Aiming High Together
Respect, Integrity and Accountability
9F
or p
erso
nal u
se o
nly

Kerry DalyChairman
Joined 2009
Member of the Audit and Risk Management and PDL Investment Committees
Philip HennessyIndependent, Non-executive Director
Joined 2013
Chair of the Audit and Risk Management Committee
Member of the Remuneration and Nomination Committee (to 23 December 2016) and the PDL Investment Committee
Michael Knox (from 24 March 2017)Independent, Non-executive Director
Joined 2017
Leigh Berkley (from 1 July 2016)Independent, Non-executive Director
Joined 2016
Chair of the PDL Investment Committee
Member of the Audit and Risk Management Committee
Board of Directors
Refer to the Directors’ Report on page 18 for further information.
From left to right: Michael Knox, Kerry Daly, Philip Hennessy, Leigh Berkley
10Collection House Limited Annual Report 2017
For
per
sona
l use
onl
y

Executive Management Team
Kristine MayChief Financial Officer and Company Secretary
Kristine has been with the Group for more than 14 years, and was appointed to the role of Chief Financial Officer in December 2016.
She has extensive financial and general management experience gained in her tenure with the Group, along with previous public company experience with Allied Mining and Processing Ltd as the Financial Controller and Company Secretary.
She is responsible for all aspects of the Groups financial management, including reporting, planning and analysis, taxation and investor relations.
Kristine holds a Bachelor of Business (Accounting, Banking & Finance) from QUT, is a Chartered Accountant, and is a member of the Australian Institute of Company Directors.
Anand AdusumilliChief Data Scientist
Anand joined the Group on 26 July 2017, bringing over 15 years’ experience in the field of data science and predictive analytics for the financial services domain, primarily focussed on accounts receivables and debt collection.
Working with the US market leader in the debt collection industry for the last 12 years, he has vast experience in building pricing models, forecasting models, and optimisation models for operations in the financial services sector.
He has a proven track record in bridging strong symbiotic relationships between analytics and operations that are quintessential to be successful in our business.
Jonathon IdasChief Legal Officer
Jonathon joined Collection House Group on 6 September 2017, bringing over 15 years’ experience as a solicitor in Sydney and London including most recently being the Chief Legal Officer for Australian Receivables Limited and Forbes Dowling Lawyers (FDL).
As Chief Legal Officer he successfully acquired Turnbull Bowles Lawyers, strengthening FDL’s position and expanding legal services, client engagement and productivity.
As a solicitor in the United Kingdom his focus was helping clients navigate successfully through the global financial crisis, acting on large scale litigation and pursuing cross boarder insolvency matters.
Anthony RivasChief Executive Officer
Anthony joined Collection House Group on 6 July 2016, bringing more than 25 years’ experience in the collections and receivables industry across three continents.
Most recently the Managing Director of Australian Receivables Limited (ARL), a wholly owned subsidiary of global customer service leaders Alorica, Anthony brings a proven ability to drive results, build a productive culture, and deliver value.
He is responsible for the overall management of the Group and the achievement of results for all stakeholders.
11F
or p
erso
nal u
se o
nly

The Operational Management Team supports the Executive
Management Team in delivering on our strategic foundation for the
benefit of all stakeholders
Operational Management Team
Denica SaundersHead of Collection Services
Jos BassonHead of CLH Lawyers
Cassandra BrownHead of Government Services
Kevin DonaldsonHead of Lion Finance
12Collection House Limited Annual Report 2017
For
per
sona
l use
onl
y

Collection House Limited’s Board (the Board) and its Senior Executives are committed to achieving and demonstrating the highest standard of good corporate governance practices, and fostering a culture that values ethical behaviour and integrity.
The Board keeps the governance system under regular review to ensure that it reflects changes in law and keeps pace with best practice developments in corporate governance.
Board CompositionAs at 30 June 2017, the Board comprised four Directors (including the Chair), all of whom are independent, Non-executive directors.
The Board considers its current members to have an appropriate mix of skills that enable the Board to discharge its responsibilities, and deliver the Company’s strategy and corporate objectives.
Board CommitteesThe Board has established two Committees, each with its own Charter:
– Audit and Risk Management Committee
– PDL Investment Committee
The Remuneration and Nomination Committee was disbanded on 23 December 2016, with the functions, powers and delegations of the Committee absorbed by the full Board.
Communication with ShareholdersCollection House Limited uses a range of methods to communicate with shareholders, including written and electronic communications.
Shareholders are able to make enquiries with the Group at any time through the Investor Enquiries page on the Group’s website.
The Corporate Governance Statement is available online.The Company’s listing on the Australian Securities Exchange means it must comply with the Corporations Act 2001, the ASX Listing Rules and other Australian laws. As part of this Compliance, Collection House Limited (the Group) is required to disclose how it has applied the recommendations contained in the ASX Corporate Governance Council’s Principles and Recommendations – 3rd Edition (the Principles and Recommendations) during the financial year ending 30 June 2017, explaining any departures from them. The Group has, unless otherwise stated, followed the Principles and Recommendations throughout the year.
More information about Collection House Limited’s Board and Management, corporate governance policies, procedures and practices is in the Corporate Governance Statement available on the website at www.collectionhouse.com.au under the heading Investors – Corporate Governance.
Corporate Governance
Board of Directors
Chief Executive
O�cer
Executive Management
Team
Audit & Risk Management Committee
Internal Audit
PDLInvestment Committee
13F
or p
erso
nal u
se o
nly

To attain excellence delivering client and
consumer solutions whilst enhancing shareholder value
Our Purpose Statement
14Collection House Limited Annual Report 2017
For
per
sona
l use
onl
y

The Directors present their report on the consolidated entity (referred to hereafter as the Company or the Group) consisting of Collection House Limited and the entities it controlled for the financial year ended 30 June 2017.
DirectorsThe following persons were Directors of the Group during the whole of the financial period and up to the date of this report, unless stated otherwise:
– Kerry Daly
– Philip Hennessy
– Leigh Berkley (appointed 1 July 2016)
– Michael Knox (appointed 24 March 2017)
– David Gray (retired 5 August 2016)
– David Liddy AM (resigned 4 November 2016)
– Julie-Anne Schafer (resigned 4 January 2017)
– Lev Mizikovsky (appointed 1 July 2016, resigned 30 January 2017)
See pages 18 to 19 for profile information on the Directors.
Principal activitiesThe Company has two reportable segments: Purchased Debt Ledgers (PDLs), and Collection Services.
The principal activities of the Group were the provision of debt collection services and the purchase of consumer debt. There were no significant changes in the nature of the activities of the Group during the year.
FY2017 highlights – Net profit after tax for the year was $17.4 million
(2016: $18.6 million)
– Earnings per share (EPS) were 12.8 cents (2016: 14.0 cents)
– Total dividends for the year of 7.8 cents (interim 3.9 cents paid 31 March 2017, final 3.9 cents to be paid 27 October 2017), fully franked.
Overview of Group operations and financial resultsThe consolidated Net Profit After Tax (NPAT) was $17.4 million (30 June 2016: $18.6 million). Basic earnings per share were 12.8 cents per share (30 June 2016: 14.0 cents).
Directors’ Report
15F
or p
erso
nal u
se o
nly

Key financial results - by segment - Audited ($’000)
Collection ServicesPurchased Debt Ledgers (PDLs) Consolidated
30 June 2017
$ ‘000
30 June 2016
$ ‘000
30 June 2017
$ ‘000
30 June 2016
$ ‘000
30 June 2017
$ ‘000
30 June 2016
$ ‘000
Revenue
Sales 68,476 57,909 68,476 57,909
Interest income 64,794 74,639 64,794 74,639
Total segment revenue 68,476 57,909 64,794 74,639 133,270 132,548
Intersegment elimination 149 146
Consolidated revenue 68,476 57,909 64,794 74,639 133,419 132,694
Results
Segment result 10,797 9,001 28,680 29,297 39,477 38,298
Interest expense and borrowing costs (5,363) (6,147)
Unallocated revenue less unallocated expenses (8,363) (6,167)
Profit before tax 25,751 25,984
Taxation (8,365) (7,422)
NPAT 17,386 18,562
Collection Services SegmentCollection Services (third party servicing) revenue increased year on year by 18.2 percent. The segment result of $10.8 million increased 19.9 percent from the previous year result of $9.0 million.
Growth was achieved in FY17 across this sector through:
– a deliberate focus on sales initiatives and renewal of client relationships to generate new business
– improved efficiency leveraging our new call centre technology together with innovative digital solutions
– CLH Legal Group launched an enhanced client-facing website focused on third party legal business supported by digital marketing initiatives
– ThinkMe Finance, delivering personalised financial solutions that enable individual customers to improve their financial position.
PDL SegmentPDL collections were $104.4 million (30 June 2016: $123.3 million). PDL acquisitions were $59.3 million (30 June 2016: $61.9 million). The segment result for the year was $28.7 million (30 June 2016: $29.3 million).
Forty six percent of recoveries were derived from PDLs exceeding a 3 year purchase vintage (30 June 2016: 40%). This outcome is a key supporting factor in determining the value attributed to PDLs.
The PDLs now comprise of ledgers acquired from the 4 major banks.
Our data driven PDL purchase strategies have been recently strengthened by the hiring of key personnel with specialist capabilities in the area of predictive analytics.
Review of financial positionThe Group’s net assets increased 4.6 percent to $188.6 million (30 June 2016: $180.3 million). Total net borrowings were $122.0 million (30 June 2016: $109.3 million). Gearing was 39.3% (30 June 2016: 37.7%).
The Group’s net cash outflow from investing activities was $60.0 million (30 June 2016: $67.2 million) which includes $58.3 million PDL purchases (30 June 2016: $61.9 million).
Directors’ Report
16Collection House Limited Annual Report 2017
For
per
sona
l use
onl
y
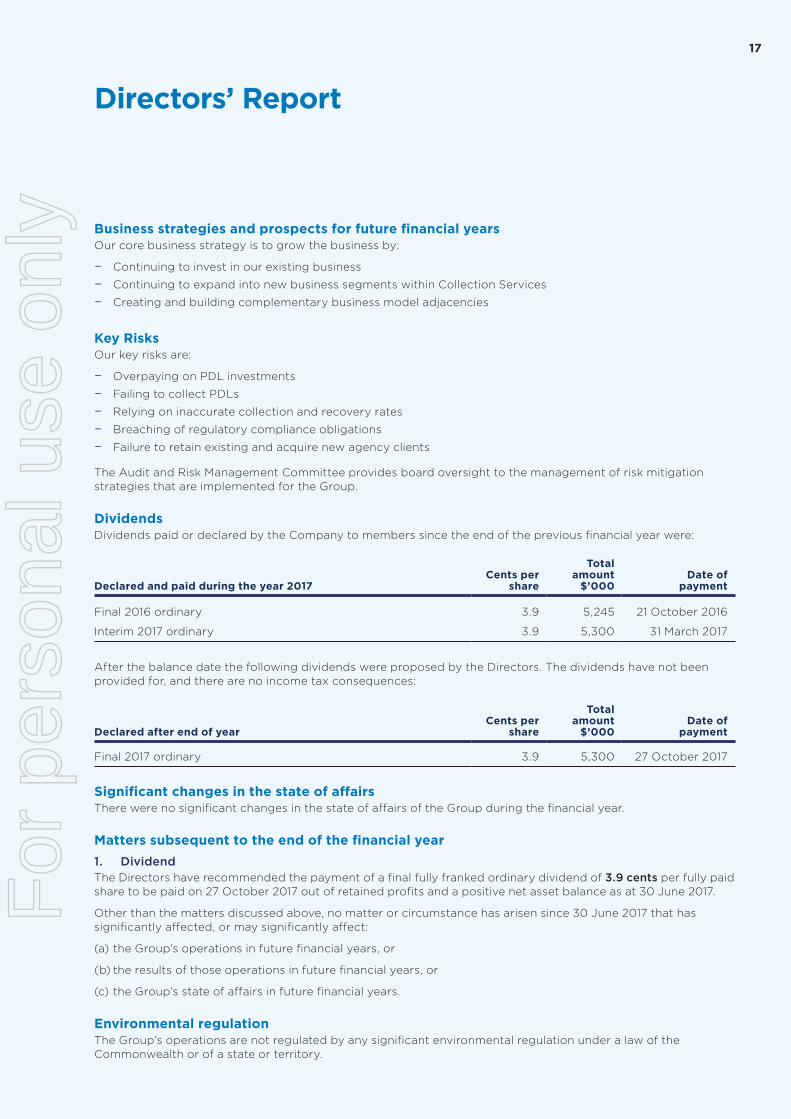
Business strategies and prospects for future financial yearsOur core business strategy is to grow the business by:
– Continuing to invest in our existing business
– Continuing to expand into new business segments within Collection Services
– Creating and building complementary business model adjacencies
Key RisksOur key risks are:
– Overpaying on PDL investments
– Failing to collect PDLs
– Relying on inaccurate collection and recovery rates
– Breaching of regulatory compliance obligations
– Failure to retain existing and acquire new agency clients
The Audit and Risk Management Committee provides board oversight to the management of risk mitigation strategies that are implemented for the Group.
DividendsDividends paid or declared by the Company to members since the end of the previous financial year were:
Declared and paid during the year 2017Cents per
share
Total amount
$’000Date of
payment
Final 2016 ordinary 3.9 5,245 21 October 2016
Interim 2017 ordinary 3.9 5,300 31 March 2017
After the balance date the following dividends were proposed by the Directors. The dividends have not been provided for, and there are no income tax consequences:
Declared after end of yearCents per
share
Total amount
$’000Date of
payment
Final 2017 ordinary 3.9 5,300 27 October 2017
Significant changes in the state of affairsThere were no significant changes in the state of affairs of the Group during the financial year.
Matters subsequent to the end of the financial year1. DividendThe Directors have recommended the payment of a final fully franked ordinary dividend of 3.9 cents per fully paid share to be paid on 27 October 2017 out of retained profits and a positive net asset balance as at 30 June 2017.
Other than the matters discussed above, no matter or circumstance has arisen since 30 June 2017 that has significantly affected, or may significantly affect:
(a) the Group’s operations in future financial years, or
(b) the results of those operations in future financial years, or
(c) the Group’s state of affairs in future financial years.
Environmental regulationThe Group’s operations are not regulated by any significant environmental regulation under a law of the Commonwealth or of a state or territory.
Directors’ Report
17F
or p
erso
nal u
se o
nly

Information on directors
Kerry Daly Independent, Non-executive Director
Qualifications BBus (Acc), CPA
Experience Mr Daly has over 38 years of experience in the financial services sector.
Mr Daly is currently a Non-executive Director of Trustees Australia Limited, and Chairman of Axsesstoday Limited.
During the period 1987 to December 2000, Mr Daly was MD and CEO of The Rock Building Society Limited where he initiated its demutualisation and was responsible for its ASX listing. From January 2001, he served as Executive Director of the fixed interest brokerage and investment banking business Grange Securities Limited.
Mr Daly was appointed to the Board of Collection House Limited on 30 October 2009.
Special responsibilities Chair of the Board from 4 November 2016.
Chair of the Audit and Risk Management Committee to 4 November 2016.
Member of the PDL Investment Committee from 1 November 2016.
Interest in shares 394,607 ordinary shares in CLH.
Philip Hennessy Independent, Non-executive Director
Experience Mr Hennessy was, until February 2013, Queensland Chair of KPMG, Chartered Accountants. After 12 years in that role and some 30 years being involved in all aspects of corporate insolvency and reconstruction, he retired from KPMG in July 2013.
Mr Hennessy is currently a Director of Metro Mining Limited and Blue Sky Alternative Investments Limited. He is a former Director of Blue Sky Alternatives Access Fund Limited, resigning in May 2017. He is also on a number of not-for-profit organisations Board of Directors and advises a number of private companies.
Mr Hennessy was appointed to the Board of Collection House Limited on 22 August 2013 and elected a Director on 25 October 2013.
Special responsibilities Chair of the Audit and Risk Management Committee from 4 November 2016.
Member of the Remuneration and Nomination Committee from 10 July 2014 to 23 December 2016.
Member of the PDL Investment Committee from 1 November 2016.
Interest in shares 50,000 ordinary shares in CLH.
Directors’ Report
18Collection House Limited Annual Report 2017
For
per
sona
l use
onl
y

Leigh Berkley Independent, Non-executive Director
Qualifications BA (Hons) in Accounting and Business Finance (Manchester University), Chartered Accountant (ICAEW), Member of the Chartered Institute of Credit Management UK.
Experience Mr Berkley has more than 25 years’ experience in the collections and debt purchase industry, and is a Board member and immediate past President of the Credit Services Association (CSA) in the UK. He is a regular visitor to Australia, and assisted the Australian Collectors & Debt Buyers Association (ACDBA) develop the recently launched ‘Code of Practice’.
Mr Berkley is currently the Director of External Affairs and Development of Arrow Global Group Plc, one of the UK’s largest consumer debt purchasers and providers of receivables management solutions. Prior to this, he was the CEO and main shareholder of Tessera Credit Group, a debt purchaser and collection agency, which he led for over 16 years before successfully negotiating a sale of its assets to Arrow Global in December 2014.
Mr Berkley is responsible for Public Affairs at the Credit Services Association (CSA), and is also Vice President of the European trade body FENCA. He sits on a number of Government and industry advisory bodies, and regularly presents at conferences and trade body forums around the world.
Mr Berkley was appointed to the Board of Collection House Limited on 1 July 2016.
Special responsibilities Member of the Remuneration and Nomination Committee from 27 July 2016 to 23 December 2016.
Chair of the PDL Investment Committee from 1 November 2016.
Interest in shares No ordinary shares in CLH.
Michael Knox Independent, Non-executive Director
Qualifications BBus (Econ), MBA
Experience Mr Knox was an Australian Trade Commissioner serving in Saudi Arabia and Indonesia. He joined Morgans (now Morgans Financial Limited) in Sydney in 1988. He was Chief Institutional Options Dealer until moving to Brisbane in 1990 as Economist and Strategist. He joined the Board of Morgan Stockbroking in 1996. He became Director of Strategy and Chief Economist in 1998. Michael remained on the Board of Morgans until 2012.
Michael has served on many Queensland Government advisory committees. He was Chairman of the Queensland Food Industry Strategy Committee in 1992, a Member of the Consultative Committee of the Ipswich Development Board in 1993, a Member of the Queensland Tourism Strategy Committee in 1994 and a Member of the Ministerial Advisory Committee on Economic Development in 1997. From 2003 to 2012, he was Chairman of the Advisory Committee of School of Economics and Finance at the Queensland University of Technology. He has been a Governor of the American Chamber of Commerce from 1997 to 2007. In 2008, Michael joined the Board of The City of Brisbane Investment Corporation Pty Ltd. Michael remained on the Board until 2016. Michael was the President of the Economic Society of Australia (Qld) Inc from 2009 to 2013.
Mr Knox was appointed to the Board of Collection House Limited on 24 March 2017.
Special responsibilities Nil
Interest in shares No ordinary shares in CLH.
Directors’ Report
19F
or p
erso
nal u
se o
nly

Company SecretaryThe Company Secretary is Kristine May.
Ms May holds a Bachelor of Business (Accounting, Banking & Finance), is a Chartered Accountant, and is a member of the Australian Institute of Company Directors. Ms May has been with the Group for more than 15 years providing extensive financial and general management across the Group. Ms May undertakes the combined roles of Chief Financial Officer and Company Secretary for the Group. Prior to 2001, Ms May held the position of Financial Controller and Company Secretary with Allied Mining & Processing Ltd.
Meetings of DirectorsThe number of meetings of the Group’s Board of Directors and of each board committee held during the year ended 30 June 2017, and the number of meetings attended by each Director were:
2017
Meetings of committees
DirectorsAudit and Risk Management
Remuneration and Nomination** PDL Investment
A B A B A B A B
Kerry Daly 10 10 9 9 1 1 3 3
Philip Hennessy 10 10 9 9 4 4 3 3
Leigh Berkley 10 10 8 9 * * 3 3
Michael Knox 2 4 * * * * * *
David Gray 0 1 0 1 * * * *
David Liddy 3 4 * * 4 4 * *
Julie-Anne Schafer 5 5 * * 4 4 * *
Lev Mizikovsky 5 5 4 4 2 2 1 1
A Number of meetings attended.
B Number of meetings held during the time the director held office or was a member of the committee during the year.
* Not a member of the relevant Board Committee.
** The Remuneration and Nomination Committee was disbanded on 23 December 2016, with the functions of the Committee absorbed by the Board.
Directors’ Report
20Collection House Limited Annual Report 2017
For
per
sona
l use
onl
y

Remuneration Report – AUDITEDThis Remuneration Report outlines the overall remuneration strategy, framework and practices adopted by the Group for FY17 for Non-Executive Directors (NEDs), the Chief Executive Officer and other Key Management Personnel (KMP). It has been prepared in accordance with the requirements of the Corporations Act 2001 (Cth), as amended (the Act) and its regulations. The information provided in this Remuneration Report has been audited as required by Section 308(3C) of the Act. The Remuneration Report contains the following sections:
A Directors and other key management personnel disclosed in this report
B Remuneration governance
C Executive remuneration policy and framework
D Relationship between remuneration and the Group’s performance
E Non-executive Director remuneration policy
F Details of remuneration of Directors and key management personnel
G Service agreements
H Share-based compensation
I Equity instruments held by key management personnel
J Additional information
A Directors and other key management personnel disclosed in this reportThe key management personnel include those who have the authority and responsibility, directly or indirectly, to plan, direct and control the major activities of the Group.
The Group’s Directors and key management personnel for FY17
Board of Directors
Kerry Daly Chair (Non-Executive)
Philip Hennessy Director (Non-Executive)
Leigh Berkley Director (Non-Executive) (appointed 1 July 2016)
Michael Knox Director (Non-Executive) (appointed 24 March 2017)
David Gray Director (Non-Executive) (resigned 5 August 2016)
David Liddy AM Chair (Non-Executive) (resigned 4 November 2016)
Julie-Anne Schafer Director (Non-Executive) (resigned 4 January 2017)
Lev Mizikovsky Director (Non-Executive) (appointed 1 July 2016, resigned 30 January 2017)
Executive Management Team (EMT)
Anthony Rivas Chief Executive Officer (CEO) (appointed 6 July 2016)
Kristine May Chief Financial Officer (CFO) (acting from 29 October 2016, appointed 23 December 2016)
Company Secretary (appointed 4 November 2016)
Marcus Barron Chief Information Officer (CIO) (to 22 December 2016)
Chief Operating Officer (COO) (from 23 December 2016 to 3 July 2017)
Michelle Cummins Chief People and Culture Officer (CPCO) (resigned 24 January 2017)
Matthew Thomas Chief Executive Officer (CEO) (resigned 5 July 2016)
Adrian Ralston Chief Financial Officer (CFO) (resigned 18 August 2016)
George Wilson Chief Financial Officer (CFO) (appointed 1 September 2016, resigned 28 October 2016)
Julie Tealby Company Secretary and Chief Risk Officer (CRO) (resigned 4 November 2016)
The following changes occurred after the reporting date and before the date the financial report was authorised for issue:
– Marcus Barron resigned as COO effective 3 July 2017. His role as KMP ceased on 30 June 2017.
– Anand Adusumilli was appointed as Chief Data Scientist effective 26 July 2017.
Directors’ Report
21F
or p
erso
nal u
se o
nly

B Remuneration governanceThe Remuneration and Nomination Committee (the Committee) was disbanded on 23 December 2016, with the functions of the Committee absorbed by the Board.
These functions include consideration of the following:
– How the remuneration policies are applied to members of the EMT
– The basis of short and long-term performance-based incentive payments for members of the EMT
– The appropriate fees for NEDs.
Fundamental to all arrangements is that all KMP must contribute to the achievement of short and long-term objectives, enhance shareholder value, avoid unnecessary or excessive risk taking and discourage behaviour that is contrary to the Group’s values.
Details of the short and long-term incentive schemes are set out below in the ‘Executive Remuneration Policy and Framework’ section of the Remuneration Report.
The objectives of the Group’s remuneration policies are to ensure remuneration packages for KMP reflect their duties, responsibilities and level of performance – as well as to ensure all KMP are motivated to pursue the long-term growth and success of the Group.
In determining the remuneration of all KMP, the Board aims to ensure that the remuneration policies and framework:
– Are fair and competitive and align with the long-term interests of the Group
– Incentivise all KMP to pursue the short and long-term growth and success of the Group within an appropriate risk control framework
– Are competitive and reasonable, enabling the Group to attract and retain key talent, knowledge and experience
– Are aligned to the Group’s strategic and business objectives and the creation of shareholder value
– Have a transparent reward structure with a risk proposition that is linked to the achievement of pre-determined performance targets.
Use of external consultantsIn performing its role, the Committee may directly commission and receive information, advice and recommendations from independent, external advisers. This is done to ensure the Group’s remuneration packages are appropriate, reflect industry standards and will help achieve the objectives of the Group’s remuneration strategy. No external consultants were engaged in relation to FY17.
Securities Trading PolicyThe trading of shares issued to eligible employees under any of the Group’s employee equity plans was subject to, and conditional upon, compliance with the Group’s Securities Trading Policy. Members of the EMT are prohibited from entering into any hedging arrangements over unvested performance rights under the Group’s Performance Rights Plan (PRP). The Group would consider a breach of this policy as misconduct, which may lead to disciplinary action and potentially dismissal.
C Executive remuneration policy and framework
The Group’s executive remuneration strategy is designed to attract, motivate and retain high performing individuals and align the interests of executives with shareholders.
The Board reviews the remuneration packages for members of the EMT annually by reference to individual performance against key individual objectives, the Group’s consolidated results and market data. The performance review of the CEO is undertaken by the Chair of the Board who then makes a recommendation to the Board. The performance review of the other members of the EMT is undertaken by the CEO and approved by the Board.
The Group aims to reward members of the EMT with a level of remuneration commensurate with their responsibilities and position within the Group, and their ability to influence shareholder value creation. The remuneration framework links rewards with the strategic objectives and performance of the Group.
The EMT pay and reward framework has three components:
– Total fixed remuneration (TFR) including superannuation and benefits
– Short-term incentives (STIs), paid in cash or shares
– Long-term incentives (LTIs) through participation in the Performance Rights Plan (PRP), which has been approved by the Board.
Directors’ Report
22Collection House Limited Annual Report 2017
For
per
sona
l use
onl
y

The combination of these components amount to the total remuneration package or total employment cost for members of the EMT.
The following summarises the target remuneration mix of the EMT:
At Risk
TFR STI LTI
CEO 21% 16% 63%
Other EMT 62% 19% 19%
Total fixed remunerationStructured as a total employment cost package, the total fixed remuneration (TFR) may be delivered as a combination of cash and prescribed non-financial benefits at the discretion of the EMT member. Members of the EMT are offered a competitive TFR that comprises the cash salary, superannuation and non-monetary benefits. TFR for EMT members is reviewed annually to ensure the pay is in line with the role, experience and performance and remains competitive with the market. Group and individual performance are considered during the annual remuneration review. TFR is usually fixed for a 12-month period with any changes effective from 1 September each financial year. An EMT member’s remuneration is also reviewed upon any change of duties.
Retirement benefits for EMTThere are no additional retirement benefits made available to members of the EMT, other than those required by statute or by law and under the shareholder approved performance rights plans.
Short-term incentives (STIs)To ensure that remuneration for members of the EMT are aligned to the Group’s performance, a portion of their remuneration, in line with their ability to influence results, is performance based and, therefore, ‘at risk’.
EMT members have the opportunity to earn an annual STI if pre-defined targets are achieved. The CEO had a target STI opportunity of 75 percent of TFR, with 60 percent of the determined amount to be paid in cash and 40 percent deferred payment to be provided in shares at the end of the contract period. Other EMT personnel each have a cash-based STI opportunity of 30 percent of TFR.
STIs for the EMT in FY17 were based on scorecard measures and weightings. The CEO key performance objective targets were set by the Board at the beginning of the financial year and aligned to the Group’s strategic and business objectives, as outlined below.
The STIs for other members of the EMT are recommended by the CEO to the Board based on the CEO’s financial and non-financial target performance objectives.
There is a high degree of alignment between the Company strategy and the EMT’s STI performance objective targets. The relative weights of financial versus non-financial performance targets for each executive are detailed below and are based on their position and influence on the financial results. The weightings strive to provide a balance between the Company’s overall financial goals and the ability of the individual executives to influence these and other strategic outcomes.
Position
Financial Performance
Objectives
Non-Financial
Performance Objectives
Chief Executive Officer 80% 20%
Chief Financial Officer/Company Secretary 60% 40%
Chief Information Officer/Chief Operating Officer (resigned 3 July 2017) 40% 60%
Chief People and Culture Officer (resigned 24 January 2017) 60% 40%
Company Secretary & Chief Risk Officer (resigned 4 November 2016) 60% 40%
The financial performance objectives are the same for all Senior Executives, providing a common objective for the EMT (weighting are different as highlighted above).
Directors’ Report
23F
or p
erso
nal u
se o
nly

The non-financial EMTs have a high degree of variability between technology projects, people and culture, and processes that reflect the individual roles, and include measures such as achieving strategic outcomes, developing people and culture, growth, business development, differentiation, innovation, digital development and other key initiatives during the financial year.
Each executive has a high degree of clarity on their individual performance objectives and priorities, as established by their scorecard. They also have an understanding of the inter-relationship of their individual performance objectives to the objectives of the other members of the EMT.
CEO STI targets for FY17 Payment of the STI is discretionary and subject to the requirement to achieve a minimum of 5% growth in EPS in a financial year, as well as the achievement of the individual personal objectives outlined below:
Performance category Metrics Weighting (%)
Financial – Net profit after tax (NPAT) 20
– Earnings per share (EPS) 40
Financial Support – Growth of the ThinkMe business line 5
– Introduction of a sales force 5
– Growth in RTO income 5
– Organic arrangement improvement 2.5
– Establish system for mortgage referrals 2.5
Other – Introduction of Interactive Intelligence technology 5
– Migration on to C5 platform 10
– Implementation of comprehensive marketing campaign 5
A summary of the actual STI Financial outcomes achieved is included in Section D.
Cessation of employment For resignation or termination for cause, any STI is forfeited, unless otherwise determined by the Board.
For any other reason, the Board may award STI on a pro-rata basis taking into account time and the current level of performance against performance hurdles.
Long-term incentives (LTIs)LTIs are awarded to the Group’s EMT by way of performance rights via the Performance Rights Plan (PRP). The LTI program has the objective of delivering long-term shareholder value by incentivising members of the EMT to achieve sustained financial performance over a three-year period (with no opportunity to retest).
Annual grants of performance rights are proposed to be made to the Group’s EMT under the PRP. The number of performance rights granted is calculated based on the weighted average share price over the five trading days before the grant date. Sections H and I provide details of performance rights granted, vested, exercised and lapsed during the year.
Performance rights were awarded to various eligible employees pursuant to the PRP, at a nil exercise price and subject to a three-year tenure hurdle. This is contingent on the achievement of certain financial performance hurdles, which are approved by the Board each financial period.
The performance rights will not vest unless the Group’s financial performance meet these hurdles. The Board set these hurdles to ensure that the EMT were focused on the delivery of increased shareholder value through the achievement of the short and long-term goals of the Group. Participants in the PRP do not receive distributions or dividends on unvested LTI grants.
Directors’ Report
24Collection House Limited Annual Report 2017
For
per
sona
l use
onl
y

FY17 Performance Rights AwardedIn line with the terms of his contract, the CEO was granted 3,000,000 performance rights in FY17. Other EMT personnel were granted performance rights in FY17 representing 30 percent of TFR.
For the FY17 performance rights the Board chose Earnings Per Share (EPS) as the key financial measurement, as EPS growth will ensure that long-term shareholder value is achieved. The hurdles and the proportion of performance rights that will vest as a percentage if the target is achieved, are outlined below:
Performance Hurdles – Compound EPS Growth % of Pool
0% - 5.00% Nil
5.01% - 7.50% 33.33%
7.51% - 10.00% 66.66%
More than 10.01% 100%
For the period 1 July 2016 to 30 June 2019, 3,621,810 unlisted performance rights over ordinary shares in the Company were granted during the current year under the PRP to the EMT and other eligible employees. The performance rights will vest (and therefore be capable of being exercised) depending on the Group achieving certain performance hurdles as at 30 June 2019 as highlighted above.
FY16 Performance Rights AwardedThe MD and CEO was granted performance rights in FY16 representing 87 percent of TFR. Other EMT personnel were granted performance rights in FY16 representing 30 percent of TFR with the exception of the CFO who was granted performance rights representing 35 percent of TFR.
For the FY16 performance rights the Board chose Earnings Per Share (EPS) as the key financial measurement as EPS growth will ensure that long-term shareholder value is achieved.
Up to 50 percent of awarded performance rights will be capable of vesting where average compound EPS growth over the Performance Period (1 July 2015 to 30 June 2018) is at least 5 percent. Up to an additional 50 percent of awarded performance rights will be capable of vesting on a sliding scale capped at 10 percent average compound EPS growth (hence 1 percent per 0.1 percent of additional EPS growth).
For the period 1 July 2015 to 30 June 2018, 467,365 unlisted performance rights over ordinary shares in the Company were granted under the PRP to the EMT and other eligible employees. The performance rights will vest (and therefore be capable of being exercised) depending on the Group achieving certain performance hurdles as at 30 June 2018 as highlighted above.
FY15 Performance Rights AwardedFor FY15 the performance hurdles were based on the satisfactory achievement of performance conditions approved by the Board. The hurdles and the proportion of performance rights that will vest as a percentage if the target is achieved, are outlined below:
Performance Conditions % of Pool
Average ROE 10%
Debt/Debt + Equity 10%
EPS Base 30%
EPS Stretch 50%
Total 100%
For the period 1 July 2014 to 30 June 2017, 680,184 unlisted performance rights over ordinary shares in the Company were granted under the PRP to the EMT and other eligible employees. The performance rights will vest (and therefore be capable of being exercised) depending on the Group achieving certain performance hurdles as at 30 June 2017 as highlighted above.
A summary of the actual LTI Financial outcomes achieved is included in Section D.
Directors’ Report
25F
or p
erso
nal u
se o
nly
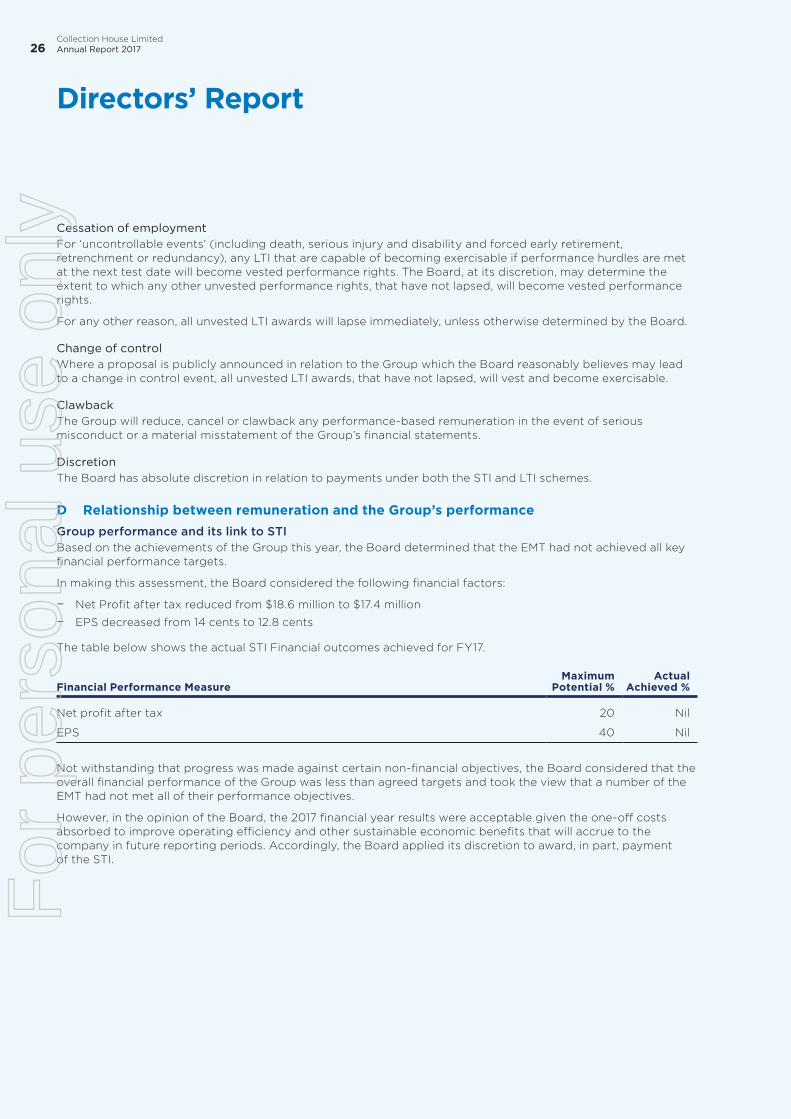
Cessation of employmentFor ‘uncontrollable events’ (including death, serious injury and disability and forced early retirement, retrenchment or redundancy), any LTI that are capable of becoming exercisable if performance hurdles are met at the next test date will become vested performance rights. The Board, at its discretion, may determine the extent to which any other unvested performance rights, that have not lapsed, will become vested performance rights.
For any other reason, all unvested LTI awards will lapse immediately, unless otherwise determined by the Board.
Change of controlWhere a proposal is publicly announced in relation to the Group which the Board reasonably believes may lead to a change in control event, all unvested LTI awards, that have not lapsed, will vest and become exercisable.
ClawbackThe Group will reduce, cancel or clawback any performance-based remuneration in the event of serious misconduct or a material misstatement of the Group’s financial statements.
DiscretionThe Board has absolute discretion in relation to payments under both the STI and LTI schemes.
D Relationship between remuneration and the Group’s performanceGroup performance and its link to STIBased on the achievements of the Group this year, the Board determined that the EMT had not achieved all key financial performance targets.
In making this assessment, the Board considered the following financial factors:
– Net Profit after tax reduced from $18.6 million to $17.4 million
– EPS decreased from 14 cents to 12.8 cents
The table below shows the actual STI Financial outcomes achieved for FY17.
Financial Performance MeasureMaximum
Potential %Actual
Achieved %
Net profit after tax 20 Nil
EPS 40 Nil
Not withstanding that progress was made against certain non-financial objectives, the Board considered that the overall financial performance of the Group was less than agreed targets and took the view that a number of the EMT had not met all of their performance objectives.
However, in the opinion of the Board, the 2017 financial year results were acceptable given the one-off costs absorbed to improve operating efficiency and other sustainable economic benefits that will accrue to the company in future reporting periods. Accordingly, the Board applied its discretion to award, in part, payment of the STI.
Directors’ Report
26Collection House Limited Annual Report 2017
For
per
sona
l use
onl
y

Group performance and its link to LTIThe overall level of reward for members of the EMT takes into account the performance of the Group over a number of years, with greater emphasis given to the current and previous year. Details of the relationship between the remuneration policy and Group’s performance over the last five years is detailed below.
2013 2014 2015 2016 2017
Net profit after tax ($m) $15.6 $18.7 $22.5 $18.6 $17.4
Dividends declared (franked) 7.2 cents 8.0 cents 9.1 cents 7.8 cents 7.8 cents
Share price commenced $0.80 $1.65 $1.88 $2.23 $1.10
Share price ended $1.65 $1.88 $2.23 $1.10 $1.16
Basic EPS (including discontinued operations) 13.6 cents 14.7 cents 17.2 cents 14.0 cents 12.8 cents
The vesting of LTI awards for the year ended 30 June 2017 is linked to the Group’s EPS, average ROE and Gearing performance. Based on the achievements of the Group’s financial performance over the three-year performance period ended 30 June 2017 the Committee determined that the EMT had not achieved its performance hurdles.
The table below outlines the Group’s performance measures for the three-year performance period ended 30 June 2017 and the actual percentage achieved to these targets.
Performance Measure Maximum
Potential %Actual
achieved %
EPS 80 Nil
Average ROE 10 Nil
Net Debt/Net Debt plus Equity 10 Nil
Based on the above performance, the Board has determined that the performance rights granted for the performance period ended 30 June 2017 (the FY15 grant) will lapse with no vesting.
Directors’ Report
27F
or p
erso
nal u
se o
nly

Details of remuneration: cash bonuses and performance rightsFor each cash bonus and grant of performance rights included in the table on page 32 the percentage of the available bonus or grant that was paid, or that vested, in the financial year, and the percentage that was forfeited because the person did not meet the service and performance criteria, is set out below. Other than the deferred payment shares, no part of the STI is payable in future years. No performance rights will vest unless the vesting conditions are met, hence the minimum value of the performance rights yet to vest is nil. The maximum value of the performance rights yet to be expensed has been determined as the amount of the grant date fair value of the performance rights that are yet to be expensed.
Cash bonus 2017Deferred Payment
Shares 2017* Performance rights
Awarded %
Forfeited %
Awarded %
Forfeited %
Financial year
grantedVested
%Forfeited
%Lapsed
%
Financial years in
which performance
rights may be issued
(subject to certain qualifying
hurdles)
Maximum total
value of performance
rights yet to be
expensed
Anthony Rivas 80% 20% 80% 20% 2017 – – – 2020 3,451,921
Kristine May 80% 20% – – 2017 – – – 2020 68,333
Marcus Barron – 100% – – 2015 – – 100% 2018 –
2016 – – 100% 2019 –
2017 – – 100% 2020 –
Michelle Cummins – 100% – – 2016 – – 100% 2019 –
2017 – – 100% 2020 –
Matthew Thomas – 100% – – 2015 – – 100% 2018 –
2016 – – 100% 2019 –
Adrian Ralston – 100% – – 2015 – – 100% 2018 –
2016 – – 100% 2019 –
George Wilson – 100% – – 2017 – – – – –
Julie Tealby – 100% – – 2015 – – 100% 2018 –
2016 – – 100% 2019 –
* Under the terms of the CEO’s employment agreement, 40% of the FY17 STI is payable in shares at the end of the employment contract, and is contingent upon the CEO being employed by the Company at the end of the contract period.
Directors’ Report
28Collection House Limited Annual Report 2017
For
per
sona
l use
onl
y

E Non-Executive Director remuneration policyNon-Executive Director’s (NEDs) fees are determined within an aggregate Directors’ fee pool limit, which is periodically recommended for approval by shareholders. Non-Executive Directors do not receive share options or performance rights. The maximum aggregate fee pool and the fee structure is reviewed annually against fees paid to NEDs of comparable companies. The Board considers advice from external advisors when undertaking the annual review process.
The maximum annual aggregate Directors’ fee pool limit is $900,000 per annum and was approved by shareholders at the Group’s AGM on 25 October 2013. The FY17 aggregate total Non-Executive Director fees distribution is $602,606 (including superannuation). The Board will not seek any increase to the annual aggregate NED fee pool limit at the 2017 AGM.
Payments are allowed for additional responsibilities for the Chair of each Board Committee. Fees and payments to Non-Executive Directors reflect the demands that are made on, and the responsibilities of, the Directors.
The table below summarises the NED fees for FY17 (exclusive of superannuation):
FEES FY17 FY16
Base fees
Chair $165,000* $165,000*
Other Non-Executive Directors $90,000 $90,000
Additional fees
Audit and Risk Management Committee Chair $15,000 $15,000
Audit and Risk Management Committee Member $Nil $Nil
Remuneration and Nomination Committee Chair $15,000 $15,000
Remuneration and Nomination Committee Member $Nil $Nil
PDL Investment Committee Chair $15,000 $Nil
PDL Investment Committee Member $Nil $Nil
* The Chair’s fee covers his entire engagement on the Board.
For further information in relation to Directors’ remuneration, including fees paid in accordance with statutory rules and applicable accounting standards, refer to Section F below.
Note that the changes in the NED fee structure do not require an increase in the Directors’ fee pool limit.
Retirement allowances for DirectorsThere are no retirement allowances paid to Non-Executive Directors.
Directors’ Report
29F
or p
erso
nal u
se o
nly

F Details of remuneration of Directors and key management personnelAmounts of remunerationDetails of the remuneration of Directors and all other key management personnel (as defined in AASB 124 Related Party Disclosures) of the Group are set out below.
In Dollars
Short-termPost-
employmentOther long
term
Termination benefits
Share-based
payments
Total
Proportion of remu-neration
performance related
Salary and fees
STI Cash
bonus
Non- monetary
benefits Total
Super- annuation
benefits
Annual and long
service leave Rights
Non-Executive Directors
Kerry Daly Chair (appointed Chair 4 November 2016)
2017 144,635 – – 144,635 13,740 – – – 158,375
2016 104,731 – – 104,731 9,949 – – – 114,680
Philip Hennessy Non-Executive Director
2017 100,154 – – 100,154 9,515 – – – 109,669
2016 89,865 – – 89,865 8,537 – – – 98,402
Leigh Berkley Non-Executive Director (appointed 1 July 2016)
2017 106,650 – – 106,650 2,850 – – – 109,500
2016 – – – – – – – – –
Michael Knox Non-Executive Director (appointed 24 March 2017)
2017 24,577 – – 24,577 2,302 – – – 26,879
2016 – – – – – – – – –
David Gray Non-Executive Director (resigned 5 August 2016)
2017 12,519 – – 12,519 1,189 – – – 13,708
2016 104,327 – – 104,327 9,911 – – – 114,238
David Liddy AM Chair (resigned 4 November 2016)
2017 57,750 – – 57,750 5,486 – – – 63,236
2016 164,811 – – 164,811 15,657 – – – 180,468
Julie-Anne Schafer Non-Executive Director (resigned 4 January 2017)
2017 52,615 – – 52,615 4,998 – – – 57,613
2016 89,596 – – 89,596 8,512 – – – 98,108
Lev Mizikovsky Non-Executive Director (appointed 1 July 2016, resigned 30 January 2017)
2017 57,750 – – 57,750 – – – – 57,750
2016 – – – – – – – – –
Directors’ Report
30Collection House Limited Annual Report 2017
For
per
sona
l use
onl
y

In Dollars
Short-termPost-
employmentOther long
term
Termination benefits
Share-based payments
Total
Proportion of remu-neration
performance related
Salary and fees
STI Cash
bonus
Non- monetary
benefits Total
Super- annuation
benefits
Annual and long
service leave Rights
Deferred Shares*
Executive Director and other Key Management Personnel
Anthony Rivas Chief Executive Officer (appointed 6 July 2016)
2017 421,731 159,600 51,536 632,867 40,064 22,237 – 431,490 106,400 1,233,058 57%
2016 – – – – – – – – – – –
Kristine May Chief Financial Officer/Company Secretary (acting from 29 October 2016, appointed 23 December 2016)
2017 158,276 62,000 2,938 223,214 15,036 5,876 – 8,542 – 252,668 28%
2016 – – – – – – – – – – –
Marcus Barron Chief Operating Officer (appointed 23 December 2016) Chief Information Officer (to 23 December 2016)
2017 268,846 – 4,344 273,190 31,715 17,499 65,000 – – 387,404 –
2016 232,800 59,000 3,910 295,710 22,116 6,793 – (52,742) – 271,877 2%
Michelle Cummins Chief People and Culture Officer (resigned 24 January 2017)
2017 142,308 – 2,456 144,764 19,913 16,412 67,308 – – 248,397 –
2016 105,961 33,000 2,304 141,265 10,066 8,266 – – – 159,597 21%
Matthew Thomas MD/CEO (resigned 5 July 2016)
2017 105,752 – 54 105,806 4,192 309,167 – – – 419,165 –
2016 593,708 – 3,910 597,618 29,978 23,452 – (495,204) – 155,844 (318%)
Adrian Ralston Chief Financial Officer (resigned 18 August 2016)
2017 62,371 – 558 62,929 8,208 112,720 29,412 – – 213,269 –
2016 333,875 – 3,910 337,785 31,681 5,260 – (72,767) – 301,959 (24%)
George Wilson Chief Financial Officer (appointed 1 September 2016, resigned 28 October 2016)
2017 49,522 – 7,339 56,861 4,374 – – – – 61,235 –
2016 – – – – – – – – – – –
Julie Tealby Chief Risk Officer + Company Secretary (resigned 4 November 2016)
2017 56,616 – 1,489 58,105 10,402 26,664 19,682 – – 114,853 –
2016 213,040 33,200 3,910 250,150 20,239 5,613 – (34,458) – 241,544 (1%)
- For recently appointed EMT, the remuneration information provided in the table below relates to the period from the date of appointment as EMT to FY17, unless otherwise stated.
* Deferred share represent 40 percent of FY17 STI, payable to the CEO at the end of his contract term.
Directors’ Report
31F
or p
erso
nal u
se o
nly

G Service agreementsRemuneration and other terms of employment for the CEO and other key management personnel are also formalised in service agreements. Except for the CEO who has a six month notice period, all contracts with members of the EMT may be terminated early by either party with three months’ notice. Collection House, at its full discretion, may make a payment in lieu of the notice period, either partially or in full. Major provisions of the agreements relating to remuneration are set out below.
Anthony RivasCEO (appointed 6 July 2016)
Annual fixed remuneration
Performance bonus
Performance rights
Contract period
$469,746 inclusive of superannuation and non-monetary benefits for FY17.
$331,778 was the maximum STI opportunity in relation to FY17 (60% cash, 40% deferred payment in shares at the end of the contract period, provided the CEO remains employed by the Company at the end of the contract period).
3,000,000 at risk performance rights were granted during FY17.
Three years, to 30 June 2019
Kristine MayCFO(acting from 29 October 2016, appointed 23 December 2016)Company Secretary (appointed 4 November 2016)
Annual fixed remuneration
Performance cash bonus
Performance rights
$256,221 inclusive of superannuation and non-monetary benefits for FY17.
$76,866 was the maximum STI opportunity in relation to FY17.
59,387 at risk performance rights were granted during FY17.
Marcus BarronCIO (to 22 December 2016)COO (appointed 23 December 2016)(resigned 3 July 2017)
Annual fixed remuneration
Performance cash bonus
Performance rights
$289,071 inclusive of superannuation and non-monetary benefits for FY17.
$86,721 was the maximum STI opportunity in relation to FY17.
44,391 at risk performance rights were issued during FY15.
36,080 at risk performance rights were granted during FY16.
67,000 at risk performance rights were granted during FY17.
Directors’ Report
32Collection House Limited Annual Report 2017
For
per
sona
l use
onl
y

H Share-based compensationPerformance rightsPerformance rights have been granted to certain eligible employees under the Collection House Performance Rights Plan (PRP).
Performance rights granted under the PRP respectively carry no dividend or voting rights. When exercisable, each performance right is convertible into one ordinary share of Collection House Limited.
Details of performance rights over ordinary shares in the Group provided as remuneration to members of the EMT are set out below.
Name
Number of performance rights granted/issued
during the year
Number of performance rights vested/issuable
during the year
2017 2016 2017 2016
Anthony Rivas 3,000,000 – – –
Kristine May 59,387 – – –
Marcus Barron 67,000 36,080 – –
Michelle Cummins 64,462 – – –
Matthew Thomas – 253,283 – –
Adrian Ralston – 58,829 – –
George Wilson – – – –
Julie Tealby – 32,260 – –
The assessed fair value at grant date of performance rights compensation granted to members of the EMT has been calculated using the five day volume weighted average price (VWAP) of one ordinary share over the five days preceding the grant. The expense is recognised over the vesting period. The expense for each relevant financial year will require an assessment at each reporting date of the probability that each performance hurdle will be achieved.
I Equity instruments held by key management personnelPerformance rightsDetails of performance rights over ordinary shares in the Company provided as remuneration to each Director of Collection House Limited and other key management personnel of the Group, are set out below.
2017
Name
Balance at start of
the yearGranted as
compensation Vested Lapsed
Balance at end of
the yearVested and
issuable Un-vested
Anthony Rivas – 3,000,000 – – 3,000,000 – 3,000,000
Kristine May – 59,387 – – 59,387 – 59,387
Marcus Barron 80,471 67,000 – (147,471) – – –
Michelle Cummins – 64,462 – (64,462) – – –
Matthew Thomas 647,857 – – (647,857) – – –
Adrian Ralston 129,013 – – (129,013) – – –
George Wilson – – – – – – –
Julie Tealby 79,121 – – (79,121) – – –
Directors’ Report
33F
or p
erso
nal u
se o
nly

Share holdingsThe number of shares in the Company held during the financial year by each Director of Collection House Limited and other key management personnel of the Group, including their personally related parties, are set out below.
2017
Non-Executive Directors
Balance at start of the year, or on
appointment
Other changes
during the year
Balance at the end of
the year
Kerry Daly 394,607 – 394,607
Philip Hennessy 50,000 – 50,000
Leigh Berkley – – –
Michael Knox – – –
David Gray* 195,999 (195,999) –
David Liddy AM* 150,000 (150,000) –
Julie-Anne Schafer* 66,500 (66,500) –
Lev Mizikovsky* 15,627,008 (16,081,784) –
* Resigned from Board during FY17. Shares held upon resignation are included in other changes.
2017
Executive Director and other key management personnel
Balance at start of the
year
Other changes
during the year
Balance at the end of
the year
Anthony Rivas – – –
Kristine May – – –
Marcus Barron* 10,100 (10,100) –
Michelle Cummins* – – –
Matthew Thomas* 502,495 (502,495) –
Adrian Ralston* 75,250 (75,250) –
George Wilson* – – –
Julie Tealby* 7,941 (7,941) –
* Shares held upon cessation of employment are included in other changes.
Directors’ Report
34Collection House Limited Annual Report 2017
For
per
sona
l use
onl
y

J Additional informationLoans to Directors and ExecutivesThere were no loans to Directors or members of the EMT during FY17.
Shares under performance rightsLTIs are provided to certain eligible employees via the PRP. Total un-issued ordinary shares of the Group under performance rights at the date of this report are detailed below.
Performance rights
Date rights
effective
Number of rights
granted/to be issued
Issue price of
shares
No of shares issued
2017
No of unvested
shares and vested
but not yet issued
shares under rights Expiry date
PRP 1/7/16 3,621,810 Nil Nil 3,260,657 30 September 2019
Additional information – UnauditedInsurance of officersDuring the financial year the Group paid premiums of $121,942 in respect of Directors’ and Officers’ liability and legal expenses’ and insurance. This was for current and former Directors and Officers, including senior executives of the Group and Directors, Senior Executives and Secretaries of its controlled entities.
The liabilities insured are legal costs that may be incurred in defending civil or criminal proceedings that may be brought against the Directors or Officers in their capacity as Directors or Officers of entities in the Group, and any other payments arising from liabilities incurred by the Directors or Officers in connection with such proceedings. This does not include such liabilities that arise from conduct involving a wilful breach of duty by the Directors or Officers or the improper use by the Directors or Officers of their position or of information to gain advantage for themselves or someone else or to cause detriment to the Group.
Proceedings on behalf of the GroupNo person has applied to the Court under section 237 of the Corporations Act 2001 for leave to bring proceedings on behalf of the Group, or to intervene in any proceedings to which the Group is a party, for the purpose of taking responsibility on behalf of the Group for all or part of those proceedings.
No proceedings have been brought or intervened in on behalf of the Group with leave of the Court under section 237 of the Corporations Act 2001.
Non-audit servicesDuring the year KPMG, the Group’s auditor, has performed certain other services in addition to the audit and review of financial statements.
The Board has considered the non-audit services provided during the year by the auditor, and the Audit and Risk Management Committee is satisfied that the provision of those non-audit services during the year by the auditor is compatible with, and did not compromise, the auditor independence requirements of the Corporations Act 2001 for the following reasons:
– all non-audit services were subject to the corporate governance procedures adopted by the Group and have been reviewed by the Audit and Risk Management Committee to ensure they do not impact the integrity and objectivity of the auditor
– the non-audit services provided do not undermine the general principles relating to auditor independence as set out in APES 110 Code of Ethics for Processional Accountants, as they did not involve reviewing or auditing the auditor’s own work, acting in a management or decision making capacity for the Group, acting as an advocate for the Group or jointly sharing risks and rewards.
Directors’ Report
35F
or p
erso
nal u
se o
nly

Details of the amounts paid and payable to the auditors of the Group, KPMG, are set out below.
Services other than audit and review of financial statements: 2017
Other regulatory audit services $
Trust account audits 67,700
Loan covenant compliance 3,000
Other services
Taxation compliance services 145,500
Accounting advice 32,800
249,000
Audit and review of financial statements 212,400
Total paid or payable to KPMG 461,400
Auditor’s independence declarationA copy of the auditor’s independence declaration as required under section 307C of the Corporations Act 2001 is set out on page 37.
Rounding of amountsThe Group is of a kind referred to in ASIC Corporations (Rounding in Financial/Directors’ Report) Instrument 2016/191, issued by the Australian Securities and Investments Commission, relating to the ‘rounding off’ of amounts in the Directors’ report. Amounts in the Directors’ report have been rounded off in accordance with that Corporations Instrument to the nearest thousand dollars, or in certain cases, to the nearest dollar.
This report is made in accordance with a resolution of Directors.
Collection House Limited
Kerry DalyChairman
Directors’ Report
36Collection House Limited Annual Report 2017
For
per
sona
l use
onl
y

Liability limited by a scheme approved under Professional Standards Legislation.
KPMG, an Australian partnership and a member firm of the KPMG network of independent member firms affiliated with KPMG International Cooperative (“KPMG International”), a Swiss entity.
Lead Auditor’s Independence Declaration under
Section 307C of the Corporations Act 2001
To the Directors of Collection House Limited
I declare that, to the best of my knowledge and belief, in relation to the audit of Collection House Limited for the financial year ended 30 June 2017 there have been:
i. no contraventions of the auditor independence requirements as set out in the Corporations Act 2001 in relation to the audit; and
ii. no contraventions of any applicable code of professional conduct in relation to the audit.
KPMG Scott Guse
Partner
Brisbane
24 August 2017
Auditor’s Independence Declaration
37F
or p
erso
nal u
se o
nly

Income Statementfor the year ended 30 June 2017
Consolidated
Notes
30 June 2017
$’000
30 June 2016
$’000
Revenue 5 133,419 132,694
Revenue from continuing operations 133,419 132,694
Direct collection costs (25,751) (22,250)
Employee expenses (54,214) (57,667)
Depreciation and amortisation expense 6 (4,309) (3,948)
Operating lease rental expense 6 (8,273) (6,420)
Restructuring expenses 6 (196) (1,222)
Other expenses (9,563) (9,056)
Finance costs 6 (5,362) (6,147)
Profit before income tax 25,751 25,984
Income tax expense 7 (8,365) (7,422)
Profit from continuing operations 17,386 18,562
Profit for the year attributable to equity holders of Collection House Limited 17,386 18,562
Cents Cents
Earnings per share for profit attributable to the ordinary equity holders of the Company:
Basic earnings per share 28 12.8 14.0
Diluted earnings per share 28 12.6 13.9
The above income statement should be read in conjunction with the accompanying notes.
38Collection House Limited Annual Report 2017
For
per
sona
l use
onl
y

Consolidated
Notes
30 June 2017
$’000
30 June 2016
$’000
Profit for the year 17,386 18,562
Other comprehensive income, net of income tax
Items that may be reclassified subsequently to profit or loss
Exchange differences on translation of foreign operations 20(a) (168) 21
Other comprehensive income for the year, net of income tax (168) 21
Total comprehensive income for the year attributable to equity holders of Collection House Limited 17,218 18,583
The above statement of comprehensive income should be read in conjunction with the accompanying notes.
Statement of Comprehensive Incomefor the year ended 30 June 2017
39F
or p
erso
nal u
se o
nly
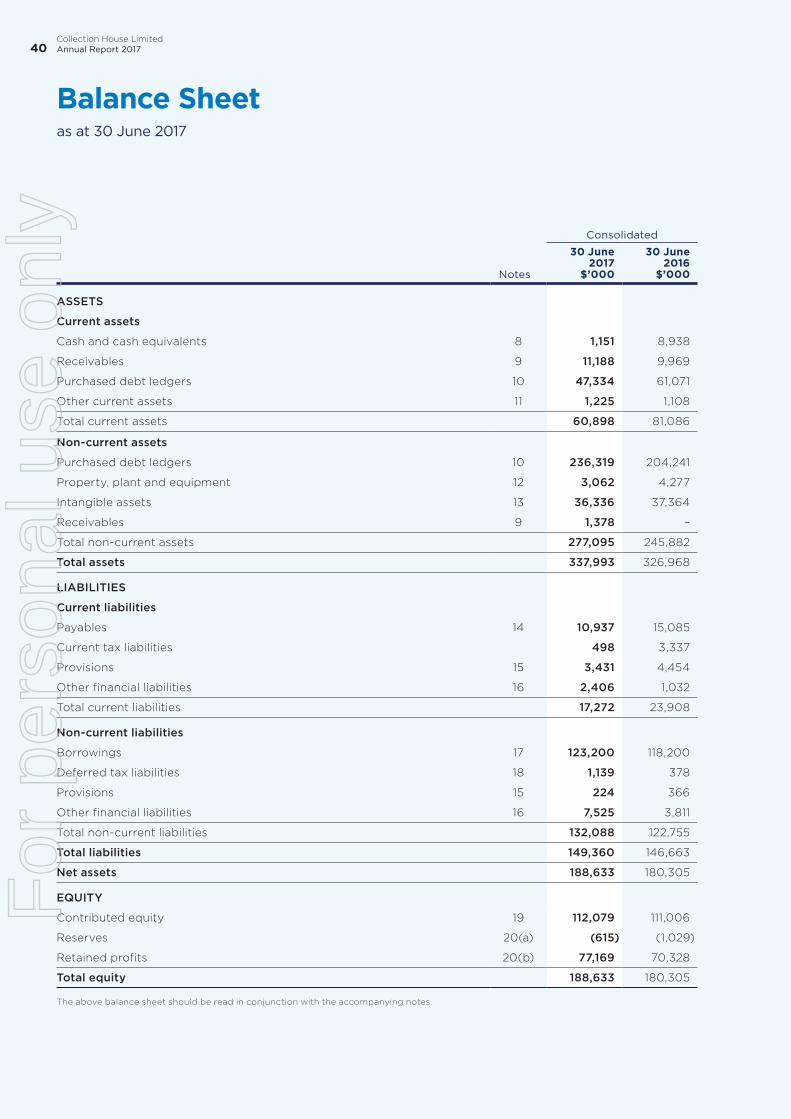
Balance Sheetas at 30 June 2017
Consolidated
Notes
30 June 2017
$’000
30 June 2016
$’000
ASSETS
Current assets
Cash and cash equivalents 8 1,151 8,938
Receivables 9 11,188 9,969
Purchased debt ledgers 10 47,334 61,071
Other current assets 11 1,225 1,108
Total current assets 60,898 81,086
Non-current assets
Purchased debt ledgers 10 236,319 204,241
Property, plant and equipment 12 3,062 4,277
Intangible assets 13 36,336 37,364
Receivables 9 1,378 –
Total non-current assets 277,095 245,882
Total assets 337,993 326,968
LIABILITIES
Current liabilities
Payables 14 10,937 15,085
Current tax liabilities 498 3,337
Provisions 15 3,431 4,454
Other financial liabilities 16 2,406 1,032
Total current liabilities 17,272 23,908
Non-current liabilities
Borrowings 17 123,200 118,200
Deferred tax liabilities 18 1,139 378
Provisions 15 224 366
Other financial liabilities 16 7,525 3,811
Total non-current liabilities 132,088 122,755
Total liabilities 149,360 146,663
Net assets 188,633 180,305
EQUITY
Contributed equity 19 112,079 111,006
Reserves 20(a) (615) (1,029)
Retained profits 20(b) 77,169 70,328
Total equity 188,633 180,305
The above balance sheet should be read in conjunction with the accompanying notes.
40Collection House Limited Annual Report 2017
For
per
sona
l use
onl
y

Statement of Changes in Equityfor the year ended 30 June 2017
Attributable to owners of Collection House Limited
Consolidated Notes
Contributed equity $’000
Reserves $’000
Retained earnings
$’000
Total equity $’000
Balance at 1 July 2015 105,307 2,188 63,170 170,665
Profit for the year – – 18,562 18,562
Other comprehensive income – 21 – 21
Total comprehensive income for the year – 21 18,562 18,583
Transactions with owners in their capacity as owners:
Contributions of equity net of transaction costs 19 3,053 – – 3,053
Employee share rights-value of employee services 20 2,646 (3,238) – (592)
Dividends provided for or paid 21 – – (11,404) (11,404)
5,699 (3,238) (11,404) (8,943)
Balance at 30 June 2016 111,006 (1,029) 70,328 180,305
Balance at 1 July 2016 111,006 (1,029) 70,328 180,305
Profit for the year – – 17,386 17,386
Other comprehensive income – (168) – (168)
Total comprehensive income for the year – (168) 17,386 17,218
Transactions with owners in their capacity as owners:
Contributions of equity net of transaction costs 19 1,608 – – 1,608
Acquisition of treasury shares (535) – – (535)
Employee share rights-value of employee services 20 – 582 – 582
Dividends provided for or paid 21 – – (10,545) (10,545)
1,073 582 (10,545) (8,890)
Balance at 30 June 2017 112,079 (615) 77,169 188,633
The above statement of changes in equity should be read in conjunction with the accompanying notes.
41F
or p
erso
nal u
se o
nly

Statement of Cash Flowsfor the year ended 30 June 2017
Consolidated
Notes
30 June 2017
$’000
30 June 2016
$’000
Cash flows from operating activities
Receipts from customers (inclusive of goods and services tax) 174,888 192,273
Payments to suppliers and employees (inclusive of goods and services tax) (102,419) (100,402)
72,469 91,871
Income taxes paid (10,444) (7,588)
Net cash inflow (outflow) from operating activities 30 62,025 84,283
Cash flows from investing activities
Payments for property, plant and equipment (259) (422)
Payments for leasehold improvements (21) (240)
Payments for purchased debt ledgers (58,315) (61,862)
Payments for intangible assets (1,490) (4,633)
Net cash (outflow) inflow from investing activities (60,085) (67,157)
Cash flows from financing activities
Proceeds from borrowings 5,000 1,900
Repayment of borrowings (44) (3,203)
Borrowing costs (1,323) (1,445)
Interest paid (3,758) (4,384)
Dividends paid to Company's shareholders 21 (10,545) (11,404)
Proceeds from issues of shares and other equity securities 1,606 3,053
Purchase of treasury shares (565) -
Net cash (outflow) inflow from financing activities (9,629) (15,483)
Net increase (decrease) in cash and cash equivalents (7,689) 1,643
Cash and cash equivalents at the beginning of the financial year 8,938 7,222
Effects of exchange rate changes on cash and cash equivalents (98) 73
Cash and cash equivalents at end of year 8 1,151 8,938
The above statement of cash flows should be read in conjunction with the accompanying notes.
42Collection House Limited Annual Report 2017
For
per
sona
l use
onl
y

Notes to the Financial Statementsfor the year ended 30 June 2017
These financial statements are for the consolidated entity consisting of Collection House Limited (the Company) and its subsidiaries (the Group).
Collection House Limited is a public company incorporated and domiciled in Australia.
The financial statements were authorised for issue on 24 August 2017 by the directors of the Company.
1 Summary of significant accounting policies
The principal accounting policies adopted in the preparation of these consolidated financial statements are set out below. These policies have been consistently applied to all the years presented, unless otherwise stated.
(a) Basis of preparationThese general purpose financial statements have been prepared in accordance with Australian Accounting Standards and interpretations issued by the Australian Accounting Standards Board and the Corporations Act 2001. Collection House Limited is a for profit entity for the purpose of preparing the financial statements.
(i) Compliance with IFRSThe consolidated financial statements of the Collection House Limited Group also comply with International Financial Reporting Standards (IFRS) as issued by the International Accounting Standards Board (IASB).
(ii) New and amended standards adopted by the Group
The new standards and amendments to standards mandatory for the first time in the annual reporting period commencing 1 July 2016 do not impact amounts recognised in the current or prior period, and are not likely to affect future periods.
(iii) Early adoption of standardsThe Group has elected to continue to early adopt the following pronouncements:
– AASB 9 Financial Instruments (December 2010) and AASB 2010-7 Amendments to Australian Accounting Standards arising from AASB 9 (December 2010)
This includes applying the revised pronouncement to the comparatives in accordance with AASB 108 Accounting Policies, Changes in Accounting Estimates and Errors. None of the items in the financial statements had to be restated as a result of applying these standards.
(iv) Historical cost conventionThese financial statements have been prepared under the historical cost convention, as modified by the revaluation of financial assets, financial assets and liabilities (including derivative instruments) at fair value through profit or loss, and certain classes of property, plant and equipment.
(v) Critical accounting estimatesThe preparation of financial statements requires the use of certain critical accounting estimates. It also requires management to exercise its judgement in the process of applying the Group’s accounting policies. The areas involving a higher degree of judgement or complexity, or areas where assumptions and estimates are significant to the financial statements are disclosed in Note 3.
(b) Principles of consolidation
(i) SubsidiariesSubsidiaries are all entities over which the Group has control. The group controls an entity when the group is exposed to, or has rights to, variable returns from its involvement with the entity and has the ability to affect those returns through its power to direct the activities of the entity.
Subsidiaries are fully consolidated from the date on which control is transferred to the Group. They are de-consolidated from the date that control ceases.
The acquisition method of accounting is used to account for business combinations by the Group (refer to Note 1(h)).
Intercompany transactions, balances and unrealised gains on transactions between Group companies are eliminated. Unrealised losses are also eliminated unless the transaction provides evidence of the impairment of the asset transferred. Accounting policies of subsidiaries have been changed where necessary to ensure consistency with the policies adopted by the Group.
There are currently no non-controlling interests in the Group.
(c) Segment reportingOperating segments are reported in a manner consistent with the internal reporting provided to the chief operating decision maker. The chief operating decision maker, who is responsible for allocating resources and assessing performance of the operating segments, has been identified as the Board of Directors.
43F
or p
erso
nal u
se o
nly

Notes to the Financial Statementsfor the year ended 30 June 2017 (continued)
1 Summary of significant accounting policies (continued)
(d) Foreign currency translation
(i) Functional and presentation currencyItems included in the financial statements of each of the Group’s entities are measured using the currency of the primary economic environment in which it operates (‘the functional currency’). The consolidated financial statements are presented in Australian dollars, which is Collection House Limited’s functional and presentation currency.
(ii) Transactions and balancesForeign currency transactions are translated into the functional currency using the exchange rates prevailing at the dates of the transactions. Foreign exchange gains and losses resulting from the settlement of such transactions and from the translation at year end exchange rates of monetary assets and liabilities denominated in foreign currencies are recognised in profit or loss, except when they are deferred in equity as qualifying cash flow hedges and qualifying net investment hedges or are attributable to part of the net investment in a foreign operation.
Non-monetary items that are measured at fair value in a foreign currency are translated using the exchange rates at the date when the fair value was determined. Translation differences on assets and liabilities carried at fair value are reported as part of the fair value gain or loss.
(iii) Group companiesThe results and financial position of foreign operations that have a functional currency different from the presentation currency are translated into the presentation currency as follows:
– assets and liabilities for each balance sheet presented are translated at the closing rate at the date of that balance sheet;
– income and expenses for each income statement and statement of comprehensive income are translated at average exchange rates (unless this is not a reasonable approximation of the cumulative effect of the rates prevailing on the transaction dates, in which case income and expenses are translated at the dates of the transactions), and
– all resulting exchange differences are recognised in other comprehensive income.
On consolidation, exchange differences arising from the translation of any net investment in foreign entities, and of borrowings and other financial instruments designated as hedges of such investments, are recognised in other comprehensive income.
When a foreign operation is sold or any borrowings forming part of the net investment are repaid, the associated exchange differences are reclassified to profit or loss, as part of the gain or loss on sale.
Goodwill and fair value adjustments arising on the acquisition of a foreign operation are treated as assets and liabilities of the foreign operation and translated at the closing rate.
(e) Revenue recognitionRevenue is measured at the fair value of the consideration received or receivable. Amounts disclosed as revenue are net of returns, trade allowances, rebates and amounts collected on behalf of third parties.
The Group recognises revenue when the amount of revenue can be reliably measured, it is probable that future economic benefits will flow to the Group and specific criteria have been met for each of the Group’s activities as described below.
Revenue is recognised for the major business activities as follows:
(i) Interest income – Purchased Debt Ledgers (PDL’s)
Interest income is recognised using the effective interest method under AASB 9 Financial Instruments. Interest is shown net of any adjustments to the carrying amount of purchased debt ledgers as a result of changes in estimated cash flows.
(ii) Rendering of services – commission revenueRevenue from rendering services is recognised to the extent that it is probable that the revenue benefits will flow to the Group and the revenue can be reliably measured.
(iii) Sale of non-current assetsThe net gain or loss on disposal of non-current assets is included as either income or an expense at the date control of the asset passes to the buyer, usually when an unconditional contract of sale is signed.
The gain or loss on disposal is calculated as the difference between the carrying amount of the asset at the time of disposal and the net proceeds on disposal.
(iv) DividendsRevenue from dividends and distributions from controlled entities is recognised by the Parent Entity when they are declared by the controlled entities.
Revenue from dividends from other investments is recognised when received.
44Collection House Limited Annual Report 2017
For
per
sona
l use
onl
y
Notes to the Financial Statementsfor the year ended 30 June 2017 (continued)
1 Summary of significant accounting policies (continued)
(f) Income taxThe income tax expense or revenue for the period is the tax payable on the current period’s taxable income based on the applicable income tax rate for each jurisdiction adjusted by changes in deferred tax assets and liabilities attributable to temporary differences and to unused tax losses.
The current income tax charge is calculated on the basis of the tax laws enacted or substantively enacted at the end of the reporting period in the countries where the Company’s subsidiaries and associates operate and generate taxable income. Management periodically evaluates positions taken in tax returns with respect to situations in which applicable tax regulation is subject to interpretation. It establishes provisions where appropriate on the basis of amounts expected to be paid to the tax authorities.
Deferred income tax is provided in full, using the liability method, on temporary differences arising between the tax bases of assets and liabilities and their carrying amounts in the consolidated financial statements. However, deferred tax liabilities are not recognised if they arise from the initial recognition of goodwill. Deferred income tax is also not accounted for if it arises from initial recognition of an asset or liability in a transaction other than a business combination that at the time of the transaction affects neither accounting nor taxable profit or loss. Deferred income tax is determined using tax rates (and laws) that have been enacted or substantially enacted by the end of the reporting period and are expected to apply when the related deferred income tax asset is realised or the deferred income tax liability is settled.
Deferred tax assets are recognised for deductible temporary differences and unused tax losses only if it is probable that future taxable amounts will be available to utilise those temporary differences and losses.
Deferred tax liabilities and assets are not recognised for temporary differences between the carrying amount and tax bases of investments in foreign operations where the company is able to control the timing of the reversal of the temporary differences and it is probable that the differences will not reverse in the foreseeable future.
Deferred tax assets and liabilities are offset when there is a legally enforceable right to offset current tax assets and liabilities and when the deferred tax balances relate to the same taxation authority.
Current tax assets and tax liabilities are offset where the entity has a legally enforceable right to offset and intends either to settle on a net basis, or to realise the asset and settle the liability simultaneously.
Collection House Limited and its wholly-owned Australian controlled entities have implemented the tax consolidation legislation. As a consequence, these entities are taxed as a single entity and the deferred tax assets and liabilities of these entities are set off in the consolidated financial statements.
Current and deferred tax is recognised in profit or loss, except to the extent that it relates to items recognised in other comprehensive income or directly in equity. In this case, the tax is also recognised in other comprehensive income or directly in equity, respectively.
(g) LeasesLeases of property, plant and equipment where the Group, as lessee, has substantially all the risks and rewards of ownership are classified as finance leases (Note 16). Finance leases are capitalised at the lease’s inception at the fair value of the leased property or, if lower, the present value of the minimum lease payments. The corresponding rental obligations, net of finance charges, are included in other current financial liabilities and other non-current financial liabilities. Each lease payment is allocated between the liability and finance costs. The finance cost is charged to the profit or loss over the lease period so as to produce a constant periodic rate of interest on the remaining balance of the liability for each period. The property, plant and equipment acquired under finance leases is depreciated over the asset’s useful life or over the shorter of the asset’s useful life and the lease term if there is no reasonable certainty that the Group will obtain ownership at the end of the lease term.
Leases in which a significant portion of the risks and rewards of ownership are not transferred to the Group as lessee are classified as operating leases (Note 24). Payments made under operating leases (net of any incentives received from the lessor) are charged to profit or loss on a straight-line basis over the period of the lease.
45F
or p
erso
nal u
se o
nly

1 Summary of significant accounting policies (continued)
(h) Business combinationsThe acquisition method of accounting is used to account for all business combinations, regardless of whether equity instruments or other assets are acquired. The consideration transferred for the acquisition of a subsidiary comprises the fair values of the assets transferred, the liabilities incurred and the equity interests issued by the Group. The consideration transferred also includes the fair value of any asset or liability resulting from a contingent consideration arrangement and the fair value of any pre-existing equity interest in the subsidiary. Acquisition-related costs are expensed as incurred. Identifiable assets acquired and liabilities and contingent liabilities assumed in a business combination are measured initially at their fair values at the acquisition date.
The excess of the consideration transferred over the fair value of the Group’s share of the net identifiable assets acquired is recorded as goodwill. If this amount is less than the fair value of the net identifiable assets of the subsidiary acquired and the measurement of all amounts has been reviewed, the difference is recognised directly in profit or loss as a bargain purchase.
Where settlement of any part of cash consideration is deferred, the amounts payable in the future are discounted to their present value as at the date of exchange. The discount rate used is the entity’s incremental borrowing rate, being the rate at which a similar borrowing could be obtained from an independent financier under comparable terms and conditions.
(i) Impairment of assetsGoodwill is not subject to amortisation and is tested semi-annually for impairment, or more frequently if events or changes in circumstances indicate that it might be impaired. Other assets are reviewed for impairment whenever events or changes in circumstances indicate that the carrying amount may not be recoverable. An impairment loss is recognised for the amount by which the asset’s carrying amount exceeds its recoverable amount. The recoverable amount is the higher of an asset’s fair value less costs to sell and value-in-use (refer to Note 13). For the purposes of assessing impairment, assets are grouped at the lowest levels for which there are separately identifiable cash inflows which are largely independent of the cash inflows from other assets or groups of assets (cash-generating units).
(j) Cash and cash equivalentsFor the purpose of presentation in the cash flow statement, cash and cash equivalents includes cash on hand, deposits held at call with financial institutions, other short-term, highly liquid investments with original maturities of three months or less that are readily convertible to known amounts of cash and which are subject to an insignificant risk of changes in value, and where applicable bank overdrafts. Where applicable, bank overdrafts are shown within borrowings in current liabilities in the consolidated balance sheet.
(k) Trade receivablesTrade receivables are recognised initially at fair value less provision for impairment. Trade receivables are due for settlement no more than 30 days from the date of recognition, and are presented as current assets unless collection is not expected for more than 12 months after the reporting date.
Collectability of trade receivables is reviewed on an ongoing basis. Debts which are known to be uncollectible are written off by reducing the carrying amount directly. An allowance account (provision for impairment of trade receivables) is used when there is objective evidence that the Group will not be able to collect all amounts due according to the original terms of the receivables. Significant financial difficulties of the debtor, probability that the debtor will enter bankruptcy or financial reorganisation, and default or delinquency in payments (more than 30 days overdue) are considered indicators that the trade receivable is impaired. The amount of the impairment allowance is the difference between the asset’s carrying amount and the estimated future cash flows. Cash flows relating to short-term receivables are not discounted if the effect of discounting is immaterial.
The amount of the impairment loss is recognised in profit or loss within other expenses. When a trade receivable for which an impairment allowance had been recognised becomes uncollectible in a subsequent period, it is written off against the allowance account. Subsequent recoveries of amounts previously written off are credited against other expenses in profit or loss.
(l) Other financial assets
ClassificationThe Group classifies financial assets as subsequently measured at either amortised cost or fair value on the basis of both the Group’s business model for managing the financial assets and the contractual cash flow characteristics of the financial asset.
Notes to the Financial Statementsfor the year ended 30 June 2017 (continued)
46Collection House Limited Annual Report 2017
For
per
sona
l use
onl
y

1 Summary of significant accounting policies (continued)
(l) Other financial assets (continued)The classification depends on the purpose for which the financial assets were acquired. Management determines the classification of its financial assets at initial recognition and re-evaluates this designation at each reporting date.
(i) Financial assets subsequently measured at amortised cost - PDLs
ClassificationPurchased debt ledgers have been included in this category of financial assets as the Group’s business model for managing the PDLs and the characteristics of the contractual cash flows of the financial asset are consistent with this measurement approach.
PDLs are included as non-current assets, except for the amount of the ledger that is expected to be realised within 12 months of the balance sheet date, which is classified as a current asset.
Subsequent MeasurementPDLs are initially recognised at cost, as cost reflects fair value plus any incidental costs of acquisition and thereafter measured at amortised cost using the effective interest method, less any impairment losses.
Net gains on financial assets are disclosed in the income statement as interest income net of any change in value of the ledgers.
ImpairmentThe carrying amount of the PDLs is continuously reviewed to ensure that the carrying amount is not impaired. PDLs are collectively assessed for impairment as they are not considered to be individually significant within the portfolio and they have similar credit risk characteristics.
A PDL is considered to be impaired if the carrying amount exceeds the present value of the estimated future cash flows discounted at the asset’s original effective interest rate. Impairment losses are recognised in the income statement. When a subsequent change in estimated future cash flows causes the amount of impairment loss to reverse, the reversal in impairment is recognised in the income statement to the initial amount of the original impairment loss.
(ii) Trade receivablesTrade receivables are subsequently carried at amortised cost using the effective interest method.
Recognition and derecognitionRegular way purchases and sales of financial assets are recognised on trade-date i.e. the date on which the Group commits to purchase or sell the asset. Financial assets are derecognised when the rights to receive cash flows from the financial assets have expired or have been transferred and the Group has transferred substantially all the risks and rewards of ownership.
MeasurementAt initial recognition, the Group measures a financial asset at its fair value plus, in the case of a financial asset not at fair value through profit or loss, transaction costs that are directly attributable to the acquisition of the financial asset. Transaction costs of financial assets carried at fair value through profit or loss are expensed in profit or loss.
(iii) ImpairmentThe group assesses at the end of each reporting period whether there is objective evidence that a financial asset or group of financial assets is impaired. A financial asset or group of financial assets is impaired and impairment losses are incurred only if there is objective evidence of impairment as a result of one or more events that occurred after the initial recognition and that loss event has an impact on the estimated future cash flows of the financial asset or group of financial assets that can be readily estimated.
(m) Fair value estimation of financial assets and liabilities
The fair value of financial assets and financial liabilities must be estimated for recognition and measurement or for disclosure purposes.
The fair value of financial instruments that are not traded in an active market is determined using valuation techniques. The Group uses estimated discounted cash flows to determine fair value.
(n) Other current assets
(i) Legal and court costs capitalisedSignificant legal and court costs associated with purchased debt and incurred subsequent to acquisition have been capitalised in recognition that it is expected beyond reasonable doubt future economic benefits will flow to the Group as a result of the expenditure being incurred.
These costs are amortised on a straight line basis over the period of their expected benefit, which is not expected to exceed twelve months.
Notes to the Financial Statementsfor the year ended 30 June 2017 (continued)
47F
or p
erso
nal u
se o
nly

1 Summary of significant accounting policies (continued)
(o) Property, plant and equipmentAll items of property, plant and equipment are initially recorded at cost at the date of acquisition, being the fair value of the consideration provided plus incidental costs directly attributable to the acquisition. Subsequent costs are included in the assets carrying amount, or recognised as a separate asset as appropriate, only when it is probable that future economic benefits associated with the item will flow to the Group, and the cost of the item can be measured reliably.
Where settlement of any part of cash consideration is deferred, the amounts payable are recorded at their present value, discounted at the rate applicable to the Company if similar borrowings were obtained from an independent financier under comparable terms and conditions.
The costs of assets constructed or internally generated by the Group, other than goodwill, include the cost of materials and direct labour. Directly attributable overheads and other incidental costs are also capitalised to the asset. Borrowing costs are capitalised to qualifying assets as set out in Note 1(s).
Expenditure, including that on internally generated assets, is only recognised as an asset when the Group controls future economic benefits as a result of the costs incurred, it is probable that those future economic benefits will eventuate, and the costs can be measured reliably. Costs attributable to feasibility and alternative approach assessments are expensed as incurred.
All assets are depreciated using the straight-line method over their estimated useful lives taking into account estimated residual values, with the exception of leased assets, which are depreciated over the shorter of the lease term and their useful lives.
Assets are depreciated or amortised from the date of acquisition or, in respect of internally constructed assets, from the time an asset is completed and held ready for use.
The estimated useful lives of property, plant and equipment for current and comparative periods are as follows:
– Plant and equipment 4-12 years
– Computer equipment 3-5 years
– Leased plant and equipment Term of Lease
The assets’ residual values and useful lives are reviewed, and adjusted if appropriate, at the end of each reporting period. When changes are made, adjustments are reflected prospectively in current and future periods only.
An asset’s carrying amount is written down immediately to its recoverable amount if the asset’s carrying amount is greater than its estimated recoverable amount (Note 1(i)).
Gains and losses on disposals are determined by comparing proceeds with carrying amount. These are included in profit or loss.
(p) Intangible assets
(i) GoodwillGoodwill is measured as described in Note 1(h). Goodwill on acquisitions of subsidiaries is included in intangible assets. Goodwill is not amortised but it is tested for impairment annually, or more frequently if events or changes in circumstances indicate that it might be impaired, and is carried at cost less accumulated impairment losses. Gains and losses on the disposal of an entity include the carrying amount of goodwill relating to the entity sold.
Goodwill is allocated to cash-generating units for the purpose of impairment testing. The allocation is made to those cash-generating units or groups of cash-generating units that are expected to benefit from the business combination in which the goodwill arose, identified according to operating segments (Note 4).
(ii) IT development and softwareCosts incurred in developing products or systems and costs incurred in acquiring software and licenses that will contribute to future period financial benefits through revenue generation and/or cost reduction are capitalised to software and systems. Costs capitalised include external direct costs of materials and service and direct payroll and payroll related costs of employees’ time spent on the project. Amortisation commences from the point at which the asset is ready for use, and is calculated on a straight-line basis over periods generally ranging from 2 to 10 years. Useful lives are reviewed at each reporting date and adjusted if appropriate.
IT development costs include only those costs directly attributable to the development phase and are only recognised following completion of technical feasibility and where the Group has an intention and ability to use the asset.
(iii) Customer contractsThe customer contracts were acquired as part of a business combination. They are recognised at their fair value at the date of acquisition and are subsequently amortised on a straight-line basis over periods ranging from 2 to 10 years.
Notes to the Financial Statementsfor the year ended 30 June 2017 (continued)
48Collection House Limited Annual Report 2017
For
per
sona
l use
onl
y

1 Summary of significant accounting policies (continued)
(p) Intangible assets (continued)
(iv) Other intangible assetsLicences and intellectual property are considered to have a definite useful life and are carried at cost less accumulated amortisation. All costs associated with the maintenance and protection of these assets are expensed in the period consumed.
(q) Trade and other payablesThese amounts represent liabilities for goods and services provided to the Group prior to the end of financial year which are unpaid. The amounts are unsecured and are usually paid within 30 days of recognition. Trade and other payables are presented as current liabilities unless payment is not due within 12 months from the reporting date.
(r) BorrowingsAll borrowings are recognised at their principal amounts subject to set off arrangements which represent the present value of future cash flows associated with servicing the debt. Where interest is payable in arrears the interest expense is accrued over the period it becomes due and it is recorded at the contracted rate as part of “Other payables”.
Where interest is paid in advance, the interest expense is recorded as a part of “Prepayments” and released over the period to maturity.
Borrowings are removed from the consolidated balance sheet when the obligation specified in the contract is discharged, cancelled or expired. The difference between the carrying amount of a financial liability that has been extinguished or transferred to another party and the consideration paid, including any non-cash assets transferred or liabilities assumed, is recognised in profit or loss as other income or finance costs.
Borrowings are classified as current liabilities unless the Group has an unconditional right to defer settlement of the liability for at least 12 months after the reporting period.
(s) Borrowing costsBorrowing costs incurred for the construction of any qualifying asset are capitalised during the period of time that is required to complete and prepare the asset for its intended use or sale. Other borrowing costs are expensed.
Borrowing costs include interest, amortisation of discounts or premiums relating to borrowings, amortisation of ancillary costs incurred in connection with arrangement of borrowings, foreign exchange losses net of any hedged amounts on borrowings, including trade creditors and lease finance charges.
Ancillary costs incurred in connection with the arrangement of borrowings are capitalised and amortised over the life of the borrowings.
(t) Provisions
(i) Make goodThe Group is required to restore the leased premises for a number of its premises to their original condition at the end of the respective lease terms. A provision has been recognised for the estimated expenditure required to remove any leasehold improvements. These costs have been capitalised as part of the cost of leasehold improvements and are amortised over the shorter of the term of the lease or the useful life of the assets.
(ii) Legal provisionsProvisions for legal claims are recognised when the Group has a present legal or constructive obligation as a result of past events, it is probable that an outflow of resources will be required to settle the obligation and the amount has been reliably estimated. Provisions are not recognised for future operating losses.
Where there are a number of similar obligations, the likelihood that an outflow will be required in settlement is determined by considering the class of obligations as a whole. A provision is recognised even if the likelihood of an outflow with respect to any one item included in the same class of obligations may be small.
(iii) Recognition and measurementProvisions are measured at the present value of management’s best estimate of the expenditure required to settle the present obligation at the end of each reporting period. The discount rate used to determine the present value is a pre-tax rate that reflects current market assessments of the time value of money and the risks specific to the liability. The increase in the provision due to the passage of time is recognised as interest expense.
Notes to the Financial Statementsfor the year ended 30 June 2017 (continued)
49F
or p
erso
nal u
se o
nly

1 Summary of significant accounting policies (continued)
(u) Employee benefits
(i) Short-term obligationsLiabilities for wages and salaries, including non-monetary benefits and annual leave expected to be settled within 12 months after the end of the period in which the employees render the related service are recognised in respect of employees’ services up to the end of the reporting period and are measured at the amounts expected to be paid when the liabilities are settled. The liability for annual leave is recognised in the provision for employee benefits. All other short-term employee benefit obligations are presented as payables.
(ii) Long-term employee benefit obligations The liability for long service leave and annual leave which is not expected to be settled within 12 months after the end of the period in which the employees render the related service is recognised in the provision for employee benefits and measured as the present value of expected future payments to be made in respect of services provided by employees up to the end of the reporting period. Consideration is given to expected future wage and salary levels, experience of employee departures and periods of service. Expected future payments are discounted using market yields at the end of the reporting period on national government bonds with terms to maturity and currency that match, as closely as possible, the estimated future cash outflows.
The obligations are presented as current liabilities in the consolidated balance sheet if the entity does not have an unconditional right to defer settlement for at least twelve months after the reporting date, regardless of when the actual settlement is expected to occur.
(iii) Superannuation PlansThe Company and other controlled entities make statutory contributions to several superannuation funds in accordance with the directions of its employees. Contributions are expensed in the period to which they relate.
(iv) Share-based paymentsShare-based compensation benefits are provided to the Chief Executive Officer via the employment agreement between the Company and the Chief Executive Officer.
Share-based compensation benefits are provided to employees other than the Chief Executive Officer via the Collection House Limited Performance Rights Plan. Further details are set out in Note 29.
The fair value of the performance rights granted under the PRP was independently determined. The fair value at grant date has been calculated using the five day volume weighted average price (VWAP). The expense is recognised over the vesting period. The expense for each relevant financial year will require an assessment at each reporting date of the probability that each performance hurdle will be achieved. This probability factor will then be multiplied by the total number of rights apportioned to each performance hurdle to determine the number used in calculating the charge to profit and loss. Further details are set out in Note 29.
(v) Termination benefitsTermination benefits are payable when employment is terminated before the normal retirement date, or when an employee accepts voluntary redundancy in exchange for these benefits. The Group recognises termination benefits when it is demonstrably committed to either terminating the employment of current employees according to a detailed formal plan without possibility of withdrawal or to providing termination benefits as a result of an offer made to encourage voluntary redundancy. Benefits falling due more than 12 months after the end of the reporting period are discounted to present value.
(v) Contributed equityOrdinary shares are classified as equity.
Incremental costs directly attributable to the issue of new shares are shown in equity as a deduction, net of tax, from the proceeds.
Where any group company purchases the Company’s equity instruments, for example as the result of a share buy-back or a share-based payment plan, the consideration paid, including any directly attributable incremental costs (net of income taxes) is deducted from equity attributable to the equity holders of Collection House Limited as treasury shares until the shares are cancelled or reissued. Where such ordinary shares are subsequently reissued, any consideration received, net of any directly attributable incremental transaction costs and the related income tax effects, is included in equity attributable to the equity holders of Collection House Limited.
(w) DividendsProvision is made for the amount of any dividend declared, being appropriately authorised and no longer at the discretion of the entity, on or before the end of the reporting period but not distributed at the end of the reporting period.
Notes to the Financial Statementsfor the year ended 30 June 2017 (continued)
50Collection House Limited Annual Report 2017
For
per
sona
l use
onl
y

1 Summary of significant accounting policies (continued)
(x) Earnings per share
(i) Basic earnings per shareBasic earnings per share is calculated by dividing:
– the profit attributable to owners of the Company, excluding any costs of servicing equity other than ordinary shares
– by the weighted average number of ordinary shares outstanding during the financial year, adjusted for bonus elements in ordinary shares issued during the year and excluding treasury shares (Note 28).
(ii) Diluted earnings per shareDiluted earnings per share adjusts the figures used in the determination of basic earnings per share to take into account:
– the after income tax effect of interest and other financing costs associated with dilutive potential ordinary shares, and
– the weighted average number of additional ordinary shares that would have been outstanding assuming the conversion of all dilutive potential ordinary shares.
(y) Goods and Services Tax (GST)Revenues, expenses and assets are recognised net of the amount of associated GST, unless the GST incurred is not recoverable from the taxation authority. In this case it is recognised as part of the cost of acquisition of the asset or as part of the expense.
Receivables and payables are stated inclusive of the amount of GST receivable or payable. The net amount of GST recoverable from, or payable to, the taxation authority is included with other receivables or payables in the consolidated balance sheet.
Cash flows are presented on a gross basis. The GST components of cash flows arising from investing or financing activities which are recoverable from, or payable to the taxation authority, are presented as operating cash flows.
(z) Rounding of amountsThe Company is of a kind referred to in ASIC Corporations Instrument 2016/191, issued by the Australian Securities and Investments Commission, relating to the ‘rounding off’ of amounts in the financial statements. Amounts in the financial statements have been rounded off in accordance with that Corporations Instrument to the nearest thousand dollars, or in certain cases, the nearest dollar.
(aa) New accounting standards and interpretations
Certain new accounting standards and interpretations have been published that are not mandatory for the 30 June 2017 reporting period and have not been early adopted by the Group. The Group’s assessment of the impact of these new standards and interpretations is set out below.
At the date of authorisation of the financial report, the following relevant Standards and Interpretations were issued but not yet effective:
(i) AASB 9 Financial Instruments (December 2014) and associated Amending Standards (applicable to annual reporting periods beginning on or after 1 January 2018)
AASB 9 addresses the classification, measurement and derecognition of financial assets and liabilities, introduces new rules for hedge accounting, and a new impairment model for financial assets.
Financial assetsThe Group does not expect the new guidance to have a significant impact on the classification and measurement of its financial assets.
Financial liabilitiesAASB 9 retains materially all of the existing requirements in AASB 139 on subsequent measurement of financial liabilities with the exception of the treatment of own credit risk relating to financial liabilities designated at fair value through profit or loss. It is anticipated, based on the current composition of the Group’s Balance sheet, that there will be no impact on the Group’s accounting for financial liabilities, as the Group has no financial liabilities designated at fair value through profit or loss. The derecognition rules have been transferred from AASB 139 Financial Instruments: Recognition and Measurement and have not been changed.
Notes to the Financial Statementsfor the year ended 30 June 2017 (continued)
51F
or p
erso
nal u
se o
nly

1 Summary of significant accounting policies (continued)
(aa) New accounting standards and interpretations (continued)
ImpairmentThe new impairment model requires the recognition of impairment provisions based on expected credit losses (ECL) rather than only incurred credit losses as is the case under AASB 139. Specifically, AASB 9 requires the Group to account for the expected credit losses from when the financial instruments are first recognised and to recognise full lifetime expected losses on a more timely basis. It applies to financial assets classified at amortised cost, debt instruments measured at FVOCI, contract assets under AASB 15 Revenue from Contracts with Customers, lease receivables, loan commitments and certain financial guarantee contracts. While the Group has not yet undertaken a detailed assessment of how its impairment provisions would be affected by the new model, it may result in an earlier recognition of credit losses.
The new standard also introduces expanded disclosure requirements and changes in presentation. These are expected to change the nature and extent of the Group’s disclosures about its financial instruments, particularly in the year of adoption of the new standard.
(ii) AASB 15 Revenue from Contracts with Customers (applicable to annual reporting periods commencing on or after 1 January 2018)
The AASB has issued a new standard for the recognition of revenue. This will replace AASB 118, which covers revenue arising from the sale of goods and the rendering of services, and AASB 111 which covers construction contracts.
The new standard is based on the principle that revenue is recognised when control of a good or service transfers to a customer.
The standard permits either a full retrospective or a modified retrospective approach for the adoption.
Management is currently assessing the effects of applying the new standard on the Group’s financial statements. The Company’s initial assessment has identified a small potential change to the recognition of commission income. However, this is not expected to be material. The Group will make more detailed assessments of the effect over the next twelve months.
(iii) AASB 16 Leases (applicable to annual reporting periods commencing on or after 1 January 2019)
AASB 16 will result in the majority of leases being recognised on balance sheet, as the distinction between operating and finance leases is removed. Under the new standard, a lessee initially recognises and measures a right-of-use asset representing its right to use the underlying asset, and a lease liability representing its obligation to make lease payments on a present value basis taking into consideration the contractual lease period and likely periods subject to optional extension. Subsequently, a leasee measures a right-of-use asset similarly to other non-financial assets and lease liabilities similarly to other financial liabilities. The only exceptions are short-term and low-value leases.
The Group has started an initial assessment of the potential impact of the new standard on its consolidated financial statements. As at the reporting date, the Group has non-cancellable operating lease commitments of $58,747,000 (see Note 24). Subject to the impact of certain transitional elections with respect to the depreciation of the right-of-use asset and amortisation of lease liability still to be quantified, the Group’s operating lease commitments of $58,747,000 is materially expected to represent the impact on adoption of the new standard. The impact to net assets is expected to be immaterial. To date, the most significant impact identified is that the Group will recognise new assets and liabilities for the operating lease agreements in place for its office premises. In addition, the nature of expenses related to those leases will now change, as AASB 16 replaces the straight-line operating lease expense with a depreciation charge for right-of-use assets and interest expense on lease liabilities. The full extent of the impact is unable to be reliably determined until closer to application date, once the mix and maturity of leases held by the Group at that point is able to be determined.
The Group does not expect to adopt the new standards before their operative date.
There are no other standards that are not yet effective and that are expected to have a material impact on the Group in the current or future reporting periods and on foreseeable future transactions.
Notes to the Financial Statementsfor the year ended 30 June 2017 (continued)
52Collection House Limited Annual Report 2017
For
per
sona
l use
onl
y

1 Summary of significant accounting policies (continued)
(ab) Parent entity financial informationThe financial information for the parent entity, Collection House Limited, disclosed in Note 26 has been prepared on the same basis as the consolidated financial statements, except as set out below.
(i) Investments in subsidiaries, associates and joint venture entities
Investments in subsidiaries, associates and joint venture entities are accounted for at cost in the financial statements of Collection House Limited. Dividends received from associates are recognised in the parent entity’s profit or loss, rather than being deducted from the carrying amount of these investments.
(ii) Tax consolidation legislationCollection House Limited and its wholly-owned Australian controlled entities have implemented the tax consolidation legislation.
The head entity, Collection House Limited, and the controlled entities in the tax consolidated group account for their own current and deferred tax amounts. These tax amounts are measured as if each entity in the tax consolidated group continues to be a stand alone taxpayer in its own right.
In addition to its own current and deferred tax amounts, Collection House Limited also recognises the current tax liabilities (or assets) and the deferred tax assets arising from unused tax losses and unused tax credits assumed from controlled entities in the tax consolidated group.
The entities have also entered into a tax funding agreement under which the wholly-owned entities fully compensate Collection House Limited for any current tax payable assumed and are compensated by Collection House Limited for any current tax receivable and deferred tax assets relating to unused tax losses or unused tax credits that are transferred to Collection House Limited under the tax consolidation legislation. The funding amounts are determined by reference to the amounts recognised in the wholly-owned entities’ financial statements.
The amounts receivable/payable under the tax funding agreement are due upon receipt of the funding advice from the head entity, which is issued as soon as practicable after the end of each financial year. The head entity may also require payment of interim funding amounts to assist with its obligations to pay tax instalments.
Assets or liabilities arising under tax funding agreements with the tax consolidated entities are recognised as current amounts receivable from or payable to other entities in the group.
Any difference between the amounts assumed and amounts receivable or payable under the tax funding agreement are recognised as a contribution to (or distribution from) wholly-owned tax consolidated entities.
2 Financial risk managementThe Group’s financial assets and liabilities consist mainly of PDLs, deposits with banks, trade and other receivables, payables and borrowings.
The Group’s activities expose it to a variety of financial risks: market risk (including currency risk and interest rate risk), credit risk and liquidity risk. The Group’s overall risk management program focuses on the unpredictability of financial markets and seeks to minimise potential adverse effects on the financial performance of the Group. The Group uses different methods to measure different types of risk to which it is exposed. These methods include sensitivity analysis in the case of interest rate and foreign exchange risks, and aging analysis for credit risk.
Risk management is carried out by the finance department under policies approved by the Audit and Risk Management Committee of the Board. Under the authority of the Board of Directors the Audit and Risk Management Committee ensures that the total risk exposure of the Group is consistent with the Business Strategy and within the risk tolerance of the Group. Regular risk reports are tabled before the Audit and Risk Management Committee.
Within this framework, the Finance team identifies, evaluates and manages financial risks in close co-operation with the Group’s operating units.
Notes to the Financial Statementsfor the year ended 30 June 2017 (continued)
53F
or p
erso
nal u
se o
nly

2 Financial risk management (continued)(a) Market riskMarket risk is the risk that changes in market prices such as foreign exchange rates and interest rates will affect the Group’s income.
(i) Foreign exchange riskThe Group operates internationally and is exposed to foreign exchange risk arising from various currency exposures, primarily with respect to the New Zealand (NZ) Dollar and the Philippine Peso. Fluctuations in either of these currencies may impact the Group’s results.
Foreign exchange risk arises from future commercial transactions and recognised assets and liabilities denominated in a currency that is not the entity’s functional currency.
SensitivityAt 30 June 2017, had the Australian Dollar weakened/strengthened by 10% against the NZ Dollar or the Philippine Peso with all other variables held constant, the impact for the year would have been immaterial to both profit for the year and equity.
(ii) Cash flow and fair value interest rate riskAs the Group has no significant interest bearing assets, the Group’s income and operating cash flows are not materially exposed to changes in market interest rates.
The Group’s main interest rate risk arises from long-term borrowings. Borrowings issued at variable rates expose the Group to cash flow interest rate risk. During 2017 and 2016, the Group borrowings at variable rates were denominated in Australian Dollars only.
Group finance facilities are a combination of overdraft and short-term commercial bill facilities, all of which are on a variable interest rate basis. In the current interest rate environment, this approach maximises available cash with minimal exposure to interest rate movements. All aspects of the financing arrangements, including interest rate structuring can be reviewed as required during the life of the facility.
The Group analyses interest rate exposure in the context of current economic conditions. Management monitors the impact on profits of specific interest rate increases, and annual budgets and ongoing forecasts are framed based upon group and market expectations of interest rate levels for the coming year.
The Board of Directors have authorised the use of interest rate swaps as a tool for managing interest rate risk within the Group. At 30 June 2017, the Group has one remaining interest rate swap arrangement, as outlined below.
On 9 February 2015, the Company confirmed an interest rate swap transaction for a notional amount of $20m at a fixed rate of 1.86% per annum effective as at 9 February 2015 and continuing until 9 February 2018.
Notes to the Financial Statementsfor the year ended 30 June 2017 (continued)
54Collection House Limited Annual Report 2017
For
per
sona
l use
onl
y

2 Financial risk management (continued)(a) Market risk (continued)As at the reporting date, the Group had the following variable rate borrowings and interest rate swap contracts outstanding:
Consolidated
30 June 2017 30 June 2016
Weighted average
interest rate%
Balance$’000
Weighted average
interest rate %
Balance$’000
Bank overdrafts and bank loans 2.7% 123,200 3.0% 118,200
Interest rate swaps (notional principal amount) 3.3% (20,000) 3.6% (95,500)
Net exposure to cash flow interest rate risk 103,200 22,700
SensitivityAt 30 June 2017, if interest rates had changed by +/- 25 basis points from the year end rates with all other variables held constant, post-tax profit for the year would have been $181,000 lower/higher (2016 - change of 25 bps: $41,000 lower/higher), mainly as a result of higher/lower interest expense from net borrowings. Other components of equity would have been $181,000 lower/higher (2016 - $41,000 lower/higher) mainly as a result of an increase/decrease in cash not required for interest payments. Other financial assets and liabilities are not interest bearing and therefore are not subject to interest rate risk.
The following table summarises the sensitivity of the Group’s financial assets and financial liabilities to interest rate risk.
Consolidated30 June 2017
Interest rate risk
–25 bps +25 bps
Carrying amount
$’000Profit$’000
Equity$’000
Profit$’000
Equity$’000
Financial liabilities 180 – – (–) (–)
Borrowings 103,200 181 181 (181) (181)
Total increase/(decrease) in financial liabilities 181 181 (181) (181)
Total increase/(decrease) 181 181 (181) (181)
Consolidated30 June 2016
Interest rate risk
–25 bps +25 bps
Carrying amount
$’000Profit$’000
Equity$’000
Profit$’000
Equity$’000
Financial liabilities 429 1 1 (1) (1)
Borrowings 22,700 40 40 (40) (40)
Total increase/(decrease) in financial liabilities 41 41 (41) (41)
Total increase/(decrease) 41 41 (41) (41)
Notes to the Financial Statementsfor the year ended 30 June 2017 (continued)
55F
or p
erso
nal u
se o
nly

2 Financial risk management (continued)(b) Credit riskCredit risk is the risk of financial loss to the Group if a customer or counterparty to a financial instrument fails to meet its contractual obligations, and arises principally from cash and cash equivalents, as well as credit exposures to clients, including outstanding receivables and committed transactions.
The carrying amount of financial assets represents the maximum credit exposure.
30 June 2017
$’000
30 June 2016
$’000
Cash and cash equivalents 1,151 8,938
Receivables 12,566 9,969
Purchased debt ledgers 283,653 265,312
Other current assets 1,225 1,108
Total financial assets 298,595 285,327
Credit risk in relation to PDLs is managed via managements’ approach in determining the initial purchase price to pay for a portfolio of debt. At acquisition, the PDL is initially recognised at fair value at a portfolio level, being the transaction price and thereafter at amortised cost, less any impairment losses. Most PDLs, by their nature are impaired on acquisition which is reflected in the fair value at acquisition. Amortised cost is measured as the present value of forecast future of cash flows using the effective interest rate method. The effective interest rate is calculated on initial recognition and reflects a constant periodic return on the carrying value of the loans.
Management continuously monitor cash flows and the carrying value of the PDLs. An impairment is assessed on a regular basis by management and is identified on a portfolio basis following evidence that the PDL is impaired. An impairment is recognised where actual performance and re-forecast future cash flows deviate to below the initial effective interest rate. During the year ended 30 June 2017, no impairment charge was recognised (30 June 2016: nil) as future cash flows remain at a rate above the initial effective interest rate. All income from the recovery of PDLs has been recognised as interest.
Ongoing credit risk is managed through the application of a valuation model, which forecasts recoverability based on the historical experience of the company based on metrics such as debt type, age, and customer status.
The Group has no significant concentrations of trade credit risk. The Group has policies in place to ensure that services are made to customers with an appropriate credit history.
The Group establishes an allowance for impairment that represents its estimate of incurred losses in respect of trade and other receivables. Refer to Note 9 for further details.
(c) Liquidity riskLiquidity risk is the risk that the Group will encounter difficulty in meeting the obligations associated with its financial liabilities that are settled by delivering cash or another financial asset.
Prudent liquidity risk management implies maintaining sufficient cash and the availability of funding through an adequate amount of committed credit facilities to meet obligations when due. Due to the dynamic nature of the underlying businesses, the Finance Team aims to maintain flexibility in funding by keeping committed credit lines available.
Management monitors rolling forecasts of the Group’s liquidity reserve (comprising the undrawn borrowing facilities below) and cash and cash equivalents on the basis of expected cash flow. Cash flows are forecast on a day-to-day basis across the Group to ensure that sufficient funds are available to meet requirements on the basis of expected cash flows In addition, the Group’s liquidity management policy involves projecting cash flows in major currencies and considering the level of liquid assets necessary to meet these, monitoring balance sheet liquidity ratios against internal and external regulatory requirements and maintaining debt financing plans.
Notes to the Financial Statementsfor the year ended 30 June 2017 (continued)
56Collection House Limited Annual Report 2017
For
per
sona
l use
onl
y

2 Financial risk management (continued)(c) Liquidity risk (continued)
Financing arrangements The Group had access to the following undrawn borrowing facilities at the end of the reporting period:
Consolidated
30 June 2017
$’000
30 June 2016
$’000
Term debt facility 1,800 6,800
Group set off 12,500 12,500
The group set off can be drawn upon at any time and the term debt option can be drawn upon within 2 days. The group set off is repayable on demand, and the term debt is repayable at the end of the term.
The facility, which was syndicated in January 2014, was subject to meeting a number of financial undertakings. The undertakings are reviewed by the Audit and Risk Management Committee each month, and are reported on to the finance provider bi-annually. All companies within the Group are required to notify the finance provider of any event of default as soon as it becomes aware of them.
In addition to the above the Group is required to keep the finance provider fully informed of relevant details of the Group as they arise.
Further details of the banking facility are set out in Note 17.
Maturities of financial liabilitiesThe table below analyses the Group’s financial liabilities into relevant maturity groupings based on the remaining period at the reporting date to the contractual maturity date. The amounts disclosed in the table are the contractual undiscounted cash flows. Balances due within 12 months equal their carrying balances, as the impact of discounting is not significant.
Contractual maturities of financial liabilitiesAt 30 June 2017
Less than 6 months
$’000
6 – 12 months
$’000
Between 1 and 2 years
$’000
Between 2 and 5 years
$’000
Over 5 years
$’000
Total contractualcash flows
$’000
Non-derivatives
Non-interest bearing 10,937 – – – – 10,937
Variable rate – 180 – 123,200 – 123,380
Total non-derivatives 10,937 180 – 123,200 – 134,317
At 30 June 2016
Less than 6 months
$’000
6 – 12 months
$’000
Between 1 and 2 years
$’000
Between 2 and 5 years
$’000
Over 5 years
$’000
Total contractualcash flows
$’000
Non-derivatives
Non-interest bearing 15,085 – – – – 15,085
Variable rate – – 429 118,200 – 118,629
Total non-derivatives 15,085 – 429 118,200 – 133,714
Notes to the Financial Statementsfor the year ended 30 June 2017 (continued)
57F
or p
erso
nal u
se o
nly

3 Critical accounting estimates and judgements
Estimates and judgements are continually evaluated and are based on historical experience and other factors, including expectations of future events that may have a financial impact on the Group and that are believed to be reasonable under the circumstances.
(a) Critical accounting estimates and assumptions
The Group makes estimates and assumptions concerning the future. The resulting accounting estimates will, by definition, seldom equal the related actual results. The estimates and assumptions that have a significant risk of causing a material adjustment to the carrying amounts of assets and liabilities within the next financial year are discussed below.
(i) Estimated impairment of goodwillAnnually the Group tests whether goodwill has suffered any impairment, in accordance with the accounting policy stated in Note 1(p). The recoverable amounts of cash generating units have been determined based on value-in-use calculations. These calculations require the use of assumptions. Refer to Note 13 for details of these assumptions and the potential impact of changes to the assumptions.
(ii) PDLsPDLs are initially recognised at fair value plus any directly attributable acquisition costs. Subsequent to initial recognition, PDLs are measured at amortised cost using the effective interest method, less any impairment losses. Management continue to monitor the performance and key estimates used in determining whether any objective evidence exists that a PDL may be impaired. This includes:
– re-forecasting expected future cash flows every six months. An impairment is recognised where actual performance and re-forecast future cash flows deviate to below the initial effective interest rate. Refer to Note 10 for further details.
– regular assessment of the estimated forecast amortisation rate applied to PDLs. For the year ended 30 June 2017, the company has estimated that PDLs amortise at a rate of 43 percent per annum (30 June 2016: 43%).
(iii) Estimated impairment of non-financial assets and intangible assets other than goodwillAnnually the Group tests whether the non-financial assets or intangible assets of the Group (other than goodwill) have suffered any impairment, in accordance with the accounting policy stated in Note 1(i). The recoverable amounts of cash generating units have been determined based on value-in-use calculations. These calculations require the use of assumptions.
(iv) Performance rightsThe Group determines the amount to be posted to the share based payments reserve based on management’s best estimate of employees meeting their performance hurdles. The value of performance rights could change if the number of employees that meet their performance hurdles differs significantly from managements estimate.
(b) Critical judgements in applying the entity’s accounting policies
(i) Employee benefitsManagement judgment is applied in determining the key assumptions used in the calculation of long service leave at balance date, including future increases in wages and salaries, future on-cost rates, discount rates, and experience of employee departures and period of service.
(ii) Useful lives of property, plant and equipment, and intangible assets other than goodwillThe Group’s management determines the estimated useful lives and related depreciation and amortisation charges for property, plant and equipment at the time of acquisition. As described in Note 1(o) useful lives are reviewed regularly throughout the year for appropriateness.
During the year, management reassessed the useful life of one of the key components of its computer software down from 15 to 10 years. This reassessment was effective from 1 July 2016, and resulted in an additional amortisation charge of $446,933 during the period to 30 June 2017.
(iii) Capitalised software development costsAn independent forensic analysis of capitalised computer software development costs was conducted during the year. This analysis, in conjunction with a detailed review undertaken by management and the Board, taking into account the strategic direction of the company, resulted in the write off of certain assets previously capitalised, and an acceleration of amortisation on certain other assets, as a result of revisions to useful life assessments. This resulted in a total write down of $2.18m for the year ended 30 June 2017.
Notes to the Financial Statementsfor the year ended 30 June 2017 (continued)
58Collection House Limited Annual Report 2017
For
per
sona
l use
onl
y

4 Segment information(a) Description of segmentsIndividual business segments are identified on the basis of grouping individual products or services subject to similar risks and returns. The business segments reported are: Collection Services and Purchased Debt Ledgers. The Group has identified its operating segments based on the internal reports that are reviewed and used by the Board of Directors (chief operating decision makers) in assessing performance and determining the allocation of resources.
The consolidated entity is organised on a global basis into the following divisions by product and service type.
Collection ServicesThe earning of commissions on the collection of debts for clients.
Purchased Debt LedgersThe collection of debts from client ledgers acquired by the Group.
All other segmentsAll other segments includes unallocated revenue and expenses, intersegment eliminations, interest, borrowings, and income tax expenses.
(b) Segment information provided to the Board
2017
Collection services
$’000
Purchased debt
ledgers$’000
All other segments
$’000Consolidated
$’000
Segment revenue
Sales to external customers 68,130 – – 68,130
Intersegment sales 346 – 149 495
Total sales revenue 68,476 – 149 68,625
Interest income – 64,794 – 64,794
Total segment revenue 68,476 64,794 149 133,419
Segment result
Segment result 10,797 28,680 (8,363) 31,114
Interest expense and borrowing costs (5,363) (5,363)
Profit before income tax 25,751
Income tax expense (8,365) (8,365)
Profit for the year 17,386
Segment assets and liabilities
Segment assets 187,455 285,521 (133,998) 338,978
Segment liabilities 29,088 133,358 (12,101) 150,345
Other segment information
Acquisitions of property, plant and equipment, intangibles and other non-current segment assets 3,912 60,914 – 64,826
Total acquisitions 64,826
Depreciation and amortisation expense 2,494 873 942 4,309
Total depreciation and amortisation 4,309
Other non-cash expenses 254 39,496 2,389 42,139
Notes to the Financial Statementsfor the year ended 30 June 2017 (continued)
59F
or p
erso
nal u
se o
nly

4 Segment information (continued)(b) Segment information provided to the Board (continued)
2016
Collection services
$’000
Purchased debt
ledgers$’000
All other segments
$’000Consolidated
$’000
Segment revenue
Sales to external customers 57,459 – – 57,459
Intersegment sales 450 – 146 596
Total sales revenue 57,909 – 146 58,055
Interest income – 74,639 – 74,639
Total segment revenue 57,909 74,639 146 132,694
Segment result
Segment result 9,001 29,297 (6,167) 32,131
Interest expense and borrowing costs (6,147) (6,147)
Profit before income tax 25,984
Income tax expense (7,422) (7,422)
Profit for the year 18,562
Segment assets and liabilities
Segment assets 164,050 267,518 (107,673) 323,895
Segment liabilities 22,830 107,049 18,683 148,562
Other segment information
Acquisitions of property, plant and equipment, intangibles and other non-current segment assets 13,182 64,166 – 77,348
Total acquisitions 77,348
Depreciation and amortisation expense 1,806 901 1,241 3,948
Total depreciation and amortisation 3,948
Other non-cash expenses 346 48,751 1,427 50,524
(c) Geographical informationThe consolidated entity operates in two main geographical areas, Australia and New Zealand.
Segment revenues from sales to external
customers Segment assets
Acquisitions of property, plant and equipment,
intangibles and other non-current segment assets
30 June2017
$’000
30 June2016
$’000
30 June2017
$’000
30 June2016
$’000
30 June2017
$’000
30 June2016
$’000
Australia 128,534 127,456 327,681 312,330 64,786 77,342
New Zealand 4,374 4,642 9,450 9,657 40 3
Philippines 15 – 1,847 1,908 – 3
132,923 132,098 338,978 323,895 64,826 77,348
Segment revenues are allocated based on the country in which the customer is located. Segment assets and capital expenditure are allocated based on where the assets are located.
Notes to the Financial Statementsfor the year ended 30 June 2017 (continued)
60Collection House Limited Annual Report 2017
For
per
sona
l use
onl
y
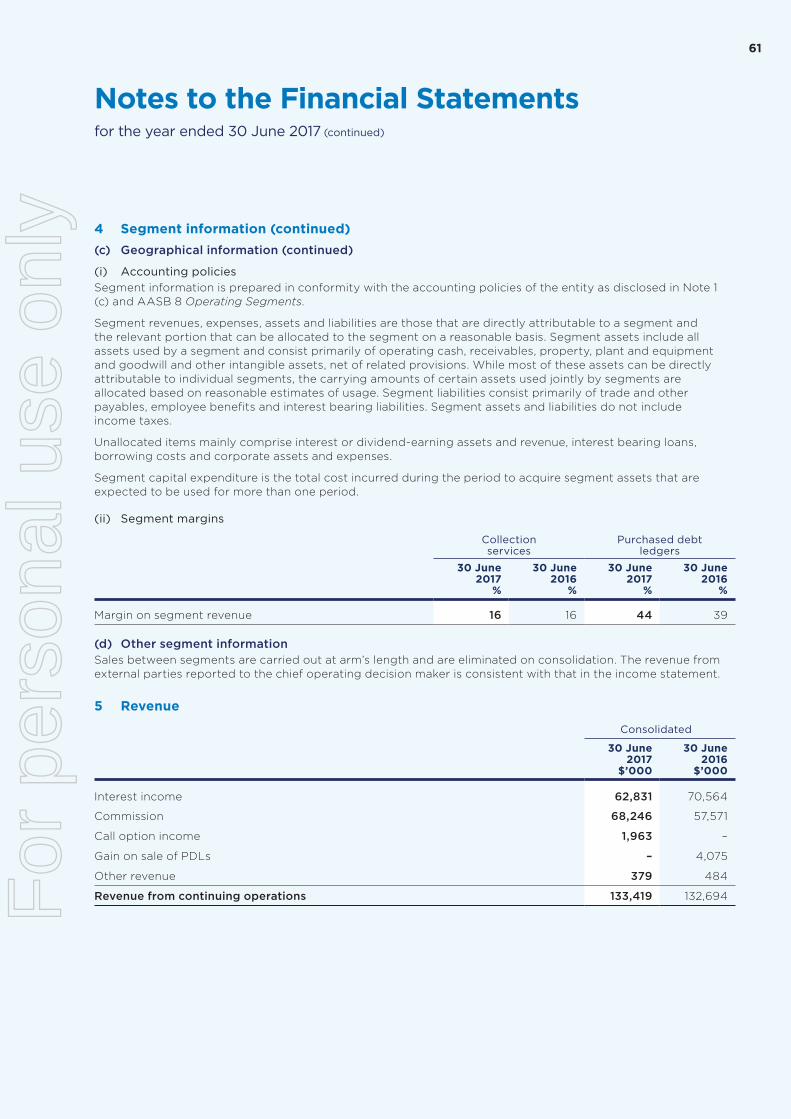
4 Segment information (continued)(c) Geographical information (continued)
(i) Accounting policiesSegment information is prepared in conformity with the accounting policies of the entity as disclosed in Note 1 (c) and AASB 8 Operating Segments.
Segment revenues, expenses, assets and liabilities are those that are directly attributable to a segment and the relevant portion that can be allocated to the segment on a reasonable basis. Segment assets include all assets used by a segment and consist primarily of operating cash, receivables, property, plant and equipment and goodwill and other intangible assets, net of related provisions. While most of these assets can be directly attributable to individual segments, the carrying amounts of certain assets used jointly by segments are allocated based on reasonable estimates of usage. Segment liabilities consist primarily of trade and other payables, employee benefits and interest bearing liabilities. Segment assets and liabilities do not include income taxes.
Unallocated items mainly comprise interest or dividend-earning assets and revenue, interest bearing loans, borrowing costs and corporate assets and expenses.
Segment capital expenditure is the total cost incurred during the period to acquire segment assets that are expected to be used for more than one period.
(ii) Segment margins
Collection services
Purchased debt ledgers
30 June 2017
%
30 June 2016
%
30 June 2017
%
30 June 2016
%
Margin on segment revenue 16 16 44 39
(d) Other segment informationSales between segments are carried out at arm’s length and are eliminated on consolidation. The revenue from external parties reported to the chief operating decision maker is consistent with that in the income statement.
5 Revenue
Consolidated
30 June2017
$’000
30 June2016
$’000
Interest income 62,831 70,564
Commission 68,246 57,571
Call option income 1,963 –
Gain on sale of PDLs – 4,075
Other revenue 379 484
Revenue from continuing operations 133,419 132,694
Notes to the Financial Statementsfor the year ended 30 June 2017 (continued)
61F
or p
erso
nal u
se o
nly

6 Expenses
Consolidated
30 June2017
$’000
30 June2016
$’000
Profit before income tax includes the following specific expenses:
Depreciation
Leasehold improvements, plant and equipment 861 2,000
Total depreciation 861 2,000
Amortisation
Computer software 2,674 1,109
Customer contracts 338 364
Business formation costs 38 38
Stamp Duty 398 437
Total amortisation 3,448 1,948
Total depreciation and amortisation 4,309 3,948
Write off of assets (included in other expenses)
Intangible assets 1,810 –
Plant and equipment (18) 778
Leasehold improvements – 942
Total write off of assets 1,792 1,720
Finance expenses
Interest and finance charges paid/payable 5,459 6,378
Amount capitalised (a) (97) (231)
Finance costs expensed 5,362 6,147
Rental expense relating to operating leases
Minimum lease payments 8,273 6,420
Total rental expense relating to operating leases 8,273 6,420
Restructuring expenses
Restructure costs 196 1,222
Total restructuring expenses 196 1,222
(a) Capitalised borrowing costsThe capitalisation rate used to determine the amount of borrowing costs to be capitalised is the weighted average interest rate applicable to the entity’s outstanding borrowings during the year, in this case 4.0% (2016 – 4.9%).
Notes to the Financial Statementsfor the year ended 30 June 2017 (continued)
62Collection House Limited Annual Report 2017
For
per
sona
l use
onl
y

7 Income tax expense
Consolidated
30 June2017
$’000
30 June2016
$’000
(a) Income tax expense
Income tax expense - Profit from continuing operations 8,365 7,422
Income tax expense is attributable to:
Current tax 8,288 9,337
Deferred tax 761 (1,476)
Under (over) provided in previous years (684) (439)
Aggregate income tax expense 8,365 7,422
Deferred income tax (revenue) expense included in income tax expense comprises:
Decrease (increase) in deferred tax assets (Note 18) 435 (1,596)
(Decrease) increase in deferred tax liabilities (Note 18) 326 120
761 (1,476)
(b) Numerical reconciliation of income tax expense to prima facie tax payable
Profit from continuing operations before income tax expense 25,751 25,984
Tax at the Australian tax rate of 30% (2016 - 30%) 7,725 7,795
Tax effect of amounts which are not deductible (taxable) in calculating taxable income:
Non-deductible expenses 31 (176)
Effect of tax rates in foreign jurisdictions (7) 21
Tax exempt (income) / loss – (196)
7,749 7,444
Adjustments for current tax of prior periods 616 (22)
616 (22)
Income tax expense 8,365 7,422
8 Cash and cash equivalents(a) Reconciliation of cash at the end of the yearThe above figures are reconciled to cash at the end of the financial year as shown in the statement of cash flows as follows:
Consolidated
30 June2017
$’000
30 June2016
$’000
Cash at bank and on hand 1,151 8,938
Balances per statement of cash flows 1,151 8,938
(b) Bank overdraft right of set-offWith effect from 1 July 2004, the Company holds a contractual right of set-off between the current overdraft balance and the cash at bank balances.
Notes to the Financial Statementsfor the year ended 30 June 2017 (continued)
63F
or p
erso
nal u
se o
nly

9 Trade and other receivables
Consolidated
30 June2017
$’000
30 June2016
$’000
Current
Net trade receivables
Trade receivables 5,804 6,043
Provision for impairment of receivables (a) (81) (93)
5,723 5,950
Accrued revenue 3,512 2,339
Other assets 414 194
Prepaid expenses 1,539 1,486
11,188 9,969
Non-current
Prepaid expenses 1,378 –
1,378 –
(a) Impaired trade receivablesAs at 30 June 2017 current trade receivables of the Group with a value of $212,000 (2016 - $164,000) were assessed as potentially impaired. The amount of the provision was $81,000 (2016 - $93,000). The individually impaired receivables mainly relate to debtors which have been outstanding for more than 90 days. It has been assessed that a portion of these receivables are expected to be recovered.
The ageing of these receivables is as follows:
Consolidated
30 June2017
$’000
30 June2016
$’000
Over 3 months 212 164
212 164
Movements in the provision for impairment of receivables are as follows:
Consolidated
30 June2017
$’000
30 June2016
$’000
At 1 July 93 96
Provision for impairment recognised during the year 81 98
Receivables written off during the year as uncollectible – (3)
Unused amount reversed (93) (98)
81 93
The creation and release of the provision for impaired receivables has been included in ‘other expenses’ in the income statement. Amounts charged to the allowance account are generally written off when there is no expectation of recovering additional cash.
Notes to the Financial Statementsfor the year ended 30 June 2017 (continued)
64Collection House Limited Annual Report 2017
For
per
sona
l use
onl
y

9 Trade and other receivables (continued)(a) Impaired trade receivables (continued)The other classes within trade and other receivables do not contain impaired assets and are not past due. Based on the credit history of these other classes, it is expected that these amounts will be received when due. The Group does not hold any collateral in relation to these receivables.
(b) Past due but not impairedAs at 30 June 2017, trade receivables of the Group of $1,786,000 (2016 - $709,000) were past due but not impaired. These relate to a number of independent customers for whom there is no recent history of default.
The ageing analysis of these trade receivables is as follows:
Consolidated
30 June2017
$’000
30 June2016
$’000
Up to 3 months 1,557 675
Over 3 months 229 34
1,786 709
10 Purchased debt ledgers
Consolidated
30 June2017
$’000
30 June2016
$’000
Current 47,334 61,071
Non-current 236,319 204,241
283,653 265,312
PDLs are measured at amortised cost using the effective interest method in accordance with AASB 9 Financial Instruments.
The effective interest rate is the implicit interest rate based on forecast collections determined in the period of acquisition of an individual PDL and equates to the Internal Rate of Return (IRR) of the forecast cash flows without any consideration of collection costs.
11 Other current assets
Consolidated
30 June2017
$’000
30 June2016
$’000
Other deposits 21 21
Legal and court costs capitalised - net 1,204 1,087
1,225 1,108
Notes to the Financial Statementsfor the year ended 30 June 2017 (continued)
65F
or p
erso
nal u
se o
nly

12 Property, plant and equipment
Plant and equipment
$’000
Leasehold improvements
$’000
Leased plant and
equipment$’000
Work-in-progress
$’000Total
$’000
At 1 July 2015
Cost or fair value 8,952 4,806 – 553 14,311
Accumulated depreciation (6,466) (2,370) – – (8,836)
Net book amount 2,486 2,436 – 553 5,475
Year ended 30 June 2016
Opening net book amount 2,486 2,436 – 553 5,475
Additions 122 1,109 – 783 2,014
Disposals (68) (1,085) – – (1,153)
Depreciation charge (655) (1,404) – – (2,059)
Transfers 444 331 – (775) –
Closing net book amount 2,329 1,387 – 561 4,277
At 30 June 2016
Cost or fair value 9,450 5,161 – 561 15,172
Accumulated depreciation (7,121) (3,774) – – (10,895)
Net book amount 2,329 1,387 – 561 4,277
Plant and equipment
$’000
Leasehold improvements
$’000
Leased plant and
equipment$’000
Work-in-progress
$’000Total
$’000
Year ended 30 June 2017
Opening net book amount 2,329 1,387 – 561 4,277
Additions 291 12 – 122 425
Disposals (696) – – – (696)
Depreciation charge (505) (356) – – (861)
Transfers 57 10 – (150) (83)
Closing net book amount 1,476 1,053 – 533 3,062
At 30 June 2017
Cost or fair value 9,115 5,183 – 533 14,831
Accumulated depreciation (7,639) (4,130) – – (11,769)
Net book amount 1,476 1,053 – 533 3,062
(a) Non-current assets pledged as securityRefer to Note 17 for information on non-current assets pledged as security by the Group.
Notes to the Financial Statementsfor the year ended 30 June 2017 (continued)
66Collection House Limited Annual Report 2017
For
per
sona
l use
onl
y
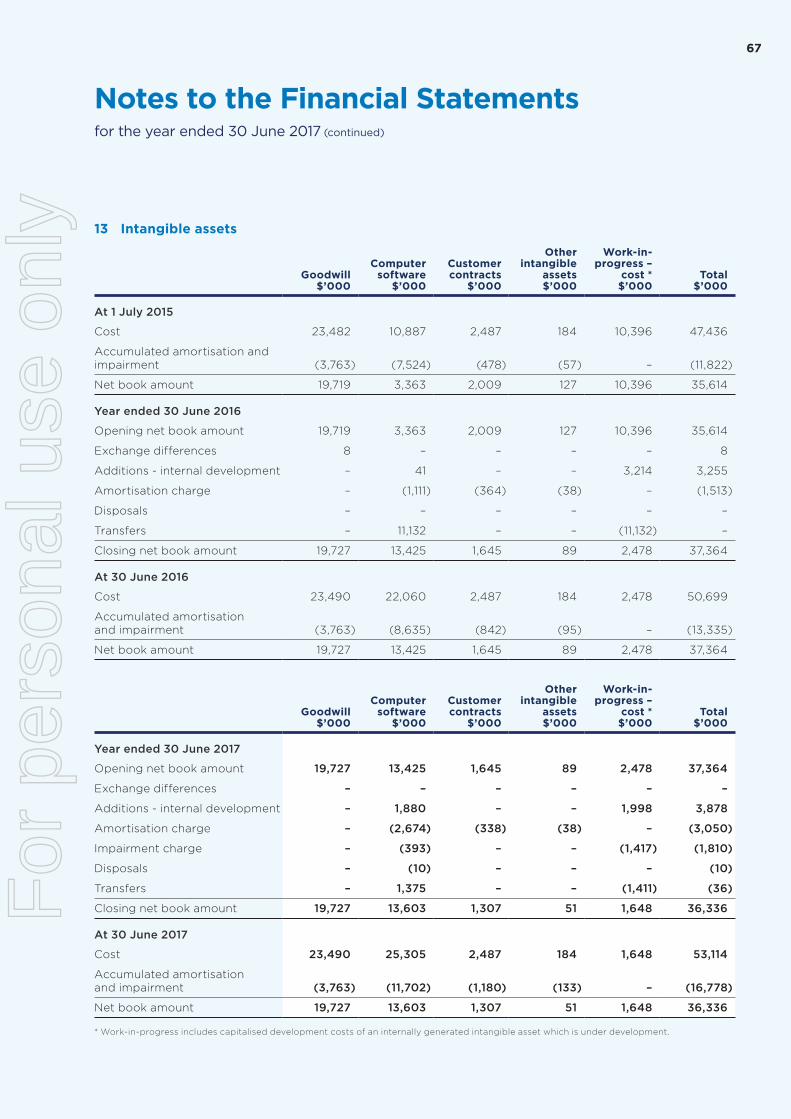
13 Intangible assets
Goodwill$’000
Computer software
$’000
Customer contracts
$’000
Other intangible
assets$’000
Work-in-progress –
cost *$’000
Total$’000
At 1 July 2015
Cost 23,482 10,887 2,487 184 10,396 47,436
Accumulated amortisation and impairment (3,763) (7,524) (478) (57) – (11,822)
Net book amount 19,719 3,363 2,009 127 10,396 35,614
Year ended 30 June 2016
Opening net book amount 19,719 3,363 2,009 127 10,396 35,614
Exchange differences 8 – – – – 8
Additions - internal development – 41 – – 3,214 3,255
Amortisation charge – (1,111) (364) (38) – (1,513)
Disposals – – – – – –
Transfers – 11,132 – – (11,132) –
Closing net book amount 19,727 13,425 1,645 89 2,478 37,364
At 30 June 2016
Cost 23,490 22,060 2,487 184 2,478 50,699
Accumulated amortisation and impairment (3,763) (8,635) (842) (95) – (13,335)
Net book amount 19,727 13,425 1,645 89 2,478 37,364
Goodwill$’000
Computer software
$’000
Customer contracts
$’000
Other intangible
assets$’000
Work-in-progress –
cost *$’000
Total$’000
Year ended 30 June 2017
Opening net book amount 19,727 13,425 1,645 89 2,478 37,364
Exchange differences – – – – – –
Additions - internal development – 1,880 – – 1,998 3,878
Amortisation charge – (2,674) (338) (38) – (3,050)
Impairment charge – (393) – – (1,417) (1,810)
Disposals – (10) – – – (10)
Transfers – 1,375 – – (1,411) (36)
Closing net book amount 19,727 13,603 1,307 51 1,648 36,336
At 30 June 2017
Cost 23,490 25,305 2,487 184 1,648 53,114
Accumulated amortisation and impairment (3,763) (11,702) (1,180) (133) – (16,778)
Net book amount 19,727 13,603 1,307 51 1,648 36,336
* Work-in-progress includes capitalised development costs of an internally generated intangible asset which is under development.
Notes to the Financial Statementsfor the year ended 30 June 2017 (continued)
67F
or p
erso
nal u
se o
nly
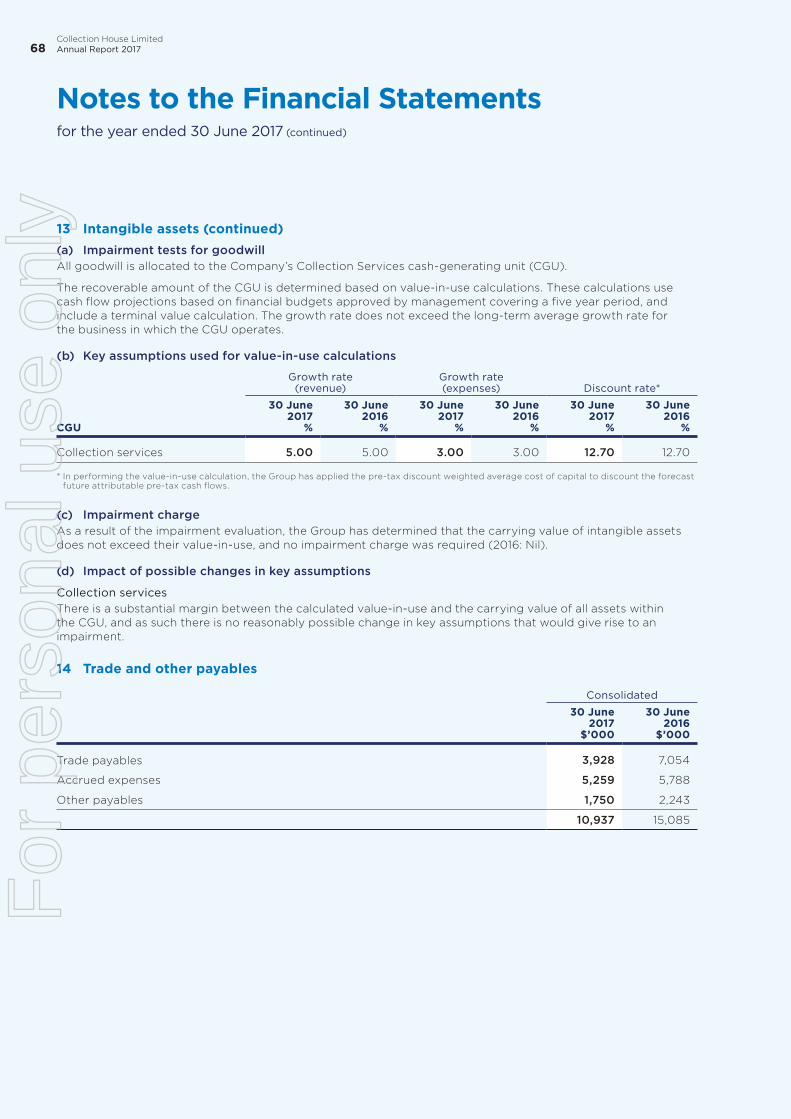
13 Intangible assets (continued)(a) Impairment tests for goodwillAll goodwill is allocated to the Company’s Collection Services cash-generating unit (CGU).
The recoverable amount of the CGU is determined based on value-in-use calculations. These calculations use cash flow projections based on financial budgets approved by management covering a five year period, and include a terminal value calculation. The growth rate does not exceed the long-term average growth rate for the business in which the CGU operates.
(b) Key assumptions used for value-in-use calculations
Growth rate (revenue)
Growth rate (expenses) Discount rate*
CGU
30 June2017
%
30 June2016
%
30 June2017
%
30 June2016
%
30 June2017
%
30 June2016
%
Collection services 5.00 5.00 3.00 3.00 12.70 12.70
* In performing the value-in-use calculation, the Group has applied the pre-tax discount weighted average cost of capital to discount the forecast future attributable pre-tax cash flows.
(c) Impairment chargeAs a result of the impairment evaluation, the Group has determined that the carrying value of intangible assets does not exceed their value-in-use, and no impairment charge was required (2016: Nil).
(d) Impact of possible changes in key assumptions
Collection servicesThere is a substantial margin between the calculated value-in-use and the carrying value of all assets within the CGU, and as such there is no reasonably possible change in key assumptions that would give rise to an impairment.
14 Trade and other payables
Consolidated
30 June2017
$’000
30 June2016
$’000
Trade payables 3,928 7,054
Accrued expenses 5,259 5,788
Other payables 1,750 2,243
10,937 15,085
Notes to the Financial Statementsfor the year ended 30 June 2017 (continued)
68Collection House Limited Annual Report 2017
For
per
sona
l use
onl
y
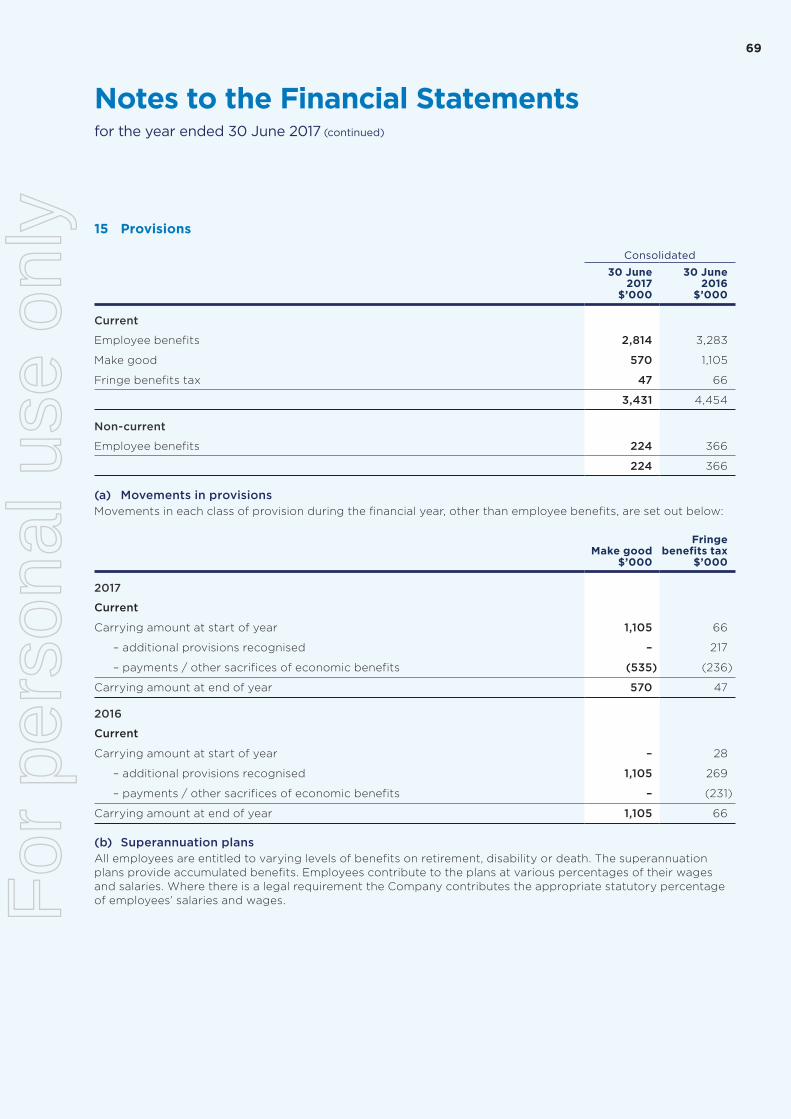
15 Provisions
Consolidated
30 June2017
$’000
30 June2016
$’000
Current
Employee benefits 2,814 3,283
Make good 570 1,105
Fringe benefits tax 47 66
3,431 4,454
Non-current
Employee benefits 224 366
224 366
(a) Movements in provisionsMovements in each class of provision during the financial year, other than employee benefits, are set out below:
Make good$’000
Fringe benefits tax
$’000
2017
Current
Carrying amount at start of year 1,105 66
– additional provisions recognised – 217
– payments / other sacrifices of economic benefits (535) (236)
Carrying amount at end of year 570 47
2016
Current
Carrying amount at start of year – 28
– additional provisions recognised 1,105 269
– payments / other sacrifices of economic benefits – (231)
Carrying amount at end of year 1,105 66
(b) Superannuation plansAll employees are entitled to varying levels of benefits on retirement, disability or death. The superannuation plans provide accumulated benefits. Employees contribute to the plans at various percentages of their wages and salaries. Where there is a legal requirement the Company contributes the appropriate statutory percentage of employees’ salaries and wages.
Notes to the Financial Statementsfor the year ended 30 June 2017 (continued)
69F
or p
erso
nal u
se o
nly
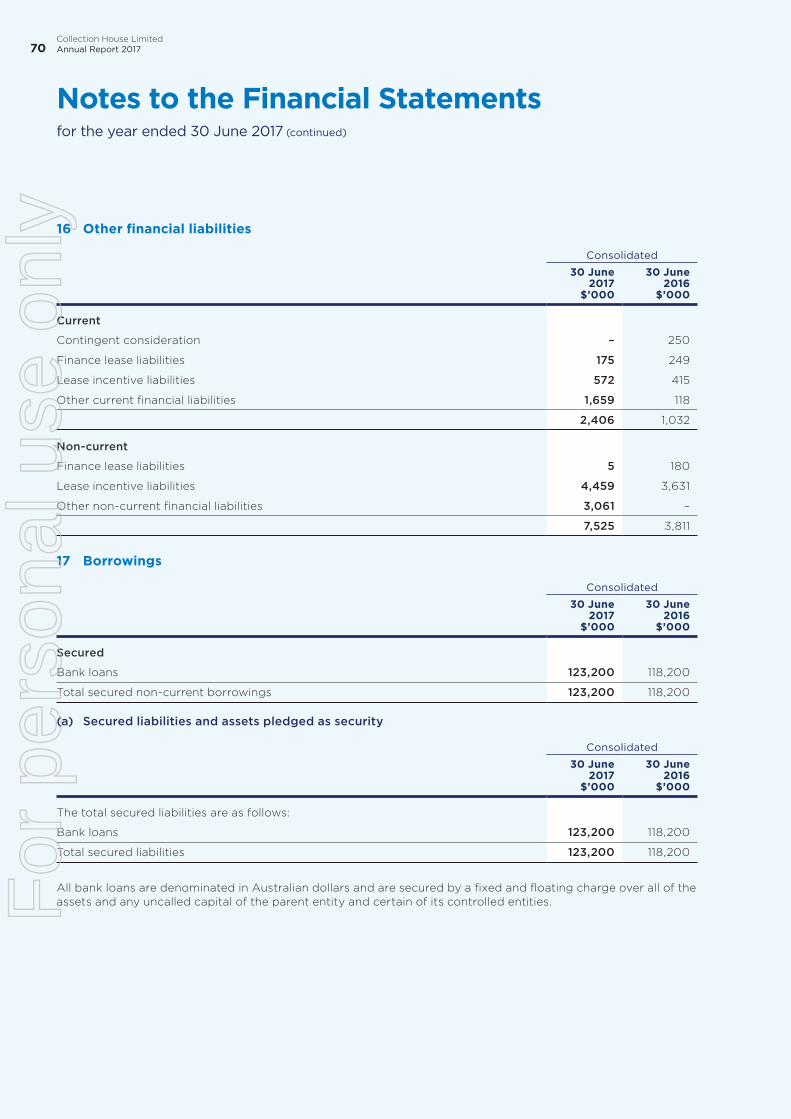
16 Other financial liabilities
Consolidated
30 June2017
$’000
30 June2016
$’000
Current
Contingent consideration – 250
Finance lease liabilities 175 249
Lease incentive liabilities 572 415
Other current financial liabilities 1,659 118
2,406 1,032
Non-current
Finance lease liabilities 5 180
Lease incentive liabilities 4,459 3,631
Other non-current financial liabilities 3,061 –
7,525 3,811
17 Borrowings
Consolidated
30 June2017
$’000
30 June2016
$’000
Secured
Bank loans 123,200 118,200
Total secured non-current borrowings 123,200 118,200
(a) Secured liabilities and assets pledged as security
Consolidated
30 June2017
$’000
30 June2016
$’000
The total secured liabilities are as follows:
Bank loans 123,200 118,200
Total secured liabilities 123,200 118,200
All bank loans are denominated in Australian dollars and are secured by a fixed and floating charge over all of the assets and any uncalled capital of the parent entity and certain of its controlled entities.
Notes to the Financial Statementsfor the year ended 30 June 2017 (continued)
70Collection House Limited Annual Report 2017
For
per
sona
l use
onl
y

17 Borrowings (continued)(a) Secured liabilities and assets pledged as security (continued)The carrying amounts of assets pledged as security for borrowings are:
Consolidated
Notes
30 June2017
$’000
30 June2016
$’000
Current
Floating charge
Cash and cash equivalents 8 1,151 8,938
Receivables 9 11,188 9,969
Purchased debt ledgers 10 47,334 61,071
Total current assets pledged as security 59,673 79,978
Non-current
Floating charge
Receivables 9 1,378 –
Purchased debt ledgers 10 236,319 204,241
Plant and equipment 12 3,062 4,277
Total non-current assets pledged as security 240,759 208,518
Total assets pledged as security 300,432 288,496
(b) Fair valueThe carrying amounts and fair values of borrowings at the end of reporting period are:
30 June 2017 30 June 2016
Group
Carrying amount
$’000Fair value
$’000
Carrying amount
$’000Fair value
$’000
On-balance sheet (i)
Non-traded financial liabilities
Bank loans 123,200 123,200 118,200 118,200
123,200 123,200 118,200 118,200
As noted, none of the classes of liabilities are readily traded on organised markets in standardised form.
(i) On balance sheetThe fair value of current borrowings equals their carrying amount. The facility is structured as a series of loan instruments which are repriced on a regular basis with terms of less than six months, and the impact of discounting on such instruments is not material. The rolling nature of the loan instruments is designed to provide the Group with maximum flexibility within the overall facility, however the overall facility is classified as non-current, as it is not due for renewal until January 2020.
(c) Risk exposuresInformation about the Group’s exposure to interest rate and foreign currency changes is provided in Note 2.
For an analysis of the sensitivity of borrowings to interest rate risk and foreign exchange risk refer to Note 2.
Notes to the Financial Statementsfor the year ended 30 June 2017 (continued)
71F
or p
erso
nal u
se o
nly

18 Deferred tax balances
Consolidated
30 June2017
$’000
30 June2016
$’000
(a) Deferred tax assets
The balance comprises temporary differences attributable to:
Tax losses 190 506
Provisions and employee benefits 1,185 1,403
Lease incentives 1,509 1,214
Accruals 47 88
Unearned revenue – 29
Doubtful debts 24 28
Future deductible windup costs 2 3
Other 14 19
2,971 3,290
Set-off of deferred tax liabilities pursuant to set off provisions (b) (2,971) (3,290)
Net deferred tax assets – –
Movements:
Opening balance at 1 July 3,290 1,694
Credited / (charged) to the income statement (Note 7) (319) 1,596
Closing balance at 30 June 2,971 3,290
Movements – Consolidated
Tax losses$’000
Provisions and
employee benefits
$’000
Lease incentive
$’000Accruals
$’000
Unearned revenue
$’000
Doubtful debts$’000
Future deductible
windup costs
$’000Other$’000
Total$’000
At 30 June 2015 238 1,356 – 53 – 29 6 12 1,694
- to profit or loss 268 47 1,214 35 29 (1) (3) 7 1,596
At 30 June 2016 506 1,403 1,214 88 29 28 3 19 3,290
Movements – Consolidated
Tax losses$’000
Provisions and
employee benefits
$’000
Lease incentive
$’000Accruals
$’000
Unearned revenue
$’000
Doubtful debts$’000
Future deductible
windup costs
$’000Other$’000
Total$’000
At 30 June 2016 506 1,403 1,214 88 29 28 3 19 3,290
- to profit or loss (316) (218) 295 (41) (29) (4) (1) (5) (319)
At 30 June 2017 190 1,185 1,509 47 – 24 2 14 2,971
Notes to the Financial Statementsfor the year ended 30 June 2017 (continued)
72Collection House Limited Annual Report 2017
For
per
sona
l use
onl
y

18 Deferred tax balances (continued)
Consolidated
30 June2017
$’000
30 June2016
$’000
(b) Deferred tax liabilities
The balance comprises temporary differences attributable to:
Property, plant and equipment 3,451 3,044
Purchased debt 653 605
Prepayments 6 6
Other – 13
4,110 3,668
Total deferred tax liabilities 4,110 3,668
Set-off of deferred tax liabilities pursuant to set-off provisions (a) (2,971) (3,290)
Net deferred tax liabilities 1,139 378
Consolidated
30 June2017
$’000
30 June2016
$’000
Movements:
Opening balance at 1 July 3,668 3,548
Charged / (credited) to the income statement (Note 7) 442 120
Closing balance at 30 June 4,110 3,668
Movements – Consolidated
Property, plant and
equipment$’000
Purchased debt
$’000Prepayments
$’000Other$’000
Total$’000
At 30 June 2015 2,956 577 4 11 3,548
- to profit or loss 88 28 2 2 120
At 30 June 2016 3,044 605 6 13 3,668
Movements – Consolidated
Property, plant and
equipment$’000
Purchased debt
$’000Prepayments
$’000Other$’000
Total$’000
At 30 June 2016 3,044 605 6 13 3,668
- to profit or loss 407 48 – (13) 442
At 30 June 2017 3,451 653 6 – 4,110
Notes to the Financial Statementsfor the year ended 30 June 2017 (continued)
73F
or p
erso
nal u
se o
nly

19 Contributed equity
Company Company
2017Shares
2016Shares
2017$’000
2016$’000
(a) Share capital
Ordinary shares – fully paid 135,889,764 134,489,172 112,614 111,006
Treasury shares (412,833) – (535) –
Total contributed equity 135,476,931 134,489,172 112,079 111,006
(b) Movements in ordinary share capitalIssues of ordinary shares during the year
Date DetailsNumber of
shares $’000
1 July 2015 Opening balance 131,199,651 105,307
1 September 2015 Performance Rights Plan 1,019,670 2,546
16 October 2015 Dividend reinvestment plan issues 789,260 1,729
11 December 2015 Performance Rights Plan 64,666 100
1 April 2016 Dividend reinvestment plan issues 1,415,925 1,349
Less: Transaction costs arising on share issues – (25)
30 June 2016 Closing balance 134,489,172 111,006
1 July 2016 Opening balance 134,489,172 111,006
21 October 2016 Dividend reinvestment plan issues 1,400,592 1,617
Less: Transaction costs arising on share issues – (9)
30 June 2017 Closing balance 135,889,764 112,614
(c) Ordinary sharesOrdinary shares entitle the holder to participate in dividends and the proceeds on winding up of the company in proportion to the number of and amounts paid on the shares held.
On a show of hands every holder of ordinary shares present at a meeting in person or by proxy, is entitled to one vote, and upon a poll each share is entitled to one vote.
Ordinary shares have no par value and the Company does not have a limited amount of authorised capital.
(d) Treasury sharesWhen share capital recognised as equity is repurchased or held by employee share plans and subject to vesting conditions, the amount of the consideration paid, including directly attributable costs, is recognised as a deduction from equity. When treasury shares are sold or reissued subsequently, the amount received is recognised as an increase in equity.
(e) Dividend reinvestment planThe Company has established a dividend reinvestment plan under which holders of ordinary shares may elect to have all or part of their dividend entitlements satisfied by the issue of new ordinary shares rather than by being paid in cash. Shares are issued under the plan at a 5% discount to the market price.
Notes to the Financial Statementsfor the year ended 30 June 2017 (continued)
74Collection House Limited Annual Report 2017
For
per
sona
l use
onl
y

19 Contributed equity (continued)(f) Employee share schemeInformation relating to the employee share scheme, including details of shares issued under the scheme, is set out in Note 29.
(g) Performance rightsInformation relating to the performance rights plan adopted as a means of rewarding and incentivising key employees, including details of rights issued during the financial year, is set out in Note 29.
(h) Capital risk managementThe Group’s objectives when managing capital are to safeguard their ability to continue as a going concern, and to provide adequate returns for shareholders and benefits for other stakeholders.
“Capital” includes all funding provided under the Group’s funding facility (net of cash balances for which a right of offset is held) plus equity as shown in the balance sheet.
In order to maintain or adjust the capital structure, the Group may:
– draw down or repay debt funding;
– adjust the amount of dividends paid to shareholders;
– negotiate new or additional facilities or cancel existing ones;
– return capital to shareholders or issue new shares or
– sell assets to reduce debt.
The Group manages capital to ensure that the goals of continuing as a going concern and the provision of acceptable stakeholder returns are met.
Arrangements with the Group’s financiers are in place to ensure that there is sufficient undrawn credit available to meet unforeseen circumstances should they arise. Financing facilities are renegotiated on a regular basis to ensure that they are sufficient for the Group’s projected growth plus a buffer. As far as possible, asset purchases are funded from operational cash flow, allowing undrawn balances to be maintained. Cash is monitored on a daily basis to ensure that immediate and short term requirements can be met. By maintaining a buffer of undrawn funds, the Company reduces the risk of liquidity and going concern issues.
Management of the mix between debt and equity impacts the Group’s Cost of Capital and hence ability to provide returns to stakeholders, primarily the funding institutions and shareholders. The Group maintains its debt-to-equity mix in accordance with its immediate needs and forecasts at any point in time. Effective management of the capital structure maximises profit and hence franked dividend returns to shareholders.
When additional funding is required, it is sourced from either debt or equity, depending upon management’s evaluation as to which is the most appropriate at that point in time.
The financing facility includes all funding provided by the Group’s main bankers. Details of financing facilities are set out in Note 2.
Quantitative analyses are conducted by management using contributed equity balances shown above together with the drawn and undrawn loan balances disclosed in Note 2.
As part of the financing facility, the Company is required to monitor a number of financial indicators as specified by the financiers. The Group monitors the indicators on a monthly basis and reports to the funding providers every six months. The Group has comfortably met these covenants at all times during the year.
This strategy was followed during both the 2017 and 2016 financial years.
Notes to the Financial Statementsfor the year ended 30 June 2017 (continued)
75F
or p
erso
nal u
se o
nly

20 Reserves and retained earnings(a) Reserves
Consolidated
30 June2017
$’000
30 June2016
$’000
Share-based payments reserve 773 191
Foreign currency translation reserve (1,388) (1,220)
(615) (1,029)
Consolidated
30 June2017
$’000
30 June2016
$’000
Movements:
Share-based payments reserve
Balance 1 July 191 3,429
Rights expense 582 (3,238)
Balance 30 June 773 191
Consolidated
30 June2017
$’000
30 June2016
$’000
Movements:
Foreign currency translation reserve
Balance 1 July (1,220) (1,241)
Currency translation differences arising during the year (168) 21
Balance 30 June (1,388) (1,220)
(b) Retained earningsMovements in retained earnings were as follows:
Consolidated
30 June2017
$’000
30 June2016
$’000
Balance 1 July 70,328 63,170
Net profit for the year 17,386 18,562
Dividends (10,545) (11,404)
Balance 30 June 77,169 70,328
Notes to the Financial Statementsfor the year ended 30 June 2017 (continued)
76Collection House Limited Annual Report 2017
For
per
sona
l use
onl
y

20 Reserves and retained earnings (continued)(c) Nature and purpose of reserves
(i) Share-based payments reserveThe share based payments reserve is used to recognise the fair value of performance rights issued to employees that have not yet vested, or those that have vested at year end but not yet been issued as shares.
(ii) Foreign currency translation reserveExchange differences arising on translation of the foreign operations are recognised in other comprehensive income as described in Note 1(d) and accumulated in a separate reserve within equity. The cumulative amount is reclassified to profit or loss when the net investment is disposed of.
21 DividendsConsolidated
30 June 2017
$’000
30 June 2016
$’000
(a) Ordinary shares
Fully franked final dividend for the year ended 30 June 2016 – 3.9 cents per share (2015 – 4.7 cents) 5,245 6,214
Fully franked interim dividend for the year ended 30 June 2017 – 3.9 cents per share (2016 – 3.9 cents) 5,300 5,190
10,545 11,404
Dividends paid in cash or satisfied by the issue of shares under the dividend reinvestment plan during the years ended 30 June 2016 and 2015 were as follows:
Paid in cash 8,928 8,326
Satisfied under the Dividend Reinvestment Plan 1,617 3,078
10,545 11,404
(b) Dividends not recognised at the end of the reporting period
In addition to the above dividends, since year end the directors have recommended the payment of a fully franked final dividend of 3.9 cents per fully paid ordinary share (2016 – 3.9 cents, fully franked). The aggregate amount of the proposed dividend expected to be paid on 27 October 2017 out of retained profits and a positive net balance sheet at 30 June 2017, but not recognised as a liability at year end, is 5,300 5,245
5,300 5,245
(c) Franked dividendsThe franked portions of the final dividends recommended after 30 June 2017 will be franked out of existing franking credits or out of franking credits arising from the payment of income tax in the year ending 30 June 2018.
The financial effect of this dividend has not been brought to account in the financial statements for the year ended 30 June 2017 and will be recognised in subsequent financial reports.
Consolidated30 June
2017 $’000
30 June 2016
$’000
Franking credits available for subsequent financial years based on a tax rate of 30% (2016 – 30%) 37,375 34,404
37,375 34,404
Notes to the Financial Statementsfor the year ended 30 June 2017 (continued)
77F
or p
erso
nal u
se o
nly

21 Dividends (continued)(c) Franked dividends (continued)The above amounts represent the balance of the franking account as at the end of the reporting period, adjusted for:
(a) franking credits that will arise from the payment of the amount of the provision for income tax;
(b) franking debits that will arise from the payment of dividends recognised as a liability at the reporting date;
(c) franking credits that will arise from the receipt of dividends recognised as receivables at the reporting date; and
(d) franking credits that may be prevented from being distributed in subsequent financial years.
The consolidated amounts include franking credits that would be available to the parent entity if distributable profits of subsidiaries were paid as dividends.
22 Remuneration of auditorsDuring the year the following fees were paid or payable for services provided by the auditor of the parent entity, its related practices and non-related audit firms:
Consolidated
30 June2017
$
30 June2016
$
Audit and review services
(a) Auditors of the Company – KPMG
Audit and review of the financial statements 212,400 166,989
Other regulatory audit services 70,700 42,750
Total auditors’ remuneration 283,100 209,739
(b) Other auditors
Audit and review of the financial statements 3,794 3,729
Other regulatory audit services – 27,100
Total auditors’ remuneration 3,794 30,829
Other services
Auditors of the Company – KPMG
In relation to accounting advice 32,800 –
Review of CreditCollect acquisition earn out calculation – 3,500
In relation to taxation services 145,500 112,000
In relation to information technology services – 49,467
178,300 164,967
Notes to the Financial Statementsfor the year ended 30 June 2017 (continued)
78Collection House Limited Annual Report 2017
For
per
sona
l use
onl
y

23 Contingencies(a) Contingent liabilitiesThe Group had contingent liabilities at 30 June 2017 in respect of:
ClaimsThere were no claims of a material nature during the relevant period.
Guarantees(a) Bank Guarantees (secured) exist in respect of satisfactory contract performance in the normal course of
business for the Group amounting to $6,203,295 (2016: $8,076,875). During the period, the Group replaced Bank Guarantees and obtained additional Bank Guarantees to secure our continued performance in the normal course of business resulting in the decrease.
(b) Guarantees and Indemnities (secured) given by the Company and certain of its subsidiaries in support of the existing Syndicated Loan Facility provided by Westpac Banking Corporation and Commonwealth Bank of Australia, are currently in place.
Paragraphs (a) and (b) above are secured by a Fixed and Floating charge over the assets of the Company and certain of its subsidiaries of the Group and may give rise to liabilities in the Group, if the associates do not meet their respective obligations under the terms of the contracts, subject to the guarantees.
No material losses are anticipated in respect of any of the above contingent liabilities.
24 Commitments(a) Capital commitmentsCapital expenditure contracted for in relation to purchased debt commitments at the reporting date but not recognised as liabilities is as follows:
Consolidated
30 June2017
$’000
30 June2016
$’000
Within one year 36,347 16,525
Later than one year, but not later than five years 5,000 –
41,347 16,525
(b) Non-cancellable operating leasesThe Group leases its offices under non-cancellable operating leases expiring at various times during the next eleven years. The leases have varying terms, escalation clauses and renewal rights. On renewal, the terms of the leases are renegotiated.
Consolidated
30 June2017
$’000
30 June2016
$’000
Commitments for minimum lease payments in relation to non-cancellable operating leases are payable as follows:
Within one year 7,087 6,608
Later than one year but not later than five years 25,468 25,098
Later than five years 26,192 31,220
58,747 62,926
Notes to the Financial Statementsfor the year ended 30 June 2017 (continued)
79F
or p
erso
nal u
se o
nly
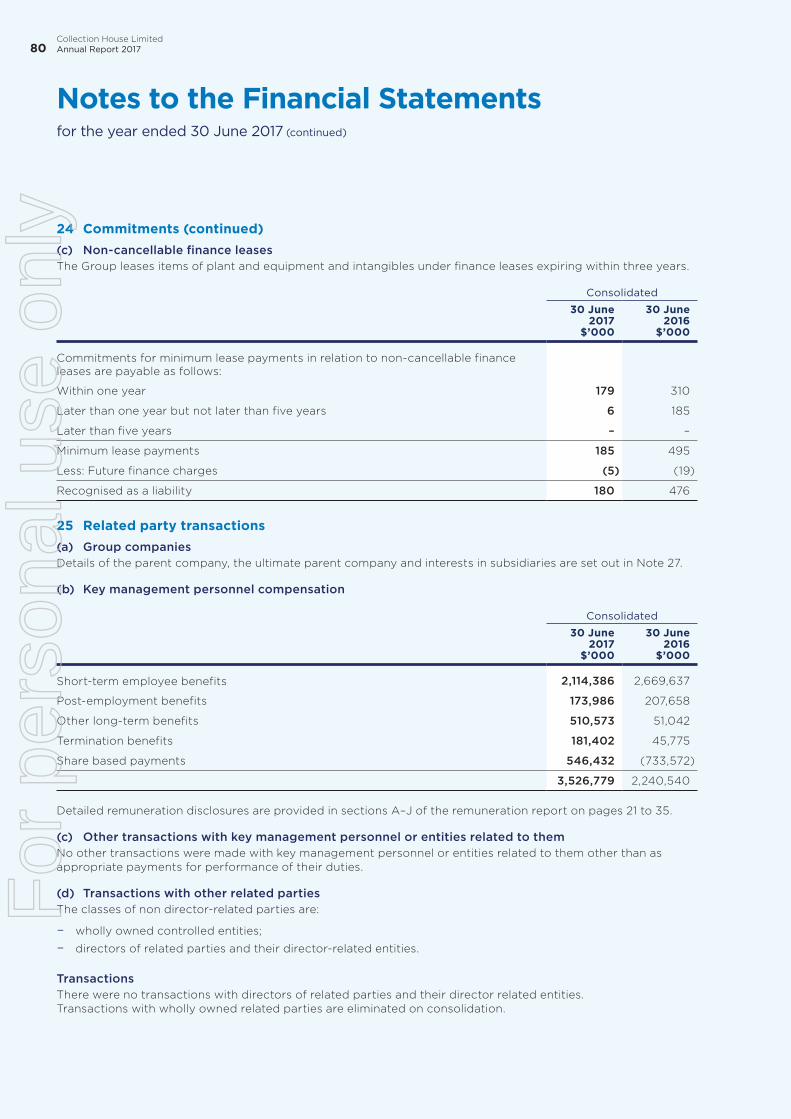
24 Commitments (continued)(c) Non-cancellable finance leasesThe Group leases items of plant and equipment and intangibles under finance leases expiring within three years.
Consolidated
30 June2017
$’000
30 June2016
$’000
Commitments for minimum lease payments in relation to non-cancellable finance leases are payable as follows:
Within one year 179 310
Later than one year but not later than five years 6 185
Later than five years – –
Minimum lease payments 185 495
Less: Future finance charges (5) (19)
Recognised as a liability 180 476
25 Related party transactions(a) Group companiesDetails of the parent company, the ultimate parent company and interests in subsidiaries are set out in Note 27.
(b) Key management personnel compensation
Consolidated
30 June2017
$’000
30 June2016
$’000
Short-term employee benefits 2,114,386 2,669,637
Post-employment benefits 173,986 207,658
Other long-term benefits 510,573 51,042
Termination benefits 181,402 45,775
Share based payments 546,432 (733,572)
3,526,779 2,240,540
Detailed remuneration disclosures are provided in sections A–J of the remuneration report on pages 21 to 35.
(c) Other transactions with key management personnel or entities related to themNo other transactions were made with key management personnel or entities related to them other than as appropriate payments for performance of their duties.
(d) Transactions with other related partiesThe classes of non director-related parties are:
– wholly owned controlled entities;
– directors of related parties and their director-related entities.
TransactionsThere were no transactions with directors of related parties and their director related entities. Transactions with wholly owned related parties are eliminated on consolidation.
Notes to the Financial Statementsfor the year ended 30 June 2017 (continued)
80Collection House Limited Annual Report 2017
For
per
sona
l use
onl
y

26 Parent entity financial information(a) Summary financial informationThe individual financial statements for the parent entity show the following aggregate amounts:
Company
30 June2017
$’000
30 June2016
$’000
Balance sheet
Current assets 6,962 12,320
Non-current assets 312,596 288,689
Total assets 319,558 301,009
Current liabilities 18,393 22,790
Non-current liabilities 162,267 148,236
Total liabilities 180,660 171,026
Shareholders’ equity
Contributed equity 112,079 111,006
Reserves 773 191
Retained earnings 26,045 18,786
Capital and reserves attributable to owners of Collection House Limited 138,897 129,983
Profit or loss for the year 17,804 14,487
Total comprehensive income 17,804 14,487
(b) Guarantees entered into by the parent entityThe parent entity has entered into guarantees with certain of its subsidiaries as set out in Note 23.
No liability was recognised by the parent entity or the consolidated entity in relation to this guarantee, as the fair value is immaterial.
(c) Contingent liabilities of the parent entityRefer to Note 23 for contingent liabilities entered into by the parent entity. For information about guarantees given by the parent entity, please see above.
Notes to the Financial Statementsfor the year ended 30 June 2017 (continued)
81F
or p
erso
nal u
se o
nly

27 SubsidiariesThe consolidated financial statements incorporate the assets, liabilities and results of the following subsidiaries in accordance with the accounting policy described in Note 1(b):
2017%
2016%
Parent and Ultimate Parent company:
Collection House Limited
Controlled entities - incorporated in Australia
Safe Horizons Pty Ltd (formerly Cashflow Accelerator Pty Ltd) 100 100
ThinkMe Finance Pty Ltd 100 100
Collective Learning and Development Pty Ltd 100 100
CLH Legal Group Pty Ltd 100 100
Lion Finance Pty Ltd 100 100
Midstate CreditCollect Pty Ltd 100 100
CLH Business Services Pty Ltd 100 –
Collection House Limited Employee Share Plan Trust 100 –
Controlled entities - incorporated in New Zealand
Collection House (NZ) Limited 100 100
Lion Finance Limited 100 100
Controlled entities - incorporated in Philippines
Collection House International BPO, Inc * 100 100
* Collection House International BPO, Inc started up on 10 May 2012 and commenced business operations on 1 April 2013. While Collection House Limited holds legal and beneficial ownership of 9,995 issued shares in the subsidiary, it has beneficial ownership of 5 issued shares in the subsidiary, held on trust for Collection House Limited by each of the five appointed directors of the subsidiary, in accordance with Philippines law, representing all of the issued shares in the subsidiary currently.
28 Earnings per share
Consolidated
30 June2017
Cents
30 June2016
Cents
(a) Basic earnings per share
From continuing operations attributable to the ordinary equity holders of the Company 12.8 14.0
Total basic earnings per share attributable to the ordinary equity holders of the Company 12.8 14.0
(b) Diluted earnings per share
From continuing operations attributable to the ordinary equity holders of the Company 12.6 13.9
Total diluted earnings per share attributable to the ordinary equity holders of the Company 12.6 13.9
Notes to the Financial Statementsfor the year ended 30 June 2017 (continued)
82Collection House Limited Annual Report 2017
For
per
sona
l use
onl
y

28 Earnings per share (continued)(c) Reconciliations of earnings used in calculating earnings per share
Consolidated
30 June2017
$’000
30 June2016
$’000
Basic earnings per share
Profit attributable to the ordinary equity holders of the Company used in calculating basic earnings per share 17,386 18,562
17,386 18,562
Diluted earnings per share
Profit attributable to the ordinary equity holders of the Company used in calculating diluted earnings per share 17,386 18,562
17,386 18,562
(d) Weighted average number of shares used as the denominator
Consolidated
30 June2017
Number
30 June2016
Number
Weighted average number of ordinary shares used as the denominator in calculating basic earnings per share 135,339,625 133,024,624
Adjustments for calculation of diluted earnings per share:
Performance Rights 2,443,598 232,363
Weighted average number of ordinary shares and potential ordinary shares used as the denominator in calculating diluted earnings per share 137,783,223 133,256,987
(e) Information concerning the classification of securities
(i) Performance rightsPerformance rights issued to employees under the Performance Rights Plan (PRP) are considered to be potential ordinary shares and have been included at the probability rate of 100% in the determination of diluted earnings per share to the extent to which they are dilutive. The performance rights have not been included in the determination of basic earnings per share. Details relating to the performance rights are set out in Note 29.
29 Share-based payments(a) Performance Rights PlanIn line with the executive remuneration framework, the Board approved and adopted the Performance Rights Plan (PRP), effective on and from 1 July 2012, as a means of rewarding and incentivising its key employees.
The PRP was extended to the then Chief Executive Officer (CEO), and to eligible employees.
Future performance rights may be issued by the Board pursuant to the PRP. The board determines the value of shares granted based on the individual’s performance. Future performance rights may vest at the discretion of the Board, subject to not only individual service conditions being met, but also, Company performance hurdles being achieved.
Notes to the Financial Statementsfor the year ended 30 June 2017 (continued)
83F
or p
erso
nal u
se o
nly

29 Share-based payments (continued)(a) Performance Rights Plan (continued)During the reporting period ending 30 June 2017, 3,621,810 unlisted performance rights were issued to a number of eligible employees pursuant to the PRP. A summary of these performance rights is identified below as PR2017.
PR2017
Effective date 1 July 2016
Earliest possible Vesting date The performance rights cannot vest earlier than the Test Date(1)
Performance hurdles based on the satisfactory achievement of performance conditions approved by the Board
Performance Conditions % off Pool
Compound EPS growth over performance period of:
0% to 5.00% Nil
5.01% to 7.50% 33.33%
7.51% to 10% 66.66%
More than 10.01% 100%
Performance between 5% to 10% will be assessed on a sliding scale basis up to a maximum of 3,621,810 shares.
Exercise conditions and Vesting Date
The Performance Rights Test Date will be 30 June 2019 (Test Date) after which, the Board will determine whether or not the Performance Hurdles have been achieved.
As soon as reasonably practicable after each Test Date applicable to any Performance Period, the Board shall determine in respect of each eligible employee, as at that Test Date:
(a) whether, and to what extent, the Performance Hurdles applicable as at the Test Date have been satisfied;
(b) the number of Performance Rights (if any) that will become Vested Performance Rights as at the Test Date; and
(c) the number of Performance Rights (if any) that will lapse as a result of the non-satisfaction of Performance Hurdles as at the Test Date,
and shall provide written notification to each eligible employee as to that determination.
Exercise price Nil
Expiry date 30 September 2019
A Performance Right lapses, to the extent it has not been exercised, on the earlier to occur of:
(a) where Performance Hurdles have not been satisfied as at the relevant Test Date;
(b) if an eligible employee’s employment with the Company or Related Body Corporate ceases before the Vesting Date;
(c) the day the Board makes a determination that the Performance Rights lapses because of breach, fraud or dishonesty; and
(d) 30 September 2019.
5 Day volume weighted average Share price
$1.2945
(1) Test Date: the date at which assessment against the Performance Conditions are made by the Board. For PR2017, the Test Date will be 30 June 2019.
Notes to the Financial Statementsfor the year ended 30 June 2017 (continued)
84Collection House Limited Annual Report 2017
For
per
sona
l use
onl
y
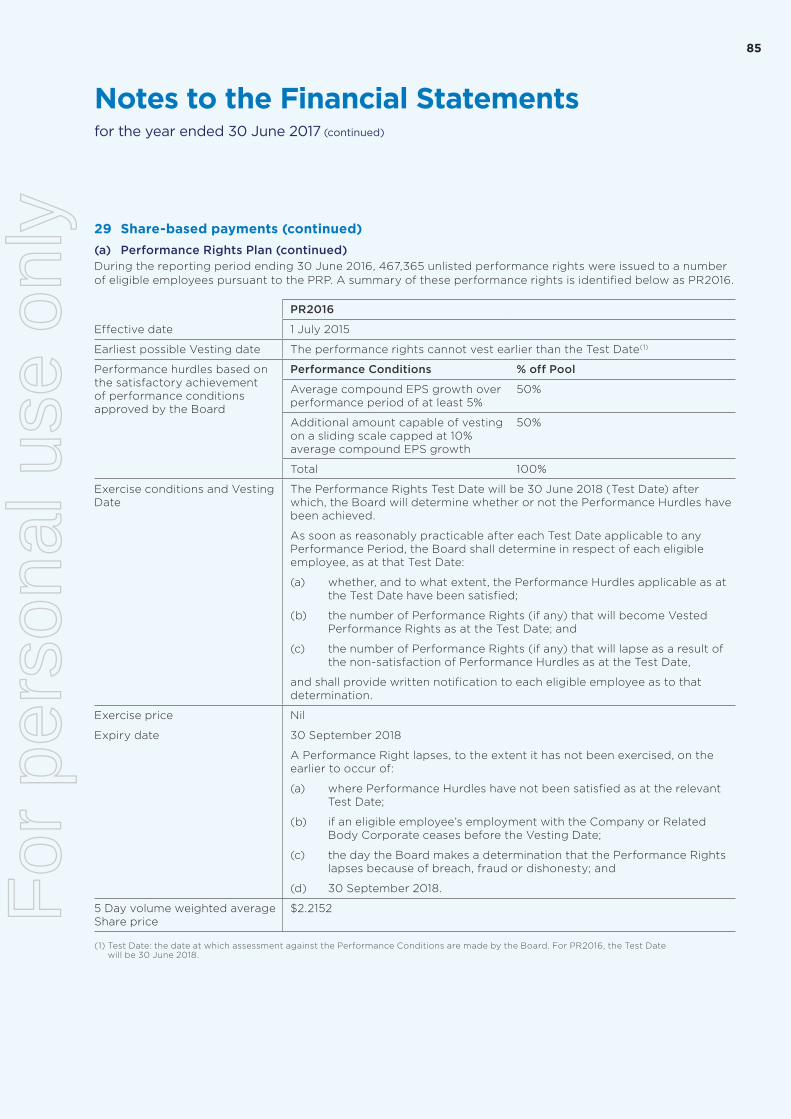
29 Share-based payments (continued)(a) Performance Rights Plan (continued)During the reporting period ending 30 June 2016, 467,365 unlisted performance rights were issued to a number of eligible employees pursuant to the PRP. A summary of these performance rights is identified below as PR2016.
PR2016
Effective date 1 July 2015
Earliest possible Vesting date The performance rights cannot vest earlier than the Test Date(1)
Performance hurdles based on the satisfactory achievement of performance conditions approved by the Board
Performance Conditions % off Pool
Average compound EPS growth over performance period of at least 5%
50%
Additional amount capable of vesting on a sliding scale capped at 10% average compound EPS growth
50%
Total 100%
Exercise conditions and Vesting Date
The Performance Rights Test Date will be 30 June 2018 (Test Date) after which, the Board will determine whether or not the Performance Hurdles have been achieved.
As soon as reasonably practicable after each Test Date applicable to any Performance Period, the Board shall determine in respect of each eligible employee, as at that Test Date:
(a) whether, and to what extent, the Performance Hurdles applicable as at the Test Date have been satisfied;
(b) the number of Performance Rights (if any) that will become Vested Performance Rights as at the Test Date; and
(c) the number of Performance Rights (if any) that will lapse as a result of the non-satisfaction of Performance Hurdles as at the Test Date,
and shall provide written notification to each eligible employee as to that determination.
Exercise price Nil
Expiry date 30 September 2018
A Performance Right lapses, to the extent it has not been exercised, on the earlier to occur of:
(a) where Performance Hurdles have not been satisfied as at the relevant Test Date;
(b) if an eligible employee’s employment with the Company or Related Body Corporate ceases before the Vesting Date;
(c) the day the Board makes a determination that the Performance Rights lapses because of breach, fraud or dishonesty; and
(d) 30 September 2018.
5 Day volume weighted average Share price
$2.2152
(1) Test Date: the date at which assessment against the Performance Conditions are made by the Board. For PR2016, the Test Date will be 30 June 2018.
Notes to the Financial Statementsfor the year ended 30 June 2017 (continued)
85F
or p
erso
nal u
se o
nly

29 Share-based payments (continued)(a) Performance Rights Plan (continued)During the reporting period ending 30 June 2015, 680,184 unlisted performance rights were issued to a number of eligible employees pursuant to the PRP. A summary of these performance rights is identified below as PR2015.
PR2015
Effective date 1 July 2014
Earliest possible Vesting date The performance rights cannot vest earlier than the Test Date(1)
Performance hurdles based on the satisfactory achievement of confidential performance conditions approved by the Board
Performance Conditions % off Pool
Average ROE 10%
Debt/Debt + Equity 10%
EPS Base 30%
EPS Stretch 50%
Total 100%
Exercise conditions and Vesting Date
The Performance Rights Test Date will be 30 June 2017 (Test Date) after which, the Board will determine whether or not the Performance Hurdles have been achieved.
As soon as reasonably practicable after each Test Date applicable to any Performance Period, the Board shall determine in respect of each eligible employee, as at that Test Date:
(a) whether, and to what extent, the Performance Hurdles applicable as at the Test Date have been satisfied;
(b) the number of Performance Rights (if any) that will become Vested Performance Rights as at the Test Date; and
(c) the number of Performance Rights (if any) that will lapse as a result of the non-satisfaction of Performance Hurdles as at the Test Date,
and shall provide written notification to each eligible employee as to that determination.
Exercise price Nil
Expiry date 30 September 2017
A Performance Right lapses, to the extent it has not been exercised, on the earlier to occur of:
(a) where Performance Hurdles have not been satisfied as at the relevant Test Date;
(b) if an eligible employee’s employment with the Company or Related Body Corporate ceases before the Vesting Date;
(c) the day the Board makes a determination that the Performance Rights lapses because of breach, fraud or dishonesty; and
(d) 30 September 2017.
5 Day volume weighted average Share price
$1.8515
(1) Test Date: the date at which assessment against the Performance Conditions are made by the Board. For PR2015, the Test Date will be 30 June 2017.
Notes to the Financial Statementsfor the year ended 30 June 2017 (continued)
86Collection House Limited Annual Report 2017
For
per
sona
l use
onl
y

29 Share-based payments (continued)(a) Performance Rights Plan (continued)During the reporting period ending 30 June 2014, 839,828 unlisted performance rights were issued to a number of eligible employees pursuant to the PRP. A summary of these performance rights is identified below as PR2014.
PR2014
Effective date 1 July 2013
Earliest possible Vesting date The performance rights cannot vest earlier than the Test Date(2)
Performance hurdles based on the satisfactory achievement of confidential performance conditions approved by the Board
Performance Conditions % off Pool
Average ROE 25%
Debt/Debt + Equity 15%
EPS Base 30%
EPS Stretch 30%
Total 100%
Exercise conditions and Vesting Date
The Performance Rights Test Date will be 30 June 2016 (Test Date) after which, the Board will determine whether or not the Performance Hurdles have been achieved.
As soon as reasonably practicable after each Test Date applicable to any Performance Period, the Board shall determine in respect of each eligible employee, as at that Test Date:
(a) whether, and to what extent, the Performance Hurdles applicable as at the Test Date have been satisfied;
(b) the number of Performance Rights (if any) that will become Vested Performance Rights as at the Test Date; and
(c) the number of Performance Rights (if any) that will lapse as a result of the non-satisfaction of Performance Hurdles as at the Test Date,
and shall provide written notification to each eligible employee as to that determination.
Exercise price Nil
Expiry date 30 September 2016
A Performance Right lapses, to the extent it has not been exercised, on the earlier to occur of:
(m) where Performance Hurdles have not been satisfied as at the relevant Test Date;
(b) if an eligible employee’s employment with the Company or Related Body Corporate ceases before the Vesting Date;
(c) the day the Board makes a determination that the Performance Rights lapses because of breach, fraud or dishonesty; and
(d) 30 September 2016.
5 Day volume weighted average Share price
$1.5479
(2) Test Date: the date at which assessment against the Performance Conditions are made by the Board. For PR2014, the Test Date will be 30 June 2016.
Notes to the Financial Statementsfor the year ended 30 June 2017 (continued)
87F
or p
erso
nal u
se o
nly

29 Share-based payments (continued)(a) Performance Rights Plan (continued)Set out below are summaries of rights issued under the plan:
Effective Date Expiry date
Exercise price
Balance at start of
the year
Granted during
the year
Vested during
the year
Lapsed during
the year
Balance at end of the year
Vested and
issuable at end of the year
Number Number Number Number Number Number
Company – 2017
1 July 2014 30 September 2017 Nil 556,010 – – 556,010 – –
1 July 2015 30 September 2018 Nil 380,452 – – 380,452 – –
1 July 2016 30 September 2019 Nil – 3,621,810 – 361,153 3,260,657 –
Total 936,462 3,621,810 – 1,297,615 3,260,657 –
Effective Date Expiry date
Exercise price
Balance at start of
the year
Granted during
the year
Vested during
the year
Lapsed during
the year
Balance at end of the year
Vested and
issuable at end of the year
Number Number Number Number Number Number
Company – 2016
1 July 2013 30 September 2016 Nil 816,733 – 64,666 752,067 – –
1 July 2014 30 September 2017 Nil 680,184 – – 124,174 556,010 –
1 July 2015 30 September 2018 Nil – 467,365 – 86,913 380,452 –
Total 1,496,917 467,365 64,666 963,154 936,462 –
Fair Value of Performance Rights IssuedThe assessed fair value at issue date of all performance rights is set out above. The fair value at issue date is determined based on the five day volume weighted average share price prior to issue date.
(b) Deferred Shares – CEO short-term incentive schemeUnder the Group’s short-term incentive (STI) scheme, the CEO is entitled to receive 60% of his annual STI achieved in cash, and 40% in the form of rights to deferred shares of Collection House Limited, issuable at the end of his contract period, subject to him being employed by the Group at the end of the contract period. The rights will automatically convert into one ordinary share each on vesting, at an exercise price of nil. The CEO will not receive dividends, or be entitled to vote in relation to the deferred shares during the vesting period. If the CEO ceases to be employed by the Group within this period, the rights will be forfeited, except in limited circumstances that may be approved by the Board at their discretion.
The number of rights to be granted is determined based on the amount of the STI awarded divided by the weighted average price at which the Company’s shares are traded on the Australian Securities Exchange over the five trading days preceding the date of issue.
The maximum value of deferred shares issuable in relation to 30 June 2017 was $132,707. The Board has determined that the CEO is entitled to 80% of the maximum value, and shares to the value of $106,400 will be issuable at the end of the CEO’s employment contract.
Notes to the Financial Statementsfor the year ended 30 June 2017 (continued)
88Collection House Limited Annual Report 2017
For
per
sona
l use
onl
y
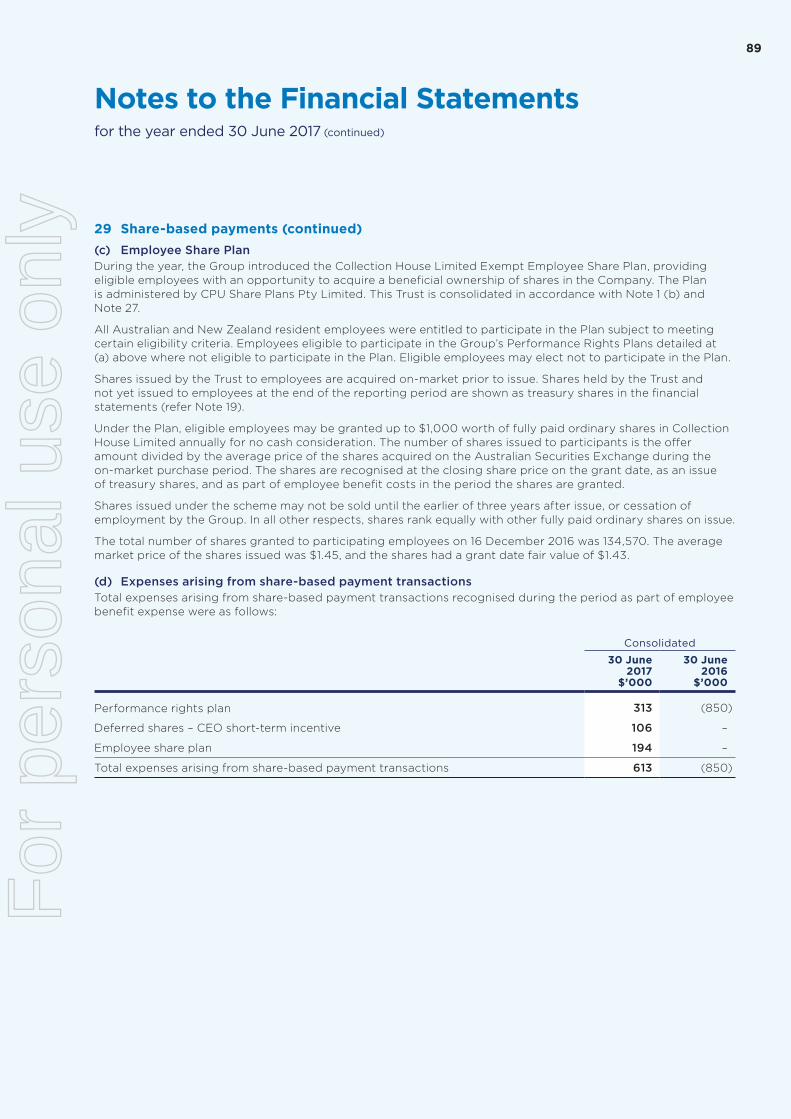
29 Share-based payments (continued)(c) Employee Share PlanDuring the year, the Group introduced the Collection House Limited Exempt Employee Share Plan, providing eligible employees with an opportunity to acquire a beneficial ownership of shares in the Company. The Plan is administered by CPU Share Plans Pty Limited. This Trust is consolidated in accordance with Note 1 (b) and Note 27.
All Australian and New Zealand resident employees were entitled to participate in the Plan subject to meeting certain eligibility criteria. Employees eligible to participate in the Group’s Performance Rights Plans detailed at (a) above where not eligible to participate in the Plan. Eligible employees may elect not to participate in the Plan.
Shares issued by the Trust to employees are acquired on-market prior to issue. Shares held by the Trust and not yet issued to employees at the end of the reporting period are shown as treasury shares in the financial statements (refer Note 19).
Under the Plan, eligible employees may be granted up to $1,000 worth of fully paid ordinary shares in Collection House Limited annually for no cash consideration. The number of shares issued to participants is the offer amount divided by the average price of the shares acquired on the Australian Securities Exchange during the on-market purchase period. The shares are recognised at the closing share price on the grant date, as an issue of treasury shares, and as part of employee benefit costs in the period the shares are granted.
Shares issued under the scheme may not be sold until the earlier of three years after issue, or cessation of employment by the Group. In all other respects, shares rank equally with other fully paid ordinary shares on issue.
The total number of shares granted to participating employees on 16 December 2016 was 134,570. The average market price of the shares issued was $1.45, and the shares had a grant date fair value of $1.43.
(d) Expenses arising from share-based payment transactionsTotal expenses arising from share-based payment transactions recognised during the period as part of employee benefit expense were as follows:
Consolidated
30 June2017
$’000
30 June2016
$’000
Performance rights plan 313 (850)
Deferred shares – CEO short-term incentive 106 –
Employee share plan 194 –
Total expenses arising from share-based payment transactions 613 (850)
Notes to the Financial Statementsfor the year ended 30 June 2017 (continued)
89F
or p
erso
nal u
se o
nly
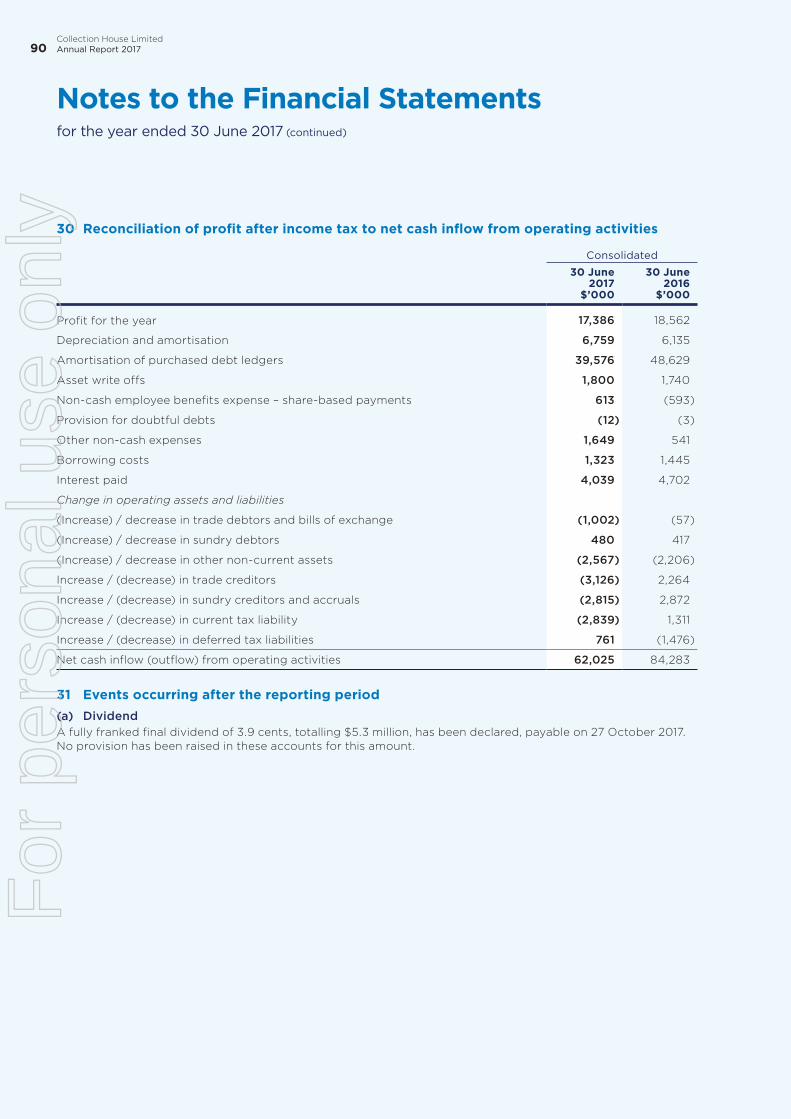
30 Reconciliation of profit after income tax to net cash inflow from operating activities
Consolidated
30 June2017
$’000
30 June2016
$’000
Profit for the year 17,386 18,562
Depreciation and amortisation 6,759 6,135
Amortisation of purchased debt ledgers 39,576 48,629
Asset write offs 1,800 1,740
Non-cash employee benefits expense – share-based payments 613 (593)
Provision for doubtful debts (12) (3)
Other non-cash expenses 1,649 541
Borrowing costs 1,323 1,445
Interest paid 4,039 4,702
Change in operating assets and liabilities
(Increase) / decrease in trade debtors and bills of exchange (1,002) (57)
(Increase) / decrease in sundry debtors 480 417
(Increase) / decrease in other non-current assets (2,567) (2,206)
Increase / (decrease) in trade creditors (3,126) 2,264
Increase / (decrease) in sundry creditors and accruals (2,815) 2,872
Increase / (decrease) in current tax liability (2,839) 1,311
Increase / (decrease) in deferred tax liabilities 761 (1,476)
Net cash inflow (outflow) from operating activities 62,025 84,283
31 Events occurring after the reporting period(a) DividendA fully franked final dividend of 3.9 cents, totalling $5.3 million, has been declared, payable on 27 October 2017. No provision has been raised in these accounts for this amount.
Notes to the Financial Statementsfor the year ended 30 June 2017 (continued)
90Collection House Limited Annual Report 2017
For
per
sona
l use
onl
y

In the directors’ opinion:(a) the financial statements and notes set out on pages 38 to 90 are in accordance with the Corporations Act
2001, including:
(i) complying with Accounting Standards, the Corporations Regulations 2001 and other mandatory professional reporting requirements, and
(ii) giving a true and fair view of the consolidated entity’s financial position as at 30 June 2017 and of its performance for the financial year ended on that date,
(b) there are reasonable grounds to believe that the company will be able to pay its debts as and when they become due and payable, and
Note 1(a) confirms that the financial statements also comply with International Financial Reporting Standards as issued by the International Accounting Standards Board.
The directors have been given the declarations by the chief executive officer and chief financial officer required by section 295A of the Corporations Act 2001.
This declaration is made in accordance with a resolution of the directors.
Kerry DalyChairman
Brisbane 24 August 2017
Directors’ Declarationfor the year ended 30 June 2017
91F
or p
erso
nal u
se o
nly

Independent Auditor’s Reportto the members
Liability limited by a scheme approved under Professional Standards Legislation.
KPMG, an Australian partnership and a member firm of the KPMG network of independent member firms affiliated with KPMG International Cooperative (“KPMG International”), a Swiss entity.
Independent Auditor’s Report
To the shareholders of Collection House Limited
Report on the audit of the Financial Report
Opinion
We have audited the Financial Report of Collection House Limited (the Company).
In our opinion, the accompanying Financial Report of the Company is in accordance with the Corporations Act 2001, including:
• giving a true and fair view of the Group's financial position as at 30 June 2017 and of its financial performance for the year ended on that date; and
• complying with Australian Accounting Standards and the Corporations Regulations 2001.
The Financial Report comprises:
• Consolidated balance sheet as at 30 June 2017
• Consolidated income statement, Consolidated statement of comprehensive income, Consolidated statement of changes in equity, and Consolidated statement of cash flows for the year then ended
• Notes including a summary of significant accounting policies
• Directors' Declaration.
The Group consists of the Company and the entities it controlled at the year end or from time to time during the financial year.
Basis for opinion
We conducted our audit in accordance with Australian Auditing Standards. We believe that the audit evidence we have obtained is sufficient and appropriate to provide a basis for our opinion.
Our responsibilities under those standards are further described in the Auditor’s responsibilities for the audit of the Financial Report section of our report.
We are independent of the Group in accordance with the Corporations Act 2001 and the ethical requirements of the Accounting Professional and Ethical Standards Board’s APES 110 Code of Ethics for Professional Accountants (the Code) that are relevant to our audit of the Financial Report in Australia. We have fulfilled our other ethical responsibilities in accordance with the Code.
92Collection House Limited Annual Report 2017
For
per
sona
l use
onl
y

Independent Auditor’s Reportto the members (continued)
Key Audit Matters
The Key Audit Matters we identified are:
• Value of the Purchased Debt Ledger portfolio
• Value of intangible computer software
Key Audit Matters are those matters that, in our professional judgement, were of most significance in our audit of the Financial Report of the current period.
These matters were addressed in the context of our audit of the Financial Report as a whole, and in forming our opinion thereon, and we do not provide a separate opinion on these matters.
Value of the Purchased Debt Ledger portfolio ($283,653,000)
Refer to Note 10 – Purchased Debt Ledgers
The key audit matter How the matter was addressed in our audit
The value of Purchase Debt Ledgers (PDLs) are considered a key audit matter due to:
• the significance of the PDLs to the Company’s financial position.
• the complexity of the PDL impairment model utilised by the Company to assess the carrying value of the PDL portfolio at 30 June 2017 and the appropriateness of the rate at which the PDL principal and interest is recognised (the “amortisation rate”).
• the high degree of uncertainty that is inherent when auditing estimates based on future events. Of particular risk to us auditing the value of PDLs is the long-term nature of the underlying debt receivables (“principal”) in the PDL and Management’s assumptions of when expected cash flows will be recovered from customers, the (“amortisation rate”) and implicit interest rate (“effective interest rate”), combined with the inability of the Company to control factors that may lead to changes in the ultimate amount expected to be recovered.
• the judgments we needed to apply when considering the accuracy of the PDL impairment model estimates, including auditing Management’s assumptions supporting model inputs.
The model is key to determining whether there are any indicators of impairment. As the PDLs are recognised at amortised cost, if the fair value
Working with our valuation specialists, our audit procedures included:
• Challenging assumptions used by management in calculating the value of the PDL portfolio, including reviewing model integrity with a view to identifying areas of management bias that may further focus our work. Our challenge of key assumptions was based on:
– the accuracy of previous estimates applied by Management in the PDL model, including debt collection forecasting, effective interest rate, amortisation rate, and estimated PDL life, when compared to actual historical data;
– analysing key estimates to identify unusual ratios and trends compared to historical, current and forecast economic conditions;
– analysing the effective interest rate applied by the Company through recalculating the effective interest rate of a selection of PDLs;
– performing substantive audit procedures including ratio analysis and stress testing the amortisation rate and forecast collection estimates applied by Management;
• For a sample of PDLs, agreeing their
93F
or p
erso
nal u
se o
nly

Independent Auditor’s Reportto the members (continued)
is materially less than the carrying value of the PDL, a provision is required under AASB 139 Financial Instruments: Recognition and Measurement. The PDL valuation model incorporated inherently subjective inputs such as the following specific recoverability characteristics of PDLs:
• age and classification type of debt (i.e utilities, credit card, personal loan).
• any repayment or arrangement plan agreed with customers.
• internally developed historical debt collection statistics, effective interest rate, discount rate, amortisation rate and any planned changes in the future amortization rate.
• future collection estimates generated using a combination of both internal and external information.
• estimated PDL life.
We involved our valuation specialists and senior team members with the assessment of this Key Audit Matter.
classification type to the underlying documentation obtained by the Company when the PDL was purchased.
• Testing key internal controls in the debt collection process, including the collection call centre process and related information technology system controls.
Value of intangible computer software ($13,603,000) and work-in-progress ($1,648,000)
Refer to Note 13 – Intangible Assets
The key audit matter How the matter was addressed in our audit
The valuation of Software is a key audit matter due to the:
– Significance of Software carried on the balance sheet
– Significance of Software write off’s $1,810,000 and an accelerated amortisation charge of $374,000 during the year.
– Reassessment of useful life of the Group’s major operating software platform Controller 5 (“C5”) from 15 years to 10 years during the year.
– Increased focus of the Board and Senior Management during the year on the valuation of capitalised Software.
– Nature of Software carried on the balance sheet which comprises predominantly in-
Our audit procedures included:
• Evaluating the Group’s accounting policy to recognise and capitalise software development costs using the criteria in accounting standards.
• Testing a sample of internal controls to ensure the Group’s compliance with the accounting policy. This included testing Management’s review and authorisation of internal and external costs to be capitalised to an in-house software development project.
• Testing a sample of the costs capitalised to ensure the Group’s compliance with the accounting policy and challenging management on the nature and
94Collection House Limited Annual Report 2017
For
per
sona
l use
onl
y
Independent Auditor’s Reportto the members (continued)
house developed Software. Auditing in- house developed software requires a greater level of audit effort to evaluate the Group’s application of the requirements of accounting standard AASB 138 Intangible Assets. We focused on the following significant assumptions applied by the Group in estimating the value of in-house developed Software to ensure compliance with accounting standards:
– Capitalisation of appropriate and relevant costs – The Group’s estimation of the value of intangible computer software is based on actual costs incurred which comprise both external costs and internal staff salary costs. In capitalising these costs, the Group has performed an analysis to determine that the resulting computer software meets the definition of an Intangible asset in accordance with the accounting standards. This assessment is subjective in nature. We specifically focused on the realisation of future economic benefits and the assumptions and methodologies used in recording and capitalising of staff salaries.
Assessment of the software’s expected useful life – After development, the computer software is ‘in-use’, the Group estimates the useful life of the computer software and amortises it over this period. This assessment is based on the intended use of the asset. This can be judgemental and dependent upon future events, including advances in technology. We focused on the evidence for the intended use. We looked for consistency of this with the application of the useful life period, the utilisation of the computer software, and the analysis of impairment indicators performed by the Group
appropriateness of those costs. This included testing costs capitalised back to supporting documents, such as payroll records for employee wages and invoices for external costs.
• Challenging the appropriateness of the remaining useful lives of software developments through enquiry and review of management’s strategies to determine their future application and usage.
• Reviewing and assessing the findings of internal and external reviews performed over the software capitalisation process.
• Assessing the adequacy of the Group’s disclosures in relation to Software costs and the current year accelerated amortisation charges and write-offs.
95F
or p
erso
nal u
se o
nly

Independent Auditor’s Reportto the members (continued)
Other Information
Other Information is financial and non-financial information in Collection House Limited’s annual reporting which is provided in addition to the Financial Report and the Auditor’s Report. The Directors are responsible for the Other Information.
The Other Information we obtained prior to the date of this Auditor’s Report was the Directors’ Report, including Remuneration Report.
Our opinion on the Financial Report does not cover the Other Information and, accordingly, we will not express an audit opinion or any form of assurance conclusion thereon, with the exception of the Remuneration Report and our related assurance opinion.
In connection with our audit of the Financial Report, our responsibility is to read the Other Information. In doing so, we consider whether the Other Information is materially inconsistent with the Financial Report or our knowledge obtained in the audit, or otherwise appears to be materially misstated.
Responsibilities of the Directors for the Financial Report
The Directors are responsible for:
• preparing the Financial Report that gives a true and fair view in accordance with Australian Accounting Standards and the Corporations Act 2001
• implementing necessary internal control to enable the preparation of a Financial Report that gives a true and fair view and is free from material misstatement, whether due to fraud or error
• assessing the Group and Company's ability to continue as a going concern. This includes disclosing, as applicable, matters related to going concern and using the going concern basis of accounting unless they either intend to liquidate the Group and Company or to cease operations, or have no realistic alternative but to do so.
Auditor’s responsibilities for the audit of the Financial Report
Our objective is:
• to obtain reasonable assurance about whether the Financial Report as a whole is free from material misstatement, whether due to fraud or error; and
• to issue an Auditor’s Report that includes our opinion.
Reasonable assurance is a high level of assurance, but is not a guarantee that an audit conducted in accordance with Australian Auditing Standards will always detect a material misstatement when it exists.
Misstatements can arise from fraud or error. They are considered material if, individually or in the aggregate, they could reasonably be expected to influence the economic decisions of users taken on the basis of this Financial Report.
A further description of our responsibilities for the audit of the Financial Report is located at the Auditing and Assurance Standards Board website at: http://www.auasb.gov.au/auditors_files/ar2.pdf. This description forms part of our Auditor’s Report.
96Collection House Limited Annual Report 2017
For
per
sona
l use
onl
y

Independent Auditor’s Reportto the members (continued)
Report on the Remuneration Report
Opinion
In our opinion, the Remuneration Report of Collection House Limited for the year ended 30 June 2017, complies with Section 300A of the Corporations Act 2001.
Directors’ responsibilities
The Directors of the Company are responsible for the preparation and presentation of the Remuneration Report in accordance with Section 300A of the Corporations Act 2001.
Our responsibilities
We have audited Sections A to J of the Remuneration Report which is contained in the Directors’ report for the year ended 30 June 2017.
Our responsibility is to express an opinion on the Remuneration Report, based on our audit conducted in accordance with Australian Auditing Standards.
KPMG Scott Guse
Partner
Brisbane
24 August 2017
97F
or p
erso
nal u
se o
nly

The shareholder information set out below was applicable as at 27 September 2017.
A. Distribution of equity securitiesAnalysis of numbers of equity security holders by size of holding:
Class of equity security Ordinary shares
Holders Shares
1 - 1,000 3,647 2,228,289
1,001 - 5,000 7,214 19,908,700
5,001 - 10,000 2,431 18,227,364
10,001 - 100,000 1,958 45,484,790
100,001 and over 74 50,040,621
Total 15,324 135,889,764
There were 806 holders of less than a marketable parcel of ordinary shares.
B. Equity security holdersTwenty largest quoted equity security holdersThe names of the twenty largest holders of quoted equity securities are listed below:
Name Units% of issued
capital
1. Ankla Pty Ltd 12,711,134 9.35
2. HSBC Custody Nominees (Australia) Limited 8,624,836 6.35
3. Citicorp Nominees Pty Limited 5,607,534 4.13
4. JP Morgan Nominees Australia Limited 2,849,084 2.10
5. Poltick Pty Ltd 1,538,684 1.13
6. Brispot Nominees Pty Ltd (House Head Nominee A/C) 1,051,542 0.77
7. Rollee Pty Ltd 977,839 0.72
8. Mr Frederick Benjamin Warmbrand (FB & LJ Warmbrand Super A/C) 945,591 0.70
9. BNP Paribas Nominees Pty Ltd Hub24 Custodial Serv Ltd DRP 860,809 0.63
10. Sunstar Australia Pty Ltd 731,777 0.54
11. Durbin Superannuation Pty Ltd (Durbin Family S Fund A/C) 720,000 0.53
12. BNP Paribas Noms Pty Ltd (DRP) 668,597 0.49
13. Skylevi Pty Ltd (Superfun Super Fund A/C) 589,756 0.43
14. Garrett Smythe Limited 583,509 0.43
15. Kemp SMSF Pty Ltd (Kemp Super Fund A/C) 560,423 0.41
16. Nowcastle Pty Ltd 466,245 0.34
17. BNP Paribas Nominees Pty Ltd (IB AU Noms Retail Client DRP) 418,598 0.31
18. Britetek Pty Ltd (The D’Adamo Super Fund A/C) 404,548 0.30
19. Kreskin Pty Ltd (KD Superannuation Fund A/C) 394,607 0.29
20. Mizi Superannuation Pty Ltd (Mizi Super Fund A/C) 343,561 0.25
Total 41,048,674 30.21
Shareholder Information
98Collection House Limited Annual Report 2017
For
per
sona
l use
onl
y

Shareholder Information(continued)
B. Equity security holders (continued)Unquoted equity securitiesDetails of these Performance Rights are set out at Note 29 of the financial statements.
Effective Date Expiry date
Exercise price
Balance at start of
the year
Granted during the
year
Vested during the
year
Lapsed during the
year
Balance at end of the
year
Vested and
issuable at end of the
year
Number Number Number Number Number Number
Company – 2017
1 July 2014 30 September 2017 Nil 556,010 – – 556,010 – –
1 July 2015 30 September 2018 Nil 380,452 – – 380,452 – –
1 July 2016 30 September 2019 Nil – 3,621,810 – 361,153 3,260,657 –
Total 936,462 3,621,810 – 1,297,615 3,260,657 –
Restricted securitiesAll issued shares in Collection House Limited are quoted on the ASX and there are no shares subject to escrow or other regulated restrictions.
C. Substantial holdersSubstantial shareholders of ordinary shares in the Company are set out below:
Holder Units% of issued
capital
1. Ankla Pty Ltd, Poltick Pty Ltd, Nowcastle Pty Ltd, Skylevi Pty Ltd (Superfun Superfund), Sunstar Australia Pty Ltd, and Simone Mizikovsky Family Maintenance Trust (combined shareholdings) 16,047,596 11.81
2. HSBC Custody Nominees (Australia) Limited 8,624,836 6.35
D. Voting rightsThe voting rights attaching to each class of equity securities are set out below:
(a) Ordinary sharesOn a show of hands, every member present at a meeting in person or by proxy shall have one vote and upon a poll each share shall have one vote.
(b) Performance rightsNo voting rights.
99F
or p
erso
nal u
se o
nly

DirectorsKerry Daly Chair (Non-Executive) Philip Hennessy Director (Non-Executive) Leigh Berkley Director (Non-Executive) (appointed 1 July 2016) Michael Knox Director (Non-Executive) (appointed 24 March 2017)
Company SecretaryKristine May
Executive Management TeamAnthony Rivas Chief Executive Officer (appointed 6 July 2016) Kristine May Chief Financial Officer & Company Secretary (appointed 23 December 2016) Anand Adusumilli Chief Data Scientist (appointed 26 July 2017) Jonathon Idas Chief Legal Officer (appointed 6 September 2017)
Main contactKristine May Company Secretary T: +61 7 3292 1015 E: [email protected]
Principal registered office in AustraliaLevel 12, 100 Skyring Terrace Newstead Qld 4006 T: +61 7 3292 1000 F: +61 7 3832 0222 W: www.collectionhouse.com.au
Postal addressPO Box 2247 Fortitude Valley BC Qld 4006
Share registerComputershare Investor Services Pty LtdGPO Box 2975 Melbourne Vic 3000 T: 1300 850 505 F: +61 7 3237 2152 W: www.computershare.com.au
AuditorKPMG71 Eagle Street Brisbane Qld 4000
Stock exchange listingCollection House Limited shares are listed on the Australian Securities Exchange (ASX). The home exchange is Sydney.
ASX codeCLH
Investor and client presentationThe Group’s latest investor and client presentation is available at www.collectionhouse.com.au.
Corporate Directory
100Collection House Limited Annual Report 2017
For
per
sona
l use
onl
y

www.collectionhouse.com.au
For
per
sona
l use
onl
y

HEAD OFFICE:
Level 12, 100 Skyring Terrace, Newstead QLD 4006
T: +61 7 3292 1000 F: +61 7 3832 0222
www.collectionhouse.com.au
For
per
sona
l use
onl
y