for personal use only - australian securities exchange · note: excludes boq specialist for...
TRANSCRIPT

Results presentation for the half year ended 28 February 201526 March 2015
Bank of Queensland Limited ABN 32 009 656 740. AFSL No 244616.
For
per
sona
l use
onl
y

2
Agenda
Result overview
Financial overview
Summary & outlook
Jon SuttonManaging Director & CEO
Anthony RoseChief Financial Officer
Jon SuttonManaging Director & CEO
For
per
sona
l use
onl
y

3
1H15 overview
1
2
3
4
Solid first half result
Growth without compromising price or quality
Foundations set for sustainable future
BOQ Specialist tracking to expectations
For
per
sona
l use
onl
y

4
Key metrics strong in 1H15
Property &
CRM impact
BOQ
Specialist
BOQ
Specialist
43.9
48.11.97
1.87
+19%+14%
+430bps+20bps
For
per
sona
l use
onl
y
5
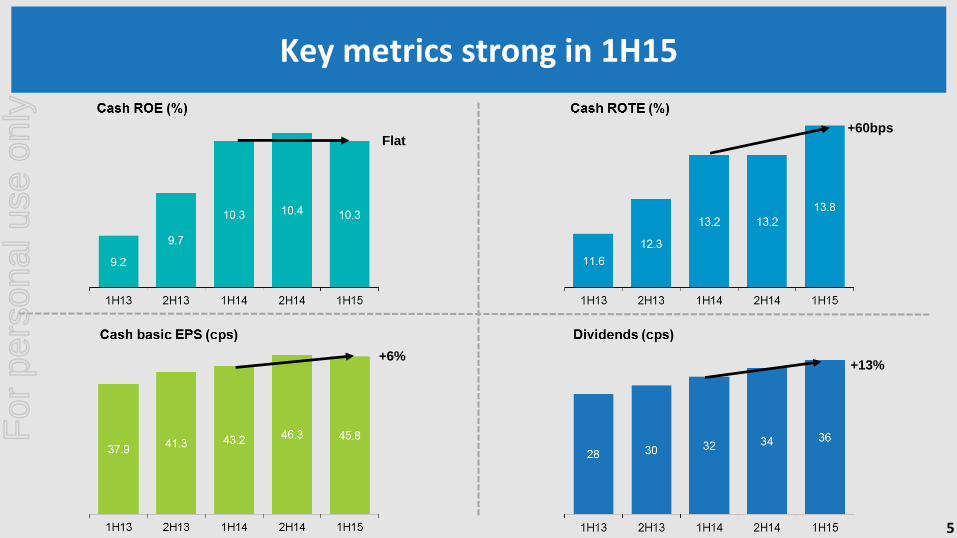
Key metrics strong in 1H15
Flat+60bps
+6%+13%
For
per
sona
l use
onl
y
6
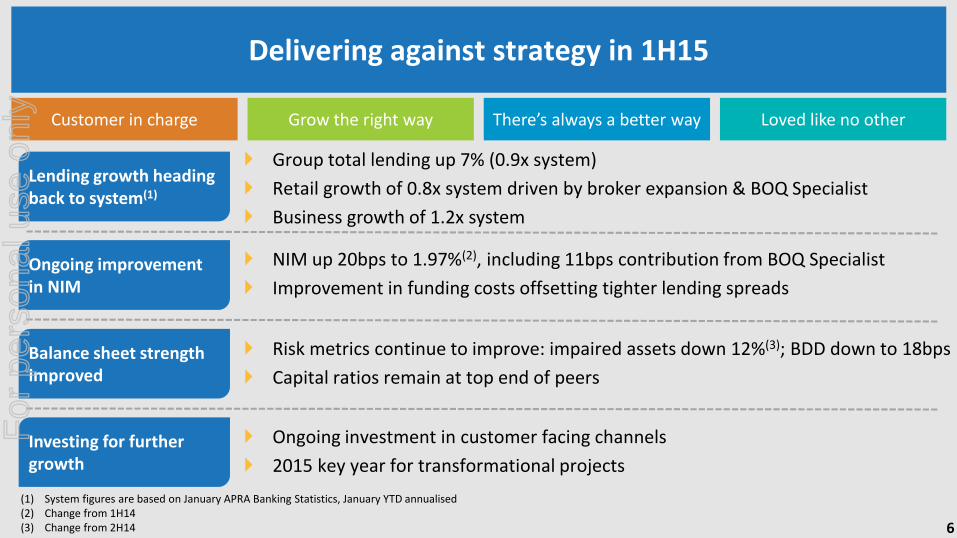
Delivering against strategy in 1H15
Lending growth heading back to system(1)
Group total lending up 7% (0.9x system)
Retail growth of 0.8x system driven by broker expansion & BOQ Specialist
Business growth of 1.2x system
Ongoing improvement in NIM
NIM up 20bps to 1.97%(2), including 11bps contribution from BOQ Specialist
Improvement in funding costs offsetting tighter lending spreads
Balance sheet strength improved
Risk metrics continue to improve: impaired assets down 12%(3); BDD down to 18bps
Capital ratios remain at top end of peers
Investing for further growth
Ongoing investment in customer facing channels
2015 key year for transformational projects
(1) System figures are based on January APRA Banking Statistics, January YTD annualised(2) Change from 1H14(3) Change from 2H14
Customer in charge Grow the right way There’s always a better way Loved like no other
For
per
sona
l use
onl
y

7
BOQ Specialist delivering to expectations
Loan growth momentum maintained
$19m Cash earnings is on track for $38m guidance
Margins remain healthy
Impairment expense low for nature of commercial portfolio
On-balance sheet mortgages ahead of target
Announcementguidance
1H15 performance
Commercial lending growth 11-13% In line
Asset Spread 4.70% Slightly above
BDD/GLA Mid 20s In line
Key metrics disclosed at acquisition
1H14 2H14 1H15
On Balance Sheet - - 352
Third Party 558 698 397
Total 558 698 749
Mortgage originations ($m)
For
per
sona
l use
onl
y

8
Management targets
(1) Cash earnings basis(2) Excluding the impact of impaired asset run-off(3) Excludes one-off costs(4) Excluding goodwill and identifiable intangible assets
Metrics(1) 1H15 ResultsFY15+ Target(from 2H12)
BOQ asset growth-Retail
-Business(2)
0.5x system
1.3x system
1.2x system
1.5x system
Net Interest Margin 186bps Low-Mid 160s
Expense growth(3) 5% < Inflation
Cost to Income(3) 44% Low 40s
Bad & Doubtful Debts to GLA 18bps ~20bps
Return on Tangible Equity(3)(4) 14.4% 13%+
Excludes Virgin Money Australia and BOQ Specialist
Management targets set at the end of FY12
New measures to track delivery against strategy being developed
For
per
sona
l use
onl
y
Financial overviewAnthony RoseChief Financial Officer
For
per
sona
l use
onl
y

10
Solid underlying financial performance
Group 1H15BOQ Specialist
1H15Group ex-BOQ Specialist 1H15 2H14 1H14
1H15 v 2H14
1H15 v 1H14
Net interest income $448m $61m $387m $390m $362m (1%) 7%
Non interest income $84m $5m $79m $86m $82m (8%) (4%)
Total income $532m $66m $466m $476m $444m (2%) 5%
Operating expenses ($256m) ($35m) ($221m) ($208m) ($195m) 6% 13%
Underlying profit $276m $31m $245m $268m $249m (9%) (2%)
Loan impairment expense ($36m) ($4m) ($32m) ($40m) ($46m) (20%) (30%)
Profit before tax $240m $27m $213m $228m $203m (7%) 5%
Income tax expense ($73m) ($8m) ($65m) ($70m) ($63m) (7%) 3%
Cash earnings after tax $167m $19m $148m $158m $140m (6%) 6%
For
per
sona
l use
onl
y
11
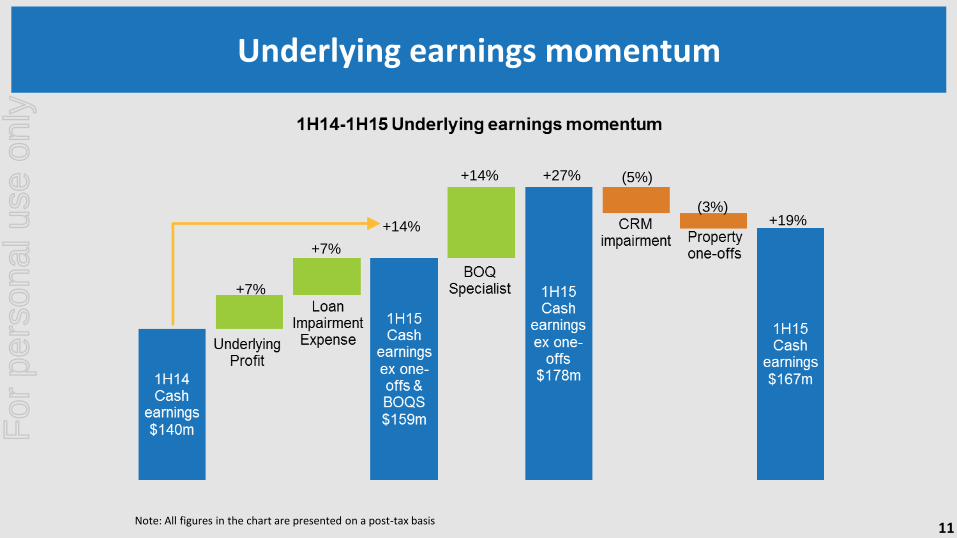
Underlying earnings momentum
+7%
+7%
+14%
Note: All figures in the chart are presented on a post-tax basis
(5%)
(3%)
+14% +27%
+19%
For
per
sona
l use
onl
y

12
Cash to statutory reconciliation
1H14 2H14 1H15
Cash earnings after tax $140m $161m $167m
Amortisation of customer contracts ($2m) ($4m) ($5m)
Hedge ineffectiveness ($1m) ($1m) $1m
Government guarantee break fee ($1m) - -
Integration / due diligence costs - ($8m) ($8m)
Legacy items ($1m) ($22m) ($1m)
Statutory profit after tax $135m $126m $154m
Legacy items dealt with BOQ Specialist integration &
transaction costs within assumed profile
Assumptions at acquisition 2H14 1H15 Total
Integration/transaction $23m $8m $4m $12m
Balance Sheet transition $6m - $4m $4m
Total $29m $8m $8m $16m
BOQ Specialist transaction/integration costs (post-tax basis)
For
per
sona
l use
onl
y

13
Loan portfolio returning to growth
Total lending up 7% annualised
Prior year initiatives and investments bearing fruit
34.6 35.3
38.439.7
(1) Includes BOQ Specialist from acquisition in 2014
For
per
sona
l use
onl
y

14
Growth emerging across all portfolios
Housing growth supported by broker expansion and BOQ Specialist
Commercial and Leasing growth ahead of system
BOQ FinanceBOQ BOQ Specialist
Commercial loan growth ($m) Leasing growth ($m)Housing loan growth ($m)
Note: Growth amounts are from the end of the prior half-year period; BOQ Specialist growth for 2H14 is a one-month growth figure following acquisition completion in July 2014
0.3x
system
0.8x
system
0.8x
system
1.2x
system813 385
63
110293
0.5x
system
For
per
sona
l use
onl
y

15
Deposit target range maintained
Continuing to derive benefits of credit rating upgrade
Deposit pricing and mix initiatives implemented
68% 69%
Deposits to Loans ratio
67%
38.7
42.5 43.4
7.98.4
9.4
For
per
sona
l use
onl
y

16
Continued strong margin management
Improvement in funding costs offsetting tighter lending spreads
Commercial loan and BOQ Specialist growth reducing third party cost impact
2.10%
2.18%
2.27%
3rd Party costsNIM
2.05%2.00%
(1)
(1) Excluding BOQ Specialist
For
per
sona
l use
onl
y

17
Other income flat
St Andrew’s claims experience higher than usual
Continued pressure on fee income with shift to fee free products
Virgin Money provides positive contribution to other income
87
80 82
84
For
per
sona
l use
onl
y

18
Underlying expense growth stable
Expenses impacted by BOQ Specialist, one-off property costs and CRM impairment
Amortisation profile rising as expected with investment in digitisation
On track for underlying cost to income ratio of 45% for 2H15
3% annualised
underlying cost
growth
60.8 59.6 61.568.0
83.8
68.764.466.3
83.3
99.1107.5256
213
For
per
sona
l use
onl
y
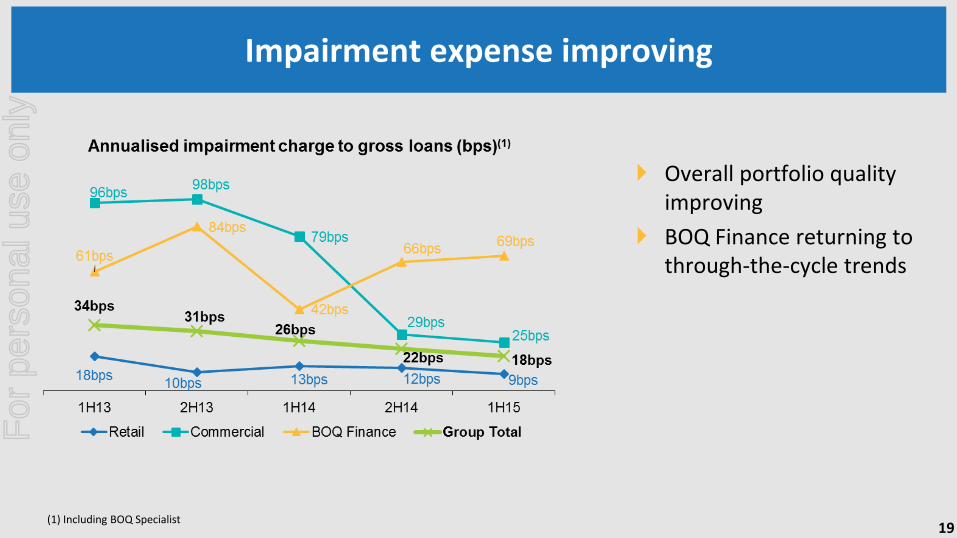
19
Impairment expense improving
Overall portfolio quality improving
BOQ Finance returning to through-the-cycle trends
(1) Including BOQ Specialist
For
per
sona
l use
onl
y

20
Further reduction in impaired assets
293
382
298
259110
125
8882
Down
12%
For
per
sona
l use
onl
y

21
Arrears levels appear to have bottomed
(1) Including BOQ Specialist (2) Housing including Lines of Credit
Seasonal uptick in Housing arrears
Commercial remaining flat
BOQ Finance uptick attributable to seasonal issues and small number of larger accounts
For
per
sona
l use
onl
y

22
Sound housing portfolio
Quality continues to improve under revised risk appetite
Historical portfolio weighting to Investor loans (44%), with 1H15 settlements 40%
Investor lending growth – well below 10% level being monitored by APRA
Portfolio metrics (%) 1H14 2H14 1H15
Owner occupied 56 56 56
Investment 44 44 44
Weighted avg LVR 65 64 65
Line of Credit 15 14 13
Avg loan balance $228k $229k $231k
Variable rate 79 79 79
Fixed rate 21 21 21
Settlement metrics (%) 1H14 2H14 1H15
Owner occupied 60 61 60
Investment 40 39 40
Weighted avg LVR 65 65 67
Line of Credit 5 5 5
Avg settlement limit $315k $324k $335k
Variable rate 77 84 82
Fixed rate 23 16 18
Note: Excludes BOQ Specialist
For
per
sona
l use
onl
y

23
Capital generation
Underlying capital generation
Underlying capital generation impacted by one-offs and stronger RWA growth
Current level of ROE capable of supporting higher levels of growth
(1) “Cash Earnings” has been adjusted for one-off non-recurring items. “Other” includes a reduction in deferred tax assets largely relating to the reduction in the product remediation provision, normalisation adjustments to determine cash earnings and favourable market movements on liquid assets held in the banking book.
For
per
sona
l use
onl
y

24
Ongoing investment in risk management
Building blocks in place for advanced accreditation
Increased sophistication in portfolio management
What we’ve achieved
► Group & business unit risk
appetite statements
► Policy & process
► Basel II compliant credit risk
models
► Portfolio management &
reporting
► Governance framework
► Stress testing framework
What we’re currently enhancing
► Collective provision/GRCL
► New data warehouse
► Retail lending origination
system
► ALM system
► Operational risk management
framework
► Rollout of credit risk grading
system
What’s to come
► Enhanced collateral
management framework &
process
► Operational risk system
implementation
► Asset management &
collections system
► Advanced internal / external
data collection
► Advanced model validation,
monitoring & governance
► Commercial lending
origination system
► Evolved data governance
► Enhanced market risk trading
platform
For
per
sona
l use
onl
y

Summary & outlookJon SuttonManaging Director & CEO
For
per
sona
l use
onl
y

26
Business environment
Economy running below long-run trend
Sustained improvement will require pickup in consumer and business confidence
Outlook will remain uncertain over the short- to medium-term
State economic performance mixed
For
per
sona
l use
onl
y

27
Capital – the need for timely regulatory action
FSI recommendations need to be implemented – risk weighting changes in particular
Basel committee consultations will take time but capital levels heading higher, particularly for IRB banks
BOQ remains well capitalised on all measures
Building blocks in place for future advanced accreditation
(1) Source: Latest published company reports (2) Source: Latest published S&P reports. For BEN & SUN, upper limit of expected range is used as absolute figure is not published
For
per
sona
l use
onl
y

28
FY15
Strategic journey
Laying the foundations
Digitising & transforming
Sustainable growth
• Restoring the balance sheet
• Risk frameworks & culture
• Compliance
• Back office digitisation
• New IT Sourcing model
• New OMB commission agreements
• Reinvigorate branch network
• Harness consumer trends in
digital & social – eg. Virgin
Money
• Focus on niche market segments
eg. BOQ Specialist
• Ongoing diversification through
segments, geography
• Opening new distribution channels
• Refreshed branding
• Niche market acquisitions – Virgin Money,
BOQ Specialist
• Building online capability
• IT simplification
• Advanced accreditation
For
per
sona
l use
onl
y

29
Priorities & outlook
1
2
3
4
5
Continued growth through new channels – Broker, BOQ Specialist, Virgin Money mortgages
Growing the right way – targeted business segments, risk sophistication, new OMB commission agreements
Delivery of transformational projects – lending program, IT services contract
Subdued economic conditions to remain
Confident in BOQ’s long-term prospects
For
per
sona
l use
onl
y

30
Important notices
Financial amounts
All dollar values are in Australian dollars (A$) and financial data is presented as at the date stated. Pro-forma financial information and past information provided in this Presentation is for illustrative purposes only and is not represented as being indicative of BOQ's views on its future financial condition and/or performance. Past performance, including past trading or share price performance, of BOQ cannot be relied upon as an indicator of (and provides no guidance as to) future BOQ performance including future trading or share price performance.
Future performance
This Presentation contains certain "forward looking statements". Forward looking statements can generally be identified by the use of forward looking words such as "anticipate", "believe", "expect", "project", "forecast", "estimate", "likely", "intend", "should", “will”, "could", "may", "target", "plan" and other similar expressions within the meaning of securities laws of applicable jurisdictions. The forward looking statements contained in this Presentation involve known and unknown risks and uncertainties and other factors, many of which are beyond the control of BOQ, and may involve significant elements of subjective judgement as to future events which may or may not be correct.
There can be no assurance that actual outcomes will not differ materially from these forward-looking statements.
Financial performance
In assessing financial performance, BOQ discloses the net profit (loss) after tax on both a ‘Statutory basis’ and a ‘Cash Earnings basis’. The Statutory basis is prepared in accordance with the Corporations Act 2001 and the Australian Accounting Standards, which comply with International Financial Reporting Standards (IFRS). The Cash Earnings basis is used by Management to present a clear view of BOQ’s underlying operating results. This excludes a number of items that introduce volatility and/or one off distortions of BOQ’s current period performance, and allows for a more effective comparison of BOQ’s performance across reporting periods and against peers. These items, such as amortisation of intangibles from acquisitions, and accounting for economic hedges, are calculated consistently year on year and do not discriminate between positive and negative adjustments. BOQ also uses the measure of ‘Underlying Profit’, which represents the profit before loan impairment expense and tax, to provide users with a view on the underlying growth rate of the business. Further details of items excluded from statutory profit are provided in the reconciliation of the net profit after tax (“Cash Earnings basis”) in this Presentation.
Non statutory financial disclosures are not audited.
For
per
sona
l use
onl
y

For
per
sona
l use
onl
y