for personal use only - asx · 2019-03-21 · – market share, industry position, market dynamics....
TRANSCRIPT

NGE CAPITAL LIMITED Annual Report for the year ended 31 December 2018
ABN 31 112 618 238
For
per
sona
l use
onl
y

CONTENTS
NGE Capital Limited and Controlled Entities Annual Report for the year ended 31 December 2018 2
Overview 3 Corporate Directory 4 Chairman’s Letter 5 Directors’ Report 21 Auditor’s Independence Declaration 35 Corporate Governance Statement 36 Financial Statements 37 Notes to the Financial Statements 41 Directors’ Declaration 67 Independent Auditor’s Report 68 Additional Information 71
For
per
sona
l use
onl
y

OVERVIEW
NGE Capital Limited and Controlled Entities Annual Report for the year ended 31 December 2018 3
NGE Capital Limited (ASX:NGE) is a Listed Investment Company which allows investors to gain exposure to a concentrated, high conviction, actively managed portfolio of financial assets. We primarily focus on listed ASX and international equities, with the aim of generating strong risk-adjusted returns over the medium to long term.
21.4%
27.5%
2018 NTA PER SHARE INCREASE
2018 SHARE PRICE INCREASE
$5.0m
2018 PROFIT BEFORE INCOME TAX
INVESTMENT PHILOSOPHY
TARGET STRONG RETURNS WITH ADEQUATE MARGIN OF SAFETY
• Individual securities can and do significantly deviate away from their fair value. • Potential to generate strong risk-adjusted returns by investing in select
securities at opportune times.
HOLD A HIGH CONVICTION, CONCENTRATED PORTFOLIO
• Only invest in a compelling opportunity, otherwise hold cash. • Prefer to invest heavily in a small number of high conviction opportunities than
invest small amounts in a large number of less compelling opportunities.
INVEST BASED ON FUNDAMENTAL ANALYSIS
• Bottom up stock selection, focusing on the fundamentals of individual companies rather than market trends.
• Conduct extensive proprietary research with a focus on: • Board and management – track record, skin in the game. • Credit risk – gearing, debt profile, interest coverage. • Earnings – free cash flows including timing and likelihood, margins,
payout ratio, and growth potential. • Valuation – multiples, discounted cash flow analysis, break-up value. • Competition – market share, industry position, market dynamics.
KEY METRICS AS AT 31 DEC 2018
Share Price $0.580
Shares Outstanding 37.19m
Market Cap $21.6m
NTA per share before tax $0.765
NTA per share after tax $0.819
Net Tangible Asset Value $28.5m
Directors’ Shareholding 29.0%
For
per
sona
l use
onl
y
CORPORATE DIRECTORY
NGE Capital Limited and Controlled Entities Annual Report for the year ended 31 December 2018 4
DIRECTORS David Lamm Executive Chairman and Chief Investment Officer Ilan Rimer Non-Executive Director Adam Saunders Executive Director and Portfolio Manager COMPANY SECRETARY Leslie Smith REGISTERED OFFICE Level 4, North Building 333 Collins Street Melbourne VIC 3000
Telephone: 03 9648 2290 Facsimile: 03 7000 5077 Email: [email protected] WEBSITE www.ngecapital.com.au STOCK EXCHANGE LISTINGS ASX Limited OTC Markets 20 Bridge Street Sydney NSW 2000
304 Hudson Street, 3rd Floor New York, NY 10013 USA
ASX CODE: NGE OTC CODE: NGELF SHARE REGISTRY Boardroom Pty Limited Level 12, 225 George Street Sydney NSW 2000
Telephone: 1300 737 760
02 9290 9600 Facsimile: 1300 653 459
02 9290 0644 Website: www.boardroomlimited.com.au AUDITORS SOLICITORS Grant Thornton Clayton Utz Collins Square, Tower 5 727 Collins Street Docklands VIC 3008
Level 18 333 Collins Street Melbourne VIC 3000
For
per
sona
l use
onl
y

CHAIRMAN’S LETTER
NGE Capital Limited and Controlled Entities Annual Report for the year ended 31 December 2018 5
Dear Shareholder, NGE Capital Limited (NGE or Company) recorded a before-tax profit of $5.0 million and an after-tax profit of $7.0 million for the financial year ended 31 December 2018, the second consecutive profitable year since NGE began operating as a Listed Investment Company (LIC). The portfolio returned 21.4% pre-tax and after all expenses during the year, and has returned 21.5% p.a. since 30 November 2016, the date on which NGE became a LIC. The key positive contributors to portfolio performance in FY2018 were the successful exit of our investment in Mineral Deposits (ASX:MDL), an upward revaluation in our holding of unlisted Powerwrap, and gradual price appreciation of United Company RUSAL (HKE:0486). Key detractors from performance were our exit from Godfreys Group (ASX:GFY) and the deterioration in Millennium Services Group’s (ASX:MIL) business. We discuss each of our major portfolio positions in detail below. LISTED EQUITIES Mineral Deposits (ASX:MDL) (EXIT) Mineral Deposits jointly owns and manages TiZir Limited, a 50-50 joint venture with ERAMET of France. The TiZir JV operates the Grande Côte mineral sands operation (GCO) in Senegal and the TiZir Titanium & Iron ilmenite upgrading facility (TTI) in Tyssedal, Norway. GCO produces zircon and ilmenite. The majority of GCO’s ilmenite is sold to TTI, which then upgrades the ilmenite to produce high quality titanium feedstocks (either chloride or sulphate slag), and high purity pig iron as a valuable co-product. As we wrote in our 2017 Annual Report:
We were attracted to MDL for the following reasons: • Bottom of the cycle of commodity prices – MDL is highly leveraged to a recovery in zircon
and titanium slag prices, with signs of improvement in the months leading up to our investment;
• Operational performance had been poor at the Grande Côte mineral sands operation in Senegal and the Norwegian plant had been impacted, however both operations were being fixed (and are now running very well) – MDL is highly leveraged to an improvement in mine availability;
• Evidence of favourable industry dynamics returning, with the Chinese government encouraging expansion of chloride route pigment plants and the shutdown of high-polluting, marginal pigment producers;
• Significant infrastructure and plant in place and in operation in both Senegal and Norway; and
• The company had been trading at depressed levels due a heavy debt burden carried by TiZir, but we were confident that the debt would be refinanced on reasonable terms.
Our investment in Mineral Deposits resulted in a $10.6 million profit on a $3.3 million investment for a total return of 318% over 20 months, after we accepted ERAMET’s takeover offer of A$1.75 cash per share. Whilst we sensed that ERAMET was getting a good deal, we felt on balance that a guaranteed lower cash offer was more attractive than an at-risk $2-3 per share valuation (depending on commodity price and production assumptions). We are certainly not disappointed with the outcome overall. United Company RUSAL plc (HKE:0486) RUSAL is a Hong Kong- and Moscow-listed vertically integrated aluminium producer, responsible for
For
per
sona
l use
onl
y

CHAIRMAN’S LETTER
NGE Capital Limited and Controlled Entities Annual Report for the year ended 31 December 2018 6
around 6% of global aluminium production. RUSAL operates 12 aluminium smelters (4mtpa capacity), 10 alumina plants (10.5mtpa capacity) and 8 bauxite mines (17.5mtpa capacity). The company’s core assets are 5 smelters located in Siberia, Russia. RUSAL is favourably positioned in the first quartile of the global cost curve, helped by its core smelting operations being located close to Siberian hydro power plants and therefore having access to cheap electricity supply. The company also has a strategic 27.8% stake in MICEX-, LSE- and OTC-listed MMC Norilsk Nickel PJSC (Nornickel) which makes up ~67% of RUSAL’s enterprise value. Nornickel is a leading nickel producer and no. 1 palladium producer globally, as well as a significant producer of platinum and copper. Nornickel produces battery-grade refined nickel that is suitable for use in electrical vehicles. Development of the EV industry should underpin long-term demand for Nornickel’s core commodity. RUSAL SNAPSHOT
We invested following a dramatic share price fall after the US Department of Treasury’s Office of Foreign Assets Control (OFAC) slapped sanctions on several Russian oligarchs and companies, including RUSAL, its major shareholder En+, and En+’s major shareholder Oleg Deripaska. Our investment thesis hinged on the presumption that the company is too important to global (non-Chinese) aluminium supply to remain on the US sanctions list. The US’s position as the world’s largest aluminium importer (~7mtpa), and the 28% increase in the cash price in response to the sanctions also suggested that there would be an appetite to find a solution. Early on, the US Department of Treasury softened its stance, inviting the possibility of lifting the sanctions if Deripaska relinquished control. OFAC subsequently extended the deadline (via “General Licenses”) over 10 times for trading in the company’s securities and winding up dealings with the company. The sanctions were finally lifted on 27 January 2019, after RUSAL agreed to significant restructuring and governance changes. RUSAL’s share price made some gains in the lead up to the sanctions lift, ending the year at HK$2.59. Even at a share price of HK$4.64 prior to the sanctions RUSAL looked cheap back then, trading on an EV/FY2018E EBITDA multiple (adjusted for Nornickel) of ~3.7x versus Alcoa at ~4.2x, aluminium peers at ~6.8x, and global diversified miners at ~5.3x. NGE invested at around half that price averaging in initially at ~HK$2.26. We increased our stake further in December at ~HK$2.60 after OFAC announced its intention to remove the sanctions in 30 days. Yellow Cake plc (LSE:YCA) Yellow Cake is an LSE-listed investment company whose investment strategy is to buy and hold physical uranium for the long-term. We acquired 1.06m shares at an average of ~£2.26 per share. Yellow Cake currently holds 8.44 mmlbs of “natural uranium” in the form of U3O8, which is also known
Ticker HKE:0486
Price (31 Dec 2018) HKD 2.590
Market cap US$m 5,025
Net debt US$m 7,442
EV US$m 12,467
Nornickel stake US$m 8,294
EV adj US$m 4,172
EV adj / EBITDA (FY19E) x 2.0
P/E (FY19E) x 2.6
NGE position size % 19.2%
For
per
sona
l use
onl
y

CHAIRMAN’S LETTER
NGE Capital Limited and Controlled Entities Annual Report for the year ended 31 December 2018 7
as yellow cake. The company was formed to offer investors exposure to the uranium price without the risks typically borne by companies which explore for, develop and mine uranium. Yellow Cake is a simple, easy-to-understand play on the uranium price, as its Net Asset Value (NAV) should closely track the spot price. Yellow Cake purchased its uranium holding in two transactions from the world’s largest producer Kazatomprom (LSI:KAP) at an average price of US$21.10/lb, against the year-end U3O8 spot price of US$28.50/lb. Yellow Cake has an option to purchase up to US$100m of uranium per year from Kazatomprom until 2027 at the spot price at the time of purchase. This allows for an undisturbed purchase price when acquiring further uranium, an advantage that larger TSX-listed uranium holding fund Uranium Participation Corporation (TSX:U) does not enjoy. YELLOW CAKE NAV AS AT 31 DECEMBER 2018
We briefly summarise the arguments in favour of a uranium price recovery below. URANIUM PRICE NEAR HISTORIC LOWS The uranium price rose 20% from the beginning of the year, and rallied ~40% from a yearly low of US$20.50/lb in April. Despite the recent run, the price is still a long way from recovering from a prolonged bear market that has sent many uranium resource companies to the wall. For reference, prices reached US$143/lb in May of 2007. GROWING NUCLEAR POWER DEMAND According to the EIA World Energy Outlook, nuclear power capacity is expected to grow by 36% between 2015 and 2035 to meet growing demand for clean power generation, led by China and India. Base case uranium consumption is forecast to increase from ~173 mmlbs currently to ~190 mmlbs by 2030 (bull case ~260 mmlbs). In addition, the Japanese nuclear industry is still slowly progressing through a recovery post Fukushima, with Prime Minister Abe’s pro-nuclear government approving the restart of 9 reactors. Another 6 reactors have been approved for operations by the Nuclear Regulatory Authority; a total of 32 reactors could potentially restart operations by 2026-2027. The large upfront capex required to construct a nuclear power plant, the long useful life (40+ years), and the inability to quickly turn a nuclear power plant on or off, means that utilities are to a certain extent relatively price insensitive to the uranium price, which makes up a relatively small portion of the marginal cost of running a plant. Of course when profit margins are tight small changes to the cost base can have a big impact to the bottom line, so we are cautious of the argument often made
Uranium holdings mmlb 8.44Spot price US$/lb 28.50Fair value of uranium US$m 240.6Cash US$m 9.0Other net assets / (liabilities) US$m -3.0Net Asset Value US$m 246.6FX rate GBP:USD 0.7831Net Asset Value £m 193.1
Shares out. m 76.2NAV per share £ 2.53Share price (31 Dec 2018) £ 2.29Discount to NAV % -9.5%
NGE position size % 15.4%
For
per
sona
l use
onl
y
CHAIRMAN’S LETTER
NGE Capital Limited and Controlled Entities Annual Report for the year ended 31 December 2018 8
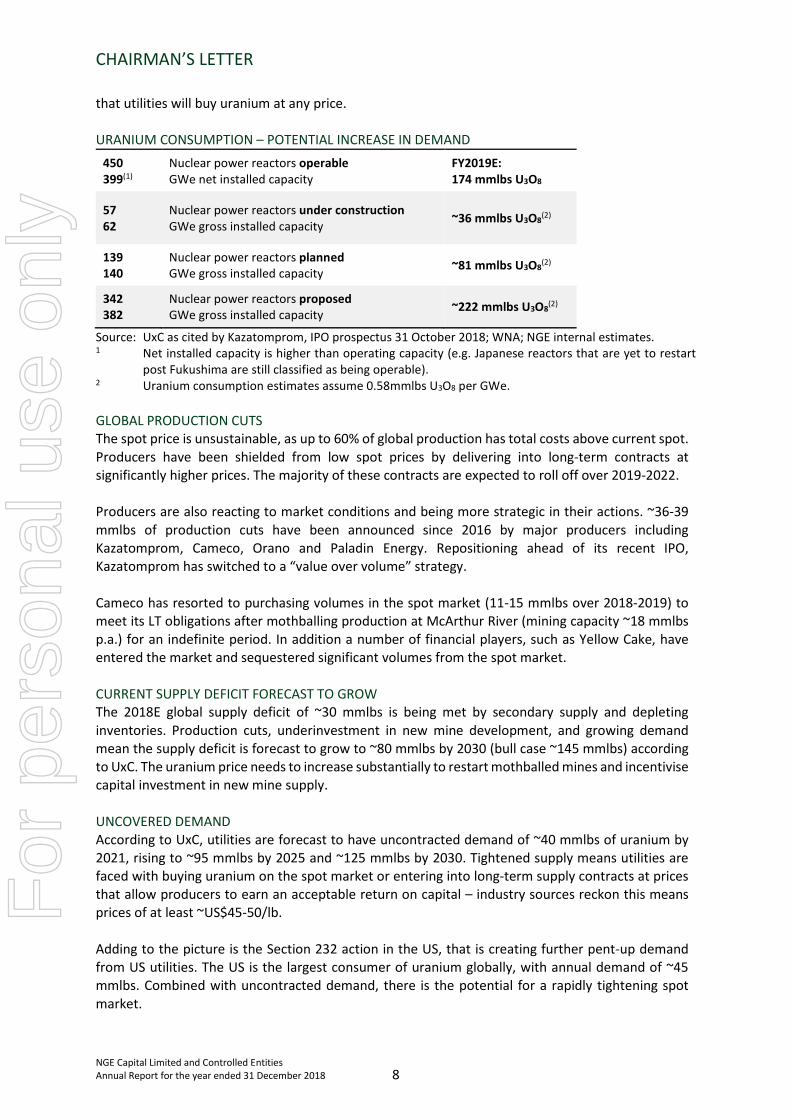
that utilities will buy uranium at any price. URANIUM CONSUMPTION – POTENTIAL INCREASE IN DEMAND
450 399(1)
Nuclear power reactors operable GWe net installed capacity
FY2019E: 174 mmlbs U3O8
57 62
Nuclear power reactors under construction GWe gross installed capacity ~36 mmlbs U3O8(2)
139 140
Nuclear power reactors planned GWe gross installed capacity ~81 mmlbs U3O8(2)
342 382
Nuclear power reactors proposed GWe gross installed capacity ~222 mmlbs U3O8(2)
Source: UxC as cited by Kazatomprom, IPO prospectus 31 October 2018; WNA; NGE internal estimates. 1 Net installed capacity is higher than operating capacity (e.g. Japanese reactors that are yet to restart
post Fukushima are still classified as being operable). 2 Uranium consumption estimates assume 0.58mmlbs U3O8 per GWe. GLOBAL PRODUCTION CUTS The spot price is unsustainable, as up to 60% of global production has total costs above current spot. Producers have been shielded from low spot prices by delivering into long-term contracts at significantly higher prices. The majority of these contracts are expected to roll off over 2019-2022. Producers are also reacting to market conditions and being more strategic in their actions. ~36-39 mmlbs of production cuts have been announced since 2016 by major producers including Kazatomprom, Cameco, Orano and Paladin Energy. Repositioning ahead of its recent IPO, Kazatomprom has switched to a “value over volume” strategy. Cameco has resorted to purchasing volumes in the spot market (11-15 mmlbs over 2018-2019) to meet its LT obligations after mothballing production at McArthur River (mining capacity ~18 mmlbs p.a.) for an indefinite period. In addition a number of financial players, such as Yellow Cake, have entered the market and sequestered significant volumes from the spot market. CURRENT SUPPLY DEFICIT FORECAST TO GROW The 2018E global supply deficit of ~30 mmlbs is being met by secondary supply and depleting inventories. Production cuts, underinvestment in new mine development, and growing demand mean the supply deficit is forecast to grow to ~80 mmlbs by 2030 (bull case ~145 mmlbs) according to UxC. The uranium price needs to increase substantially to restart mothballed mines and incentivise capital investment in new mine supply. UNCOVERED DEMAND According to UxC, utilities are forecast to have uncontracted demand of ~40 mmlbs of uranium by 2021, rising to ~95 mmlbs by 2025 and ~125 mmlbs by 2030. Tightened supply means utilities are faced with buying uranium on the spot market or entering into long-term supply contracts at prices that allow producers to earn an acceptable return on capital – industry sources reckon this means prices of at least ~US$45-50/lb. Adding to the picture is the Section 232 action in the US, that is creating further pent-up demand from US utilities. The US is the largest consumer of uranium globally, with annual demand of ~45 mmlbs. Combined with uncontracted demand, there is the potential for a rapidly tightening spot market.
For
per
sona
l use
onl
y

CHAIRMAN’S LETTER
NGE Capital Limited and Controlled Entities Annual Report for the year ended 31 December 2018 9
THE BIG UNKNOWN: INVENTORIES There are widely varying estimates of the global level of inventories. The estimates can be confronting (~850+ mmlbs), and represents many years’ consumption. However, the counter-argument is that the “saleable” inventory is much less, as governments and utilities like to hold strategic inventories equivalent to a number of years of future uranium needs. Whilst this theory has yet to be fully tested, the recent run in spot price suggests that there is not necessarily a large volume of ready-made inventory available. In summary, we think Yellow Cake provides an investment with low downside risk (perhaps 25-30%), with high potential upside. Eureka Group Holdings Limited (ASX:EGH) Eureka is a provider of low-cost rental accommodation to independent retirees who are reliant on the Government pension and Rent Assistance. The company owns and manages 32 villages (including 5 under joint venture) comprising 1,501 units, and manages a further 9 villages comprising 681 units. Eureka’s villages are made up of anywhere between 20 and 80 units each, with an average of around 55. The units are typically 30-40 sq m, and contain a bedroom, bathroom, and lounge/kitchenette area. Where there is food provided, which is the case at most villages, there is a shared dining and recreational area, and full commercial kitchen. Some recreational activities such as bingo are provided 3 times per week. Tenants usually stay for 3-4 years. Residents are typically very light on the accommodation, which results in low refurbishment costs every 3-4 years and comprises painting, some carpeting as required, and other minor touch-ups. Tenants pay for their own electricity and utilities costs. The company focuses on attracting independent retirees who can look after themselves. The core business is performing pretty well with occupancy rates finishing the year at 92.9%. Eureka has high operating leverage: higher occupancy falls to the bottom line. EUREKA SNAPSHOT
The company previously only managed its properties, but moved to a “buy and build” model in 2014 due to the higher margins and earnings achieved as owner/operator rather than just operator. Out of the 32 properties it freeholds (including 5 under JV), 8 were acquired from owners with whom Eureka had management contracts, and the rest have been from externally sourced acquisitions. The company has not built any properties to date, though has some development plans at a few sites. It is much cheaper to acquire existing properties and refurb: a new unit built on a multi-lot site will cost ~$120-130k. However, the company has been able to acquire villages from single owner-operators at an average of ~$65k per unit. This is due to the lack of available buyers in the market and the fact that a plethora of retirement parks were built 10-20 years ago, particularly along the
Ticker ASX:EGH
Price (31 Dec 2018) $ 0.280
Market cap $m 64
EV $m 114
EV / EBITDA (FY19E) x 14.6
P/E (FY19E) x 12.9
NGE position size % 8.7%
For
per
sona
l use
onl
y

CHAIRMAN’S LETTER
NGE Capital Limited and Controlled Entities Annual Report for the year ended 31 December 2018 10
Gold Coast, that subsequently went bust. A key issue has been that previous management tied up valuable capital in non-core property deals that proved a huge and costly distraction. It has also resulted in a slowing in the acquisition rate of new rental villages. When put to work in the right places, the company earns ~11% EBITDA returns on its invested capital at the property level. Currently the company has ~$20m of capital tied up in non-core assets (including ~$5 million cash from recent asset realisations that has yet to be put to work), which if applied to sensible leveraged acquisitions of additional villages could generate a further ~$4.0-4.5 million of EBITDA (versus FY2018: ~$7 million). Applying a conservative EV/EBITDA multiple of 12.0x to these additional (fictitious) earnings would result in a share price boost of ~$0.12-0.15, or ~45-55% upside from the year-end share price of $0.28. The long-term thematics that underpin our investment thesis remain strong: Australia has a growing ageing population; housing affordability remains a significant issue. Eureka will take patience to play out. As always, legacy issues take longer to solve than incoming managers expect and investors hope. The initial indications are that the new board and management are doing the right things to clean up the business, though it is still early days. Horizon Oil Limited (ASX:HZN) Horizon is an oil and gas producer. The company holds a 26.95% interest in producing assets in the Beibu Gulf, offshore China, a 26% interest in the producing Maari/Manaia fields in offshore New Zealand, and a strategic interest in a PNG LNG development project. The company’s all-in free cash flow break-even point is ~US$38/bbl, which accounts for direct production costs, capex, overheads, financing costs and tax. We forecast that the company will produce ~1.7 mmbbls (~1.1mmbbls from China; ~600 kbbls from NZ) in FY2019E. The company gets a slight price discount on its heavier Chinese oil, and a slight premium on its light, sweet NZ crude. HORIZON SNAPSHOT
1 Diluted and adjusted for IMC options and in-the-money SARS. 2 Based on assumed average achieved oil price of ~US$65/bbl for FY2019E. CHEAP ON SUM-OF-THE-PARTS VALUATION If the year-end Brent price of ~US$55/bbl persists, we value Horizon’s producing assets in the Chinese Beibu Gulf and New Zealand’s Taranaki Basin at ~$0.12 per share (~$0.16 less net debt of ~$0.04), without regard to the value of its PNG LNG interest. Based on a LT Brent oil price of US$70/bbl, our valuation rises to ~$0.20 per share (~$0.24 less net debt). The kicker to valuation is Horizon’s stake in a midscale LNG project in Papua New Guinea, which could potentially be worth an additional ~$0.10-0.20. At the year-end share price level of $0.10, we are getting the PNG LNG stake for free. Our average entry price was ~$0.125, during a period when the oil price was trading ~US$75-85/bbl. At those levels, we felt the entry level offered a decent margin of safety versus our valuation of
Ticker ASX:HZN
Price (31 Dec 2018) $ 0.100
Market cap (1) $m 172
EV (1) $m 244
EV / EBITDAX (FY19E) (2) x 2.3
NGE position size % 7.4%
For
per
sona
l use
onl
y

CHAIRMAN’S LETTER
NGE Capital Limited and Controlled Entities Annual Report for the year ended 31 December 2018 11
Horizon’s production assets, sensitised for lower oil prices. Horizon’s share price subsequently came off in line with the very rapid 37% decline in the oil price from an October high of ~US$86/bbl to the year-end price of ~US$55/bbl, however we think the stock still offers great value. CHEAP ON A FREE CASH FLOW MULTIPLE VALUATION The company’s leverage has been a problem in the past, though the company is steadily paying down its debt with free cash flow. At 31 December, Horizon had net debt of US$64m (A$91m), or A$73m if we include the A$18m that should be received at some point from IMC’s ITM options. The company is trading on an EV/EBITDAX multiple of ~2.3x based on an assumed average achieved Brent oil price of US$65/bbl for FY2019E, which is on the cheap side. HIGHLY LEVERAGED TO THE OIL PRICE Horizon is highly leveraged to the oil price: a 27% increase in the oil price to US$70/bbl leads to a 63% increase in our valuation (of course this works in reverse too!). We show a sensitivity analysis to our production assets DCF valuation in the table below, along with the potential upside from the PNG LNG project. DCF valuation of Horizon production assets (WACC 10%)
PNG LNG PROJECT THE POTENTIAL VALUE KICKER Horizon is planning for an “uncomplicated, low-risk” 1.5 mtpa LNG development, which is at a relatively advanced stage. The project plan is to draw gas across a number of fields, though foundation gas for the project is concentrated in two fields. The fields have appraised resources of 2.0-2.5 tcf gas and 60-70mmbbls of condensate. Horizon and Repsol have a combined interest of 70% of the total resource and operate all the fields. In June 2018 Repsol announced it had signed an agreement with a Chinese party, Changcheng Group, to sell its stake in the PNG LNG project. The PNG Government is stalling the deal for reasons that have not been made public. Details around the transaction have also not been released to the market, but if the deal eventually gets the green light it is likely to be positive on a look-through basis for Horizon’s stake. We believe Horizon, which holds 30% of the key fields, could sell down part of its stake (perhaps to 10-15%) to Changcheng as part of a co-ordinated transaction. It is feasible that Horizon could sell its part-stake for A$100m (~$0.06 per share). If a Final Investment Decision (FID) is made on the LNG project, Horizon is entitled to a US$50m cash payment (perhaps $0.03 per share on a present value basis) and US$80m of free carry on development costs from Osaka Gas, which acquired its stake in the project from Horizon several years ago. Upon FID, Horizon will hold a valuable minority stake in the project (together with the free carry, perhaps worth ~$0.10 on a PV basis). Recent developments on the PNG LNG Project have thrown a spanner in the works to the upside story. In May 2018 the company announced that the PNG Petroleum Minister had given the joint venture partners a notice of intention to cancel Petroleum Development License (PDL) 10, which contains one of the key gas fields. The Minister is frustrated that PDL 10, and Pipeline License 10, are not further progressed or developed, having first granted the PDL in May 2014. We understand the
Brent oil price (US$/bbl)
31-Dec-18$55.00 $60.00 $70.00 $80.00 $90.00
Possible $0.00 $0.122 $0.147 $0.199 $0.251 $0.302
values of $0.10 $0.222 $0.247 $0.299 $0.351 $0.402
PNG LNG $0.20 $0.322 $0.347 $0.399 $0.451 $0.502
For
per
sona
l use
onl
y

CHAIRMAN’S LETTER
NGE Capital Limited and Controlled Entities Annual Report for the year ended 31 December 2018 12
reason for delaying was initially down to the ridiculously high capex costs at the time of the grant as oil was trading above US$100/bbl and in-demand oil services companies had carte blanche when it came to charging clients. This was then followed by a period in which all oil and gas companies struggled due to super low oil prices that went sub US$30/bbl in January 2016. We expect the joint venture partners have put these arguments, along with some legal ones, to the Minister. As this is PNG, the process for these sorts of matters is not always straightforward, so time will tell what happens but it seems to be counterintuitive to cancel a license which underpins a significant capital investment program that is on the cusp of starting. We think it is possible that Repsol is eventually allowed to proceed with its PNG LNG stake sale to Changcheng Group, on condition that the acquirer commits to a more aggressive development schedule. Base Resources Limited (ASX:BSE) Base is an ASX- and LSE-listed mineral sands production and development company. Base operates its 100%-owned Kwale Mineral Sands Project in Kenya, and has an 85% interest (potentially rising to 100%) in a world-class development project, Toliara Sands Project, in Madagascar. Kwale commenced production in late 2013 and produces rutile, sulphate ilmenite (48.5% TiO2) and zircon. BASE SNAPSHOT
1 Diluted for performance rights. CHEAP ON SUM-OF-THE-PARTS VALUATION On a DCF basis, we value the Kwale operations at ~$0.37 per share (net of net debt), well above the year-end share price of $0.235. The value of the Toliara development project is unknowable at this stage, but we estimate it could be worth an additional ~$0.14+ per share (net of capex requirement) on a risked basis (~$0.70+ per share unrisked), meaning we are getting exposure to this blue-sky project for nothing. SUM-OF-THE-PARTS VALUATION
Ticker ASX:BSE
Price (31 Dec 2018) $ 0.235
Market cap (1) $m 286
EV $m 284
EV / EBITDA (FY19E) x 1.9
EV / FCF (FY19E) x 2.3
NGE position size % 6.1%
Per share ValuationA$ A$m US$m
DCF - Kwale Project (10% WACC) $0.37 451.5 325.1Net debt $0.00 1.4 1.0Current operations equity valuation $0.37 452.9 326.1Upside 59%Toliara upfront (PFS, DFS, 15% stake) -$0.03 -36.2 -26.0Toliara NPV (rough estimate) $1.26 1,527.6 1,100.0Toliara capex (rough estimate) -$0.51 -624.9 -450.0Toliara equity valuation (unrisked) $0.71 866.5 624.0Risk factor 20% 20% 20%Toliara equity valuation (risked) $0.14 173.3 124.8Total equity valuation $0.52 626.2 450.9Upside 119%
For
per
sona
l use
onl
y

CHAIRMAN’S LETTER
NGE Capital Limited and Controlled Entities Annual Report for the year ended 31 December 2018 13
STRONG CASH FLOW GENERATION In FY2018 Base reported operating cash flow of US$117m, and US$84m of free cash after Kwale-related capex (i.e. excluding cost of Toliara purchase). Based on current spot prices of its key commodities and factoring in the decline in mined ore grade, Base’s Kwale project should generate ~US$90 million of free cash this financial year, which will enable the company to fully pay down its outstanding debt. Kwale capex should come down in future years as FY2018 and FY2019E have been abnormally high capex spend years as the company switches ore bodies and completed the optimisation program to improve mining rates and wet concentrator plant throughput. FAVOURABLE OUTLOOK FOR MINERAL SANDS PRICES The outlook for mineral sands prices remains favourable, particularly for zircon and rutile. Base has significant exposure to zircon and rutile through Kwale. There is a bias in the market for rutile, given its high titanium dioxide (92-96%+ TiO2) content which allows for a cleaner pigment production process and resultant environmental benefits over other titanium feedstocks. The strong zircon price recovery, from ~US$700/t 24 months ago to ~US$1,580/t currently, has been driven by tight supply and strong demand. This is expected to remain the case over the medium term, as existing zircon mines mature and enter decline in coming years. Iluka Resources (ASX:ILU), the largest producer of zircon globally, sets a 6-month reference zircon price from which most other market participants set their prices. Iluka has learnt from the mistakes of the past where the zircon price rose to over US$2,000/t (in 2012), and led to significant thrifting and substitution by ceramics customers for other cheaper materials causing long-term demand destruction and oversupply. Iluka’s approach is now directed towards sustainability for the zircon industry, with slower, moderate, well-flagged price increases, guided production for 2018-2020, and monitoring of price impacts on customers and end-users/price absorption through the value chain. Whilst the ilmenite market has been soft of late, it is expected to tighten in CY2019, with a supply deficit balanced by inventory drawdown until 2020. EXPLORATION UPSIDE AT KWALE After FY2019E, we estimate that Kwale has a remaining mine life of ~5-6 years assuming run-rate production of 600ktpa of heavy mineral concentrate and a mineral resource of 4.2Mt at 3.1% HM (which includes ore reserves of 3.1Mt at 3.9%) as at 30 June 2018. The current mineral resource is based on deposits at Kwale Central Dune and Kwale South Dune. The mine life could be extended by perhaps 2 years with a successful exploration drilling at North Dune which has recently completed, with 573 holes for 20,598m drilled. A mineral resource estimate is expected during 1Q CY2019. STRONG BALANCE SHEET The recovery in mineral sands prices since 2016 has been a major tail wind to Base. Net debt has reduced from US$260m at 31 December 2015 to a net cash position of US$1m at 31 December 2018. Free cash flows will see Base strengthen its net cash position in CY2019, even accounting for Toliara capex spend to 31 December 2019 on a pre-feasibility study (PFS) and definitive feasibility study (DFS) (perhaps US$9m combined), and US$17m on payments for the remaining 15% of the project it does not currently own (i.e. US$26m total to get project to a positive FID). TOLIARA PROJECT IS A WORLD-CLASS DEVELOPMENT ASSET The large, high grade Ranobe deposit underpins the Toliara Sands Project, located in the south-west
For
per
sona
l use
onl
y

CHAIRMAN’S LETTER
NGE Capital Limited and Controlled Entities Annual Report for the year ended 31 December 2018 14
of Madagascar. Ranobe is estimated to contain a resource of 1,021Mt, with 704Mt in the Measured and Indicated categories, sufficient to support a 40+ year mine life at a scale similar to Kwale. Ranobe’s average HM grade is estimated at 5.8% with 5% slimes, and containing 59Mt HM based on a 3% cut-off grade. The Toliara Project is a simple, high grade and scale project that is expected to produce in the first quartile Revenue to Cash Cost ratio (similar to Kwale at ~3+ times). Whilst the project capex requirements are unknown, it is likely to be ~US$400-450m. Taking the high end of this range of US$450m, and assuming 60% debt funding, Base will require ~US$180m of equity funding. This could be achieved via:
• Free cash flows and a project stake sell-down – a 20% sell-down in the project to an offtaker might yield US$60m;
• Free cash flows and an additional equity raising; or • Free cash flows, though this will depend on mined grade and commodity prices.
Base’s management team brought Kwale from a development project through to commissioning and production, so they have the skills and experience to bring Toliara to market. More detail on the mine and operating parameters will be available once Base publishes its PFS, likely early this year, with a DFS expected towards the end of CY2019. SHARE PRICE STAGNATION Why is the share price trading so far below our (theoretical) valuation? We think it is probably down to a few factors:
• All of Kwale’s cash flows will be hoarded to pay for Toliara capex. Given new development projects are inherently risky, it is hard for investors to attribute full value now to Kwale’s cash flows knowing that they are going to be ploughed into Toliara for an uncertain outcome;
• Given the lead time to build Toliara, there will be no potential to return capital to shareholders for perhaps 5+ years now, which may not excite prospective investors;
• Toliara Project economics are relatively unknown currently, and in particular how much the upfront capex will be (ours is an estimate only);
• Potential for dilutive equity raising to cover equity portion of Toliara capex: there is a risk that project debt and Kwale cash flows are not enough, and there is no certainty that a stake sale at the project level will be completed or even enough to cover the balance; and
• An illiquid microcap operating in Kenya and Madagascar will be perceived as high risk. We think that once Base puts some solid numbers behind the Toliara project, the market will begin to wake up to the stock’s potential. Warrior Met Coal Inc (NYS:HCC) We initially dipped our toe with a small investment in Warrior Met Coal in November 2017, and probably underinvested at that time. Recent volatility has afforded us an attractive entry point for further investment in November and December 2018 at a share price of ~US$22.80. Warrior is a NYSE-listed producer and exporter of metallurgical coal from two underground mines located in Alabama. The company also has 103m short tons of undeveloped reserves at the Blue Creek Energy Mine. Met coal is used to produce coke, which is an essential fuel and reactant in the blast furnace process for the manufacture of steel. The company has operational capacity to mine ~8 million St (~7.25 million metric tons) of met coal per year from recoverable reserves of ~101m St. Warrior’s coal contains low sulfur and has strong coking
For
per
sona
l use
onl
y

CHAIRMAN’S LETTER
NGE Capital Limited and Controlled Entities Annual Report for the year ended 31 December 2018 15
properties and therefore receives a slim discount (~2%) to the globally recognised Hard Coking Coal benchmark set in Australia, which is used to set quarterly pricing for the met coal industry. Warrior is a simple, pure-play met coal business that is highly cash generative. We like the business because its mine infrastructure is already built, the mine has been in production for a number of years, and the company is focused on returning cash to shareholders. This has been evidenced by the payment of US$17.94 in gross dividends since we purchased our initial stake at US$27.50 in November 2017. The high spot coal price (~US$200/t) means Warrior is absolutely creaming cash flows, with EBITDA of ~US$635m and FCF of ~US$495m. On a P/E basis this equates to 3.0x, which is dirt cheap. Of course the coal price is expected to decrease, but even at US$160/t the value still makes sense to us. WARRIOR MET COAL SNAPSHOT
1 Based on assumed FY2019E met coal price of US$175/t (vs spot price ~US$200/t). Assuming a FY2019E coal price of US$175/t (which looks conservative against spot), and a long-term (2020E+) price of US$160/t, we value Warrior’s operations at ~US$34 per share (net of net debt). The company recently published illustrative valuations for the undeveloped Blue Creek Project across a range of coal prices, showing that the project alone could be worth an additional ~US$16-34 per share. In response, we have upped our ascribed value from ~US$1 per share to ~US$4 per share. SUM-OF-THE-PARTS VALUATION
1 Assumes FY2019E coal price US$165/t; LT US$160/t. 2 NGE internal estimate. Implies ~US$1.94/St on 103m St of reserves. Subsequent to year end the company has also announced an offer to repurchase up to $150m of its Senior Debt, which will free up the ability to pay further special dividends or buy back shares, up to an aggregate value of $150m. This equates to ~US$3 per share if paid out as a special dividend. Against the year-end price of US$24.11, that would represent a 12% dividend yield. Millennium Services Group Limited (ASX:MIL) Millennium Services Group is an ASX-listed mid-tier provider of cleaning, security and low-level maintenance services to retail shopping centres, offices and schools in Australia and New Zealand. The bulk of revenues (~75%) come from cleaning contracts at retail shopping centres. We were attracted to the company due to its predictable contracted revenues, high contract retention rates, blue chip clients, and that the business traded on cheap EV/EBITDA and P/E multiples (adjusted for
Ticker NYS:HCC
Price (31 Dec 2018) US$ 24.11
Market cap US$m 1,243
EV US$m 1,489
EV / EBITDA (FY19E) (1) x 3.5
P / E (FY19E) (1) x 4.4
NGE position size % 5.6%
Valuation Per shareUS$m US$
DCF - operating mines (10% WACC) (1) $1,984 $38.49
Blue Creek (undeveloped) (2) $200 $3.88Net debt (31 Dec 2018) -$246 -$4.77Total equity valuation $1,939 $37.60
Upside 56%
For
per
sona
l use
onl
y

CHAIRMAN’S LETTER
NGE Capital Limited and Controlled Entities Annual Report for the year ended 31 December 2018 16
acquisition-related amortisation). We knew that the market in which Millennium operates is competitive, but understood that the company was being disciplined in its tendering activities and selective about winning new business. The company also offered potential upside with growth in the Security division and bolt-on acquisitions. MILLENNIUM SERVICES GROUP SNAPSHOT
The company’s customers include Scentre Group (which owns and operates Westfield shopping centres in Australia and NZ), AMP, QIC and state governments. These owners and operators of large, valuable property assets have a strong incentive to keep them well-maintained, clean, safe and attractive to visitors. Reputation is also very important: given the large number of visitors to the properties, there is a real risk of claims for negligence due to injuries (real or feigned) from slippages or falls. Millennium is able to provide its clients with an auditable trail of its cleaning and maintenance activities (including GPS tracking of its employees using “wands”), thereby reducing the potential liability for claims. Some of this liability does rest with Millennium, however, and this is a cost of doing business which is factored in when tendering for contracts. Millennium’s contracts are typically for a base duration of 3 years, with options to extend for further periods. After factoring in labour, cleaning materials and potential claims costs, Millennium targets a modest double-digit gross margin on its contracts. Most contracts require some upfront capex for equipment procurement (e.g. floor scrubbers) paid for by Millennium, and can be in the order of 10% of the value of the contract. The quality of the company’s customer base means bad debt exposure is low. During November, the new board of Millennium Services Group provided updated earnings guidance following receipt of preliminary results of a strategic review conducted by an external corporate advisor. We excerpt part of the announcement below: The consultant’s Preliminary Report notes that this revenue growth has been at lower gross
profit margins than historically generated by the Company. As a result, Millennium’s overall profitability has been negatively impacted and, should current trends continue, the Company’s FY19 EBITDA is anticipated to be at close to breakeven levels. This is significantly below the guidance provided by the Company on 31 August 2018 (issued by the previous board).
This was a very shocking update: only three months prior the company put out guidance that the company should make FY2019E EBITDA of $15.5-17.5 million from revenue of $290-310 million. After missing every single earnings guidance number put out to the market since listing in November 2015, and being heavily punished for it, we understood that the company was applying ultra-conservative assumptions to its forecasts. Whilst the revenue forecast looks to be on track, we are now told that EBITDA might be closer to zero. Clearly the business was in worse shape than the previous management and board realised. Millennium finished the year at an all-time low share price of $0.215, down 85% for the year.
Ticker ASX:MIL
Price (31 Dec 2018) $ 0.215
Market cap $m 10
EV $m 39
FY19E Revenue $m 290-310
FY19E EBITDA $m 0+
NGE position size % 2.4%
For
per
sona
l use
onl
y
CHAIRMAN’S LETTER
NGE Capital Limited and Controlled Entities Annual Report for the year ended 31 December 2018 17
With such a low margin business (FY2018 statutory gross margin was 14.5%), and overheads tracking at ~$33m (~11% of FY2019E revenue), there is little room for error. Regardless of whether the company is disciplined in tendering for new business, if focus is taken off the day-to-day operations, issues such as poor rostering (which leads to unnecessary overtime and overstaffing of sites) quickly erode profits. It appears that the business has also been affected by an unusually large increase (relative to historical increases) in July of the FWC award for cleaning and security of 3.5% (FY2017: 3.3%; FY2016: 2.4%; FY2015: 2.5%), which may not be fully recoverable across a significant number of contracts. Add to the above the large debt load being carried following the Airlite acquisition in 2016, and things look somewhat precarious. The company breached its debt covenants at 31 December, as it did at 30 June. The company’s lender, ANZ, appears to be giving the new board a chance to turn things around with its profit improvement plan. Despite the rapid decline in profitability, it does not mean the company is beyond being fixed. Godfreys Group Limited (ASX:GFY) (EXIT) Godfreys is a specialty retailer of vacuum cleaners and cleaning products for domestic use in Australia and New Zealand. Godfreys sells its own company-owned brands, the brand Hoover via a licensing agreement, and third party brands via 217 retail stores (125 company owned, 92 franchised), wholesale channels through other retail outlets, and a website. We exited our investment in Godfreys in June after it was put out of its listed misery, taken public-to-private for a second time by John Johnston. Unfortunately for us, the takeout price of $0.335 was a big haircut to our initial investment. When we invested, Godfreys was profitable, cashflow positive and traded on very low EV/EBITDA and P/E multiples, making it one of the cheapest stocks on the ASX. We were aware that it is in a tough sector and had been going through some management and strategy changes as well. At the time we invested all our research and due diligence led us to believe that the company was in the early stages of turning around and improving operational performance, however we were clearly mistaken. In the end the company was not able to improve its operating performance, and competition from the likes of Harvey Norman, JB Hi-Fi and even Aldi made the going increasingly tough. Following the initial takeover offer from Mr Johnston we materially increased our stake at 30c and subsequently managed to extract a slightly higher offer than the original $0.32 price, capturing a further $0.015 per share for a small additional profit. Nonetheless overall Godfreys was a very poor investment for us, as we made a $1.2 million loss on a $2.5 million investment. UNLISTED EQUITIES Powerwrap Limited Powerwrap Limited is our largest portfolio investment as at 31 December 2018. Powerwrap is an unlisted public company that provides investment portfolio administration services. The company operates in a very attractive market supporting independent financial advisors in managing their clients’ wealth. The independent financial advice industry is growing strongly from superannuation and non-superannuation flows, largely driven by a shift away from conflicted remuneration structures, whereby large vertically integrated financial institutions manufacture and then sell their own financial products via their retail investor channels. An increasing number of financial advisors are leaving large financial institutions (e.g. big banks, AMP, IOOF) to set up independently or join smaller groups.
For
per
sona
l use
onl
y

CHAIRMAN’S LETTER
NGE Capital Limited and Controlled Entities Annual Report for the year ended 31 December 2018 18
The company is not yet profitable but has been growing strongly. As at 30 June 2018, the company had $7.1 billion in funds under administration (FUA), up 22% over the year. Platform revenue increased 26% to $14.6 million, and EBITDA adjusted for one-offs improved to -$1.8 million (FY2017: -$3.5 million). During the year the Board resolved to revalue our Powerwrap holding to $0.10 per share, up 67% from our purchase price of $0.06. The revaluation was in line with NGE’s Investment Valuation Policy, and followed Powerwrap’s successful $7.25 million capital raise at $0.10 per share in April 2018. Powerwrap had previously undertaken a $2 million capital raising in late December 2017 also at $0.10 per share, however we had at that time elected to hold our unlisted securities at cost due to the small amount raised. Powerwrap has plans to conduct an IPO in May 2019. **************** Despite a pleasing overall portfolio return of 21.4% for the year, we took on board some expensive and hard lessons from Godfreys and Millennium Services. We apologise to our shareholders for our poor capital allocation with these investments. There are some common traits and mistakes of each of these investments, which we wish to highlight:
• Micro cap with low liquidity; • Operating in a competitive industry; • Bad news begets more bad news: what looks like a cheap business based on earnings
multiples can quickly become a value trap when earnings continue to deteriorate; • Mistaken belief in management’s ability to turn business around; • Overly leveraged, making a failure to turn the business around a terminal outcome; • Mistaken confidence from insider buying, as insiders can overestimate their abilities and get
their buying wrong; and • Averaging down when instead we should have been waiting for further signs of positive
news, or cutting our losses and selling out. We will no doubt make other errors of judgement in the future, but will be mindful to avoid companies sharing too many of the traits exhibited by Godfreys and Millennium Services. **************** READING SUGGESTIONS Over the Christmas holiday period we enjoyed reading British-American fund manager Bill Browder’s book Red Notice, which charts his experience as a pioneering investor in Russia. Browder initially focused on the post-Soviet Empire privatisations that occurred in the 1990s where valuable assets were sold off for a song: it was during this time that oligarchs like Oleg Deripaska gained control of assets that would make them amongst the richest people in the world. Browder made a fortune during the 90s, only to lose it all in the 1998 Ruble crisis. He then made it back in the early 2000s, often adopting an activist approach and taking on corporate insiders and oligarchs that had enriched themselves at the expense of minority shareholders. This was lucrative, but also very dangerous, and he made some powerful enemies along the way. We won’t spoil the book any further, however we note ironically that NGE’s investment in RUSAL stems directly from Browder’s activism around introducing sanctions on Russian agents. One of the book’s key takeaways from an investment perspective is Browder’s open mind and
For
per
sona
l use
onl
y
CHAIRMAN’S LETTER
NGE Capital Limited and Controlled Entities Annual Report for the year ended 31 December 2018 19
curiosity to understand the unknown, ability to connect with the right people to gain an understanding of a situation, opportunism, and determination and conviction to stay the course in the face of significant pressures (particularly after the 1998 market melt-up).
“As I went over all this with Prutkov, I felt the release of that familiar chemical in my stomach – the one I’d felt after seeing my ten bagger in Poland. I wondered, Is this deal unique to the Murmansk Trawler Fleet, or is the same thing happening all over Russia? And if it is, how can I get involved?”
We also recently read billionaire distressed asset investor and entrepreneur Sam Zell’s book, Am I Being Too Subtle? We enjoyed reading about his approach to investments across a wide range of industries (originally property but also energy, manufacturing, logistics, healthcare and communications). Known as “The Grave Dancer” from an article he wrote in 1976 about buying distressed properties, Zell had an uncanny knack for reading market trends and acting before consensus thinking caught up. This is best illustrated by his savvy property deals during the 1970s, and his subsequent move into other industries during the 1980s when he saw that the easy profits from real estate were going to be harder to come by in the future. “The 1970s could have been a disaster for us. They were for many in real estate. Instead, they
were a great ride. Our firm ended the decade with an enormous, diverse portfolio, some of which would later seed two of the largest REITs in the industry.
Years later, people would ask me, “How did you know when and what to buy?” But all I basically
did was create a massive arbitrage – a fixed-rate instrument in an inflationary environment. I essentially took on $4 billion of nonrecourse debt at an average interest rate of 6 percent in an environment with inflation of 9 percent or higher. That means I was already making 3 percent returns the second the deal closes – without doing a thing to the assets. Sure, we picked some terrific properties, but every one didn’t have to be Class A. Overall, it was the creation of an enormous amount of nonrecourse, fixed-rate debt…3 to 4 percent…below inflation. When we started, my estimate was that we could make $50 million (equivalent to about $250 million today) in five years. What I didn’t envision was that the country would elect Jimmy Carter. As a result, everything he did raised inflation. So we made a lot more.”
**************** During the year NGE received tax advice that the Company’s historical tax losses are available to be offset against future tax liabilities so long as NGE continues to satisfy the continuity of ownership test as set out in Divisions 165 and 166 of the Income Tax Assessment Act 1997 (Cth) and there are no adverse changes in tax legislation. The Board resolved to recognise a deferred tax asset of $2 million on the balance sheet as at 31 December 2018, however this does not fully reflect the size of our tax loss position which is, in fact, much larger. The aggregate of unused and unrealised losses is $44 million which equates to a potential tax benefit of approximately $12 million, or $0.33 per share. NGE’s share price rose 27.5% in 2018, and at 31 December was trading at a 29.1% discount to NTA. We see no valid reason for this discount, and expect to continue opportunistically buying back shares on-market if the large discount persists. Of course, the best long-term solution is to continue our strong investment performance and allow the market to narrow the discount on its own.
For
per
sona
l use
onl
y

CHAIRMAN’S LETTER
NGE Capital Limited and Controlled Entities Annual Report for the year ended 31 December 2018 20
Whilst 2019 may prove to be a difficult investment climate, we are excited by the potential of the investments we currently hold in our portfolio and we will continue to work hard to find new compelling investment opportunities. Yours sincerely,
David Lamm Executive Chairman and Chief Investment Officer 21 March 2019 IMPORTANT INFORMATION: While management of NGE have taken every effort to ensure the accuracy of the material covering the Company’s portfolio investments in the Chairman’s Letter, the material is provided for information purposes only. No representation or warranty, express or implied, is or will be made by NGE or its officers, directors, employees or advisers as to the fairness, accuracy, completeness or correctness of the information contained in the “LISTED EQUITIES” and “UNLISTED EQUITIES” sections, opinions and conclusions contained in, or implied by, these sections, or as to the reasonableness of any assumption, forecasts, prospects or returns contained in, or implied by, these sections. The Chairman’s Letter does not constitute investment, legal, taxation or other advice and does not take into account your investment objectives, financial situation nor particular needs. You are responsible for forming your own opinions and conclusions on such matters and should make your own independent assessment of the information contained in, or implied by, the Chairman’s Letter and seek independent professional advice in relation to such information and any action taken on the basis of the information. The Chairman’s Letter is not, and does not constitute advice or an offer to sell or the solicitation, invitation or recommendation to purchase any securities that are referred to in the Chairman’s Letter.
For
per
sona
l use
onl
y

DIRECTORS’ REPORT
NGE Capital Limited and Controlled Entities Annual Report for the year ended 31 December 2018 21
The Directors of NGE Capital Limited (NGE or Company) present their Report together with the financial statements of the consolidated entity, being NGE and its Controlled Entities (Group) for the year ended 31 December 2018. DIRECTORS Current Directors The following persons were directors of NGE during or since the end of the financial year: Mr David Lamm
Executive Chairman and Chief Investment Officer 15 September 2017 – present Executive Chairman 29 February 2016 – 14 September 2017 Chair of Investment Committee
Mr Lamm is responsible for the origination of investment ideas, management of NGE’s portfolio and overall performance of the LIC. He has over 15 years of experience in business and financial markets including roles at Credit Suisse, Bain & Company and the Alter Family Office. He is the founder and Managing Director of Kentgrove Capital, an investment management firm focused on listed Australian and international equities. Mr Lamm qualified as an actuary, specialising in Investments and Finance, is a Fellow of the Institute of Actuaries of Australia, and also holds a Bachelor in Commerce from the University of Melbourne, with First Class Honours. Other Current Directorships: Alchemia Limited (appointed 7 March 2016, resigned 6 June 2018) Powerwrap Limited (appointed 29 November 2017) NGE Shareholding as at report date: 10,116,810 shares (held indirectly) Mr Ilan Rimer
Non-Executive Director 17 August 2017 – present Chair of Audit Committee Member of Investment Committee
Mr Rimer has extensive experience in management consulting, corporate strategy and new business development. He is the founder and CEO of Property Trail, an innovative real estate technology business, and was most recently a Non-Executive Director for Australian Business Volunteers. Previously he held roles at Bain and Company, PwC, Australia Post, Visy Industries, and Stellar Asia-Pacific. Mr Rimer holds a Master of Business Administration from Oxford University and a Bachelor of Commerce (Hons) from Monash University. He is a graduate of the Australian Institute of Company Directors. NGE Shareholding as at report date: Nil
For
per
sona
l use
onl
y

DIRECTORS’ REPORT Continued
NGE Capital Limited and Controlled Entities Annual Report for the year ended 31 December 2018 22
DIRECTORS (CONTINUED) Mr Adam Caspar Saunders
Executive Director and Portfolio Manager 15 September 2017 – present Non-Executive Director 15 July 2015 – 14 September 2017 Member of Audit Committee Member of Investment Committee
Mr Saunders is responsible for the origination, analysis and execution of investment ideas and management of NGE’s portfolio. He is a Portfolio Manager at Kentgrove Capital, and previously held corporate advisory roles at GBS Finanzas in Madrid, and Credit Suisse in Melbourne. Mr Saunders holds a Bachelor in Commerce from the University of Melbourne with Honours in Finance, and is a Graduate of the Australian Institute of Company Directors. NGE Shareholding as at report date: 664,000 shares (held indirectly) COMPANY SECRETARY Mr Leslie Smith
Chief Financial Officer and Company Secretary 13 July 2016 – present
Over a career spanning 30+ years, Mr Smith has held senior financial and company secretarial positions in various private, public and listed entities in the resources, manufacturing, IT and not-for-profit sectors. Mr Smith graduated with a Bachelor of Business from Massey University (1982), a Masters of Business Administration at the University of Melbourne (2003), and a Graduate Diploma in Applied Corporate Governance. Mr Smith is a Chartered Accountant, a CPA and a Member of the Governance Institute of Australia. PRINCIPAL ACTIVITIES NGE Capital Limited is an internally managed Listed Investment Company whose principal activities are to make investments in listed and unlisted securities. INVESTMENT STRATEGY The Company’s investment strategy is to invest in a concentrated, high conviction portfolio of financial assets with the aim of generating strong risk-adjusted returns over the medium to long term. NGE has a flexible investment mandate and invests according to a defined set of investment principles that are summarised as follows:
• Only invest in a compelling opportunity, otherwise hold cash; • Invest based on fundamental analysis; • Target investments that can generate strong returns with an adequate margin of safety; and • Aim to hold a concentrated portfolio of high conviction investments.
For
per
sona
l use
onl
y

DIRECTORS’ REPORT Continued
NGE Capital Limited and Controlled Entities Annual Report for the year ended 31 December 2018 23
OPERATING AND FINANCIAL REVIEW a) Financial Result The profit of the Group after income tax for the year was $7.034 million (2017: $4.681 million), comprising profit before income tax of $5.014 million (2017: $4.886 million) and recognition of a deferred tax asset $2.020 million (2017: $ Nil). b) Investment Performance At year end NGE’s principal assets comprised financial assets, mainly investments in listed equities, at market value of $26.507 million (2017: $18.654 million), and cash and cash equivalents of $2.095 million (2017: $5.296 million). Net assets increased by $6.876 million to $30.501 million (2017: $23.625 million). Net tangible assets (NTA) increased by $4.856 million to $28.481 million. On a per share basis, NTA (before tax and net of all operating expenses) increased 21.4% to $0.765 (2017: $0.630). NTA per share after tax increased 30.0% to $0.819 (2017: $0.630). NGE quarterly NTA per share (before tax and net of all operating expenses) since inception1
1 From 30 November 2016, the date on which NGE became a Listed Investment Company. Since inception to 31 December 2018, NGE has returned a cumulative 50.0% or 21.5% annualised on a pre-tax, net of operating expenses basis. This puts NGE at the very top of LIC performers, as highlighted by the following graph.
$0.765
$0.054
$0.510$0.497
$0.565$0.595
$0.629 $0.630$0.612
$0.793$0.815 $0.819
30-Nov-16 31-Dec-16 31-Mar-17 30-Jun-17 30-Sep-17 31-Dec-17 31-Mar-18 30-Jun-18 30-Sep-18 31-Dec-18
NTA per share before tax Deferred Tax Asset
+50.0%
For
per
sona
l use
onl
y

DIRECTORS’ REPORT Continued
NGE Capital Limited and Controlled Entities Annual Report for the year ended 31 December 2018 24
Annualised portfolio return since inception – all ASX LICs1
Note: Each bar represents the total return of an ASX LIC since 30 November 2016. Returns include growth in
NTA (pre-tax, after fees and operating expenses) and payment of dividends (grossed up for franking credits).
1 Peer comparison data comprises 60 ASX-listed equities focused LICs with Net Tangible Assets of at least A$10 million that were listed as at 30 November 2016.
Total portfolio return
31 December
2018 31 December
2017 Increase
NTA $28.481 million $23.625 million $4.856 million1
NTA per share before tax $0.765 $0.630 21.4% 1 The increase in NTA is after the buyback of 249,674 shares for $157,300 during 2018.
21.5%
-20.0%
-15.0%
-10.0%
-5.0%
0.0%
5.0%
10.0%
15.0%
20.0%
25.0%
NGE
For
per
sona
l use
onl
y

DIRECTORS’ REPORT Continued
NGE Capital Limited and Controlled Entities Annual Report for the year ended 31 December 2018 25
c) Portfolio The Company’s investment portfolio as at 31 December 2018 is presented below. Listed Equities Ticker $’000 %
United Company RUSAL Plc HKE:0486 5,485 19.2%
Yellow Cake Plc LSE:YCA 4,375 15.4%
Eureka Group Holdings Limited ASX:EGH 2,476 8.7%
Horizon Oil Limited ASX:HZN 2,098 7.4%
Base Resources Limited ASX:BSE 1,739 6.1%
Warrior Met Coal Inc NYS:HCC 1,606 5.6%
Westgold Resources Limited ASX:WGX 1,035 3.6%
Millennium Services Group Limited ASX:MIL 695 2.4%
Uranium Participation Corporation TSX:U 140 0.5%
Total 19,649 69.0%
Unlisted Equities
Powerwrap Limited 5,974 21.0%
Cody Live Pty Ltd 134 0.5%
Total 6,108 21.5%
Convertible Notes and Loans
Cody Live Pty Ltd 6.50% Notes 750 2.6%
Western Drilling Limited 263 0.9%
Total 1,013 3.5%
Cash and Other
Cash and cash equivalents 2,095 7.4%
Other (384) (1.4%)
Total 1,711 6.0%
Total Net Tangible Asset Value 28,481 100.0% Investment transactions The total number of contract notes that were issued for transactions in securities during the financial year was 137 (2017: 134). Total brokerage fees incurred net of GST were $55,315 (2017: $72,009). Exits The Group exited its position in Mineral Deposits Limited (ASX:MDL) for a $10.6 million profit on a $3.3 million investment for a total return of 318% over 20 months. The Group also exited Godfreys Group Limited (ASX:GFY) for a $1.2 million loss on a $2.5 million investment. Further detail on each of these investments is provided in the Chairman’s Letter. Investment Income The Group earned $305,000 (2017: $735,000) of investment income through the year, comprising interest income of $161,000 (2017: $237,000), dividend income of $134,000 (2017: $370,000) and underwriting income of $10,000 (2017: $128,000). The bulk of dividend income came from a US$6.53
For
per
sona
l use
onl
y

DIRECTORS’ REPORT Continued
NGE Capital Limited and Controlled Entities Annual Report for the year ended 31 December 2018 26
per share special dividend paid by Warrior Met Coal (NYS:HCC) in April 2018, which followed the US$11.21 per share special dividend paid in November 2017. Selected investment summaries Refer to the Chairman’s Letter for management commentary on the Company’s key portfolio investments. d) Cash Flows Operating activities resulted in a net outflow of $2,915,000 (2017: outflow $7,663,000) as the Group made investments using existing cash reserves, which included reinvesting cash received from investment exits during the period. The Group’s net outflow from financing activities of $170,000 (2017: outflow $1,635,000) was due to the Company’s continued capital management program of on-market share buy-backs, and included settlement of $11,485 (before transaction costs) of shares bought back in the prior period. e) Capital Management On-market buy-backs During the year the Company purchased 249,674 of its own shares costing $157,300 before transaction costs under a 10/12 buy-back of unlimited duration announced in August 2017. f) Board and Management There were no changes to the Board or management during the year. g) Dividends No dividends have been paid or declared by the Company since the beginning of the year. h) Legacy Assets WESTERN DRILLING LIMITED WDL continues to market its drill rig, camp and other assets for lease, sale or potential sell-down of equity. Whilst the Group looks to extract value from NGE’s investment in WDL, the rig has been cold-stacked and overhead costs in maintaining the rig and equipment have been reduced to a minimum. The joint venture partners agreed to forego accruing interest on their investment from 2016. SIGNIFICANT CHANGES STATE OF AFFAIRS There have been no significant changes, other than those noted above, in the state of affairs of the Group during the financial year. LIKELY DEVELOPMENTS During the subsequent financial years, the likely developments of the Group will be to identify and invest in suitable investments using cash reserves on hand. ENVIRONMENTAL ISSUES The Group’s current operations as a Listed Investment Company are not subject to any particular or significant environmental regulation under a law of the Commonwealth or of a State or Territory of Australia. F
or p
erso
nal u
se o
nly

DIRECTORS’ REPORT Continued
NGE Capital Limited and Controlled Entities Annual Report for the year ended 31 December 2018 27
REMUNERATION REPORT (AUDITED) The Directors present the Remuneration Report for Non-Executive Directors, Executive Directors and other key management personnel (KMP), prepared in accordance with the Corporations Act 2001 and the Corporations Regulations 2001. The Remuneration Report is set out under the following main headings:
(a) Remuneration policy and practices; (b) Service agreements; (c) Details of remuneration; (d) Share-based remuneration; and (e) Other information.
a) Remuneration policy and practices The Board has assumed the duties and responsibilities of the Remuneration Committee until such time that the Company’s size and operation warrant a Board composition with additional independent non-executive directors. Mr Rimer chairs the Board when it addresses remuneration matters. The Board ensures that conflicted members are not involved in remuneration determination and review discussions. Mr Rimer may engage independent external consultants and advisors to provide any necessary information to assist in the discharge of his responsibilities. When determining and reviewing compensation arrangements for the directors and KMP, the Board operates in accordance with its established Remuneration Committee charter. The Board seeks to design and develop executive remuneration policy in such a way that it:
i) Attracts and retains talented senior executives and directors and motivates them to enhance the performance and growth of the Company; and
ii) Ensures that the level and composition of remuneration packages are fair, reasonable and adequate and, in the case of executive directors and senior managers, displays a clear relationship between the performance of the individual and the performance of the Company.
The Company’s policy for determining the nature and amount of remuneration of directors and KMP is as follows: i) Non-Executive Directors
The Board’s policy is to remunerate non-executive directors at market rates for comparable companies for their time, commitment and responsibilities. The Board determines the remuneration of the Company’s non-executive directors and reviews their remuneration annually. The annual remuneration for non-executive directors is $25,000 (inclusive of superannuation). The maximum aggregate annual remuneration for non-executive directors is subject to approval by the shareholders at a general meeting. The shareholders have approved a maximum aggregate annual remuneration of $500,000 per annum. F
or p
erso
nal u
se o
nly

DIRECTORS’ REPORT Continued
NGE Capital Limited and Controlled Entities Annual Report for the year ended 31 December 2018 28
REMUNERATION REPORT (AUDITED) (CONTINUED) ii) Key Management Personnel The remuneration structure for senior executives, including executive directors, is based on a number of factors, including qualifications, particular experience, general past performance of the individual concerned, overall performance of the Company and benchmarked against industry remuneration levels generally. KMP remuneration comprises fixed compensation and, where appropriate, performance-based short-term incentives. Remuneration levels are reviewed annually by the board through a process that considers individual performance and overall performance of the Company. Fixed compensation Fixed compensation consists of base salary (which is calculated on a total cost basis and includes any fringe benefits tax charges related to employee benefits) and employer contributions to superannuation funds, as required by law. Performance-based short-term incentive Performance linked compensation comprises a short-term incentive (STI) and is designed to reward KMP for meeting or exceeding the Company’s financial objectives and to keep the Company competitive in the marketplace. The STI is an at-risk bonus provided in the form of cash and based on the key performance indicator (KPI) of maximising the NTA per share before tax of the Company. This KPI is reviewed annually by the Board. For 2018 NGE’s Chief Investment Officer and Portfolio Manager were incentivised to receive STI payments in addition to fixed compensation by achieving the following KPI: Growth in NTA per share before tax1 < 2.5% 12.5% ≥ 25.0%
STI payment (% of fixed compensation) 0% 50%
4% for each 1% growth in NTA per share before tax
1 NTA is adjusted for NGE’s legacy PNG assets and share buy-backs. For achievement of growth in NTA per share before tax that falls between these thresholds, the STI is calculated according to a sliding scale formula. Effective 1 January 2019, NGE’s STI structure has been amended to bring it in line with other comparable LICs on the ASX. This has been executed pursuant to formal advice from independent remuneration consultant Mercer Consulting (Australia) Pty Ltd (see page 31 for further details). It is structured to strike a balance between remunerating the investment team fairly relative to comparable LICs and ensuring continued alignment of the investment team with shareholder returns. The amended STI structure establishes a pool of funds available for payment to members of the investment team (which currently comprises the Chief Investment Officer and Portfolio Manager) and is calculated by reference to the increase in NTA before tax over the year (Performance Fee). The total value of the pool for distribution is equal to a 10.0% share of the growth in NTA before tax (adjusted for capital raisings and share buy-backs), subject to a high water mark. Subject to exceeding the high water mark, the Performance Fee will be paid annually in arrears.
For
per
sona
l use
onl
y

DIRECTORS’ REPORT Continued
NGE Capital Limited and Controlled Entities Annual Report for the year ended 31 December 2018 29
REMUNERATION REPORT (AUDITED) (CONTINUED) b) Service Agreements The following table provides employment details of persons who were Directors or Key Management Personnel of the Group during the financial year:
Name Position held Employment arrangement Notice period
Mr David Lamm1 Executive Chairman and Chief Investment Officer
Executive Services Agreement 6 months
Mr Ilan Rimer Non-Executive Director Appointment Letter None
Mr Adam Saunders2 Executive Director and Portfolio Manager
Executive Services Agreement 2 months
Mr Leslie Smith Company Secretary and Chief Financial Officer
Executive Services Agreement 2 months
1 An Employment Services Agreement (ESA) between the Company and Mr Lamm was executed upon his
appointment to the position of Executive Chairman. The ESA is for an indefinite period and is terminable on 6 months’ notice, with fixed annual remuneration of $240,000 per annum including superannuation and a short-term incentive paid dependent on meeting certain KPIs.
2 An ESA between the Company and Mr Saunders was executed on 28 September 2017 with effect from 15 September 2017 upon his appointment to the position of Executive Director and Portfolio Manager. The ESA is for an indefinite period and is terminable on 2 months’ notice, with annual remuneration of $130,000 per annum including superannuation and a short-term incentive paid dependent on meeting certain KPIs.
For
per
sona
l use
onl
y

DIRECTORS’ REPORT Continued
NGE Capital Limited and Controlled Entities Annual Report for the year ended 31 December 2018 30
REMUNERATION REPORT (AUDITED) (CONTINUED) c) Details of remuneration Remuneration received by Directors and KMP for the years ended 31 December 2018 and 31 December 2017 is disclosed below:
Short-term employee
benefits Post-employment
benefit Other long
term benefit Termination
benefits
Cash salary
and fees Cash bonus Superannuation Long service
leave Termination
payments Total
Performance linked
compensation Name Position $ $ $ $ $ $ %
31 December 2018 Directors
D Lamm Executive Chairman and CIO 210,891 218,251 20,822 3,815 - 453,779 48.1
I Rimer Non-Executive Director 22,831 - 2,169 - - 25,000 -
A Saunders Executive Director and Portfolio Manager 119,801 118,219 11,279 811 - 250,110 47.3
Other KMP
L Smith Company Secretary and CFO 141,369 - 26,631 1,294 - 169,294 -
TOTAL 494,892 336,470 60,901 5,920 - 898,183 37.5
31 December 2017
Directors
D Lamm1 Executive Chairman 205,618 240,000 29,764 981 - 476,363 50.4
I Rimer2 Non-Executive Director 8,549 - 812 - - 9,361 -
A Saunders3 Executive Director and Portfolio Manager 67,995 37,917 6,372 34 - 112,318 33.8
Sir M Bromley4 Non-Executive Director 3,334 - - - - 3,334 -
G Worner5 Non-Executive Director 20,766 - - - - 20,766 -
Other KMP
L Smith Company Secretary and CFO 141,744 - 25,641 530 - 167,915 -
TOTAL 448,006 277,917 62,589 1,545 - 790,057 35.2
1 Title changed to Executive Chairman and Chief Investment Officer from 15 September 2017 with no
change to remuneration conditions. 2 Appointed 17 August 2017. 3 Appointed to the role of Executive Director and Portfolio Manager from 15 September 2017. 4 Ceased 24 January 2017. 5 Ceased 30 May 2017.
For
per
sona
l use
onl
y

DIRECTORS’ REPORT Continued
NGE Capital Limited and Controlled Entities Annual Report for the year ended 31 December 2018 31
REMUNERATION REPORT (AUDITED) (CONTINUED) Performance based short-term incentive included in remuneration Review of performance against KPIs
31 December
2017 31 December
2018 Increase NTA per share before tax $0.630 $0.765 21.4%
STI payment 90.9%
As the KPI of NTA per share before tax growth of less than 25% but greater than 12.5% was achieved, according to the agreed formula the Board approved an STI payment of 90.9% of fixed compensation to the Chief Investment Officer and the Portfolio Manager to be included in their remuneration for 2018. Use of remuneration consultants The Board did not seek the advice of remuneration consultants during the year ended 31 December 2018. In March 2019, Mercer Consulting (Australia) Pty Ltd (Mercer) was appointed by Ilan Rimer, Non-Executive Director, as an independent remuneration consultant to conduct a remuneration review and provide remuneration recommendations as defined in section 9B of the Corporations Act 2001. The consideration payable for this engagement was $15,000, excluding GST. Their scope of work included benchmarking NGE against a group of comparable peer companies selected by Mercer, and to make recommendations relating to the absolute levels of remuneration and the structure of remuneration that would be required to bring NGE’s remuneration practices into line with the group of peer companies. Mercer’s remuneration recommendations were provided directly to the Non-Executive Director. Mercer’s recommendations were made free of undue influence by members of Key Management Personnel to whom the recommendations relate. Voting and comments made at the Company’s 2018 Annual General Meeting At the Company’s AGM a resolution to adopt the prior year remuneration report was put to the vote and at least 75% of the votes cast were in favour of the adoption of that report. No comments were made on the remuneration report that were considered at the AGM. d) Share-based remuneration No ordinary shares or options over ordinary shares in the Company were granted as remuneration to KMP during the year.
For
per
sona
l use
onl
y

DIRECTORS’ REPORT Continued
NGE Capital Limited and Controlled Entities Annual Report for the year ended 31 December 2018 32
e) Other information Shares held by Directors and Key Management Personnel The relevant interests of Directors and KMP and their related parties in the shares of the Company during the financial year ended 31 December 2018 is set out below:
Opening balance
No. of shares Acquired
No. of shares Sold
No. of shares Closing balance
No. of shares
D Lamm 9,081,810 1,035,000 - 10,116,810
I Rimer - - - -
A Saunders 664,000 - - 664,000
L Smith - - - -
End of audited Remuneration Report.
For
per
sona
l use
onl
y

DIRECTORS’ REPORT Continued
NGE Capital Limited and Controlled Entities Annual Report for the year ended 31 December 2018 33
MEETINGS OF DIRECTORS The following table shows the number of Board and Committee meetings held during the financial year ended 31 December 2018:
Directors’ Meetings Audit Committee Remuneration
Committee1
No. eligible to attend
No. attended
No. eligible to attend
No. attended
No. eligible to attend
No. attended
D Lamm 5 5 - - - -
I Rimer 5 5 2 2 - -
A Saunders 5 5 2 2 - - 1 The Board has assumed the duties of the Remuneration Committee and deals with remuneration issues
during the year as they arise. Mr Rimer chairs the Board when it addresses remuneration matters. UNISSUED SHARES UNDER OPTION There are no options over ordinary shares of the Company as at the date of this report. INDEMNIFICATION OF DIRECTORS, OFFICERS AND AUDITORS During the financial year, the Company paid premiums in respect of contracts insuring the Directors and officers of the Company against a liability incurred by such Directors and officers to the extent permitted by the Corporations Act 2001. The nature of the liability and the amount of premium has not been disclosed due to confidentiality of the insurance contract. The Company has not otherwise, during or since the end of the year, indemnified or agreed to indemnify an officer or an auditor of the Company, or of any related body corporate, against a liability incurred by such an officer or auditor. PROCEEDINGS No person has applied to the Court under section 237 of the Corporations Act 2001 for leave to bring proceedings on behalf of the Company, or to intervene in any proceedings to which the Company is a party, for the purpose of taking responsibility on behalf of the Company for all or part of those proceedings. EVENTS ARISING SINCE THE END OF THE REPORTING PERIOD Other than the matters described below, there are no matters or circumstances that have arisen since the end of the year that have significantly affected or may significantly affect either:
• the Group’s operations in future financial years; • the results of those operations in future financial years; or • the Group’s state of affairs in future financial years.
On 7 February 2019 the Company entered into loan agreement and borrowed $3 million, at an interest rate of 10% p.a. and maturity of 12 months after the initial drawdown. The funds, along with a proportion of the Company’s existing cash balance, were applied towards the purchase of a parcel of shares in Karoon Energy Ltd (ASX:KAR). A detailed commentary on this investment was provided in the Company’s Investment and NTA update as at 28 February 2019.
For
per
sona
l use
onl
y

DIRECTORS’ REPORT Continued
NGE Capital Limited and Controlled Entities Annual Report for the year ended 31 December 2018 34
NON-AUDIT SERVICES No non-audit services were provided during the year. Refer to Note 22 of the financial statements for details of auditor remuneration. AUDITOR’S INDEPENDENCE DECLARATION A copy of the Auditor’s Independence Declaration as required under section 307C of the Corporations Act 2001 is included on page 35 of this financial report and forms part of the Directors’ Report. ROUNDING OF AMOUNTS NGE is a type of Company referred to in ASIC Corporation’s (Rounding in Financial/Directors’ Reports) Instrument 2016/191 and therefore the amounts contained in this report and in the financial report have been rounded to the nearest $1,000, or in certain cases, to the nearest dollar. Signed in accordance with a resolution of the Directors.
____________________ David Lamm Executive Chairman and Chief Investment Officer 21 March 2019
For
per
sona
l use
onl
y

Grant Thornton Audit Pty Ltd ACN 130 913 594 a subsidiary or related entity of Grant Thornton Australia Ltd ABN 41 127 556 389
‘Grant Thornton’ refers to the brand under which the Grant Thornton member firms provide assurance, tax and advisory services to their clients and/or refers to one or more member firms, as the context requires. Grant Thornton Australia Ltd is a member firm of Grant Thornton International Ltd (GTIL). GTIL and the member firms are not a worldwide partnership. GTIL and each member firm is a separate legal entity. Services are
delivered by the member firms. GTIL does not provide services to clients. GTIL and its member firms are not agents of, and do not obligate one another and are not liable for one another’s acts or omissions. In the Australian context only, the use of the term ‘Grant Thornton’ may refer to Grant Thornton Australia Limited ABN 41 127 556 389 and its Australian subsidiaries and related entities. GTIL is not an Australian related entity to
Grant Thornton Australia Limited.
Liability limited by a scheme approved under Professional Standards Legislation.
www.grantthornton.com.au
Collins Square, Tower 5 727 Collins Street Melbourne Victoria 3008 Correspondence to: GPO Box 4736 Melbourne Victoria 3001 T +61 3 8320 2222 F +61 3 8320 2200 E [email protected] W www.grantthornton.com.au
Auditor’s Independence Declaration
To the Directors of NGE Capital Limited
In accordance with the requirements of section 307C of the Corporations Act 2001, as lead auditor for the audit of NGE Capital
Limited for the year ended 31 December 2018, I declare that, to the best of my knowledge and belief, there have been:
a no contraventions of the auditor independence requirements of the Corporations Act 2001 in relation to the audit; and
b no contraventions of any applicable code of professional conduct in relation to the audit.
Grant Thornton Audit Pty Ltd
Chartered Accountants
Michael Climpson
Partner
Melbourne, 21st March 2019
For
per
sona
l use
onl
y

CORPORATE GOVERNANCE STATEMENT
NGE Capital Limited and Controlled Entities Annual Report for the year ended 31 December 2018 36
The Board is committed to achieving and demonstrating the highest standards of corporate governance. As such, NGE Capital Limited and its Controlled Entities (Group) have adopted the 3rd edition of the Corporate Governance Principles and Recommendations which was released by the ASX Corporate Governance Council on 27 March 2015 and became effective for the financial years beginning on or after 1 July 2015. The Board has reviewed the consultation draft of the 4th edition of the Corporate Governance Principles and Recommendations. A final edition is due to be released in early 2019, and is expected to take effect for an entity’s first full financial year commencing on or after 1 July 2019. As such the financial year ended 31 December 2020 is expected to be the first period in which the new edition applies to the Group. The Group’s Corporate Governance Statement for the financial year ending 31 December 2018 is dated as 21 March 2019 and was approved by the Board on 21 March 2019. The Corporate Governance Statement is available on NGE Capital Limited’s website at: http://ngecapital.com.au/investor-information/corporate-governance/
For
per
sona
l use
onl
y

CONSOLIDATED STATEMENT OF PROFIT OR LOSS AND OTHER COMPREHENSIVE INCOME For the year ended 31 December 2018
NGE Capital Limited and Controlled Entities Annual Report for the year ended 31 December 2018 37
2018 2017
Notes $’000 $’000
Revenue 5 305 735
Change in fair value of financial instruments held at fair value through profit or loss
5,900 5,351
Employee benefits expense (892) (764)
Gain/(loss) from foreign exchange differences 39 (69)
Other expenses 6 (338) (367)
Profit before income tax 5,014 4,886
Income tax benefit 9 2,020 -
Profit from continuing operations after income tax 7,034 4,886
(Loss) from discontinued operations after income tax 10 - (205)
Other comprehensive income
Other comprehensive income for the year, net of tax - -
Other comprehensive income for the year - -
Total comprehensive income for the year attributable to members of the Parent Entity
7,034
4,681
Cents Cents
Basic and diluted earnings/(loss) per share
From continuing operations 7 18.83 12.65
From discontinued operations 7 - (0.53)
Total 18.83 12.12
Note: This statement should be read in conjunction with the notes to the financial statements.
For
per
sona
l use
onl
y

CONSOLIDATED STATEMENT OF FINANCIAL POSITION For the year ended 31 December 2018
NGE Capital Limited and Controlled Entities Annual Report for the year ended 31 December 2018 38
2018 2017
Notes $’000 $’000
Assets
Cash and cash equivalents 16 2,095 5,296
Trade and other receivables 17 20 22
Financial assets held at fair value through profit or loss 12 26,770 18,655
Other assets 18 42 41
Deferred tax assets 19 2,020 -
Total Assets 30,947 24,014
Liabilities
Trade and other payables 20 429 379
Provisions 21 17 10
Total Liabilities 446 389
Net Assets 30,501 23,625
Equity
Issued capital 14 78,136 78,293
Reserves 14 - 11,377
Accumulated losses (47,635) (66,045)
Total Equity 30,501 23,625
Note: This statement should be read in conjunction with the notes to the financial statements.
For
per
sona
l use
onl
y

STATEMENT OF CHANGES IN EQUITY For the year ended 31 December 2018
NGE Capital Limited and Controlled Entities Annual Report for the year ended 31 December 2018 39
Share capital
Accumulated losses
Option reserve
Equity component of
convertible instrument Total equity
$’000 $’000 $’000 $’000 $’000
Balance at 31 December 2016 79,939 (70,716) 7,894 3,483 20,600
Total comprehensive income for the year
- 4,681 - - 4,681
Prior year adjustment - (10) - - (10)
Transactions with owners in their capacity as owners:
Share buy-back (1,646) - - - (1,646)
Balance at 31 December 2017 78,293 (66,045) 7,894 3,483 23,625
Total comprehensive income for the year
- 7,034 - - 7,034
Transfer from reserves - 11,377 (7,894) (3,483) -
Prior year adjustment - (1) - - (1)
Transactions with owners in their capacity as owners:
Share buy-back (157) - - - (157)
Balance at 31 December 2018 78,136 (47,635) - - 30,501 Note: This statement should be read in conjunction with the notes to the financial statements.
For
per
sona
l use
onl
y

CONSOLIDATED STATEMENT OF CASH FLOWS For the year ended 31 December 2018
NGE Capital Limited and Controlled Entities Annual Report for the year ended 31 December 2018 40
2018 2017
Notes $’000 $’000
Cash Flow from Operating Activities
Payments to suppliers and employees (1,150) (914)
Payments for equity investments (20,817) (16,544)
Proceeds from sale of equity investments 18,754 9,083
Interest received 161 248
Dividends received 127 336
Underwriting income 10 128
Net cash (used in) operating activities 15 (2,915) (7,663)
Cash Flow from Investing Activities
Loans advanced to joint venture (144) (35)
Proceeds from refund of security deposits - 71
Net cash (used in) investing activities (144) (169)
Cash Flow from Financing Activities
Payments for share buy-back (169) (1,635)
Interest paid (1) -
Net cash (used in) financing activities (170) (1,635)
Net (decrease) in cash and cash equivalents held (3,229) (9,467)
Cash at beginning of period 5,296 14,816
Effect of exchange rates on cash holding in foreign currencies 28 (53)
Cash at end of period 16 2,095 5,296 Note: This statement should be read in conjunction with the notes to the financial statements.
For
per
sona
l use
onl
y

NOTES TO THE FINANCIAL STATEMENTS
NGE Capital Limited and Controlled Entities Annual Report for the year ended 31 December 2018 41
1. NATURE OF OPERATIONS The Group’s principal activities are to make investments in listed and unlisted securities. The Company is an internally managed Listed Investment Company. These principal activities had effect from NGE’s reinstatement to official quotation on the ASX on 30 November 2016 following its application to change the nature of its activities. Prior to this date the Group’s principal activities consisted of exploration for oil and gas in Papua New Guinea. 2. GENERAL INFORMATION AND STATEMENT OF COMPLIANCE The consolidated general financial statements of the Group have been prepared in accordance with the requirements of the Corporations Act 2001, Australian Accounting Standards and other authoritative pronouncements of the Australian Accounting Standards Board (AASB). Compliance with Australian Accounting Standards results in full compliance with the International Financial Reporting Standards (IFRS) as issued by the International Accounting Standards Board (IASB). NGE is a for-profit entity for the purpose of preparing the financial statements. NGE is the Group’s ultimate parent company. NGE is a public company incorporated and domiciled in Australia. The address of its registered office and principal place of business is Level 4 North Building 333 Collins Street, Melbourne VIC 3000. The consolidated financial statements for the year ended 31 December 2018 were approved and authorised for issue by the board of directors on 21 March 2019. 3. SUMMARY OF ACCOUNTING POLICIES a) Overall considerations The consolidated financial statements have been prepared using the significant accounting policies and measurement bases summarised below. Going concern basis of accounting The financial report has been prepared on the going concern basis, which contemplates continuity of normal business activities and the realisation of assets and settlement of liabilities in the ordinary course of business. b) Basis of consolidation The Group financial statements consolidate those of the Parent Company and its subsidiary as of 31 December 2018. The Parent controls a subsidiary if it is exposed, or has rights, to variable returns from its involvement with the subsidiary and has the ability to affect those returns through its power over the subsidiary. The subsidiary has a reporting date of 31 December. All transactions and balances between Group companies are eliminated on consolidation, including unrealised gains and losses on transactions between Group companies. Where unrealised losses on
For
per
sona
l use
onl
y
NOTES TO THE FINANCIAL STATEMENTS Continued
NGE Capital Limited and Controlled Entities Annual Report for the year ended 31 December 2018 42
3. SUMMARY OF ACCOUNTING POLICIES (CONTINUED) b) Basis of consolidation (continued) intra-group asset sales are reversed on consolidation, the underlying asset is also tested for impairment from a group perspective. Amounts reported in the financial statements of subsidiaries have been adjusted where necessary to ensure consistency with the accounting policies adopted by the Group Profit or loss and other comprehensive income of subsidiaries acquired or disposed of during the year are recognised from the effective date of acquisition, or up to the effective date of disposal, as applicable. Non-controlling interests, presented as part of equity, represent the portion of a subsidiary's profit or loss and net assets that is not held by the Group. The Group attributes total comprehensive income or loss of subsidiaries between the owners of the parent and the non-controlling interests based on their respective ownership interests. c) Foreign currency translation Functional and presentation currency The consolidated financial statements are presented in Australian dollars (AUD), which is also the functional currency of the parent company. Foreign currency transactions and balances Foreign currency transactions are translated into the functional currency of the respective Group entity, using the exchange rates prevailing at the dates of the transactions (spot exchange rate). Foreign exchange gains and losses resulting from the settlement of such transactions and from the re-measurement of monetary items at year end exchange rates are recognised in profit or loss. Non-monetary items are not retranslated at year-end and are measured at historical cost (translated using the exchange rates at the date of the transaction), except for non-monetary items measured at fair value which are translated using the exchange rates at the date when fair value was determined. Foreign operations In the Group's financial statements, all assets, liabilities and transactions of Group entities with a functional currency other than the AUD are translated into AUD upon consolidation. The functional currency of the entities in the Group has remained unchanged during the reporting period. On consolidation, assets and liabilities have been translated into AUD at the closing rate at the reporting date. Income and expenses have been translated into AUD at the average rate over the reporting period. Exchange differences are charged/credited to other comprehensive income and recognised in the currency translation reserve in equity. On disposal of a foreign operation the cumulative translation differences recognised in equity are reclassified to profit or loss and recognised as part of the gain or loss on disposal. d) Revenue and income recognition Revenue Revenue is recognised and measured at the fair value of the consideration received or receivable to the extent that it is probable that the economic benefits will flow to the Group and the revenue can be reliably measured. Net gains/(losses) on financial assets held at fair value through profit or loss arising on a change in fair value are calculated as the difference between the fair value at the period end and the fair value at the previous valuation point. Net gains/(losses) do not include interest or dividend income.
For
per
sona
l use
onl
y

NOTES TO THE FINANCIAL STATEMENTS Continued
NGE Capital Limited and Controlled Entities Annual Report for the year ended 31 December 2018 43
3. SUMMARY OF ACCOUNTING POLICIES (CONTINUED) d) Revenue and income recognition (continued) Dividends Dividend income is recognised on the ex-dividend date with any corresponding foreign withholding tax recorded as an expense. Interest income Interest income is recognised on a time proportionate basis taking into account the effective interest rates applicable to the financial assets. e) Operating expenses Operating expenses are recognised in the Consolidated Statement of Profit or Loss and Other Comprehensive Income on an accruals basis. f) Earnings per share Basic earnings per share amounts are calculated by dividing net profit for the year attributable to shareholders of the parent company by the weighted average number of ordinary shares outstanding during the year. Diluted earnings per share amounts are calculated by dividing net profit for the year attributable to shareholders of the parent company, as adjusted for the effect of dilutive potential ordinary shares where applicable, by the weighted average number of ordinary shares outstanding during the year plus the weighted average of ordinary shares that would be issued on the conversion of all dilutive potential ordinary shares into ordinary shares. g) Income tax Tax expense recognised in profit or loss comprises the sum of deferred tax and current tax not recognised in other comprehensive income or directly in equity. Current income tax assets and/or liabilities comprise those obligations to, or claims from, the Australian Taxation Office and other fiscal authorities relating to the current or prior reporting periods, that are unpaid at the reporting date. Current tax is payable on taxable profit which differs from profit or loss in the financial statements. Calculation of current tax is based on tax rates and tax laws that have been enacted or substantively enacted by the end of the reporting period. Deferred income taxes are calculated using the liability method on temporary differences between the carrying amounts of assets and liabilities and their tax bases. However deferred tax is not provided on the initial recognition of goodwill, or on the initial recognition of an asset or liability unless the related transaction is a business combination or affects tax or accounting profit. Deferred tax on temporary differences associated with investments in subsidiaries and joints ventures is not provided if reversal of these temporary differences can be controlled by the Group and it is probable that reversal will not occur in the foreseeable future. Deferred tax assets and liabilities are calculated, without discounting, at tax rates that are expected to apply to their respective period of realisation, provided they are enacted or substantively enacted by the end of the reporting period.
For
per
sona
l use
onl
y

NOTES TO THE FINANCIAL STATEMENTS Continued
NGE Capital Limited and Controlled Entities Annual Report for the year ended 31 December 2018 44
3. SUMMARY OF ACCOUNTING POLICIES (CONTINUED) g) Income tax (continued) Deferred tax assets are recognised to the extent that it is probable they will be able to be utilised against future taxable income, based on the Group’s forecast of future operating results which is adjusted for significant non-taxable income and expenses and specific limits to the use of any unused tax loss or credit. Deferred tax liabilities are always provided for in full. Deferred tax assets and liabilities are offset only when the Group has a right and intention to set off current tax assets and liabilities from the same tax authority. Changes in deferred tax assets or liabilities are recognised as a component of tax income or expenses in profit or loss, except where they relate to items that are recognised in other comprehensive income (such as the revaluation of land) or directly in equity, in which case the related deferred tax is also recognised in other comprehensive income or equity respectively. h) Investments in financial assets Classification The Company's investments are classified as at fair value through profit or loss. They comprise: Financial assets designated at fair value through profit or loss All financial assets are held at fair value through profit or loss. These include financial assets that are not held for trading purposes and which may be sold. These are investments in exchange traded or unlisted securities. Recognition and derecognition Purchases and sales of financial assets at fair value through profit or loss are recognised on the trade date, being the date on which the Company commits to purchase or sell the asset. Financial assets are derecognised when the rights to receive cash flows from the financial assets have expired or have been transferred and the Company has transferred substantially all the risks and rewards of ownership. Measurement Financial assets held at fair value through profit or loss Changes in fair value and transaction costs are recognised in profit or loss. Fair value in an active market The fair value of listed investments is based on their quoted market prices at the reporting date without any deduction for estimated future selling costs. The quoted market price used for financial assets held by the Group is the current close price. Net gains/(losses) on financial assets held at fair value through profit or loss arising on a change in fair value are calculated as the difference between the fair value at period end and the fair value at the previous valuation point. Net gains/(losses) do not include interest or dividend income. The Company’s Investment Valuation Policy is discussed in Note 12.
For
per
sona
l use
onl
y

NOTES TO THE FINANCIAL STATEMENTS Continued
NGE Capital Limited and Controlled Entities Annual Report for the year ended 31 December 2018 45
3. SUMMARY OF ACCOUNTING POLICIES (CONTINUED) i) Investments in joint ventures A joint venture is an arrangement that the Group controls jointly with one or more other investors, and over which the Group has rights to a share of the arrangement’s net assets rather than direct rights to underlying assets and obligations for underlying liabilities. Investments in joint ventures are initially recognised at cost and subsequently accounted for using the equity method. The carrying amount of the investments in joint ventures is increased or decreased to recognise the Group’s share of the profit or loss and other comprehensive income of the joint venture, adjusted where necessary to ensure consistency with the accounting policies of the Group. j) Equity, reserves and accumulated losses Share capital represents the fair value of shares that have been issued. Any transaction costs associated with the issuing of shares are deducted from share capital, net of any related income tax benefits. The Option Reserve records items recognised as expense on share options and rights granted for compensation and services rendered. The options and rights have been valued at the invoiced amounts or, if grated for nil consideration, at fair value. The Equity component of convertible instrument reserve recognises the fair value of convertible equity bonds issued in previous years. Accumulated losses include all current and prior accumulated losses. k) Cash and cash equivalents Cash and cash equivalents comprise cash on hand and demand deposits, together with other short-term highly liquid investments that are readily convertible into known amounts of cash and which are subject to an insignificant risk of changes in value. l) Receivables Receivables represent the principal amounts due at balance date plus accrued interest and less, where applicable, any unearned income and provisions for doubtful debts. m) Provisions Provisions are recognised when the Group has a legal or constructive obligation, as a result of past events, for which it is probable than an outflow of economic benefits will result, and that outflow can be readily measured. Provision is made for the Group’s liability for employee benefits arising from the services rendered by employees to the end of the reporting period. Employee benefits that are expected to be wholly settled within one year have been measured at the amounts expected to be paid when the lability is settled, plus related on-costs. Employee benefits payable later than one year have been measured at the present value of the estimated future cash outflows to be made for those benefits. n) Parent entity financial information The financial information for the parent entity, NGE Capital Limited, has been prepared on the same basis as the consolidated financial statements.
For
per
sona
l use
onl
y

NOTES TO THE FINANCIAL STATEMENTS Continued
NGE Capital Limited and Controlled Entities Annual Report for the year ended 31 December 2018 46
3. SUMMARY OF ACCOUNTING POLICIES (CONTINUED) o) Goods and services tax (GST) Revenues, expenses and assets are recognised net of the amount of GST, except where the amount of GST incurred is not recoverable from the Tax Office. In these circumstances the GST is recognised as part of the cost of acquisition of the asset or as part of an item of the expense. Receivables and payables in the statement of financial position are shown inclusive of GST. Cash flows are presented in the statement of cash flows on a gross basis, except for the GST components of investing and financing activities, which are disclosed as operating cash flows. p) Rounding of amounts NGE Capital Limited is a type of Company referred to in ASIC Corporations (Rounding in Financial/Directors’ Reports) Instrument 2016/191 and therefore the amounts contained in this report and in the financial report have been rounded to the nearest $1,000, or in certain cases, to the nearest dollar. q) Significant management judgement in applying accounting policies When preparing the financial statements, management undertakes a number of judgements, estimates and assumptions about the recognition and measurement of assets, liabilities, income and expenses. The following are significant management judgements in applying the accounting policies of the Group that have the most significant effect on the financial statements. Carrying value of investments in unlisted securities The best available evidence of fair value during the first 12 months of ownership is usually the cost of the investment, unless there is an apparent change in circumstances which would indicate the need for a new valuation. Such a circumstance may include observing the price from a recent transaction of an investment, provided the relevant transaction occurred sufficiently close to the measurement date (usually within 12 months). In the absence of a recent transaction providing a reliable estimate, the fair value of unlisted direct securities will be calculated with reference to appropriate valuation methods including, but not limited to, an assessment of the investment’s cash flows, comparable transactions, and comparable listed assets. Carrying value of investments accounted for using the equity method The Group has assessed the carrying value of its 50% owned investment in the joint venture entity, Western Drilling Limited, which is accounted for using the equity method. Details of the assessment are included in Note 13. Impairments The Group assesses impairment at the end of each reporting period by evaluating conditions and events specific to the Group that may be indicative of impairment trigger. Recoverable amounts of relevant assets are reassessed using the higher of fair value less costs of disposal and value-in-use calculations which incorporate various key assumptions.
For
per
sona
l use
onl
y

NOTES TO THE FINANCIAL STATEMENTS Continued
NGE Capital Limited and Controlled Entities Annual Report for the year ended 31 December 2018 47
3. SUMMARY OF ACCOUNTING POLICIES (CONTINUED) Recovery of deferred tax assets Deferred tax assets are recognised for deductible temporary differences only if the Group considers it is probable that future taxable amounts will be available to utilise those temporary differences and losses. Judgement is required in determining whether it is probable that the tax losses will be utilised against future taxable income and the quantum of the amount which is considered probable. Details of deferred tax assets are included in Note 9.
For
per
sona
l use
onl
y
NOTES TO THE FINANCIAL STATEMENTS Continued
NGE Capital Limited and Controlled Entities Annual Report for the year ended 31 December 2018 48
4. CHANGES IN ACCOUNTING POLICIES a) New and revised standards that are effective for these financial statements Some new standards, amendments to standards and interpretations became effective for the first time to annual reporting periods beginning on or after 1 January 2018.
Standard/Interpretation Application date
of standard Application date for the Company
AASB 9 “Financial Instruments”, and the relevant amending standards 1 January 2018 1 January 2018
AASB 15 “Revenue from contracts with customers” 1 January 2018 1 January 2018 IFRIC 22 “Foreign Currency Transactions and Advance Consideration” 1 January 2018 1 January 2018
AASB 2016-1 “Amendments to AAS – Recognition of Deferred Tax Assets for Unrealised Losses” 1 January 2017 1 January 2018
AASB 2016-2 “Amendments to AAS – Disclosure Initiative: Amendments to AASB 107” 1 January 2017 1 January 2018
AASB 2017-5 “Amendments to AAS -AASB 10 and AASB 128” 1 January 2018 1 January 2018
The adoption of AASB 9 Financial Instruments had no material impact on the Group as all investments were previously classified at fair value through profit or loss as at 31 December 2017 and this still applied under the new standard. The adoption of AASB 15 Revenue form contracts with customers had no material impact of the Group as the Group receives no material revenue from contracts with customers. Application of the other new or revised standards has not had a material impact on the Group. b) Standards and interpretations in issue but not yet adopted As at the report date, the standards and interpretations listed below were in issue but not yet effective and are available for early adoption.
Standard/Interpretation
Effective for annual reporting
periods beginning on or after
Expected application
date for the Company
AASB 16 “Leases” 1 January 2019 1 January 2019
AASB 2017-4 “Uncertainty over Income Tax Treatments” 1 January 2019 1 January 2019
AASB 2017-6 “Amendments to AAS Prepayment features with Negative Compensation” 1 January 2019 1 January 2019
AASB 2017-7 “Amendments to AAS - Long term interests in associates and joint ventures” 1 January 2019 1 January 2019
AASB 2018-1 “Annual improvements to IFRS Standards 2015-2017 Cycle” 1 January 2019 1 January 2019
AASB 2018-2 “Plan amendment, Curtailment or Settlement” 1 January 2019 1 January 2019
With the exception of AASB 16 “Leases” the potential effect of these standards on the Group’s financial statements has not yet been determined. However, based on a preliminary assessment, they are not expected to have a material impact on the amounts recognised in the financial statements. AASB 16 - Leases The Company has a licence to occupy business premises until 31 July 2021. Future licence commitments total $178,526. Adoption of AASB 16, using the modified retrospective approach as at 1 January 2019, will result in the initial recognition of a Right of Use Asset of $171,470 and a Lease Liability of $171,470.
For
per
sona
l use
onl
y

NOTES TO THE FINANCIAL STATEMENTS Continued
NGE Capital Limited and Controlled Entities Annual Report for the year ended 31 December 2018 49
5. REVENUE AND OTHER INCOME FROM CONTINUING OPERATIONS 2018 2017 $’000 $’000 Interest income 161 237 Dividend income 134 370 Underwriting income 10 128
Total 305 735
6. OTHER EXPENSES INCURRED IN CONTINUING OPERATIONS 2018 2017
$’000 $’000
Directors’ fees 25 33
Audit, professional and legal fees 80 124
Listing costs 55 56
Operating leases 67 64
Other 111 90
Total 338 367
7. EARNINGS PER SHARE 2018 2017 $’000 $’000
Profit/(loss) from continuing operations attributable to the ordinary equity holders used in the calculation of basic and dilutive earnings per share 7,034 4,886
Profit/(loss) from discontinued operations attributable to the ordinary equity holders used in the calculation of basic and dilutive earnings per share - (205)
Number Number
Weighted average number of ordinary shares outstanding during the year used in the calculation of basic and diluted earnings per share. 37,349,290 38,632,716
Basic and diluted earnings per share 2018 2017 Cents Cents Earnings from continuing operations 18.83 12.65 Earnings from discontinued operations - (0.53)
8. SEGMENT REPORTING The Group has only one reportable segment. The Group is engaged solely in investment activities conducted from Australia, deriving revenue from dividend income, interest income and from the sale of investments.
For
per
sona
l use
onl
y

NOTES TO THE FINANCIAL STATEMENTS Continued
NGE Capital Limited and Controlled Entities Annual Report for the year ended 31 December 2018 50
9. INCOME TAX EXPENSE The reconciliation of prima facie tax payable to reported income tax expense/(benefit) is as follows: 2018 2017 $’000 $’000 Profit before tax 5,014 4,681 Domestic tax rate 27.5% 27.5%
Prima facie tax expense 1,379 1,287
Adjustments for tax effect of:
Non-temporary differences - 90
Previously unrecognised tax losses now recouped to reduce current tax expense (4,316) (1,375)
Temporary differences and tax losses not recognised 917 (2)
Income tax expense/(benefit) (2,020) -
Tax losses
Unused Australian losses which have been recognised as a deferred tax asset1 7,360 -
Unused Australian losses for which no tax loss has been recognised as a deferred tax asset2
33,642
25,801
Unrealised Australian losses/(gains) (net) 3,289 (3,587)
Total Australian unused and unrealised losses 44,291 22,214
Potential tax benefit of unused and unrealised losses at 27.5% (2017: 27.5%)3 12,180 6,109
Potential tax benefit of unused and unrealised losses – $ per share $0.33 $0.16 1 A deferred tax asset of $2.020 million (potential tax benefit at 27.5% of $7.360 million) has been
recognised on unused Australian tax losses of the Company. The deferred tax asset has been recognised as at 31 December 2018 based on the following management judgements: i) The Company has experienced its second consecutive full year of profitability since
becoming a LIC on 30 November 2016; and ii) By applying the average Australian and International share returns since 1970 of 9.75% p.a.
over a 4-year investment time horizon, the Board considers it is probable that sufficient future taxable profits will be available to offset the amount of the deferred tax asset.
2 This represents total realised tax losses and capital losses which are unused and have not been
recognised as a deferred tax asset. 3 The taxation benefits will only be obtained if:
i) The Group derives future assessable income of a nature and of an amount sufficient to enable the benefit from the deduction for the loss to be realised;
ii) The Group continues to comply with the conditions for deductibility imposed by law and, in particular, as long as NGE continues to satisfy the continuity of ownership test as set out in Divisions 165 and 166 of the Income Tax Assessment Act 1997 (Cth); and
iii) No changes in tax legislation adversely affect the Group in realising the benefits from the deductions for the loss.
Not included in the above table:
• Unused PNG losses of $45.282 million (2017: $45.282 million) for which no tax loss has been recognised because of the uncertainty of being able to use them.
For
per
sona
l use
onl
y

NOTES TO THE FINANCIAL STATEMENTS Continued
NGE Capital Limited and Controlled Entities Annual Report for the year ended 31 December 2018 51
9. INCOME TAX EXPENSE (CONTINUED)
• The impaired value of certain investments in PNG and Australia which may in future give rise to further Australian tax losses.
10. DISCONTINUED OPERATIONS In 2016 the Company received the requisite approvals to change the nature of its operations to a Listed Investment Company. The Company’s previous principal activity, exploration for oil and gas in Papua New Guinea has been treated as a discontinued operation. Continuing activities for this disclosure have been treated as investment activities and those administrative activities required to operate an ASX listed corporation. 2018 2017
$’000 $’000
Expenses incurred in discontinued operations
Impairment of deferred exploration expenditure - (205)
Loss for the year - (205)
Cash flows generated by discontinued operations for the reporting periods are as follows:
Investing activities - (205) As at 31 December 2018 the carrying amounts of the net assets associated with exploration activities were $ Nil (2017: $ Nil).
For
per
sona
l use
onl
y

NOTES TO THE FINANCIAL STATEMENTS Continued
NGE Capital Limited and Controlled Entities Annual Report for the year ended 31 December 2018 52
11. FINANCIAL RISK MANAGEMENT a) Risk management objectives and policies The Group’s financial instruments consist mainly of cash and deposits with banks, accounts receivable and payable and loans to subsidiaries and its joint venture entity. The Group’s overall risk management program seeks to minimise potential adverse effects on the financial performance of the group and may use a range of derivative financial instruments to manage risk exposures. The main risks arising from the Group’s financial instruments are foreign currency risk, interest rate risk, credit risk, liquidity risk and price risk. Senior management, in conjunction with the Board, reviews and agrees policies for managing each of these risks. b) Foreign currency risk The Group is exposed to foreign currency risk on holding currencies other than Australian dollars. The currencies giving rise to this are the CAD, GBP, HKD, PGK, USD. The Group does not currently enter into derivative financial instruments to hedge such transactions denominated in a foreign currency. At 31 December 2018, the Group had the following exposure to various foreign currencies:
2018 2017
$’000 $’000
Financial assets
Cash and cash equivalents 11 87
Trade and other receivables 18 21
Financial assets held at fair value through profit or loss 11,606 483
Other assets 2 1
Other long-term assets 263 110
11,900 702
Financial liabilities
Trade and other payables - Current (10) (42)
Net exposure 11,890 660 The Group has performed sensitivity analysis relating to its exposure to foreign currency risk at balance date. This sensitivity analysis demonstrates the effect on the net exposure which could result from a change in this risk. 2018 2017 Sensitivity Analysis- Increase/(decrease) in net exposure $’000 $’000 Australian dollar depreciates by 5% against CAD 7 - Australian dollar depreciates by 5% against GBP 208 - Australian dollar depreciates by 5% against HKD 262 - Australian dollar depreciates by 5% against PGK 13 8 Australian dollar depreciates by 5% against USD 76 23 Australian dollar appreciates by 5% against CAD (7) - Australian dollar appreciates by 5% against GBP (208) - Australian dollar appreciates by 5% against HKD (262) - Australian dollar appreciates by 5% against PGK (13) (8) Australian dollar appreciates by 5% against USD (76) (23)
For
per
sona
l use
onl
y

NOTES TO THE FINANCIAL STATEMENTS Continued
NGE Capital Limited and Controlled Entities Annual Report for the year ended 31 December 2018 53
11. FINANCIAL RISK MANAGEMENT (CONTINUED) c) Interest rate risk At 31 December 2018, the Group had no fixed or floating rate debt and had the following mix of financial assets exposed to variable interest rate risk: 2018 2017
Financial assets $’000 $’000
Cash and cash equivalents 2,084 5,209
Total 2,084 5,209
The Group has performed sensitivity analysis relating to its exposure to interest rate risk and price risk at balance date. This sensitivity analysis demonstrates the effect on the current year results which could result from a change in these risks. 2018 2017
Interest rate sensitivity analysis $’000 $’000
Increase/(decrease) in profit/(loss)
- increase in interest rate by 2% 103 190
- decrease in interest rate by 2% (103) (190) d) Credit risk The maximum exposure to credit risk, excluding the value of any collateral or other security, at balance date, to recognised financial assets, is the carrying amount, net of any provision for impairment of those assets, as disclosed in the Statement of Financial Position and notes to the financial statements. The Group does not have any material credit risk exposure to any single debtor or group of debtors under financial instruments entered into by the group other than the loans to and accrued interest receivable from its 50% owned joint venture entity, Western Drilling Limited and its subsidiary. At balance date 2015 all loans and interest receivable were fully impaired. The carrying value of the Group’s investment in WDL at balance date 2018 is $263,000.
For
per
sona
l use
onl
y

NOTES TO THE FINANCIAL STATEMENTS Continued
NGE Capital Limited and Controlled Entities Annual Report for the year ended 31 December 2018 54
11. FINANCIAL RISK MANAGEMENT (CONTINUED) e) Liquidity risk Liquidity risk is the risk that the Group might be unable to meet its obligations. The Group manages its liquidity needs by continuously monitoring forecast and actual cash flows and ensuring there are appropriate plans in place to finance these future cash flows. As at 31 December, the Group holds $2.095 million in cash and has no borrowings. As at 31 December, the Group’s non-derivative financial liabilities have contractual maturities (including interest payments where applicable) as summarised below: Current Non-current
< 1 year 1 to 5 years Later than
5 years
$’000 $’000 $’000
2018
Trade and other payables 429 - -
Total 429 - -
2017
Trade and other payables 379 - -
Total 379 - - The above amounts reflect the contractual undiscounted cash flows, which may differ to the carrying values of the liabilities at reporting date. f) Price risk The Group is exposed to movement in market prices of its equity investments. As the Group does not derive revenue from sale of products, the effect on profit and equity as a result of changes in the price risk is not considered material. Equity investment in listed shares is subject to movement in the market prices of the shares.
For
per
sona
l use
onl
y

NOTES TO THE FINANCIAL STATEMENTS Continued
NGE Capital Limited and Controlled Entities Annual Report for the year ended 31 December 2018 55
12. FAIR VALUE MEASUREMENT The Group measures and recognises the following assets at fair value on a recurring basis:
• Financial assets held at fair value through profit or loss There are no assets or liabilities measured at fair value on a non-recurring basis in the current reporting period. Fair value hierarchy AASB 13 requires disclosure of fair value measurements by level of the following fair value measurement hierarchy.
• Level 1: quoted prices (unadjusted) in active markets for identical assets or liabilities that the entity can access at the measurement date.
• Level 2: inputs other than quoted prices included within Level 1 that are observable for the asset or liability, either directly (i.e. as prices) or indirectly (i.e. derived from prices). These include quoted prices for similar assets or liabilities in active markets.
• Level 3: inputs for the asset or liability that are not based on observable market data (unobservable inputs).
The table below presents the financial assets (by class) measured and recognised at fair value at 31 December 2018. Level 1 Level 2 Level 3 Total
2018 $’000 $’000 $’000 $’000
Financial Assets at fair value through profit or loss
Listed equity securities 19,649 - - 19,649
Unlisted convertible notes - - 750 750
Unlisted equities - - 6,371 6,371
Total Financial Assets at fair value through profit or loss 19,649 - 7,121 26,770
2017
Financial Assets at fair value through profit or loss
Listed equity securities 13,950 - - 13,950
Unlisted convertible notes - - 750 750
Unlisted equities - - 3,955 3,955
Total Financial Assets at fair value through profit or loss 13,950 - 4,705 18,655 Valuation techniques used to determine fair values Assets in the Group’s investment portfolio are valued in accordance with the Group’s published Investment Valuation policy, a summary of which is provided below. This summary does not purport to be complete, and readers should refer to the full Investment Valuation Policy which is available on the Group’s website.
For
per
sona
l use
onl
y

NOTES TO THE FINANCIAL STATEMENTS Continued
NGE Capital Limited and Controlled Entities Annual Report for the year ended 31 December 2018 56
12. FAIR VALUE MEASUREMENT (CONTINUED) LEVEL 1 The fair value of investments that are traded in an active market (for example, listed equities) is determined using the last traded quoted price in an active market. As at 31 December 2018, the Company had $19,649,000 (2017: $13,950,000) financial assets held at fair value through profit or loss included in Level 1. As at 31 December 2018 the Company had $ Nil (2017: $ Nil) financial liabilities held at fair value through profit or loss included in Level 1. LEVEL 2 The fair value of investments that are not traded in an active market (for example, unlisted securities) is determined by reference to quoted prices for similar assets or liabilities in active markets. As at 31 December 2018, the Company had $ Nil (2017: $ Nil) investments in Level 2. LEVEL 3 If one or more of the significant inputs is not based on observable market data, the investment is included in Level 3. The fair value of unlisted securities for the first 12 months of ownership is usually valued at the cost of the investment, unless there is an apparent change in circumstances which would indicate the need for a new valuation. Such a circumstance may include observing the price from a recent transaction of an investment, provided the relevant transaction occurred sufficiently close to the measurement date (usually within 12 months). In the absence of a recent transaction providing a reliable estimate, the fair value of unlisted direct securities will be calculated with reference to appropriate valuation methods including, but not limited to, an assessment of the investment’s cash flows, comparable transactions, and comparable listed assets. As at 31 December 2018, the Company had $7,121,000 (2017: $4,705,000) of investments held at fair value through profit or loss included in Level 3. Valuation of Powerwrap Limited as at 31 December 2018 In June 2017 the Company invested $3.6m in Powerwrap Limited (Powerwrap) at a price per share of $0.06 as part of a $19.6m capital raising, implying a total equity valuation of ~$40m. The issue price was considered the best available evidence of fair value and this investment was initially valued at $3.6m. In April 2018 Powerwrap completed a $7.25m capital raising at $0.10 per share, valuing Powerwrap at ~$75m. Due to the significance of this capital raising, and in accordance with the Company’s Investment Valuation policy, the Board resolved to adjust the valuation of the Company’s holding in Powerwrap up by $0.04 per share ($2.4m) to $0.10 per share ($6.0m). Valuation of Cody Live Pty Ltd as at 31 December 2018 In March 2017 the Company invested $250,000 in Cody Live Pty Ltd (Cody Live) at a price per share of $0.22. The issue price was considered the best available evidence of fair value and this investment was initially valued at $250,000. During the period Cody Live undertook a capital raise at $0.10 per share with a free attaching 1:5 option. NGE participated in this capital raise, investing a further $20,000. The Board considers the latest share issue price is the best available evidence of fair value and accordingly resolved to adjust the fair value of the Company’s initial holding in Cody Live down by $0.12 per share ($136,000) to $0.10 per share ($114,000). The Board also invested $750,000 in Cody Live convertible notes in March/April 2017. These convertible notes accrue interest at 6.50% per annum, payable quarterly in arrears with the option, at the holder’s election, of being converted into ordinary shares prior to maturity at $0.25 per share.
For
per
sona
l use
onl
y

NOTES TO THE FINANCIAL STATEMENTS Continued
NGE Capital Limited and Controlled Entities Annual Report for the year ended 31 December 2018 57
12. FAIR VALUE MEASUREMENT (CONTINUED) Cody Live has met all its interest payment requirements to date. Cody Live is an early stage company that is not yet profitable and is therefore a higher risk investment. However, the Board is of the view that Cody Live holds valuable intellectual property, which includes Australian patents for the application of digital boards to real estate marketing, and has potential to grow and become a valuable company. Convertible notes with a face value of $500,000 mature on 24 March 2019, with the balance maturing on 1 May 2019. NGE is currently in negotiations with Cody Live’s management about the possibility of extending the term of the notes, provided that any renegotiated terms are sufficiently attractive. The Board believes that there is a reasonable likelihood that Cody Live will raise sufficient funds in the next 12 months to cover both its ongoing operational expenses and to repay the Convertible Notes. For these reasons, the Board is of the opinion that the best available evidence of fair value of the investment is the original cost. Valuation of PFE Holdings Pty Ltd as at 31 December 2018 The Board resolved to fully impair the remaining carrying value of the Company’s holding in PFE Holdings Pty Ltd to $ Nil (2017: $10,000). This decision was based on the Board’s view that the Company is unlikely to recover any future value from these shares. Valuation of Western Drilling Limited (WDL) as at 31 December 2018 Since 2016 the Company has advanced loans for working capital purposes to WDL. The Board considers that the best available evidence of fair value of this loan investment is the original cost of the investment. At 31 December 2018 that fair value of this investment is $262,899 (2017: $109,518) Reconciliation of fair value measurements categorised within Level 3 of the fair value hierarchy. The carrying amounts of investments measured using significant unobservable inputs (Level 3) are shown below:
Unlisted Convertible
notes Unlisted equities Total
For the year ended 31 December 2018 $’000 $’000 $’000
Beginning balance 750 3,955 4,705
Purchase - 173 173
Revaluation gain - 2,389 2,389
Revaluation loss - (146) (146)
Ending balance 750 6,371 7,121
For the year ended 31 December 2017
Beginning balance - 94 94
Purchase 750 3,861 4,611
Ending balance 750 3,955 4,705
For
per
sona
l use
onl
y

NOTES TO THE FINANCIAL STATEMENTS Continued
NGE Capital Limited and Controlled Entities Annual Report for the year ended 31 December 2018 58
13. INVESTMENTS ACCOUNTED FOR USING THE EQUITY METHOD 2018 2017
Investment in Western Drilling Limited (WDL) $’000 $’000
Loans to WDL 9,620 9,620
Share of losses accounted for using the equity method (1,761) (1,761)
Impairment (7,859) (7,859)
At end of year - - The Group holds a 50% voting and equity interest in Western Drilling Limited (WDL), a jointly controlled company registered in Papua New Guinea. Maps Tuna Limited, a company related to former Non-Executive Director Sir Michael Bromley, holds the remaining 50%. WDL has a wholly-owned subsidiary registered in Australia and both companies have a reporting date of 31 December. Dividends are subject to the approval of a majority of directors of the joint venture entity. The Group received no dividends during 2018 or 2017. Until 2015 the Group’s investment in WDL was accounted for using the equity method of accounting and the Group shares the results of WDL group based on the Group’s percentage interest in WDL. At year end 2015 the investment was fully impaired and interest accruals on loans were suspended (see Note 18). These actions were taken because the global oil and gas market for WDL’s major asset, a Heli rig, entered a downturn and there were no contract opportunities for the use, hire, or sale of the rig. Accordingly, it was difficult to support any assumptions or estimates of future cash flows for the rig under a value-in-use approach or to reliably estimate a fair value less costs of disposal. At each year-end subsequent to 2015 the Directors reviewed their impairment decision and determined that, full impairment of the investment in WDL remained appropriate. WDL is continuing its efforts to secure contracts. WDL has also appointed sales agents to market the rig, camp and other drilling assets, however no bids have been received to date. In the future should new drilling contracts be secured and/or the rig, camp and and other drilling assets be sold in whole or in part then the impairment could be reversed in part or in full. The aggregate amounts of certain financial information of the jointly controlled entity can be summarised as follows: 2018 2017
$’000 $’000
Assets 19,950 18,068
Impairments (19,278) (17,421)
Liabilities 25,200 22,501
Revenues - -
Loss for the year (344) (386)
Loss attributable to the Group (172) (193)
For
per
sona
l use
onl
y

NOTES TO THE FINANCIAL STATEMENTS Continued
NGE Capital Limited and Controlled Entities Annual Report for the year ended 31 December 2018 59
14. EQUITY AND CAPITAL MANAGEMENT a) Share Capital Shares issued and fully paid
2018 Shares
2017 Shares
2018 $’000
2017 $’000
At beginning of year 37,444,448 41,567,635 78,293 79,939
Share buy-back (249,674) (3,950,687) (157) (1,646)
Treasury Shares – buy-back - (172,500) - -
Total contributed equity at 31 December 37,194,774 37,444,448 78,136 78,293
Ordinary shares entitle the holder to participate in dividends and the proceeds on winding-up of the Company in proportion to the number of shares held. Every ordinary shareholder present at a meeting of the Company, in person or by proxy, is entitled to one vote, and upon a poll each ordinary share is entitled to one vote. Ordinary shares have no par value. b) On-market share buy-back On 21 August 2017 the Company announced a 10/12 on-market buy-back to commence on or after 4 September 2017. This buy-back is of unlimited duration and was re-confirmed by the Board for the year commencing on 4 September 2018, with the Company reserving the right to suspend or terminate the buy-back at any time. During the year 249,674 (2017: 3,950,687) shares were bought back and cancelled. The total cost of $157,300 (2017: $1,645,600) was deducted from Share Capital. c) Options over unissued shares 2018 2017
Options A exercisable at $0.05 each on or before 30 November 2017:
Balance at beginning of reporting period - 150,000
Lapsed during year - (150,000)
Balance at end of reporting period - -
Total at end of year - -
d) Capital risk management The Group currently has no long-term debt or short-term debt and is not subject to any externally imposed capital requirements, nor does it focus on obtaining debt as a key capital management tool. The operating cash flows of the Group are financed by its cash holdings. Capital risk management is continually reviewed by the Board and Management.
For
per
sona
l use
onl
y

NOTES TO THE FINANCIAL STATEMENTS Continued
NGE Capital Limited and Controlled Entities Annual Report for the year ended 31 December 2018 60
14. EQUITY AND CAPITAL MANAGEMENT (CONTINUED) e) Reserves 2018 2017
$’000 $’000
Option reserve - 7,894
Equity component of convertible instrument - 3,483
Total - 11,377
Option reserve 2018 2017
$’000 $’000
Balance at beginning of year 7,894 7,894
Transfer to accumulated losses/retained earnings (7,894) -
Balance at end of year - 7,894 The option reserve records items recognised as expenses on share options and rights granted for compensation and services rendered. The options and rights have been valued at the invoiced amounts or if granted for nil consideration, at fair value. As there were no options outstanding at year-end the accumulated balance of the option reserve was transferred directly to accumulated losses/retained earnings. Equity component of convertible instrument 2018 2017
$’000 $’000
Balance at beginning of year 3,483 3,483
Transfer to accumulated losses/retained earnings (3,483) -
Balance at end of year - 3,483 This reserve recognises the equity component of the fair value of convertible equity bonds issued in previous years. All of these equity bonds were subsequently repaid in full and none converted to equity. As there were no convertible equity bonds outstanding at year-end the accumulated balance of the equity component of convertible instrument reserve was transferred directly to accumulated losses/retained earnings.
For
per
sona
l use
onl
y

NOTES TO THE FINANCIAL STATEMENTS Continued
NGE Capital Limited and Controlled Entities Annual Report for the year ended 31 December 2018 61
15. RECONCILIATION OF CASH FLOWS FROM OPERATING ACTIVITIES 2018 2017
Cash flows from operating activities $’000 $’000
Profit for the period 7,034 4,681
Adjustments for:
Depreciation 1 1
Discontinued operations - 205
Foreign exchange differences (37) 53
Provision for employee entitlements 7 5
Changes in assets and liabilities relating to operations
Increase in creditors and accruals 62 126
Decrease in receivables 2 274
Increase in financial assets (7,963) (13,018)
Decrease in other-long term assets - 10
Increase in prepayments (1) -
Increase in deferred tax asset (2,020) -
Net cash used in operating activities (2,915) (7,663) 16. CASH AND CASH EQUIVALENTS
2018 2017
$’000 $’000
Cash at bank and on hand 2,095 5,296 Cash and cash equivalents at balance date consisted of AUD2,084,414, HKD 60,937 and PGK98 (2017: AUD5,208,930 and PGK218,306). 17. TRADE AND OTHER RECEIVABLES 2018 2017
Current $’000 $’000
Receivables 20 18
Deposits - 4
Total 20 22 a) Allowance for impairment loss All amounts are short-term. The net carrying value of receivables is considered a reasonable approximation of fair value. b) Foreign exchange and interest rate risk Detail regarding foreign exchange and interest rate risk exposure is disclosed in Note 11.
For
per
sona
l use
onl
y

NOTES TO THE FINANCIAL STATEMENTS Continued
NGE Capital Limited and Controlled Entities Annual Report for the year ended 31 December 2018 62
18. OTHER ASSETS 2018 2017
Current $’000 $’000
Prepayments 42 41 2018 2017
Non-current $’000 $’000
Accrued interest receivable 4,726 4,726
Impairment (4,726) (4,726)
Total - - The accrued interest receivable represents a provision for interest on loans and payments made to and on behalf of the joint venture entity, Western Drilling Limited (WDL) and its subsidiary, Rig 6 Pty Ltd. This receivable was fully impaired in 2015. See Note 13 for an analysis of the investment in WDL and impairment assessments. 19. DEFERRED TAX ASSETS The balance comprises temporary differences attributable to: 2018 2017
$’000 $’000
Tax losses 2,020 -
Total 2,020 -
Tax losses
Other temporary differences Total
Movements $’000 $’000 $’000
Balance at 31 December 2016 - - -
(Charged)/credited:
- to profit or loss - - -
- directly to equity - - -
Balance at 31 December 2017 - - -
(Charged)/credited:
- to profit or loss 2,020 - 2,020
- directly to equity - - -
Balance at 31 December 2018 2,020 - 2,020 Refer to Note 9 for details of the recognition of this deferred tax asset.
For
per
sona
l use
onl
y

NOTES TO THE FINANCIAL STATEMENTS Continued
NGE Capital Limited and Controlled Entities Annual Report for the year ended 31 December 2018 63
20. TRADE AND OTHER PAYABLES 2018 2017
Current $’000 $’000
Trade payables 18 37
Sundry payables and accrued expenses 411 342
Total 429 379 21. PROVISIONS 2018 2017
Current $’000 $’000
Employee provisions 9 8
Non-Current
Employee provisions 8 2 Employee provisions relate to annual leave and long service leave entitlements. 22. AUDITOR’S REMUNERATION 2018 2017 $ $ Audit and review of financial statements Auditor of the Company - Grant Thornton 31,339 34,777 Other auditors for audit and review of subsidiaries’ financial statements 3,951 32,800
Total 35,290 67,577
Other non-audit services Auditor of the Company - Grant Thornton - -
Total 35,290 67,577
23. CONTROLLED AND JOINTLY CONTROLLED ENTITIES Controlled Entities Country of Incorporation Ownership Interest %
NGE Administration Limited Papua New Guinea 100 Changes in 2018 During the period previously controlled entities Kingsbury Limited, Kirkland Limited, Ladysmith Limited and Roebuck Limited were amalgamated into NGE Administration Limited. Jointly Controlled Entities Country of Incorporation Ownership Interest %
Western Drilling Limited (WDL) Papua New Guinea 50
- Rig 6 Pty Ltd1 Australia 50 1 Rig 6 Pty Ltd is a wholly owned subsidiary of WDL.
For
per
sona
l use
onl
y

NOTES TO THE FINANCIAL STATEMENTS Continued
NGE Capital Limited and Controlled Entities Annual Report for the year ended 31 December 2018 64
24. RELATED PARTY TRANSACTIONS The Group’s related parties include its joint venture company and key management. Unless otherwise stated, none of the transactions incorporate special terms and conditions and no guarantees were given or received. Outstanding balances are usually settled in cash. a) Wholly owned group The Company provides all controlled entities with support services and funds for expenditure interest free with no fixed repayment dates and recovers overhead expenses from the controlled entities. b) Jointly controlled entity The Group holds a 50% voting and equity interest in Western Drilling Limited (WDL), a jointly controlled company registered in Papua New Guinea. Maps Tuna Limited, a company related to former director Sir Michael Bromley, holds the remaining 50%. Rig 6 Pty Ltd, registered in Australia, is a wholly-owned subsidiary of WDL. Loans were made to WDL group in previous years to finance the acquisition of assets and working capital for its drilling business. The loans are denominated in USD and bore interest at market rates until balance date 2015 at which point the loans and interest receivable were fully impaired as noted in Notes 13 and 18. An agreement between the parties provided that no interest would be charged in 2016 and future periods until it became more certain that the accrued and future interest could be paid. b) Jointly controlled entity (continued) Since the end of 2015, additional funds were loaned by both parties, some of which have been repaid, and the Group’s net loan balance ($262,899) is disclosed as a non-current asset, as repayment is reasonably expected. c) Transactions with key management personnel Key Management Personnel remuneration includes the following expenses: 2018 2017
$ $
Short-term employee benefits 831,362 725,923
Post-employment benefits 60,901 62,589
Other long-term benefits 5,920 1,545
Total 898,183 790,057 d) Transactions with other related parties In 2016, the Company entered into a licence agreement with Kentgrove Capital Pty Ltd for the sub-lease of office premises for its business from 1 June 2016 to 30 April 2018 at the rate of $60,000 per annum. For the period 1 May 2018 to 31 July 2018 the Company paid Kentgrove Capital Pty Ltd $7,500, for access to serviced offices for its business. In 2018 the parties signed a licence agreement for the sub-lease of office premises for its business from 1 August 2018 to 31 July 2021 at the rate of $66,000 per annum, with annual 4% increases. The Executive Chairman and Chief Investment Officer David Lamm is a director and controlling shareholder of Kentgrove Capital Pty Ltd.
For
per
sona
l use
onl
y

NOTES TO THE FINANCIAL STATEMENTS Continued
NGE Capital Limited and Controlled Entities Annual Report for the year ended 31 December 2018 65
25. EMPLOYEE BENEFITS Superannuation The Group makes contributions based on each employee’s salary to superannuation plans that provide employees with benefits on retirement in accordance with the requirements of superannuation legislation. Employee incentive plan The Company does not offer an Employee Incentive Plan under which the Directors may offer options and ordinary shares in the Company to eligible persons. 26. COMMITMENTS The Group has no capital commitments. The Group signed a non-cancellable license agreement in the year, to occupy office facilities. Commitments for minimum licence payments are as follows: 2018 2017
$ $
Within one year 67,100 20,000
Later than one year but not later than 5 years 111,426 -
Total 178,526 20,000 27. CONTINGENT ASSETS AND LIABILITIES At balance date the Group has no contingent assets or contingent liabilities.
For
per
sona
l use
onl
y

NOTES TO THE FINANCIAL STATEMENTS Continued
NGE Capital Limited and Controlled Entities Annual Report for the year ended 31 December 2018 66
28. PARENT ENTITY INFORMATION Information relating to NGE (“the Parent Entity”):
2018 2017
$’000 $’000
Assets
Cash and cash equivalents 2,095 5,209
Trade and other receivables 4 1
Financial assets held at fair value through profit or loss 26,507 18,545
Other Assets 40 38
Plant and equipment - 1
Other long-term assets 269 175
Deferred tax assets 2,020 -
Total Assets 30,935 23,969
Liabilities
Trade and other payables 419 335
Provisions 17 10
Total Liabilities 436 345
Net Assets 30,499 23,624
Equity
Issued capital 78,136 78,293
Option reserve - 7,894
Equity component of convertible instrument - 3,483
Accumulated losses (47,637) (66,046)
Total Equity 30,499 23,624
Financial Performance
Profit for the year 7,032 4,675
Other comprehensive income - -
Total Comprehensive Income 7,032 4,675 29. POST-REPORTING DATE EVENTS Apart from the following event no adjusting or significant non-adjusting events have occurred between the reporting date and the date of authorisation. On 7 February 2019 the Company entered into loan agreement and borrowed $3 million, at an interest rate of 10% p.a. and maturity of 12 months after the initial drawdown. The funds, along with a proportion of the Company’s existing cash balance, were applied towards the purchase of a parcel of shares in Karoon Energy Ltd (ASX:KAR). A detailed commentary on this investment was provided in the Company’s Investment and NTA update as at 28 February 2019.
For
per
sona
l use
onl
y

DIRECTORS’ DECLARATION
NGE Capital Limited and Controlled Entities Annual Report for the year ended 31 December 2018 67
1. In the opinion of the Directors of NGE Capital Limited:
a. the consolidated financial statements and notes of NGE Capital Limited are in accordance with the Corporations Act 2001, including:
i. Giving a true and fair view of its financial position as at 31 December 2018 and of its performance for the year ended on that date; and
ii. Complying with Australian Accounting Standards (including the Australian Accounting Interpretations) and the Corporations Regulations 2001; and
b. there are reasonable grounds to believe that NGE Capital Limited will be able to pay its debts as and when they become due and payable.
2. The directors have been given the declarations required by Section 295A of the Corporations Act 2001 from the Chief Executive Officer and Chief Financial Officer for the financial year ended 31 December 2018.
3. Note 2 confirms that the consolidated financial statements also comply with International Financial Reporting Standards.
Signed in accordance with a resolution of the Directors: Dated this 21st day of March 2019
________________ David Lamm Executive Chairman and Chief Investment Officer
For
per
sona
l use
onl
y

Grant Thornton Audit Pty Ltd ACN 130 913 594 a subsidiary or related entity of Grant Thornton Australia Ltd ABN 41 127 556 389
‘Grant Thornton’ refers to the brand under which the Grant Thornton member firms provide assurance, tax and advisory services to their clients and/or refers to one or more member firms, as the context requires. Grant Thornton Australia Ltd is a member firm of Grant Thornton International Ltd (GTIL). GTIL and the member firms are not a worldwide partnership. GTIL and each member firm is a separate legal entity. Services are
delivered by the member firms. GTIL does not provide services to clients. GTIL and its member firms are not agents of, and do not obligate one another and are not liable for one another’s acts or omissions. In the Australian context only, the use of the term ‘Grant Thornton’ may refer to Grant Thornton Australia Limited ABN 41 127 556 389 and its Australian subsidiaries and related entities. GTIL is not an Australian related entity to
Grant Thornton Australia Limited.
Liability limited by a scheme approved under Professional Standards Legislation.
www.grantthornton.com.au
Collins Square, Tower 5 727 Colling Street Docklands Victoria 3008 Correspondence to: GPO Box 4736 Melbourne Victoria 3001 T +61 3 8320 2222 F +61 3 8320 2200 E [email protected] W www.grantthornton.com.au
Independent Auditor’s Report
To the Members of NGE Capital Limited
Report on the audit of the financial report
Opinion
We have audited the financial report of NGE Capital Limited (the Company) and its subsidiaries (the Group), which
comprises the consolidated statement of financial position as at 31 December 2018, the consolidated statement of profit or
loss and other comprehensive income, consolidated statement of changes in equity and consolidated statement of cash
flows for the year then ended, and notes to the consolidated financial statements, including a summary of significant
accounting policies, and the Directors’ declaration.
In our opinion, the accompanying financial report of the Group is in accordance with the Corporations Act 2001, including:
a giving a true and fair view of the Group’s financial position as at 31 December 2018 and of its performance for the
year ended on that date; and
b complying with Australian Accounting Standards and the Corporations Regulations 2001.
Basis for opinion
We conducted our audit in accordance with Australian Auditing Standards. Our responsibilities under those standards are
further described in the Auditor’s Responsibilities for the Audit of the Financial Report section of our report. We are
independent of the Group in accordance with the auditor independence requirements of the Corporations Act 2001 and
the ethical requirements of the Accounting Professional and Ethical Standards Board’s APES 110 Code of Ethics for
Professional Accountants (the Code) that are relevant to our audit of the financial report in Australia. We have also fulfilled
our other ethical responsibilities in accordance with the Code.
We believe that the audit evidence we have obtained is sufficient and appropriate to provide a basis for our opinion.
For
per
sona
l use
onl
y

69
Key audit matters
Key audit matters are those matters that, in our professional judgement, were of most significance in our audit of the financial
report of the current period. These matters were addressed in the context of our audit of the financial report as a whole, and in
forming our opinion thereon, and we do not provide a separate opinion on these matters.
Key audit matter How our audit addressed the key audit matter
Financial assets held at fair value through profit or loss – unlisted equity securities, Note 12
As at 31 December 2018, the Group’s financial assets held at fair value through profit or loss totalled $26.51m, including $6.11m in unlisted equity securities.
The fair value of unlisted investments may require significant judgement by management. Given the inherent subjectivity in determining the fair value of unlisted investments, this is a key audit matter.
Our procedures included, amongst others:
Assessing the application of the valuation methodology applied to unlisted investments in accordance with accounting standard AASB 13 Fair Value Measurement;
Assessing the basis and key assumptions of management’s determination of fair value;
Challenging the key assumptions;
Assessing all available evidence about these investments, such as their latest financial statements, future projections and commentary within board packs;
Ensuring any recent equity raises by the investment business have been considered in the determination of fair value; and
Reviewing the appropriateness of the related disclosures within the financial statements.
Information other than the financial report and auditor’s report thereon
The Directors are responsible for the other information. The other information comprises the information included in the
Group’s annual report for the year ended 31 December 2018, but does not include the financial report and our auditor’s report
thereon.
Our opinion on the financial report does not cover the other information and we do not express any form of assurance
conclusion thereon.
In connection with our audit of the financial report, our responsibility is to read the other information and, in doing so, consider
whether the other information is materially inconsistent with the financial report or our knowledge obtained in the audit or
otherwise appears to be materially misstated.
If, based on the work we have performed, we conclude that there is a material misstatement of this other information, we are
required to report that fact. We have nothing to report in this regard.
Responsibilities of the Directors for the financial report
The Directors of the Company are responsible for the preparation of the financial report that gives a true and fair view in
accordance with Australian Accounting Standards and the Corporations Act 2001 and for such internal control as the Directors
determine is necessary to enable the preparation of the financial report that gives a true and fair view and is free from material
misstatement, whether due to fraud or error.
In preparing the financial report, the Directors are responsible for assessing the Group’s ability to continue as a going concern,
disclosing, as applicable, matters related to going concern and using the going concern basis of accounting unless the
Directors either intend to liquidate the Group or to cease operations, or have no realistic alternative but to do so.
For
per
sona
l use
onl
y

70
Auditor’s responsibilities for the audit of the financial report
Our objectives are to obtain reasonable assurance about whether the financial report as a whole is free from material
misstatement, whether due to fraud or error, and to issue an auditor’s report that includes our opinion. Reasonable assurance
is a high level of assurance, but is not a guarantee that an audit conducted in accordance with the Australian Auditing
Standards will always detect a material misstatement when it exists. Misstatements can arise from fraud or error and are
considered material if, individually or in the aggregate, they could reasonably be expected to influence the economic decisions
of users taken on the basis of this financial report.
A further description of our responsibilities for the audit of the financial report is located at the Auditing and Assurance
Standards Board website at: http://www.auasb.gov.au/auditors_responsibilities/ar1.pdf. This description forms part of our
auditor’s report.
Report on the remuneration report
Opinion on the remuneration report
We have audited the Remuneration Report included in pages 27 to 32 of the Directors’ report for the year ended 31
December 2018.
In our opinion, the Remuneration Report of NGE Capital Limited, for the year ended 31 December 2018 complies with
section 300A of the Corporations Act 2001.
Responsibilities
The Directors of the Company are responsible for the preparation and presentation of the Remuneration Report in accordance
with section 300A of the Corporations Act 2001. Our responsibility is to express an opinion on the Remuneration Report,
based on our audit conducted in accordance with Australian Auditing Standards.
Grant Thornton Audit Pty Ltd
Chartered Accountants
Michael Climpson
Partner
Melbourne, 21st March 2019
For
per
sona
l use
onl
y
ADDITIONAL INFORMATION
NGE Capital Limited and Controlled Entities Annual Report for the year ended 31 December 2018 71
Additional information included in accordance with the Listing Rules of ASX Limited. 1. SHAREHOLDINGS a) Distribution of Shareholders as at 15 March 2019
Size of holding Holders Ordinary shares held %
1-1,000 238 89,503 0.24
1,001-5,000 578 1,647,046 4.43
5,001-10,000 178 1,415,364 3.81
10,001-100,000 257 8,117,850 21.82
100,001 and over 42 25,925,011 69.70
Total 1,293 37,194,774 100.00
183 shareholders held less than a marketable parcel. b) Top Twenty Shareholders as at 15 March 2019
Shareholder
Number of ordinary
shares
% Held of issued
ordinary capital
KENTGROVE CAPITAL PTY LTD <KENTGROVE CAPITAL FUND A/C> 5,500,000 14.79
PARKBAY CAPITAL PTY LTD <PARKBAY A/C> 2,314,271 6.22
J P MORGAN NOMINEES AUSTRALIA LIMITED 2,229,391 5.99
SARGON CT PTY LTD <KENTGROVE CAPITAL FUND> 1,952,539 5.25
RUMINATOR PTY LTD 1,775,000 4.77
MANAR NOMINEES PTY LTD 1,567,000 4.21
WALLBAY PTY LTD <THE MICHAEL ABELL S/F A/C> 1,495,428 4.02
DAWNEY & CO LTD 800,000 2.15
LUCERNE CAPITAL PTY LTD <LUCERNE CAPITAL A/C> 664,000 1.79
YARANDI INVESTMENTS PTY LTD <GRIFFITH FAMILY NO 2 A/C> 658,376 1.77
DR DAVID GEORGE MAXWELL WELSH 500,000 1.34
ALLAN DALE HOLDINGS PTY LTD 411,000 1.10
MR EDWARD JAMES DALLY & MRS SELINA DALLY <E J DALLY SUPER FUND A/C> 400,000 1.08
WALLBAY PTY LTD <ABELL UNIT ACCOUNT> 371,955 1.00
MR DAVID LAMM & MRS PENINA SARA LAMM <D&P LAMM SUPER FUND A/C> 350,000 0.94
MR WARWICK SAUER 333,759 0.90
ROSSBEL PTY LIMITED <THE ROSSBEL A/C> 279,545 0.75
ZELWER SUPERANNUATION PTY LTD <ZELWER SUPER BENEFIT A/C> 267,036 0.72
POLMA PTY LTD <MOSS RETIREMENT FUND A/C> 260,000 0.70
RIFLERANGE TRADING CO PTY LTD 259,508 0.70
Twenty largest shareholders 22,388,808 60.19
Others 14,805,966 39.81
Total 37,194,774 100.00
For
per
sona
l use
onl
y

ADDITIONAL INFORMATION Continued
NGE Capital Limited and Controlled Entities Annual Report for the year ended 31 December 2018 72
2. VOTING RIGHTS a) At meetings of members each member entitled to vote may vote in person or by proxy or
attorney or, in the case of a member which is a body corporate, by representative duly authorized.
b) On a show of hands every member entitled to vote and be present in person or by proxy or attorney or representative duly authorised shall have one (1) vote.
c) On a poll every member entitled to vote and be present in person or by proxy or attorney or representative duly authorised shall have one (1) vote for each fully paid share of which he is a holder.
3. AUDIT COMMITTEE As at the date of this report the Group has an Audit Committee and an Investment Committee; subcommittees of the Board of Directors. 4. SUBSTANTIAL SHAREHOLDERS As at the date of this report substantial shareholder notices had been lodged in relation to the Company’s securities by the following shareholders:
Name Number of
ordinary shares % Held of issued ordinary capital
Kentgrove Capital Pty Ltd 10,116,810 27.2%
Noontide Investments Ltd 2,132,054 5.7%
Wallbay Pty Ltd 2,119,596 5.7%
For
per
sona
l use
onl
y