for personal use only · 2016-02-03 · power and gas downer offers customers a wide range of...
TRANSCRIPT

4 February 2016
Company Announcements Office ASX Limited Exchange Centre Level 4, 20 Bridge Street SYDNEY NSW 2000
Dear Sir/Madam
Please find attached the following documents:
1. Appendix 4D – results for announcement to the market for the half-year ended 31 December 2015;
2. Condensed Consolidated Half-year Financial Report dated 31 December 2015;
3. Market release dated 4 February 2016; and
4. Investor Presentation.
Yours sincerely, Downer EDI Limited
Peter Tompkins Company Secretary
Downer EDI Limited ABN 97 003 872 848
Triniti Business Campus 39 Delhi Road
North Ryde NSW 2113
1800 DOWNER www.downergroup.com
Page 1 of 1
For
per
sona
l use
onl
y

Results for announcement to the marketfor the half-year ended 31 December 2015
Appendix 4D
31 Dec 2015 31 Dec 2014 change$'m $'m %
Revenue from ordinary activities 3,262.0 3,375.0 Other income 2.6 2.8 Total revenue and other income from ordinary activities 3,264.6 3,377.8 (3.4%)
Total revenue including joint ventures and other income 3,543.4 3,586.0 (1.2%)
113.2 141.7 (20.1%)
72.1 94.7 (23.9%)
31 Dec 2015 31 Dec 2014 changecents cents %
Basic earnings per share 15.8 20.8 (24.0%)
Diluted earnings per share 15.1 20.1 (24.9%)
Net tangible asset backing per ordinary share 254.2 253.5 0.3%
Dividend 31 Dec 2015 31 Dec 2014Interim Interim
Dividend per share (cents) 12.0 12.0Franked amount per share (cents) 12.0 12.0Dividend record date 18/02/2016 19/02/2015Dividend payable date 17/03/2016 19/03/2015
Redeemable Optionally Adjustable Distributing Securities (ROADS)Dividend per ROADS (in Australian cents) 2.40 2.65 New Zealand imputation credit percentage per ROADS 100% 100%
ROADS payment date Quarter 1 Quarter 2Instalment date FY2016 15/09/2015 15/12/2015Instalment date FY2015 15/09/2014 15/12/2014
For commentary on the results for the period and review of operations, please refer to the Directors' Report andseparate media release attached.
Earnings before interest and tax
Profit from ordinary activities after tax attributable to members of the parent entity
Downer EDI's Dividend Reinvestment Plan (DRP) has been suspended.
For
per
sona
l use
onl
y

Condensed Consolidated Half-year Financial Report 31 December 2015
For
per
sona
l use
onl
y

This page has been left blank intentionally.
For
per
sona
l use
onl
y
Condensed Consolidated Financial Reportfor the half-year ended 31 December 2015
Contents
Directors' ReportPage 2
Auditor's signed reportPage 18 Auditor's Independence DeclarationPage 19 Independent Auditor's Review Report
Financial StatementsPage 20 Condensed Consolidated Statement of Profit or Loss and Other Comprehensive IncomePage 21 Condensed Consolidated Statement of Financial PositionPage 22 Condensed Consolidated Statement of Changes in EquityPage 23 Condensed Consolidated Statement of Cash Flows
A B C D
B1 C1 D1
B2 C2 D2
B3 C3 D3
B4 C4 D4
D5
Directors' Declaration Page 39
Contingent liabilities
Other disclosuresCapital structure and financing
Business performance
Profit from ordinary activities
Financing facilities Intangible assets
Acquisition and disposal of businesses
Segment information Borrowings Property, plant and equipment
DividendsSubsequent events
Earnings per share Issued capital Joint arrangements and associate entities
Notes to the condensed consolidated financial report
Page 24 Page 24-27 Page 33-38Page 28-32
About this report
1
For
per
sona
l use
onl
y
DIRECTORS’ REPORT For the half-year ended 31 December 2015
The Directors of Downer EDI Limited (Downer) submit the condensed consolidated financial report of the Company for the half-year ended 31 December 2015. In accordance with the provisions of the Corporations Act 2001 (Cth), the Directors' Report is set out below: Directors
The names of the Directors of the Company during, or since the end of, the half-year are: R M Harding (Chairman, Independent Non-executive Director)
G A Fenn (Managing Director and Chief Executive Officer)
S A Chaplain (Independent Non-executive Director)
P S Garling (Independent Non-executive Director)
E A Howell (Independent Non-executive Director)
J S Humphrey (Independent Non-executive Director)
C G Thorne (Independent Non-executive Director)
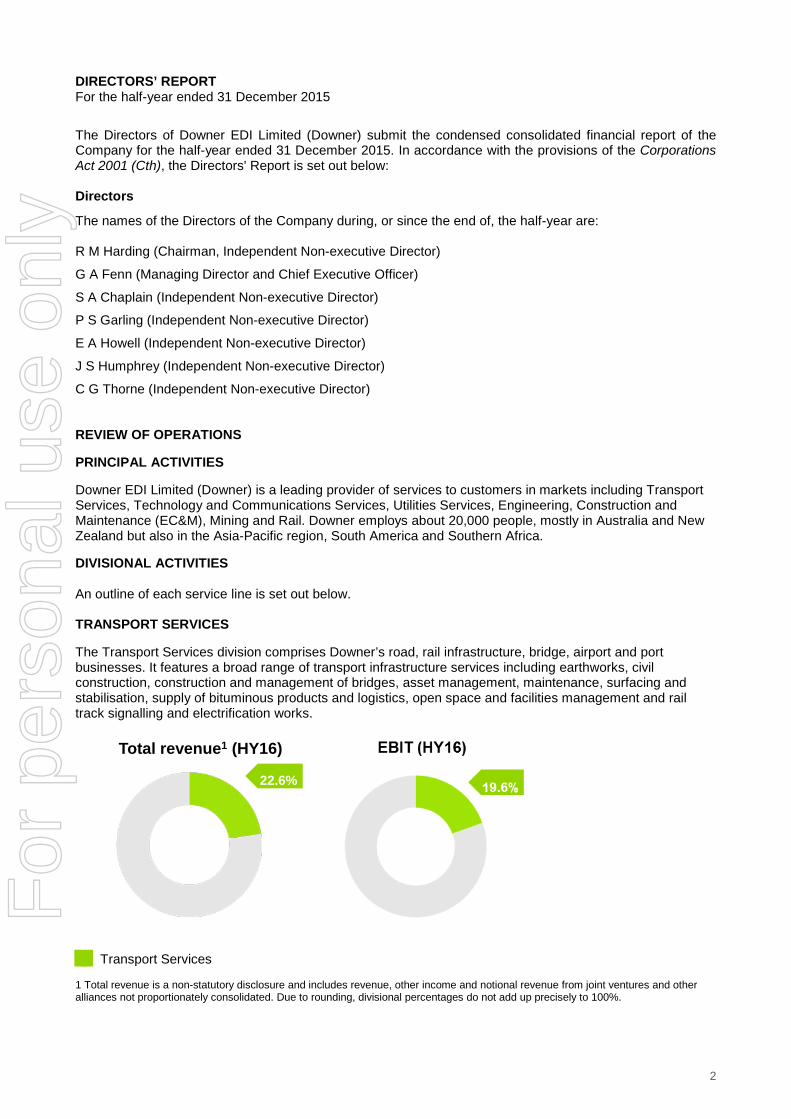
REVIEW OF OPERATIONS PRINCIPAL ACTIVITIES Downer EDI Limited (Downer) is a leading provider of services to customers in markets including Transport Services, Technology and Communications Services, Utilities Services, Engineering, Construction and Maintenance (EC&M), Mining and Rail. Downer employs about 20,000 people, mostly in Australia and New Zealand but also in the Asia-Pacific region, South America and Southern Africa. DIVISIONAL ACTIVITIES An outline of each service line is set out below. TRANSPORT SERVICES The Transport Services division comprises Downer’s road, rail infrastructure, bridge, airport and port businesses. It features a broad range of transport infrastructure services including earthworks, civil construction, construction and management of bridges, asset management, maintenance, surfacing and stabilisation, supply of bituminous products and logistics, open space and facilities management and rail track signalling and electrification works.
Transport Services
1 Total revenue is a non-statutory disclosure and includes revenue, other income and notional revenue from joint ventures and other alliances not proportionately consolidated. Due to rounding, divisional percentages do not add up precisely to 100%.
22.6%
Total revenue1 (HY16)
2
For
per
sona
l use
onl
y
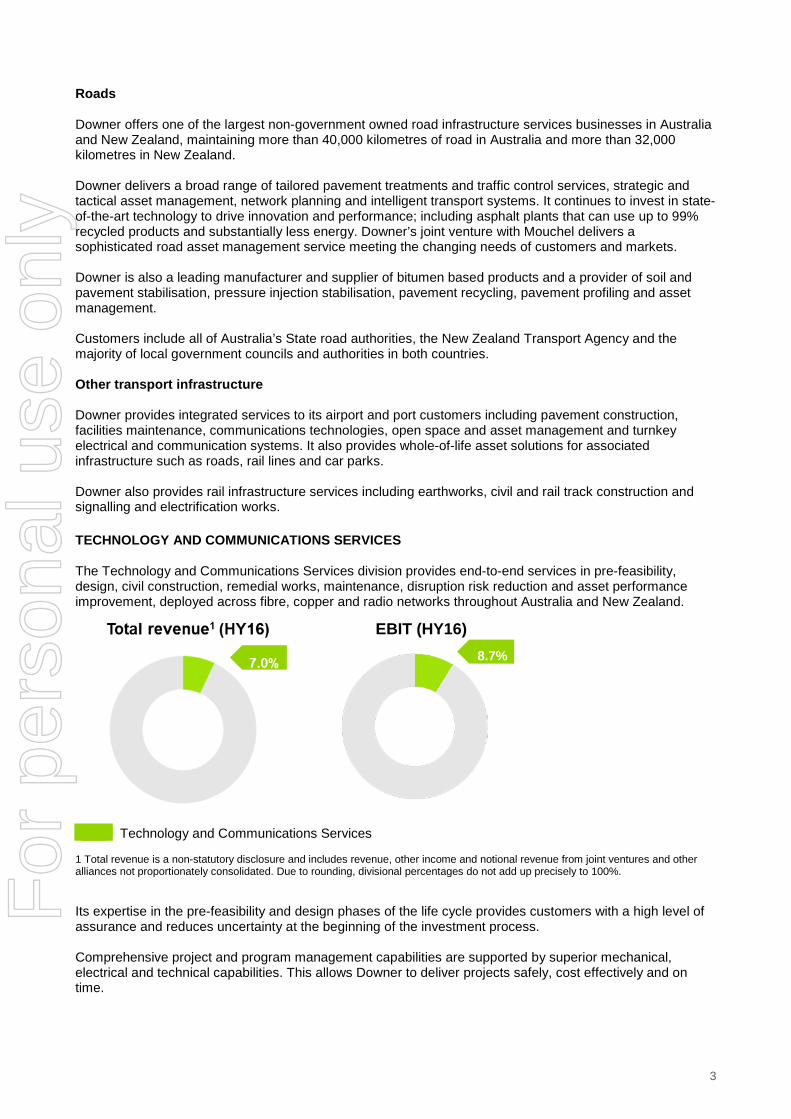
Roads Downer offers one of the largest non-government owned road infrastructure services businesses in Australia and New Zealand, maintaining more than 40,000 kilometres of road in Australia and more than 32,000 kilometres in New Zealand. Downer delivers a broad range of tailored pavement treatments and traffic control services, strategic and tactical asset management, network planning and intelligent transport systems. It continues to invest in state-of-the-art technology to drive innovation and performance; including asphalt plants that can use up to 99% recycled products and substantially less energy. Downer’s joint venture with Mouchel delivers a sophisticated road asset management service meeting the changing needs of customers and markets. Downer is also a leading manufacturer and supplier of bitumen based products and a provider of soil and pavement stabilisation, pressure injection stabilisation, pavement recycling, pavement profiling and asset management. Customers include all of Australia’s State road authorities, the New Zealand Transport Agency and the majority of local government councils and authorities in both countries. Other transport infrastructure Downer provides integrated services to its airport and port customers including pavement construction, facilities maintenance, communications technologies, open space and asset management and turnkey electrical and communication systems. It also provides whole-of-life asset solutions for associated infrastructure such as roads, rail lines and car parks. Downer also provides rail infrastructure services including earthworks, civil and rail track construction and signalling and electrification works. TECHNOLOGY AND COMMUNICATIONS SERVICES The Technology and Communications Services division provides end-to-end services in pre-feasibility, design, civil construction, remedial works, maintenance, disruption risk reduction and asset performance improvement, deployed across fibre, copper and radio networks throughout Australia and New Zealand.
Technology and Communications Services
1 Total revenue is a non-statutory disclosure and includes revenue, other income and notional revenue from joint ventures and other alliances not proportionately consolidated. Due to rounding, divisional percentages do not add up precisely to 100%.
Its expertise in the pre-feasibility and design phases of the life cycle provides customers with a high level of assurance and reduces uncertainty at the beginning of the investment process. Comprehensive project and program management capabilities are supported by superior mechanical, electrical and technical capabilities. This allows Downer to deliver projects safely, cost effectively and on time.
8.7%
EBIT (HY16)
3
For
per
sona
l use
onl
y

Downer manages, and delivers remedial works and maintenance focusing on reducing disruption risk and ensuring assets meet their life cycle expectations. Customers include nbnTM, Foxtel, Chorus, Spark, Enable and Vodafone. UTILITIES SERVICES The Utilities Services division provides complete lifecycle solutions to customers in the power, gas, water and renewable energy sectors.
Utilities Services
1 Total revenue is a non-statutory disclosure and includes revenue, other income and notional revenue from joint ventures and other alliances not proportionately consolidated. Due to rounding, divisional percentages do not add up precisely to 100%. Power and Gas Downer offers customers a wide range of services including planning, designing, constructing, operating, maintaining, managing and decommissioning power and gas network assets. Over the past four years, Downer has erected over 1,000 steel lattice transmission towers. It has designed and built over 100 substations and every year it connects 35,000 new power and gas customers. It also maintains over 62,000 kilometres of electricity and gas networks across more than 115,000 square kilometres. Customers include United Energy, AusNet Services, Ergon Energy, Powerco, Wellington Electricity and Powerlink. Water Downer provides complete water lifecycle solutions for municipal and industrial water users, with expertise including waste and waste water treatment, pumping and water transfer, desalination and water re-use, and abstraction and dewatering. Supporting its customers across the full asset lifecycle from the conceptual development of a project through design, construction, commissioning and optimisation, Downer also operates and maintains treatment, storage, pump station and network assets. Customers include Logan City Council, Mackay Regional Council, Melbourne Water, Yarra Valley Water, Wagga Wagga City Council, Queensland Urban Utilities, Watercare and Tauranga City Council.
4
For
per
sona
l use
onl
y

Renewable energy Downer is one of Australia’s largest and most experienced providers in the renewable energy market, offering design, build and maintenance services for:
wind farms and wind turbine sites; solar farms; landfill methane generation plants; sugar cane waste (Bagasse) fired cogeneration plants; and other biomass fired cogeneration plants.
Downer offers the services required for the entire asset life-cycle including procurement, assembly, construction and commissioning. Downer’s experience in wind farms includes Collgar (Western Australia), Boco Rock and Taralga (New South Wales), Lake Bonney (South Australia) and Mt Mercer (Victoria). In addition, Downer is currently engaged on a contract for the Ararat wind farm (Victoria). Downer’s Utilities Services business includes the operations of Tenix Holdings Australia Pty Limited (Tenix). The Tenix business was acquired on 31 October 2014. The acquisition has increased Downer’s infrastructure exposure and positions it for future opportunities in electricity distribution and maintenance. ENGINEERING, CONSTRUCTION AND MAINTENANCE (EC&M) The EC&M division comprises Downer’s plant construction and maintenance service offerings, including Electrical and Instrumentation (E&I), Structural, Mechanical and Piping (SMP) and Industrial and Infrastructure Maintenance, and resource-based consultancies.
EC&M
1 Total revenue is a non-statutory disclosure and includes revenue, other income and notional revenue from joint ventures and other alliances not proportionately consolidated. Due to rounding, divisional percentages do not add up precisely to 100%. Downer supports its customers through the life of their projects, from initial feasibility and design through to construction, commissioning, operation, ongoing asset management and decommissioning. Downer’s multi-disciplined teams project manage and self-execute a wide range of services for greenfield and brownfield projects. These include complex mining and industrial sites as well as commercial operations with critical infrastructure requirements such as data centres, airport facilities and hospitals. Downer delivers specialised EC&M services to customers across a range of industry sectors including oil and gas, power generation, commercial, iron ore, coal, and industrial minerals, with a focus on safety. Customers include Alcoa, Bechtel, BHP Billiton, Chevron, G & S Engineering, Landcorp, Onesteel, Orica, Origin Energy, Powerlink Queensland, Santos, Sydney Water Corporation, Transgrid, Wesfarmers, Woodside Energy and Xstrata.
12.8% EBIT (HY16)
5
For
per
sona
l use
onl
y

MINING The Mining division provides a broad range of services through each stage of the mining lifecycle. including open cut and underground mining, mine planning and design, civil construction, blasting, crushing, tyre management, mine rehabilitation and exploration drilling.
Mining
1 Total revenue is a non-statutory disclosure and includes revenue, other income and notional revenue from joint ventures and other alliances not proportionately consolidated. Due to rounding, divisional percentages do not add up precisely to 100%. The division has been successfully delivering contract mining and civil earthmoving services to its customers for over 90 years and is one of Australia’s most diversified mining contractors. It employs approximately 4,100 people across 50 sites mainly in Australia and New Zealand but also in Papua New Guinea, South America and Southern Africa. Downer’s Mining division generates its revenues primarily from open cut mining and blasting services, with contributions also from tyre management and underground mining. Customers include Fortescue Metals Group, Idemitsu Australia Resources, BHP Mitsubishi Alliance, Karara Iron Ore Project and Roy Hill Iron Ore.
6
For
per
sona
l use
onl
y

RAIL The Rail division provides total rail asset solutions including freight and passenger build, operations and maintenance, component overhauls and After-Market Services (AMS).
Rail
1 Total revenue is a non-statutory disclosure and includes revenue, other income and notional revenue from joint ventures and other alliances not proportionately consolidated. Due to rounding, divisional percentages do not add up precisely to 100%. Downer provides services to a range of public and private sector rail customers with capabilities spanning the provision, maintenance and overhaul of passenger and freight rolling stock, as well as importing and commissioning completed locomotive units for use in the resources sector. Downer’s Rail division has a strong national presence, particularly across Australia’s eastern seaboard capital cities, with approximately 1,400 workers employed across 20 maintenance facilities. Downer Rail operates two fleet control centres focused on monitoring and management of passenger and freight fleets on behalf of its customers and four manufacturing plants. Downer has formed strategic joint ventures with leading technology and knowledge providers to support its growth objectives in the passenger and freight market. These include partnerships with Keolis, Bombardier, ChangChun Railway Company (CRC) and Electro-Motive Diesel (owned by Caterpillar). The Keolis Downer joint venture is now Australia’s largest privately owned provider of multi-modal public transport solutions, with contracts to operate and maintain Yarra Trams in Melbourne and the Gold Coast Light Rail in Queensland. In April 2015, Keolis Downer acquired Australian Transit Enterprises (ATE), one of Australia’s largest route, school and charter bus businesses. ATE operates a fleet of over 900 buses in South Australia, Western Australia (WA) and Queensland and generates around $190 million in annual revenue. Customers include Pacific National, BHP Billiton, Fortescue Metals Group, TasRail, Sydney Trains, Queensland Rail, Public Transport Authority (WA) and Metro Trains Melbourne.
7
For
per
sona
l use
onl
y

GROUP FINANCIAL PERFORMANCE As outlined above, Downer reports its results under the following six service lines:
Transport Services; Technology and Communications Services; Utilities Services; Engineering, Construction & Maintenance (EC&M); Mining; and Rail For the six months ended 31 December 2015, Downer reported declines in total revenue, earnings before interest and tax (EBIT) and net profit after tax (NPAT). REVENUE Total revenue for the Group decreased by 1.2%, or $42.6 million, to $3.5 billion. Transport Services revenue of $802.9 million was 12.3% lower than the prior corresponding period due to reduced Government expenditure and inclement weather, particularly in NSW and WA. Rail infrastructure revenue was down significantly as completed projects in the prior corresponding period were not replaced. Technology and Communication Services revenue increased 2.0% to $249.9 million due primarily to the nbnTM contracts in Australia and contracts in New Zealand. This was offset by lower revenue on the Chorus contract as the rollout of the Ultra-Fast Broadband network completes. Utilities Services revenue increased 83.7% to $376.5 million due to a strong performance from power and gas projects, ramped up activity at the Ararat wind farm project in Victoria and the current period including an additional four months contribution from Tenix. EC&M revenue decreased 4.4% to $927.8 million as a result of lower activity in Queensland partially offset by increased activity in WA and New Zealand. Mining revenue decreased 5.2% to $781.6 million due to reduced volumes and contract completions. Rail revenue decreased 1.0% to $420.1 million, comprising an $86.1 million or 28.9% reduction in core Rail revenue reflecting the completion of manufacturing contracts, lower freight maintenance expenditure and lower AMS sales, largely offset by an $81.8 million or 64.5% increase in joint venture revenue. EXPENSES Downer continues to take proactive steps to right-size its business in line with market conditions. Downer’s total expenses declined by 2.7% in the current period. Employee benefits expenses increased by 7.3% to $1.3 billion and represent 42.4% of Downer’s cost base. This increase is mainly due to the acquisition of Tenix. Excluding Tenix, employee benefits related costs increased by 1.9% reflecting enterprise bargaining agreement wage increases, higher restructuring costs incurred to right-size the business and an increase in self-perform in some contracts – which was offset by lower subcontractor costs. Subcontractor costs decreased by 17.0% to $628.2 million and represent 19.9% of Downer’s cost base. This decrease accords with the reduction in total revenue and a shift to self-perform on some contracts. The continued use of subcontracting accords with the strategic intent by the Group to retain cost base variability. Raw materials and consumables expense decreased 10.0% to $565.4 million and represents 17.9% of Downer’s cost base. The decrease reflects the completion of contracts and lower activity compared to the prior corresponding period.
8
For
per
sona
l use
onl
y

Plant and equipment costs decreased by $9.1 million to $301.3 million and represent 9.5% of Downer’s cost base. The reduction largely reflects reduced reliance upon operating leased assets coupled with increased utilisation of owned assets, more efficient maintenance practices, a reduction in scope on some of Mining’s contracts and an increase in free-issue materials (e.g. consumables). Depreciation and amortisation increased by 4.9% to $128.0 million and represents 4.1% of Downer’s cost base. This increase is predominantly a result of the amortisation of customer related intangibles following the acquisition of Tenix in October 2014. Other expenses, communication, travel, occupancy and professional fees have increased by 8.2% to $195.4 million and represent 6.2% of Downer’s cost base. Included in other expenses is $13.0 million referable to Downer’s share of pre-tax bid costs in relation to Downer’s unsuccessful bid for Canberra’s new light rail project (Capital Metro). EARNINGS EBIT for the Group decreased 20.1% to $113.2 million, reflecting the write off of bid costs associated with Capital Metro and softness in the Group’s resources related businesses, particularly Engineering, Construction & Maintenance (EC&M) and Rail. Net Profit After Tax (NPAT) for the Group decreased 23.9% to $72.1 million. Transport Services EBIT decreased 9.7% to $31.6 million due mainly to reduced Government expenditure and weather delays, particularly in NSW and WA, and a significantly reduced contribution by the rail infrastructure business as completed projects in the prior corresponding period were not replaced. Technology and Communications Services EBIT increased 54.9% to $14.1 million as a result of strong performance on the nbnTM contracts in Australia and favourable performance on contracts in New Zealand. New Zealand EBIT was affected by tighter bid margins. Utilities Services EBIT increased 135.1% to $22.8 million due to a strong performance from power and gas projects, ramped up activity at the Ararat wind farm project in Victoria and the current period including an additional four months of contribution from Tenix. EC&M EBIT decreased 26.4% to $20.6 million due to reduced activity, restructuring costs and losses incurred by the resources related consultancies. Mining EBIT increased 13.0% to $67.7 million due to continued strong performance on ongoing contracts and the favourable one off benefit of $15 million. Rail EBIT decreased $13.0 million to $4.5 million driven by restructuring costs, a $4.0 million provision release in the prior corresponding period relating to the Waratah Train Project and lower relative performance from joint venture operations. Corporate costs increased by $1.9 million, or 5.0%, to $40.1 million, predominantly due to restructuring costs. The Group recognised $13.0 million expenses referable to Downer’s share of pre-tax bid costs in relation to the unsuccessful bid for Canberra’s new light rail project (Capital Metro). The Group recognised $5.0 million in Research & Development (R&D) incentives compared to $10.2 million in the prior corresponding period, reflecting a change in legislation that limited eligible R&D expenditure to $100 million. Net finance costs increased by $2.0 million, or 14.5%, to $15.8 million reflecting a full period of interest referable to the Tenix acquisition and marginally higher interest rates on the USPP notes. The effective tax rate of 26.0% is lower than the statutory rate of 30.0% due to non-assessable R&D incentives, non-taxable distributions from joint ventures and lower overseas tax rates.
9
For
per
sona
l use
onl
y

DIVISIONAL FINANCIAL PERFORMANCE Transport Services
Total revenue of $802.9 million, down 12.3%; EBIT of $31.6 million, down 9.7%; EBIT margin of 3.9%, up 0.1 ppts; ROFE of 16.1%, down from 18.9%; and Work-in-hand of $4.5 billion.
Technology and Communications Services
Total revenue of $249.9 million, up 2.0%; EBIT of $14.1 million, up 54.9%; EBIT margin of 5.6%, up 1.9 ppts; ROFE of 58.9%, up from 18.9%; and Work-in-hand of $1.8 billion.
Utilities Services
Total revenue of $376.5 million, up 83.7%; EBIT of $22.8 million, up 135.1%; EBIT margin of 6.1%, up 1.4 ppts; ROFE of 13.2%, down from 14.6%; and Work-in-hand of $2.9 billion.
0.0%
1.0%
2.0%
3.0%
4.0%
5.0%
0
200
400
600
800
1,000H
Y13
HY
14
HY
15
HY
16
($m)Revenue EBIT Margin
0.0%
2.0%
4.0%
6.0%
8.0%
0
50
100
150
200
250
300
350
400
HY
13
HY
14
HY
15
HY
16
($m)Utilities EBIT Margin
10
0.0%
1.0%
2.0%
3.0%
4.0%
5.0%
6.0%
0
50
100
150
200
250
300
HY
13
HY
14
HY
15
HY
16
($m)Revenue EBIT Margin
For
per
sona
l use
onl
y
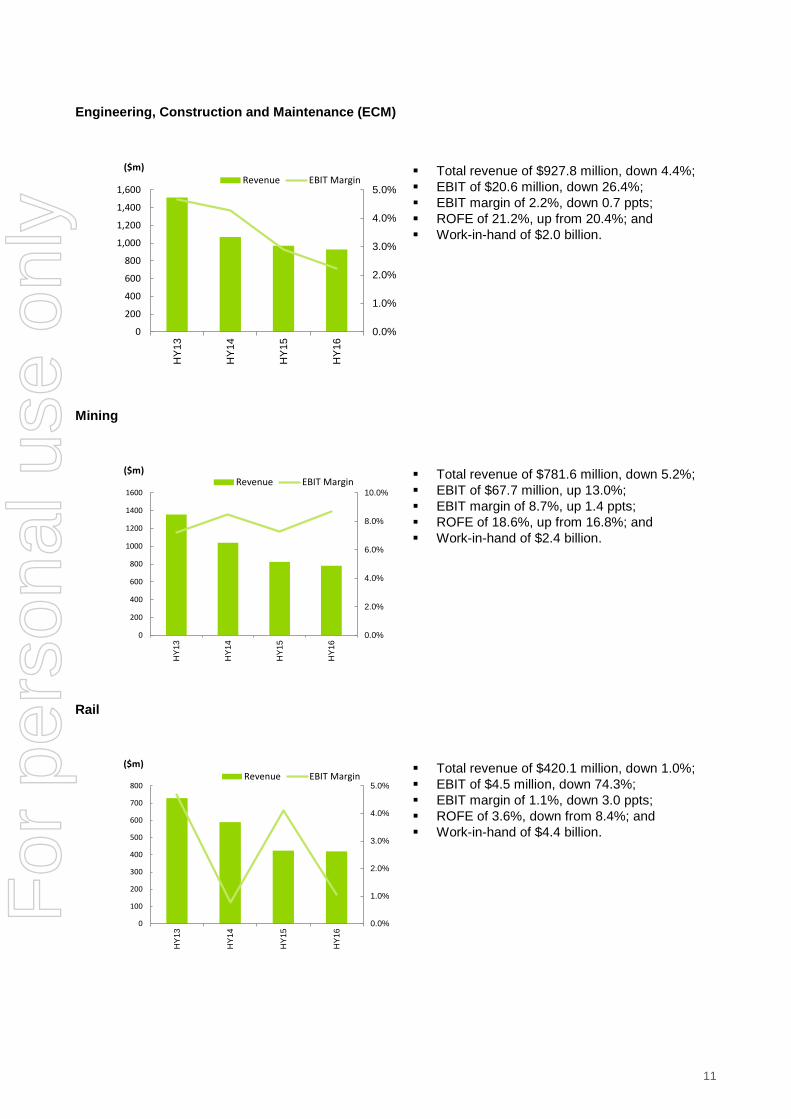
Engineering, Construction and Maintenance (ECM)
Total revenue of $927.8 million, down 4.4%; EBIT of $20.6 million, down 26.4%; EBIT margin of 2.2%, down 0.7 ppts; ROFE of 21.2%, up from 20.4%; and Work-in-hand of $2.0 billion.
Mining
Total revenue of $781.6 million, down 5.2%; EBIT of $67.7 million, up 13.0%; EBIT margin of 8.7%, up 1.4 ppts; ROFE of 18.6%, up from 16.8%; and Work-in-hand of $2.4 billion.
Rail
Total revenue of $420.1 million, down 1.0%; EBIT of $4.5 million, down 74.3%; EBIT margin of 1.1%, down 3.0 ppts; ROFE of 3.6%, down from 8.4%; and Work-in-hand of $4.4 billion.
0.0%
1.0%
2.0%
3.0%
4.0%
5.0%
0
200
400
600
800
1,000
1,200
1,400
1,600H
Y13
HY
14
HY
15
HY
16
($m)Revenue EBIT Margin
0.0%
2.0%
4.0%
6.0%
8.0%
10.0%
0
200
400
600
800
1000
1200
1400
1600
HY
13
HY
14
HY
15
HY
16
($m)Revenue EBIT Margin
0.0%
1.0%
2.0%
3.0%
4.0%
5.0%
0
100
200
300
400
500
600
700
800
HY
13
HY
14
HY
15
HY
16
($m)Revenue EBIT Margin
11
For
per
sona
l use
onl
y

GROUP FINANCIAL POSITION Funding, liquidity and capital are managed at Group level, with Divisions focused on working capital and operating cash flow management. The following financial position commentary relates to the Downer Group. OPERATING CASH FLOW Operating cash flow of $178.1 million was 30.9% lower than the prior corresponding period, reflecting an increase in unresolved project claims. Operating cash flow ($’m) Dec-14 Dec-13 INVESTING CASH FLOW Total investing cash flow was $123.5 million, down 69.4% or $280.6 million. The variance is predominantly due to the acquisitions of Tenix and VEC Engineering in the prior corresponding period for a combined total of $318.5 million. Excluding Tenix and VEC acquisitions, investing cash flow increased by $37.9 million reflecting capital expenditure made to support existing contracted operations. Payments for intangible assets increased by $24.1 million, representing the Group’s investment in IT systems. DEBT AND BONDING During the period, Downer completed an issue of 10 year fixed rate US Private Placement Notes in two tranches for amounts of US$100 million and $30 million, with a maturity date of July 2025. The Group’s performance bonding facilities increased by $34.3 million during the period to $1,367.6 million and with $574.9 million undrawn, there is material available capacity to support the ongoing operations of the Group. As at 31 December 2015, Downer had liquidity of $1.0 billion comprising cash balances of $489.5 million and undrawn committed debt facilities of $528.0 million. The Group continues to be rated BBB (Stable) by Fitch Ratings. BALANCE SHEET The net assets of Downer increased by 1.0% to $2.1 billion. Cash and cash equivalents increased by $117.3 million or 31.5% to $489.5 million, reflecting positive cash contributions from operations. Current trade and other receivables decreased by 5.6% or $62.8 million to $1.1 billion reflecting a decrease in revenue and a continued focus on cash collections by all divisions. Trade debtor days (excluding WIP) for the Group decreased by 4.0 days, from 25.7 to 21.7 days. Trade debtor days (including WIP) for the Group decreased 3.2 days from 56.7 days at June 2015 to 53.5 days. Net debt increased from $179.0 million at June 2015 to $188.4 million at December 2015 mainly reflecting the proceeds from the USPP notes, partially offset by normal debt and finance leases repayment. Gearing (net debt to net debt plus equity) increased from 8.1% (June 2015) to 8.4%. Taking into account the reduction in the present value of operating lease commitments for plant and equipment from $151.1 million (June 2015) to $140.8 million, off balance sheet gearing decreased from 14.0% (June 2015) to 13.8%. Inventories increased $3.4 million to $356.0 million reflecting revaluation of USD denominated stock and higher bitumen levels, partially offset by a reduction in tyre inventories and raw materials as a result of tight inventory management. Prepayments and other assets reduced by $7.3 million as a result of lower insurance and tyre prepayments.
12
For
per
sona
l use
onl
y

Interest in joint ventures and associates increased by $5.1 million due to Downer’s share of net profits from joint ventures and associates during the period. The net value of Property Plant and Equipment decreased by $10.7 million principally due to depreciation exceeding capex spend in response to the change in market conditions, partially offset by additions from operating lease buyout.
Intangible assets increased by $42.4 million due to goodwill arising from the acquisition of Tenix and VEC of $20.5 million with the remaining increase relating to the Group’s investment in IT systems during the period.
Trade and other payables decreased by $135.0 million as a result of lower business activities in December 2015 compared to June 2015 due to seasonality . Trade creditor days decreased by 2.0 days from 35.2 to 33.2 days, which is well within Downer’s terms of trade. Trade and other payables represent 46.3% of Downer’s total liabilities. Total drawn borrowings of $672.2 million represent 33.0% of Downer’s total liabilities and has increased by $133.6 million as a result of the USPP notes issued in July 2015, partially offset by repayment of debt. Other financial liabilities of $15.6 million decreased by $2.5 million and represent 0.8% of Downer’s total liabilities. The decrease reflects the refund of advances to joint ventures during the period and a lower marked to market revaluation on cross currency and interest rate swaps. Provisions of $325.1 million increased by $3.5 million and represent 16.0% of Downer’s total liabilities. Employee provisions (annual leave and long service leave) made up 79.6% of this balance with the remainder covering return conditions obligation for leased assets and property and warranty obligations. Shareholder equity increased by $21.2 million due predominantly to net profit after tax of $72.1 million during the period partially offset by the $6.4 million on-market share buy-back and $56.7 million of dividend payments made during the period. Net foreign currency gains on translation of foreign jurisdictions, particularly the New Zealand business, resulted in an increase in the foreign currency translation reserve by $10.7 million. DIVIDENDS The Downer Board resolved to pay a fully franked interim dividend of 12.0 cents per share (12.0 cents per share in the prior corresponding period), payable on 17 March 2016 to shareholders on the register at 18 February 2016. The Board also determined to continue to pay a fully imputed dividend on the ROADS security, which having been reset on 15 June 2015 has a yield of 7.21% per annum payable quarterly in arrears, with the next payment due on 15 March 2016. As this dividend is fully imputed (the New Zealand equivalent of being fully franked), the actual cash yield paid by Downer will be 5.19% per annum for the next 12 months.
13
For
per
sona
l use
onl
y

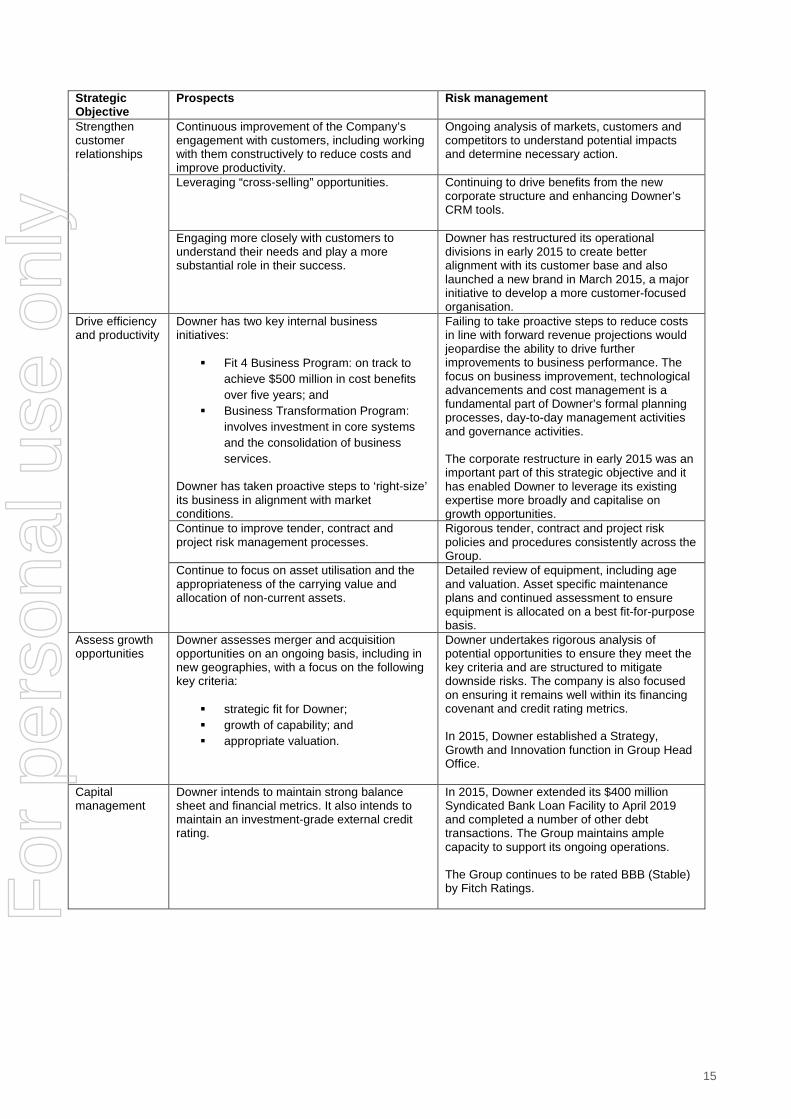
GROUP BUSINESS STRATEGIES, PROSPECTS AND RISKS FOR FUTURE FINANCIAL YEARS Downer is focused on improving business performance through a focus on safety, enhanced customer relationships, business transformation, cost efficiencies and productivity gains in response to changing economic conditions and the outlook for end markets. Downer’s strategic objectives, prospects and risks that could adversely impact the achievement of these objectives are outlined in the table below: Strategic Objective
Prospects Risk management
Maintain focus on Zero Harm
Downer is an industry leader but seeks to continually improve its performance to achieve its goal of zero work related injuries and environmental incidents.
Downer’s activities can result in harm to people and the environment. Downer has sought to mitigate this risk by assessing, understanding and mitigating the “critical risks” facing Downer and implementing Downer’s Cardinal Rules which provide direction and guidance on these critical risks.
Build core markets and capabilities
Downer will continue to improve its existing business and build on its market leading positions, capabilities and Intellectual Property. Downer will pursue initiatives to achieve these objectives, including:
The achievement of these strategic objectives may be affected by macro-economic risks including global economic conditions, volatile commodity prices, reduced capital expenditure in the Australian resources sector, insourcing by key customers (e.g. rolling stock maintenance and mining services), early termination or scope reduction on existing contracts (e.g. contract mining) and increasing overseas competition. Downer will continue to manage its exposure to these risks through:
developing and growing Asset Management capabilities;
forming strategic partnerships and joint ventures with leading technology and knowledge providers;
focusing more closely on forward revenue opportunities in public transport (network construction, operations and maintenance), electricity networks (through State Government privatisations), passenger rail (heavy and light rail), outsourcing of road maintenance by State Governments and the nbnTM roll-out;
forming strategic partnerships and joint ventures with leading technology and knowledge providers and enhancing Downer’s Customer Relationship Management (CRM) program;
expanding into overseas markets selectively through existing customer relationships;
identification, and rigorous review, of overseas opportunities;
enhancing management capability to improve operational and financial performance;
a succession planning process for all leadership roles and a leadership development program;
adapting tendering model for large infrastructure projects; and
bid governance process ensures i) there is a substantial level of risk assessment to inform Downer’s decision on whether to bid, and the terms of the bid, and ii) there is a strong focus on bid costs throughout the tender process; and
maintaining industry and geographical diversification to achieve greater resilience through economic cycles.
growth and development strategies to diversify revenue sources, including through joint ventures.
14
For
per
sona
l use
onl
y
Strategic Objective
Prospects Risk management
Strengthen customer relationships
Continuous improvement of the Company’s engagement with customers, including working with them constructively to reduce costs and improve productivity.
Ongoing analysis of markets, customers and competitors to understand potential impacts and determine necessary action.
Leveraging “cross-selling” opportunities. Continuing to drive benefits from the new corporate structure and enhancing Downer’s CRM tools.
Engaging more closely with customers to understand their needs and play a more substantial role in their success.
Downer has restructured its operational divisions in early 2015 to create better alignment with its customer base and also launched a new brand in March 2015, a major initiative to develop a more customer-focused organisation.
Drive efficiency and productivity
Downer has two key internal business initiatives:
Fit 4 Business Program: on track to achieve $500 million in cost benefits over five years; and
Business Transformation Program: involves investment in core systems and the consolidation of business services.
Downer has taken proactive steps to ‘right-size’ its business in alignment with market conditions.
Failing to take proactive steps to reduce costs in line with forward revenue projections would jeopardise the ability to drive further improvements to business performance. The focus on business improvement, technological advancements and cost management is a fundamental part of Downer’s formal planning processes, day-to-day management activities and governance activities. The corporate restructure in early 2015 was an important part of this strategic objective and it has enabled Downer to leverage its existing expertise more broadly and capitalise on growth opportunities.
Continue to improve tender, contract and project risk management processes.
Rigorous tender, contract and project risk policies and procedures consistently across the Group.
Continue to focus on asset utilisation and the appropriateness of the carrying value and allocation of non-current assets.
Detailed review of equipment, including age and valuation. Asset specific maintenance plans and continued assessment to ensure equipment is allocated on a best fit-for-purpose basis.
Assess growth opportunities
Downer assesses merger and acquisition opportunities on an ongoing basis, including in new geographies, with a focus on the following key criteria:
strategic fit for Downer; growth of capability; and appropriate valuation.
Downer undertakes rigorous analysis of potential opportunities to ensure they meet the key criteria and are structured to mitigate downside risks. The company is also focused on ensuring it remains well within its financing covenant and credit rating metrics. In 2015, Downer established a Strategy, Growth and Innovation function in Group Head Office.
Capital management
Downer intends to maintain strong balance sheet and financial metrics. It also intends to maintain an investment-grade external credit rating.
In 2015, Downer extended its $400 million Syndicated Bank Loan Facility to April 2019 and completed a number of other debt transactions. The Group maintains ample capacity to support its ongoing operations. The Group continues to be rated BBB (Stable) by Fitch Ratings.
15
For
per
sona
l use
onl
y

As discussed above, from 1 July 2015 Downer changed its segment reporting to the following six service lines: Transport Services; Technology and Communications Services; Utilities Services; EC&M; Mining; and Rail. The following table provides an overview of the key prospects relevant to each of these service lines and summarises Downer’s intended strategic response across each sector to maximise the company’s performance and realise future opportunities.
Service line Prospects Downer’s response Transport Services Potential for further outsourcing as Governments
seek greater efficiency and smarter solutions.
Downer has a sophisticated road asset management offering through its joint venture with Mouchel. It is well positioned for potential opportunities in NSW, QLD and other States/Territories. Downer has a vertically integrated Roads business with end-to-end service offering, including asphalt production.
Technology and Communications Services
Customers are developing new performance-based contracting models, based on closer collaboration between parties, which are generating longer term construction, operations and maintenance opportunities.
In 2015, Downer was awarded a five year contract by nbnTM to continue rolling out the national broadband network under the new Multi-technology Mix model.
Utilities Services The power, gas and water markets offer long-term operations and maintenance contract opportunities, with potential for growth through increased outsourcing.
In 2015, legislation was passed on Australia’s Renewable Energy Target, increasing the potential for new project development and contracting opportunities.
Downer holds a strong position in utilities markets due to its acquisition of Tenix in 2014. The Utilities business is well positioned to win outsourced work through the NSW power privatisation. In 2015, Downer was awarded a contract on the Ararat wind farm in Victoria and is pursuing several other renewable energy opportunities.
EC&M EC&M opportunities, particularly in the resources sector, are declining due to the mining downturn. They are being replaced by opportunities at different stages of the investment/asset lifecycle and across adjacent sectors.
Downer is building on its leading, multi-discipline capability, working with customers to provide the best project management delivery mode, and developing its asset management capabilities to become a strategic solutions provider across the complete asset lifecycle. Downer is also focused on optimising its performance on existing LNG projects.
Mining Depressed commodity prices have led to reduced volumes and lower levels of investment, increasing the industry’s focus on cost reduction. However, opportunities exist for mining contractors that can work collaboratively with customers to help drive productivity improvements and reduce production costs.
Downer’s Mining division continues to perform strongly by focusing on cost reduction, increased efficiencies and close collaboration with customers. The business continues to examine overseas opportunities.
Rail Governments are seeking value through:
the procurement of large orders of passenger rolling stock and long-term maintenance contracts;
the franchising of operations and maintenance of heavy rail, light rail and bus transport networks; and
the development of multi-modal transport infrastructure solutions.
Freight customers are seeking continual improvements to fleet performance and reliability, with a strong focus on technology and innovation.
Downer’s rail asset management model has a strong focus on ‘return on investment’ – i.e. increasing fleet availability and reliability. Downer maintains strong strategic partnerships with leading global transport solutions providers and, through this model, is pursuing opportunities in rolling stock manufacture and maintenance and transport network operations and maintenance. The Keolis Downer joint venture is a leading Australian multi-modal transport operator, through its light rail and bus operations.
16
For
per
sona
l use
onl
y
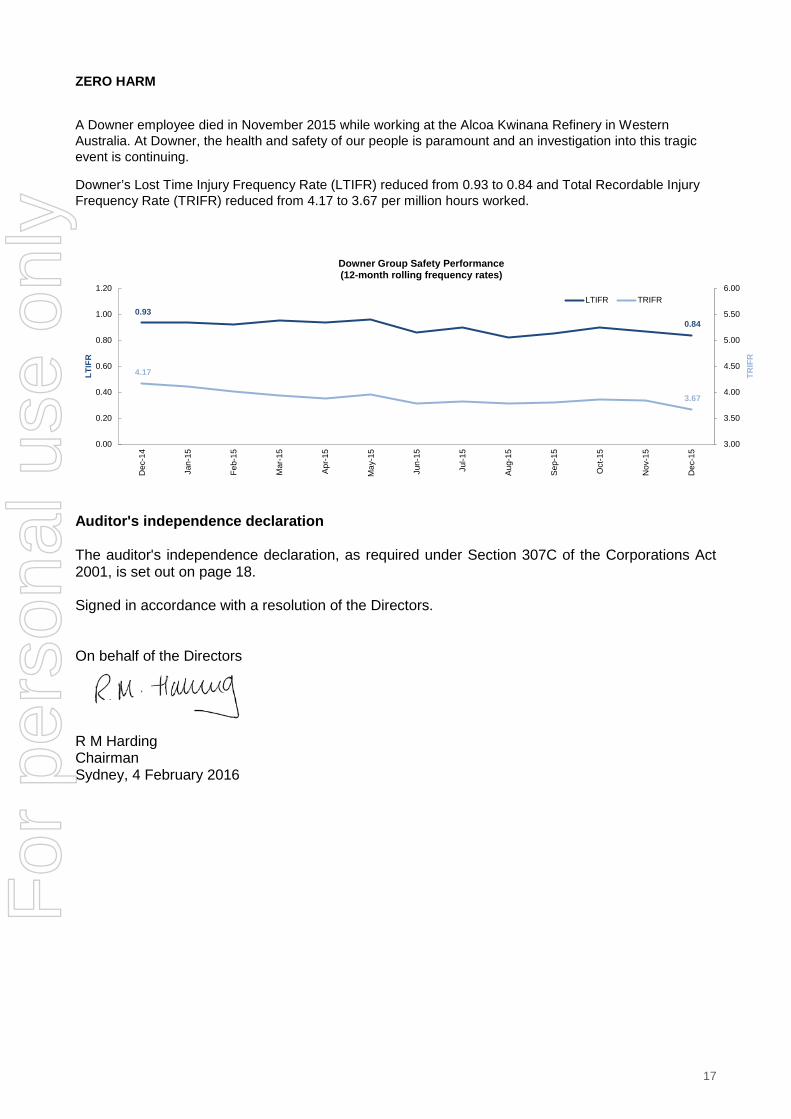
ZERO HARM
A Downer employee died in November 2015 while working at the Alcoa Kwinana Refinery in Western Australia. At Downer, the health and safety of our people is paramount and an investigation into this tragic event is continuing.
Downer’s Lost Time Injury Frequency Rate (LTIFR) reduced from 0.93 to 0.84 and Total Recordable Injury Frequency Rate (TRIFR) reduced from 4.17 to 3.67 per million hours worked.
Auditor's independence declaration The auditor's independence declaration, as required under Section 307C of the Corporations Act 2001, is set out on page 18. Signed in accordance with a resolution of the Directors. On behalf of the Directors
R M Harding Chairman Sydney, 4 February 2016
0.93 0.84
4.17
3.67
3.00
3.50
4.00
4.50
5.00
5.50
6.00
0.00
0.20
0.40
0.60
0.80
1.00
1.20
Dec
-14
Jan-
15
Feb-
15
Mar
-15
Apr
-15
May
-15
Jun-
15
Jul-1
5
Aug
-15
Sep
-15
Oct
-15
Nov
-15
Dec
-15
TRIF
R
LTIF
R
Downer Group Safety Performance (12-month rolling frequency rates)
LTIFR TRIFR
17
For
per
sona
l use
onl
y

KPMG, an Australian partnership and a member firm of the KPMG network of independent member firms affiliated with KPMG International Cooperative (“KPMG
International”), a Swiss entity. Liability limited by a scheme approved under Professional Standards Legislation.
Lead Auditor’s Independence Declaration under Section 307C of the Corporations Act 2001
To: the directors of Downer EDI Limited
I declare that, to the best of my knowledge and belief, in relation to the review for the half-year ended 31 December 2015 there have been:
(i) no contraventions of the auditor independence requirements as set out in the Corporations Act 2001 in relation to the audit; and
(ii) no contraventions of any applicable code of professional conduct in relation to the audit.
KPMG
John Teer Partner
Sydney
4 February 2016
For
per
sona
l use
onl
y

KPMG, an Australian partnership and a member firm of the KPMG network of independent member firms affiliated with KPMG International Cooperative (“KPMG International”), a Swiss entity. Liability limited by a scheme approved under Professional Standards Legislation.
INDEPENDENT AUDITOR’S REVIEW REPORT To the Members of Downer EDI Limited REPORT ON THE FINANCIAL REPORT We have reviewed the accompanying half-year financial report of Downer EDI Limited, which comprises the condensed consolidated statement of financial position as at 31 December 2015, condensed consolidated statement of profit or loss and condensed consolidated statement of comprehensive income, condensed consolidated statement of changes in equity and condensed consolidated statement of cash flows for the half-year ended on that date, notes A to D comprising a summary of significant accounting policies and other explanatory information and the directors’ declaration of the Group comprising the company and the entities it controlled at the half-year’s end or from time to time during the half-year.
Directors’ responsibility for the half-year financial report The directors of the company are responsible for the preparation of the half-year financial report that gives a true and fair view in accordance with Australian Accounting Standards and the Corporations Act 2001 and for such internal control as the directors determine is necessary to enable the preparation of the half-year financial report that is free from material misstatement, whether due to fraud or error.
Auditor’s responsibility Our responsibility is to express a conclusion on the half-year financial report based on our review. We conducted our
review in accordance with Auditing Standard on Review Engagements ASRE 2410 Review of a Financial Report Performed by the Independent Auditor of the Entity, in order to state whether, on the basis of the procedures described, we have become aware of any matter that makes us believe that the half-year financial report is not in accordance with the Corporations Act 2001 including: giving a true and fair view of the Group’s financial position as at 31 December 2015 and its performance for the half-year ended on that date; and complying with Australian Accounting Standard AASB 134 Interim Financial Reporting and the Corporations Regulations 2001. As auditor of Downer EDI Limited, ASRE 2410 requires that we comply with the ethical requirements relevant to the audit of the annual financial report.
A review of a half-year financial report consists of making enquiries, primarily of persons responsible for financial and accounting matters, and applying analytical and other review procedures. A review is substantially less in scope than an audit conducted in accordance with Australian Auditing Standards and consequently does not enable us to obtain assurance that we would become aware of all significant matters that might be identified in an audit. Accordingly, we do not express an audit opinion.
Independence
In conducting our review, we have complied with the independence requirements of the Corporations Act 2001.
Conclusion
Based on our review, which is not an audit, we have not become aware of any matter that makes us believe that the half-year financial report of Downer EDI Limited is not in accordance with the Corporations Act 2001, including:
(a) giving a true and fair view of the Group’s financial position as at 31 December 2015 and of its performance for the half-year ended on that date; and
(b) complying with Australian Accounting Standard AASB 134 Interim Financial Reporting and the Corporations Regulations 2001.
KPMG KPMG
John Teer Cameron Slapp Partner Partner
Sydney Sydney
4 February 2016 4 February 2016
For
per
sona
l use
onl
y

Condensed Consolidated Statement of Profit or Loss and Other Comprehensive Incomefor the half-year ended 31 December 2015
31 Dec 31 Dec2015 2014
Note $'m $'m
Revenue from ordinary activities B2 3,262.0 3,375.0 Other income B2 2.6 2.8 Total revenue and other income 3,264.6 3,377.8
Employee benefits expense B2 (1,341.2) (1,250.3)Raw materials and consumables used(i) (565.4) (628.5)Subcontractor costs (628.2) (757.0)Plant and equipment costs(i) (301.3) (310.4)Depreciation and amortisation D1,D2 (128.0) (122.0)Other expenses from ordinary activities (195.4) (180.6)Total expenses (3,159.5) (3,248.8)
Share of net profit of joint ventures and associates 8.1 12.7
Earnings before interest and tax 113.2 141.7
Finance income 3.8 3.9 Finance costs (19.6) (17.7)Net finance costs (15.8) (13.8)
Profit before income tax 97.4 127.9 Income tax expense (25.3) (33.2)Profit after income tax 72.1 94.7
Other comprehensive income
Items that may be reclassified subsequently to profit or loss- 10.7 4.8 - (1.2) 2.5 - (1.2) 0.1 - 0.7 (0.7)
9.0 6.7
Total comprehensive income for the period 81.1 101.4
Earnings per share (cents)- Basic earnings per share B3 15.8 20.8 - Diluted earnings per share B3 15.1 20.1
(i)
Other comprehensive income for the period (net of tax)Income tax relating to components of other comprehensive income
The condensed consolidated statement of profit or loss and other comprehensive income should be read inconjunction with the accompanying notes on pages 24 to 38.
The December 2014 balances have been reclassified by $22.1 million to better reflect the nature of the costs incurred. There has been no impact on the earnings before interest and tax as a result of these changes.
Exchange differences arising on translation of foreign operations
Net (loss)/gain on cross currency interest rate swaps taken to equityNet (loss)/gain on foreign currency forward contracts taken to equity
20
For
per
sona
l use
onl
y

Condensed Consolidated Statement of Financial Positionas at 31 December 2015
Dec Jun2015 2015
Note $'m $'m
ASSETSCurrent assetsCash and cash equivalents 489.5 372.2 Trade and other receivables 1,060.6 1,123.4 Other financial assets 12.8 11.5 Inventories 356.0 352.6 Current tax assets 13.5 20.3 Prepayments and other assets 34.6 41.9 Total current assets 1,967.0 1,921.9
Non-current assetsTrade and other receivables 15.9 15.9 Interest in joint ventures and associates 88.4 83.3 Property, plant and equipment D1 1,026.4 1,037.1 Intangible assets D2 961.4 919.0 Other financial assets 25.2 19.6 Deferred tax assets - 0.7 Prepayments and other assets 6.3 6.9 Total non-current assets 2,123.6 2,082.5 Total assets 4,090.6 4,004.4
LIABILITIESCurrent liabilitiesTrade and other payables 928.5 1,066.5 Borrowings C1 46.3 62.2 Other financial liabilities 14.8 15.9 Employee benefits provision 229.0 228.1 Provisions 50.4 50.1 Current tax liabilities 10.9 0.7 Total current liabilities 1,279.9 1,423.5
Non-current liabilitiesTrade and other payables 12.7 9.7 Borrowings C1 625.9 476.4 Other financial liabilities 0.8 2.2 Employee benefits provision 29.7 29.5 Provisions 16.0 13.9 Deferred tax liabilities 69.1 13.9 Total non-current liabilities 754.2 545.6 Total liabilities 2,034.1 1,969.1 Net assets 2,056.5 2,035.3
EQUITYIssued capital C3 1,443.6 1,449.1 Reserves (4.5) (15.8)Retained earnings 617.4 602.0 Total equity 2,056.5 2,035.3
The condensed consolidated statement of financial position should be read in conjunction with theaccompanying notes on pages 24 to 38.
21
For
per
sona
l use
onl
y

Condensed Consolidated Statement of Changes in Equityfor the half-year ended 31 December 2015
Dec 2015$'m
Issued capital
Hedge reserve
Foreign currency
translation reserve
Employee benefits reserve
Retained earnings Total
Balance at 1 July 2015 1,449.1 (0.3) (27.8) 12.3 602.0 2,035.3
Profit after income tax - - - - 72.1 72.1
Other comprehensive income for the period (net of tax) - (1.7) 10.7 - - 9.0
Total comprehensive income for the period - (1.7) 10.7 - 72.1 81.1
Group on-market share buy-back (6.4) - - - - (6.4)Vested executive incentive shares transactions 0.9 - - - - 0.9 Share-based employee benefits expense - - - 2.4 - 2.4 Income tax relating to share-based transactions during the period - - - (0.1) - (0.1)Payment of dividends(i) - - - - (56.7) (56.7)
Balance at 31 December 2015 1,443.6 (2.0) (17.1) 14.6 617.4 2,056.5
Dec 2014$'m
Issued capital
Hedge reserve
Foreign currency
translation reserve
Employee benefits reserve
Retained earnings Total
Balance at 1 July 2014 1,457.9 (1.7) (16.1) 15.3 506.6 1,962.0
Profit after income tax - - - - 94.7 94.7
Other comprehensive income for the period (net of tax) - 1.9 4.8 - - 6.7
Total comprehensive income for the period - 1.9 4.8 - 94.7 101.4
Group on-market share buy-back (11.7) - - - - (11.7)Vested executive incentive shares transactions 0.2 - - (0.2) - - Share-based employee benefits expense - - - 1.3 - 1.3 Income tax relating to share-based transactions during the period - - - 0.1 - 0.1 Payment of dividends(i) - - - - (57.5) (57.5)Balance at 31 December 2014 1,446.4 0.2 (11.3) 16.5 543.8 1,995.6
The condensed consolidated statement of changes in equity should be read in conjunction with the accompanyingnotes on pages 24 to 38.
(i) Payment of dividend relates to the 2014 final dividend, and $5.3m ROADS dividends paid during the financial period.
(i) Payment of dividend relates to the 2015 final dividend, and $4.8m ROADS dividends paid during the financial period.
22
For
per
sona
l use
onl
y

Condensed Consolidated Statement of Cash Flowsfor the half-year ended 31 December 2015
31 Dec 31 Dec2015 2014$'m $'m
Cash flows from operating activitiesReceipts from customers 3,690.6 3,947.5 Distributions from equity-accounted investees 2.1 2.4 Payments to suppliers and employees (3,537.6) (3,658.1)Interest received 3.5 3.9 Interest and other costs of finance paid (14.7) (15.9)Income tax received/(paid) 34.2 (21.9)Net cash inflow from operating activities 178.1 257.9
Cash flows from investing activitiesProceeds from sale of property, plant and equipment 12.0 14.3 Payments for property, plant and equipment (112.0) (92.9)Payments for intangible assets (28.7) (4.6)Receipt from/(payments for) investments 0.6 (0.1)Advances to joint ventures (1.5) (2.3)Proceeds from sale of businesses 7.2 - Payments for businesses acquired (1.1) (318.5)Net cash used in investing activities (123.5) (404.1)
Cash flows from financing activitiesGroup on-market share buy-back (6.4) (11.7)Proceeds from borrowings 168.9 499.0 Repayments of borrowings (44.8) (339.3)Dividends paid (56.7) (57.5)Net cash used in financing activities 61.0 90.5
Net increase/(decrease) in cash and cash equivalents 115.6 (55.7)Cash and cash equivalents at the beginning of the period 372.2 431.8 Effect of exchange rate changes 1.7 1.9 Cash and cash equivalents at the end of the period 489.5 378.0
The condensed consolidated statement of cash flows should be read in conjunction with the accompanying noteson pages 24 to 38.
23
For
per
sona
l use
onl
y

Notes to the condensed consolidated financial reportfor the half-year ended 31 December 2015
About this report
Statement of compliance and basis of preparation
Rounding of amounts
Accounting estimates and judgements
Business performance
B1. Segment information B3. Earnings per shareB2. Profit from ordinary activities B4. Subsequent events
B1. Segment information
- Transport Services- Technology and Communication Services (Tech & Comms Services)- Utilities Services- Engineering, Construction and Maintenance (EC&M)- Mining- Rail
There have been no changes to the composition of the Group's reportable segments since last reported in the 2015Annual Report.
The operating segments identified within the Group are outlined below:
An operating segment is a component of an entity that engages in business activities from which it may earn revenueand incur expenses. The operating segments have been identified based on the nature of the service provided andthe internal reports that are reviewed regularly by the Group CEO in assessing performance and in determining theallocation of resources.
A
B
This condensed consolidated half-year Financial Report (Financial Report) represents the consolidated results ofDowner EDI Limited (ABN 97 003 872 848) (Downer). The Financial Report is a general purpose Financial Reportprepared in accordance with AASB 134 Interim Financial Reporting and the Corporations Act 2001 (Cth), and withIAS 134 Interim Financial Reporting .
The Financial Report does not include all the information required for an annual financial report and should be readin conjunction with the 2015 Annual Report.
Accounting policies are selected and applied in a manner that ensures the resulting financial information satisfies theconcepts of relevance and reliability, thereby ensuring that the substance of the underlying transactions or otherevents is reported. The accounting policies and methods of computation applied in the Financial Report areconsistent with those adopted and disclosed in the 2015 Annual Report. Amounts in the Financial Report arepresented in Australian dollars unless otherwise noted and has been prepared on a historical cost basis, except forrevaluation of certain financial instruments.
The Financial Report was authorised for issue by the Directors on 4 February 2016.
Downer is a company of a kind referred to in ASIC Class Order 98/100 dated 10 July 1998 and in accordance withthe Class Order, unless otherwise stated, amounts have been rounded off to the nearest whole number of millions ofdollars and one place of decimals representing hundreds of thousands of dollars in accordance with that ClassOrder. Amounts shown as $ – represent amounts less than $50,000 which have been rounded down.
Significant judgement, estimates and assumptions about future events are made by management when applyingaccounting policies and preparing the Financial Report which are consistent with those described in the 2015 AnnualReport.
24
For
per
sona
l use
onl
y
Notes to the condensed consolidated financial report - continuedfor the half-year ended 31 December 2015
B1. Segment information - continuedB1-01 B1-02 B1-03 B1-04 B1-05 B1-06 B1-07
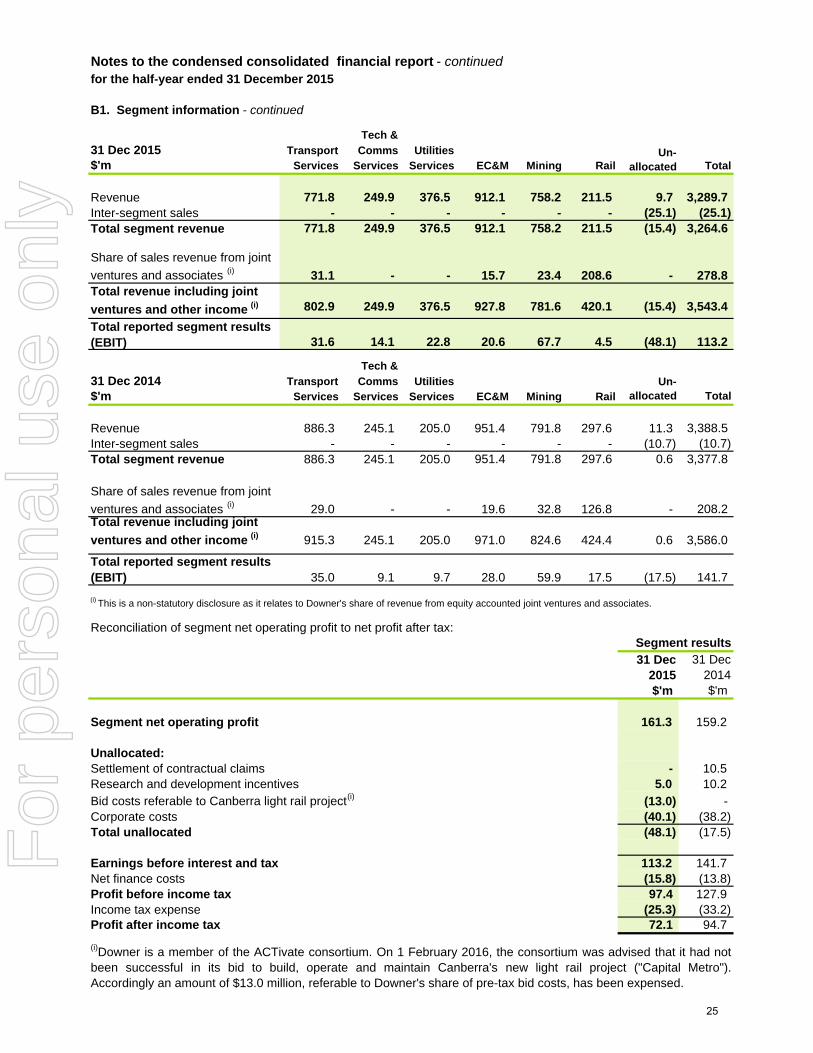
Tech &31 Dec 2015 Transport Comms Utilities$'m Services Services Services EC&M Mining Rail Total
Revenue 771.8 249.9 376.5 912.1 758.2 211.5 9.7 3,289.7 Inter-segment sales - - - - - - (25.1) (25.1)Total segment revenue 771.8 249.9 376.5 912.1 758.2 211.5 (15.4) 3,264.6
31.1 - - 15.7 23.4 208.6 - 278.8
802.9 249.9 376.5 927.8 781.6 420.1 (15.4) 3,543.4
31.6 14.1 22.8 20.6 67.7 4.5 (48.1) 113.2
Tech &31 Dec 2014 Transport Comms Utilities$'m Services Services Services EC&M Mining Rail Total
Revenue 886.3 245.1 205.0 951.4 791.8 297.6 11.3 3,388.5 Inter-segment sales - - - - - - (10.7) (10.7)Total segment revenue 886.3 245.1 205.0 951.4 791.8 297.6 0.6 3,377.8
29.0 - - 19.6 32.8 126.8 - 208.2
915.3 245.1 205.0 971.0 824.6 424.4 0.6 3,586.0
35.0 9.1 9.7 28.0 59.9 17.5 (17.5) 141.7
Reconciliation of segment net operating profit to net profit after tax:
31 Dec 31 Dec2015 2014$'m $'m
Segment net operating profit 161.3 159.2
Unallocated:Settlement of contractual claims - 10.5 Research and development incentives 5.0 10.2 Bid costs referable to Canberra light rail project(i) (13.0) - Corporate costs (40.1) (38.2)Total unallocated (48.1) (17.5)
Earnings before interest and tax 113.2 141.7 Net finance costs (15.8) (13.8)Profit before income tax 97.4 127.9 Income tax expense (25.3) (33.2)Profit after income tax 72.1 94.7
Segment results
Total reported segment results (EBIT)
Total reported segment results (EBIT)
(i)Downer is a member of the ACTivate consortium. On 1 February 2016, the consortium was advised that it had notbeen successful in its bid to build, operate and maintain Canberra's new light rail project ("Capital Metro").Accordingly an amount of $13.0 million, referable to Downer's share of pre-tax bid costs, has been expensed.
Un-allocated
Un-allocated
(i) This is a non-statutory disclosure as it relates to Downer's share of revenue from equity accounted joint ventures and associates.
Share of sales revenue from joint ventures and associates (i)
Share of sales revenue from joint ventures and associates (i)
Total revenue including joint ventures and other income (i)
Total revenue including joint ventures and other income (i)
25
For
per
sona
l use
onl
y

Notes to the condensed consolidated financial report - continuedfor the half-year ended 31 December 2015
B2. Profit from ordinary activities
a) Revenue and other income31 Dec 31 Dec
2015 2014$'m $'m
Sales revenue Rendering of services(i) 1,955.9 2,064.9 Mining services 739.4 766.2 Construction contracts(i) 449.0 394.7 Sale of goods 98.1 125.1 Other revenue 19.6 24.1 Total revenue from ordinary activities 3,262.0 3,375.0 Other income 2.6 2.8 Total revenue and other income 3,264.6 3,377.8 Share of sales revenue from joint ventures and associates (ii) 278.8 208.2 Total revenue including joint ventures and associates and other income (ii) 3,543.4 3,586.0
b) Operating expenses31 Dec 31 Dec
2015 2014$'m $'m
Employee benefits expense: - Defined contribution plans 69.6 68.2 - Shared-based employee benefits expense 2.4 1.3 - Employee benefits 1,255.5 1,169.2 - Redundancy costs 13.7 11.6 Total employee benefits expense 1,341.2 1,250.3
Operating lease expenses relating to land and building 34.2 34.3 Operating lease expenses relating to plant and equipment 49.4 63.7 Total operating lease expenses 83.6 98.0
2.3 -
c) Individually significant item31 Dec 31 Dec
2015 2014$'m $'m
- Bid costs referable to Canberra light rail project 13.0 -
(i) The December 2014 balances have been reclassified by $64.7 million to better reflect the nature of sales revenue recognised. There has beenno impact on the total revenue from ordinary activities.(ii) This is a non-statutory disclosure as it relates to Downer's share of revenue from equity accounted joint ventures and associates.
Net loss on disposal of business
The following material item is relevant to an understanding of the Group's financialperformance:
Downer is a member of the ACTivate consortium. On 1 February 2016, the consortium was advised that it had notbeen successful in its bid to build, operate and maintain Canberra's new light rail project ("Capital Metro").Accordingly an amount of $13.0 million, referable to Downer's share of pre-tax bid costs, has been expensed.
26
For
per
sona
l use
onl
y

Notes to the condensed consolidated financial report - continuedfor the half-year ended 31 December 2015
B3. Earnings per share
Basic earnings per share
31 Dec 31 Dec2015 2014
Profit attributable to members of the parent entity ($'m) 72.1 94.7 Adjustment to reflect ROADS dividends paid ($'m) (4.8) (5.3)
67.3 89.4
Weighted average number of ordinary shares (WANOS) on issue (m's) (i) 427.1 428.9
Basic earnings per share (cents per share) 15.8 20.8
Diluted earnings per share
31 Dec 31 Dec 2015 2014
72.1 94.7
Weighted average number of ordinary shares - diluted Weighted average number of ordinary shares (WANOS) on issue (m's) (i)(ii) 427.8 429.0 WANOS adjustment to reflect potential dilution for ROADS (m's)(iii) 50.9 43.1
WANOS used in the calculation of diluted EPS (m's) 478.7 472.1
Diluted earnings per share (cents per share) 15.1 20.1
(i)
(ii)
(iii)
B4. Subsequent events
On 1 February 2016, the ACTivate consortium, of which Downer is a member, was advised that it had not beensuccessful in its bid to build, operate and maintain Canberra's new light rail project ("Capital Metro"). Accordingly anamount of $13.0 million, referable to Downer's share of pre-tax bid costs, has been expensed and disclosed as anindividually significant item in Note B2(c).
Profit attributable to members of the parent entity ($'m)
The calculation of basic earnings per share (EPS) is based on the profit attributable to ordinary shareholders andthe weighted-average number of ordinary shares outstanding.
The calculation of diluted EPS is based on the profit attributable to ordinary shareholders and the weighted-averagenumber of ordinary shares outstanding after adjustments for the effects of all dilutive potential ordinary shares.
Profit attributable to members of the parent entity used in calculating EPS ($'m)
The WANOS on issue has been adjusted by the weighted average effect of on-market share buy-back and the unvestedexecutive incentive shares. For diluted earnings per share, the WANOS has been further adjusted by the potential vesting of executive incentive shares. The WANOS adjustment is the value of ROADS that could potentially be converted into ordinary shares at the reportingdate. It is calculated based on the issued value of ROADS in New Zealand dollars converted to Australian dollars at the spotrate prevailing at the reporting date, which was $187.5 million (Dec 2014: $191.1 million), divided by the average marketprice of the Company's ordinary shares for the period 1 July 2015 to 31 December 2015 discounted by 2.5% according to theROADS contract terms, which was $3.68 (Dec 2014: $4.43).
27
For
per
sona
l use
onl
y
Notes to the condensed consolidated financial report - continuedfor the half-year ended 31 December 2015
Capital structure and financing
C1. Borrowings C3. Issued capitalC2. Financing facilities C4. Dividends
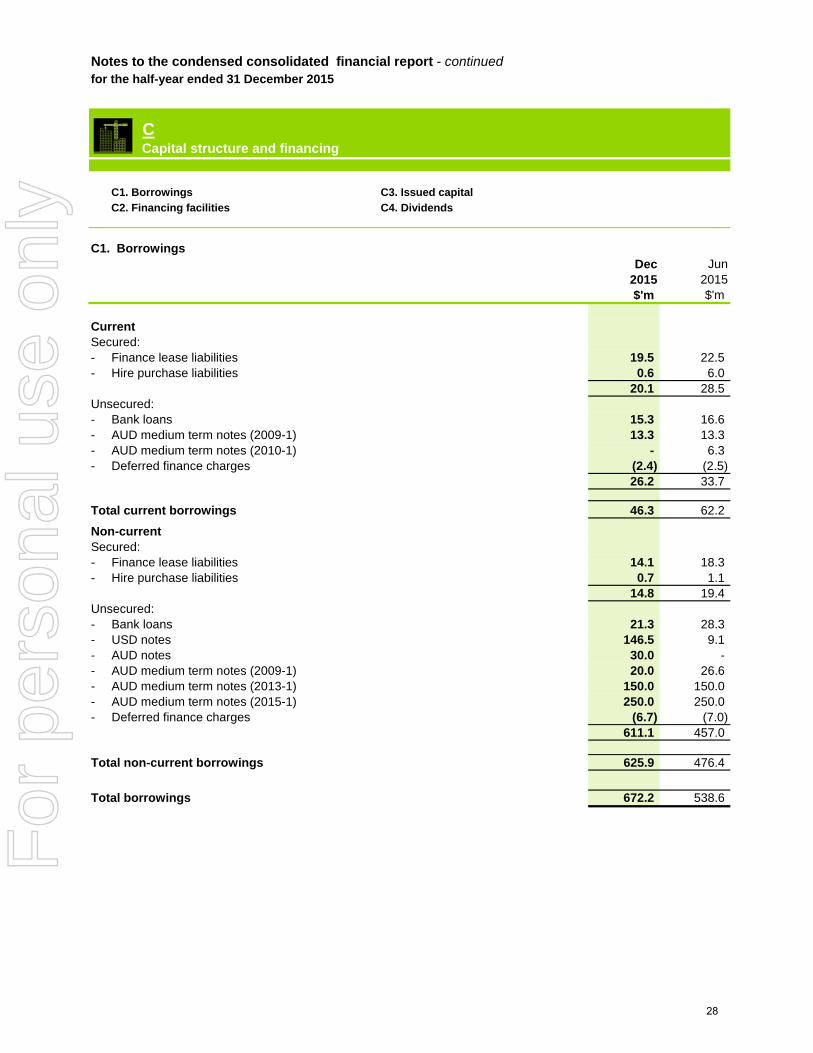
C1. BorrowingsDec Jun
2015 2015$'m $'m
CurrentSecured:- Finance lease liabilities 19.5 22.5 - Hire purchase liabilities 0.6 6.0
20.1 28.5 Unsecured: - Bank loans 15.3 16.6 - AUD medium term notes (2009-1) 13.3 13.3 - AUD medium term notes (2010-1) - 6.3 - Deferred finance charges (2.4) (2.5)
26.2 33.7
Total current borrowings 46.3 62.2
Non-currentSecured: - Finance lease liabilities 14.1 18.3 - Hire purchase liabilities 0.7 1.1
14.8 19.4 Unsecured: - Bank loans 21.3 28.3 - USD notes 146.5 9.1 - AUD notes 30.0 - - AUD medium term notes (2009-1) 20.0 26.6 - AUD medium term notes (2013-1) 150.0 150.0 - AUD medium term notes (2015-1) 250.0 250.0 - Deferred finance charges (6.7) (7.0)
611.1 457.0
Total non-current borrowings 625.9 476.4
Total borrowings 672.2 538.6
C
28
For
per
sona
l use
onl
y

Notes to the condensed consolidated financial report - continuedfor the half-year ended 31 December 2015
C2. Financing facilities
Financing facilities
Dec Jun2015 2015$'m $'m
Syndicated bank loan facility 400.0 400.0 Bilateral bank loan facilities 128.0 210.0 Total unutilised bank loan facilities 528.0 610.0
Bilateral bank and insurance company bonding facilities 574.9 524.9 Total unutilised bonding facilities 574.9 524.9
Bank loans Syndicated loan facility
Bilateral bank loans
USD notes
AUD notes
AUD Medium Term Notes (MTNs)The Group has the following MTNs on issue:
-
--
The above facilities and notes are subject to certain Group guarantees.
Finance lease facilities
Hire purchase
Series 2015-1 for an amount of $250.0 million, which has a bullet maturity date of March 2022.
The Group funds certain of its equipment under finance leases which amortise over periods of up to two years. TheGroup’s obligations under finance leases are secured by the lessors’ title to the leased assets.
Hire purchase facilities are secured by the specific assets financed.
At 31 December 2015, the Group had the following facilities that were not utilised:
The syndicated loan facility, totalling $400.0 million, is unsecured and has a maturity date of April 2019.
USD unsecured private placement notes are on issue for a total amount of US$107.0 million. US$7.0 million notesmature in September 2019 and the remainder in July 2025. The USD denominated principal and interest amountshave been fully hedged against the Australian dollar.
AUD unsecured private placement notes are on issue for a total amount of $30.0 million with a maturity of July 2025.
Series 2009-1 amortises through even semi-annual instalments, until the final maturity date of April 2018 and has a balance of $33.3 million; Series 2013-1 for an amount of $150.0 million, which has a bullet maturity date of November 2018; and
These facilities are unsecured and due for renewal in multiple tranches in calendar years 2017 and 2018 excluding$36.6 million of loans which are supported by Export Credit Agency guarantees and which amortise through even,semi-annual instalments with final maturity dates of May 2017, October 2017 and July 2019.
29
For
per
sona
l use
onl
y
Notes to the condensed consolidated financial report - continuedfor the half-year ended 31 December 2015
C2. Financing facilities - continued
Covenants on financing facilities
Bonding
Refinancing requirements
Credit ratings
The Group’s facilities are provided by a number of banks and insurance companies on an unsecured basis and aresubject to certain Group guarantees. $792.7 million (refer to Note D5) of these facilities were utilised as at 31December 2015 with $574.9 million unutilised. $32.3 million of the current committed facilities relates to a non-revolving syndicated bonding facility referable to the Waratah Train Project which matures in March 2016 and is fullyutilised. Excluding this syndicated facility, the Group’s other facilities have varying maturity dates between calendaryears 2016 and 2018.
Certain of the Group's financing facilities contain undertakings including an obligation to comply at all times withfinancial covenants. This requires the Group to operate within certain financial ratios as well as ensuring thatsubsidiaries that contribute certain minimum threshold amounts of Group EBIT and Group Total Tangible Assets areguarantors under various facilities.
The Group currently has an Investment Grade credit rating of BBB (Outlook Stable) from Fitch Ratings. Where thecredit rating is reduced or placed on negative watch, customers and suppliers may be less willing to contract with theGroup. Furthermore, banks and other lending institutions may demand more stringent terms (including increasedpricing, reduced tenors and lower facility limits) on debt and bonding facilities to reflect the higher credit risk profile.
The underlying risk being assumed by the relevant financier under all bonds is Downer corporate credit risk, ratherthan project specific risk.
Where existing facilities approach maturity, the Group will seek to negotiate with existing and new financiers toextend the maturity date of these facilities. The Group’s financial metrics, credit rating, state of the economy,conditions in financial markets and other factors may influence the outcome of these negotiations.
The Group has the flexibility in respect of certain committed facility amounts (shown as part of the unutilised bilateralbank loan facilities) which can, at the election of the Group, be utilised for bonding purposes.
The main financial covenants which the Group is subject to are Net Worth, Interest Service Coverage (calculated asrolling 12 month EBIT to Net Interest Expense) and Leverage (calculated as Net Debt to Total Capitalisation).
Financial covenants testing is undertaken and reported to the Board on a monthly basis. Reporting of financialcovenants to financiers occurs semi-annually for the rolling 12 month periods to 30 June and 31 December. TheGroup was in compliance with all its financial covenants as at 31 December 2015.
The Group has $1,367.6 million of bank guarantee and insurance bond facilities to support its contracting activities.$539.8 million of these facilities are provided to the Group on a committed basis and $827.8 million on anuncommitted basis.
30
For
per
sona
l use
onl
y

Notes to the condensed consolidated financial report - continuedfor the half-year ended 31 December 2015
C3. Issued capital Dec Jun
2015 2015$'m $'m
Ordinary shares430,858,214 ordinary shares (Jun 2015: 432,683,214) 1,290.3 1,296.7 Unvested executive incentive shares5,152,435 ordinary shares (Jun 2015: 5,295,993) (25.3) (26.2)Redeemable Optionally Adjustable Distributing Securities (ROADS) 200,000,000 ROADS (Jun 2015: 200,000,000) 178.6 178.6
1,443.6 1,449.1
Fully paid ordinary share capitalFully paid ordinary shares carry one vote per share and carry the right to dividends.
m's $'m m's $'m
Fully paid ordinary share capitalBalance at the beginning of the financial period/year 432.7 1,296.7 435.4 1,308.4 Group on-market share buy-back (1.8) (6.4) (2.7) (11.7)Balance at the end of the financial period/year 430.9 1,290.3 432.7 1,296.7
Unvested executive incentive sharesBalance at the beginning of the financial period/year 5.3 (26.2) 6.0 (29.1)Vested executive incentive shares transactions (i) (0.1) 0.9 (0.7) 2.9 Balance at the end of the financial period/year 5.2 (25.3) 5.3 (26.2)
Redeemable Optionally Adjustable DistributingSecurities (ROADS) m's $'m m's $'m
200.0 178.6 200.0 178.6
Jun
Dec Jun
Unvested executive incentive shares are stock market purchases and are held by the Executive Employee SharePlan Trust under the Long Term Incentive (LTI) plan. From the 2011 LTI plan onwards, no dividends will bedistributed on shares held in trust during the performance measurement and service periods. Accumulated dividendswill be paid out to executives after all vesting conditions have been met. Otherwise, excess net dividends areretained in the trust to be used by the Company to acquire additional shares on the market for employee equityplans.
2015
Balance at the beginning and at the end of the financial period/year
2015 2015
Dec2015
(i) 143,558 vested shares for a value of $878,518 referable to the first deferred component of the 2014 STI award. June 2015 referable to vested shares under the LTI plan totalling 742,705 shares for a value of $2,920,601.
Commencing in the 2014 financial year, the Board introduced deferral as part of the short-term incentive structure(DSTIP). Under the DSTIP, 50% of award are deferred over two years and paid in two tranches, each to the value of25% of the award. These deferred components are settled in shares, net of applicable taxes, unless the Boarddetermines otherwise.
31
For
per
sona
l use
onl
y

Notes to the condensed consolidated financial report - continuedfor the half-year ended 31 December 2015
C4. Dividends
a) Ordinary shares
2016Interim
2015 Final
2015 Interim
Dividend per share (in Australian cents) 12.0 12.0 12.0 Franking percentage 100% 100% 100%Cost (in $'m) 51.7 51.9 51.9 Payment date 17/03/2016 17/09/2015 19/03/2015Dividend record date 18/02/2016 20/08/2015 19/02/2015
b) Redeemable Optionally Adjustable Distributing Securities (ROADS)
2016 Quarter 1 Quarter 2 Total
Dividend per ROADS (in Australian cents) 1.18 1.22 2.40 100% 100% 100%
Cost (in A$'m) 2.4 2.4 4.8 Payment date 15/09/2015 15/12/2015
2015 Quarter 1 Quarter 2 Quarter 3 Quarter 4 Total
Dividend per ROADS (in Australian cents) 1.28 1.37 1.40 1.27 5.32 100% 100% 100% 100% 100%
Cost (in A$'m) 2.6 2.7 2.8 2.6 10.7 Payment date 15/09/2014 15/12/2014 16/03/2015 15/06/2015
New Zealand imputation credit percentage
The 2016 interim dividend has not been declared at the reporting date and therefore is not reflected in the financialstatements.
New Zealand imputation credit percentage
32
For
per
sona
l use
onl
y

Notes to the condensed consolidated financial report - continuedfor the half-year ended 31 December 2015
Other disclosures
D1. Property, plant and equipment D4. Acquisition and disposal of businessesD2. Intangible assets D5. Contingent liabilitiesD3. Joint arrangements and associate entities
D1. Property, plant and equipment
Freehold Land and Buildings
Plant and Equipment
Equipment under
Finance Lease Total
Carrying amount as at 1 July 2015 59.1 895.1 82.9 1,037.1 Additions 13.9 94.9 2.3 111.1 Disposals at net book value - (9.8) (0.1) (9.9)Acquisition of businesses - 1.7 - 1.7 Disposals of business at net book value - (0.6) - (0.6)Depreciation expense (2.4) (107.9) (6.5) (116.8)Reclassifications at net book value - 5.2 (5.2) - Reclassified as intangible assets (i) - (1.1) - (1.1)
0.4 4.7 (0.2) 4.9 Closing net book value as at 31 December 2015 71.0 882.2 73.2 1,026.4 Cost 95.7 2,099.3 132.2 2,327.2 Accumulated depreciation (24.7) (1,217.1) (59.0) (1,300.8)
Carrying amount as at 1 July 2014 53.0 1,010.4 83.5 1,146.9 Additions 13.5 163.1 8.2 184.8 Disposals at net book value (2.4) (72.2) (0.7) (75.3)Acquisition of businesses 0.2 18.7 0.4 19.3 Depreciation expense (5.5) (213.9) (9.2) (228.6)Reclassifications at net book value 0.7 (1.1) 0.4 - Reclassified as intangible assets (i) - (3.0) - (3.0)
(0.4) (6.9) 0.3 (7.0)Closing net book value as at 30 June 2015 59.1 895.1 82.9 1,037.1 Cost 80.9 2,060.9 138.3 2,280.1 Accumulated depreciation (21.8) (1,165.8) (55.4) (1,243.0)
Net foreign currency exchange differences at net book value
(i) Refers to the reclassification of software from Capital Work In Progress to Intangible Assets.
Net foreign currency exchange differences at net book value
D
Dec 2015$'m
Jun 2015
33
For
per
sona
l use
onl
y

Notes to the condensed consolidated financial report - continuedfor the half-year ended 31 December 2015
D2. Intangible assets
Goodwill
Customer contracts andrelationships
Intellectual property,
software and system
development Total
Carrying amount as at 1 July 2015 781.7 43.5 93.8 919.0 Purchases - - 28.7 28.7 Acquisition of business 20.5 - - 20.5 Reclassifications at net book value (i) - - 1.1 1.1 Amortisation expense - (3.2) (8.0) (11.2)
2.3 - 1.0 3.3 Closing net book value as at 31 December 2015 804.5 40.3 116.6 961.4 Cost 880.5 50.1 235.4 1,166.0 Accumulated amortisation and impairment (76.0) (9.8) (118.8) (204.6)
Carrying amount as at 1 July 2014 521.6 - 67.9 589.5 Purchases - - 32.2 32.2 Acquisition of business 261.9 50.1 9.2 321.2 Reclassifications at net book value (i) - - 3.0 3.0 Amortisation expense - (6.6) (17.9) (24.5)
(1.8) - (0.6) (2.4)Closing net book value as at 30 June 2015 781.7 43.5 93.8 919.0 Cost 857.7 50.1 200.4 1,108.2 Accumulated amortisation and impairment (76.0) (6.6) (106.6) (189.2)
Net foreign currency exchange differences at net book value
(i) Refers to the reclassification of software from Capital Work In Progress to Intangible Assets.
Net foreign currency exchange differences at net book value
Dec 2015$'m
Jun 2015
34
For
per
sona
l use
onl
y

Notes to the condensed consolidated financial report - continuedfor the half-year ended 31 December 2015
D3. Joint arrangements and associate entities
Name of arrangementCountry of operation
31 Dec 2015 %
31 Dec 2014 %
Allied Asphalt Limited New Zealand 50 50 Australia 50 50
Australia 50 50 Australia 50 50
New Zealand 50 50 New Zealand - 33
Isaac Asphalt Limited New Zealand 50 50
Australia 44 44
Stockton Alliance Limited (ii) New Zealand - 50
AssociatesAustralia 27 27
Australia 49 49
Australia 49 49
(i)
(ii)
(iii)
Joint ventures and associates have a statutory reporting date of 30 June.
Joint ventures
There are no material commitments held by joint ventures or associates.
Bitumen Importers Australia Joint VentureBitumen Importers Australia Pty LtdEDI Rail-Bombardier Transportation Pty LtdEmulco LimitedGreen Vision Recycling Limited(i)
RTL Mining and Earthworks Pty Ltd
MHPS Plant Services Pty Ltd
Reliance Rail Pty Ltd (iii)
Downer previously wrote down its investment in Reliance Rail Pty Ltd to nil. The New South Wales Government has the right inFebruary 2018 to acquire Downer's ownership of Reliance Rail Pty Ltd for nil consideration. As a consequence, Downer doesnot include Reliance Rail Pty Ltd in its equity accounted disclosure.
Keolis Downer Pty Ltd
Construction of bitumen storage facilityBitumen importerSale and maintenance of railway rolling stockEmulsion plantRecycling
Manufacture and supply of asphaltContract mining; civil works and plant hire
Downer acquired the remaining ownership interest on 18 December 2015 (refer to Note D4).50% interest was disposed on 31 March 2015 following completion of contract.
Mine operations
Refurbishment, construction and maintenance of boilers
Rail manufacturing and maintenance
Principal activity
Operation and maintenance of Gold Coast light rail, Melbourne tram network and bus operation
Ownership interest
The Group has interests in the following joint ventures and associates which are equity accounted:
Asphalt plant
35
For
per
sona
l use
onl
y

Notes to the condensed consolidated financial report - continuedfor the half-year ended 31 December 2015
D4. Acquisition and disposal of businesses
AcquisitionsDec 2015
Dec 2014
(a) Identifiable assets acquired and liabilities assumed
$'m Note Fair values
Cash and cash equivalents 29.3 Trade and other receivables 79.0 Inventories 8.7 Other current assets 1.1 Property, plant and equipment 16.1 Intangible assets - software 8.8 Intangible assets - customer contracts and relationships 50.1 Net tax liabilities (7.8)Trade and other payables (81.4)Provisions (43.0)Borrowings (0.4)Total identifiable net assets acquired D4(b) 60.5
(b) Goodwill
Note $'m
Gross purchase consideration 333.0 Fair value of identifiable net assets acquired D4(a) (60.5)Goodwill arising from acquisition 272.5
The following table summarises the recognised amounts of assets acquired and liabilities assumed at acquisitiondate:
Goodwill arising from Tenix's acquisition has been recognised as follows:
On 31 October 2014, the Group acquired 100% of Tenix Holdings Australia Pty Ltd and its subsidiaries (Tenix) for agross consideration of $333 million. The principal activity of Tenix is to provide design to maintenance services in thewater, power and gas industries.
On 18 December 2015, the Group acquired 100% of Green Vision Recycling Limited for $0.9 million. Green Vision isa New Zealand company specialised in recycling horizontal infrastructure (roads, footpath, kerbs and soil).
(c) Purchase consideration - cash outflow
The goodwill represents expected revenue growth opportunities, the skills and technical talent of Tenix's workforceand expected synergies. These benefits are not recognised separately from goodwill because they do not meet therecognition criteria for identifiable intangible assets. None of the goodwill arising on the acquisition is expected to bedeductible for tax purposes.
There has been no changes to the outflow of cash on Tenix acquisition since last reported in the 2015 Annual Report.
The final accounting and tax values for the acquisition of Tenix have been determined at the end of the measurementperiod. $19.1 million of additional goodwill recognised since 30 June 2015 is primarily from the recognition of anadditional deferred tax liability on the finalisation of acquisition accounting.
There have been no changes to the valuation techniques used for measuring the fair value of material assetsacquired since last reported in the 2015 Annual Report.
36
For
per
sona
l use
onl
y

Notes to the condensed consolidated financial report - continuedfor the half-year ended 31 December 2015
D4. Acquisition and disposal of businesses - continued
Disposals
The Group did not dispose any business during the period ended 31 December 2014.
D5. Contingent liabilitiesDec Jun
2015 2015$'m $'m
Bonding
792.7 808.4
Other contingent liabilities
i)
ii)
iii)
iv)
v)
The Group is subject to product liability claims. Provision is made for the potential costs of carrying outrectification works based on known claims and previous claims history. However, as the ultimate outcome ofthese claims cannot be reliably determined at the date of this report, contingent liability may exist for any amountsthat ultimately becomes payable in excess of current provisioning levels.
The Group is subject to design liability in relation to completed design and construction projects. The Directorsare of the opinion that there is adequate insurance to cover this area and accordingly, no amounts are recognisedin the financial statements.
Controlled entities have entered into various joint arrangements under which the controlled entity is jointly andseverally liable for the obligations of the relevant joint arrangements.
The Group carries the normal contractor’s and consultant’s liability in relation to services, supply and constructioncontracts (for example, liability relating to professional advice, design, completion, workmanship, and damage),as well as liability for personal injury/property damage during the course of a project. Potential liability may arisefrom claims, disputes and/or litigation/arbitration by or against Group companies and/or joint venturearrangements in which the Group has an interest. The Group is currently managing a number of claims,arbitration and litigation processes in relation to services, supply and construction contracts as well as in relationto personal injury and property damage claims arising from project delivery.
Several New Zealand entities in the Group have been named as co-defendants in seven “leaky building” claims.The leaky building claims where Group entities are co-defendants generally relate to water damage arisen fromhistorical design and construction methodologies (and certification) for residential and other buildings in NewZealand during the early-mid 2000s. The Directors are of the opinion that disclosure of any further informationrelating to the leaky building claims would be prejudicial to the interests of the Group.
Dec 2015
Dec 2014
On 31 August 2015, the Group sold the Rimtec business to Rimex Wheel Pty Ltd for a total consideration of $7.2million. The Group has incurred $2.3 million loss as a result of this transaction.
The Group has bid bonds and performance bonds issued in respectof contract performance in the normal course of business for wholly-owned controlled entities
The Group is called upon to give guarantees and indemnities to counterparties, relating to the performance ofcontractual and financial obligations (including for controlled entities and related parties). Other than as noted above,these guarantees and indemnities are indeterminable in amount.
37
For
per
sona
l use
onl
y

Notes to the condensed consolidated financial report - continuedfor the half-year ended 31 December 2015
D5. Contingent Liabilities - continued
vi)
vii)
viii)
ix)
x)
Ground subsidence at the Waratah Train Maintenance Centre located on Manchester Road, Auburn (‘AMC’) hasbeen identified. The design and construction of the AMC formed part of the Waratah Train Project, with RelianceRail contracting Downer to design and build the AMC. In turn, Downer subcontracted this work to John HollandPty Ltd. The design and construction of the areas in which subsidence has been observed formed part of thesubcontractor’s design and construct obligations. Investigations into the causes of the subsidence, the cost ofremediation and operational impacts are ongoing. While it is too early to reliably estimate the total cost of theremediation, in the opinion of the Directors, there is no material exposure to either Downer EDI Rail Pty Limited orDowner EDI PPP Maintenance Pty Limited arising from the subsidence, based on the fact that there are a rangeof recovery options being pursued.
The Group is defending a claim brought by Port Waratah Coal Services Limited and a cross claim by anotherdefendant, Menard Bachy Pty Ltd in respect of alleged non-conforming excavation and civil work performed atKooragang Island Coal Terminal by Downer and its joint venture partner, Daracon Contractors Pty Ltd. The valueof the claim against Downer and Daracon is $39 million with a hearing commencing in March 2016. The Directors are of the opinion that disclosure of any further information relating to this matter would be prejudicial to theinterests of the Group.
Under the terms of the agreement reached between the New South Wales Government and Reliance Rail, theGroup has a contingent commitment to pay Reliance Rail $12.5 million in 2018 should it be required to refinanceReliance Rail's senior debt.
On 27 February 2014, the Group announced that the IMF (Australia) Ltd (IMF) funded shareholder class actionhad been settled (‘First Class Action’). Slater & Gordon has also advised that it reserves its position in relation to a second claim arising out of thesecond impairment to the Waratah Train Project announced on 27 January 2011, although no basis for thisposition has been provided. On 27 March 2014, Downer was served with a second class action claim alleging breaches of Downer’scontinuous disclosure obligations in connection with the Group’s $190 million impairment to the Waratah TrainProject announced on 1 June 2010 i.e. based on the same events as the First Class Action (“Second ClassAction”). The Second Class Action has been commenced in the Victorian Supreme Court with a hearing commencing inFebruary 2016. The Directors are of the opinion that disclosure of any further information relating to this matterwould be prejudicial to the interests of the Group.
On 16 September 2015, the Group announced that it had terminated a contract with Tecnicas Reunidas S.A.(“TR”) following TR’s failure to remedy a substantial breach of the contract and that the Group would be pursuinga claim against TR in the order of $65 million. Downer has since demobilised from the site and is in the process ofcommencing a claim that will be determined via an arbitration process expected to take place in calendar year2017. TR has indicated that it will initiate a counter-claim as part of that process although no basis for thisposition has been provided. The Directors are of the opinion that disclosure of any further information relating tothis matter would be prejudicial to the interests of the Group.
38
For
per
sona
l use
onl
y

Directors' Declarationfor the half-year ended 31 December 2015
In the opinion of the Directors' of Downer EDI Limited:
(a)
(i)
(ii)
(b)
On behalf of the Directors
R M HardingChairman
Sydney, 4 February 2016
the condensed consolidated half-year Financial Report and notes set out on pages 20 to 38, are inaccordance with the Corporations Act 2001 including:
there are reasonable grounds to believe that the Company will be able to pay its debts as and when theybecome due and payable.
Signed in accordance with a resolution of the Directors:
giving a true and fair view of the Group's financial position as at 31 December 2015 and of itsperformance for the six month period ended on that date; andcomplying with Australian Accounting Standard AASB134 Interim Financial Reporting and the Corporations Regulations 2001; and
39
For
per
sona
l use
onl
y
Media/ ASX and NZX Release 4 February 2016
DOWNER REPORTS NET PROFIT AFTER TAX OF $72.1 MILLION
Downer EDI Limited (Downer) today announced net profit after tax (NPAT) of $72.1 million for the six months to 31 December 2015, 23.9% lower than the prior corresponding period.
The result reflects the write off of $13 million in pre-tax bid costs and softness in the Group’s resources related businesses, particularly Engineering, Construction & Maintenance (EC&M) and Rail.
Total revenue of $3.5 billion was down $42.6 million, or 1.2%. Earnings before interest and tax (EBIT) was down $28.5 million, or 20.1%, to $113.2 million.
Operating cash flow was $178.1 million for the six month period.
At 31 December 2015, Downer’s gearing was 8.4% with available liquidity of $1.0 billion.
Downer’s work-in-hand was $18.0 billion at 31 December 2015, down from $18.5 billion at 30 June 2015.
The Chief Executive Officer of Downer, Grant Fenn, said competition remained intense and the Mining and Energy markets continue to be very challenging.
“Commodity prices remain very low with a significant flow on effect on business investment and operating expenditure,” Mr Fenn said. “Our customers are understandably very focused on costs and we continue to work closely with them.
“Our performance in the first six months of the 2016 financial year is very credible in light of the market conditions and reflects the strength of our market positions and the diversity of our operations.”
Performance Summary
Transport Services
Transport Services includes the Group’s road, rail infrastructure, bridge, airport and marine port businesses.
Revenue was down 12.3% to $802.9 million and EBIT was down 9.7% to $31.6 million.
The New Zealand, New South Wales (NSW) and Victorian businesses continued to perform well.
The result was impacted by reduced Government expenditure and inclement weather in NSW and Western Australia (WA) and the rail infrastructure contribution was down significantly as projects completed in the prior corresponding period were not replaced.
Downer EDI Limited ABN 97 003 872 848
Triniti Business Campus 39 Delhi Road
North Ryde NSW 2113
1800 DOWNER www.downergroup.com
Page 1 of 4
For
per
sona
l use
onl
y
Technology and Communications Services
Technology and Communications Services comprises the Group’s fibre, copper and radio network infrastructure businesses.
Revenue increased 2.0% to $249.9 million and EBIT increased 54.9% to $14.1million.
The result benefited from continued strong performance on the nbnTM contracts in Australia and favourable performance on contracts in New Zealand. There was lower revenue from the Chorus contract in New Zealand as the rollout of the Ultra-Fast Broadband fibre network completes.
Utilities Services
Utilities Services comprises the Group’s power, gas and water network infrastructure and renewable energy businesses.
Revenue increased 83.7% to $376.5 million and EBIT increased 135.1% to $22.8 million due to a strong performance from power and gas projects, ramped up activity at the Ararat wind farm project in Victoria and an additional four months of contribution from Tenix.
Engineering, Construction and Maintenance (EC&M)
EC&M comprises the Group’s plant construction and maintenance services, including Electrical and Instrumentation (E&I), Structural, Mechanical and Piping (SMP) and industrial and infrastructure maintenance, as well as the Group’s resources based consultancies.
Revenue decreased 4.4% to $927.8 million and EBIT fell 26.4% to $20.6 million as a result of lower activity in Queensland, partially offset by increased activity in WA and New Zealand, and $5.7 million of restructuring costs.
Mining
The Mining division provides a broad range of services through each stage of the mining lifecycle including open cut and underground mining, mine planning and design, blasting, crushing, tyre management and mine rehabilitation.
Revenue declined 5.2% to $781.6 million due to reduced volumes and contract completions.
EBIT, however, increased 13.0% to $67.7 million due to continued strong performance on ongoing contracts and net favourable one off benefits of $15 million.
Rail
The Rail division provides total rail asset solutions including freight and passenger build, operations and maintenance, component overhauls and After Market Services (AMS).
Total revenue decreased by 1.0% to $420.1 million, comprising an $86.1 million or 28.9% reduction in core Rail revenue reflecting the completion of manufacturing contracts, lower freight maintenance expenditure and lower AMS sales, largely offset by an $81.8 million or 64.5% increase in joint venture revenue.
Page 2 of 4
For
per
sona
l use
onl
y

EBIT decreased by $13.0 million to $4.5 million driven by restructuring costs, a $4.0 million provision release in the prior corresponding period relating to the Waratah Train Project and lower relative performance from joint venture operations.
Downer and its partner Changchun Railway Company (CRC) are one of four consortia short-listed by Transport for NSW to supply and maintain a new inter-city fleet of approximately 520 passenger carriages. The contract is expected to be awarded in mid-2016.
Downer and CRC are also one of three consortia short-listed for the Victorian Government’s tender for 37 next generation, high capacity trains. This contract is expected to be awarded in late 2016.
Downer’s share of pre-tax bid costs is estimated at around $9 million each and will be expensed in the event the relevant bid is unsuccessful.
Zero Harm
A Downer employee died in November 2015 while working at the Alcoa Kwinana Refinery in Western Australia. At Downer, the health and safety of our people is paramount and an investigation into this tragic event is continuing.
Downer’s Total Recordable Injury Frequency Rate reduced from 4.17 to 3.67 per million hours worked while the Lost Time Injury Frequency Rate of 0.84 remained below one incident per million hours worked.
Capital Management
Operating cash flow of $178.1 million represents a cash conversion of 64% of earnings before interest, tax, depreciation and amortisation (EBITDA). This performance was lower than recent reporting periods primarily due to $65 million of unresolved claims relating to the terminated contract with Tecnicas Reunidas S.A in relation to a Technical Ammonium Nitrate Plant located on Burrup Peninsula in Western Australia (announced on 16 September, 2015). Adjusting for these claims, cash conversion would have been 91%.
Total capital expenditure was $100.0 million, including replacement of Mining fleet components and the acquisition of an asphalt plant in Rosehill, Sydney.
Downer acquired 1.8 million shares at a cost of $6.4 million during the period under the company’s ongoing on-market share buy-back program.
Downer has a strong balance sheet, with gearing of 8.4% at 31 December 2015 (13.8% including off balance sheet debt) and available liquidity of $1.0 billion comprising cash of $489.5 million and undrawn committed facilities of $528.0 million.
Dividend
The Downer Board resolved to pay a fully franked interim dividend of 12.0 cents per share (12.0 cents per share in the prior corresponding period), payable on 17 March 2016 to shareholders on the register at 18 February 2016. The company’s Dividend Reinvestment Plan (DRP) remains suspended and will not operate for this dividend.
Page 3 of 4
For
per
sona
l use
onl
y

Outlook
Downer stated at its full year results in August 2015 that it was targeting NPAT of around $190 million for the 2016 financial year.
As announced on 1 February 2016, the ACTivate consortium was not successful in its bid for Capital Metro and, as a result, Downer has written off $13 million in pre-tax bid costs in the 2016 first half result.
Downer is now targeting NPAT of around $180 million for the 2016 financial year.
For further information please contact:
Michael Sharp, Group Head of Corporate Affairs and Investor Relations +61 439 470145
Downer EDI Limited (Downer) is a leading provider of services to customers in markets including: Transport Services; Technology and Communications Services; Utilities Services; Engineering, Construction and Maintenance (EC&M); Mining; and Rail. Downer employs about 20,000 people, mostly in Australia and New Zealand but also in the Asia-Pacific region, South America and Southern Africa.
Page 4 of 4
For
per
sona
l use
onl
y

For
per
sona
l use
onl
y

OVERVIEW
Total revenue1 $3,543.4 million, down 1.2%
Work in hand2 $18.0 billion, down from $18.5 billion at 30 June 2015
1 Total revenue is a non-statutory disclosure and includes revenue from joint ventures and other alliances and other income.
2 Work-in-hand numbers are unaudited
3 Adjusted for the mark-to-market of derivatives and deferred finance charges.
4 Gearing = Net debt / net debt + equity. Gearing including off-balance sheet debt based on present value of plant and equipment operating leases discounted at 10% pa: $140.8m (June 2015: $151.1m)
5 Lost Time Injury Frequency Rate - the number of lost time injuries (LTIs) per million hours worked
6 Total Recordable Injury Frequency Rate – the number of LTIs and medically treated injuries per million hours worked
2
Net Profit After Tax (NPAT) $72.1 million, down 23.9%
Earnings Before Interest and Tax (EBIT) $113.2 million, down 20.1% (including $13 million pre-tax write off of Capital Metro bid costs)
Operating cash flow $178.1 million, investing cash flow $123.5 million
Net debt3 $188.4 million, $9.4 million increase from 30 June 2015
Interim dividend declared: 12 cps, 100% franked, no DRP
▪ LTIFR5 of 0.84, down from 0.93 ▪ TRIFR6 of 3.67, down from 4.17
Return on Funds Employed (ROFE) 12.5%, down from 15.0%
Gearing4 8.4% (13.8% including off-balance sheet debt)
For
per
sona
l use
onl
y

TRANSPORT SERVICES
Total revenue1 $m EBIT margin EBIT $m ROFE2
OPPORTUNITIES
3
▪ New Zealand, New South Wales (NSW) and Victoria continued to perform well
▪ However, the rail infrastructure result contribution was down significantly due to projects completed in the prior corresponding period not being replaced
▪ In addition, there was reduced Government expenditure and inclement weather, particularly in NSW and Western Australia (WA)
1 Total revenue includes joint ventures and other income.
2 ROFE = EBIT divided by average funds employed (AFE). AFE = Average Opening and Closing Net Debt + Equity.
802.9 915.3
0100200300400500600700800900
1000
HY16 HY15
31.6 35.0
0
5
10
15
20
25
30
35
40
HY16 HY15
3.9% 3.8%
0%
1%
2%
3%
4%
5%
HY16 HY15
16.1%
18.9%
0%2%4%6%8%
10%12%14%16%18%20%
HY16 HY15
For
per
sona
l use
onl
y

▪ Strong delivery on nbnTM contracts in Australia
▪ Good performance on contracts in New Zealand
▪ Lower revenue from Chorus contract in New Zealand as the roll-out of the Ultra-Fast Broadband fibre network comes to completion and the Next Generation Access (NGA) contracts ramp up
TECHNOLOGY AND COMMUNICATIONS SERVICES
4
1 Total revenue includes joint ventures and other income.
2 ROFE = EBIT divided by average funds employed (AFE). AFE = Average Opening and Closing Net Debt + Equity.
Total revenue1 $m EBIT margin EBIT $m ROFE2
249.9 245.1
0
50
100
150
200
250
300
HY16 HY15
14.1
9.1
0
2
4
6
8
10
12
14
16
HY16 HY15
5.6%
3.7%
0%
1%
2%
3%
4%
5%
6%
HY16 HY15
58.9%
18.9%
0%
10%
20%
30%
40%
50%
60%
70%
HY16 HY15
For
per
sona
l use
onl
y

▪ Current period includes an additional four months of contribution from Tenix
▪ Tenix integration completed, successfully enhancing the Group’s capabilities
▪ Power and gas projects performed strongly
▪ Ramp up of activity at Ararat wind farm project in Victoria
UTILITIES SERVICES
5
1 Total revenue includes joint ventures and other income.
2 ROFE = EBIT divided by average funds employed (AFE). AFE = Average Opening and Closing Net Debt + Equity.
Total revenue1 $m EBIT margin EBIT $m ROFE2
376.5
205.0
0
50
100
150
200
250
300
350
400
HY16 HY15
22.8
9.7
0
5
10
15
20
25
HY16 HY15
6.1%
4.7%
0%
1%
2%
3%
4%
5%
6%
7%
HY16 HY15
13.2% 14.6%
0%
2%
4%
6%
8%
10%
12%
14%
16%
HY16 HY15
For
per
sona
l use
onl
y

▪ Continued decline in Metals and Minerals related capital expenditure
▪ Lower activity in Queensland offset by increased activity on Oil and Gas projects in WA (Gorgon and Wheatstone) and also projects in New Zealand
▪ $5.7million in restructuring costs to realign the business to the revenue environment
▪ Resources related consultancies (QCC and Mineral Technologies) lost $4.7million in the period
ENGINEERING, CONSTRUCTION & MAINTENANCE
6
1 Total revenue includes joint ventures and other income.
2 ROFE = EBIT divided by average funds employed (AFE). AFE = Average Opening and Closing Net Debt + Equity.
Total revenue1 $m EBIT margin EBIT $m ROFE2
20.6
28.0
0
5
10
15
20
25
30
HY16 HY15
2.2%
2.9%
0%
1%
2%
3%
4%
5%
HY16 HY15
21.2% 20.4%
0%
5%
10%
15%
20%
25%
HY16 HY15
927.8 971.0
0
200
400
600
800
1000
1200
HY16 HY15
For
per
sona
l use
onl
y
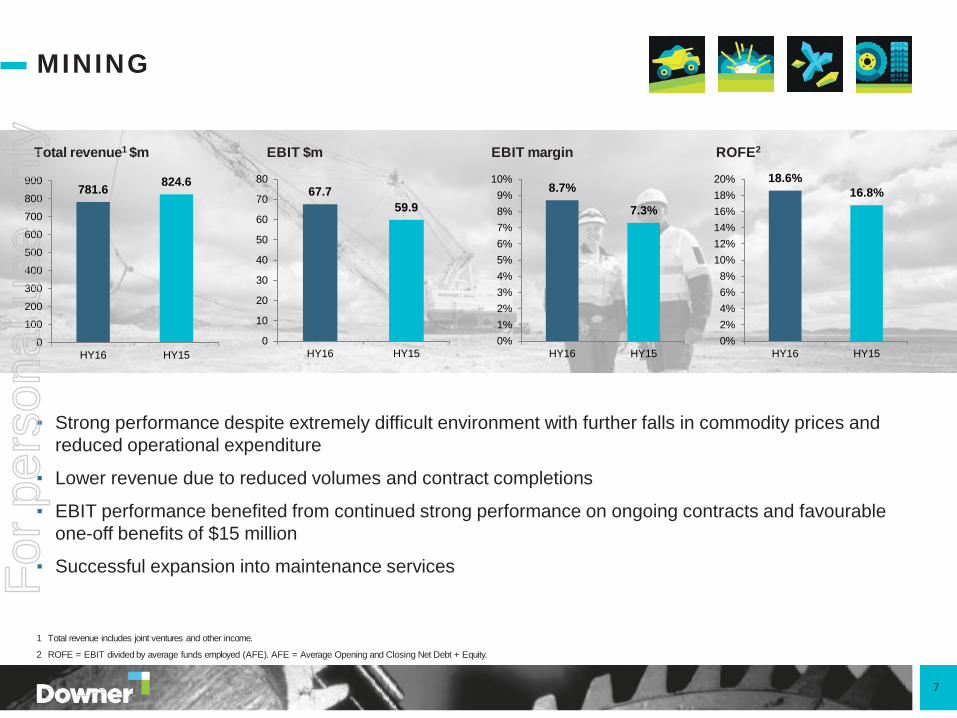
▪ Strong performance despite extremely difficult environment with further falls in commodity prices and reduced operational expenditure
▪ Lower revenue due to reduced volumes and contract completions
▪ EBIT performance benefited from continued strong performance on ongoing contracts and favourable one-off benefits of $15 million
▪ Successful expansion into maintenance services
MINING
1 Total revenue includes joint ventures and other income.
2 ROFE = EBIT divided by average funds employed (AFE). AFE = Average Opening and Closing Net Debt + Equity.
7
Total revenue1 $m EBIT margin EBIT $m ROFE2
781.6 824.6
0
100
200
300
400
500
600
700
800
900
HY16 HY15
67.7 59.9
0
10
20
30
40
50
60
70
80
HY16 HY15
8.7%
7.3%
0%1%2%3%4%5%6%7%8%9%
10%
HY16 HY15
18.6% 16.8%
0%2%4%6%8%
10%12%14%16%18%20%
HY16 HY15
For
per
sona
l use
onl
y

RAIL
▪ Lower core Rail revenue reflects the completion of manufacturing contracts, lower freight maintenance expenditure and lower After Market Services sales, largely offset by increased joint venture revenue
▪ Lower EBIT driven by restructuring costs, provision release in the pcp relating to the Waratah Train Project (WTP) and lower relative performance from joint ventures
▪ WTP Through Life Support contract performing very well
1 Total revenue includes joint ventures and other income.
2 ROFE = EBIT divided by average funds employed (AFE). AFE = Average Opening and Closing Net Debt + Equity.
8
Total revenue1 $m EBIT margin EBIT $m ROFE2
420.1 424.4
0
50
100
150
200
250
300
350
400
450
HY16 HY15
4.5
17.5
02468
101214161820
HY16 HY15
1.1%
4.1%
0%
1%
2%
3%
4%
5%
HY16 HY15
3.6%
8.4%
0%
1%
2%
3%
4%
5%
6%
7%
8%
9%
HY16 HY15
For
per
sona
l use
onl
y
For
per
sona
l use
onl
y

FINANCIAL PERFORMANCE
1 Total revenue includes joint ventures and other income.
2 ROFE = EBIT divided by average funds employed (AFE); AFE = Average Opening and Closing Net Debt + Equity.
10
$m HY16 HY15 Change (%)
Total revenue1 3,543.4 3,586.0 (1.2)
EBITDA 241.2 263.7 (8.5)
EBIT 113.2 141.7 (20.1)
Net interest expense (15.8) (13.8) (14.5)
Tax expense (25.3) (33.2) 23.8
Net profit after tax 72.1 94.7 (23.9)
EBIT margin 3.2% 4.0%
Effective tax rate 26.0% 26.0%
ROFE2 12.5% 15.0% Dividend declared (cents per share) 12.0 12.0
For
per
sona
l use
onl
y

$m Total Transport Tech & Comm Utilities EC&M Mining Rail Corp
Statutory EBIT 113.2 31.6 14.1 22.8 20.6 67.7 4.5 (48.1) Capital Metro bid costs 13.0 - - - - - - 13.0
Restructuring costs 13.7 - - - 5.7 - 5.7 2.3
Former employee entitlements 10.8 - - - - 10.8 - -
Loss on sale of Rimtec 2.3 - - - - 2.3 - -
Contingency release on renegotiated and completed contracts
(28.7) - - - - (28.7) - -
Adjusted EBIT (approx) 124.3 31.6 14.1 22.8 26.3 52.1 10.2 (32.8)
SUMMARY OF EARNINGS
11
For
per
sona
l use
onl
y

OPERATING CASH FLOW
1 Interest and other costs of finance paid minus interest received.
2 Unaudited.
12
$m HY16 HY15
EBIT 113.2 141.7
Add: depreciation & amortisation 128.0 122.0
EBITDA 241.2 263.7
Operating cash flow 178.1 257.9
Add: Net interest paid1 11.2 12.0
Tax (received) / paid (34.2) 21.9
Waratah Train Project net cash (inflow)2 – (18.9)
Adjusted operating cash flow 155.1 272.9
EBITDA conversion 64.3% 103.5%
Add back project claims 65.0
Underlying operating cash flow 220.1
Normalised EBITDA conversion 91.3% For
per
sona
l use
onl
y

CASH FLOW
1 As at 31 December 2015, Downer had bought back 1.8 million shares, reducing the total number of shares outstanding to 430.9 million.
2 Refer to slide 21 for details.
13
$m HY16 HY15
Total operating 178.1 257.9
Net capital expenditure (100.0) (78.6)
Tenix and VEC acquisitions – (318.5)
IT Transformation and Other (23.5) (7.0)
Total investing (123.5) (404.1)
On-market share buy-back1 (6.4) (11.7)
Net proceeds of borrowings 124.1 159.7
Dividends paid (56.7) (57.5)
Total financing 61.0 90.5
Net increase/(decrease) in cash held 115.6 (55.7)
Cash at 31 December 489.5 378.0
Total liquidity2 1,017.5 990.0 For
per
sona
l use
onl
y

DEBT MATURITY PROFILE
14
Weighted average duration 4.36 years
Well diversified funding sources
0
100
200
300
400
500
Jun-
16
Dec
-16
Jun-
17
Dec
-17
Jun-
18
Dec
-18
Jun-
19
Dec
-19
Jun-
20
Dec
-20
Jun-
21
Dec
-21
Jun-
22
Dec
-22
Jun-
23
Dec
-23
Jun-
24
Dec
-24
Jun-
25
Dec
-25
A$m
Equ
ival
ent
Finance leases
ECA finance
Bilateral bank facilities
A$MTN
Syndicated bank facility
USPP (USD and AUD Notes)
For
per
sona
l use
onl
y

BALANCE SHEET AND CAPITAL MANAGEMENT
1 Adjusted for the mark-to-market of derivatives and deferred finance charges.
2 Includes the present value of plant and equipment operating leases discounted at 10% pa: $140.8m (2015: $151.1m).
3 Adjusted Net Debt includes Net Debt plus 6x operating lease expenses in the year. Adjusted EBITDAR equals underlying earnings before interest, tax, depreciation, amortisation and operating lease expense (on a rolling 12 month basis).
15
$m Dec15 Jun15
Total assets 4,090.6 4,004.4
Total shareholders’ equity 2,056.5 2,035.3
Net debt1 188.4 179.0
Gearing: net debt to net debt plus equity 8.4% 8.1%
Gearing (including off balance sheet debt)2 13.8% 14.0%
Debtor days 21.7 25.7
WIP days 31.8 31.0
Creditor days 33.2 35.2
Interest cover 9.2 10.4
Net Debt / EBITDA 0.3 0.3
Adjusted Net Debt / adjusted EBITDAR3 1.8 1.9 For
per
sona
l use
onl
y

For
per
sona
l use
onl
y

36%
31%
24%
3% 6%
Fixed Price / Lump Sum
Schedule of Rates
Recurring
Target Cost / Alliance
Cost Plus
24%
25%
13%
12%
16%
10%
Rail
Transport Services
Mining
EC&M Services
Utilities Services
Techology CommunicationsServices
WORK-IN-HAND: $18 BILLION
By Contract Type – December 2015
17
By Service Line – December 2015
$4.4b
$4.5b
$2.4b
$2.0b
$2.9b
$1.8b
$6.5b
$5.6b
$4.2b
$0.5b
$1.2b For
per
sona
l use
onl
y

OUTLOOK
Downer stated at its full year results in August 2015 that it was targeting NPAT of around $190 million for the 2016 financial year. As announced on 1 February 2016, the ACTivate consortium was not successful in its bid for Capital Metro and, as a result, Downer has written off $13 million in pre-tax bid costs in the 2016 first half result. Downer is now targeting NPAT of around $180 million for the 2016 financial year.
18
For
per
sona
l use
onl
y

For
per
sona
l use
onl
y

SEGMENT REPORTING
20
December 2015
Dec-15 $m
Transport Services
Technology and Communications
Services
Utilities Services EC&M Mining Rail Unallocated Total
Segment revenue 771.8 249.9 376.5 912.1 758.2 211.5 (15.4) 3,264.6
Share of sales from JVs and Associates1 31.1 - - 15.7 23.4 208.6 - 278.8
Total revenue1 802.9 249.9 376.5 927.8 781.6 420.1 (15.4) 3,543.4
EBIT 31.6 14.1 22.8 20.6 67.7 4.5 (48.1) 113.2
EBIT margin 3.9% 5.6% 6.1% 2.2% 8.7% 1.1% - 3.2%
December 2014
Dec-14 $m
Transport Services
Technology and Communications
Services
Utilities Services
EC&M Mining Rail Unallocated Total
Segment revenue 886.3 245.1 205.0 951.4 791.8 297.6 0.6 3,377.8
Share of sales from JVs and Associates1 29.0 - - 19.6 32.8 126.8 - 208.2
Total revenue1 915.3 245.1 205.0 971.0 824.6 424.4 0.6 3,586.0
EBIT 35.0 9.1 9.7 28.0 59.9 17.5 (17.5) 141.7
EBIT margin 3.8% 3.7% 4.7% 2.9% 7.3% 4.1% - 4.0%
1 This is a non-statutory disclosure as it relates to/includes Downer’s share of revenue from equity accounted joint ventures and associates
For
per
sona
l use
onl
y

DEBT AND BONDING FACILITIES
1 1 Including A$ Medium Term Notes sold to Asian and European domiciled investors measured at financial close of the transaction.
21
Debt facilities $m
Total facilities 1,205.7
Drawn (677.7)
Available facilities 528.0
Cash 489.5
Total liquidity 1,017.5
Bonding facilities $m
Total facilities 1,367.6
Drawn (792.7)
Available facilities 574.9
Debt facilities by type %
Syndicated bank facility 33
A$MTN 33
USPP 14
Bilateral bank facilities 11
ECA finance 6
Finance leases & other 3
100
Debt facilities by geography %
Australia / NZ 49
North America 23
Asia1 22
Europe1 5
100 For
per
sona
l use
onl
y

UNALLOCATED COSTS (CORPORATE COSTS)
HY16 HY15
Settlement of contractual claims
- 10.5
R&D incentives 5.0 10.2
Capital Metro pre-tax bid costs
(13.0) -
Corporate costs (40.1) (38.2)
Total unallocated (48.1) (17.5)
For
per
sona
l use
onl
y

DISCLAIMER
23
RELIANCE ON THIRD PARTY INFORMATION This Presentation may contain information that has been derived from publicly available sources that have not been independently verified. No representation or warranty is made as to the accuracy, completeness or reliability of the information. No responsibility, warranty or liability is accepted by the Company, its officers, employees, agents or contractors for any errors, misstatements in or omissions from this Presentation PRESENTATION IS A SUMMARY ONLY This Presentation is information in a summary form only and does not purport to be complete. It should be read in conjunction with the condensed consolidated Financial Report for the half year ended 31 December 2015. Any information or opinions expressed in this Presentation are subject to change without notice and the Company is not under any obligation to update or keep current the information contained within this Presentation. NOT INVESTMENT ADVICE This Presentation is not intended and should not be considered to be the giving of investment advice by the Company or any of its shareholders, Directors, officers, agents, employees or advisers. The information provided in this Presentation has been prepared without taking into account the recipient’s investment objectives, financial circumstances or particular needs. Each party to whom this Presentation is made available must make its own .
independent assessment of the Company after making such investigations and taking such advice as may be deemed necessary. NO OFFER OF SECURITIES Nothing in this Presentation should be construed as either an offer to sell or a solicitation of an offer to buy or sell Company securities in any jurisdiction. FORWARD LOOKING STATEMENTS This Presentation may include forward-looking statements. Although the Company believes the expectations expressed in such forward-looking statements are based on reasonable assumptions, these statements are not guarantees or predictions of future performance, and involve both known and unknown risks, uncertainties and other factors, many of which are beyond the Company’s control. As a result, actual results or developments may differ materially from those expressed in the statements contained in this Presentation. Investors are cautioned that statements contained in this Presentation are not guarantees or projections of future performance and actual results or developments may differ materially from those projected in forward-looking statements. NO LIABILITY To the maximum extent permitted by law, neither the Company nor its related bodies corporate, Directors, employees or agents, nor any other person, accepts
any liability, including without limitation any liability arising from fault or negligence, for any direct, indirect or consequential loss arising from the use of this Presentation or its contents or otherwise arising in connection with it. DISCLOSEURE OF NON-IFRS FINANCIAL INFORMATION Throughout this presentation, there are occasions where financial information is presented not in accordance with accounting standards. There are a number of reasons why the Company has chosen to do this including: to maintain a consistency of disclosure across reporting periods; to demonstrate key financial indicators in a comparable way to how the market assesses the performance of the Company; to demonstrate the impact that significant one-off items have had on Company performance. Where Company earnings have been distorted by significant items, Management have used their discretion in highlighting these. These items are short-term in nature and considered to be outside the normal course of business. Unaudited numbers used throughout are labelled accordingly. ROUNDING Due to rounding, numbers presented throughout this document may not add up precisely to the totals provided.
For
per
sona
l use
onl
y

For
per
sona
l use
onl
y