for personal use only - asx2015/09/17 · the total distribution of income for the year ended 30...
TRANSCRIPT

CONTACT DETAILS REGISTRY
Level 16, 61 Lavender Street c/- Link Market Services Limited Ardent Leisure Trust Milsons Point NSW 2061 Level 12, 680 George Street ARSN 093 193 438 AUSTRALIA Sydney NSW 2000 Ardent Leisure Limited Telephone +61 2 9409 3670 Locked Bag A14 ABN 22 104 529 106 Investor Services 1800 ARDENT Sydney South NSW 1235 Ardent Leisure Management Limited Fax +61 2 9409 3670 Telephone 1300 720 560 ABN 36 079 630 676 www.ardentleisure.com.au [email protected] (AFS Licence No. 247010)
AMF Bowling | d’Albora Marinas | Dreamworld | Goodlife Health Clubs | Hypoxi
Kingpin Bowling | Main Event Entertainment | SkyPoint | SkyPoint Climb | WhiteWater World
ASX RELEASE 17 September 2015 The Manager Company Notices Section ASX Limited 20 Bridge Street SYDNEY NSW 2000 Dear Sir/Madam 2015 Annual Report, Corporate Governance Statement and Appendix 4G In accordance with Listing Rule 4.7, please find attached, for release to the market, the Ardent Leisure Group Annual Report 2015, the Corporate Governance Statement and Appendix 4G. Yours faithfully Alan Shedden Company Secretary
Ardent Leisure Group is a specialist operator of leisure and entertainment assets across Australia, New Zealand and the United
States. The Group owns and operates Dreamworld, WhiteWater World, SkyPoint, SkyPoint Climb, d’Albora Marinas, Hypoxi Body
Contouring, Goodlife health clubs, AMF and Kingpin bowling centres across Australia and New Zealand. The Group also operates
Main Event Entertainment, the fastest growing family entertainment chain in the United States. For further information on the
Group’s activities please visit our website at www.ardentleisure.com.au For
per
sona
l use
onl
y

Annual Financial Report for the year ended 30 June 2015
The financial report was authorised for issue by the Directors of Ardent Leisure Management Limited and Ardent Leisure Limited on 18 August 2015. The Directors have the power to amend and reissue the financial report.
For
per
sona
l use
onl
y

For
per
sona
l use
onl
y

Financial Report
Ardent Leisure Group | Annual Report 2015 1
Directors’ report to stapled security holders 2 Income Statements 36 Statements of Comprehensive Income 37 Balance Sheets 38 Statements of Changes in Equity 39 Statements of Cash Flows 40 Notes to the financial statements 41 1. Summary of significant accounting policies 41 Ardent Leisure Trust and Ardent Leisure Limited formation 56 Revenue from operating activities 56 Borrowing costs 56
5. Property expenses 56 Net gain/(loss) from derivative financial instruments 57 Management fees 57 Other expenses 58 Remuneration of auditor 58 Income tax expense 59 Earnings per security/share 60 Distributions and dividends paid and payable 62 Receivables 62 Derivative financial instruments 63 Inventories 64 Property held for sale 64 Other assets 65 Investment properties 65 Property, plant and equipment 66 Livestock 68 Intangible assets 68
22. Deferred tax assets 72 23. Payables 73 24. Interest bearing liabilities 73 25. Provisions 76 26. Other liabilities 77 27. Deferred tax liabilities 77 28. Contributed equity 78 29. Security-based payments 79
Reserves 86 Retained profits/(accumulated losses) 87 Business combinations 88 Cash and cash equivalents 91 Cash flow information 91 Net tangible assets 92 Related party disclosures 92 Segment information 94
38. Capital and financial risk management 99 39. Fair value measurement 107 40. Contingent liabilities 110 41. Capital and lease commitments 110 42. Deed of Cross Guarantee 112 43. Parent entity financial information 114 44. Events occurring after reporting date 115 Directors’ declaration to stapled security holders 116 Independent auditor’s report to stapled security holders 117 Investor Analysis 119 Investor Relations 120 Corporate Directory 121
2.3.4.
6.7.8.9.10.11.12.13.14.15.16.17.18.19.20.21.
30.31.32.33.34.35.36.37.
For
per
sona
l use
onl
y

Directors’ report to stapled security holders
2 Ardent Leisure Group | Annual Report 2015
Directors’ report to stapled security holders The Directors of Ardent Leisure Management Limited (Manager), (as responsible entity of Ardent Leisure Trust) and the Directors of Ardent Leisure Limited present their report together with the consolidated financial report of Ardent Leisure Group (Group or Consolidated Group) and the consolidated financial report of Ardent Leisure Limited Group (ALL Group) for the year ended 30 June 2015.
The financial report of the Group comprises of Ardent Leisure Trust (Trust) and its controlled entities including Ardent Leisure Limited (ALL or Company) and its controlled entities. The financial report of the ALL Group comprises of Ardent Leisure Limited and its controlled entities.
Ardent Leisure Limited is a company limited by shares, incorporated and domiciled in Australia. Its registered office and principal place of business are Level 16, 61 Lavender Street, Milsons Point, NSW 2061.
The units of the Trust and the shares of ALL are combined and issued as stapled securities in the Group. The units of the Trust and shares of ALL cannot be traded separately and can only be traded as stapled securities. Although there is no ownership interest between the Trust and ALL, the Trust is deemed to be the parent entity of the Group under Australian Accounting Standards.
1. Directors
The following persons have held office as Directors of the Manager and ALL during the period and up to the date of this report:
Neil Balnaves AO (Chair); Roger Davis; David Haslingden (appointed 6 July 2015); Anne Keating (retired 29 October 2014); Don Morris AO; Greg Shaw (retired 10 March 2015); Deborah Thomas; George Venardos; and Melanie Willis (appointed 17 July 2015).
2. Principal activities
The Group’s principal activity is to invest in and operate leisure and entertainment businesses in Australia, New Zealand and the United States. There were no significant changes in the nature of the activities of the Group during the year.
3. Distributions
The total distribution of income for the year ended 30 June 2015 will be 12.5 cents (2014: 13.0 cents) per stapled security which will be paid by the Group. An interim distribution of 7.0 cents (2014: 6.8 cents) per stapled security was paid in February 2015. This comprised a distribution paid by the Trust of 4.0 cents (31 December 2013: 6.8 cents) and a dividend paid by the Company of 3.0 cents (31 December 2013: nil) per stapled security. A final distribution for the year ended 30 June 2015 of 5.5 cents (2014: 6.2 cents) per stapled security will be paid by the Trust in August 2015. A provision has not been recognised in the financial statements at 30 June 2015 as this distribution had not been declared at the reporting date. During the year, a subsidiary of ALL paid to the Trust $1.6 million (2014: $3.9 million) relating to convertible notes which are classified as equity under Australian Accounting Standards.
4. Operating and financial review
Overview
The Group’s strategy is to focus primarily on domestic leisure segments with mass market appeal. The Group‘s operations are diversified through its five core operating divisions, being family entertainment centres in the US, bowling centres, marinas, theme parks and health clubs.
The Group’s theme parks and marinas divisions occupy strategic positions within their respective markets while the other three divisions provide well established operating platforms with organic growth opportunities to roll out new sites or make “bolt-on” acquisitions as conditions permit.
During the year, the Group acquired eight health clubs in Western Australia for $32.0 million. The Group also acquired Playtime Highpoint, an amusement arcade at Highpoint, Victoria for $2.5 million and the exclusive US and Canadian distribution and master franchise rights for the Hypoxi targeted weight loss business for $0.8 million. In addition, the Group acquired two Hypoxi studios in Randwick, NSW and Ballantyne, North Carolina for a total of $0.4 million. Refer to Note 32 to the financial statements.
For
per
sona
l use
onl
y

Directors’ report to stapled security holders
Ardent Leisure Group | Annual Report 2015 3
4. Operating and financial review (continued)
Overview (continued) During the year, the Group also closed two bowling centres at Randwick, NSW and Chadstone, Victoria and disposed of a further bowling centre at Launceston, Tasmania for $0.3 million.
In June 2015, the Group completed the sale and leaseback of three family entertainment centres at Tulsa and Oklahoma City, Oklahoma and San Antonio West, Texas, realising proceeds of US$32.0 million and a gain on disposal of US$5.3 million.
Group results The performance of the Consolidated Group, as represented by the aggregated results of its operations for the year, was as follows:
Segmentrevenues
2015
Segment revenues
2014
SegmentEBITDA*
2015
SegmentEBITDA*
2014 $’000 $’000 $’000 $’000
Family entertainment centres 177,123 98,121 45,657 24,714 Bowling centres 116,510 113,889 13,989 13,765Marinas 22,952 23,466 10,150 10,396Theme parks 99,571 100,139 32,015 32,799 Health clubs 178,388 164,070 28,152 33,990Other 59 18 49 (1)Total 594,603 499,703 130,012 115,663Depreciation and amortisation* (36,998) (27,148)Divisional EBIT 93,014 88,515
Pre-opening expenses, straight lining of fixed rent increases, IFRS depreciation, onerous lease costs, intangible asset amortisation and impairment of property, plant and equipment and intangible assets not included in divisional EBIT (32,122) (19,020) Valuation loss - investment properties (501) -Valuation gains - property, plant and equipment - 8,590Loss on closure of bowling centres (104) (1,579) Loss on disposal of assets (523) (453) Gain on sale and leaseback of family entertainment centres 6,959 379Net gain/(loss) from derivative financial instruments 552 (613)Interest income 121 211Corporate costs (15,056) (12,545)Business acquisition costs (1,938) (277) Borrowing costs (11,333) (11,330) Net tax expense (6,947) (2,876)Profit 32,122 49,002
Core earnings (Note 11 to the financial statements) 56,234 58,153
* Segment earnings before interest, tax, depreciation and amortisation (EBITDA) excludes pre-opening expenses, straight lining of fixed rent increases, IFRS depreciation, onerous lease costs, amortisation of intangible assets and impairment of property, plant and equipment and intangible assets. IFRS depreciation represents depreciation recorded under Australian Accounting Standards effective 1 July 2005 on property, plant and equipment which were previously classified as investment properties. Management believes that adjusting the segment result for these items allows the Group to more effectively compare underlying performance against prior periods and between divisions. Segment EBRITDA, which represents segment EBITDA before property costs, is another measure used by management to assess the trading performance of divisions excluding the impact of property costs.
Profit for the year decreased by $16.9 million, or 34.4%, to $32.1 million, mainly due to the following factors: Depreciation (including IFRS depreciation) and amortisation of property, plant and equipment and software increased by $12.4
million in the current year to $48.1 million;
Impairment of property, plant and equipment and intangible assets of $2.8 million, and onerous lease costs of $2.6 million were incurred in the current year;
Pre-opening costs increased by $3.9 million to $6.5 million;
There was a revaluation loss of $0.5 million on investment properties compared to a gain of $8.6 million on property, plant and equipment in the prior year;
Corporate costs increased by $2.5 million to $15.1 million; and
There was a $4.1 million increase in tax expense for the year largely due to growth in profit from US operations.
For
per
sona
l use
onl
y

Directors’ report to stapled security holders
4 Ardent Leisure Group | Annual Report 2015
4. Operating and financial review (continued)
Group results (continued)
However, this was partially offset by the following factors:
Revenue from operating activities increased by $94.9 million, or 19.0%, to $594.6 million and divisional EBITDA increased by $14.3 million, or 12.4%, to $130.0 million. Further commentary on divisional results is set out separately below;
There was a $7.0 million gain on the sale and leaseback on three Main Event family entertainment centres; and
There was a net gain of $0.6 million from derivative financial instruments in the current year compared to a net loss $0.6 million in the prior year.
The above factors also delivered a decrease in core earnings of $1.9 million, or 3.3%, to $56.2 million. Core earnings (as defined in Note 11 to the financial statements) represents the earnings of the Group after adding back unrealised items (such as unrealised gains or losses on derivatives and unrealised valuation gains and losses on investment property and property, plant and equipment), straight lining of fixed rent increases, IFRS depreciation, onerous lease costs, impairment of property, plant and equipment and intangible assets, amortisation of intangible assets and one off realised items.
Family entertainment centres
The performance of Main Event’s family entertainment centres is summarised as follows:
2015 2014 Change US$'000 US$'000 %
Total revenue 143,612 89,254 60.9
EBRITDA (excluding pre-opening expenses) 52,043 33,513 55.3Operating margin 36.2% 37.5% Property costs (15,352) (11,112) 38.2EBITDA 36,691 22,401 63.8
During the year, total US dollar revenue grew by 60.9%, driving EBITDA growth of 63.8% as a result of strong constant centre performance and the success of new centres opened over the last 12 months as set out below:
Revenue Revenue Change EBRITDA EBRITDA Change 2015 2014 2015 2014 US$'000 US$'000 % US$'000 US$'000 %
Constant centres 83,783 77,354 8.3 38,394 35,019 9.6New centres 59,829 11,900 402.8 25,567 5,276 384.6Corporate and regional office expenses/sales and marketing - - - (11,918) (6,782) 75.7Total 143,612 89,254 60.9 52,043 33,513 55.3
Constant centre revenue growth of 8.3% was assisted by a new core food menu, bar remodels and increased amusement game contribution. Value-based promotions, growth in corporate, group and social league events and ongoing focus on customer satisfaction has driven guest spend.
Six new centres were opened during the year, in which the average revenue of new centres has substantially exceeded the average of the constant centres. Main Event now has six out of 20 centres operating successfully outside of Texas. Construction has started on five new sites with design and construction documents completed on a further two new sites due to open in FY16. Negotiations are underway for a further eight sites to open in FY17. An institutional real estate investor has agreed to fund up to US$100 million of new centre developments. The family entertainment centres division will continue to actively pursue opportunities for additional new sites in FY16 and FY17. F
or p
erso
nal u
se o
nly

Directors’ report to stapled security holders
Ardent Leisure Group | Annual Report 2015 5
4. Operating and financial review (continued)
Bowling centres
The division recorded total revenues of $116.5 million, being an increase of 2.3% compared to the prior year. EBITDA grew by 1.6% through a combination of modest constant centre growth and growth from acquisitions. Excluding one-off make good costs for the closures of Randwick and Richmond bowling centres, EBITDA grew by 5%. Operating margin has increased from 34.2% to 34.6% in FY15.
The performance of bowling centres is summarised as follows: 2015 2014 Change $'000 $'000 %
Total revenue 116,510 113,889 2.3
EBRITDA (excluding pre-opening expenses) 40,279 38,907 3.5Operating margin 34.6% 34.2% Property costs (excluding straight-line rent and onerous lease costs) (26,290) (25,142) 4.6EBITDA 13,989 13,765 1.6
A further analysis of bowling centres performance is summarised as follows: Revenue Revenue Change EBRITDA EBRITDA Change 2015 2014 2015 2014 $'000 $'000 % $'000 $'000 %
Constant centres 110,206 109,755 0.4 52,772 51,381 2.7Centres closed 1,377 3,816 (63.9) 527 1,568 (66.4)New centres /acquisitions 4,874 288 1,592.4 2,613 157 1,564.3Corporate and regional office expenses/sales and marketing 53 30 76.7 (15,633) (14,199) 10.1Total 116,510 113,889 2.3 40,279 38,907 3.5
Revenue and EBITDA growth were driven by initiatives launched during the year which include an online booking engine for social bowling and birthday parties, customer call centre for AMF, and a new food menu in the top 20 locations. Digital initiatives will continue to be executed, including a new website launched in July 2015 and mobile app planned for later in FY16.
The acquisitions of City Amusements late in FY14 and Playtime Highpoint and a new Revesby bowling centre in the current year have contributed positively to the division’s results. In addition, a new Kingpin centre which opened on 1 August 2015 in Darwin has also recorded exceptional early trading results. The division is reviewing opportunities to convert key locations to multi attraction family entertainment centres and continuing to pursue further opportunities to acquire “stand alone” amusement arcades.
During the year, the division exited three centres being Randwick, Chadstone and Launceston and will continue to evaluate divestment opportunities for any underperforming non-core centres.
Marinas
The performance of marinas is summarised as follows: 2015 2014 Change $'000 $'000 %
Total revenue 22,952 23,466 (2.2)EBRITDA 12,765 12,944 (1.4)Operating margin 55.6% 55.2% Property costs (2,615) (2,548) 2.6EBITDA 10,150 10,396 (2.4)
Revenue from marinas fell marginally by 2.2%, to $23.0 million, and EBITDA fell slightly by 2.4% to $10.2 million. Marina revenue principally comprises the following: 2015 2014 Change $'000 $'000 %
Berthing 12,865 12,812 0.4Land 5,220 5,375 (2.9)Fuel and other 4,867 5,279 (7.8)Total 22,952 23,466 (2.2)
For
per
sona
l use
onl
y

Directors’ report to stapled security holders
6 Ardent Leisure Group | Annual Report 2015
4. Operating and financial review (continued)
Marinas (continued)
FY15 berthing revenue was impacted by lower occupancy at the Spit in fourth quarter of FY15 as a result of a $5 million redevelopment which is expected to complete in first quarter of FY16. Despite this, berthing occupancies increased from 84.2% in FY14 to 85.5% in FY15. Costs were well controlled with an operating margin of 55.6% compared to 55.2% in the prior year. Revenue was also impacted by vacancies at Nelson Bay and Pier 35 and weaker fuel sales during second half of FY15.
Revenue uplift at The Spit from 24 new large berths is expected to be realised in second quarter of FY16. The marinas division will continue to focus on digital initiatives to improve customer engagement and retention as well as pursue opportunities to create value through selective redevelopment and refurbishment.
Theme parks
The performance of the theme parks is summarised as follows: 2015 2014 Change $'000 $'000 %
Total revenue 99,571 100,139 (0.6)EBRITDA 33,163 33,867 (2.1)Operating margin 33.3% 33.8% Property costs (1,148) (1,068) 7.5EBITDA 32,015 32,799 (2.4) Attendance 2,281,606 2,042,164 11.7Per capita spend ($) 43.64 49.04 (11.0)
Total revenue has slightly decreased by $0.6 million, or 0.6% to $99.6 million. Full year EBITDA earnings marginally decreased by 2.4% to $32.0 million.
Theme parks have delivered a solid result despite unprecedented rainfall and the impact of Cyclone Marcia. This was assisted by a successful June 2016 pass marketing campaign and competitive pricing which has delivered incremented pass holder growth and strong continued growth from the two largest international markets being New Zealand and China.
During the year, Dreamworld launched four new food and beverage outlets to further improve guest experience.
Dreamworld was voted Queenslands Best Major Tourist attraction and Australia’s third most popular tourist attraction at the annual Australia Tourism awards.
The strategy of the theme parks division is to grow revenue and earnings by continuing to invest in products which provide value and a unique experience to its customers, such as ABC Kids World which opened in June 2015 and Corroboree which has strong appeal to group, education and international markets. In addition further investment will continue to be made into digital technology, food and beverage and retail outlets to continue to improve the customer experience and drive increased spend.
The SkyPoint business continues to perform well, with strong attendance growth lead by pass holders and international markets.
Health clubs
The performance of health clubs is summarised as follows:
2015 2014 Change $'000 $'000 %
Total revenue 178,388 164,070 8.7EBRITDA (excluding pre-opening expenses) 72,543 70,249 3.3Operating margin 40.7% 42.8% Property costs (excluding straight-line rent and onerous lease costs) (44,391) (36,259) 22.4EBITDA 28,152 33,990 (17.2)
For
per
sona
l use
onl
y

Directors’ report to stapled security holders
Ardent Leisure Group | Annual Report 2015 7
4. Operating and financial review (continued)
Health clubs (continued)
Revenue from our health clubs division increased by 8.7% to $178.4 million for the year, underpinned by the acquisition of the Fitness First WA portfolio in September 2014.
Revenue Revenue Change EBRITDA EBRITDA Change 2015 2014 2015 2014 $'000 $'000 % $'000 $'000 %
Constant clubs 148,541 158,370 (6.2) 73,702 81,044 (9.1)Clubs closed 173 569 (69.6) 34 161 (78.9)New clubs/acquisitions 26,839 4,193 540.1 13,319 1,793 642.8Corporate and regional office expenses/sales and marketing 2,835 938 202.2 (14,512) (12,749) 13.8Total 178,388 164,070 8.7 72,543 70,249 3.3
During the year, the acquisition of eight fitness first clubs in Western Australia, together with the acquisition of the exclusive US and Canadian distribution and master franchise rights in the Hypoxi targeted weight loss business have contributed towards continued revenue growth in the current year. The Camberwell and Port Melbourne clubs, along with the initial acquisition of the Hypoxi business, have also contributed a full year of earnings in the current year, being acquired in the third quarter of the prior financial year. However, Health clubs EBITDA was down 17.2% for the year due to competition from 24/7 operators. On a constant club basis, earnings before property costs of $73.7 million were 9.1% lower than earnings of $81.0 million in the prior corresponding period. EBITDA trends have improved during the second half of FY15 underpinned by strong improvement in member attrition across the portfolio and improved sales results, particularly from the implementation of large format full service 24/7 club conversions. A change of product strategy has driven a stronger mix of higher value membership sales in the second half the year, including higher percentages of 12 and 18 month programs. 24/7 club conversions are on schedule with 15 clubs converted by end of June 2015. Sales in these clubs were up 34.3% and leavers down 18.1% on prior corresponding periods. A further 30 clubs are scheduled to be converted during FY16. The business will continue to further enhance its member service offering including providing unique in-club and online offerings and access to a new Goodlife digital 24/7 nutrition, fitness and health website. Six new Hypoxi studios are planned to open in Australia in FY16. In addition, the first of two new prototype Hypoxi US studios is expected to open in Scottsdale, Arizona in September 2015 to act as a flagship studio for the Hypoxi US business.
Strategic focus
Overall, the Group benefits from the diversity of its five core operating divisions. Each of the divisions has a growth strategy for FY16 with a common theme that offers customers quality affordable leisure experiences, innovative products and a consistently high level of customer service, customer engagement and importantly, value for money.
Future earnings growth will be driven by four key operational strategies:
Customer We aim to be truly customer centric by using research, feedback and customer analytics to deliver more innovative and relevant customer experiences that meet the ever-changing needs of our customers. To create awesome, highly valued leisure experiences that encourage more people, to visit more often and spend more with us.
People To deliver enhanced customer service and satisfaction through “noticeably better people and culture” by providing all staff with superior training, development, reward and recognition.
Volume To drive increased volume with competitive value propositions, effective marketing, better customer service and loyalty rewards. Our aim is to maximise capacity without impacting margin.
Efficiency To produce greater operational efficiencies by leveraging Group buying capacity and volume. To create better outcomes and solutions for our customers and staff with investment in technology and effective IT systems.
5. Significant changes in the state of affairs
In the opinion of the Directors, there were no significant changes in the state of affairs of the Consolidated Group or ALL Group that occurred during the year not otherwise disclosed in this report or the financial statements.
For
per
sona
l use
onl
y

Directors’ report to stapled security holders
8 Ardent Leisure Group | Annual Report 2015
6. Value of assets
Consolidated
GroupConsolidated
Group ALL Group ALL Group 2015 2014 2015 2014 $’000 $’000 $’000 $’000
Value of total assets 996,507 853,007 499,065 366,403Value of net assets 579,482 505,502 151,007 84,476
The value of the Group’s and the ALL Group’s assets is derived using the basis set out in Note 1 to the financial statements.
7. Interests in the Group
The movement in stapled securities of the Group during the year is set out below:
Consolidated
Group Consolidated
Group
2015 2014
Stapled securities on issue at the beginning of the year 405,055,708 397,803,987Stapled securities issued under Distribution Reinvestment Plan 6,358,756 5,295,345Stapled securities issued for Fitness First WA placement 20,746,888 -Stapled securities issued for Security Purchase Plan 8,298,754 -Stapled securities issued as part of ALL's employee security-based payments plans 1,862,000 1,956,376Stapled securities on issue at the end of the year 442,322,106 405,055,708
8. Information on current Directors
Neil Balnaves AO Chair
Appointed: Ardent Leisure Management Limited – 26 October 2001. Ardent Leisure Limited – 28 April 2003.
Age: 71.
Neil Balnaves was appointed as Chair of the Group in 2001. Neil has worked in the entertainment and media industries for over 50 years, previously holding the position of Executive Chairman of Southern Star Group Limited which he founded. Neil is a Trustee Member of Bond University and has an Honorary Degree of Doctor of the University. Neil is a Director of the Sydney Orthopaedic Research Institute and a member of the Advisory Council and Dean’s Circle of The University of New South Wales (Faculty of Medicine) and in 2010 received an Honorary Doctorate of the University.
Neil is a Board member of the Art Gallery of South Australia, is a Director of Technicolor Australia Limited and serves on the boards of numerous advisory and community organisations and is a Foundation Fellow of the Australian Institute of Company Directors. Neil’s former directorships include Hanna-Barbera Australia, Reed Consolidated Industries, Hamlyn Group, Taft Hardie and Southern Cross Broadcasting.
In 2006, Neil established The Balnaves Foundation, a philanthropic fund that focuses on education, medicine and the arts. In 2010, Neil was appointed an Officer of the Order of Australia for his services to business and philanthropy.
Neil is non-executive Chair of the Group and a member of both the Remuneration and Nomination Committee and the Audit and Risk Committee.
Former listed directorships in last three years: None.
Interest in stapled securities: 2,801,510.
For
per
sona
l use
onl
y

Directors’ report to stapled security holders
Ardent Leisure Group | Annual Report 2015 9
8. Information on current Directors (continued)
Roger Davis Director
Appointed: Ardent Leisure Management Limited – 1 September 2009. Ardent Leisure Limited – 28 May 2008.
Age: 63.
Roger Davis was appointed a Director of the Company in 2008. Roger brings to the Board over 35 years of experience in banking and investment banking in Australia, the US and Japan. Roger is presently Chairman of the Bank of Queensland and a Consulting Director at Rothschild (Australia) Limited and holds non-executive directorships at Argo Investments Limited, Aristocrat Leisure Limited and AIG Australia Limited. Previously, he was Managing Director at Citigroup where he worked for over 20 years and more recently was a Group Managing Director at ANZ Banking Group.
Roger’s former directorships include the chairmanship of Esanda, along with directorships of ANZ (New Zealand) Limited, Charter Hall Office Management Limited (the manager for Charter Hall Office REIT), The Trust Company Limited, TIO Limited and Citicorp Securities Inc. in the United States.
Roger holds a BEc (Hons) from The University of Sydney and a Master of Philosophy from Oxford.
Roger is Chair of the Safety, Sustainability and Environment Committee and is a member of both the Remuneration and Nomination Committee and the Audit and Risk Committee.
Former listed directorships in last three years: The Trust Company Limited (resigned 30 November 2013).
Interest in stapled securities: 200,658.
David Haslingden Director
Appointed: Ardent Leisure Management Limited – 6 July 2015. Ardent Leisure Limited – 6 July 2015.
Age: 54.
David Haslingden was appointed a Director of the Company and the Manager in July 2015. David is presently the Chairman and a non-executive director of Nine Entertainment Limited. David owns and operates a network of television production companies in Australia and overseas including Natural History New Zealand and Keshet Australia.
He is also a director of US charity WildAid, having been Chairman for the eight years prior to 2015.
Previously, David was President and Chief Operating Officer of Fox Networks Group and Chief Executive of Fox International Channels. David has also served as Chief Executive Officer of the National Geographic Channels business.
David has sat on a number of industry boards in the United States including the National Cable and Telecommunications Association.
David holds a BA and LLB from Sydney University and a LLM from the University of Cambridge.
Former listed directorships in the last three years: None. Interest in stapled securities: Nil.
For
per
sona
l use
onl
y
Directors’ report to stapled security holders
10 Ardent Leisure Group | Annual Report 2015
8. Information on current Directors (continued)
Don Morris AO Director
Appointed: Ardent Leisure Management Limited – 1 January 2012. Ardent Leisure Limited – 1 January 2012.
Age: 70.
Don Morris was appointed a Director of both the Company and the Manager in January 2012 and brings to the Board significant experience of advertising, marketing and promotion, particularly for tourism entities.
Don was a founding principal of Mojo Australia Advertising, creators of several iconic Australian advertising campaigns, including ‘I Still Call Australia Home’ for Qantas, the Paul Hogan ‘Shrimp on the Barbie’ for Australian tourism and ‘C’mon Aussie C’mon’ for World Series Cricket.
Don was the former Chair of the Sydney Olympics Community Support Commission and both the Australian Tourist Commission and Tourism Queensland. He is a former director of Mojo MDA Group Limited, RM Williams Limited, Harvey World Travel Limited, PMP Limited, the Tourism & Transport Forum, Tourism Asset Holdings Limited, Hamilton Island Enterprises Limited and Port Douglas Reef Resorts Limited.
Don was appointed an Officer of the Order of Australia in 2002 for services to tourism and holds a Bachelor of Economics from Monash University.
Don’s current directorships include Ausflag Limited and The Sport and Tourism Youth Foundation.
He was appointed an Adjunct Professor in Tourism, Sport, and Hotel Management at Griffith University in 2012.
In 2013, he received an Honorary Degree of Doctor of the University, and was appointed Chair of the Advisory Board of the Griffith Institute for Tourism (GIFT).
Don is a member of the Remuneration and Nomination Committee and the Safety, Sustainability and Environment Committee.
Former listed directorships in the last three years: None.
Interest in stapled securities: 13,950.
For
per
sona
l use
onl
y

Directors’ report to stapled security holders
Ardent Leisure Group | Annual Report 2015 11
8. Information on current Directors (continued)
Deborah Thomas Managing Director and Chief Executive Officer
Appointed: Ardent Leisure Management Limited – 1 December 2013. Ardent Leisure Limited – 1 December 2013.
Age: 59.
Deborah Thomas was appointed a Director of both the Company and the Manager in December 2013. On 10 March 2015, Deborah was appointed as the Managing Director and Chief Executive Officer of the Group and commenced in this role on 7 April 2015.
One of Australia’s most successful publishing executives, Deborah brings over 28 years of experience in media to the role of Chief Executive Officer. A former Editor-in-Chief of The Australian Women’s Weekly, a position she held for almost a decade, Deborah has a deep understanding of product innovation, marketing, retail sales, advertising and digital development communications.
As Editorial Director across Bauer Media's portfolio of Women’s Lifestyle magazines and Custom Publishing, Deborah was responsible for editorial direction, customer relationships, corporate marketing, public affairs, events and new revenue streams. These initiatives included licensed products for major brands in partnership with retail stores across Australia and New Zealand. Deborah was a director on the board of Post ACP, the company's joint venture between Bauer Media and the Bangkok Post (Thailand). She is currently Deputy Chair of the National Library of Australia.
Former listed directorships in the last three years: None.
Interest in stapled securities:
20,331.
George Venardos Director
Appointed: Ardent Leisure Management Limited – 22 September 2009. Ardent Leisure Limited – 22 September 2009.
Age: 57.
George Venardos was appointed a Director of both the Company and the Manager in September 2009. George is a Chartered Accountant with more than 35 years’ experience in finance, accounting, insurance and funds management.
His former positions include Group Chief Financial Officer of Insurance Australia Group and, for 10 years, Chairman of the Finance and Accounting Committee of the Insurance Council of Australia. George also held the position of Finance Director of Legal & General Group in Australia and was named Insto Magazine’s CFO of the Year for 2003.
George holds a Bachelor of Commerce in Accounting, Finance and Systems from The University of New South Wales. He is also a Fellow of The Institute of Chartered Accountants in Australia, the Australian Institute of Company Directors and the Taxation Institute of Australia. He holds a Diploma in Corporate Management and is a Fellow of the Governance Institute of Australia.
George’s other ASX listed non-executive director positions include IOOF Holdings Limited and BluGlass Limited.
George is Chair of both the Audit and Risk Committee and the Remuneration and Nomination Committee and is also a member of the Safety, Sustainability and Environment Committee.
Former listed directorships in the last three years: Miclyn Express Offshore Limited (resigned 21 June 2013).
Interest in stapled securities: 198,053.
For
per
sona
l use
onl
y

Directors’ report to stapled security holders
12 Ardent Leisure Group | Annual Report 2015
8. Information on current Directors (continued)
Melanie Willis Director
Appointed: Ardent Leisure Management Limited – 17 July 2015. Ardent Leisure Limited – 17 July 2015.
Age: 51.
Melanie Willis was appointed a Director of both the Company and the Manager in July 2015 and brings to the Group significant experience in the global financial, investment banking and professional services sectors.
Melanie has had extensive exposure to domestic and international leisure related businesses and is currently a non-executive director of Mantra Group and Pepper Group. Melanie recently held the position of Chief Executive Officer of NRMA Investments where she was responsible for the commercial businesses and overall group strategy.
Previously, Melanie held non-executive directorships at Crowe Horwath Australasia Limited, Aevum Limited, Hydro Tasmania and Rhodium Asset Solutions Limited, as well as senior executive positions within Deutsche Bank and Bankers Trust Australia.
Melanie holds a Bachelor of Economics from the University of Western Australia, a Masters of Law (Tax) from The University of Melbourne and a Company Director Diploma from the Australian Institute of Company Directors.
In addition, Melanie has completed a leadership course at Harvard Business School, and is a member of both Chief Executive Women and the Big Issue Women’s Advisory Board.
Former listed directorships in the last three years: Crowe Horwath Limited (resigned 30 October 2014).
Interest in stapled securities: Nil.
9. Meetings of Directors
The attendance at meetings of Directors of the Manager and ALL during the year is set out in the following table:
Full meetings of Directors
Meetings of Committees
Audit and Risk Remuneration and
Nomination Safety, Sustainability and
Environment Eligible
to attend Attended
Eligible to
attend Attended
Eligible to
attend Attended
Eligible to
attend Attended
Neil Balnaves AO 9 9 4 3 5 5 N/A N/ARoger Davis 9 8 4 3 5 4 4 4Anne Keating 3 3 2 2 1 1 N/A N/ADon Morris AO 9 9 N/A N/A 5 5 3 3Greg Shaw 5 5 N/A N/A N/A N/A 3 3Deborah Thomas 9 9 N/A N/A 3 3 N/A N/AGeorge Venardos 9 9 4 4 5 5 4 4
10. Company Secretary
The Group’s Company Secretary is Alan Shedden. Alan was appointed to the position of Secretary of the Manager and ALL on 9 September 2009.
Alan has over 17 years of experience as a Company Secretary and, prior to joining the Group, held positions at Brookfield Multiplex Limited and Orange S.A., the mobile telecommunications subsidiary of France Telecom S.A. Alan also acts as Group General Manager Corporate Services and provides guidance to the human resources, health and safety, insurance, Australian Financial Services (AFS) licence compliance and energy efficiency functions. Alan holds a degree in business studies and is a Fellow of the Institute of Chartered Secretaries and Administrators.
For
per
sona
l use
onl
y

Directors’ report to stapled security holders
Ardent Leisure Group | Annual Report 2015 13
11. Remuneration report
The Manager and the Directors of ALL present the remuneration report for the Group for the year ended 30 June 2015.
The remuneration report is set out under the following main headings:
(a) Key remuneration objectives; (b) Remuneration framework and strategy; (c) Details of remuneration – key management personnel; (d) Service agreements of key management personnel; (e) Deferred Short Term Incentive Plan (DSTI); (f) Long Term Incentive Plan (LTIP); and (g) Additional information.
The information provided in the remuneration report has been audited as required by section 308 (3C) of the Corporations Act 2001.
(a) Key remuneration objectives
The objective of the Group’s executive framework is to attract and retain high quality executives by ensuring that executive remuneration is competitive with prevailing employment market conditions and also providing sufficient motivation by ensuring that remuneration is aligned to the Group’s results.
In August 2014, the Board commissioned an independent remuneration review by Aon Hewitt which benchmarked the remuneration packages for certain key executives including the Chief Executive Officer. Following the presentation of this review, the Board resolved to increase the remuneration packages for key executives and implemented an increase in the LTIP target component for the Chief Executive Officer to ensure that the remuneration mix was consistent with market practice.
The Board has adopted a process of annual benchmarking of key management personnel (KMP) and accordingly the Remuneration and Nomination Committee also commissioned independent benchmarking from Ernst & Young of the Chief Executive Officer roles in both family entertainment centres and health clubs. These reports resulted in the Board adopting revised package structures for these positions including the increase of the LTIP component and the adoption of a stretch target short term incentive (STI) mechanism.
The stretch target STI operates purely in relation to the over-achievement of financial key performance indicators (KPIs) and allows participating executives the opportunity to receive 160% of their target STI if they exceed their financial KPIs by 120%. Delivery of the stretch payment is made through the issue of performance rights under the terms of the DSTI which vest into fully paid stapled securities over the following 1 and 2 years after grant.
The transition of the Chief Executive Officer role from Greg Shaw to Deborah Thomas announced to the market on 10 March 2015 resulted in a review of roles and responsibilities for key executives in the Group. Following amendments made to the position description of the Chief Financial Officer, a benchmark exercise was undertaken of the new role and this resulted in the Board increasing the fixed remuneration of the Chief Financial Officer.
Although none of the independent benchmarking reports constituted “remuneration recommendations” under the Corporations Act 2001, as a matter of good governance they were prepared independently and presented directly to the Remuneration and Nomination Committee. As a result, the Directors are satisfied that the reports were prepared in a manner free from undue influence by the Group’s KMP.
Throughout this process, the Remuneration and Nomination Committee has sought to maintain the alignment of key executives with investors through the adoption of a total shareholder return (TSR) performance measure and a second performance measure for the LTIP based upon an internal compound earnings per security (EPS) growth target. This dual performance measure is designed to drive sustainable growth and provide meaningful security holdings for executive KMP and thus extend the Group’s long term approach to executive remuneration.
For
per
sona
l use
onl
y

Directors’ report to stapled security holders
14 Ardent Leisure Group | Annual Report 2015
11. Remuneration report (continued)
(a) Key remuneration objectives (continued)
The components of the remuneration package of the Chief Executive Officer and other executive KMP for the financial year are set out in the table below:
Position Name Annual base
salary
STI1 LTIP1 Total annual target
remunerationCash Deferred equity
Chief Executive Officer Deborah Thomas2 $670,000 25% 25% 50.00% $1,340,000Chief Financial Officer Richard Johnson3 $516,305 50% 25% 37.50% $1,097,148CEO – Bowling centres Nicole Noye4 $360,000 35% 35% 15.00% $666,000CEO – Health clubs Greg Oliver $460,000 35% 35% 15.00% $851,000CEO – Main Event Charlie Keegan5 US$400,000 35% 35% 30.00% US$800,000CEO – Theme parks Craig Davidson $350,000 35% 35% 15.00% $647,500Chief Executive Officer Greg Shaw6 $800,000 50% 25% 40.00% $1,720,000
(1) Target STI and LTIP remuneration components are expressed as percentages of the annual base salary. (2) Deborah Thomas was appointed Chief Executive Officer effective 7 April 2015. (3) Annual base salary increased from $401,305 to $516,305 from 1 April 2015. (4) Appointed 16 June 2014. (5) Total target annual remuneration does not include stretch potential for over-achievement of financial KPIs. (6) The retirement of Greg Shaw as Chief Executive Officer was announced to the ASX on 10 March 2015 and he ceased to be considered KMP on 7 April 2015. It should be noted that the base salary is considered secure and the STI and LTIP figures set out above are considered “at risk” and will only be paid if performance targets have been achieved.
(b) Remuneration framework and strategy
The Group’s remuneration framework seeks to align executive reward with the achievement of strategic objectives and in particular, the creation of sustainable value and earnings growth for investors. In addition, the Board seeks to have reference to market best practice to ensure that executive remuneration remains competitive, fair and reasonable.
(i) Non-Executive Directors Fees paid to Non-Executive Directors reflect the demands which are made on, and the responsibilities of, the Directors. Non-Executive Directors’ fees are reviewed annually by the Board and the Remuneration and Nomination Committee.
Non-Executive Directors are paid solely by the way of directors’ fees and do not participate in any equity or short term cash-based incentives schemes. Non-Executive Directors bring a depth of experience and knowledge to their roles and are a key component in the effective operation of the Board. The maximum aggregate of directors’ fees payable to Directors of the Group is set out in clause 16.1 of the Constitution of Ardent Leisure Limited. The maximum total aggregate level of directors’ fees payable by the Group is $1,200,000 per annum and was set by investors at the 30 October 2014 general meeting.
The Board last reviewed the fee structure in December 2013 and this structure, which remains within the constitutional cap of $1,200,000 per annum (inclusive of superannuation), is as follows:
Position Current annual fee
Board Chair $205,000Other Non-Executive Director $120,000Audit and Risk Committee - Chair $20,000
- Member $15,000Other Committee - Chair $12,500 - Member $7,500
For
per
sona
l use
onl
y
Directors’ report to stapled security holders
Ardent Leisure Group | Annual Report 2015 15
11. Remuneration report (continued)
(b) Remuneration framework and strategy (continued)
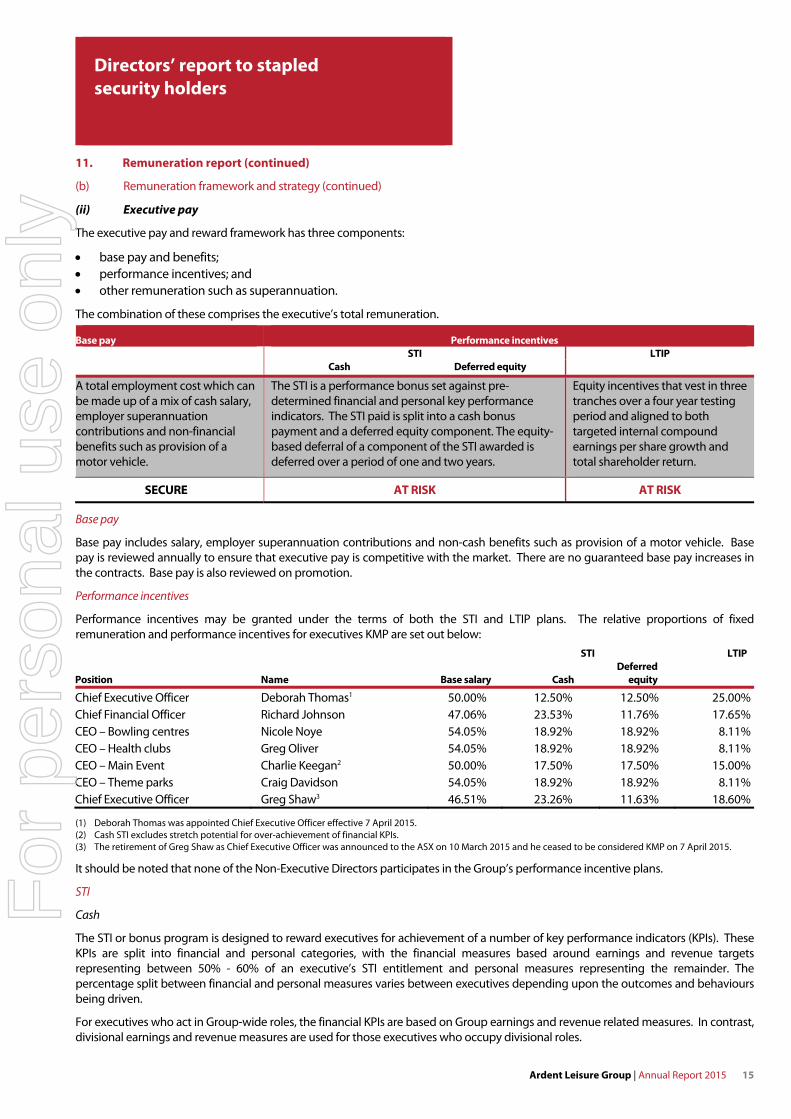
(ii) Executive pay
The executive pay and reward framework has three components:
base pay and benefits; performance incentives; and other remuneration such as superannuation.
The combination of these comprises the executive’s total remuneration.
Base pay Performance incentives STI LTIP
Cash Deferred equity
A total employment cost which can be made up of a mix of cash salary, employer superannuation contributions and non-financial benefits such as provision of a motor vehicle.
The STI is a performance bonus set against pre-determined financial and personal key performance indicators. The STI paid is split into a cash bonus payment and a deferred equity component. The equity-based deferral of a component of the STI awarded is deferred over a period of one and two years.
Equity incentives that vest in three tranches over a four year testing period and aligned to both targeted internal compound earnings per share growth and total shareholder return.
SECURE AT RISK AT RISK
Base pay
Base pay includes salary, employer superannuation contributions and non-cash benefits such as provision of a motor vehicle. Base pay is reviewed annually to ensure that executive pay is competitive with the market. There are no guaranteed base pay increases in the contracts. Base pay is also reviewed on promotion.
Performance incentives
Performance incentives may be granted under the terms of both the STI and LTIP plans. The relative proportions of fixed remuneration and performance incentives for executives KMP are set out below:
Position Name Base salary
STI LTIP
Cash Deferred
equity
Chief Executive Officer Deborah Thomas1 50.00% 12.50% 12.50% 25.00%Chief Financial Officer Richard Johnson 47.06% 23.53% 11.76% 17.65%CEO – Bowling centres Nicole Noye 54.05% 18.92% 18.92% 8.11%CEO – Health clubs Greg Oliver 54.05% 18.92% 18.92% 8.11%CEO – Main Event Charlie Keegan2 50.00% 17.50% 17.50% 15.00%CEO – Theme parks Craig Davidson 54.05% 18.92% 18.92% 8.11%Chief Executive Officer Greg Shaw3 46.51% 23.26% 11.63% 18.60%
(1) Deborah Thomas was appointed Chief Executive Officer effective 7 April 2015. (2) Cash STI excludes stretch potential for over-achievement of financial KPIs. (3) The retirement of Greg Shaw as Chief Executive Officer was announced to the ASX on 10 March 2015 and he ceased to be considered KMP on 7 April 2015.
It should be noted that none of the Non-Executive Directors participates in the Group’s performance incentive plans. STI
Cash
The STI or bonus program is designed to reward executives for achievement of a number of key performance indicators (KPIs). These KPIs are split into financial and personal categories, with the financial measures based around earnings and revenue targets representing between 50% - 60% of an executive’s STI entitlement and personal measures representing the remainder. The percentage split between financial and personal measures varies between executives depending upon the outcomes and behaviours being driven.
For executives who act in Group-wide roles, the financial KPIs are based on Group earnings and revenue related measures. In contrast, divisional earnings and revenue measures are used for those executives who occupy divisional roles.
For
per
sona
l use
onl
y

Directors’ report to stapled security holders
16 Ardent Leisure Group | Annual Report 2015
11. Remuneration report (continued)
(b) Remuneration framework and strategy (continued)
(ii) Executive pay (continued)
STI (continued)
Cash (continued)
Personal KPIs for executives are not financial in nature and are set around execution of improvements and initiatives in such functions as health and safety, risk management, compliance, relationship management, customer engagement, employee satisfaction, employee engagement and other strategic initiatives. Hypothetical examples of personal KPIs which may be used are set out in the table below:
Strategy Refine and implement the Group’s strategic vision and target opportunities to take advantage of macro-environmental shifts in consumer interests and expectations of leisure experiences.
Sales and marketing Implement a divisional loyalty program to drive repeat visitation and develop cross promotional opportunities. Implement an end-to-end process for the collation of suitable consumer data to allow targeted customer segmentation, analysis and direct messaging to drive revenue.
People Provide leadership and create a culture of innovation, productivity and respect, with a strong focus on customer service. Demonstrate significant improvement in the top three areas for improvement identified in the annual staff engagement survey. Improve the level and timeliness of the Group’s internal and external communications. Identify and implement measures to increase the competency and level of talent across the Group.
Innovation Incubate multiple new product development initiatives aimed at increasing visitation, customer spend and dwell time. Identify opportunities for the digital enhancement of the Group’s operational efficiency.
Health and safety Standardise the adoption and reporting of safety lead indicators to ensure that safety remains a priority across all divisions. Drive continued improvements in safety systems and culture to achieve meaningful improvements in safety outcomes.
Customer Establish customer feedback mechanisms to record and report customer service metrics to line management.
The extent to which an executive achieves their personal and financial KPIs is assessed by the Remuneration and Nomination Committee based upon recommendations from the Chief Executive Officer. The resulting cash bonuses are traditionally payable in cash by 30 September each year. Using a combination of revenue and earnings targets ensures that STI payments are only available when sustainable value has been created for investors and profit is consistent with the Group’s business plan.
Maximum achievable awards to KMP under the STI range between 50% - 75% of an executive’s base salary (including superannuation) dependent upon the executive’s position.
Deferred equity
A percentage of the actual STI paid to an executive may be deferred and settled in performance rights to acquire fully paid Group stapled securities for nil exercise price. These performance rights are issued under the terms of the Group’s Deferred Short Term Incentive plan rules and vest in two equal tranches in one year and two years.
LTIP
The LTIP awards performance rights ranging between 15.0% and 40.0% of an executive’s base salary (including superannuation) dependent upon the executive’s role. Further details of the LTIP are set out in section (f) below.
(iii) Alignment with investor interests The Directors are committed to the alignment of executives’ remuneration with investors’ interests and seek to achieve this through the most appropriate mix of base pay and short and long term incentives.
In the 2015 financial year, KMP KPIs were set to drive divisional and Group earnings, with targets set within the Group’s budgetary framework. In this way, the KPIs used to determine performance under the STI are used to align KMP remuneration with sustainable earnings growth and other operational long term goals. The deferral of a component of the STI into equity acts as a two year retention tool to ensure that earnings targets are not achieved at the expense of long term profitability and growth.
For
per
sona
l use
onl
y

Directors’ report to stapled security holders
Ardent Leisure Group | Annual Report 2015 17
11. Remuneration report (continued)
(b) Remuneration framework and strategy (continued)
(iii) Alignment with investor interests (continued) The LTIP further aligns executives’ remuneration with long term investor returns through the total shareholder return performance hurdle. The LTIP is subject to the dual measures of total shareholder return and an internal compound EPS measure. In this way, the LTIP provides a direct link between executive reward and investor return and offers no benefit to individual executives unless the Group’s performance exceeds the 50th percentile of the benchmark Australian Securities Exchange (ASX) Small Industrials Index and a minimum compound EPS growth in the performance period.
(c) Details of remuneration – key management personnel
KMP are defined in AASB 124 Related Party Disclosures as those having authority and responsibility for planning, directing and controlling the activities of the Group. For the year ended 30 June 2015, the KMP for the Group comprise the Independent Directors and the following:
Position Name
Chief Executive Officer1 Deborah ThomasChief Financial Officer Richard JohnsonCEO – Bowling centres Nicole Noye CEO – Theme parks Craig DavidsonCEO – Main Event Charlie KeeganCEO – Health clubs Greg OliverChief Executive Officer2 Greg Shaw
(1) Deborah Thomas was appointed Chief Executive Officer effective 7 April 2015. (2) The retirement of Greg Shaw as Chief Executive Officer was announced to the ASX on 10 March 2015 and he ceased to be considered KMP on 7 April 2015. Details of the remuneration of KMP of the Group for 2015 and 2014 are set out in the tables on the following pages. The tables set out the total cash benefits paid to the KMP in the relevant period and, under the heading “Security-based payments”, show a component of the fair value of the performance rights. The fair value of the performance rights is recognised over the vesting period as an employee benefit expense. Further details of the fair value calculations are set out in sections (e) and (f) below.
Short term benefits Post-employment
benefits Other long term
benefits
Salary Cash
bonus Annual
leaveSuper-
annuation Retirement Other TerminationTotal cash
payment
Security-based
payments Total
Security-based
payment
$ $ $ $ $ $ $ $ $ $% of total
Independent Directors Current Neil Balnaves AO 2015 207,762 - - 18,783 - - - 226,545 - 226,545 -Chair 2014 195,459 - - 17,268 - - - 212,727 - 212,727 -
Roger Davis 2015 141,553 - - 13,447 - - - 155,000 - 155,000 -2014 135,158 - - 12,502 - - - 147,660 - 147,660 -
Don Morris AO 2015 121,005 - - 11,495 - - - 132,500 - 132,500 -2014 119,132 - - 11,020 - - - 130,152 - 130,152 -
George Venardos 2015 142,838 - - 13,570 - - - 156,408 - 156,408 -2014 137,452 - - 12,714 - - - 150,166 - 150,166 -
Past Anne Keating (Note 1) 2015 43,916 - - 4,172 - - - 48,088 - 48,088 -
2014 128,287 - - 11,867 - - - 140,154 - 140,154 -
Executive Directors Current Deborah Thomas (Note 2) 2015 244,002 - - 13,173 - - - 257,175 - 257,175 -
2014 67,353 - - 6,230 - - - 73,583 - 73,583 -Past Greg Shaw (Note 3) 2015 738,984 336,509 42,065 18,783 - - - 1,136,341 534,100 1,670,441 31.97%
2014 677,105 334,500 56,425 17,775 - - - 1,085,805 452,810 1,538,615 29.43%
For
per
sona
l use
onl
y

Directors’ report to stapled security holders
18 Ardent Leisure Group | Annual Report 2015
11. Remuneration report (continued)
(c) Details of remuneration – key management personnel (continued)
Short term benefits Post-employment
benefits Other long term
benefits
Salary Cash
bonus Annual
leave Super-
annuation Retirement Other TerminationTotal cash
payment
Security-based
payments Total
Security-based
payment
$ $ $ $ $ $ $ $ $ $% of total
Other key management personnel Current
Craig Davidson (Note 4) 2015 309,837 74,720 21,379 18,783 - - - 424,719 64,024 488,743 13.1%
CEO – Theme parks 2014 236,327 - 19,694 15,699 - - - 271,720 - 271,720 -
Richard Johnson 2015 414,937 190,018 7,414 18,783 - - - 631,152 248,250 879,402 28.23%
Chief Financial Officer 2014 354,028 184,000 29,502 17,775 - - - 585,305 244,915 830,220 29.50%
Charlie Keegan 2015 454,967 148,986 27,658 - - - - 631,611 251,404 883,015 28.47%
CEO – Main Event 2014 364,669 122,331 30,389 - - - - 517,389 373,768 891,157 41.94%
Nicole Noye (Note 5) 2015 325,469 - 15,748 18,783 - - - 360,000 - 360,000 -
CEO – Bowling centres 2014 13,788 - 1,149 1,382 - - - 16,319 - 16,319 -
Greg Oliver 2015 425,944 136,945 15,273 18,783 - - - 596,945 187,110 784,055 23.86%
CEO – Health clubs 2014 371,285 119,310 30,940 17,775 - - - 539,310 161,725 701,035 23.07%
Past Lee Chadwick (Note 6) 2015 N/A N/A N/A N/A N/A N/A N/A N/A N/A N/A N/AEx CEO – Bowling centres 2014 316,532 49,333 26,378 17,775 - - - 410,018 - 410,018 -Todd Coates (Note 7) 2015 N/A N/A N/A N/A N/A N/A N/A N/A N/A N/A N/AEx CEO – Theme parks 2014 31,820 - 2,652 2,452 - - - 36,924 (38,285) (1,361) -
2015 3,571,214 887,178 129,537 168,555 - - - 4,756,484 1,284,888 6,041,372 21.3%
2014 3,148,395 809,474 197,129 162,234 - - - 4,317,232 1,194,933 5,512,165 21.7%
(1) Anne Keating retired on 29 October 2014. (2) Deborah Thomas was appointed a Non-Executive Director of the Group effective 1 December 2013 and is considered KMP from this date. Deborah Thomas was
appointed Chief Executive Officer effective 7 April 2015. (3) The retirement of Greg Shaw as Chief Executive Officer was announced to the ASX on 10 March 2015 and he ceased to be considered KMP on 7 April 2015. (4) Craig Davidson was appointed CEO of Theme parks on 2 September 2013 and is considered KMP from this date. (5) Nicole Noye was appointed CEO of Bowling centres on 16 June 2014 and is considered KMP from this date. (6) Lee Chadwick resigned from the Group effective 16 June 2014. (7) Todd Coates resigned from the Group effective 31 July 2013. No termination benefits were paid to KMP during the current financial year. There are no cash bonuses or options forfeited with respect to specified executives not previously disclosed. No payments were made to KMP by the Group before they became employees.
Security-based payments included in the tables above reflect the amounts in the Income Statements of the Group. For performance rights issued to all Australian and US KMP post 1 July 2014, this amount is based on the fair value of the equity instruments at the date of the grant rather than at vesting or reporting date for those instruments not yet vested. For performance rights issued to US KMP prior to 1 July 2014, this amount is based on the fair value of the equity instruments at the reporting date. During the year, 716,574 plan securities were issued to Australian employees under the deferred equity component of the STI (2014: 722,192). If the fair value recorded in the Income Statement was based on the movement in the fair value of the instruments between reporting dates, the amount included in KMP compensation would be increased by $380,464 to $1,665,352 (2014: increased by $3,110,201 to $4,305,134). F
or p
erso
nal u
se o
nly

Directors’ report to stapled security holders
Ardent Leisure Group | Annual Report 2015 19
11. Remuneration report (continued)
(d) Service agreements of key management personnel
Remuneration and other terms of employment for KMP are formalised in service agreements. Each of these agreements provides for the payment of performance related cash bonuses and participation in the Group’s long term incentive plans. Other major provisions of the agreements relating to remuneration as at 30 June 2015 are set out below:
Executive Deborah Thomas Richard Johnson Craig Davidson Charlie Keegan Nicole Noye Greg Oliver
Position Chief Executive Officer
Chief Financial Officer CEO – Theme parks CEO – Main Event CEO – Bowling centres CEO – Health clubs
Term No fixed term. No fixed term. No fixed term. Contract subject to automatic annual renewal.
No fixed term. No fixed term;however, may not be terminated earlier than September 2015 unless certain early termination conditions are triggered.
Base annual salary
$670,000 as at 30 June 2015.
$516,305 as at 30 June 2015.
$350,000 as at 30 June 2015.
US$400,000 as at 30 June 2015.
$360,000 as at 30 June 2015.
$460,000 as at 30 June 2015.
Termination Employment shall continue with the Group unless the executive gives the Group six months’ notice in writing, or the Group gives the executive 12 months’ notice in writing.
Employment shall continue with the Group unless the executive gives the Group six months’ notice in writing, or the Group gives the executive 12 months’ notice in writing.
Employment shall continue with the Group unless either party gives three months’ notice in writing.
During the contract term, employment shall continue with the Group unless the executive gives three months’ notice in writing. An early termination payment equal to one year's salary is payable to the executive if the Group terminates the executive during the contract, other than for gross misconduct.
Employment shall continue with the Group unless either party gives three months’ notice in writing.
Employment shall continue with the Group unless either party gives six months’ notice in writing.
All base salary amounts are inclusive of any superannuation payment and will be reviewed annually. With the exception of the terms noted above, there are no contracted termination benefits payable to any KMP.
For
per
sona
l use
onl
y
Directors’ report to stapled security holders
20 Ardent Leisure Group | Annual Report 2015
11. Remuneration report (continued)
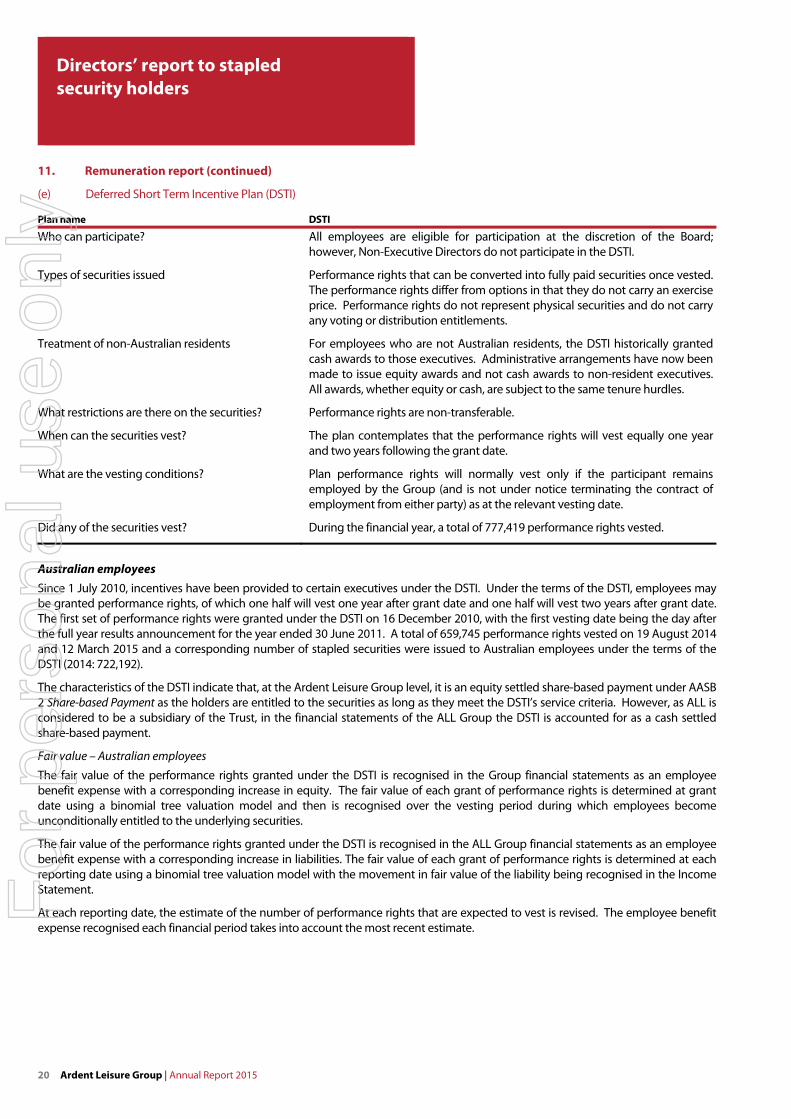
(e) Deferred Short Term Incentive Plan (DSTI)
Plan name DSTI
Who can participate? All employees are eligible for participation at the discretion of the Board;however, Non-Executive Directors do not participate in the DSTI.
Types of securities issued Performance rights that can be converted into fully paid securities once vested. The performance rights differ from options in that they do not carry an exercise price. Performance rights do not represent physical securities and do not carry any voting or distribution entitlements.
Treatment of non-Australian residents For employees who are not Australian residents, the DSTI historically granted cash awards to those executives. Administrative arrangements have now been made to issue equity awards and not cash awards to non-resident executives. All awards, whether equity or cash, are subject to the same tenure hurdles.
What restrictions are there on the securities? Performance rights are non-transferable.
When can the securities vest? The plan contemplates that the performance rights will vest equally one yearand two years following the grant date.
What are the vesting conditions? Plan performance rights will normally vest only if the participant remains employed by the Group (and is not under notice terminating the contract of employment from either party) as at the relevant vesting date.
Did any of the securities vest? During the financial year, a total of 777,419 performance rights vested.
Australian employees Since 1 July 2010, incentives have been provided to certain executives under the DSTI. Under the terms of the DSTI, employees may be granted performance rights, of which one half will vest one year after grant date and one half will vest two years after grant date. The first set of performance rights were granted under the DSTI on 16 December 2010, with the first vesting date being the day after the full year results announcement for the year ended 30 June 2011. A total of 659,745 performance rights vested on 19 August 2014 and 12 March 2015 and a corresponding number of stapled securities were issued to Australian employees under the terms of the DSTI (2014: 722,192).
The characteristics of the DSTI indicate that, at the Ardent Leisure Group level, it is an equity settled share-based payment under AASB 2 Share-based Payment as the holders are entitled to the securities as long as they meet the DSTI’s service criteria. However, as ALL is considered to be a subsidiary of the Trust, in the financial statements of the ALL Group the DSTI is accounted for as a cash settled share-based payment.
Fair value – Australian employees
The fair value of the performance rights granted under the DSTI is recognised in the Group financial statements as an employee benefit expense with a corresponding increase in equity. The fair value of each grant of performance rights is determined at grant date using a binomial tree valuation model and then is recognised over the vesting period during which employees become unconditionally entitled to the underlying securities.
The fair value of the performance rights granted under the DSTI is recognised in the ALL Group financial statements as an employee benefit expense with a corresponding increase in liabilities. The fair value of each grant of performance rights is determined at each reporting date using a binomial tree valuation model with the movement in fair value of the liability being recognised in the Income Statement.
At each reporting date, the estimate of the number of performance rights that are expected to vest is revised. The employee benefit expense recognised each financial period takes into account the most recent estimate.
For
per
sona
l use
onl
y

Directors’ report to stapled security holders
Ardent Leisure Group | Annual Report 2015 21
11. Remuneration report (continued)
(e) Deferred Short Term Incentive Plan (DSTI) (continued)
US employees Due to previous restrictions on the issue of securities to US residents, those US executives eligible for the DSTI were subject to a shadow performance rights scheme whereby a cash payment was made instead of performance rights being granted. At the end of each vesting period, the number of performance rights which would have vested is multiplied by the Group stapled security volume weighted average price (VWAP) for the five trading days immediately following the vesting date and an equivalent cash payment is made. Due to the nature of the scheme, this is considered to be a cash settled share-based payment under AASB 2. A total of 60,845 cash settled performance rights vested on 19 August 2014 to US employees under the terms of the DSTI (2014: 135,090). Following steps taken to issue equity to US resident employees, all new performance rights issued after1 July 2014 will be settled in equity upon vesting in future periods. As such, these performance rights are considered to be equity settled share-based payments under AASB 2. A total of 56,829 equity settled performance rights vested on 19 August 2014 (2014: nil). In the ALL financial statements, all performance rights issued to US employees are considered to be cash settled.
Fair value – US employees
The fair value of cash settled performance rights is determined at grant date and each reporting date using a binomial tree valuation model. This is recorded as a liability with the movement in the fair value of the financial liability being recognised in the Income Statement.
The fair value of equity settled performance rights is determined at grant date using a binomial tree valuation model. This is recorded as an employee benefit expense with a corresponding increase in equity.
At each reporting date, the estimate of the number of performance rights that are expected to vest is revised. The employee benefit expense recognised each period takes into account the most recent estimate.
Valuation inputs For the performance rights outstanding at 30 June 2015, the table below shows the fair value of the performance rights on each grant date as well as the factors used to value the performance rights at the date of grant. This valuation is used to value the equity settled performance rights granted to employees at 30 June 2015:
Grant 2013 2014
Grant date 23 August 2013 19 August 2014Vesting date – year 1 19 August 2014 31 August 2015Vesting date – year 2 31 August 2015 31 August 2016Average risk free rate 2.60% per annum 2.50% per annumExpected price volatility 30.9% per annum 27.0% per annumExpected distribution yield 6.6% per annum 4.3% per annumStapled security price at grant date $1.82 $3.00Valuation per performance right on issue $1.66 $2.81 The table below shows the fair value of the performance rights in each grant as at 30 June 2015 as well as the factors used to value the performance rights as at 30 June 2015. This valuation is used to value the cash settled performance rights granted to employees at 30 June 2015:
Grant 2013 2014
Grant date 23 August 2013 19 August 2014Vesting date – year 1 19 August 2014 31 August 2015Vesting date – year 2 31 August 2015 31 August 2016Average risk free rate 2.00% per annum 2.00% per annumExpected price volatility 41.9% per annum 41.9% per annumExpected distribution yield 5.8% per annum 5.8% per annumStapled security price at year end $2.17 $2.17Valuation per performance right at year end $2.17 $2.10
Grants of performance rights are made annually with the grant date being the date of the issue of the offer letters to employees. Although the grant date may vary from year to year, the testing period (subject to any hurdles) remains constant with the vesting date being 24 hours immediately following the announcement of the Group’s full year financial results.
For
per
sona
l use
onl
y

Directors’ report to stapled security holders
22 Ardent Leisure Group | Annual Report 2015
11. Remuneration report (continued)
(e) Deferred Short Term Incentive Plan (DSTI) (continued)
Tenure hurdle The vesting of the performance rights is subject to a tenure hurdle and participants must remain employed by the Group (and not be under notice terminating the contract of employment from either party) as at the relevant vesting date.
Performance rights The number of performance rights on issue and granted to the Group’s KMP is set out below:
30 June 2015 Opening
balance Granted as
compensation Exercised Lapsed Closing balance
Vested and exercisable Unvested
Current executives Craig Davidson - 26,613 - - 26,613 - 26,613 Richard Johnson 90,288 33,839 (62,577) - 61,550 - 61,550 Charlie Keegan 72,993 47,306 (36,497) - 83,802 - 83,802 Nicole Noye - - - - - - -Greg Oliver 115,177 48,755 (79,241) - 84,691 - 84,691Deborah Thomas - - - - - - -
Past executives Greg Shaw 162,041 59,926 (221,967) - - - -Equity settled 440,499 216,439 (400,282) - 256,656 - 256,656
Current executives Charlie Keegan 41,654 - (41,654) - - - - Cash settled 41,654 - (41,654) - - - -
482,153 216,439 (441,936) - 256,656 - 256,656 F
or p
erso
nal u
se o
nly

Directors’ report to stapled security holders
Ardent Leisure Group | Annual Report 2015 23
11. Remuneration report (continued)
(f) Long Term Incentive Plan (LTIP)
Plan name LTIP
Who can participate? All employees are eligible for participation at the discretion of the Board;however, Non-Executive Directors do not participate in the LTIP.
Types of securities issued Performance rights that can be converted into fully paid securities once vested. The performance rights differ from options in that they do not carry an exercise price. Performance rights do not represent physical securities and do not carry any voting or distribution entitlements.
Treatment of non-Australian residents For employees who are not Australian residents, the LTIP historically granted cash awards to those executives. Administrative arrangements have now been made to issue equity awards and not cash awards to non-resident executives. All awards, whether equity or cash, are subject to the same performance and tenure hurdles.
What restrictions are there on the securities? Performance rights are non-transferable.
When can the securities vest? The plan contemplates that the performance rights will vest equally two, three and four years following the grant date, subject to meeting the total shareholder return (TSR) and internal compound earnings per security (EPS) performance hurdles. The weighting between the two hurdles will be split as follows:
TSR – 50%; and EPS – 50%.
What are the vesting conditions? For grants made after 1 July 2014, in order for any or all of the performance rights to vest one or both of the following hurdles must be met:
TSR performance hurdle - the Group's TSR for the performance period must exceed the 50th percentile of the TSRs of the benchmark group for the same period. A sliding scale of vesting applies above the 50th percentile threshold; and
EPS performance hurdle - the Group's compound EPS growth for the performance period must exceed 5%. A sliding scale of vesting applies above the 5% threshold.
What does total shareholder return include? TSR is the total return an investor would receive over a set period of timeassuming that all distributions were reinvested in the Group’s securities. The TSR definition takes account of both capital growth and distributions.
What is the earnings per security hurdle? The EPS hurdle refers to the annual growth of earnings per security over the total vesting periods of two, three and four years from the grant date.
What is the benchmark group? The benchmark group comprises the ASX Small Industrials Index.
Did any of the securities vest? During the financial year, a total of 1,202,878 performance rights reached vesting following an independent third party assessment of the Group’s TSR performance compared to the benchmark.
For
per
sona
l use
onl
y

Directors’ report to stapled security holders
24 Ardent Leisure Group | Annual Report 2015
11. Remuneration report (continued)
(f) Long Term Incentive Plan (LTIP) (continued)
Australian employees Since 1 July 2009, long term incentives have been provided to certain executives under the LTIP. Under the terms of the LTIP and the initial grant, employees may be granted performance rights, of which one third will vest two years after grant date, one third will vest three years after grant date and one third will vest four years after grant date. The percentage of performance rights which may vest is subject to the TSR performance of the Group relative to its peer group, which is the ASX Small Industrials Index.
During the year, the relative TSR performance of the Group was tested in accordance with the LTIP for tranches issued in 2010, 2011 and 2012 with the following results:
Tranche TSR percentile Vesting percentage
T3-2010 96.70 100.0%T2-2011 93.62 100.0%T1-2012 91.75 100.0%
A total of 1,145,426 performance rights vested on 19 August 2014 and a corresponding number of stapled securities were issued to Australian employees under the terms of the LTIP (2014: 1,234,184).
The characteristics of the LTIP indicate that, at the Ardent Leisure Group level, it is an equity settled share-based payment under AASB 2 Share-based Payment as the holders are entitled to the securities as long as they meet the LTIP’s service and performance criteria. However, as ALL is considered to be a subsidiary of the Trust, in the financial statements of the ALL Group the LTIP is accounted for as a cash settled share-based payment.
Fair value – Australian employees
The fair value of the performance rights granted under the LTIP is recognised in the Group financial statements as an employee benefit expense with a corresponding increase in equity. The fair value of the performance rights is determined at grant date using a Monte Carlo simulation valuation model and then is recognised over the vesting period during which employees become unconditionally entitled to the underlying securities.
The fair value of the performance rights granted under the LTIP is recognised in the ALL Group financial statements as an employee benefit expense with a corresponding increase in liabilities. The fair value of each grant of performance rights is determined at each reporting date using a Monte Carlo simulation valuation model with the movement in fair value of the liability being recognised in the Income Statement.
At each reporting date, the estimate of the number of performance rights that are expected to vest is revised. The employee benefit expense recognised each financial period takes into account the most recent estimate.
US employees Due to previous restrictions on the issue of securities to US residents, those US executives eligible for the DSTI were subject to a shadow performance rights scheme whereby a cash payment was made instead of performance rights being granted. At the end of each vesting period, the number of performance rights which would have vested is multiplied by the Group stapled security VWAP for the five trading days immediately following the vesting date and an equivalent cash payment is made. Due to the nature of the scheme, this is considered to be a cash settled share-based payment under AASB 2. A total of 57,452 cash settled performance rights vested on 19 August 2014 to US employees under the terms of the LTIP (2014: 69,060). Following steps taken to issue equity to US resident employees, all new performance rights issued after 1 July 2014 will be settled in equity upon vesting in future periods. As such, these performance rights are considered to be equity settled share-based payments under AASB 2.
Fair value – US employees
The fair value of cash settled performance rights is determined at grant date and each reporting date using a Monte Carlo simulation valuation model. This is recorded as a liability with the difference in the movement in the fair value of the financial liability recognised in the Income Statement.
The fair value of equity settled performance rights is determined at grant date using a Monte Carlo simulation valuation model. This is recorded as an employee benefit expense with a corresponding increase in equity.
At each reporting date, the estimate of the number of performance rights that are expected to vest is revised. The employee benefit expense recognised each period takes into account the most recent estimate.
For
per
sona
l use
onl
y

Directors’ report to stapled security holders
Ardent Leisure Group | Annual Report 2015 25
11. Remuneration report (continued)
(f) Long Term Incentive Plan (LTIP) (continued)
Valuation inputs For performance rights outstanding at 30 June 2015, the table below shows the fair value of the performance rights on each grant date as well as the factors used to value the performance rights at the grant date. This valuation is used to value the equity settled performance rights granted to employees at 30 June 2015:
Grant 2011 2012 2013 2014
Grant date 12 September 2011 24 August 2012 23 August 2013 19 August 2014Vesting date – year 2 23 August 2013 19 August 2014 31 August 2015 31 August 2016Vesting date – year 3 19 August 2014 31 August 2015 31 August 2016 31 August 2017Vesting date – year 4 31 August 2015 31 August 2016 31 August 2017 31 August 2018Average risk free rate 3.49% per annum 2.73% per annum 2.60% per annum 2.57% per annumExpected price volatility 40.0% per annum 35.0% per annum 32.0% per annum 27.0% per annumExpected distribution yield 11.0% per annum 9.1% per annum 6.6% per annum 4.3% per annumStapled security price at grant date $1.055 $1.290 $1.815 $3.00Valuation per performance right on issue $0.44 $0.61 $0.76 $1.54
The table below shows the fair value of the performance rights for each grant as at 30 June 2015 as well as the factors used to value the performance rights at 30 June 2015. This valuation is used to value the cash settled performance rights granted to employees at 30 June 2015:
Grant 2011 2012 2013 2014
Grant date 12 September 2011 24 August 2012 23 August 2013 19 August 2014Vesting date – year 2 23 August 2013 19 August 2014 31 August 2015 31 August 2016Vesting date – year 3 19 August 2014 31 August 2015 31 August 2016 31 August 2017Vesting date – year 4 31 August 2015 31 August 2016 31 August 2017 31 August 2018Average risk free rate 2.00% per annum 2.00% per annum 2.00% per annum 2.00% per annumExpected price volatility 41.9% per annum 41.9% per annum 39.3% per annum 36.2% per annumExpected distribution yield 5.8% per annum 5.8% per annum 5.8% per annum 5.8% per annumStapled security price at year end $2.17 $2.17 $2.17 $2.17Valuation per performance right on issue $2.17 $1.94 $1.43 $0.58
Grants of performance rights are made annually with the grant date being the date of the issue of the offer letters to employees. Although the grant date may vary from year to year, the testing period (subject to any hurdles) remains constant with the vesting date being 24 hours immediately following the announcement of the Group’s full year financial results.
Performance hurdles In order for any or all of the performance rights to vest under the LTIP, the Group's TSR and/or (for grants made after 1 July 2014) the EPS performance hurdle must be met.
TSR
The Group’s TSR for the performance period must exceed the 50th percentile of the TSRs of the benchmark for the same period. A sliding scale of vesting applies above the 50th percentile threshold.
TSR of the Group relative to TSRs of comparators Proportion of performance rights vesting
Below 51st percentile 0%51st percentile 50%Between 51st percentile and 75th percentile Straight-line vesting between 50% and 100%75th percentile or higher 100%
TSR over a performance period is measured against the benchmark group securities calculated at the average closing price of securities on the ASX for the calendar month period up to and including each of the first and last dates of the performance period. Distributions are assumed to be reinvested at the distribution date and any franking credits (or similar) are ignored.
For
per
sona
l use
onl
y

Directors’ report to stapled security holders
26 Ardent Leisure Group | Annual Report 2015
11. Remuneration report (continued)
(f) Long Term Incentive Plan (LTIP) (continued)
Performance hurdles (continued) EPS
The Group’s compound EPS growth for the performance period must exceed 5%. A sliding scale of vesting applies above 5% threshold.
Compound EPS growth in the period Proportion of performance rights vesting
Below 5% 0%5% 50%Between 5% and 10% Straight-line vesting between 50% and 100%10% or higher 100%
The weighting between the two performance measures is split as follows:
TSR – 50%; and EPS – 50%.
Performance rights The number of performance rights on issue and granted to the Group’s KMP is set out below:
30 June 2015 Opening
balance Granted as
compensation Exercised LapsedClosing balance
Vested and exercisable Unvested
Current executives Craig Davidson - 34,104 - - 34,104 - 34,104Richard Johnson 781,332 101,412 (305,292) - 577,452 - 577,452Charlie Keegan 51,487 83,883 - - 135,370 - 135,370Nicole Noye - - - - - - -Greg Oliver 251,539 44,823 (92,018) - 204,344 - 204,344Deborah Thomas - - - - - - -
Past executives Greg Shaw 1,464,997 207,873 (572,422) - 1,100,448 - 1,100,448Equity settled 2,549,355 472,095 (969,732) - 2,051,718 - 2,051,718
Current executives Charlie Keegan 113,489 - (57,452) - 56,037 - 56,037Cash settled 113,489 - (57,452) - 56,037 56,037Total performance rights 2,662,844 472,095 (1,027,184) - 2,107,755 - 2,107,755
For
per
sona
l use
onl
y

Directors’ report to stapled security holders
Ardent Leisure Group | Annual Report 2015 27
11. Remuneration report (continued)
(g) Additional information
Performance of the Group Over the past five years, core earnings per security of the Group have increased by 14.0% and the market capitalisation of the Group has increased by 213.7%. In 2010, following the internalisation of the Manager, the definition of KMP extended to include executives of both the Manager and ALL. The table below compares the Group’s core earnings per security with total KMP remuneration over the past five years:
2015 2014 2013 2012 2011
Security price as at 30 June $2.170 $2.710 $1.715 $1.275 $1.275First half year distribution per security $0.070 $0.068 $0.066 $0.065 $0.065Distribution reinvestment price $2.6389 N/A N/A $1.0073 $0.9872Second half year distribution per security $0.055 $0.062 $0.054 $0.052 $0.050Distribution reinvestment price $2.1553 $2.6378 $1.6841 $1.2373 $1.2496Number of securities on issue as at 30 June 442,322,106 405,055,708 397,803,987 334,209,401 318,147,978Market capitalisation as at 30 June ($ million) $959.8 $1,097.7 $682.2 $426.1 $405.6Core earnings per security (cents) 12.92 14.40 13.14 12.91 12.54Total KMP remuneration $6,041,372 $5,512,165 $5,102,854 $6,052,116 $4,988,292Investor value of a $5,000 investment as at 30 June 2010 (based upon an initial security price of $0.99) $15,556 $13,749 $8,608 $5,978 $5,391
Details of remuneration: cash bonuses and options All service and performance criteria were met by executives eligible for a bonus with respect to their performance in the 30 June 2014 financial year. These bonuses were paid during the year and the percentages forfeited are set out below. No part of the bonuses is payable in future years. Bonuses with respect to performance within the 30 June 2015 financial year have been accrued but are subject to approval by the Board’s Remuneration and Nomination Committee before payment.
Plan securities and performance rights granted to executives vest over varying periods of one, two, three and four years, provided the vesting conditions are met. No plan securities or performance rights will vest if the conditions are not satisfied; hence, the minimum value of the plan securities and performance rights yet to vest is nil.
DSTI
Under the terms of the 2012 grant, performance rights were allocated on the basis of a valuation dated 24 August 2012 and there was no valuation difference.
Under the terms of the 2013 grant, performance rights were allocated on the basis of a valuation dated 23 August 2013 and there was no valuation difference.
Under the terms of the 2014 grant, performance rights were allocated on the basis of a valuation dated 19 August 2014 and there was no valuation difference.
LTIP
Under the terms of the 2011 grant, performance rights were allocated on the basis of a valuation dated 12 September 2011 and there was no valuation difference.
Under the terms of the 2012 grant, performance rights were allocated on the basis of a valuation dated 24 August 2012 and there was no valuation difference.
Under the terms of the 2013 grant, performance rights were allocated on the basis of a valuation dated 23 August 2013 and there was no valuation difference.
Under the terms of the 2014 grant, performance rights were allocated on the basis of a valuation dated 19 August 2014 and there was no valuation difference.
For
per
sona
l use
onl
y

Directors’ report to stapled security holders
28 Ardent Leisure Group | Annual Report 2015
11. Remuneration report (continued)
(g) Additional information (continued)
The table below sets out the number of performance rights that were granted, lapsed and vested during the financial year and that are yet to vest. The percentage of cash STI (as listed in the table in section (c) above) that was awarded to the Group’s KMP and the percentage that was forfeited because the executive did not meet the performance criteria is also set out below. No part of any cash STI is payable in future years.
Year granted Tranche
Financial years in which performance
rights may vest
Value of performance
rights at grant
Number lapsed
Value of performance
rights at lapse
Number vested
Value of performance
rights at vesting
Maximum value yet
to vest Cash STI (%)
Year Number $ $ $ $ Awarded Forfeited
Current executives
Equity settled
Craig Davidson LTI 2014 T1 2017 11,368 19,789 - - - - 19,789 92.0 8.0
T2 2018 11,368 17,740 - - - - 17,740
T3 2019 11,368 14,973 - - - - 14,973
DSTI 2014 T1 2016 13,306 38,171 - - - - 38,171
T2 2017 13,307 36,550 - - - - 36,550
Total 60,717 127,223 - - - - 127,223
Richard Johnson LTI 2010 T3 2015 108,696 56,522 - - 108,696 326,088 - 94.7 5.3
2011 T2 2015 114,521 50,389 - - 114,521 343,563 -
T3 2016 114,522 49,244 - - - - 49,244
2012 T1 2015 82,075 50,328 - - 82,075 246,225 -
T2 2016 82,075 50,181 - - - - 50,181
T3 2017 82,075 49,491 - - - - 49,491
2013 T1 2016 65,790 51,678 - - - - 51,678
T2 2017 65,789 51,388 - - - - 51,388
T3 2018 65,789 47,579 - - - - 47,579
2014 T1 2017 33,804 58,846 - - - - 58,846
T2 2018 33,804 52,751 - - - - 52,751
T3 2019 33,804 44,523 - - - - 44,523
DSTI 2012 T2 2015 34,866 38,182 - - 34,866 104,598 -
2013 T1 2015 27,711 47,541 - - 27,711 83,133 -
T2 2016 27,711 44,498 - - - - 44,498
2014 T1 2016 16,919 48,536 - - - - 48,536
T2 2017 16,920 46,474 - - - - 46,474
Total 1,006,871 838,151 - - 367,869 1,103,607 595,189
Nicole Noye Total - - - - - - - - -
For
per
sona
l use
onl
y

Directors’ report to stapled security holders
Ardent Leisure Group | Annual Report 2015 29
11. Remuneration report (continued)
(g) Additional information (continued)
Year granted Tranche
Financial years in which performance
rights may vest
Value of performance
rights at grant
Number lapsed
Value of performance
rights at lapse
Number vested
Value of performance
rights at vesting
Maximum value yet to
vest Cash STI (%)
Year Number $ $ $ $ Awarded Forfeited
Greg Oliver LTI 2010 T3 2015 29,620 15,402 - - 29,620 88,860 - 93.2 6.8
2011 T2 2015 34,356 15,117 - - 34,356 103,068 -
T3 2016 34,357 14,774 - - - - 14,774
2012 T1 2015 28,042 17,195 - - 28,042 84,126 -
T2 2016 28,042 17,145 - - - - 17,145
T3 2017 28,043 16,910 - - - - 16,910
2013 T1 2016 23,027 18,088 - - - - 18,088
T2 2017 23,026 17,986 - - - - 17,986
T3 2018 23,026 16,652 - - - - 16,652
2014 T1 2017 14,941 26,009 - - - - 26,009
T2 2018 14,941 23,315 - - - - 23,315
T3 2019 14,941 19,679 - - - - 19,679
DSTI 2012 T2 2015 43,304 47,422 - - 43,304 129,912 -
2013 T1 2015 35,937 61,654 - - 35,937 107,811 -
T2 2016 35,936 57,706 - - - - 57,706
2014 T1 2016 24,377 69,930 - - - - 69,930
T2 2017 24,378 66,959 - - - - 66,959
Total 460,294 521,943 - - 171,259 513,777 365,153 Deborah Thomas Total - - - - - - - - -
Charlie Keegan LTI 2013 T1 2016 17,163 13,482 - - - - 13,482 98.0 2.0
T2 2017 17,162 13,405 - - - - 13,405
T3 2018 17,162 12,412 - - - - 12,412
2014 T1 2017 27,961 48,675 - - - - 48,675
T2 2018 27,961 43,633 - - - - 43,633
T3 2019 27,961 36,827 - - - - 36,827
DSTI 2013 T1 2015 36,497 62,614 - - 36,497 109,491 -
T2 2016 36,496 58,605 - - - - 58,605
2014 T1 2016 23,653 67,853 - - - - 67,853
T2 2017 23,653 64,968 - - - - 64,968
Cash settled
Charlie Keegan LTI 2010 T3 2015 18,454 9,596 - - 18,454 55,362 -
2011 T2 2015 21,960 9,662 - - 21,960 65,880 -
T3 2016 21,960 9,443 - - - - 9,443
2012 T1 2015 17,038 10,448 - - 17,038 51,114 -
T2 2016 17,038 10,417 - - - - 10,417
T3 2017 17,039 10,275 - - - - 10,275
DSTI 2012 T2 2015 41,654 45,615 - - 41,654 124,962 -
Total 410,812 527,930 - - 135,603 406,809 389,995
For
per
sona
l use
onl
y

Directors’ report to stapled security holders
30 Ardent Leisure Group | Annual Report 2015
11. Remuneration report (continued)
(g) Additional information (continued)
Year granted Tranche
Financial years in which performance
rights may vest
Value of performance
rights at grant
Number lapsed
Value of performance
rights at lapse
Number vested
Value of performance
rights at vesting
Maximum value yet to
vest Cash STI (%)
Year Number $ $ $ $ Awarded Forfeited
Past executives
Greg Shaw LTI 2010 T3 2015 203,804 105,978 - - 203,804 611,412 - 89.6 10.4
2011 T2 2015 214,727 94,480 - - 214,727 644,181 -
T3 2016 214,728 92,333 - - - - 92,333
2012 T1 2015 153,890 94,365 - - 153,890 461,670 -
T2 2016 153,890 94,088 - - - - 94,088
T3 2017 153,891 92,796 - - - - 92,796
2013 T1 2016 123,356 96,896 - - - - 96,896
T2 2017 123,355 96,353 - - - - 96,353
T3 2018 123,355 89,210 - - - - 89,210
2014 T1 2017 69,291 120,622 - - - - 120,622
T2 2018 69,291 108,129 - - - - 108,129
T3 2019 69,291 91,263 - - - - 91,263
DSTI 2012 T2 2015 61,288 67,116 - - 61,288 183,864 -
2013 T1 2015 50,377 86,427 - - 50,377 151,131 -
T2 2016 50,376 80,894 - - 50,376 104,278 -
2014 T1 2016 29,963 85,955 - - 29,963 62,023 -
T2 2017 29,963 82,299 - - 29,963 62,023 -
Total 1,894,836 1,579,204 - - 794,388 2,280,582 881,690
Directors’ interests in securities Changes to Directors’ interests in stapled securities during the period are set out below:
Opening
balance Acquired
Acquired under the Group's
equity plans Disposed Closing balance
Neil Balnaves AO 2,439,062 362,448 - - 2,801,510Roger Davis 150,275 50,383 - - 200,658Don Morris AO - 13,950 - - 13,950Deborah Thomas 6,000 14,331 - - 20,331George Venardos 112,636 85,417 - - 198,053 2,707,973 526,529 - - 3,234,502
KMP interests in securities Changes to the interests of other KMP in stapled securities during the period are set out below:
Opening
balance Acquired
Acquired under the Group's
equity plans Disposed Closing balance
Craig Davidson - - - - -Richard Johnson 516,622 6,224 367,869 (790,715) 100,000Charlie Keegan - - 36,497 - 36,497Nicole Noye - 2,500 - - 2,500Greg Oliver 294,709 17,154 171,259 - 483,122 811,331 25,878 575,625 (790,715) 622,119
For
per
sona
l use
onl
y

Directors’ report to stapled security holders
Ardent Leisure Group | Annual Report 2015 31
11. Remuneration report (continued)
(g) Additional information (continued)
Loans and other transactions with KMP There were no loans made to KMP during the financial year, as disclosed in Note 36(e) to the financial statements. Refer to Note 36(f) to the financial statements for details of other transactions with KMP during the financial year.
Corporations Amendment (Improving Accountability on Director and Executive Remuneration) Act 2011 On 1 July 2011, the Corporations Amendment (Improving Accountability on Director and Executive Remuneration) Act 2011 came into force. The new legislative requirements under the Corporations Act 2001 in relation to remuneration votes and the “two strikes” rule operate such that a company receiving a 25% or more “NO” vote against its remuneration report resolution at the Annual General Meeting (AGM) in two consecutive years will be required to put a spill resolution to the meeting whereby investors can vote to hold a further meeting where all board directors will be subject to re-election.
In addition, KMP and their closely related parties are prohibited from voting on the adoption of the remuneration report and any other remuneration related resolutions at the AGM. In order to ensure that KMP and their closely related parties do not exercise their votes, the Group issued an instruction to them prior to the AGM and instructed the security registrars to apply appropriate voting exclusions.
At the AGM held on 31 October 2014, the following votes were cast on the adoption of the 2014 Remuneration Report:
Votes for Votes against Votes abstain
Adoption of the Remuneration Report 97.53% 1.78% 0.69%
12. Non-audit services
The Group may decide to employ the auditor on assignments additional to their statutory audit duties where the auditor’s expertise and experience with the Group are important.
Details of the amounts paid to the auditor (PricewaterhouseCoopers) for audit and non-audit services provided during the year are disclosed in Note 9 to the financial statements.
The Directors have considered the position and, in accordance with the recommendation received from the Audit and Risk Committee, are satisfied that the provision of the non-audit services is compatible with the general standard of independence for auditors imposed by the Corporations Act 2001. The Directors are satisfied that the provision of non-audit services by the auditor, as set out in Note 9 to the financial statements, did not compromise the auditor independence requirements of the Corporations Act 2001 for the following reasons:
All non-audit services have been reviewed by the Audit and Risk Committee to ensure that they do not impact the integrity and objectivity of the auditor; and
None of the services undermines the general principles relating to auditor independence as set out in Accounting Professional and Ethical Standards Board APES 110 Code of Ethics for Professional Accountants.
13. Auditor’s independence declaration
A copy of the auditor’s independence declaration as required under sect-ion 307C of the Corporations Act 2001 is set out on page 35.
14. Events occurring after reporting date
Subsequent to 30 June 2015, a distribution of 5.5 cents per stapled security has been declared by the Board of Directors. The total distribution amount of $24.3 million will be paid on or before 31 August 2015 in respect of the half year ended 30 June 2015.
Effective 11 August 2015, the Group completed refinancing of its syndicated loan facilities. This has resulted in an increase in the available USD facilities to US$280.0 million (30 June 2015: US$160.0 million) and an extended tenure maturing in equal tranches of three, four and five years respectively. Australian dollar facilities remain at $200.0 million (30 June 2015: $200.0 million) however have been similarly extended to mature in equal tranches of three, four and five years respectively.
Since the end of the financial year, the Directors of the Manager and ALL are not aware of any other matters or circumstances not otherwise dealt with in this report or the financial report that has significantly affected or may significantly affect the operations of the Group, the results of those operations or the state of affairs of the Group in financial years subsequent to the year ended 30 June 2015.
For
per
sona
l use
onl
y

Directors’ report to stapled security holders
32 Ardent Leisure Group | Annual Report 2015
15. Likely developments and expected results of operations
The financial statements have been prepared on the basis of the current known market conditions. The extent to which any potential deterioration in either the capital or physical property markets may have on the future results of the Group is unknown. Such results could include the potential to influence property market valuations, the ability of borrowers, including the Group, to raise or refinance debt, and the cost of such debt and the ability to raise equity.
At the date of this report, and to the best of the Directors’ knowledge and belief, there are no other anticipated changes in the operations of the Group which would have a material impact on the future results of the Group.
16. Indemnification and insurance of officers and auditor
Manager
No insurance premiums are paid for out of the assets of the Trust for insurance provided to either the officers of the Manager or the auditor of the Trust. So long as the officers of the Manager act in accordance with the Trust Constitution and the Corporations Act 2001, the officers remain indemnified out of the assets of the Trust against losses incurred while acting on behalf of the Trust. The auditor of the Trust is in no way indemnified out of the assets of the Trust.
ALL
Under ALL’s Constitution, ALL indemnifies:
All past and present officers of ALL, and persons concerned in or taking part in the management of ALL, against all liabilities incurred by them in their respective capacities in successfully defending proceedings against them; and
All past and present officers of ALL against liabilities incurred by them, in their respective capacities as an officer of ALL, to other persons (other than ALL or its related parties), unless the liability arises out of conduct involving a lack of good faith.
During the reporting period, ALL had in place a policy of insurance covering the Directors and officers against liabilities arising as a result of work performed in their capacity as Directors and officers of ALL. Disclosure of the premiums paid for the insurance policy is prohibited under the terms of the insurance policy.
17. Fees paid to and interests held in the Trust by the Manager or its associates
The interests in the Trust held by the Manager or its related entities as at 30 June 2015 and fees paid to its related entities during the financial year are disclosed in Notes 7 and 36 to the financial statements.
18. Environmental regulations
The Group is subject to significant environmental regulation in respect of its operating activities. During the financial year, the Group’s major businesses were subject to environmental legislation in respect of its operating activities as set out below:
(a) Dreamworld
Dreamworld and WhiteWater World theme parks are subject to various legislative requirements in respect of environmental impacts of their operating activities. The Queensland Environmental Protection Act 1994 regulates all activities where a contaminant may be released into the environment and/or there is a potential for environmental harm or nuisance. In accordance with Schedule 1 of the Environmental Protection Regulation 1998, Dreamworld holds licences or approvals for the operation of a helipad, motor vehicle workshop and train-shed and storage and use of flammable/combustible goods. During the year, Dreamworld and WhiteWater World complied with all requirements of the Act.
The environment committee meets on a bi-monthly basis to pursue environmental projects and improve environmental performance. An energy conservation program was rolled out throughout the organisation. A mobile phone recycling program continued throughout the park as well as other local organisations. Proceeds from the program have also been raised to improve wildlife protection in parts of Africa where mobile phone components are sourced from. A range of existing recycling programs continue to operate effectively, including glass, plastic, waste metals, paper, waste oils and cardboard. A water efficiency management plan continues to operate effectively, with a net reduction of consumption over the past nine years. Staff also carried out voluntary programs aimed at the humane treatment of pests, removal of noxious weeds and other sustainability initiatives. These initiatives were additionally integrated into existing staff training programs to further strengthen environmental culture within the organisation.
For
per
sona
l use
onl
y

Directors’ report to stapled security holders
Ardent Leisure Group | Annual Report 2015 33
18. Environmental regulations (continued)
(a) Dreamworld (continued)
Dreamworld’s noise conservation program ensures that noise emissions emanating from park activities do not contravene State regulations or adversely impact surrounding neighbours. Local government regulations for the staging of night time events and functions were complied with at all times.
Dreamworld’s Life Sciences department is subject to the Quarantine Act 1908. In accordance with the Australian Quarantine Regulations, Dreamworld holds an approved post-arrival facilities licence and an approved zoo permit. In accordance with the Nature Conservation Act 1992 and the Nature Conservation Regulation 1994, Dreamworld holds a “Wildlife Exhibitors Licence” and in accordance with Land Protection (Pest and Stock Route Management) Regulation 2003, Dreamworld holds a "Declared Pest Permit". All licences and permits remain current and Dreamworld has complied fully with the requirements of each.
There are two water licences for the Dreamworld/WhiteWater World property. These relate to water conservation and irrigation. There have been no issues or events of non-compliance recorded by management or the regulatory authorities regarding water use.
(b) d’Albora Marinas
Schedule 1 Environment Protection Licences are held for all five NSW marinas in the portfolio in accordance with the Protection of the Environment Operations Act 1997 (NSW). There are no specific environmental licence requirements in Victoria relating to the Pier 35 or Victoria Harbour marinas.
In July 2002, the NSW Environmental Protection Authority (EPA) was notified of long term historic groundwater contamination at the Rushcutters Bay marina, and the plan to manage the contamination. d’Albora Marinas has been working in consultation with the EPA to rectify the site contamination. The costs to rectify the site are not considered material to the Group.
(c) Bowling centres - Australia
Bowling centres are subject to environmental regulations concerning their food facilities. This is primarily trade waste and grease traps. The Group has adequate management systems and the correct licence requirements in place concerning the disposal of such waste in accordance with each State or Territory’s legislation. Cooking oil is replaced and disposed of by external organisations at all locations.
All hazardous substances are disposed of according to manufacturers’ and EPA regulations. A register of all hazardous substances and dangerous goods is located at centre level.
Lane cleaning and maintenance products are largely water-based products, excluding approach cleaner, which is a solvent-based product. This product is disposed of in accordance with each State and Territory’s EPA requirements.
Noise is adequately monitored for both internal and external environmental breaches. Noise emissions fall within acceptable levels for both residential and industrial areas and all EPA requirements. No complaints have been received since acquisition of the business.
(d) Bowling centres – New Zealand
There are no specific requirements relating to the New Zealand centres that are not reflected in the above statement.
(e) Family entertainment centres – United States of America
Main Event is subject to various Federal, State and local environmental requirements with respect to development of new centres in the United States of America. At a Federal level, the Environmental Protection Agency is responsible for setting national standards for a variety of environmental programs, and delegates to states the responsibility for issuing permits and for monitoring and enforcing compliance.
A prerequisite for any building permit for new centre construction is full compliance with all city and State planning and zoning ordinances. A building permit, depending on locality, may require soils reports, site line studies, storm water and irrigation regulation compliance, asbestos free reports, refuse and grease storage permits, health and food safety permits, and complete Occupational Safety and Health Administration (OSHA) Material Safety Data Sheets (MSDS) documentation.
With respect to operating activities at Main Event, the OSHA requires that MSDS be available to all Main Event employees for explaining potentially harmful chemical substances handled in the workplace under the hazard communication regulation. The MSDS is also required to be made available to local fire departments and local and State emergency planning officials under section 311 of the Emergency Planning and Community Right-to-Know Act.
At this time, there are no known issues of non-compliance with any environmental regulation at Main Event.
For
per
sona
l use
onl
y

Directors’ report to stapled security holders
34 Ardent Leisure Group | Annual Report 2015
18. Environmental regulations (continued)
(f) Goodlife Health Clubs
Goodlife is subject to environmental regulations across the business and has initiatives in place to meet all areas of environmental compliance.
Water conservation is a high priority and management has implemented a range of strategies to meet current water regulations as per each State’s regulations. A recycling program has been implemented across the business, assisting with reduction of waste products and meeting environmental standards.
Hazardous substances and dangerous goods are strictly monitored in the business and, where possible, non-hazardous chemicals are used. All hazardous chemicals and dangerous goods are disposed as per current regulations. All clubs hold site specific chemical registers with safe work methods.
Noise emissions do not contravene State regulations or impact on surrounding business or neighbourhoods.
(g) Greenhouse gas and energy data reporting requirements
The Group is subject to the reporting requirements of both the Energy Efficiency Opportunities Act 2006 and the National Greenhouse and Energy Reporting Act 2007.
The Energy Efficiency Opportunities Act 2006 requires the Group to assess its energy usage, including the identification, investigation and evaluation of energy saving opportunities, and to report publicly on the assessments undertaken, including what action the Group intends to take as a result. The Group continues to meet its obligations under this Act.
The National Greenhouse and Energy Reporting Act 2007 requires the Group to report its annual greenhouse gas emissions and energy use. The Group has implemented systems and processes for the collection and calculation of the data required. The Group submitted its 2013/2014 emissions report under the Act in October 2014. The Group is not subject to any other significant environmental regulations and there are adequate systems in place to manage its environmental responsibilities.
19. Rounding of amounts to the nearest thousand dollars
The Group is a registered scheme of a kind referred to in Class Order 98/100 (as amended) issued by the Australian Securities and Investments Commission relating to the “rounding off” of amounts in the Directors’ report and financial report. Amounts in the Directors’ report and financial report have been rounded to the nearest thousand dollars in accordance with that Class Order, unless otherwise indicated.
This report is made in accordance with a resolution of the Boards of Directors of Ardent Leisure Management Limited and Ardent Leisure Limited.
Neil Balnaves AO Deborah Thomas Chairman Managing Director
Sydney 18 August 2015 F
or p
erso
nal u
se o
nly

PricewaterhouseCoopers, ABN 52 780 433 757Riverside Centre, 123 Eagle Street, BRISBANE QLD 4000, GPO Box 150, BRISBANE QLD 4001T: +61 7 3257 5000, F: +61 7 3257 5999, www.pwc.com.au
Liability limited by a scheme approved under Professional Standards Legislation.
Auditor’s Independence Declaration
As lead auditor for the audit of Ardent Leisure Group for the year ended 30 June 2015, I declare that tothe best of my knowledge and belief, there have been:
a) no contraventions of the auditor independence requirements of the Corporations Act 2001 inrelation to the audit; and
b) no contraventions of any applicable code of professional conduct in relation to the audit.
This declaration is in respect of Ardent Leisure Group, which includes Ardent Leisure Trust andArdent Leisure Limited and the entities they controlled during the period.
Timothy J Allman BrisbanePartnerPricewaterhouseCoopers
18 August 2015
For
per
sona
l use
onl
y

Income Statements for the year ended 30 June 2015
36 Ardent Leisure Group | Annual Report 2015
Income Statements
Note Consolidated
Group Consolidated
Group ALL Group ALL Group 2015 2014 2015 2014 $’000 $’000 $’000 $’000
Income Revenue from operating activities 3 594,603 499,703 594,603 499,703 Management fee income 7(b) - - 1,200 1,200 Valuation gains - property, plant and equipment - 8,590 - - Net gain from derivative financial instruments 6 552 - - - Interest income 121 211 77 99 Gain on sale and leaseback of family entertainment centres 6,959 379 6,959 379
Total income 602,235 508,883 602,839 501,381
Expenses Purchases of finished goods 58,756 46,550 58,756 46,550 Salary and employee benefits 224,843 185,191 225,678 189,397 Borrowing costs 4 11,333 11,330 11,731 8,766 Property expenses 5 99,029 79,539 149,865 138,302 Depreciation and amortisation 54,878 42,043 31,775 21,007 Loss on closure of bowling centres 104 1,579 - - Loss on disposal of assets 523 453 376 460Advertising and promotions 20,771 18,997 20,771 18,997 Repairs and maintenance 26,823 22,222 26,823 22,222 Pre-opening expenses 6,521 2,579 6,521 2,579 Business acquisition costs 1,938 277 1,938 277 Impairment of property, plant and equipment 2,646 - 1,009 -Impairment of goodwill 141 - 141 -Net loss from derivative financial instruments 6 - 613 - -Valuation loss - investment properties 501 - - - Other expenses 8 54,359 45,632 53,436 45,141
Total expenses 563,166 457,005 588,820 493,698
Profit before tax expense 39,069 51,878 14,019 7,683
Withholding tax (income)/expense (182) 159 - - US State tax expense 1,463 724 1,463 724Income tax expense 10 5,666 1,993 5,694 1,903 Profit for the year 32,122 49,002 6,862 5,056
Attributable to: Stapled security holders 32,122 49,002 6,862 5,056 Profit for the year 32,122 49,002 6,862 5,056
The above Income Statements should be read in conjunction with the accompanying notes.
Basic earnings per security/share (cents) 11 7.38 12.13 1.58 1.25Diluted earnings per security/share (cents) 11 7.35 12.05 1.57 1.24
Dividend/distribution in respect of the year ended 30 June 12 55,035 52,657 13,160 - Dividend/distribution per security in respect of the year ended 30 June (cents) 12 12.50 13.00 3.00 -
For
per
sona
l use
onl
y

Statements of Comprehensive Income for the year ended 30 June 2015
Ardent Leisure Group | Annual Report 2015 37
Statements of Comprehensive Income
Note Consolidated
GroupConsolidated
Group ALL Group ALL Group2015 2014 2015 2014
$’000 $’000 $’000 $’000
Profit for the year 32,122 49,002 6,862 5,056
Other comprehensive income Items that may be reclassified to profit and loss Cash flow hedges 30 (958) 434 (75) (30)Foreign exchange translation difference 30 3,623 391 6,916 (942)Income tax relating to these items 30 24 11 24 11
Items that will not be reclassified to profit and loss Gain on revaluation of property, plant and equipment 30 7,541 6,866 - -Other comprehensive income for the year, net of tax 10,230 7,702 6,865 (961)Total comprehensive income for the year, net of tax 42,352 56,704 13,727 4,095
Attributable to: Stapled security holders 42,352 56,704 13,727 4,095
Total comprehensive income for the year, net of tax 42,352 56,704 13,727 4,095
The above Statements of Comprehensive Income should be read in conjunction with the accompanying notes.
For
per
sona
l use
onl
y

Balance Sheets as at 30 June 2015
38 Ardent Leisure Group | Annual Report 2015
Balance Sheets
Note Consolidated
GroupConsolidated
Group ALL Group ALL Group2015 2014 2015 2014
$’000 $’000 $’000 $’000
Current assets
Cash and cash equivalents 33 4,986 7,079 4,685 6,197Receivables 13 10,856 7,416 13,210 7,762Derivative financial instruments 14 263 - - -Inventories 15 11,372 9,378 11,372 9,378Current tax receivables 1,740 - 1,740 -Property held for sale 16 - 10,650 - 10,650Other 17 10,736 8,937 7,026 5,438Total current assets 39,953 43,460 38,033 39,425
Non-current assets Investment properties 18 99,326 95,870 - -Property, plant and equipment 19 609,682 510,162 213,600 123,463Derivative financial instruments 14 114 - - -Livestock 20 245 300 245 300Intangible assets 21 242,944 201,237 242,944 201,237Deferred tax assets 22 4,243 1,978 4,243 1,978Total non-current assets 956,554 809,547 461,032 326,978Total assets 996,507 853,007 499,065 366,403
Current liabilities Payables 23 91,323 69,065 76,287 60,287Derivative financial instruments 14 98 459 - -Interest bearing liabilities 24 - 61 - 61Current tax liabilities 1,291 376 1,291 376Provisions 25 3,236 3,272 3,236 3,272Other 26 2,694 2,155 2,694 2,155Total current liabilities 98,642 75,388 83,508 66,151
Non-current liabilities Derivative financial instruments 14 2,133 1,004 129 48Interest bearing liabilities 24 278,618 260,211 237,006 204,826Provisions 25 15,769 1,625 5,552 1,625Deferred tax liabilities 27 21,863 9,277 21,863 9,277Total non-current liabilities 318,383 272,117 264,550 215,776Total liabilities 417,025 347,505 348,058 281,927Net assets 579,482 505,502 151,007 84,476
Equity Contributed equity 28 605,181 513,912 155,262 16,309Reserves 30 (30,691) (45,918) 7,638 (1,537)Retained profits/(accumulated losses) 31 4,992 37,508 (11,893) (1,655)Total equity attributable to stapled security holders 579,482 505,502 151,007 13,117Non-controlling interests - - - 71,359Total equity 579,482 505,502 151,007 84,476
The above Balance Sheets should be read in conjunction with the accompanying notes.
For
per
sona
l use
onl
y

Statements of Changes in Equity for the year ended 30 June 2015
Ardent Leisure Group | Annual Report 2015 39
Statements of Changes in Equity Retained
NoteContributed
equity Reserves
profits/ (accumulated
losses)
Non-controlling
interests Total
$’000 $’000 $’000 $’000 $’000
Consolidated Group Total equity at 1 July 2013 501,416 (45,817) 31,691 - 487,290
Profit for the year - - 49,002 - 49,002 Other comprehensive income - 7,702 - - 7,702 Total comprehensive income for the year - 7,702 49,002 - 56,704
Transactions with owners in their capacity as owners:Security-based payments 30 - (1,963) - - (1,963) Contributions of equity, net of issue costs 28 8,915 - - - 8,915 Security-based payments - securities/shares issued 28 3,581 - - - 3,581 Distributions paid and payable 31 - - (49,025) - (49,025) Reserve transfers 30, 31 - (5,840) 5,840 - - Total equity at 30 June 2014 513,912 (45,918) 37,508 - 505,502
Profit for the year - - 32,122 - 32,122 Other comprehensive income - 10,230 - - 10,230 Total comprehensive income for the year - 10,230 32,122 - 42,352 Transactions with owners in their capacity as owners:Security-based payments 30 - (3,821) - - (3,821) Contributions of equity, net of issue costs 28 85,786 - - - 85,786 Security-based payments - securities/shares issued 28 5,483 - - - 5,483 Distributions paid and payable 31 - - (55,820) - (55,820) Reserve transfers 30, 31 - 8,818 (8,818) - -
Total equity at 30 June 2015 605,181 (30,691) 4,992 - 579,482
ALL Group Total equity at 1 July 2013 14,202 (576) (2,837) 71,359 82,148
Profit for the year - - 5,056 - 5,056 Other comprehensive income - (961) - - (961) Total comprehensive income for the year - (961) 5,056 - 4,095 Transactions with owners in their capacity as owners:Contributions of equity, net of issue costs 28 1,503 - - - 1,503 Security-based payments - securities/shares issued 28 604 - - - 604 Dividends paid and payable 31 - - (3,874) - (3,874) Total equity at 30 June 2014 16,309 (1,537) (1,655) 71,359 84,476
Profit for the year - - 6,862 - 6,862 Other comprehensive income - 6,865 - - 6,865 Total comprehensive income for the year - 6,865 6,862 - 13,727
Transactions with owners in their capacity as owners:Contributions of equity, net of issue costs 28 15,189 - - - 15,189 Security-based payments - securities/shares issued 28 937 - - - 937 Capital reallocation 28 122,827 - - - 122,827 Reserve transfers 30, 31 - 2,310 (2,310) - - Repayment of non-controlling interests - - - (71,359) (71,359) Dividends paid and payable 31 - - (14,790) - (14,790) Total equity at 30 June 2015 155,262 7,638 (11,893) - 151,007
The above Statements of Changes in Equity should be read in conjunction with the accompanying notes.
For
per
sona
l use
onl
y

Statements of Cash Flows for the year ended 30 June 2015
40 Ardent Leisure Group | Annual Report 2015
Statements of Cash Flows
Note Consolidated
GroupConsolidated
Group ALL Group ALL Group 2015 2014 2015 2014
$’000 $’000 $’000 $’000
Cash flows from operating activities Receipts from customers 650,383 549,659 651,136 550,257 Payments to suppliers and employees (436,132) (367,238) (433,864) (369,765) Property expenses paid (96,189) (79,704) (92,330) (76,501) Interest received 121 211 77 99 Rent payments to the Trust - - (115,766) (111,296)
Receipts of funds for property costs from the Trust - - 58,922 50,464 US withholding tax paid (140) (143) - - Income tax paid (2,691) (5,317) (2,691) (5,317) Net cash flows from operating activities 34(a) 115,352 97,468 65,484 37,941
Cash flows from investing activities Payments for property, plant and equipment and other intangibles (133,965) (86,337) (115,862) (72,317) Purchase of assets for the Trust - - (19,108) (14,516) Receipt of funds for assets purchased on behalf of the Trust - - 18,387 16,100 Proceeds from sale of plant and equipment 628 226 270 102 Proceeds from sale of land and buildings 41,719 10,278 41,719 10,278 Payments for purchase of businesses, net of cash acquired (33,322) (11,736) (31,195) (10,145) Net cash flows from investing activities (124,940) (87,569) (105,789) (70,498)
Cash flows from financing activities Proceeds from borrowings 2,084,223 1,925,688 984,102 726,852 Repayments of borrowings (2,095,274) (1,890,351) (978,076) (699,738) Borrowing costs (10,937) (10,870) (11,797) (8,600) Proceeds from issue of stapled securities 70,000 - 11,698 - Costs of issue of stapled securities (993) (3) (167) (1) Dividends paid to the Trust - - (1,630) (3,874) Proceeds from loans from the Trust - - 125,104 94,288 Repayments of borrowings to the Trust - - (76,839) (82,520) Repayments of principal on finance leases (61) (249) (61) (249) Distributions paid to stapled security holders (39,041) (40,107) (13,160) - Net cash flows from financing activities 7,917 (15,892) 39,174 26,158
Net decrease in cash and cash equivalents (1,671) (5,993) (1,131) (6,399) Cash and cash equivalents at the beginning of the year 7,079 12,953 6,197 12,481
Effect of exchange rate changes on cash and cash equivalents (422) 119 (381) 115 Cash at the end of the year 33 4,986 7,079 4,685 6,197
The above Statements of Cash Flows should be read in conjunction with the accompanying notes. For
per
sona
l use
onl
y

Notes to the Financial Statements for the year ended 30 June 2015
Ardent Leisure Group | Annual Report 2015 41
Notes to the financial statements 1. Summary of significant accounting policies
Ardent Leisure Group (Group or Consolidated Group) is a ‘stapled’ entity comprising of Ardent Leisure Trust (Trust) and its controlled entities, and Ardent Leisure Limited (ALL or Company) and its controlled entities. The units in the Trust are stapled to shares in the Company. The stapled securities cannot be traded or dealt with separately. The stapled securities of the Group are listed on the Australian Securities Exchange (ASX).
The significant policies which have been adopted in the preparation of these consolidated financial statements for the year ended 30 June 2015 are set out below. These policies have been consistently applied to the years presented, unless otherwise stated.
(a) Basis of preparation
As permitted by Class Order 05/642, issued by the Australian Securities and Investments Commission (ASIC), this financial report is a combined report that presents the consolidated financial statements and accompanying notes of both the Ardent Leisure Group and the Ardent Leisure Limited Group (ALL Group).
The financial report of Ardent Leisure Group comprises the consolidated financial report of Ardent Leisure Trust and its controlled entities, including Ardent Leisure Limited and its controlled entities.
The financial report of Ardent Leisure Limited Group comprises the consolidated financial report of Ardent Leisure Limited and its controlled entities.
These general purpose financial statements have been prepared in accordance with the requirements of the Trust Constitution, Australian Accounting Standards and Interpretations issued by the Australian Accounting Standards Board, and the Corporations Act 2001.
Ardent Leisure Group is a for-profit entity for the purposes of preparing financial statements.
These consolidated financial statements have been presented in accordance with ASIC Class Order 13/1050 as amended by ASIC Class Order 13/1644. These Class Orders allow the presentation of consolidated financial statements covering all the entities in a stapled group. There are no non-controlling interests that are attributable to the stapled security holders.
Compliance with IFRS as issued by the IASB Compliance with Australian Accounting Standards ensures that the financial statements comply with International Financial Reporting Standards (IFRS) as issued by the International Accounting Standards Board (IASB). Consequently, these financial statements have also been prepared in accordance with and comply with IFRS as issued by the IASB.
New and amended standards adopted by the Group The Group has applied the following new and amended standards for first time for the annual reporting period commencing 1 July 2014:
AASB 2014-1 Part A – Amendments to Australian Accounting Standards – Annual Improvements 2010-2012 and 2011-2013 Cycles (containing amendments to AASB 2, AASB 3, AASB 8, AASB 13, AASB 116, AASB 124, AASB 138 and AASB 140);
AASB 2014-1 Part B – Amendments to Australian Accounting Standards – Defined Benefit Plans: Employee Contributions;
AASB 2014-2 Amendments to AASB 1053 – Transition to and between Tiers, and related Tier 2 Disclosure Requirements; and
AASB 2013-4 Amendments to Australian Accounting Standards - Novation of Derivatives and Continuation of Hedge Accounting.
The adoption of AASB 2014 amendments has had an impact on disclosures only and there has been no further impact to the financial statements as a result of the new or amended accounting standards.
For
per
sona
l use
onl
y

Notes to the Financial Statements for the year ended 30 June 2015
42 Ardent Leisure Group | Annual Report 2015
1. Summary of significant accounting policies (continued)
(a) Basis of preparation (continued)
Historical cost convention The financial statements have been prepared under the historical cost convention, as modified by the revaluation of investment properties, property, plant and equipment and derivative financial instruments held at fair value.
Critical accounting estimates The preparation of financial statements in conformity with Australian Accounting Standards may require the use of certain critical accounting estimates and management to exercise its judgement in the process of applying the Group’s accounting policies. Other than the estimation of fair values described in Notes 1(f), 1(g), 1(j), 1(m), 1(p), 1(s)(v), 1(s)(vi), 1(ab) and 1(ac) and assumptions related to deferred tax assets and liabilities, impairment testing of goodwill and Director valuations for some property, plant and equipment and investment properties, no key assumptions concerning the future, or other estimation of uncertainty at the reporting date, have a significant risk of causing material adjustments to the financial statements in the next annual reporting period.
Deficiency of current assets As at 30 June 2015, the Group and ALL Group had deficiencies of current assets of $58.7 million (2014: $31.9 million) and $45.5 million (2014: $26.7 million) respectively. Due to the nature of the business, the majority of sales are for cash whereas purchases are on credit resulting in a negative working capital position. Surplus cash is used to repay external loans, resulting in a deficiency of current assets at 30 June 2015. The Group has $128.6 million (2014: $65.7 million) of unused loan capacity at 30 June 2015 which can be drawn on as required. The ALL Group has $171.0 million (2014: $256.8 million) of unused capacity in its bank loans and its loans with the Trust which can be utilised to fund any deficiency in its net current assets. Refer to Note 24.
(b) Principles of consolidation
As the Trust is deemed to be the parent entity under Australian Accounting Standards, a consolidated financial report has been prepared for the Group as well as a consolidated financial report for the ALL Group. The consolidated financial report of the Group combines the financial report for the Trust and ALL Group for the year. Transactions between the entities have been eliminated in the consolidated financial reports of the Group and ALL Group. Accounting for the Group is carried out in accordance with Australian Accounting Standards.
Controlled entities are all those entities (including special purpose entities) over which the Group has the power to govern the financial and operating policies, generally accompanying an equity holding of more than one half of the voting rights. The existence and effect of potential voting rights that are currently exercisable or convertible are considered when assessing whether the Group controls another entity.
Controlled entities are fully consolidated from the date on which control is transferred to the Group. They are deconsolidated from the date that control ceases.
The acquisition method of accounting is used to account for the acquisition of controlled entities by the Group (refer to Note 1(ac)).
The Group treats transactions with non-controlling interests that do not result in a loss of control as transactions with equity owners of the Group. A change in ownership interest results in an adjustment between the carrying amounts of the controlling and non-controlling interests to reflect their relative interests in the subsidiary. Any difference between the amount of the adjustment to non-controlling interests and any consideration paid or received is recognised in a separate reserve within equity attributable to owners of Ardent Leisure Group.
When the Group ceases to have control, joint control or significant influence, any retained interest in the entity is remeasured to its fair value with the change in carrying amount recognised in profit or loss. The fair value is the initial carrying amount for the purposes of subsequently accounting for the retained interest as an associate, jointly controlled entity or financial asset. In addition, any amounts previously recognised in other comprehensive income in respect of that entity are accounted for as if the Group had directly disposed of the related assets or liabilities. This may mean that amounts previously recognised in other comprehensive income are reclassified to profit or loss.
If the ownership interest in an associate or a jointly controlled entity is reduced but joint control or significant influence is retained, only a proportionate share of the amounts previously recognised in other comprehensive income are reclassified to profit or loss where appropriate.
For
per
sona
l use
onl
y

Notes to the Financial Statements for the year ended 30 June 2015
Ardent Leisure Group | Annual Report 2015 43
1. Summary of significant accounting policies (continued)
(b) Principles of consolidation (continued)
The Group applies a policy of treating transactions with non-controlling interests as transactions with parties external to the Group. Disposals to non-controlling interests result in gains and losses for the Group that are recorded in the Income Statement. Purchases from non-controlling interests result in goodwill, being the difference between any consideration paid and the relevant share acquired of the carrying value of identifiable net assets of the subsidiary.
Inter-entity transactions, balances and unrealised gains on transactions between Group entities are eliminated. Unrealised losses are also eliminated unless the transaction provides evidence of the impairment of the asset transferred. Accounting policies of subsidiaries have been changed where necessary to ensure consistency with the policies adopted by the Group.
A business segment is a group of assets and operations engaged in providing products or services that are subject to risks and returns that are different to those of other business segments.
(c) Cash and cash equivalents
For Statement of Cash Flows presentation purposes, cash and cash equivalents includes cash on hand, deposits held at call with financial institutions, other short term, highly liquid investments with original maturities of three months or less that are readily convertible to known amounts of cash and which are subject to an insignificant risk of changes in value, and bank overdrafts.
(d) Receivables
Trade receivables are initially recognised at fair value and subsequently measured at amortised cost using the effective interest rate method less provision for doubtful debts. They are presented as current assets unless collection is not expected for more than 12 months after the reporting date. The collectability of debts is reviewed on an ongoing basis. Debts which are known to be uncollectible are written off in the period in which they are identified. A provision for doubtful debts is raised where there is objective evidence that the Group will not collect all amounts due. The amount of the provision is the difference between the carrying amount and estimated future cash flows. Cash flows relating to current receivables are not discounted.
The amount of any impairment loss is recognised in the Income Statement within other expenses. When a trade receivable for which a provision has been recognised becomes uncollectible in a subsequent period, it is written off against the provision. Subsequent recoveries of amounts previously written off are credited against other expenses in the Income Statement.
(e) Inventories
Inventories are valued at the lower of cost and net realisable value. Cost of goods held for resale is determined by weighted average cost. Cost of catering stores (which by nature are perishable) and other inventories is determined by purchase price.
(f) Investment properties
Investment properties comprise investment interests in land and buildings (including integral plant and equipment) held for the purposes of letting to produce rental income.
Initially, investment properties are measured at cost including transaction costs. Subsequent to initial recognition, the investment properties are then stated at fair value. Gains and losses arising from changes in the fair values of investment properties are included in the Income Statement in the period in which they arise.
At each reporting date, the fair values of the investment properties are assessed by the Manager by reference to independent valuation reports or through appropriate valuation techniques adopted by the Manager. Fair value is determined assuming a long term property investment. Specific circumstances of the owner are not taken into account.
The use of independent valuers is on a progressive basis over a three year period, or earlier, where the Manager believes there may be a material change in the carrying value of the property.
Where an independent valuation is obtained, the valuer considers the valuation under both the discounted cash flow (DCF) method and the income capitalisation method, with the adopted value generally being a mid-point of the valuations determined under these methods.
Under the DCF method, a property’s fair value is estimated using the explicit assumptions regarding the benefits and liabilities of ownership over the asset’s life. The DCF method involves the projection of a series of cash flows on the property. To this projected cash flow series, an appropriate, market-derived discount rate is applied to establish the present value of the income stream associated with the property.
Under the income capitalisation method, the total income receivable from the property is assessed and this is capitalised in perpetuity to derive a capital value, with allowances for capital expenditure required.
For
per
sona
l use
onl
y

Notes to the Financial Statements for the year ended 30 June 2015
44 Ardent Leisure Group | Annual Report 2015
1. Summary of significant accounting policies (continued)
(f) Investment properties (continued)
Where an independent valuation is not obtained, factors taken into account where appropriate, by the Directors in determining fair value may include:
assuming a willing buyer and a willing seller, without duress and an appropriate time to market the property to maximise price; information obtained from valuers, sales and leasing agents, market research reports, vendors and potential purchasers; capitalisation rates used to value the asset, market rental levels and lease expiries; changes in interest rates; asset replacement values; discounted cash flow models; available sales evidence; and comparisons to valuation professionals performing valuation assignments across the market.
As the fair value method has been adopted for investment properties, the buildings and any component thereof are not depreciated. Taxation allowances for the depreciation of buildings and plant and equipment are claimed by the Trust and contribute to the tax deferred component of distributions.
(g) Property, plant and equipment
Revaluation model The revaluation model of accounting is used for land and buildings, and major rides and attractions. All other classes of property, plant and equipment (PPE) are carried at historic cost. Initially, PPE are measured at cost. For assets carried under the revaluation model, PPE is carried at a revalued amount, being its fair value at the date of revaluation less any subsequent accumulated depreciation and subsequent accumulated impairment losses. Revaluations are made with sufficient regularity to ensure that the carrying amount does not differ materially from that which would be determined using fair value at the reporting date.
Increases in the carrying amounts arising on revaluation of PPE are credited, net of tax, to other reserves in equity. To the extent that the increase reverses a decrease previously recognised in profit or loss, the increase is first recognised in profit or loss. Decreases that reverse previous increases of the same asset are first charged against the asset revaluation reserve directly in equity to the extent of the remaining reserve attributable to the asset; all other decreases are charged to the Income Statement. Each year, the difference between depreciation based on the revalued carrying amount of the asset is charged to the Income Statement and depreciation based on the asset’s original cost, net of tax, is transferred from the asset revaluation reserve to retained profits.
At each reporting date, the fair values of PPE are assessed by the Manager by reference to independent valuation reports or through appropriate valuation techniques adopted by the Manager. Fair value is determined assuming a long term property investment. Specific circumstances of the owner are not taken into account.
The use of independent valuers is on a progressive basis over a three year period, or earlier, where the Manager believes there may be a material change in the carrying value of the property.
Where an independent valuation is not obtained, factors taken into account where appropriate, by the Directors in determining fair value may include:
assuming a willing buyer and a willing seller, without duress and an appropriate time to market the property to maximise price; information obtained from valuers, sales and leasing agents, market research reports, vendors and potential purchasers; capitalisation rates used to value the asset, market rental levels and lease expiries; changes in interest rates; asset replacement values; discounted cash flow models; available sales evidence; and comparisons to valuation professionals performing valuation assignments across the market. F
or p
erso
nal u
se o
nly

Notes to the Financial Statements for the year ended 30 June 2015
Ardent Leisure Group | Annual Report 2015 45
1. Summary of significant accounting policies (continued)
(g) Property, plant and equipment (continued)
Depreciation Land is not depreciated. Depreciation on other assets is calculated using the straight-line method to allocate their cost or revalued amounts, net of their residual values, over their estimated useful lives as follows:
2015 2014
Buildings 40 years 40 yearsLeasehold improvements Over life of lease Over life of leaseMajor rides and attractions 20 - 40 years 20 - 40 yearsPlant and equipment 4 - 25 years 4 - 25 years Furniture, fittings and equipment 3 - 13 years 4 - 13 yearsMotor vehicles 8 years 8 years
The assets’ residual values and useful lives are reviewed, and adjusted if appropriate, at each reporting date. An asset’s carrying amount is written down immediately to its recoverable amount if the asset’s carrying amount is greater than its estimated recoverable amount (refer to Note 1(m)).
Gains and losses on disposals are determined by comparing proceeds with carrying amount. These are included in the Income Statement. When revalued assets are sold, it is Group policy to transfer the amounts included in reserves in respect of those assets to retained profits.
(h) Leases
Where the Group has substantially all the risks and rewards of ownership, leases of property, plant and equipment are classified as finance leases. Finance leases are capitalised at inception at the lower of the fair value of the leased property and the present value of the minimum lease payments. The corresponding rental obligations, net of finance charges, are included in interest bearing liabilities. Each lease payment is allocated between the liability and finance cost. The finance cost is charged to the Income Statement over the lease period so as to produce a constant periodic rate of interest on the remaining balance of the liability for each period. The PPE acquired under finance leases are depreciated over the shorter of the asset’s useful life and the lease term.
Leases in which a significant portion of the risks and rewards of ownership are retained by the lessor are classified as operating leases. Payments made under operating leases (net of any incentives received from the lessor) are charged to the Income Statement on a straight-line basis over the period of the lease. Lease income from operating leases where the Group is a lessor is recognised in income on a straight-line basis over the lease term.
(i) Investments and other financial assets
Loans and receivables are non-derivative financial assets with fixed or determinable payments that are not quoted in an active market. They arise when the Group provides money, goods or services directly to a debtor with no intention of selling the receivable. They are included in current assets, except for those with maturities greater than 12 months after the reporting date which are classified as non-current assets. Loans and receivables are carried at amortised cost using the effective interest rate method. The Group assesses at each reporting date whether there is objective evidence that a financial asset or group of financial assets is impaired.
(j) Assets held for sale
Assets are classified as held for sale and stated at the lower of their carrying amount, and fair value less costs to sell, if their carrying amount will be recovered principally through a sale transaction rather than through continuing use and a sale is considered highly probable.
An impairment loss is recognised for any initial or subsequent write-down of the asset to fair value less costs to sell. A gain is recognised for any subsequent increases in fair value less costs to sell of an asset, but not in excess of any cumulative impairment loss previously recognised. A gain or loss not previously recognised by the date of the sale of the asset is recognised at the date of derecognition.
Assets are not depreciated or amortised while they are classified as held for sale. Assets classified as held for sale are presented separately from the other assets in the Balance Sheet.
For
per
sona
l use
onl
y

Notes to the Financial Statements for the year ended 30 June 2015
46 Ardent Leisure Group | Annual Report 2015
1. Summary of significant accounting policies (continued)
(k) Livestock
Livestock is stated at historical cost less depreciation. Historical cost includes expenditure that is directly attributable to the acquisition of the animals. The fair value of the livestock is not materially different to its carrying value.
Depreciation on livestock is calculated using the straight-line method to allocate their cost or revalued amounts, net of their residual values, over the useful lives of the assets which range from 5 - 50 years (2014: 5 - 50 years).
(l) Intangible assets
(i) Customer relationships Customer relationships acquired are amortised over the period during which the benefits are expected to be received, which is four years (2014: four years). The amortisation charge is weighted towards the first year of ownership where the majority of economic benefits arise.
(ii) Brands Brands acquired are amortised on a straight-line basis over the period during which benefits are expected to be received, which is between 10 - 13 years (2014: 10 - 13 years).
(iii) Other intangible assets Liquor licences are amortised over the length of the licences which are between 10 - 16 years (2014: 10 - 16 years), depending on the length of the licence. Software is amortised on a straight-line basis over the period during which the benefits are expected to be received, which is between 5 - 8 years (2014: 5 – 7 years).
(iv) Goodwill Goodwill is measured as described in Note 1(ac). Goodwill on acquisitions of subsidiaries is included in intangible assets. Goodwill on acquisitions of associates is included in investments in associates. Goodwill is not amortised but it is tested for impairment annually, or more frequently if events or changes in circumstances indicate that it might be impaired, and is carried at cost less accumulated impairment losses. Gains and losses on the disposal of an entity include the carrying amount of goodwill relating to the entity sold.
Goodwill is allocated to cash-generating units for the purposes of impairment testing (refer to Note 1(m)). The allocation is made to those cash-generating units or groups of cash-generating units that are expected to benefit from the business combination in which the goodwill arose, identified according to operating segments (refer to Note 37).
(m) Impairment of assets
Goodwill and intangible assets that have an indefinite useful life are not subject to amortisation and are tested annually for impairment or more frequently if events or changes in circumstances indicate that they might be impaired. Other assets are reviewed for impairment whenever events or changes in circumstances indicate that the carrying amount may not be recoverable.
An impairment loss is recognised for the amount by which the asset’s carrying amount exceeds its recoverable amount. The recoverable amount is the higher of an asset’s fair value less costs to sell, and its value in use. For the purposes of assessing impairment, assets are grouped at the lowest levels for which there are separately identifiable cash inflows which are largely independent of the cash inflows from other assets or groups of assets (cash-generating units). Non-financial assets other than goodwill that suffered impairment are reviewed for possible reversal of the impairment at each reporting date.
(n) Payables
Liabilities are recognised for amounts to be paid in the future for goods or services received, whether or not billed to the Group. The amounts are unsecured and are usually paid within 30 - 60 days of recognition. Trade payables are presented as current liabilities unless payment is not due within 12 months from the reporting date. They are recognised initially at fair value and subsequently measured at amortised cost using the effective interest rate method. F
or p
erso
nal u
se o
nly

Notes to the Financial Statements for the year ended 30 June 2015
Ardent Leisure Group | Annual Report 2015 47
1. Summary of significant accounting policies (continued)
(o) Interest bearing liabilities
Borrowings are initially recognised at fair value, net of transaction costs incurred and are subsequently measured at amortised cost. Any difference between the proceeds (net of transaction costs) and the redemption amount is recognised in the Income Statement over the period of the borrowing using the effective interest rate method. Fees paid on the establishment of loan facilities, which are not an incremental cost relating to the actual drawdown of the facility, are recognised as prepayments and amortised on a straight-line basis over the term of the facility.
Finance leases are recognised as interest bearing liabilities to the extent that the Group retains substantially all the risks and rewards of ownership.
Interest bearing liabilities are classified as current liabilities unless the Group has an unconditional right to defer settlement of the liability for at least 12 months after the end of the reporting period.
(p) Derivatives
Derivatives are initially recognised at fair value on the date a derivative contract is entered into and are subsequently remeasured to their fair value at each reporting date. The method of recognising the resulting gain or loss depends on whether the derivative is designated as a hedging instrument if hedging criteria are met, and if so, the nature of the item being hedged. The Group may designate certain derivatives as either hedges of exposures to variability in cash flows associated with future interest payments on variable rate debt (cash flow hedges) or hedges of net investments in foreign operations (net investment hedges).
The Group documents at the inception of the hedging transaction the relationship between the hedging instruments and hedged items, as well as its risk management objective and strategy for undertaking various hedge transactions. The Group also documents its assessment, both at hedge inception and on an ongoing basis, of whether the derivatives that are used in hedging transactions have been and will continue to be highly effective in offsetting changes in fair values or cash flows of hedged items.
The fair values of various derivative financial instruments used for hedging purposes are disclosed in Note 14. Movements in the cash flow hedge reserve in equity are shown in Note 30. The full fair value of a hedging derivative is classified as a non-current asset or liability when the remaining maturity is more than 12 months. They are classified as current assets or liabilities when the remaining maturity of the hedged item is less than 12 months. Trading derivatives are classified as current assets or liabilities.
(i) Derivatives that do not qualify for hedge accounting Certain derivative instruments do not qualify for hedge accounting. Changes in the fair value of any derivative instrument that does not qualify for hedge accounting are recognised immediately in the Income Statement.
(ii) Cash flow hedges The effective portion of changes in the fair value of derivatives that are designated and qualify as cash flow hedges is recognised in other comprehensive income and accumulated in reserves in equity. The gain or loss relating to the ineffective portion is recognised immediately in the Income Statement. Amounts accumulated in equity are recycled in the Income Statement in the period when the hedged item impacts the Income Statement.
When a hedging instrument expires or is sold or terminated, or when a hedge no longer meets the criteria for hedge accounting, any cumulative gain or loss existing in equity at that time remains in equity and is recognised when the forecast transaction is ultimately recognised in the Income Statement. When a forecast transaction is no longer expected to occur, the cumulative gain or loss that was reported in equity is immediately transferred to the Income Statement.
(iii) Net investment hedges The effective portion of changes in the fair value of derivatives that are designated and qualify as net investment hedges is recognised in other comprehensive income and accumulated in reserves in equity. This amount will be reclassified to the Income Statement on disposal of the foreign operation. The gain or loss relating to the ineffective portion is recognised immediately in the Income Statement. Gains and losses accumulated in equity are included in the Income Statement when the foreign operation is partially disposed of or sold. F
or p
erso
nal u
se o
nly

Notes to the Financial Statements for the year ended 30 June 2015
48 Ardent Leisure Group | Annual Report 2015
1. Summary of significant accounting policies (continued)
(q) Borrowing costs
Borrowing costs are recognised as expenses using the effective interest rate method, except where they are included in the costs of qualifying assets.
Borrowing costs include interest on short term and long term borrowings, amortisation of ancillary costs incurred in connection with the arrangement of borrowings and finance lease charges.
Borrowing costs associated with the acquisition or construction of a qualifying asset are capitalised as part of the cost of that asset. Borrowing costs not associated with qualifying assets, are expensed in the Income Statement.
The capitalisation rate used to determine the amount of borrowing costs to be capitalised is the weighted average interest rate applicable to the Group’s outstanding borrowings during the year. The average capitalisation rate used was 4.16% per annum (2014: 4.37% per annum) for Australian dollar debt and 1.54% per annum (2014: 1.51% per annum) for US dollar debt.
(r) Provisions
Provisions are recognised when the Group has a present legal or constructive obligation as a result of past events, it is probable that an outflow of resources will be required to settle the obligation, and the amount can be reliably estimated.
Where there are a number of similar obligations, the likelihood that an outflow will be required in settlement is determined by considering the class of obligations as a whole. A provision is recognised even if the likelihood of an outflow with respect to any one item included in the same class of obligations may be small.
Provisions are measured at the present value of management’s best estimate of the expenditure required to settle the present obligation at the reporting date. The discount rate used to determine the present value reflects current market assessments of the time value of money and the risks specific to the liability. The increase in the provision due to the passage of time is recognised as interest expense.
(s) Employee benefits
(i) Wages and salaries, annual leave and sick leave Liabilities for wages and salaries, including non-monetary benefits, annual leave and accumulating sick leave expected to be settled within 12 months of the reporting date are recognised in other payables in respect of employees' services up to the reporting date and are measured at the amounts expected to be paid when the liabilities are settled. Liabilities for non-accumulating sick leave are recognised when the leave is taken and measured at the rates paid or payable.
(ii) Long service leave The liability for long service leave is recognised in the provision for employee benefits and measured as the present value of expected future payments to be made in respect of services provided by employees up to the reporting date using the projected unit credit method. Consideration is given to expected future wage and salary levels, experience of employee departures and periods of service. Where amounts are not expected to be settled within 12 months, expected future payments are discounted to their net present value using market yields at the reporting date on high quality corporate bonds, except when there is no deep market in which case market yields on national government bonds are used, with terms to maturity and currency that match, as closely as possible, to the estimated future cash outflows.
The obligations are presented as current liabilities in the Balance Sheet if the Group does not have an unconditional right to defer settlement for at least 12 months after the reporting date, regardless of when the actual settlement is expected to occur.
(iii) Profit sharing and bonus plans The Group recognises a provision where contractually obliged or where there is a past practice that has created a constructive obligation.
(iv) Termination benefits Termination benefits are payable when employment is terminated before the normal retirement date, or when an employee accepts voluntary redundancy in exchange for these benefits. The Group recognises termination benefits when it is demonstrably committed to either terminating the employment of current employees according to a detailed formal plan without possibility of withdrawal or to providing termination benefits as a result of an offer made to encourage voluntary redundancy. Benefits falling due more than 12 months after the end of the reporting period are discounted to present value.
For
per
sona
l use
onl
y

Notes to the Financial Statements for the year ended 30 June 2015
Ardent Leisure Group | Annual Report 2015 49
1. Summary of significant accounting policies (continued)
(s) Employee benefits (continued)
(v) Long Term Incentive Plan (LTIP)
Australian employees
Since 1 July 2009, long term incentives have been provided to certain executives under the LTIP. Under the terms of the LTIP and the initial grant, employees may be granted performance rights, of which one third will vest two years after grant date, one third will vest three years after grant date and one third will vest four years after grant date. The percentage of performance rights which will vest is subject to the performance of the Group relative to its peer group, which is the ASX Small Industrials Index. The first set of performance rights were granted under the scheme on 4 December 2009, with the first vesting date being the day after the full year results announcement for the year ended 30 June 2011.
The characteristics of the LTIP indicate that, at the Ardent Leisure Group level, it is an equity settled share-based payment under AASB 2 Share-based Payment as the holders are entitled to the securities as long as they meet the LTIP’s service and performance criteria. However, as ALL is considered to be a subsidiary of the Trust, in the financial statements of the ALL Group the LTIP is accounted for as a cash settled share-based payment.
The fair value of the performance rights granted under the LTIP is recognised in the Group financial statements as an employee benefit expense with a corresponding increase in equity. The fair value of the performance rights at grant date is determined using a Monte Carlo simulation valuation model and then recognised over the vesting period during which employees become unconditionally entitled to the underlying securities.
The fair value of the performance rights granted under the LTIP is recognised in the ALL Group financial statements as an employee benefit expense with a corresponding increase in liabilities. The fair value of each grant of the performance rights is determined at each reporting date using a Monte Carlo simulation valuation model, with the movement in fair value of the liability being recognised in the Income Statement.
At each reporting date, the estimate of the number of performance rights that are expected to vest is revised. The employee benefit expense recognised each period takes into account the most recent estimate.
US employees
Due to previous restrictions on the issue of securities to US residents, those US executives eligible for the LTIP were subject to a shadow performance rights scheme whereby a cash payment was made instead of performance rights being granted. At the end of the vesting period for each grant of performance rights, a calculation is made of the number of performance rights which would have been granted and payment is made based on the Group stapled security volume weighted average price (VWAP) for the five trading days immediately following the vesting date. Due to the nature of the scheme, this scheme is considered to be a cash settled share-based payment under AASB 2. Following steps taken to issue equity to US resident employees, all new performance rights issued after 1 July 2014 will be settled in equity upon vesting in future periods. As such, these performance rights are considered to be equity settled shared-based payments under AASB 2.
The fair value of cash settled performance rights is determined at grant date and each reporting date using a Monte Carlo simulation valuation model. This is recorded as a liability, with the difference in the movement in the fair value of the financial liability being recognised in the Income Statement.
The fair value of equity settled performance rights is determined at grant date using a Monte Carlo simulation valuation model. This is recorded as an employee benefit expense with a corresponding increase in equity.
At each reporting date, the estimate of the number of performance rights that are expected to vest is revised. The employee benefit expense recognised each period takes into account the most recent estimate.
(vi) Deferred Short Term Incentive Plan (DSTI)
Australian employees
Since 1 July 2010, long term incentives have been provided to executives under the DSTI. Under the terms of the DSTI, employees may be granted DSTI performance rights, of which one half will vest one year after grant date and one half will vest two years after grant date. The first set of performance rights were granted under the DSTI on 16 December 2010, with the first vesting date being the day after the full year results announcement for the year ended 30 June 2011.
The characteristics of the DSTI indicate that, at the Ardent Leisure Group level, it is an equity settled share-based payment under AASB 2 Shared-based Payment as the holders are entitled to the securities as long as they meet the DSTI’s service criteria. However, as ALL is considered to be a subsidiary of the Trust, in the financial statements of the ALL Group the DSTI is accounted for as a cash settled share-based payment.
For
per
sona
l use
onl
y

Notes to the Financial Statements for the year ended 30 June 2015
50 Ardent Leisure Group | Annual Report 2015
1. Summary of significant accounting policies (continued)
(s) Employee benefits (continued)
(vi) Deferred Short Term Incentive Plan (DSTI) (continued)
Australian employees (continued)
The fair value of the performance rights granted under the DSTI is recognised in the Group financial statements as an employee benefit expense with a corresponding increase in equity. The fair value of each grant of performance rights is determined at grant date using a binomial tree valuation model and then recognised over the vesting period during which employees become unconditionally entitled to the underlying securities.
The fair value of the performance rights granted under the DSTI is recognised in the ALL Group financial statements as an employee benefit expense with a corresponding increase in liabilities. The fair value of each grant of performance rights is determined at each reporting date using a binomial tree valuation model with the movement in fair value of the liability being recognised in the Income Statement.
At each reporting date, the estimate of the number of performance rights that are expected to vest is revised. The employee benefit expense recognised each period takes into account the most recent estimate.
US employees
Due to previous restrictions on the issue of securities to US residents, those US executives eligible for the DSTI were subject to a shadow performance rights scheme whereby a cash payment was made instead of performance rights being granted. At the end of the vesting period, the number of performance rights which would have vested is multiplied by the Group VWAP for the five trading days immediately following the vesting date and an equivalent cash payment is made. Due to the nature of the scheme, this is considered to be a cash settled share-based payment under AASB 2. All new performance rights issued after 1 July 2014 will be settled in equity upon vesting in future periods. As such, the performance rights are considered to be equity settled share-based payments under AASB 2. In the ALL financial statements, all performance rights issued to US employees are considered to be cash settled.
The fair value of each cash settled performance rights is determined at grant date and each reporting date using a binomial tree valuation model. This is recorded as a liability with the difference in the movement in the fair value of the financial liability being recognised in the Income Statement.
The fair value of equity settled performance rights is determined at grant date using a binomial tree valuation model. This is recorded as an employee benefit expense with a corresponding increase in equity.
At each reporting date, the estimate of the number of performance rights that are expected to vest is revised. The employee benefit expense recognised each period takes into account the most recent estimate.
(t) Tax
The Trust is not subject to income tax. However, both of its controlled entities, Ardent Leisure (NZ) Trust and ALL Group, are subject to income tax.
Under current Australian income tax legislation, the Trust is not liable to pay income tax provided its income, as determined under the Trust Constitution, is fully distributed to unit holders, by way of cash or reinvestment. The liability for capital gains tax that may otherwise arise if the Australian properties were sold is not accounted for in these financial statements, as the Trust expects to distribute such amounts to its unit holders.
The income tax expense or revenue for the period is the tax payable on the current period's taxable income based on the applicable income tax rate for each jurisdiction adjusted by changes in deferred tax assets and liabilities attributable to temporary differences and to unused tax losses.
The current income tax charge is calculated on the basis of the tax laws enacted or substantively enacted at the end of the reporting period in the countries where the Company's subsidiaries and associates operate and generate taxable income. Management periodically evaluates positions taken in tax returns with respect to situations in which applicable tax regulation is subject to interpretation. It establishes provisions where appropriate on the basis of amounts expected to be paid to the tax authorities.
Deferred income tax is provided in full, using the liability method, on temporary differences arising between the tax bases of assets and liabilities and their carrying amounts in the consolidated financial statements. However, deferred tax liabilities are not recognised if they arise from the initial recognition of goodwill. Deferred income tax is also not accounted for if it arises from initial recognition of an asset or liability in a transaction other than a business combination that at the time of the transaction affects neither accounting nor taxable profit or loss. Deferred income tax is determined using tax rates (and laws) that have been enacted or substantially enacted by the end of the reporting period and are expected to apply when the related deferred income tax asset is realised or the deferred income tax liability is settled.
For
per
sona
l use
onl
y

Notes to the Financial Statements for the year ended 30 June 2015
Ardent Leisure Group | Annual Report 2015 51
1. Summary of significant accounting policies (continued)
(t) Tax (continued)
Deferred tax assets are recognised for deductible temporary differences and unused tax losses only if it is probable that future taxable amounts will be available to utilise those temporary differences and losses.
Deferred tax liabilities and assets are not recognised for temporary differences between the carrying amount and tax bases of investments in foreign operations where the Company is able to control the timing of the reversal of the temporary differences and it is probable that the differences will not reverse in the foreseeable future.
Deferred tax assets and liabilities are offset when there is a legally enforceable right to offset current tax assets and liabilities and when the deferred tax balances relate to the same taxation authority. Current tax assets and tax liabilities are offset where the entity has a legally enforceable right to offset and intends either to settle on a net basis, or to realise the asset and settle the liability simultaneously.
Ardent Leisure Limited and its wholly-owned Australian controlled entities have implemented the tax consolidation legislation as of 8 February 2005. As a consequence, these entities are taxed as a single entity and the deferred tax assets and liabilities of these entities are set off in the consolidated financial statements.
Current and deferred tax is recognised in profit or loss, except to the extent that it relates to items recognised in other comprehensive income or directly in equity. In this case, the tax is also recognised in other comprehensive income or directly in equity respectively.
Companies within the Group may be entitled to claim special tax deductions for investments in qualifying assets (investment allowances). The Group accounts for such allowances as tax credits. This means that the allowance reduces income tax payable and current tax expense. A deferred tax asset is recognised for unclaimed tax credits that are carried forward as deferred tax assets.
(u) Goods and services tax (GST)
Revenues, expenses and assets are recognised net of the amount of associated GST, unless the GST incurred is not recoverable from the taxation authority. In this case, it is recognised as part of the cost of acquisition of the asset or as part of the expense.
Receivables and payables are stated inclusive of the amount of GST receivable or payable. The net amount of GST recoverable from, or payable to, the taxation authority is included with other receivables or payables in the Balance Sheet.
Cash flows are presented on a gross basis. The GST components of cash flows arising from investing or financing activities which are recoverable from or payable to the taxation authority, are presented as operating cash flow.
(v) Equity
Incremental costs directly attributable to the issue of new stapled securities or options are recognised directly in equity as a reduction in the proceeds of stapled securities to which the costs relate. Incremental costs directly attributable to the issue of new stapled securities or options for the acquisition of a business are not included in the cost of the acquisition as part of the purchase consideration.
(w) Reserves
In accordance with the Trust Constitution, amounts may be transferred from reserves or contributed equity to fund distributions.
(x) Revenue
Revenue is measured at the fair value of the consideration received or receivable. Amounts disclosed as revenue are net of returns, trade allowances and amounts collected on behalf of third parties. The Group recognises revenue when the amount of revenue can be reliably measured, it is probable that further economic benefits will flow to the entity and specific criteria have been met for each of the Group’s activities as described below. Revenue is recognised for the major business activities as follows:
(i) Rendering of services Revenue from rendering of services including health club memberships, theme park and SkyPoint entry and bowling games is recognised when the outcome can be reliably measured and the service has taken place. Where health club membership is for a fixed period and paid in advance, the revenue is recognised on a straight-line basis over the membership period. Revenue relating to theme park annual passes is recognised as the passes are used.
For
per
sona
l use
onl
y

Notes to the Financial Statements for the year ended 30 June 2015
52 Ardent Leisure Group | Annual Report 2015
1. Summary of significant accounting policies (continued)
(x) Revenue (continued)
(ii) Sale of goods Revenue from sale of goods including merchandise and food and beverage items is recognised when the risks and rewards of ownership have passed to the buyer.
(iii) Rental revenue Rental income represents income earned from the sub-lease of investment properties leased by the Group, and is brought to account on a straight-line basis over the lease term.
(iv) Interest income Interest income is recognised on a time proportion basis using the effective interest rate method. When a receivable is impaired, the Group reduces the carrying amount to its recoverable amount, being the estimated future cash flow discounted at the original effective interest rate of the instrument, and continues unwinding the discount as interest income. Interest income on impaired loans is recognised using the original effective interest rate.
(y) Foreign currency translation
(i) Functional and presentation currencies Items included in the financial statements of each of the Group’s entities are measured using the currency of the primary economic environment in which the entity operates (functional currency). The consolidated financial statements are presented in Australian dollars, which is the Group’s functional and presentation currency.
(ii) Transactions and balances Foreign currency transactions are translated into the functional currency using the exchange rates prevailing at the dates of the transactions. Foreign exchange gains and losses resulting from the settlement of such transactions and from the translation at year end exchange rates of monetary assets and liabilities denominated in foreign currencies are recognised in the Income Statement, except when deferred in equity as qualifying cash flow hedges and qualifying net investment hedges or they are attributable to part of the net investment in a foreign operation.
(iii) Foreign operations Assets and liabilities of foreign controlled entities are translated at exchange rates ruling at reporting date while income and expenses are translated at average exchange rates for the period. Exchange differences arising on translation of the interests in foreign controlled entities are taken directly to the foreign currency translation reserve. On consolidation, exchange differences on loans denominated in foreign currencies, where the loan is considered part of the net investment in that foreign operation, are taken directly to the foreign currency translation reserve. At 30 June 2015, the spot rate used was A$1.00 = NZ$1.1294 (2014: A$1.00 = NZ$1.0762) and A$1.00 = US$0.7680 (2014: A$1.00 = US$0.9430). The average spot rate during the year ended 30 June 2015 was A$1.00 = NZ$1.0801 (2014: A$1.00 = NZ$1.1021) and A$1.00 = US$0.8288 (2014: A$1.00 = US$0.9113).
(z) Segment information
Segment income, expenditure, assets and liabilities are those that are directly attributable to a segment and the relevant portion that can be allocated to the segment on a reasonable basis. Segment assets include all assets used by a segment and consist primarily of cash, receivables (net of any related provisions) and investments. Any assets used jointly by segments are allocated based on reasonable estimates of usage.
Operating segments are reported in a manner consistent with the internal reporting provided to the chief operating decision maker. The chief operating decision maker, who is responsible for allocating resources and assessing performance of the operating segments, has been identified as the Board of Directors.
The main income statement items used by management to assess each of the divisions are divisional revenue and divisional EBITDA before property costs and after property costs. In addition, depreciation and amortisation are analysed by division. Each of these income statement items is looked at after adjusting for pre-opening expenses, straight lining of fixed rent increases, IFRS depreciation, onerous lease costs, amortisation of intangible assets and impairment of property, plant and equipment and intangible assets and other non-recurring realised items. As shown in Note 11, these items are excluded from management’s definition of core earnings.
For
per
sona
l use
onl
y

Notes to the Financial Statements for the year ended 30 June 2015
Ardent Leisure Group | Annual Report 2015 53
1. Summary of significant accounting policies (continued)
(aa) Earnings per stapled security
Basic earnings per stapled security are determined by dividing profit by the weighted average number of ordinary stapled securities on issue during the period.
Diluted earnings per stapled security are determined by dividing the profit by the weighted average number of ordinary stapled securities and dilutive potential ordinary stapled securities on issue during the period.
(ab) Fair value estimation
The Group measures financial instruments, such as derivatives, and non-financial assets such as investment properties, at fair value at each balance date.
Fair value is the price that would be received to sell an asset or paid to transfer a liability in an orderly transaction between market participants at the measurement date. The fair value measurement is based on the presumption that the transaction to sell the asset or transfer the liability takes place either:
In the principal market for the asset or liability; or In the absence of a principal market, in the most advantageous market for the asset or liability.
The principal or the most advantageous market must be accessible by the Group.
The fair value of an asset or liability is measured using the assumptions that market participants would use when pricing the asset or liability, assuming that market participants act in their economic best interest.
A fair value measurement of a non-financial asset takes into account a market participant’s ability to generate economic benefits by using the asset in its highest and best use or by selling it to another market participant that would use the asset in its highest and best use.
The Group uses valuation techniques that are appropriate in the circumstances and for which sufficient data is available to measure fair value, maximising the use of relevant observable inputs and minimising the use of unobservable inputs.
The fair value of financial instruments traded in active markets is based on quoted market prices at the reporting date. The quoted market price used for financial assets held by the Group is the current bid price; the appropriate quoted market price for financial liabilities is the current ask price.
The fair value of financial instruments that are not traded in an active market is determined using valuation techniques. The Group uses a variety of methods and makes assumptions that are based on market conditions existing at each reporting date. Quoted market prices or dealer quotes for similar instruments are used for long term debt instruments held. Other techniques, such as estimated discounted cash flows, are used to determine fair value for the remaining financial instruments. The fair value of interest rate swaps is calculated as the present value of the estimated future cash flows. The fair value of forward exchange contracts is determined using forward exchange market rates at the reporting date.
The nominal value less estimated credit adjustments of trade receivables and payables approximate their fair values. The fair value of financial liabilities for disclosure purposes is estimated by discounting the future contractual cash flows at the current market interest rate that is available to the Group for similar financial instruments.
(ac) Business combinations
The acquisition method of accounting is used to account for all business combinations, including business combinations involving entities or businesses under common control, regardless of whether equity instruments or other assets are acquired. The consideration transferred for the acquisition of a business comprises the fair values of the assets transferred, the liabilities incurred and the equity interests issued by the Group. The consideration transferred also includes the fair value of any contingent consideration arrangement and the fair value of any pre-existing equity interest in the subsidiary.
Acquisition related costs are expensed as incurred. Identifiable assets acquired and liabilities and contingent liabilities assumed in a business combination are, with limited exceptions, measured initially at their fair values at the acquisition date. On an acquisition by acquisition basis, the Group recognises any non-controlling interest in the acquiree either at fair value or at the non-controlling interest’s proportionate share of the acquiree’s net identifiable assets.
For
per
sona
l use
onl
y

Notes to the Financial Statements for the year ended 30 June 2015
54 Ardent Leisure Group | Annual Report 2015
1. Summary of significant accounting policies (continued)
(ac) Business combinations (continued)
The excess of the consideration transferred, the amount of any non-controlling interest in the acquiree and the acquisition date fair value of any previous equity interest in the acquiree over the fair value of the Group’s share of the net identifiable assets acquired is recorded as goodwill. If those amounts are less than the fair value of the net identifiable assets of the business acquired and the measurement of all amounts has been reviewed, the difference is recognised directly in profit or loss as a gain on acquisition.
Where settlement of any part of cash consideration is deferred, the amounts payable in the future are discounted to their present value as at the date of exchange. The discount rate used is the entity’s incremental borrowing rate, being the rate at which a similar borrowing could be obtained from an independent financier under comparable terms and conditions. Contingent consideration is classified either as equity or a financial liability. Amounts classified as a financial liability are subsequently remeasured to fair value with changes in fair value recognised in profit or loss.
Goodwill acquired is not deductible for tax.
(ad) Dividends/distributions
Provision is made for the amount of any dividend/distribution declared, being appropriately authorised and no longer at the discretion of the entity, on or before the end of the financial year but not distributed at the reporting date.
(ae) Convertible notes
A subsidiary of ALL, Ardent Leisure Note Issuer Pty Limited, previously issued convertible notes to the Trust. Due to the terms associated with these notes, the notes were classified as equity in the financial statements of the ALL Group. Given that this equity was not payable to the shareholders of ALL, the notes were included in equity attributable to non-controlling interests. The convertible notes have been repaid as a result of the capital reallocation between the Trust and the Company during the year. Refer to Note 28 for more information.
(af) Parent entity financial information
The financial information for the parent entity of the Group (Ardent Leisure Trust) and ALL Group (Ardent Leisure Limited) has been prepared on the same basis as the consolidated financial statements, except as set out below:
(i) Investments in subsidiaries, associates and jointly controlled entities Investments in subsidiaries, associates and jointly controlled entities are accounted for at cost in the financial statements of the parent entities. Dividends received from associates and jointly controlled entities are recognised in the parent entity’s profit or loss, rather than being deducted from the carrying amount of these investments.
(ii) Tax consolidation legislation Ardent Leisure Limited and its wholly-owned Australian controlled entities have implemented the tax consolidation legislation. The head entity, Ardent Leisure Limited, and the controlled entities in the tax consolidated group account for their own current and deferred tax amounts. These tax amounts are measured as if each entity in the tax consolidated group continues to be a standalone taxpayer in its own right.
In addition to its own current and deferred tax amounts, Ardent Leisure Limited also recognises the current tax liabilities (or assets) and the deferred tax assets arising from unused tax losses and unused tax credits assumed from controlled entities in the tax consolidated group.
The entities have also entered into a tax funding agreement under which the wholly-owned entities fully compensate Ardent Leisure Limited for any current tax payable assumed and are compensated by Ardent Leisure Limited for any current tax receivable and deferred tax assets relating to unused tax losses or unused tax credits that are transferred to Ardent Leisure Limited under the tax consolidation legislation. The funding amounts are determined by reference to the amounts recognised in the wholly-owned entities' financial statements.
The amounts receivable/payable under the tax funding agreement are due upon receipt of the funding advice from the head entity, which is issued as soon as practicable after the end of each financial year. The head entity may also require payment of interim funding amounts to assist with its obligations to pay tax instalments.
Assets or liabilities arising under tax funding agreements with the tax consolidated entities are recognised as current amounts receivable from or payable to other entities in the group. Any difference between the amounts assumed and amounts receivable or payable under the tax funding agreement are recognised as a contribution to (or distribution from) wholly-owned tax consolidated entities.
For
per
sona
l use
onl
y

Notes to the Financial Statements for the year ended 30 June 2015
Ardent Leisure Group | Annual Report 2015 55
1. Summary of significant accounting policies (continued)
(af) Parent entity financial information (continued)
(iii) Financial guarantees Where the parent entity has provided financial guarantees in relation to loans and payables of subsidiaries for no compensation, the fair values of these guarantees are accounted for as contributions and recognised as part of the cost of the investment.
(iv) Share-based payments The grant by the parent entity of options over its equity instruments to the employees of subsidiary undertakings in the Group is treated as a capital contribution to that subsidiary undertaking. The fair value of employee services received, measured by reference to the grant date fair value, is recognised over the vesting period as an increase to investment in subsidiary undertakings, with a corresponding credit to equity.
(ag) New accounting standards, amendments and interpretations
Certain new standards, amendments and interpretations to existing standards have been published that are mandatory for the Group for accounting periods beginning on or after 1 July 2015 but which the Group has not yet adopted. Based on a review of these standards, the majority of the standards yet to be adopted are not expected to have a significant impact on the financial statements of the Group. The Group’s and the parent entity’s assessment of the impact of those new standards, amendments and interpretations which may have an impact is set out below:
AASB 9 Financial Instruments, AASB 2009-11 Amendments to Australian Accounting Standards arising from AASB 9 and AASB 2010-7 Amendments to Australian Accounting Standards arising from AASB 9 (effective from 1 January 2018)
AASB 9 Financial Instruments addresses the classification and measurement of financial assets and may affect the Group’s and the ALL Group’s accounting for its financial assets. The standard is not applicable until 1 January 2018 but is available for early adoption. The Group is yet to assess its full impact. However, initial indications are that there should be no material impact on the Group’s or the ALL Group’s financial statements. The Group and the ALL Group do not intend to adopt AASB 9 before its operative date, which means that it would be first applied in the annual reporting period ending 30 June 2019.
AASB 15 Revenue from Contracts with Customers (effective from 1 January 2017)
The IASB has issued a new standard for the recognition of revenue. This will replace IAS 18 Revenue which covers contracts for goods and services and IAS 11 Construction Contracts which covers construction contracts. The group has not yet considered the impact of the new rules on its revenue recognition policies. It will undertake a detailed assessment in the near future. The group will assess whether to adopt AASB 15 before its operative date; if not it would be first applied in the annual reporting period ending 30 June 2018.
Early adoption of standards
The Group has not elected to apply any pronouncements before their operative date in the annual reporting period beginning 1 July 2015.
(ah) Rounding
The Group is a registered scheme of a kind referred to in Class Order 98/100 (as amended) issued by the Australian Securities and Investments Commission relating to the “rounding off” of amounts in the financial report. Amounts in the financial report have been rounded to the nearest thousand dollars in accordance with that Class Order, unless otherwise indicated.
For
per
sona
l use
onl
y

Notes to the Financial Statements for the year ended 30 June 2015
56 Ardent Leisure Group | Annual Report 2015
Ardent Leisure Trust and Ardent Leisure Limited formation
The Trust was established on 6 February 1998. On 23 December 2005, the Manager executed a supplemental deed poll to amend the Trust Constitution. The amendments removed the 80 year life of the Trust, to enable the units on issue to be classified as equity under Australian Accounting Standards. ALL was incorporated on 28 April 2003. The Manager and ALL entered into the stapling deed effective 1 July 2003.
Revenue from operating activities
ConsolidatedGroup
Consolidated Group ALL Group ALL Group
2015 2014 2015 2014 $’000 $’000 $’000 $’000
Revenue from services 426,872 365,085 426,872 365,085
Revenue from sale of goods 131,380 102,070 131,380 102,070Revenue from rentals 35,956 32,108 35,956 32,108Other revenue 395 440 395 440
Revenue from operating activities 594,603 499,703 594,603 499,703
Borrowing costs
ConsolidatedGroup
Consolidated Group ALL Group ALL Group
2015 2014 2015 2014 $’000 $’000 $’000 $’000
Borrowing costs paid or payable 11,580 11,674 12,049 8,985Less: capitalised borrowing costs (573) (344) (357) (219)Provisions: unwinding of discount 326 - 39 -
Borrowing costs expensed 11,333 11,330 11,731 8,766
For details of the fair value of borrowings, refer to Note 39 (c).
5. Property expenses
ConsolidatedGroup
Consolidated Group ALL Group ALL Group
2015 2014 2015 2014 $’000 $’000 $’000 $’000
Landlord rent and outgoings 90,467 74,870 149,865 138,302
Insurance 685 607 - -Rates 3,665 2,541 - -Land tax 807 899 - -Onerous lease expense 2,598 - - -Other 807 622 - -
99,029 79,539 149,865 138,302
For
per
sona
l use
onl
y

Notes to the Financial Statements for the year ended 30 June 2015
Ardent Leisure Group | Annual Report 2015 57
Net gain/(loss) from derivative financial instruments
ConsolidatedGroup
Consolidated Group
ALL Group ALL Group
2015 2014 2015 2014
$’000 $’000 $’000 $’000
Net gain/(loss) on derivatives - unrealised 552 (613) - -
552 (613) - -
Management fees
The Manager of the Trust is Ardent Leisure Management Limited.
The Manager’s registered office and principal place of business are Level 16, 61 Lavender Street, Milsons Point, NSW 2061.
(a) Base management fee
The management fee is based on an allocation of costs incurred by ALL and its controlled entities to manage the Trust but is eliminated in the aggregated results of the Group.
(b) Management fee calculation
The management fee earned by the Manager during the year is detailed as follows:
ConsolidatedGroup
Consolidated Group ALL Group ALL Group
2015 2014 2015 2014 $’000 $’000 $’000 $’000
Base management fee - - 1,200 1,200
- - 1,200 1,200
For
per
sona
l use
onl
y

Notes to the Financial Statements for the year ended 30 June 2015
58 Ardent Leisure Group | Annual Report 2015
Other expenses
ConsolidatedGroup
ConsolidatedGroup ALL Group ALL Group
2015 2014 2015 2014 $’000 $’000 $’000 $’000
Audit fees 653 585 437 397 Consulting fees 1,789 878 1,789 878 Consumables 3,075 2,612 3,075 2,612 Custodian fees 101 109 - - Electricity 15,882 14,325 15,882 14,325 Fuel and oil 1,187 1,076 1,187 1,076 Insurance 3,609 2,424 3,609 2,424 Legal fees 725 382 724 368 Merchant fees 10,214 8,210 10,214 8,210 Motor vehicles 1,088 1,048 1,088 1,048 Permits and fees 4,921 4,528 4,899 4,492 Printing, stationery and postage 2,765 2,643 2,765 2,643 Registry fees 184 163 184 163 Stapled security holder communication costs 171 167 171 167 Stock exchange costs 165 114 165 114 Taxation fees 239 210 212 187 Telephone 2,226 1,872 2,226 1,872 Training 1,434 1,395 1,434 1,395 Travel costs 2,729 1,808 2,729 1,808 Valuation fees 70 114 - - Other 1,132 969 646 962 54,359 45,632 53,436 45,141
Remuneration of auditor
During the financial year, the auditor of the Group, PricewaterhouseCoopers (PwC), earned the following remuneration:
Consolidated Group
Consolidated Group ALL Group ALL Group
2015 2014 2015 2014 $ $ $ $
Audit and other assurance services - PwC Australia 533,268 506,360 316,339 317,777 Audit and other assurance services - related practices of PwC Australia 120,198 78,477 120,198 78,477Taxation services - PwC Australia 27,105 23,192 - - Taxation services - related practices of PwC Australia 212,088 186,923 212,088 186,923 Other services - PwC Australia 1,530 1,500 1,530 1,500 894,189 796,452 650,155 584,677
For
per
sona
l use
onl
y

Notes to the Financial Statements for the year ended 30 June 2015
Ardent Leisure Group | Annual Report 2015 59
Income tax expense
(a) Income tax expense
Note Consolidated
GroupConsolidated
Group ALL Group ALL Group2015 2014 2015 2014
$’000 $’000 $’000 $’000
Current tax (2,581) 4,290 (2,593) 4,200Deferred tax 8,354 (1,532) 8,354 (1,532)Over provided in prior year (107) (765) (67) (765)
5,666 1,993 5,694 1,903
Income tax expense is attributable to: Profit from continuing operations 5,666 1,993 5,694 1,903
Deferred income tax (benefit)/expense included in income tax expense comprises: (Increase)/decrease in deferred tax assets 22 (6,732) 328 (6,732) 328Increase/(decrease) in deferred tax liabilities 27 15,086 (1,860) 15,086 (1,860) 8,354 (1,532) 8,354 (1,532)
(b) Numerical reconciliation of income tax expense to prima facie tax expense
Profit from continuing operations before income tax expense 39,069 51,878 14,019 7,683Less: Profit from the trusts1 (35,279) (48,330) - -Prima facie profit 3,790 3,548 14,019 7,683
Tax at the Australian tax rate of 30% (2014: 30%) 1,137 1,064 4,206 2,305
Tax effects of amounts which are not deductible/(taxable) in calculating taxable income: Entertainment 92 54 92 54 Non-deductible depreciation and amortisation 3,331 2,569 - - Sundry items (114) (1,311) 136 (77) Employee security plans 281 181 281 181 Business acquisition costs 581 78 581 78Foreign exchange conversion differences 42 (53) 42 (53)US State taxes (348) (246) (348) (246)Withholding tax and research and development credit (275) (63) (275) (63)Difference in overseas tax rates 1,046 485 1,046 489Over provided in prior year (107) (765) (67) (765)Income tax expense 5,666 1,993 5,694 1,903
1 Profits relating to the trusts are largely distributed to unit holders via distributions and are subject to tax upon receipt of this distribution income by the unit holders.
(c) Income tax benefit relating to items of other comprehensive income
Unrealised loss on derivative financial instruments recognised in the cash flow hedge reserve 22, 30 (24) (11) (24) (11) (24) (11) (24) (11)
For
per
sona
l use
onl
y

Notes to the Financial Statements for the year ended 30 June 2015
60 Ardent Leisure Group | Annual Report 2015
10. Income tax expense (continued)
(d) Unrecognised temporary differences
There are no unrecognised temporary differences as at 30 June 2015 (2014: nil).
(e) Tax consolidation legislation
ALL and its wholly-owned Australian controlled entities have implemented the tax consolidation legislation as of 8 February 2005. The accounting policy in relation to this legislation is set out in Note 1(t).
On adoption of the tax consolidation legislation, the entities in the tax consolidated group entered into a tax sharing agreement which, in the opinion of the Directors, limits the joint and several liability of the wholly-owned entities in the case of a default by the head entity, ALL.
The entities have also entered into a tax funding agreement under which the wholly-owned entities fully compensate ALL for any current tax payable assumed and are compensated by ALL for any current tax receivable and deferred tax assets relating to unused tax losses or unused tax credits that are transferred to ALL under the tax consolidation legislation. The funding amounts are determined by reference to the amounts recognised in the wholly-owned entities’ financial statements.
The amounts receivable/payable under the tax funding agreement are payable upon demand by the head entity. The head entity may also require payment of interim funding amounts to assist with its obligations to pay tax instalments. The funding amounts are netted off in the non-current intercompany payables.
Earnings per security/share
ConsolidatedGroup
Consolidated Group ALL Group ALL Group
2015 2014 2015 2014
Basic earnings per security/share (cents) 7.38 12.13 1.58 1.25 Diluted earnings per security/share (cents) 7.35 12.05 1.57 1.24
Core earnings per security (cents) 12.92 14.40 N/A N/A Diluted core earnings per security (cents) 12.86 14.30 N/A N/A
Earnings used in the calculation of basic and diluted earnings per security/share ($'000) 32,122 49,002 6,862 5,056
Earnings used in the calculation of core earnings per security (refer to calculation in table below) ($'000) 56,234 58,153 N/A N/A
Weighted average number of stapled securities on issue used in the calculation of basic and core earnings per security/share ('000) 435,208 403,868 435,208 403,868
Weighted average number of stapled securities held by ALL employees under employee share plans (refer to Note 29) ('000) 2,069 2,848 2,069 2,848
Weighted average number of stapled securities on issue used in the calculation of diluted earnings per security/share ('000) 437,277 406,716 437,277 406,716
For
per
sona
l use
onl
y

Notes to the Financial Statements for the year ended 30 June 2015
Ardent Leisure Group | Annual Report 2015 61
11. Earnings per security/share (continued)
Calculation of core earnings
The table below outlines the Manager’s adjustments to profit under Australian Accounting Standards to determine the amount the Manager believes should be available for distribution for the current year. The Manager uses this amount as guidance for distribution determination.
Core earnings is a financial measure which is not prescribed by Australian Accounting Standards and represents the profit under Australian Accounting Standards (statutory profit) adjusted for certain unrealised and non-cash items, reserve transfers and one off realised items. Under the Trust Constitution, the amount distributed to stapled security holders by the Trust is at the discretion of the Manager. Management will use the core earnings calculated for assessing the performance of the Group and as a guide to assessing an appropriate distribution to declare. This measure is considered more relevant than statutory profit as it represents an estimate of the underlying recurring cash earnings of the Group and provides more meaningful comparison between financial years.
The adjustments between profit under Australian Accounting Standards and core earnings may change from time to time depending on changes to accounting standards and the Manager’s assessment as to whether non-recurring or infrequent items (such as realised gains on the sale of properties) will be distributed to stapled security holders.
Consolidated Group
Consolidated Group
2015 2014 $’000 $’000
Profit used in calculating earnings per stapled security 32,122 49,002 Unrealised items
- Unrealised net (gain)/loss on derivative financial instruments (552) 613 - Valuation loss - investment properties 501 - - Valuation gains - property, plant and equipment - (8,590) - Impairment - property, plant and equipment 2,646 -- Impairment - goodwill 141 -
Non-cash items - Straight lining of fixed rent increases 2,336 1,546 - IFRS depreciation(1) 11,102 8,562- Amortisation of health club brands and customer relationship intangible assets 6,778 6,333
One off realised items - Pre-opening expenses 6,521 2,579- Business acquisition costs 1,938 277 - Onerous lease costs 2,598 - - Gain on sale and leaseback of family entertainment centres (6,959) (379) - Loss on closure of bowling centres 104 1,579Tax impact of above adjustments (3,042) (3,369)
Core earnings 56,234 58,153
(1) IFRS depreciation represents depreciation recorded under Australian Accounting Standards effective 1 July 2005 on property, plant and equipment which were previously classified as investment properties.
For
per
sona
l use
onl
y

Notes to the Financial Statements for the year ended 30 June 2015
62 Ardent Leisure Group | Annual Report 2015
Distributions and dividends paid and payable
(a) Consolidated Group
The following dividends and distributions were paid and payable by the Group to stapled security holders:
Dividend Distribution Distribution Distribution
CGTcents per cents per Total tax concession Distribution
stapled stapled amount deferred amount Taxable security security $’000 % % %
2015 dividends and distributions for the half year ended: 31 December 2014 3.00 4.00 30,707 30 June 2015* - 5.50 24,328
3.00 9.50 55,035 30.87 - 69.13
2014 distributions for the half year ended: 31 December 2013 - 6.80 27,544 30 June 2014** - 6.20 25,113
- 13.00 52,657 35.17 - 64.83
* The distribution of 5.50 cents per stapled security for the half year ended 30 June 2015 was not declared prior to 30 June 2015. Refer to Note 44. ** The distribution of 6.20 cents per stapled security for the half year ended 30 June 2014 was not declared prior to 30 June 2014.
(b) ALL Group
During the year, a subsidiary of ALL paid to the Trust $1.6 million (2014: $3.9 million) relating to convertible notes which were classified as equity under Australian Accounting Standards. A fully franked dividend of 3.0 cents (2014: nil) per stapled security was paid from the ALL Group totalling $13.2 million (2014: nil) during the current financial year.
(c) Franking credits
The tax consolidated group has franking credits of $3,414,276 (2014: $6,709,050). It is the tax consolidated group’s intention to distribute these franking credits to security holders where possible.
Receivables
ConsolidatedGroup
Consolidated Group ALL Group ALL Group
2015 2014 2015 2014 $’000 $’000 $’000 $’000
Trade receivables 11,315 7,938 11,315 7,938Receivable from the Trust - - 2,354 346Provision for doubtful debts (459) (522) (459) (522) 10,856 7,416 13,210 7,762
The Group has recognised an expense of $199,959 in respect of bad and doubtful trade receivables during the year ended 30 June 2015 (2014: $121,948). The expense has been included in other expenses in the Income Statement.
For
per
sona
l use
onl
y

Notes to the Financial Statements for the year ended 30 June 2015
Ardent Leisure Group | Annual Report 2015 63
Derivative financial instruments
ConsolidatedGroup
Consolidated Group ALL Group ALL Group
2015 2014 2015 2014 $’000 $’000 $’000 $’000
Current assets Forward foreign exchange contracts 263 - - - 263 - - -
Non-current assets Forward foreign exchange contracts 114 - - - 114 - - -
Current liabilities Forward foreign exchange contracts - 11 - -Interest rate swaps 98 448 - - 98 459 - -
Non-current liabilities Forward foreign exchange contracts - 9 - -Interest rate swaps 2,133 995 129 48 2,133 1,004 129 48
Forward foreign exchange contracts
The Group has entered into forward foreign exchange contracts to buy US dollars and sell Australian dollars. These contracts total A$2.1 million (2014: A$4.6 million).
The forward contracts do not qualify for hedge accounting and accordingly, changes in fair value of these contracts are recorded in the Income Statement. Notwithstanding the accounting outcome, the Manager considers that these derivative contracts are appropriate and effective in offsetting the economic foreign exchange exposures of the Group.
Interest rate swaps
The Group has entered into interest rate swap agreements totalling $70.0 million (2014: $100.0 million) and US$47.0 million (2014: US$30.0 million) that entitle it to receive interest, at quarterly intervals, at a floating rate on a notional principal and obliges it to pay interest at a fixed rate. The interest rate swap agreements allow the Group to raise long term borrowings at a floating rate and effectively swap them into a fixed rate. The Group also has forward starting interest rate swaps totalling $90.0 million (2014: $40.0 million) with start dates from June 2017 and end dates to June 2018.
With the exception of one $40.0 million swap, all interest rate swap contracts qualify as cash flow hedges. Accordingly, the change in fair value of these swaps is recorded in the cash flow hedge reserve. Amounts accumulated in equity are recycled in the Income Statement in the period when the hedged item impacts the Income Statement. For the one swap which does not qualify as a cash flow hedge, the changes in fair value are recorded directly in the Income Statement. Notwithstanding the accounting outcome, the Manager considers that these derivative contracts are appropriate and effective in offsetting the economic foreign exchange exposures of the Group and the ALL Group.
For
per
sona
l use
onl
y

Notes to the Financial Statements for the year ended 30 June 2015
64 Ardent Leisure Group | Annual Report 2015
14. Derivative financial instruments (continued)
Interest rate swaps (continued)
The table below shows the maturity profile of the interest rate swaps:
ConsolidatedGroup
Consolidated Group ALL Group ALL Group
2015 2014 2015 2014$’000 $’000 $’000 $’000
Less than 1 year 40,000 60,000 - -1 - 2 years 111,198 40,000 39,063 -2 - 3 years 70,000 71,813 - 31,8133 - 4 years - - - -4 - 5 years - - - -More than 5 years - - - -
221,198 171,813 39,063 31,813
Inventories
ConsolidatedGroup
Consolidated Group ALL Group ALL Group
2015 2014 2015 2014 $’000 $’000 $’000 $’000
Goods held for resale 11,392 9,398 11,392 9,398Provision for diminution (20) (20) (20) (20) 11,372 9,378 11,372 9,378
There was no reversal of write-downs of inventories recognised as a benefit during the year ended 30 June 2015 (2014: nil).
Property held for sale
ConsolidatedGroup
Consolidated Group ALL Group ALL Group
2015 2014 2015 2014 $’000 $’000 $’000 $’000
Family entertainment centres - 10,650 - 10,650
- 10,650 - 10,650
Consolidated
GroupConsolidated
Group ALL Group ALL Group2015 2014 2015 2014
$’000 $’000 $’000 $’000
Opening balance 10,650 4,210 10,650 4,210Transfer from property, plant and equipment - 9,741 - 9,741Additions 19,551 6,725 19,551 6,725Foreign exchange movements 4,163 (168) 4,163 (168)Disposals (34,364) (9,858) (34,364) (9,858)Closing balance - 10,650 - 10,650
During the year, the Group disposed of three family entertainment centres at Tulsa and Oklahoma City, Oklahoma and San Antonio West, Texas, being previously held for sale. The three centres were disposed of through sale and leaseback transactions.
For
per
sona
l use
onl
y

Notes to the Financial Statements for the year ended 30 June 2015
Ardent Leisure Group | Annual Report 2015 65
Other assets
ConsolidatedGroup
Consolidated Group ALL Group ALL Group
2015 2014 2015 2014 $’000 $’000 $’000 $’000
Prepayments 6,779 6,685 3,069 3,186Accrued revenue 3,957 2,252 3,957 2,252
10,736 8,937 7,026 5,438
Investment properties
Consolidated Group
Property Note Valuer Cost
Cumulative revaluation
(decrements)/increments
Consolidated book value Cost
Cumulative revaluation
(decrements)/increments
Consolidated book value
2015 2015 2015 2014 2014 2014 $’000 $’000 $’000 $’000 $’000 $’000
Excess land at Dreamworld (a) (1) 2,875 (975) 1,900 2,874 (462) 2,412Marinas (b) (2) 77,594 19,832 97,426 73,638 19,820 93,458Total 80,469 18,857 99,326 76,512 19,358 95,870
(a) The remaining excess land has been valued by Directors at $1.9 million (2014: $2.4 million). (b) The total carrying value of d’Albora Marinas (including plant and equipment of $7.8 million (2014: $7.8 million)) is $105.2 million (2014: $101.3 million). The
fair value was assessed to be $105.2 million (2014: $101.3 million). (1) Robert Tye, CBRE Valuations Pty Limited, independently valued the excess land on Foxwell Road, Coomera at 31 December 2014 at $1.1 million. The
remaining excess land has been valued by the Directors at 31 December 2014 at $0.8 million. (2) Adam Ellis, LandMark White (Sydney) Pty Limited, independently valued two of the seven properties at 30 June 2015. The remaining five properties were
last independently valued at 30 June 2014.
Refer to Note 39(b) for information on the valuation techniques used to derive the fair value of the investment properties.
A reconciliation of the carrying amount of investment properties at the beginning and end of the current year is set out below:
ConsolidatedGroup
Consolidated Group ALL Group ALL Group
2015 2014 2015 2014
$’000 $’000 $’000 $’000
Carrying amount at the beginning of the year 95,870 95,232 - -Additions 3,957 638 - -Revaluation decrements (501) - - -
Carrying amount at the end of the year 99,326 95,870 - -
Amounts recognised in the Income Statement for investment properties:
Revenue from investment properties 18,085 18,186 - -Property expenses incurred on investment properties (2,615) (2,548) - - At 30 June 2015, the Group had receivables from third parties totalling $332,646 (2014: $648,709) relating to leases on its investment properties. F
or p
erso
nal u
se o
nly

Notes to the Financial Statements for the year ended 30 June 2015
66 Ardent Leisure Group | Annual Report 2015
Property, plant and equipment
Consolidated Group
Property Note
Cost less accumulated depreciation
Cumulative revaluation increments/
(decrements)
Consolidated book value
Cost less accumulated depreciation
Cumulative revaluation increments/
(decrements) Consolidated
book value2015 2015 2015 2014 2014 2014
$’000 $’000 $’000 $’000 $’000 $’000
Theme parks (1) (2) 213,490 39,015 252,505 212,603 34,811 247,414Marinas (3) 7,777 - 7,777 7,806 - 7,806Bowling centres (4) 104,350 1,900 106,250 97,335 1,900 99,235Family entertainment centres (5) 157,322 (86) 157,236 78,446 (86) 78,360Health clubs (6) 83,092 - 83,092 74,605 - 74,605Other (7) 2,823 - 2,822 2,742 - 2,742Total 568,854 40,829 609,682 473,537 36,625 510,162
(1) The book value of Dreamworld and WhiteWater World land and buildings and major rides and attractions (including intangible assets of $0.8 million (2014: $0.8 million)) is $227.5 million (2014: $227.0 million). In an independent valuation performed at 30 June 2015 by Jones Lang LaSalle, the fair value for these assets was assessed to be $227.0 million (2014: $227.0 million). The Directors have valued other property, plant and equipment of Dreamworld and WhiteWater World at 30 June 2015 at $2.9 million (2014: $2.3 million).
(2) The book value of SkyPoint (including intangible assets of $3.6 million (2014: $3.6 million)) is $26.5 million (2014: $22.5 million). In an independent valuation performed at 30 June 2015, the fair value for SkyPoint was assessed to be $26.5 million (2014: $22.5 million).
(3) The Directors have valued the property, plant and equipment of d’Albora Marinas at $7.8 million (2014: $7.8 million). (4) The one remaining freehold building was independently valued at 30 June 2013 at $1.9 million. At 30 June 2015, the Directors assessed the fair value of the
freehold building to be $1.9 million (2014: $1.9 million) and the remaining property, plant and equipment to be $104.4 million (2014: $97.3 million). (5) At 30 June 2015, the Directors assessed the fair value of the property, plant and equipment in its family entertainment centres to be $157.2 million (2014:
$78.4 million). (6) The Directors have valued the property, plant and equipment of Goodlife at 30 June 2015 at $83.1 million (2014: $74.6 million). (7) The fair value of other property, plant and equipment was assessed by the Directors to be $2.8 million (2014: $2.7 million) at 30 June 2015.
Refer to Note 39(b) for information on the valuation techniques used to derive the fair value of the land and buildings and major rides and attractions.
A reconciliation of the carrying amount of property, plant and equipment at the beginning and end of the current and previous years is set out below:
Land and buildings
Major rides and
attractions Plant and
equipment
Plant and equipment
under finance
lease
Furniture, fittings and equipment
Motor vehicles Total
$’000 $’000 $’000 $’000 $’000 $’000 $’000
Consolidated Group - 2015 Carrying amount at the beginning of the year 283,047 63,579 144,908 492 17,862 274 510,162Additions 42,834 3,389 66,474 - 3,228 50 115,975Acquired through business combinations 4,080 - 971 - 469 - 5,520Transfer to plant and equipment - - 492 (492) - - -Disposals (415) - (1,159) - (50) (3) (1,627)Depreciation (13,657) (1,766) (27,294) - (4,466) (73) (47,256)Foreign exchange movements 9,793 - 12,226 - (6) - 22,013Revaluation increments 7,541 - - - - - 7,541Impairment (2,646) - - - - - (2,646)Carrying amount at the end of the year 330,577 65,202 196,618 - 17,037 248 609,682
For
per
sona
l use
onl
y

Notes to the Financial Statements for the year ended 30 June 2015
Ardent Leisure Group | Annual Report 2015 67
19. Property, plant and equipment (continued)
Land and buildings
Major rides and
attractions Plant and
equipment
Plant and equipment
under finance
lease
Furniture, fittings and equipment
Motor vehicles Total
$’000 $’000 $’000 $’000 $’000 $’000 $’000
Consolidated Group - 2014 Carrying amount at the beginning of the year 248,679 64,994 133,646 582 13,630 384 461,915Additions 39,629 1,524 31,399 - 6,660 25 79,237Acquired through business combinations 1,591 - 1,368 - 208 - 3,167Transfer to property held for sale (9,741) - - - - - (9,741)Disposals (815) (829) (470) - (68) (30) (2,212)Depreciation (10,473) (2,110) (20,236) (90) (2,574) (105) (35,588)Foreign exchange movements (1,279) - (799) - 6 - (2,072)Revaluation increments 15,456 - - - - - 15,456Carrying amount at the end of the year 283,047 63,579 144,908 492 17,862 274 510,162
Land and buildings
Plant and equipment
Plant and equipment
under finance lease Total
$’000 $’000 $’000 $’000
ALL Group - 2015 Carrying amount at the beginning of the year 50,437 72,534 492 123,463Additions 30,289 62,477 - 92,766Acquired through business combinations - 1,441 - 1,441Transfer to plant and equipment - 492 (492) -Disposals (399) (619) - (1,018)Depreciation (2,305) (21,848) - (24,153)Foreign exchange movements 9,820 12,290 - 22,110
Impairment (1,009) - - (1,009)Carrying amount at the end of the year 86,833 126,767 - 213,600
Land and buildings
Plant and equipment
Plant and equipment
under finance lease Total
$’000 $’000 $’000 $’000
ALL Group - 2014 Carrying amount at the beginning of the year 28,056 54,812 582 83,450Additions 35,079 30,433 - 65,512Acquired through business combinations - 1,576 - 1,576Transfer to property held for sale (9,741) - - (9,741)Disposals (2) (514) - (516)Depreciation (1,641) (12,821) (90) (14,552)Foreign exchange movements (1,314) (952) - (2,266)Carrying amount at the end of the year 50,437 72,534 492 123,463
For
per
sona
l use
onl
y

Notes to the Financial Statements for the year ended 30 June 2015
68 Ardent Leisure Group | Annual Report 2015
Livestock
Livestock comprises wildlife animals housed at the Dreamworld site.
ConsolidatedGroup
Consolidated Group ALL Group ALL Group
2015 2014 2015 2014 $’000 $’000 $’000 $’000
At 1 July Cost 863 828 863 828Accumulated depreciation (563) (523) (563) (523)Net book amount 300 305 300 305
Year ended 30 June Opening net book amount 300 305 300 305Additions - 81 - 81Disposals (25) (46) (25) (46)Depreciation (30) (40) (30) (40)Closing net book amount 245 300 245 300
At 30 June Cost 838 863 838 863Accumulated depreciation (593) (563) (593) (563)
Net book amount 245 300 245 300
Intangible assets
ConsolidatedGroup
Consolidated Group ALL Group ALL Group
2015 2014 2015 2014 $’000 $’000 $’000 $’000
Customer relationships at cost 35,935 29,812 35,935 29,812Accumulated amortisation (30,386) (24,697) (30,386) (24,697) 5,549 5,115 5,549 5,115
Brands at cost 12,312 10,850 12,312 10,850Accumulated amortisation (5,546) (4,454) (5,546) (4,454) 6,766 6,396 6,766 6,396
Other intangible assets at cost 8,251 3,448 6,823 2,020Accumulated amortisation (2,774) (1,960) (1,346) (532) 5,477 1,488 5,477 1,488
Goodwill at cost 236,850 199,795 236,850 199,795Accumulated impairment charge (11,698) (11,557) (11,698) (11,557) 225,152 188,238 225,152 188,238
Total intangible assets 242,944 201,237 242,944 201,237
For
per
sona
l use
onl
y

Notes to the Financial Statements for the year ended 30 June 2015
Ardent Leisure Group | Annual Report 2015 69
21. Intangible assets (continued) Consolidated
GroupConsolidated
Group ALL Group ALL Group2015 2014 2015 2014
$’000 $’000 $’000 $’000
Customer relationships Opening net book amount 5,115 9,594 5,115 9,594Additions 6,123 1,160 6,123 1,160Amortisation (5,689) (5,639) (5,689) (5,639)Closing net book amount 5,549 5,115 5,549 5,115
Brands Opening net book amount 6,396 2,779 6,396 2,779Additions 1,210 4,311 1,210 4,311Amortisation (1,089) (694) (1,089) (694)Foreign exchange movements 249 - 249 -Closing net book amount 6,766 6,396 6,766 6,396
Other intangible assets Opening net book amount 1,488 202 1,488 202Additions 4,803 1,368 4,803 1,368Amortisation (814) (82) (814) (82)Closing net book amount 5,477 1,488 5,477 1,488
Goodwill Opening net book amount 188,238 184,213 188,238 184,213Additions 27,664 5,087 27,664 5,087Foreign exchange movements 9,391 (1,062) 9,391 (1,062)Impairment (141) - (141) -Closing net book amount 225,152 188,238 225,152 188,238Total intangible assets 242,944 201,237 242,944 201,237
Customer relationships
Customer relationships relate to the relationships with health club members which were acquired as part of the various acquisitions of health clubs.
Brands
The brands relate to the Goodlife brand acquired in September 2007 along with the distribution agreement for the use of the Hypoxi brand in March 2014.
Other intangible assets
Other intangible assets represent registered trademarks associated with Dreamworld operations, intellectual property associated with Australian Tour Desk, liquor licences held by the bowling centres and software built across all the business units in the Group.
Goodwill
Goodwill represents goodwill acquired by the Group as part of various acquisitions. The movement in goodwill at cost in the period is due to the acquisition of eight health clubs and an amusement arcade (refer to Note 32) and the movement in the USD:AUD foreign exchange rate.
Goodwill is monitored by management at the operating segment level. Management reviews the business performance based on geography and type of business. The Group has six reportable segments as disclosed in Note 37.
For
per
sona
l use
onl
y

Notes to the Financial Statements for the year ended 30 June 2015
70 Ardent Leisure Group | Annual Report 2015
21. Intangible assets (continued)
Goodwill (continued)
A segment level summary of the goodwill allocation is presented below:
Consolidated Group and ALL Group
2015 Australia United States New Zealand Total
$’000 $’000 $’000 $’000
Theme parks 4,366 - - 4,366Bowling centres 20,270 - 3,476 23,746Family entertainment centres - 54,608 - 54,608Health clubs 142,432 - - 142,432
167,068 54,608 3,476 225,152
2014 Australia United States New Zealand Total
$’000 $’000 $’000 $’000
Theme parks 4,366 - - 4,366Bowling centres 18,080 - 3,646 21,726Family entertainment centres - 45,066 - 45,066Health clubs 117,080 - - 117,080
139,526 45,066 3,646 188,238
Impairment tests for goodwill
Goodwill is allocated to the Group’s cash-generating units (CGUs) identified according to business segment and country of operation.
Key assumptions used for value in use calculations
The table below shows the key assumptions used in the value in use calculations used to test for impairment in the business segments to which a significant amount of goodwill was allocated:
Budget/forecast period growth rate Long term growth rate1 Post tax discount rate2
2015 2014 2015 2014 2015 2014
% per annum % per annum % per annum % per annum % per annum % per annum
Theme parks(3) N/A N/A N/A N/A N/A N/ABowling centres 2.00 2.00 2.00 2.00 8.26 8.50 Family entertainment centres 3.00 3.00 3.00 3.00 7.16 7.50 Health clubs 0.00 - 2.00 2.00 2.00 2.00 8.26 8.50
(1) Average growth rate used to extrapolate cash flows beyond the budget/forecast period. (2) In performing the value in use calculations for each CGU, the Group has applied post-tax discount rates to discount the forecast future attributable post-tax
cash flows. Pre-tax discount rates are 9.51% for bowling centres, 9.747% for health clubs and 8.42% for family entertainment centres. (3) All non-current assets in the theme parks division are already held at fair value at 30 June 2015 and were independently valued by Jones Lang LaSalle (refer
to Note 19). As a result, no impairment testing is required at 30 June 2015.
The period over which management has projected the CGU cash flows is based upon the individual CGU’s lease term available. These assumptions have been used for the analysis of each CGU within the business segment. The weighted average growth rates used are consistent with forecasts included in industry reports. The discount rates used are post-tax and reflect specific risks relating to the relevant segments and the countries in which they operate.
The recoverable amount of a CGU is determined based on value in use calculations. These calculations use cash flow projections based on the 2016-2019 financial year budgets/forecasts. Cash flows beyond the budget period are extrapolated using the growth rates stated above. The growth rate does not exceed the long term average growth rate for the business in which the CGU operates.
For
per
sona
l use
onl
y
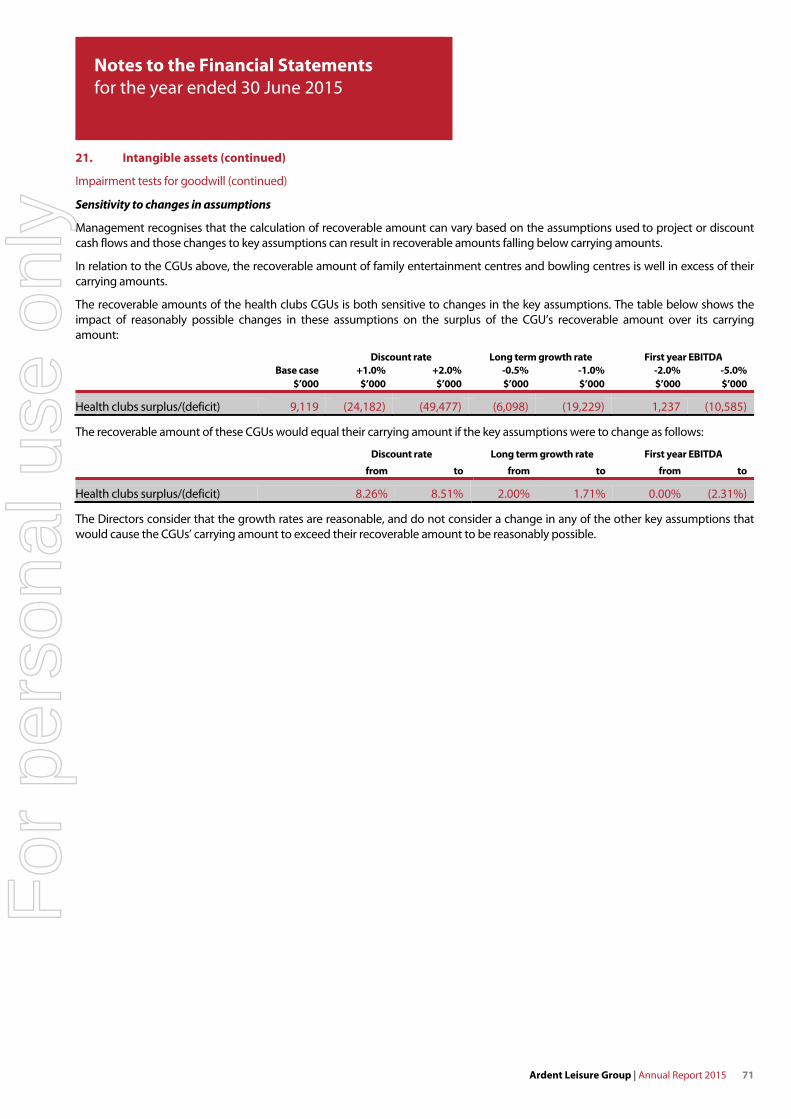
Notes to the Financial Statements for the year ended 30 June 2015
Ardent Leisure Group | Annual Report 2015 71
21. Intangible assets (continued)
Impairment tests for goodwill (continued)
Sensitivity to changes in assumptions
Management recognises that the calculation of recoverable amount can vary based on the assumptions used to project or discount cash flows and those changes to key assumptions can result in recoverable amounts falling below carrying amounts.
In relation to the CGUs above, the recoverable amount of family entertainment centres and bowling centres is well in excess of their carrying amounts.
The recoverable amounts of the health clubs CGUs is both sensitive to changes in the key assumptions. The table below shows the impact of reasonably possible changes in these assumptions on the surplus of the CGU’s recoverable amount over its carrying amount:
Discount rate Long term growth rate First year EBITDABase case +1.0% +2.0% -0.5% -1.0% -2.0% -5.0%
$’000 $’000 $’000 $’000 $’000 $’000 $’000
Health clubs surplus/(deficit) 9,119 (24,182) (49,477) (6,098) (19,229) 1,237 (10,585)
The recoverable amount of these CGUs would equal their carrying amount if the key assumptions were to change as follows:
Discount rate Long term growth rate First year EBITDA
from to from to from to
Health clubs surplus/(deficit) 8.26% 8.51% 2.00% 1.71% 0.00% (2.31%)
The Directors consider that the growth rates are reasonable, and do not consider a change in any of the other key assumptions that would cause the CGUs’ carrying amount to exceed their recoverable amount to be reasonably possible.
For
per
sona
l use
onl
y

Notes to the Financial Statements for the year ended 30 June 2015
72 Ardent Leisure Group | Annual Report 2015
22. Deferred tax assets
ConsolidatedGroup
Consolidated Group ALL Group ALL Group
2015 2014 2015 2014 $’000 $’000 $’000 $’000
The balance comprises temporary differences attributable to:
Amounts recognised in profit or loss: Doubtful debts 142 216 142 216Employee benefits 5,471 4,757 5,471 4,757Provisions and accruals 4,287 1,167 4,287 1,167Depreciation of property, plant and equipment 831 153 831 153Inventory diminution 24 6 24 6Deferred income 96 76 96 76Unrealised foreign exchange losses - 4 - 4Lease incentives 4,117 1,563 4,117 1,563Other 98 179 98 179
Deferred tax assets 15,066 8,121 15,066 8,121
Set-off of deferred tax balances pursuant to set-off provisions Australia (4,663) (3,986) (4,663) (3,986)United States (6,160) (2,157) (6,160) (2,157)
Net deferred tax assets 4,243 1,978 4,243 1,978
Movements Balance at the beginning of the year 8,121 8,158 8,121 8,158Credited/(charged) to the Income Statement (refer to Note 10) 6,732 (328) 6,732 (328)Credited to cash flow hedge reserve (refer to Note 30) 24 11 24 11Acquired through business combinations (refer to Note 32) 189 280 189 280
Balance at the end of the year 15,066 8,121 15,066 8,121
Deferred tax assets to be recovered within 12 months 8,736 5,849 8,736 5,849Deferred tax assets to be recovered after more than 12 months 6,330 2,272 6,330 2,272
15,066 8,121 15,066 8,121
For
per
sona
l use
onl
y

Notes to the Financial Statements for the year ended 30 June 2015
Ardent Leisure Group | Annual Report 2015 73
23. Payables
ConsolidatedGroup
Consolidated Group ALL Group ALL Group
2015 2014 2015 2014 $’000 $’000 $’000 $’000
Current Custodian fee 48 52 - -Interest payable 412 442 85 35GST payable 1,661 1,570 1,666 847Trade creditors 8,770 9,142 8,770 9,142Property expenses payable 761 1,048 - -Employee share plan 170 361 3,497 6,675Employee benefits 17,238 13,361 17,238 13,361Deferred income 12,864 9,131 12,864 9,131Deferred settlement for acquisition of business 2,377 - - -Stamp duty payable for acquisition of business 1,823 - 1,823 -Straight-line rent liability 17,056 14,327 3,760 2,060Lease incentive liabilities 11,245 4,596 11,245 4,596Property tax payable 1,826 945 1,826 945Other creditors and accruals 15,072 14,090 13,513 13,495Total payables 91,323 69,065 76,287 60,287
24. Interest bearing liabilities
ConsolidatedGroup
Consolidated Group ALL Group ALL Group
2015 2014 2015 2014 $’000 $’000 $’000 $’000
Current Finance lease - 61 - 61
Total current - 61 - 61
Non-current Bank loan - term debt 279,761 261,551 110,547 79,851Less: amortised costs - bank loan (1,143) (1,340) (442) (390)Loans from the Trust* - - 126,901 125,365Total non-current 278,618 260,211 237,006 204,826Total interest bearing liabilities 278,618 260,272 237,006 204,887
* Further information relating to these loans is included in Note 36(g).
The term debt is secured by mortgages over all freehold property, leasehold mortgages over key bowling centre, health club and marina leases, registered security interests over all present and after acquired property of key Group companies, and pledged interests over all US property. On 30 September 2014, the Group increased the loan facilities to include an additional US$40.0 million. The terms of the debt also impose certain covenants on the Group as follows:
Debt serviceability ratio, being the ratio of debt to EBITDA adjusted for unrealised and one off items (adjusted EBITDA), must not exceed 3.75 (2014: 3.25); and
Fixed charge cover ratio, being the ratio of adjusted EBITDA to fixed charges, must be no less than 1.75 (2014: 1.75). With effect from 30 September 2014, the Group is no longer subject to a gearing ratio covenant (2014: 40% maximum gearing covenant).
For
per
sona
l use
onl
y

Notes to the Financial Statements for the year ended 30 June 2015
74 Ardent Leisure Group | Annual Report 2015
24. Interest bearing liabilities (continued)
Total secured liabilities and assets pledged as security
The carrying amounts of assets pledged as security for current and non-current borrowings are:
ConsolidatedGroup
Consolidated Group ALL Group ALL Group
2015 2014 2015 2014 $’000 $’000 $’000 $’000
Current Floating charge Cash and cash equivalents 4,986 7,079 4,685 6,197Receivables 10,856 7,416 13,210 7,762Derivative financial instruments 263 - - -Inventories 11,372 9,378 11,372 9,378Current tax receivables 1,740 - 1,740 -Property held for sale - 10,650 - 10,650Other 10,736 8,937 7,026 5,438
Total current assets
39,953 43,460 38,033 39,425
Non-current Mortgage Investment properties 99,326 95,870 - -Land and buildings 330,577 275,405 86,833 42,795 429,903 371,275 86,833 42,795Floating charge Property, plant and equipment 279,105 226,623 126,767 72,534Livestock 245 300 245 300Derivative financial instruments 114 - - -Intangible assets 17,792 12,999 17,792 12,999 297,256 239,922 144,804 85,833Finance lease Plant and equipment - 492 - 492Total non-current assets 727,159 611,689 231,637 129,120Total assets 767,112 655,149 269,670 168,545
Lease liabilities are effectively secured as the rights to the leased assets recognised in the financial statements and revert to the lessor in the event of default.
For
per
sona
l use
onl
y

Notes to the Financial Statements for the year ended 30 June 2015
Ardent Leisure Group | Annual Report 2015 75
24. Interest bearing liabilities (continued)
Credit facilities
As at 30 June 2015, the Group had unrestricted access to the following credit facilities:
ConsolidatedGroup
Consolidated Group ALL Group ALL Group
2015 2014 2015 2014 $’000 $’000 $’000 $’000
A$ syndicated facilities 200,000 200,000 - -Amount used (144,400) (163,400) - -Amount unused 55,600 36,600 - -
US$ syndicated facilities 208,334 127,253 182,292 106,045Amount used (135,361) (98,151) (110,547) (79,851)Amount unused 72,973 29,102 71,745 26,194
Trust facilities - - 226,042 355,975Amount used - - (126,901) (125,365)Amount unused - - 99,141 230,610
Total facilities 408,334 327,253 408,334 462,020Total amount used (279,761) (261,551) (237,448) (205,216)Total amount unused 128,573 65,702 170,886 256,804 Consolidated Group
The Group has access to A$200.0 million (2014: A$200.0 million) syndicated facilities and a US$160.0 million (2014: US$120.0 million) syndicated facilities. A$100.0 million of the AUD facilities will mature on 1 July 2016 and A$100.0 million will mature on 1 July 2017. US$90.0 million of the USD facilities will mature on 1 July 2016 and US$70.0 million will mature on 1 July 2017.
As noted in note 44, effective 11 August 2015, the Group completed refinancing of its syndicated loan facilities. This has resulted in an increase in the available USD facilities to US$280.0 million (30 June 2015: US$160.0 million) and an extended tenure maturing in equal tranches of three, four and five years respectively. Australian dollar facilities remain at $200.0 million (30 June 2015: $200.0 million) however have been similarly extended to mature in equal tranches of three, four and five years respectively.
All of the facilities have a variable interest rate. As detailed in Note 14, the interest rates on the loans are partially fixed using interest rate swaps. The weighted average interest rates payable on the loans at 30 June 2015, including the impact of the interest rate swaps, is 4.28% per annum for AUD denominated debt (2014: 5.15% per annum) and 1.92% per annum for USD denominated debt (2014: 1.81% per annum).
ALL Group
Subject to the Trust loan facilities conditions being met, the facilities may be drawn down with two business days’ notice.
Australian Trust loan facilities totalling $200.0 million (2014: $249.9 million) have a maturity date of 1 July 2017. In addition, the ALL Group has US$20.0 million (2014: US$100.0 million) facilities with the Trust maturing on 1 July 2017.
The ALL Group has access to US$140.0 million (2014: US$100.0 million) syndicated facilities. US$70.0 million of the facilities will mature on 1 July 2016 and US$70.0 million will mature on 1 July 2017.
Effective 11 August 2015, the ALL Group completed refinancing of its syndicated loan facilities. This has resulted in an increase in the available USD facilities to US$260.0 million (30 June 2015: US$140.0 million) and an extended tenure with $73.3 million maturing in three years, $93.3 million maturing in four years and $93.3 million maturing in five years.
Information about the Group’s exposure to foreign exchange risk and interest rates is provided in Note 38.
For
per
sona
l use
onl
y

Notes to the Financial Statements for the year ended 30 June 2015
76 Ardent Leisure Group | Annual Report 2015
25. Provisions
(a) Distributions to stapled security holders
ConsolidatedGroup
Consolidated Group ALL Group ALL Group
2015 2014 2015 2014 $’000 $’000 $’000 $’000
Opening balance - - - -Distributions/dividends declared 55,820 49,025 14,790 3,874Distributions/dividends paid (39,041) (40,107) (11,132) (3,874)Distributions reinvested (16,779) (8,918) (3,658) -
Closing balance - - - -
A provision for the distribution relating to the half year to 30 June 2015 was not recognised as the distribution had not been declared at the reporting date. Refer to Note 44.
(b) Other provisions
ConsolidatedGroup
Consolidated Group ALL Group ALL Group
2015 2014 2015 2014 $’000 $’000 $’000 $’000
Current Employee benefits 3,047 2,700 3,047 2,700Sundry* 189 572 189 572Total current 3,236 3,272 3,236 3,272
Non-current Employee benefits 1,803 1,625 1,803 1,625Property onerous lease contracts 4,221 - 1,569 -Property make good obligations 9,745 - 2,180 -
Total non-current 15,769 1,625 5,552 1,625Total provisions 19,005 4,897 8,788 4,897
Movements in sundry provisions Carrying amount at the beginning of the year 572 542 572 542Additional provisions recognised 411 718 411 718Amounts utilised (794) (688) (794) (688)Carrying amount at the end of the year 189 572 189 572* Sundry provisions include insurance excess/deductible amounts for public liability insurance, fringe benefits tax provisions and other royalty provisions.
The current provision for employee benefits includes accrued long service leave which covers all unconditional entitlements where employees have completed the required period of service and also those where employees are entitled to pro-rata payments in certain circumstances. This is presented as current, since the Group does not have an unconditional right to defer settlement for any of these obligations. However, based on past experience, the Group does not expect all employees to take the full amount of accrued leave or require payment within the next 12 months.
For
per
sona
l use
onl
y

Notes to the Financial Statements for the year ended 30 June 2015
Ardent Leisure Group | Annual Report 2015 77
26. Other liabilities
ConsolidatedGroup
Consolidated Group ALL Group ALL Group
2015 2014 2015 2014 $’000 $’000 $’000 $’000
Security deposits 2,694 2,155 2,694 2,155
2,694 2,155 2,694 2,155
27. Deferred tax liabilities
ConsolidatedGroup
Consolidated Group ALL Group ALL Group
2015 2014 2015 2014 $’000 $’000 $’000 $’000
The balance comprises temporary differences attributable to:Amounts recognised in profit or loss: Intangible assets 3,682 3,392 3,682 3,392Prepayments 837 481 837 481Accrued revenue 122 123 122 123Depreciation of property, plant and equipment 28,045 11,424 28,045 11,424
Deferred tax liabilities 32,686 15,420 32,686 15,420
Set-off deferred tax balances pursuant to set-off provisions Australia (4,663) (3,986) (4,663) (3,986)United States (6,160) (2,157) (6,160) (2,157)
Net deferred tax liabilities 21,863 9,277 21,863 9,277
Movements Balance at the beginning of the year 15,420 15,624 15,420 15,624Charged/(credited) to the Income Statement (refer to Note 10) 15,086 (1,860) 15,086 (1,860)Acquired through business combinations (refer to Note 32) 2,180 1,656 2,180 1,656
Balance at the end of the year 32,686 15,420 32,686 15,420
Deferred tax liabilities to be settled within 12 months 845 604 845 604Deferred tax liabilities to be settled after more than 12 months 31,841 14,816 31,841 14,816
32,686 15,420 32,686 15,420
For
per
sona
l use
onl
y

Notes to the Financial Statements for the year ended 30 June 2015
78 Ardent Leisure Group | Annual Report 2015
28. Contributed equity
Date of Consolidated
GroupConsolidated
Group ALL Group ALL GroupNo. of income 2015 2014 2015 2014
securities/shares Details entitlement Note $’000 $’000 $’000 $’000
397,803,987 Securities/shares on issue 30 Jun 2013 501,416 14,2025,295,345 DRP issue 1 Jul 2013 (i) 8,918 1,504
1,895,088 Security-based payments - securities/shares issued 1 Jul 2013 (ii) 3,469 585
61,288 Security-based payments - securities/shares issued 1 Jul 2013 (ii) 112 19
- Issue costs paid (3) (1)405,055,708 Securities/shares on issue 30 Jun 2014 513,912 513,912 16,309 16,309
6,358,756 DRP issue 1 Jul 2014 (i) 16,779 3,658
1,751,698 Security-based payments - securities/shares issued 1 Jul 2014 (ii) 5,255 878
110,302 Security-based payments - securities/shares issued 1 Jan 2015 (ii) 228 59
20,746,888 Fitness First WA placement 1 Jul 2014 (iii) 50,000 8,356 8,298,754 Security Purchase Plan 1 Jul 2014 (iii) 20,000 3,342
- Issue costs paid (993) (167) - Capital reallocation (iv) - 122,827
442,322,106 Securities/shares on issue 30 Jun 2015 605,181 513,912 155,262 16,309
(i) Distribution Reinvestment Plan (DRP) issues
The Group has established a DRP under which stapled security holders may elect to have all or part of their distribution entitlements satisfied by the issue of new stapled securities rather than being paid in cash. The discount available on stapled securities issued under the DRP is 2.0% on the market price. The DRP will be in operation for the distribution for the half year ended 30 June 2015 and was in operation for the half year ended 31 December 2014.
(ii) Security-based payments
The Group has Deferred Short Term Incentive Plan and Long Term Incentive Plan remuneration arrangements under which performance rights are issued to certain management and other personnel within the Group as part of their remuneration arrangements. These performance rights are subject to vesting conditions as set out in Note 29. Upon vesting, the Group issues stapled securities to these personnel.
(iii) Fitness First WA placement and Security Purchase Plan
On 7 August 2014 and 15 September 2014, the Group issued stapled securities under a placement and a Security Purchase Plan respectively to fund the acquisition of eight Fitness First health clubs in Western Australia, as set out in Note 32, and future investment in Main Event.
(iv) Capital reallocation
The Group and ALL Group implemented a capital reallocation during the period of 0.28 cents per stapled security. This resulted in $122.8 million of capital being transferred from the Trust to the Company. There was no impact on the number of units and the number of shares on issue as a result of the capital reallocation. F
or p
erso
nal u
se o
nly

Notes to the Financial Statements for the year ended 30 June 2015
Ardent Leisure Group | Annual Report 2015 79
29. Security-based payments
(a) Deferred Short Term Incentive Plan (DSTI)
Plan name DSTI
Who can participate? All employees are eligible for participation at the discretion of the Board;however, Non-Executive Directors do not participate in the DSTI.
Types of securities issued Performance rights that can be converted into fully paid securities once vested. The performance rights differ from options in that they do not carry an exercise price. Performance rights do not represent physical securities and do not carry any voting or distribution entitlements.
Treatment of non-Australian residents For employees who are not Australian residents, the DSTI historically granted cash awards to those executives. Administrative arrangements have now been made to issue equity awards and not cash awards to non-resident executives. All awards, whether equity or cash, are subject to the same tenure hurdles.
What restrictions are there on the securities? Performance rights are non-transferable.
When can the securities vest? The plan contemplates that the performance rights will vest equally one year and two years following the grant date.
What are the vesting conditions? Plan performance rights will normally vest only if the participant remains employed by the Group (and is not under notice terminating the contract of employment from either party) as at the relevant vesting date.
Did any of the securities vest? During the financial year, a total of 777,419 performance rights vested.
Australian employees Since 1 July 2010, long term incentives have been provided to certain executives under the DSTI. Under the terms of the DSTI, employees may be granted performance rights, of which one half will vest one year after grant date and one half will vest two years after grant date. The first set of performance rights were granted under the DSTI on 16 December 2010, with the first vesting date being the day after the full year results announcement for the year ended 30 June 2011. A total of 659,745 performance rights vested on 19 August 2014 and 12 March 2015 and a corresponding number of stapled securities were issued to employees under the terms of the DSTI (2014: 722,192).
The characteristics of the DSTI indicate that, at the Ardent Leisure Group level, it is an equity settled share-based payment under AASB 2 Share-based Payment as the holders are entitled to the securities as long as they meet the DSTI’s service criteria. However, as ALL is considered to be a subsidiary of the Trust, in the financial statements of the ALL Group the DSTI is accounted for as a cash settled share-based payment.
Fair value – Australian employees
The fair value of the performance rights granted under the DSTI is recognised in the Group financial statements as an employee benefit expense with a corresponding increase in equity. The fair value of each grant of performance rights is determined at grant date using a binomial tree valuation model and then is recognised over the vesting period during which employees become unconditionally entitled to the underlying securities.
The fair value of the performance rights granted under the DSTI is recognised in the ALL Group financial statements as an employee benefit expense with a corresponding increase in liabilities. The fair value of each grant of performance rights is determined at each reporting date using a binomial tree valuation model with the movement in fair value of the liability being recognised in the Income Statement.
At each reporting date, the estimate of the number of performance rights that are expected to vest is revised. The employee benefit expense recognised each financial period takes into account the most recent estimate.
For
per
sona
l use
onl
y

Notes to the Financial Statements for the year ended 30 June 2015
80 Ardent Leisure Group | Annual Report 2015
29. Security-based payments (continued)
(a) Deferred Short Term Incentive Plan (DSTI) (continued)
US employees Due to previous restrictions on the issue of securities to US residents, those US executives eligible for the DSTI were subject to a shadow performance rights scheme whereby a cash payment was made instead of performance rights being granted. At the end of each vesting period, the number of performance rights which would have vested is multiplied by the Group stapled security volume weighted average price (VWAP) for the five trading days immediately following the vesting date and an equivalent cash payment is made. Due to the nature of the scheme, this is considered to be a cash settled share-based payment under AASB 2. A total of 60,845 cash settled performance rights vested on 19 August 2014 to US employees under the terms of the DSTI (2014: 135,090). Following steps taken to issue equity to US resident employees, all new performance rights issued after 1 July 2014 will be settled in equity upon vesting in future periods. As such, the performance rights are considered to be equity settled shared-based payments under AASB 2. A total of 56,829 equity settled performance rights vested on 19 August 2014 (2014: nil). In the ALL financial statements, all performance rights issued to US employees are considered to be cash settled.
Fair value – US employees
The fair value of cash settled performance rights is determined at grant date and each reporting date using a binomial tree valuation model. This is recorded as a liability with the movement in the fair value of the financial liability being recognised in the Income Statement.
The fair value of equity settled performance rights is determined at grant date using a binomial tree valuation model. This is recorded as an employee benefit expense with a corresponding increase in equity.
At each reporting date, the estimate of the number of performance rights that are expected to vest is revised. The employee benefit expense recognised each period takes into account the most recent estimate.
Valuation inputs For the performance rights outstanding at 30 June 2015, the table below shows the fair value of the performance rights on each grant date as well as the factors used to value the performance rights at the date of grant. This valuation is used to value the equity settled performance rights granted to employees at 30 June 2015:
Grant 2013 2014
Grant date 23 August 2013 19 August 2014Vesting date – year 1 19 August 2014 31 August 2015Vesting date – year 2 31 August 2015 31 August 2016Average risk free rate 2.60% per annum 2.50% per annumExpected price volatility 30.9% per annum 27.0% per annumExpected distribution yield 6.6% per annum 4.3% per annumStapled security price at grant date $1.82 $3.00Valuation per performance right on issue $1.66 $2.81
The table below shows the fair value of the performance rights in each grant as at 30 June 2015 as well as the factors used to value the performance rights as at 30 June 2015. This valuation is used to value the cash settled performance rights granted to employees at 30 June 2015:
Grant 2013 2014
Grant date 23 August 2013 19 August 2014Vesting date – year 1 19 August 2014 31 August 2015Vesting date – year 2 31 August 2015 31 August 2016Average risk free rate 2.00% per annum 2.00% per annumExpected price volatility 41.9% per annum 41.9% per annumExpected distribution yield 5.8% per annum 5.8% per annumStapled security price at year end $2.17 $2.17Valuation per performance right at year end $2.17 $2.10
Grants of performance rights are made annually with the grant date being the date of the issue of the offer letters to employees. Although the grant date may vary from year to year, the testing period (subject to any hurdles) remains constant with the vesting date being 24 hours immediately following the announcement of the Group’s full year financial results.
For
per
sona
l use
onl
y

Notes to the Financial Statements for the year ended 30 June 2015
Ardent Leisure Group | Annual Report 2015 81
29. Security-based payments (continued)
(a) Deferred Short Term Incentive Plan (DSTI) (continued)
Tenure hurdle The vesting of the performance rights is subject to a tenure hurdle and participants must remain employed by the Group (and not be under notice terminating the contract of employment from either party) as at the relevant vesting date.
The number of rights outstanding and the grant dates of the rights are shown in the tables below:
Consolidated Group
Consolidated Group ALL Group ALL Group
2015 2014 2015 2014Rights Rights Rights Rights
Performance rights issued to participating executives:
Performance rights 543,698 950,807 543,698 950,807
Grant date Expiry date Exercise price
Valuation per right
Balance at beginning of the year Granted Exercised
Failed to vest Cancelled
Balance at the end of
the year
24 Aug 2012 19 Aug 2014 nil 114.7 cents 383,419 - (383,419) - - -
23 Aug 2013 31 Aug 2015 nil 166.1 cents 567,388 - (334,074) - (19,383) 213,931
19 Aug 2014 31 Aug 2016 nil 280.8 cents - 408,823 (59,926) - (19,130) 329,767 950,807 408,823 (777,419) - (38,513) 543,698 The rights have an average maturity of six months.
(b) Long Term Incentive Plan (LTIP)
Plan name LTIP
Who can participate? All employees are eligible for participation at the discretion of the Board;however, Non-Executive Directors do not participate in the LTIP.
Types of securities issued Performance rights that can be converted into fully paid securities once vested. The performance rights differ from options in that they do not carry an exercise price. Performance rights do not represent physical securities and do not carry any voting or distribution entitlements.
Treatment of non-Australian residents For employees who are not Australian residents, the LTIP historically granted cash awards to those executives. Administrative arrangements have now been made to issue equity awards and not cash awards to non-resident executives. All awards, whether equity or cash, are subject to the same performance and tenure hurdles.
What restrictions are there on the securities? Performance rights are non-transferable.
When can the securities vest? The plan contemplates that the performance rights will vest equally two, three and four years following the grant date, subject to meeting the total shareholder return (TSR) and internal compound earnings per security (EPS) performance hurdles. The weighting between the two hurdles will be split as follows:
TSR – 50%; and EPS – 50%.
For
per
sona
l use
onl
y

Notes to the Financial Statements for the year ended 30 June 2015
82 Ardent Leisure Group | Annual Report 2015
29. Security-based payments (continued)
(b) Long Term Incentive Plan (LTIP) (continued)
Plan name LTIP
What are the vesting conditions? For grants made after 1 July 2014, in order for any or all of the performance rights to vest one or both of the following hurdles must be met:
TSR performance hurdle - the Group's TSR for the performance period must exceed the 50th percentile of the TSRs of the benchmark group for the same period. A sliding scale of vesting applies above the 50th percentile threshold; and
EPS performance hurdle - the Group's compound EPS growth for the performance period must exceed 5%. A sliding scale of vesting applies above the 5% threshold.
What does total shareholder return include? TSR is the total return an investor would receive over a set period of time assuming that all distributions were reinvested in the Group’s securities. The TSR definition takes account of both capital growth and distributions.
What is the earnings per security hurdle? The EPS hurdle refers to the annual growth of earnings per security over the total vesting periods of two, three and four years from the grant date.
What is the benchmark group? The benchmark group comprises the ASX Small Industrials Index.
Did any of the securities vest? During the financial year, a total of 1,202,878 performance rights reachedvesting following an independent third party assessment of the Group’s TSR performance compared to the benchmark.
Australian employees Since 1 July 2009, long term incentives have been provided to certain executives under the LTIP. Under the terms of the LTIP and the initial grant, employees may be granted performance rights, of which one third will vest two years after grant date, one third will vest three years after grant date and one third will vest four years after grant date. The percentage of performance rights which may vest is subject to the TSR performance of the Group relative to its peer group, which is the ASX Small Industrials Index.
During the year, the relative TSR performance of the Group was tested in accordance with the LTIP for tranches issued in 2010, 2011 and 2012 with the following results:
Tranche TSR percentile Vesting percentage
T3-2010 96.70 100.0%T2-2011 93.62 100.0%T1-2012 91.75 100.0%
A total of 1,145,426 performance rights vested on 19 August 2014 and a corresponding number of stapled securities were issued to Australian employees under the terms of the LTIP (2014: 1,234,184).
The characteristics of the LTIP indicate that, at the Ardent Leisure Group level, it is an equity settled share-based payment under AASB 2 Share-based Payment as the holders are entitled to the securities as long as they meet the LTIP’s service and performance criteria. However, as ALL is considered to be a subsidiary of the Trust, in the financial statements of the ALL Group the LTIP is accounted for as a cash settled share-based payment.
F
or p
erso
nal u
se o
nly
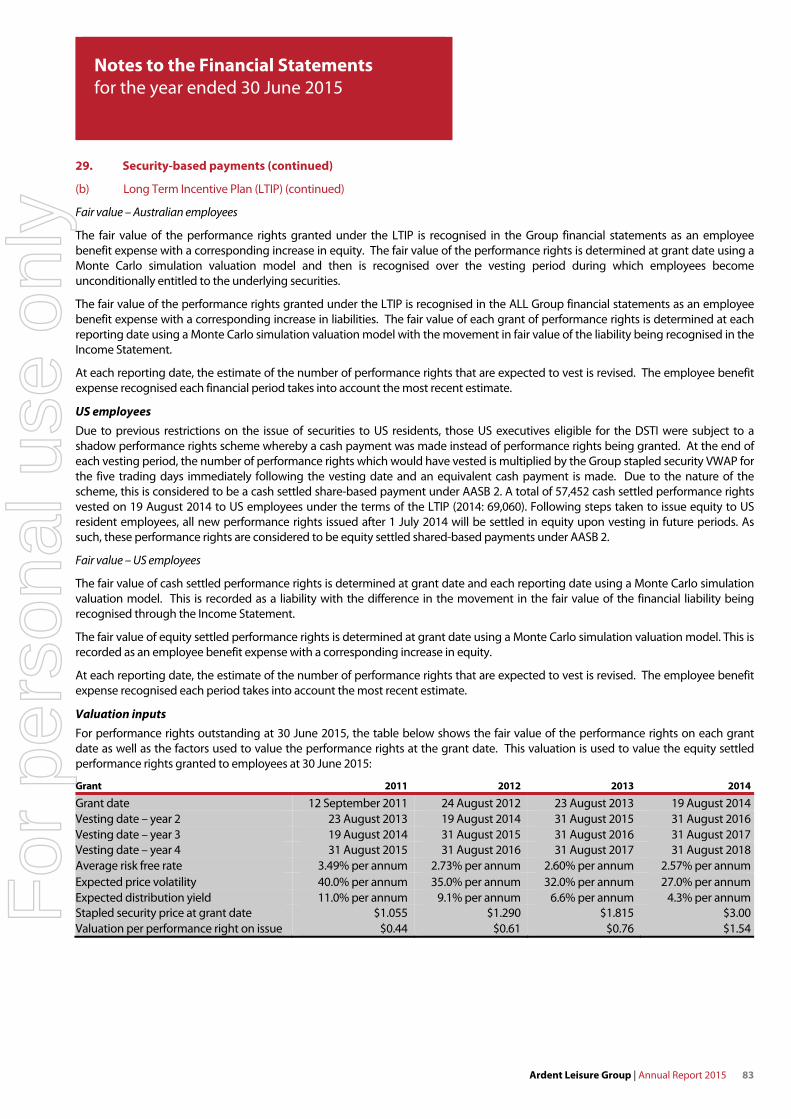
Notes to the Financial Statements for the year ended 30 June 2015
Ardent Leisure Group | Annual Report 2015 83
29. Security-based payments (continued)
(b) Long Term Incentive Plan (LTIP) (continued)
Fair value – Australian employees
The fair value of the performance rights granted under the LTIP is recognised in the Group financial statements as an employee benefit expense with a corresponding increase in equity. The fair value of the performance rights is determined at grant date using a Monte Carlo simulation valuation model and then is recognised over the vesting period during which employees become unconditionally entitled to the underlying securities.
The fair value of the performance rights granted under the LTIP is recognised in the ALL Group financial statements as an employee benefit expense with a corresponding increase in liabilities. The fair value of each grant of performance rights is determined at each reporting date using a Monte Carlo simulation valuation model with the movement in fair value of the liability being recognised in the Income Statement.
At each reporting date, the estimate of the number of performance rights that are expected to vest is revised. The employee benefit expense recognised each financial period takes into account the most recent estimate.
US employees Due to previous restrictions on the issue of securities to US residents, those US executives eligible for the DSTI were subject to a shadow performance rights scheme whereby a cash payment was made instead of performance rights being granted. At the end of each vesting period, the number of performance rights which would have vested is multiplied by the Group stapled security VWAP for the five trading days immediately following the vesting date and an equivalent cash payment is made. Due to the nature of the scheme, this is considered to be a cash settled share-based payment under AASB 2. A total of 57,452 cash settled performance rights vested on 19 August 2014 to US employees under the terms of the LTIP (2014: 69,060). Following steps taken to issue equity to US resident employees, all new performance rights issued after 1 July 2014 will be settled in equity upon vesting in future periods. As such, these performance rights are considered to be equity settled shared-based payments under AASB 2.
Fair value – US employees
The fair value of cash settled performance rights is determined at grant date and each reporting date using a Monte Carlo simulation valuation model. This is recorded as a liability with the difference in the movement in the fair value of the financial liability being recognised through the Income Statement.
The fair value of equity settled performance rights is determined at grant date using a Monte Carlo simulation valuation model. This is recorded as an employee benefit expense with a corresponding increase in equity.
At each reporting date, the estimate of the number of performance rights that are expected to vest is revised. The employee benefit expense recognised each period takes into account the most recent estimate.
Valuation inputs For performance rights outstanding at 30 June 2015, the table below shows the fair value of the performance rights on each grant date as well as the factors used to value the performance rights at the grant date. This valuation is used to value the equity settled performance rights granted to employees at 30 June 2015:
Grant 2011 2012 2013 2014
Grant date 12 September 2011 24 August 2012 23 August 2013 19 August 2014Vesting date – year 2 23 August 2013 19 August 2014 31 August 2015 31 August 2016Vesting date – year 3 19 August 2014 31 August 2015 31 August 2016 31 August 2017Vesting date – year 4 31 August 2015 31 August 2016 31 August 2017 31 August 2018Average risk free rate 3.49% per annum 2.73% per annum 2.60% per annum 2.57% per annumExpected price volatility 40.0% per annum 35.0% per annum 32.0% per annum 27.0% per annumExpected distribution yield 11.0% per annum 9.1% per annum 6.6% per annum 4.3% per annumStapled security price at grant date $1.055 $1.290 $1.815 $3.00Valuation per performance right on issue $0.44 $0.61 $0.76 $1.54
For
per
sona
l use
onl
y

Notes to the Financial Statements for the year ended 30 June 2015
84 Ardent Leisure Group | Annual Report 2015
29. Security-based payments (continued)
(b) Long Term Incentive Plan (LTIP) (continued)
Valuation inputs (continued) The table below shows the fair value of the performance rights for each grant as at 30 June 2015 as well as the factors used to value the performance rights at 30 June 2015. This valuation is used to value the cash settled performance rights granted to employees at 30 June 2015:
Grant 2011 2012 2013 2014
Grant date 12 September 2011 24 August 2012 23 August 2013 19 August 2014Vesting date – year 2 23 August 2013 19 August 2014 31 August 2015 31 August 2016Vesting date – year 3 19 August 2014 31 August 2015 31 August 2016 31 August 2017Vesting date – year 4 31 August 2015 31 August 2016 31 August 2017 31 August 2018Average risk free rate 2.00% per annum 2.00% per annum 2.00% per annum 2.00% per annumExpected price volatility 41.9% per annum 41.9% per annum 39.3% per annum 36.2% per annumExpected distribution yield 5.8% per annum 5.8% per annum 5.8% per annum 5.8% per annumStapled security price at year end $2.17 $2.17 $2.17 $2.17Valuation per performance right on issue $2.17 $1.94 $1.43 $0.58
Grants of performance rights are made annually with the grant date being the date of the issue of the offer letters to employees. Although the grant date may vary from year to year, the testing period (subject to any hurdles) remains constant with the vesting date being 24 hours immediately following the announcement of the Group’s full year financial results.
Performance hurdles In order for any or all of the performance rights to vest under the LTIP, the Group's TSR and/or (for grants made after 1 July 2014) the EPS hurdle must be met.
TSR
The Group’s TSR for the performance period must exceed the 50th percentile of the TSRs of the benchmark for the same period. A sliding scale of vesting applies above the 50th percentile threshold.
TSR of the Group relative to TSRs of comparators Proportion of performance rights vesting
Below 51st percentile 0%51st percentile 50%Between 51st percentile and 75th percentile Straight-line vesting between 50% and 100%75th percentile or higher 100%
TSR over a performance period is measured against the benchmark group securities calculated at the average closing price of securities on the ASX for the calendar month period up to and including each of the first and last dates of the performance period. Distributions are assumed to be reinvested at the distribution date and any franking credits (or similar) are ignored.
EPS
The Group’s compound EPS growth for the performance period must exceed 5%. A sliding scale of vesting applies above 5% threshold.
Compound EPS growth in the period Proportion of performance rights vesting
Below 5% 0%5% 50%Between 5% and 10% Straight-line vesting between 50% and 100%10% or higher 100%
The weighting between the two performance measures is split as follows:
TSR – 50%; and EPS – 50%.
For
per
sona
l use
onl
y

Notes to the Financial Statements for the year ended 30 June 2015
Ardent Leisure Group | Annual Report 2015 85
29. Security-based payments (continued)
(b) Long Term Incentive Plan (LTIP) (continued)
The number of rights outstanding and the grant dates of the rights are shown in the tables below:
ConsolidatedGroup
Consolidated Group ALL Group ALL Group
2015 2014 2015 2014
Rights Rights Rights Rights
Performance rights issued to participating executives:
Performance rights 2,348,012 3,147,473 2,348,012 3,147,473
Grant date Expiry date Exercise price
Valuation per right
Balance at beginning of
the year Granted ExercisedFailed to
vest Cancelled
Balance at the end of
the year
16 Dec 2010 19 Aug 2014 nil 52.3 cents 411,014 - (411,014) - - -12 Sep 2011 31 Aug 2015 nil 43.7 cents 912,756 - (456,377) - (15,270) 441,10924 Aug 2012 31 Aug 2016 nil 60.9 cents 1,006,467 - (335,488) - (23,802) 647,17723 Aug 2013 31 Aug 2017 nil 76.3 cents 817,236 - - - (29,605) 787,63119 Aug 2014 31 Aug 2018 nil 153.9 cents - 472,095 - - - 472,095 3,147,473 472,095 (1,202,879) - (68,677) 2,348,012
The rights have an average maturity of one year and three months.
The expense recorded in the Group financial statements in the year in relation to the performance rights was $1,761,441 (2014: $1,996,226). The expense recorded in the ALL Group financial statements in the year in relation to the performance rights was $2,595,805 (2014: $6,202,877).
For
per
sona
l use
onl
y

Notes to the Financial Statements for the year ended 30 June 2015
86 Ardent Leisure Group | Annual Report 2015
Reserves
ConsolidatedGroup
Consolidated Group ALL Group ALL Group
2015 2014 2015 2014 $’000 $’000 $’000 $’000
Asset revaluation reserve Opening balance 6,225 2,620 3,416 3,416Revaluation - Theme parks 7,541 6,866 - -Transfer to retained profits - realised items (3,337) (3,261) - -Closing balance 10,429 6,225 3,416 3,416
Capital reserve Opening balance (11,018) (8,439) - -Transfer from retained profits - pre-opening expenses (4,677) (2,579) - -Transfer to retained profits 15,695 - - -
Closing balance - (11,018) - -
Cash flow hedge reserve Opening balance (1,124) (1,569) (19) -Movement in effective cash flow hedges (958) 434 (75) (30)Tax on movement on US cash flow hedges 24 11 24 11
Closing balance (2,058) (1,124) (70) (19)
Foreign currency translation reserve Opening balance (38,768) (39,159) (2,624) (1,682)Translation of foreign operations 3,623 391 6,916 (942)
Closing balance (35,145) (38,768) 4,292 (2,624)
Stapled security-based payment reserveOpening balance (96) 1,867 - -Option expense (3,821) (1,963) - -
Closing balance (3,917) (96) - -
Performance fee reserve Opening balance 1,132 1,132 - -Transfer to retained profits (1,132) - - -
Closing balance - 1,132 - -
Goodlife put and call option reserve Opening balance (2,269) (2,269) (2,310) (2,310)Transfer to retained profits 2,269 - 2,310 -Closing balance - (2,269) - (2,310)
Total reserves (30,691) (45,918) 7,638 (1,537)
For
per
sona
l use
onl
y

Notes to the Financial Statements for the year ended 30 June 2015
Ardent Leisure Group | Annual Report 2015 87
30. Reserves (continued)
The asset revaluation reserve is used to record increments and decrements on the revaluation of property, plant and equipment.
The capital reserve is used to record one off costs incurred in the identification of new acquisitions or development of new sites which are not able to be capitalised by the Group as well as the difference between the amount paid and the net assets acquired in the acquisition of non-controlling interests.
The cash flow hedge reserve is used to record gains or losses on a hedging instrument in a cash flow hedge that are recognised directly in equity as described in Notes 1(p)(ii) and 14.
Exchange differences arising on the translation of foreign controlled entities are taken to the foreign currency translation reserve. In addition, on consolidation, exchange differences on loans denominated in foreign currencies are taken directly to the foreign currency translation reserve where the loan is considered part of the net investment in that foreign operation.
The stapled security-based payment reserve is used to recognise the fair value of performance rights issued to employees but not yet exercised under the Group’s DSTI and LTIP.
The performance fee reserve was used to recognise the fair value of stapled securities not yet issued to the Manager in settlement for the performance fee earned in the relevant period. The performance fee of $1.1 million was earned in the period to 30 June 2009. On the internalisation of the Manager, the performance fee payment was waived by Macquarie Group Limited but under the accounting standards, the reserve is not reversed.
The Group had the option to acquire the non-controlling interests in Ardent Leisure Health Clubs 1 Pty Limited. In accordance with AASB 132 Financial Instruments: Presentation, on first recognition the Group recorded the potential obligation under the put option on the Balance Sheet as a financial liability calculated as the present value of the redemption amount on the first exercise date. Under the Group’s economic equity approach, the initial recognition of the redemption amount was recorded in the Goodlife put and call option reserve. Movements in the financial liability due to changes in the expected redemption amount and unwinding of the present value discount were taken to the Income Statement as finance costs in subsequent periods. In a prior period, the Group acquired the remaining interest in Ardent Leisure Health Clubs 1 Pty Limited but due to the accounting standards, the reserve remained.
Retained profits/(accumulated losses)
ConsolidatedGroup
Consolidated Group ALL Group ALL Group
2015 2014 2015 2014 $’000 $’000 $’000 $’000
Opening balance 37,508 31,691 (1,655) (2,837)Profit for the year 32,122 49,002 6,862 5,056Available for distribution 69,630 80,693 5,207 2,219Transfer from asset revaluation reserve 3,337 3,261 - -Transfer (from)/to capital reserve (11,018) 2,579 - -Transfer from performance fee reserve 1,132 - - -Transfer from Goodlife put and call option reserve (2,269) - (2,310) -Distributions and dividends paid and payable (55,820) (49,025) (14,790) (3,874)
Closing balance 4,992 37,508 (11,893) (1,655)
The distribution of 5.5 cents per stapled security for the year ended 30 June 2015 totalling $24.3 million had not been declared at year end. This will be paid on or before 31 August 2015, as described in Note 44.
For
per
sona
l use
onl
y

Notes to the Financial Statements for the year ended 30 June 2015
88 Ardent Leisure Group | Annual Report 2015
Business combinations
Current period
Fitness First Western Australia On 4 September 2014, the Group acquired eight health clubs, for $32.0 million of which $2.3 million is payable in September 2015. Transaction costs totalling $1,856,774 were incurred on this project, expensed in the Income Statement and recognised within operating cash flows in the Statement of Cash Flows.
The acquired business contributed revenues of $17.4 million and a profit before allocation of Group costs and tax of $3.6 million to the Group for the period from 4 September 2014 to 30 June 2015. If the acquisition had occurred on 1 July 2014, it would have contributed revenues of $21.3 million and a profit before allocation of Group costs and tax of $4.5 million for the year ended 30 June 2015.
Details of the fair value of the assets and liabilities acquired and goodwill are as follows:
Consolidated
Group ALL Group $’000 $’000
Purchase consideration: Cash paid 31,958 29,768
Total purchase consideration 31,958 29,768 Fair value of net identifiable assets acquired 6,839 4,649
Goodwill 25,119 25,119 The goodwill is attributable to the health clubs’ strong market position and profitable trading history and synergies expected to arise after the Group’s acquisition. None of the goodwill is expected to be deductible for tax purposes.
ConsolidatedGroup
Consolidated Group ALL Group ALL Group
Acquiree's carrying amount Fair value
Acquiree's carrying amount Fair value
$’000 $’000 $’000 $’000
Cash and cash equivalents 6 6 6 6 Other current assets 465 465 465 465 Customer relationship intangible assets - 6,100 - 6,100 Property, plant and equipment 5,426 4,744 1,367 718 Net deferred tax assets/(liabilities) 92 (1,738) 92 (1,738) Deferred income (53) (53) (53) (53) Payables (541) (541) (541) (541) Property onerous lease contracts provision - (1,084) - -Provision for property make good obligations - (752) - - Employee benefits provision (308) (308) (308) (308) Net identifiable assets acquired 5,087 6,839 1,028 4,649
Consolidated Group ALL Group
$’000 $’000
Outflow of cash to acquire business: Cash consideration 31,958 29,768 Less: cash balances acquired (6) (6) Less: deferred settlement (2,297) (2,297) Outflow of cash 29,655 27,465
For
per
sona
l use
onl
y

Notes to the Financial Statements for the year ended 30 June 2015
Ardent Leisure Group | Annual Report 2015 89
32. Business combinations (continued)
Current period (continued)
Hypoxi US and Canada On 6 August 2014, the Group completed the acquisition of the exclusive US and Canadian distribution and master franchise rights for the Hypoxi targeted weight loss business for $0.8 million. Transaction costs totalling $39,509 were incurred on this project, expensed in the Income Statement and recognised within operating cash flows in the Statement of Cash Flows.
During the year ended 30 June 2015, the Group has identified a location in Arizona for its first new studio with trading expected to commence in August 2015. As a result, it has not contributed materially to the Group result for the year ended 30 June 2015.
Final details of the fair value of the assets and liabilities acquired and goodwill are as follows:
Consolidated
Group ALL Group $’000 $’000
Purchase consideration: Cash paid 815 815
Total purchase consideration 815 815
Fair value of net identifiable assets acquired 815 815
Goodwill - -
ConsolidatedGroup
Consolidated Group ALL Group ALL Group
Acquiree'scarryingamount Fair value
Acquiree'scarryingamount Fair value
$’000 $’000 $’000 $’000
Distribution agreement intangible assets - 1,165 - 1,165Net deferred tax liabilities - (350) - (350)
Net identifiable assets acquired - 815 - 815
Consolidated
Group ALL Group
$’000 $’000
Outflow of cash to acquire business: Cash consideration 815 815Outflow of cash 815 815 Playtime Highpoint Victoria On 5 November 2014, the Group acquired Playtime Highpoint, an amusement game arcade in Victoria, for $2.5 million. Transaction costs totalling $1,090 were incurred on this project, expensed in the Income Statement and recognised within operating cash flows in the Statement of Cash Flows.
The acquired business contributed revenues of $1.4 million and a profit before allocation of Group costs and tax of $0.4 million to the Group for the period from 5 November 2014 to 30 June 2015. If the acquisition had occurred on 1 July 2014, it would have contributed revenues of $2.3 million and a profit before allocation of Group costs and tax of $0.7 million for the year ended 30 June 2015.
For
per
sona
l use
onl
y

Notes to the Financial Statements for the year ended 30 June 2015
90 Ardent Leisure Group | Annual Report 2015
32. Business combinations (continued)
Current period (continued)
Playtime Highpoint Victoria (continued) Final details of the fair value of the assets and liabilities acquired and goodwill are as follows:
Consolidated
Group ALL Group $’000 $’000
Purchase consideration: Cash paid 2,463 2,538
Total purchase consideration 2,463 2,538
Fair value of net identifiable assets acquired 465 540
Goodwill 1,998 1,998
ConsolidatedGroup
Consolidated Group ALL Group ALL Group
Acquiree'scarryingamount Fair value
Acquiree's carrying amount Fair value
$’000 $’000 $’000 $’000
Cash and cash equivalents 42 42 42 42Other current assets 102 102 102 102Property, plant and equipment 422 422 399 399Net deferred tax assets 2 2 2 2Provision for property make good obligations - (98) - -Employee benefits provision (5) (5) (5) (5)Net identifiable assets acquired 563 465 540 540
Consolidated Group ALL Group
$’000 $’000
Outflow of cash to acquire business: Cash consideration 2,463 2,538Less: cash balances acquired (42) (42)Outflow of cash 2,421 2,496 Other business combinations On 30 September 2014, the Group acquired a Hypoxi studio at Ballantyne, North Carolina for $233,000. Goodwill of $137,000 was recognised on acquisition, however has now been fully impaired due to the club closing. On 31 October 2014, the Group acquired a Hypoxi studio at Randwick, Sydney for $198,000. Goodwill of $43,000 was recognised on acquisition.
Prior period
During the period, the Group finalised its prior year acquisitions of Camberwell and Port Melbourne health clubs, Hypoxi Australia Pty Limited, Hypoxi New Zealand and the City Amusements amusement game arcade. Purchase price and goodwill adjustments on finalisation were immaterial in nature.
For
per
sona
l use
onl
y

Notes to the Financial Statements for the year ended 30 June 2015
Ardent Leisure Group | Annual Report 2015 91
Cash and cash equivalents
For the purposes of the Statements of Cash Flows, cash includes only cash at banks and on deposit. Cash as at 30 June 2015 as shown in the Statements of Cash Flows is reconciled to the related items in the Balance Sheets as follows:
ConsolidatedGroup
Consolidated Group ALL Group ALL Group
2015 2014 2015 2014 $’000 $’000 $’000 $’000
Cash at bank 4,923 7,016 4,622 6,134Cash on deposit 63 63 63 63
Total cash and cash equivalents 4,986 7,079 4,685 6,197
Cash on deposit at call in the Group bears an average floating interest rate of 1.89% per annum (2014: 2.44% per annum).
Cash on deposit at call in the ALL Group bears an average floating interest rate of 2.00% per annum (2014: 2.50% per annum).
Cash flow information
(a) Reconciliation of profit to net cash flows from operating activities
ConsolidatedGroup
Consolidated Group ALL Group ALL Group
2015 2014 2015 2014 $’000 $’000 $’000 $’000
Profit 32,122 49,002 6,862 5,056
Non-cash items Depreciation of property, plant and equipment 47,256 35,588 24,153 14,552Amortisation 7,592 6,415 7,592 6,415Depreciation of livestock 30 40 30 40Impairment of goodwill 141 - 141 -Security-based payments 1,396 1,996 2,231 6,203Provision for doubtful debts 200 122 200 122Onerous lease costs 2,598 - 1,465 -Loss on sale of property, plant and equipment and livestock 919 74 772 81Loss on closure of bowling centre 104 1,579 - -Impairment of property, plant and equipment 2,646 - 1,009 -Valuation loss on investment properties and property, plant and equipment 501 (8,590) - -
Classified as financing activities Borrowing costs 11,333 11,330 11,731 8,766
Classified as investing activities Unrealised (gain)/loss on derivatives (552) 613 - -Gain on sale of family entertainment centres (7,355) - (7,355) -
Changes in asset and liabilities: Decrease/(increase) in assets: Receivables (3,345) (13) (4,633) 298 Inventories (1,993) 404 (1,993) 404 Deferred tax assets (2,265) (1,818) (2,265) (1,818) Other assets (3,333) (775) (3,123) (722)Increase/(decrease) in liabilities: Payables and other liabilities 19,040 3,440 17,422 2,343 Provisions (136) (386) 764 (386) Payable to the Trust - - 2,033 (1,860) Current tax liabilities 363 (2,120) 358 (2,120) Deferred tax liabilities 8,090 567 8,090 567Net cash flows from operating activities 115,352 97,468 65,484 37,941
For
per
sona
l use
onl
y

Notes to the Financial Statements for the year ended 30 June 2015
92 Ardent Leisure Group | Annual Report 2015
34. Cash flow information (continued)
(b) Non-cash financing and investing activities
ConsolidatedGroup
Consolidated Group ALL Group ALL Group
2015 2014 2015 2014 $’000 $’000 $’000 $’000
The following items are not reflected in the Statements of Cash Flows:
Distributions by the Group satisfied during the year by the issue of stapled securities under the DRP 16,779 8,918 3,658 1,504
Net tangible assets
Consolidated Group
ConsolidatedGroup
2015 2014
$’000 $’000
Net tangible assets are calculated as follows: Total assets 996,507 853,007Less: intangible assets (242,944) (201,237)Less: total liabilities (417,025) (347,505)
Net tangible assets 336,538 304,265
Total number of stapled securities on issue 442,322,106 405,055,708Net tangible asset backing per stapled security $0.76 $0.75
Related party disclosures
(a) Directors
The following persons have held office as Directors of the Manager and ALL during the period and up to the date of this report:
Neil Balnaves AO (Chair); Roger Davis; David Haslingden (appointed 6 July 2015); Anne Keating (retired 29 October 2014); Don Morris AO; Greg Shaw (retired 10 March 2015); Deborah Thomas; George Venardos; and Melanie Willis (appointed 17 July 2015).
(b) Parent entity
The immediate and ultimate parent entity of the Group is Ardent Leisure Trust.
The immediate and ultimate parent entity of the ALL Group is Ardent Leisure Limited.
For
per
sona
l use
onl
y

Notes to the Financial Statements for the year ended 30 June 2015
Ardent Leisure Group | Annual Report 2015 93
36. Related party disclosures (continued)
(c) Key controlled entities
These financial statements incorporate the assets, liabilities and results of the following wholly-owned key subsidiaries in accordance with the accounting policy disclosure as described in Note 1(b):
Entity Activity Country of
establishment Class of equity
securities
Controlled entities of Ardent Leisure Trust: Ardent Leisure Trust Principal lessee: Marinas, bowling centres
Freehold owner: Theme parks Australia OrdinaryArdent Leisure (NZ) Trust Principal lessee: Bowling centres New Zealand OrdinaryGoodlife Subtrust Principal lessee: Health clubs Australia Ordinary
Controlled entities of Ardent Leisure Limited: Ardent Leisure Limited Theme Parks, Marinas Australia OrdinaryBowling Centres Australia Pty Limited Bowling centres Australia OrdinaryArdent Leisure Operations (NZ) Limited Bowling centres New Zealand OrdinaryMain Event Holdings, Inc Family entertainment centres USA OrdinaryGoodlife Operations Pty Limited Health clubs Australia OrdinaryHypoxi Australia Pty Limited Targeted weight loss solutions Australia OrdinaryHypoxi (US) LLC
(d) Transactions with related parties
Key management personnel
Consolidated Group
Consolidated Group ALL Group ALL Group
2015 2014 2015 2014$ $ $ $
Short term employee benefits 4,587,929 4,154,999 4,587,929 4,154,999 Post employment benefits 168,555 162,233 168,555 162,233 Share-based payments 1,284,888 1,194,933 1,665,352 4,305,134
6,041,372 5,512,165 6,421,836 8,622,366
Remuneration of key management personnel (KMP) is shown in the Directors’ report from page 13 to page 31.
(e) Loans to KMP
There were no loans to KMP during the financial year or prior corresponding period.
(f) Other transactions with KMP
No Director has entered into a material contract with the Group and there were no material contracts involving Directors’ interests existing at year end not previously disclosed.
Targeted weight loss solutions USA Ordinary
For
per
sona
l use
onl
y

Notes to the Financial Statements for the year ended 30 June 2015
94 Ardent Leisure Group | Annual Report 2015
36. Related party disclosures (continued)
(g) Transactions with controlled entities
All transactions with controlled entities were made on normal commercial terms and conditions and at market rates, except that there are no fixed terms for the repayment of loans between the parties. Outstanding balances are unsecured and are repayable in cash. The terms and conditions of the tax funding agreement are set out in Note 10(e). The transactions incurred in the year with controlled entities were:
Consolidated Group
Consolidated Group ALL Group ALL Group
2015 2014 2015 2014 $ $ $ $
Purchases of goods Reimbursable expenses to related parties (15,312) (7,438) (15,312) (7,438)
Tax consolidation legislation Current tax payable assumed from wholly-owned tax consolidated entities - - (4,828,281) (7,287,779)
Loans from Ardent Leisure Trust Balance at the beginning of the year - - (125,365,392) (113,598,779)Loans advanced - - (129,802,645) (94,287,532)Loan repayments made - - 134,550,710 88,095,545Foreign exchange movements - - (39,692) 594 Interest charged - - (6,243,481) (5,575,220)Balance at the end of the year - - (126,900,500) (125,365,392)
Segment information
Business segments
The Group is organised on a global basis into the following divisions by product and service type:
Family entertainment centres
This segment comprises of 20 Main Event sites in Texas, Arizona, Georgia, Illinois and Oklahoma, United States of America.
Bowling centres
This segment comprises 49 bowling centres and four amusement arcades located in Australia and New Zealand.
Marinas
This segment comprises seven d’Albora Marina properties, located in New South Wales and Victoria.
Theme parks
This segment comprises Dreamworld and WhiteWater World in Coomera, Queensland and the SkyPoint observation deck and climb in Surfers Paradise, Queensland.
Health clubs This comprises 76 centres in Queensland, New South Wales, Victoria, South Australia and Western Australia, two independent Hypoxi studios in New South Wales, and one independent Hypoxi studio in Ballantyne, North Carolina.
The main income statement items used by management to assess each of the divisions are divisional revenue and divisional EBITDA before property costs and after property costs. In addition, depreciation and amortisation are analysed by division. Each of these income statement items is looked at after adjusting for pre-opening expenses, straight lining of fixed rent increases, IFRS depreciation, onerous leases costs, amortisation of intangible assets and impairment of property, plant and equipment and intangible assets. As shown in Note 11, these items are excluded from management’s definition of core earnings.
The Group’s principal activity is to invest in and operate leisure and entertainment businesses in Australia, New Zealand and the United States of America.
For
per
sona
l use
onl
y

Notes to the Financial Statements for the year ended 30 June 2015
Ardent Leisure Group | Annual Report 2015 95
37. Segment information (continued)
Business segment 2015 Consolidated Group Family
entertainment Bowling Theme Health centres centres Marinas parks clubs Other Total
$’000 $’000 $’000 $’000 $’000 $’000 $’000
Revenue from operating activities 177,123 116,510 22,952 99,571 178,388 59 594,603
Divisional EBITDA before property costs(1) 64,439 40,279 12,765 33,163 72,543 49 223,238Divisional EBITDA(2) 45,657 13,989 10,150 32,015 28,152 49 130,012Depreciation and amortisation(3) (11,982) (7,859) (929) (5,394) (10,018) (816) (36,998)
Divisional EBIT(4) 33,675 6,130 9,221 26,621 18,134 (767) 93,014
Pre-opening expenses, straight lining of fixed rent increases, IFRS depreciation, onerous lease costs, intangible asset amortisation and impairment of property, plant and equipment and intangible assets not included in divisional EBIT (32,122)Valuation loss - investment properties (501)Loss on closure of bowling centre (104)Loss on disposal of assets (523)Gain on sale and leaseback of family entertainment centres 6,959Net gain from derivative financial instruments 552Interest income 121Corporate costs (15,056)Business acquisition costs (1,938)Borrowing costs (11,333)Net tax expense (6,947)Profit for the year 32,122
Total assets 217,949 140,870 109,862 264,552 250,427 12,847 996,507Acquisitions of property, plant and equipment, investment properties and intangible assets 88,767 21,530 4,860 7,793 59,695 2,158 184,803
(1) Excludes pre-opening expenses of $6,521,000. (2) Excludes straight lining of fixed rent increases of $2,336,000, pre-opening expenses of $6,521,000 and onerous lease costs of $2,598,000. (3) Excludes IFRS depreciation of $11,102,000, amortisation of intangible assets totalling $6,778,000 and impairment of property, plant and equipment and
intangible assets of $2,787,000. (4) Excludes of pre-opening expenses of $6,521,000, straight lining of fixed rent increases of $2,336,000, onerous leases costs of $2,598,000, IFRS depreciation of
$11,102,000, amortisation of intangible assets of $6,778,000 and impairment of property, plant and equipment and intangible assets of $2,787,000.
For
per
sona
l use
onl
y

Notes to the Financial Statements for the year ended 30 June 2015
96 Ardent Leisure Group | Annual Report 2015
37. Segment information (continued)
Business segment 2014
Consolidated Group Family entertainment Bowling Theme Health centres centres Marinas parks clubs Other Total $’000 $’000 $’000 $’000 $’000 $’000 $’000
Revenue from operating activities 98,121 113,889 23,466 100,139 164,070 18 499,703
Divisional EBITDA before property costs(1) 36,896 38,907 12,944 33,867 70,249 (1) 192,862Divisional EBITDA(2) 24,714 13,765 10,396 32,799 33,990 (1) 115,663Depreciation and amortisation(3) (6,626) (7,274) (858) (4,982) (6,902) (506) (27,148) Divisional EBIT(4) 18,088 6,491 9,538 27,817 27,088 (507) 88,515 Pre-opening expenses, straight lining of fixed rent increases, IFRS depreciation and intangible asset amortisation not included in divisional EBIT (19,020)Valuation gains - property, plant and equipment 8,590Loss on closure of bowling centre (1,579)Loss on disposal of assets (453)Gain on sale and leaseback of family entertainment centre 379Net loss from derivative financial instruments (613)Interest income 211Corporate costs (12,545)Business acquisition costs (277)Borrowing costs (11,330)Net tax expense (2,876)
Profit for the year 49,002
Total assets 138,167 131,157 103,734 262,225 211,691 6,033 853,007Acquisitions of property, plant and equipment, investment properties and intangible assets 56,871 7,598 2,725 8,516 24,174 1,809 101,693
(1) Excludes pre-opening expenses of $2,579,000. (2) Excludes straight lining of fixed rent increases of $1,546,000 and pre-opening expenses of $2,579,000. (3) Excludes IFRS depreciation of $8,562,000 and amortisation of intangible assets totalling $6,333,000. (4) Excludes of pre-opening expenses of $2,579,000, straight lining of fixed rent increases of $1,546,000, IFRS depreciation of $8,562,000 and amortisation of
intangible assets of $6,333,000.
For
per
sona
l use
onl
y

Notes to the Financial Statements for the year ended 30 June 2015
Ardent Leisure Group | Annual Report 2015 97
37. Segment information (continued)
Business segment 2015 ALL Group Family
entertainment Bowling Theme Health centres centres Marinas parks clubs Other Total
$’000 $’000 $’000 $’000 $’000 $’000 $’000
Revenue from operating activities 177,123 116,510 22,952 99,571 178,388 59 594,603
Divisional EBITDA before rent to Trust(1) 45,657 40,279 12,765 33,163 60,186 49 192,099Divisional EBITDA after rent to Trust(1) 45,657 6,261 1,107 2,621 21,317 49 77,012Depreciation and amortisation(2) (11,982) (1,054) (75) (1,113) (9,959) (814) (24,997)
Divisional EBIT(3) 33,675 5,207 1,032 1,508 11,358 (765) 52,015
Pre-opening expenses, straight lining of fixed rent increases, onerous lease costs, intangible asset amortisation and impairment of property, plant and equipment and intangible assets not included in divisional EBIT (17,220)Loss on disposal of assets (376)Gain on sale and leaseback of family entertainment centres 6,959 Interest income 77 Foreign exchange gain 312 Corporate costs (14,079)Business acquisition costs (1,938)Borrowing costs (11,731)Net tax expense (7,157)
Profit for the year 6,862
Total assets 217,842 39,383 3,429 16,963 207,054 14,394 499,065 Acquisitions of property, plant and equipment, investment properties and intangible assets 88,767 6,898 883 5,195 49,657 2,158 153,558
(1) Excludes pre-opening expenses of $6,521,000, straight lining of fixed rent of $1,306,000 and onerous lease costs of $1,465,000. (2) Excludes amortisation of intangible assets of $6,778,000 and impairment of property, plant and equipment and intangible assets of $1,150,000. (3) Excludes pre-opening expenses of $6,521,000, straight lining of fixed rent of $1,306,000, onerous lease costs of $1,465,000, amortisation of intangible assets
of $6,778,000 and impairment of property, plant and equipment and intangible assets of $1,150,000.
For
per
sona
l use
onl
y

Notes to the Financial Statements For the year ended 30 June 2015
98 Ardent Leisure Group | Annual Report 2015
37. Segment information (continued)
Business segment 2014 ALL Group Family entertainment Bowling Theme Health centres centres Marinas parks clubs Other Total $’000 $’000 $’000 $’000 $’000 $’000 $’000
Revenue from operating activities 98,121 113,889 23,466 100,139 164,070 18 499,703 Divisional EBITDA before rent to Trust(1) 24,714 38,712 12,944 33,867 58,545 (1) 168,781Divisional EBITDA after rent to Trust(1) 24,714 5,192 956 2,854 22,520 - 56,236Depreciation and amortisation(2) (6,626) (456) (5) (250) (6,830) (507) (14,674)
Divisional EBIT(3) 18,088 4,736 951 2,604 15,690 (507) 41,562 Pre-opening expenses, straight lining of fixed rent increases and intangible asset amortisation not included in divisional EBIT (9,791) Loss on disposal of assets (460)Gain on sale and leaseback of family entertainment centre 379 Interest income 99 Corporate costs (15,038) Foreign exchange loss (25) Business acquisition costs (277) Borrowing costs (8,766) Net tax expense (2,627) Profit for the year 5,056 Total assets 138,365 33,183 1,753 14,834 172,903 5,365 366,403 Acquisitions of property, plant and equipment, investment properties and intangible assets 56,870 3,524 129 2,464 20,943 1,809 85,739
(1) Excludes pre-opening expenses of $2,579,000 and straight lining of fixed rent of $879,000. (2) Excludes amortisation of intangible assets of $6,333,000. (3) Excludes pre-opening expenses of $2,579,000, straight lining of fixed rent of $879,000 and amortisation of intangible assets of $6,333,000.
For
per
sona
l use
onl
y
Notes to the Financial Statements for the year ended 30 June 2015
Ardent Leisure Group | Annual Report 2015 99
38. Capital and financial risk management
(a) Capital risk management
The Group’s objectives when managing capital is to optimise stapled security holder value through the mix of available capital sources while complying with statutory and constitutional capital and distribution requirements, maintaining gearing, interest cover and debt serviceability ratios within approved limits and continuing to operate as a going concern.
The Group assesses its capital management approach as a key part of the Group’s overall strategy and it is continuously reviewed by management and the Board.
The Group is able to alter its capital mix by issuing new stapled securities, activating the DRP, electing to have the DRP underwritten, adjusting the amount of distributions paid, activating a stapled security buy-back program or selling assets to reduce borrowings.
The Group has a target gearing ratio of 30% - 35% of debt to debt plus equity. At 30 June 2015, gearing was 32.6% (2014: 34.1%) and the Group has complied with the financial covenants of its borrowing facilities in the current and previous financial years.
Protection of the Group’s equity in foreign denominated assets was achieved through borrowing in the local functional currency to provide a natural hedge supplemented by the use of foreign exchange forward contracts to provide additional hedge protection. The Group has a target equity hedge of 50% - 100% of the asset value by foreign currency.
The Trust also protects its equity in assets by taking out insurance with creditworthy insurers.
(b) Financial risk management
The Group’s principal financial instruments comprise cash, receivables, payables, interest bearing liabilities and derivative financial instruments.
The Group’s activities expose it to a variety of financial risks: market risk (including foreign exchange risk and interest rate risk), liquidity risk and credit risk.
The Group manages its exposure to these financial risks in accordance with the Group’s Financial Risk Management (FRM) policy as approved by the Board.
The FRM policy sets out the Group’s approach to managing financial risks, the policies and controls utilised to minimise the potential impact of these risks on its performance and the roles and responsibilities of those involved in the management of these financial risks.
The Group uses various measures to manage exposures to these types of risks. The main methods include foreign exchange and interest rate sensitivity analysis, ageing analysis and counterparty credit assessment and the use of future rolling cash flow forecasts.
The Group uses derivative financial instruments such as forward foreign exchange contracts, interest rate swaps and cross currency swaps to manage its financial risk as permitted under the FRM policy. Such instruments are used exclusively for hedging purposes i.e. not for trading or speculative purposes.
(c) Market risk
Foreign exchange risk
Foreign exchange risk is the risk that changes in foreign exchange rates will change the Australian dollar value of the Group’s net assets or its Australian dollar earnings.
Foreign exchange risk arises when future commercial transactions and recognised assets and liabilities are denominated in a currency that is not the Group’s functional currency.
The Group is exposed to foreign exchange risk through investing in overseas businesses and deriving operating income from those businesses. The Group manages this exposure on a consolidated basis.
The majority of derivatives utilised to manage this consolidated exposure are held by the Trust. Therefore, the information provided below is only meaningful for the Group.
For
per
sona
l use
onl
y
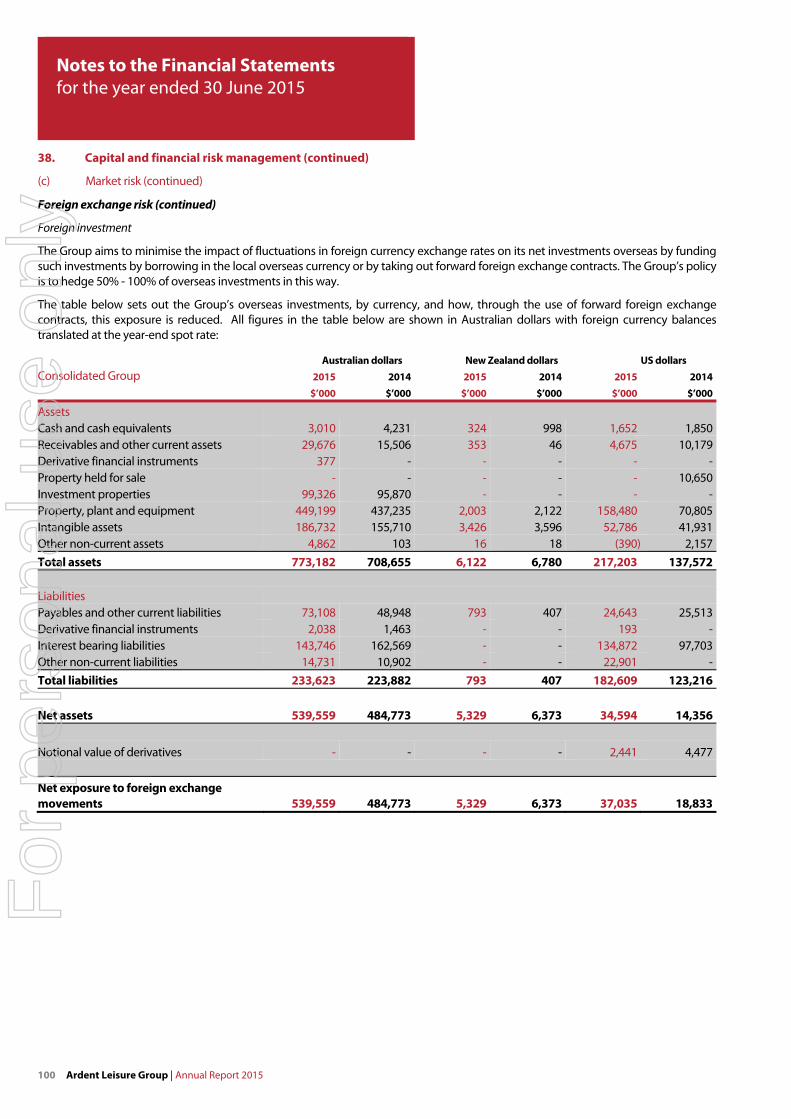
Notes to the Financial Statements for the year ended 30 June 2015
100 Ardent Leisure Group | Annual Report 2015
38. Capital and financial risk management (continued)
(c) Market risk (continued)
Foreign exchange risk (continued)
Foreign investment
The Group aims to minimise the impact of fluctuations in foreign currency exchange rates on its net investments overseas by funding such investments by borrowing in the local overseas currency or by taking out forward foreign exchange contracts. The Group’s policy is to hedge 50% - 100% of overseas investments in this way.
The table below sets out the Group’s overseas investments, by currency, and how, through the use of forward foreign exchange contracts, this exposure is reduced. All figures in the table below are shown in Australian dollars with foreign currency balances translated at the year-end spot rate:
Australian dollars New Zealand dollars US dollars Consolidated Group 2015 2014 2015 2014 2015 2014 $’000 $’000 $’000 $’000 $’000 $’000
Assets Cash and cash equivalents 3,010 4,231 324 998 1,652 1,850Receivables and other current assets 29,676 15,506 353 46 4,675 10,179Derivative financial instruments 377 - - - - -Property held for sale - - - - - 10,650Investment properties 99,326 95,870 - - - -Property, plant and equipment 449,199 437,235 2,003 2,122 158,480 70,805Intangible assets 186,732 155,710 3,426 3,596 52,786 41,931Other non-current assets 4,862 103 16 18 (390) 2,157Total assets 773,182 708,655 6,122 6,780 217,203 137,572
Liabilities Payables and other current liabilities 73,108 48,948 793 407 24,643 25,513Derivative financial instruments 2,038 1,463 - - 193 -Interest bearing liabilities 143,746 162,569 - - 134,872 97,703Other non-current liabilities 14,731 10,902 - - 22,901 -Total liabilities 233,623 223,882 793 407 182,609 123,216 Net assets 539,559 484,773 5,329 6,373 34,594 14,356
Notional value of derivatives - - - - 2,441 4,477
Net exposure to foreign exchange movements 539,559 484,773 5,329 6,373 37,035 18,833
For
per
sona
l use
onl
y

Notes to the Financial Statements for the year ended 30 June 2015
Ardent Leisure Group | Annual Report 2015 101
38. Capital and financial risk management (continued)
(c) Market risk (continued)
Foreign exchange risk (continued)
Foreign investment (continued)
Australian dollars New Zealand dollars US dollars
ALL Group 2015 2014 2015 2014 2015 2014
$’000 $’000 $’000 $’000 $’000 $’000
Assets Cash and cash equivalents 2,866 4,146 275 373 1,544 1,678Receivables and other current assets 28,834 12,255 152 144 4,362 10,179Property held for sale - - - - - 10,650Property, plant and equipment 55,120 52,658 - - 158,480 70,805Intangible assets 186,732 155,710 3,426 3,596 52,786 41,931Other non-current assets 4,862 103 16 18 (390) 2,157
Total assets 278,414 224,872 3,869 4,131 216,782 137,400
Liabilities Payables and other current liabilities 58,464 40,247 426 347 24,618 25,496Derivative financial instruments - - - - 129 -Interest bearing liabilities 125,613 125,272 - - 111,393 79,615Other non-current liabilities 4,514 10,950 - - 22,901 -
Total liabilities 188,591 176,469 426 347 159,041 105,111
Net assets 89,823 48,403 3,443 3,784 57,741 32,289
Net exposure to foreign exchange movements 89,823 48,403 3,443 3,784 57,741 32,289
The table below demonstrates the sensitivity of the above net exposures to reasonably possible changes in foreign exchange rates, with all other variables held constant. A negative amount in the table reflects a potential net reduction in the profit, core earnings or equity, while a positive amount reflects a potential net increase.
Consolidated Group Profit movement Core earnings
movement Total equity movement
2015 2014 2015 2014 2015 2014
$’000 $’000 $’000 $’000 $’000 $’000
AUD:USD - increase 10% (3,367) (1,712) - - (3,367) (1,712)AUD:USD - decrease 10% 4,115 2,093 - - 4,115 2,093AUD:NZD - increase 10% (484) (579) - - (484) (579)AUD:NZD - decrease 10% 593 708 - - 593 708
ALL Group Profit movement Total equity movement
2015 2014 2015 2014
$’000 $’000 $’000 $’000
AUD:USD - increase 10% (5,249) (2,935) (5,249) (2,935)AUD:USD - decrease 10% 6,416 3,588 6,416 3,588AUD:NZD - increase 10% (312) (344) (312) (344)AUD:NZD - decrease 10% 384 420 384 420
For
per
sona
l use
onl
y
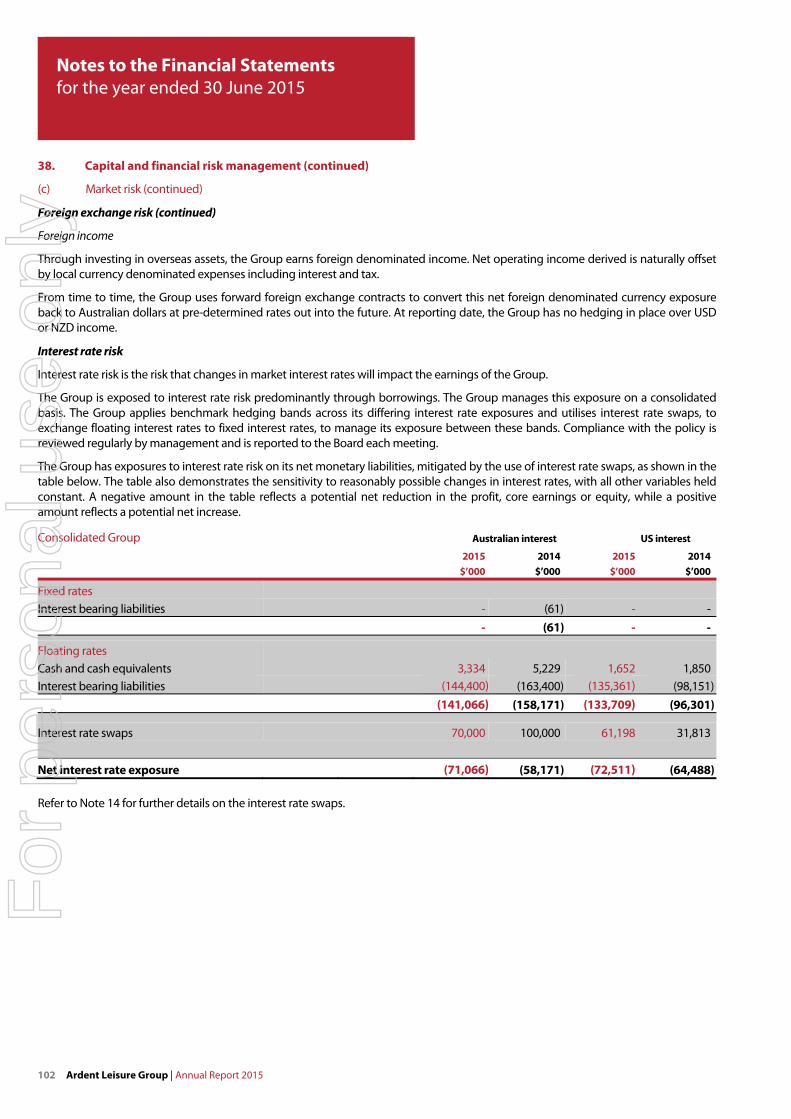
Notes to the Financial Statements for the year ended 30 June 2015
102 Ardent Leisure Group | Annual Report 2015
38. Capital and financial risk management (continued)
(c) Market risk (continued)
Foreign exchange risk (continued)
Foreign income
Through investing in overseas assets, the Group earns foreign denominated income. Net operating income derived is naturally offset by local currency denominated expenses including interest and tax.
From time to time, the Group uses forward foreign exchange contracts to convert this net foreign denominated currency exposure back to Australian dollars at pre-determined rates out into the future. At reporting date, the Group has no hedging in place over USD or NZD income.
Interest rate risk
Interest rate risk is the risk that changes in market interest rates will impact the earnings of the Group.
The Group is exposed to interest rate risk predominantly through borrowings. The Group manages this exposure on a consolidated basis. The Group applies benchmark hedging bands across its differing interest rate exposures and utilises interest rate swaps, to exchange floating interest rates to fixed interest rates, to manage its exposure between these bands. Compliance with the policy is reviewed regularly by management and is reported to the Board each meeting.
The Group has exposures to interest rate risk on its net monetary liabilities, mitigated by the use of interest rate swaps, as shown in the table below. The table also demonstrates the sensitivity to reasonably possible changes in interest rates, with all other variables held constant. A negative amount in the table reflects a potential net reduction in the profit, core earnings or equity, while a positive amount reflects a potential net increase.
Consolidated Group Australian interest US interest
2015 2014 2015 2014 $’000 $’000 $’000 $’000
Fixed rates Interest bearing liabilities - (61) - - - (61) - -
Floating rates Cash and cash equivalents 3,334 5,229 1,652 1,850Interest bearing liabilities (144,400) (163,400) (135,361) (98,151) (141,066) (158,171) (133,709) (96,301)
Interest rate swaps 70,000 100,000 61,198 31,813
Net interest rate exposure (71,066) (58,171) (72,511) (64,488)
Refer to Note 14 for further details on the interest rate swaps.
For
per
sona
l use
onl
y

Notes to the Financial Statements for the year ended 30 June 2015
Ardent Leisure Group | Annual Report 2015 103
38. Capital and financial risk management (continued)
(c) Market risk (continued)
Interest rate risk (continued)
ALL Group Australian interest US interest
2015 2014 2015 2014
$’000 $’000 $’000 $’000
Fixed rates Interest bearing liabilities - (61) - - - (61) - -Floating rates Cash and cash equivalents 3,141 4,519 1,544 1,678Interest bearing liabilities (125,613) (125,211) (111,835) (80,005) (122,472) (120,692) (110,291) (78,327)
Interest rate swaps - - 39,063 31,813
Net interest rate exposure (122,472) (120,692) (71,228) (46,514) Interest rate sensitivity
Consolidated Group Profit movement Core earnings
movement Total equity
movement
2015 2014 2015 2014 2015 2014
$’000 $’000 $’000 $’000 $’000 $’000
1% increase in AUD rate (698) (537) (711) (582) 1,296 5931% decrease in AUD rate 698 537 711 582 (1,296) (593)1% increase in USD rate (745) (689) (725) (645) 429 (66)1% decrease in USD rate 745 689 725 645 (429) 66
ALL Group Profit movement Total equity
movement
2015 2014 2015 2014
$’000 $’000 $’000 $’000
1% increase in AUD rate (1,225) (1,207) (1,225) (1,207)1% decrease in AUD rate 1,225 1,207 1,225 1,2071% increase in USD rate (712) (509) 36 1131% decrease in USD rate 712 509 (36) (113)
At reporting date, the Group has fixed 46.9% (2014: 50.4%) of its floating interest exposure.
For
per
sona
l use
onl
y

Notes to the Financial Statements for the year ended 30 June 2015
104 Ardent Leisure Group | Annual Report 2015
38. Capital and financial risk management (continued)
(d) Liquidity risk
Liquidity risk arises if the Group has insufficient liquid assets to meet its short term obligations. Liquidity risk is managed by maintaining sufficient cash balances and adequate committed credit facilities. Prudent liquidity management implies maintaining sufficient cash and marketable securities, the availability of funding through an adequate amount of committed credit facilities and the ability to close out market positions. The instruments entered into by the Group were selected to ensure sufficient funds would be available to meet the ongoing cash requirements of the Group.
The following tables provide the contractual maturity of the Group’s and ALL Group’s fixed and floating rate financial liabilities and derivatives as at 30 June 2015. The amounts presented represent the future contractual undiscounted principal and interest cash flows and therefore do not equate to the values shown in the Balance Sheets. Repayments which are subject to notice are treated as if notice were given immediately.
Consolidated Group Book value
Less than 1 year
1 to 2 years
2 to 3 years
3 to 4 years
4 to 5 years
Over 5 years Total2015
$’000 $’000 $’000 $’000 $’000 $’000 $’000 $’000
Payables 91,323 91,323 - - - - - 91,323Term debt 279,761 7,826 196,279 85,936 - - - 290,041Interest rate swaps designated as hedges of the term debt 2,231 1,440 1,472 769 - - - 3,681Forward foreign exchange contracts (377) 1,433 644 - - - - 2,077Total undiscounted financial liabilities 372,938 102,022 198,395 86,705 - - - 387,122
Consolidated Group Book value
Less than 1 year
1 to 2 years
2 to 3 years
3 to 4 years
4 to 5 years
Over 5 years Total2014
$’000 $’000 $’000 $’000 $’000 $’000 $’000 $’000
Payables 69,065 69,065 - - - - - 69,065Finance leases 61 61 - - - - - 61Term debt 261,551 8,880 8,880 195,616 69,020 - - 282,396Interest rate swaps designated as hedges of the term debt 1,443 881 796 817 - - - 2,494Forward foreign exchange contracts 20 4,597 - - - - - 4,597Total undiscounted financial liabilities 332,140 83,484 9,676 196,433 69,020 - - 358,613 ALL Group Book
value Less than
1 year 1 to 2 years
2 to 3 years
3 to 4 years
4 to 5 years
Over 5 years Total2015
$’000 $’000 $’000 $’000 $’000 $’000 $’000 $’000
Payables 76,287 76,287 - - - - - 76,287Term debt 110,547 1,762 69,650 41,536 - - - 112,948Loan from the Trust 126,901 5,824 132,725 - - - - 138,549Interest rate swaps designated as hedges of the term debt 129 318 298 - - - - 616Total undiscounted financial liabilities 313,864 84,191 202,673 41,536 - - - 328,400
ALL Group Book value
Less than 1 year
1 to 2 years
2 to 3 years
3 to 4 years
4 to 5 years
Over 5 years Total2014
$’000 $’000 $’000 $’000 $’000 $’000 $’000 $’000
Payables 60,287 60,287 - - - - - 60,287Finance leases 61 61 - - - - - 61Term debt 79,851 1,225 1,225 74,329 5,620 - - 82,399Loan from the Trust 125,365 6,547 6,547 6,547 6,547 126,477 - 152,665Interest rate swaps designated as hedges of the term debt 48 270 270 254 - - - 794Total undiscounted financial liabilities 265,612 68,390 8,042 81,130 12,167 126,477 - 296,206
For
per
sona
l use
onl
y

Notes to the Financial Statements for the year ended 30 June 2015
Ardent Leisure Group | Annual Report 2015 105
38. Capital and financial risk management (continued)
(e) Credit risk
Credit risk is the risk that a contracting entity will not complete its obligations under a financial instrument and cause the Group to make a financial loss. The Group has exposure to credit risk on all of its financial assets included in the Group’s Balance Sheet.
The Group manages credit risk on receivables by performing credit reviews of prospective debtors, obtaining collateral where appropriate and performing detailed reviews on any debtor arrears. The Group has policies to review the aggregate exposures of receivables and tenancies across its portfolio. The Group has no significant concentrations of credit risk on its trade receivables. The Group holds collateral in the form of security deposits or bank guarantees, over some receivables.
For derivative financial instruments, there is only a credit risk where the contracting entity is liable to pay the Group in the event of a close out. The Group has policies that limit the amount of credit exposure to any financial institution. Derivative counterparties and cash transactions are limited to investment grade counterparties in accordance with the Group’s FRM policy. The Group monitors the public credit rating of its counterparties.
No credit risk has been allocated to cash and cash equivalents. Credit risk adjustments relating to receivables have been applied in line with the policy set out in Note 1(d). No fair value adjustment has been made to derivative financial assets, with the impact of credit risk being minimal. The Group’s maximum exposure to credit risk is noted in the table below.
Details the concentration of credit exposure of the Group’s assets is as follows:
Consolidated Group
Consolidated Group ALL Group ALL Group
2015 2014 2015 2014 $’000 $’000 $’000 $’000
Cash and cash equivalents 4,986 7,079 4,685 6,197Receivables - Australasia 9,539 7,157 11,893 7,503Receivables - US 1,317 259 1,317 259 15,842 14,495 17,895 13,959
For
per
sona
l use
onl
y

Notes to the Financial Statements for the year ended 30 June 2015
106 Ardent Leisure Group | Annual Report 2015
38. Capital and financial risk management (continued)
(e) Credit risk (continued)
All cash, derivative financial instruments and interest bearing receivables are neither past due nor impaired.
The table below shows the ageing analysis of those receivables which are past due or impaired:
Past due but not impaired Impaired Total
Less than 30 days 31 to 60 days 61 to 90 days More than 90 days $’000 $’000 $’000 $’000 $’000 $’000
Consolidated Group 2015 Receivables - Australasia 555 262 97 222 679 1,815 Receivables - US 115 31 7 23 - 176 670 293 104 245 679 1,991
Consolidated Group 2014 Receivables - Australasia 1,771 407 124 52 804 3,158 Receivables - US 1 - - 37 - 38 1,772 407 124 89 804 3,196
ALL Group 2015 Receivables - Australasia 555 262 97 222 679 1,815 Receivables - US 115 31 7 23 - 176 670 293 104 245 679 1,991
ALL Group 2014 Receivables - Australasia 1,771 407 124 52 804 3,158 Receivables - US 1 - - 37 - 38 1,772 407 124 89 804 3,196
Based on a review of receivables by management, a provision of $459,000 (2014: $522,000) has been made against receivables with a gross balance of $679,000 (2014: $804,000).
The Group holds collateral against the impaired receivables in the form of bank guarantees and security deposits; however, these are not material.
There are no significant financial assets that have had renegotiated terms that would otherwise have been past due or impaired.
For
per
sona
l use
onl
y

Notes to the Financial Statements for the year ended 30 June 2015
Ardent Leisure Group | Annual Report 2015 107
39. Fair value measurement
(a) Fair value hierarchy
The Group measures and recognises the following assets and liabilities at fair value on a recurring basis:
Derivative financial instruments; Land and buildings; and Investment properties. AASB 13 Fair Value Measurement requires disclosure of fair value measurements by level of the following fair value measurement hierarchy:
(a) Quoted prices (unadjusted) in active markets for identical assets or liabilities (level 1); (b) Inputs other than quoted prices included within level 1 that are observable for the asset or liability, either directly or
indirectly (level 2); and (c) Inputs for the asset or liability that are not based on observable market data (unobservable inputs) (level 3). The following table provides the fair value measurement hierarchy of the Group’s assets and liabilities:
Consolidated Group Level 1 Level 2 Level 3 Total
2015 $’000 $’000 $’000 $’000
Assets measured at fair value: Investment properties - - 99,326 99,326 Property, plant and equipment(1) - - 395,779 395,779 Derivative financial instruments - 377 - 377
Liabilities measured at fair value: Derivative financial instruments - 2,231 - 2,231
Liabilities for which fair values are disclosed: Interest bearing liabilities (refer to Note 39(c)) - 279,761 - 279,761
Level 1 Level 2 Level 3 Total
2014 $’000 $’000 $’000 $’000
Assets measured at fair value: Investment properties - - 95,870 95,870 Property, plant and equipment(1) - - 346,626 346,626 Property held for sale - - 10,650 10,650
Liabilities measured at fair value: Derivative financial instruments - 1,463 - 1,463
Liabilities for which fair values are disclosed: Interest bearing liabilities (refer to Note 39(c)) - 261,612 - 261,612
(1) Land and buildings and major rides and attractions.
There has been no transfer between level 1 and level 2 during the year. For changes in level 3 items for the periods ended 30 June 2015 and 30 June 2014, refer to Notes 16, 18 and 19.
For
per
sona
l use
onl
y

Notes to the Financial Statements for the year ended 30 June 2015
108 Ardent Leisure Group | Annual Report 2015
39. Fair value measurement (continued)
(a) Fair value hierarchy (continued)
The following table provides the fair value measurement hierarchy of the ALL Group’s assets and liabilities:
ALL Group Level 1 Level 2 Level 3 Total 2015 $’000 $’000 $’000 $’000
Assets measured at fair value: Property, plant and equipment(1) - - 86,833 86,833
Liabilities measured at fair value: Derivative financial instruments - 129 - 129
Liabilities for which fair values are disclosed: Interest bearing liabilities (refer to Note 39(c)) - 237,448 - 237,448
Level 1 Level 2 Level 3 Total
2014 $’000 $’000 $’000 $’000
Assets measured at fair value: Property, plant and equipment(1) - - 50,437 50,437
Liabilities measured at fair value: Derivative financial instruments - 48 - 48
Liabilities for which fair values are disclosed: Interest bearing liabilities (refer to Note 39(c)) - 205,277 - 205,277
(1) Land and buildings and major rides and attractions.
There has been no transfer between level 1 and level 2 during the year. For changes in level 3 items for the periods ended 30 June 2015 and 30 June 2014, refer to Note 19.
The Group’s policy is to recognise transfers into and transfers out of fair value hierarchy levels as at the end of the year.
The Group did not measure any financial assets or financial liabilities at fair value on a non-recurring basis as at 30 June 2015.
(b) Valuation techniques used to derive level 2 and level 3 fair values
The fair value of financial instruments that are not traded in an active market (eg, over–the–counter derivatives) is determined using valuation techniques. These valuation techniques maximise the use of observable market data where it is available and rely as little as possible on entity specific estimates. If all significant inputs required to fair value an instrument are observable, the instrument is included in level 2. If one or more of the significant inputs is not based on observable market data, the instrument is included in level 3. This is the case for unlisted equity securities.
Specific valuation techniques used to value financial instruments include:
The use of quoted market prices or dealer quotes for similar instruments;
The fair value of interest rate swaps is calculated as the present value of the estimated future cash flows based on observable yield curves; and
The fair value of forward foreign exchange contracts is determined using forward exchange rates at the balance date.
All of the resulting fair value estimates are included in level 2. There are no level 3 financial instruments in either the Group or the ALL Group.
For
per
sona
l use
onl
y

Notes to the Financial Statements for the year ended 30 June 2015
Ardent Leisure Group | Annual Report 2015 109
39. Fair value measurement (continued)
(b) Valuation techniques used to derive level 2 and level 3 fair values (continued)
The fair value of investment properties is determined in line with the policy set out in Note 1(f), with all resulting fair value estimates included in level 3. The current use is considered to be the highest and best use for all investment properties in the Group.
Fair value measurements using significant unobservable inputs For changes in level 3 items for the periods ended 30 June 2015 and 2014 refer to the investment properties and property, plant and equipment Notes 18 and 19.
Valuation inputs and relationships to fair value The significant unobservable inputs associated with the valuation of the Group’s investment properties are as follows:
Capitalisation rate (%) Discount rate (%) Annual net property
income ($’000)
Marinas 8.6 – 13.7 10.8 - 11.7 330 – 2,311
The fair value of land and buildings and major rides and attractions is determined in line with the policy set out in Note 1(g), with all resulting fair value estimates included in level 3.
Capitalisation rate (%) Discount rate (%) Annual net property
income ($’000)
Dreamworld and WhiteWater World 9.4 15.0 29,388SkyPoint 14.7 16.3 4,190
The sensitivity of the fair values of the investment properties and land and buildings in relation to the significant unobservable inputs are set out in the table below:
Capitalisation rate (%) Discount rate (%) Annual net property
income ($’000)
Fair value measurement sensitivity to significant increase in input Decrease Decrease IncreaseFair value measurement sensitivity to significant decrease in input Increase Increase Decrease
When calculating the income capitalisation approach, the net market rent has a strong inter-relationship with the adopted capitalisation rate given the methodology involves assessing the total income receivable from the property and capitalising this in perpetuity to derive a capital value. In theory, an increase in the income and an increase (softening) in the adopted capitalisation rate could potentially offset the impact to the fair value. The same can be said for a decrease in the income and a decrease (tightening) in the adopted capitalisation rate. A directionally opposite change in the income and the adopted capitalisation rate could potentially magnify the impact to the fair value.
There are no other significant inter-relationships between unobservable inputs that materially affect the fair value.
For
per
sona
l use
onl
y

Notes to the Financial Statements for the year ended 30 June 2015
110 Ardent Leisure Group | Annual Report 2015
39. Fair value measurement (continued)
(c) Fair values of other financial instruments
The Group also has a number of financial instruments which are not measured at fair value in the Balance Sheet. For the majority of these instruments, the fair values are not materially different to their carrying amounts, since the interest receivable/payable is either close to the current market rates or the instruments are short term in nature. Significant differences were identified for the following instruments at 30 June 2015:
Carrying amount Fair value Discount rate
Carrying amount Fair value Discount rate
2015 2015 2015 2014 2014 2014
$’000 $’000 % $’000 $’000 %
Consolidated Group Interest bearing liabilities 279,761 279,796 2.80 261,612 254,831 4.75
ALL Group Interest bearing liabilities 237,448 240,010 2.80 205,277 198,610 4.75
In determining the fair value of the interest bearing liabilities, the Group’s principal payable of $279.8 million (2014: $261.6 million) has been discounted at a rate of 2.80% (2014: 4.75%) to best reflect the price that market participants would use when transferring the non-current borrowings, assuming that market participants act in their economic best interest. They are classified as level 3 fair values in the fair value hierarchy due to the use of unobservable inputs, including own credit risk. Own credit risk has been included for the first time in the current financial year following the adoption of AASB 13 Fair Value Measurement.
40. Contingent liabilities
Unless otherwise disclosed in the financial statements, there are no material contingent liabilities.
41. Capital and lease commitments
(a) Capital commitments
Capital expenditure contracted for at the reporting date but not recognised as liabilities is as follows:
Consolidated Group
Consolidated Group ALL Group ALL Group
2015 2014 2015 2014 $’000 $’000 $’000 $’000
Property, plant and equipment Payable: Within one year 3,331 1,204 3,331 1,204 3,331 1,204 3,331 1,204
For
per
sona
l use
onl
y

Notes to the Financial Statements for the year ended 30 June 2015
Ardent Leisure Group | Annual Report 2015 111
41. Capital and lease commitments (continued)
(b) Lease commitments
Consolidated Group
Consolidated Group ALL Group ALL Group
2015 2014 2015 2014 $’000 $’000 $’000 $’000
Within one year 83,368 67,885 33,798 25,418Later than one year but not later than five years 272,461 228,243 124,577 94,226Later than five years 259,110 197,222 188,130 128,633 614,939 493,350 346,505 248,277
Representing: Cancellable operating leases 415 451 415 451Non-cancellable operating leases 614,524 492,837 346,090 247,764Finance leases - 62 - 62 614,939 493,350 346,505 248,277
Operating leases The majority of non-cancellable operating leases in the Group relate to property leases.
Non-cancellable operating leases in the ALL Group include base rentals payable to the Trust in accordance with the leases for Dreamworld, marina, bowling centre and health club properties. Further amounts are payable in respect of these properties; however, the additional rental calculations are unable to be determined at reporting date as a result of the calculations being based upon future profits of the businesses.
Commitments for minimum lease payments in relation to non-cancellable operating leases are payable as follows:
Consolidated Group
Consolidated Group ALL Group ALL Group
2015 2014 2015 2014 $’000 $’000 $’000 $’000
Within one year 82,956 67,601 33,386 25,134Later than one year but not later than five years 272,457 228,014 124,573 93,996Later than five years 259,111 197,222 188,131 128,634 614,524 492,837 346,090 247,764
Finance leases Commitments in relation to finance leases are payable as follows:
Within one year - 62 - 62Later than one year but not later than five years - - - -Minimum lease payments - 62 - 62Less: future finance charges - (1) - (1)Total lease liabilities - 61 - 61
Representing lease liabilities: Current - 61 - 61Non-current - - - - - 61 - 61
In the prior financial year, the Group had an asset under a finance lease with a carrying value of $492,000. The finance lease now expired and the Group now owns this asset. Refer to Note 19.
For
per
sona
l use
onl
y

Notes to the Financial Statements for the year ended 30 June 2015
112 Ardent Leisure Group | Annual Report 2015
42. Deed of Cross Guarantee
In 2006, ALL, Bowling Centres Australia Pty Limited, Bowl Australia Holdings Pty Limited, Tidebelt Pty Limited and Bowling Centres Australia Catering Services Pty Limited entered into a Deed of Cross Guarantee under which each company guarantees the debts of the others. In 2010, Ardent Leisure Health Clubs 1 Pty Limited, Ardent Leisure Health Clubs 2 Pty Limited, Goodlife Health Clubs Holdings Pty Limited, Goodlife Operations Pty Limited, Ardent Boat Share Pty Limited and Ardent Boat Share Finance Limited executed an Assumption Deed and became parties to the Deed of Cross Guarantee. On 9 October 2012, Fenix Holdings Pty Limited and its controlled entities executed an Assumption Deed and became parties to the Deed of Cross Guarantee. On 28 April 2014, Hypoxi Australia Pty Ltd executed an Assumption Deed and became a party to the Deed of Cross Guarantee. On 25 November 2014, Hypoxi North America Pty Limited executed an Assumption Deed and became a party to the Deed of Cross Guarantee.
On 1 July 2012, a Revocation Deed was executed whereby Ardent Boat Share Pty Limited, Ardent Boat Share Finance Limited, Bowl Australia Holdings Pty Limited, Bowling Centres Australia Catering Services Pty Limited and Tidebelt Pty Limited were released from the Deed of Cross Guarantee.
By entering into the deeds, Bowling Centres Australia Pty Limited, Goodlife Operations Pty Limited, Ardent Leisure Health Clubs 1 Pty Limited, Fenix Holdings Pty Limited and Hypoxi Australia Pty Ltd have been relieved from the requirement to prepare a financial report and Directors’ report under Class Order 98/1418 (as amended) issued by the Australian Securities and Investments Commission.
(a) Consolidated Income Statement
ALL, Bowling Centres Australia Pty Limited, Ardent Leisure Health Clubs 1 Pty Limited, Ardent Leisure Health Clubs 2 Pty Limited, Goodlife Health Clubs Holdings Pty Limited, Goodlife Operations Pty Limited, Hypoxi Australia Pty Ltd and Hypoxi North America Pty Limited represent a ‘Closed Group’ for the purposes of the Class Order.
Set out below is a consolidated Income Statement for the year ended 30 June 2015 of the Closed Group:
2015 2014 $’000 $’000
Revenue from operating activities 415,742 404,224
Purchases of finished goods (32,578) (32,140)Salary and employee benefits (165,036) (156,564)Borrowing costs (8,356) (11,015)Property expenses (129,430) (124,956)Depreciation and amortisation (18,956) (14,400)Advertising and promotions (15,499) (15,734)Repairs and maintenance (19,249) (17,737)Impairment of property, plant and equipment (1,822) -Business acquisition costs (1,938) (277)Pre-opening expenses (916) (407)Other expenses (38,133) (36,776)
Loss before tax benefit (16,171) (5,782)
Income tax benefit 4,005 3,008Loss for the year (12,166) (2,774)
(b) Consolidated Statement of Comprehensive Income
Set out below is a consolidated Statement of Comprehensive Income for the year ended 30 June 2015 of the Closed Group:
2015 2014 $’000 $’000
Loss for the year (12,166) (2,774)Other comprehensive income for the year - -Total comprehensive income for the year (12,166) (2,774)
For
per
sona
l use
onl
y

Notes to the Financial Statements for the year ended 30 June 2015
Ardent Leisure Group | Annual Report 2015 113
42. Deed of Cross Guarantee (continued)
(c) Consolidated Balance Sheet
Set out below is a consolidated Balance Sheet as at 30 June 2015 of the Closed Group:
2015 2014 $’000 $’000
Current assets Cash and cash equivalents 2,844 4,128Receivables 11,219 7,035Inventories 8,766 7,566Current tax receivables 8,279 1,549Other 2,084 4,963Total current assets 33,192 25,241
Non-current assets Property, plant and equipment 55,168 46,245Livestock 245 300Intangible assets 169,149 135,520Deferred tax assets 4,298 2,105Investment in controlled entities 49,804 49,730Total non-current assets 278,664 233,900Total assets 311,856 259,141
Current liabilities Payables 52,651 47,432Interest bearing liabilities - 61Provisions 3,237 3,272Other 1,222 1,296Total current liabilities 57,110 52,061
Non-current liabilities Payables 127,231 196,081Provisions 4,514 1,625Total non-current liabilities 131,745 197,706Total liabilities 188,855 249,767Net assets 123,001 9,374
Equity Contributed equity 155,262 16,309Reserves - (2,310)Accumulated losses (32,261) (4,625)
Total equity 123,001 9,374
For
per
sona
l use
onl
y

Notes to the Financial Statements for the year ended 30 June 2015
114 Ardent Leisure Group | Annual Report 2015
42. Deed of Cross Guarantee (continued)
(d) Consolidated Statement of Changes in Equity
Set out below is a consolidated Statement of Changes in Equity for the year ended 30 June 2015 of the Closed Group:
Contributed Accumulated equity Reserves losses Total
$’000 $’000 $’000 $’000
Total equity at 30 June 2013 14,202 (2,310) (1,851) 10,041Total comprehensive income - - (2,774) (2,774)Contributions of equity, net of issue costs 2,107 - - 2,107
Total equity at 30 June 2014 16,309 (2,310) (4,625) 9,374Total comprehensive income - - (12,166) (12,166)Reserve transfers - 2,310 (2,310) -Dividends paid and payable - - (13,160) (13,160)Contributions of equity, net of issue costs 138,953 - - 138,953
Total equity at 30 June 2015 155,262 - (32,261) 123,001
43. Parent entity financial information
(a) Summary financial information
ConsolidatedGroup
Consolidated Group ALL Group ALL Group
2015 2014 2015 2014 $’000 $’000 $’000 $’000
Balance sheet Current assets 10,447 11,129 15,152 7,616Total assets 606,122 666,435 223,167 181,702Current liabilities 21,117 17,854 27,360 18,862
Total liabilities 195,965 199,559 67,538 164,353
Equity Contributed equity 449,919 497,603 155,262 16,309Reserves (4,921) (2,907) - (2,310)(Accumulated losses)/retained profits (34,841) (27,820) 367 3,350
410,157 466,876 155,629 17,349
Profit for the year 34,507 45,710 12,487 23,528
Total comprehensive income for the year 33,624 46,174 12,487 23,528
(b) Guarantees
In June 2013, Ardent Leisure Trust and Ardent Leisure Limited entered into an agreement to guarantee the obligations of Ardent Leisure US Holding Inc. (a wholly-owned subsidiary of Ardent Leisure Limited) under the terms of the Group’s extended syndicated facility arrangements as disclosed in Note 24.
Excluding the above and the deed of cross guarantee (refer to Note 42), there are no other material guarantees entered into by Ardent Leisure Limited and Ardent Leisure Trust in relation to the debts of their subsidiaries.
For
per
sona
l use
onl
y

Notes to the Financial Statements for the year ended 30 June 2015
Ardent Leisure Group | Annual Report 2015 115
43. Parent entity financial information (continued)
(c) Contingent liabilities
Ardent Leisure Trust and Ardent Leisure Limited did not have any contingent liabilities at 30 June 2015 or 30 June 2014.
(d) Contractual commitments for the acquisition of property, plant and equipment
Capital expenditure contracted for at the reporting date but not recognised as liabilities is as follows:
ConsolidatedGroup
Consolidated Group ALL Group ALL Group
2015 2014 2015 2014
$’000 $’000 $’000 $’000
Property, plant and equipment Payable:
Within one year - - 2,943 1,167
- - 2,943 1,167
Commitments with respect to the above property, plant and equipment have been incurred by ALL on behalf of the Trust for the Australian and New Zealand geographic segments totalling $2,943,000 (2014: $1,167,000). Any commitments relating to the Australian and New Zealand geographic segments will therefore be subsequently reimbursed by the Trust the month following payment.
44. Events occurring after reporting date
Subsequent to year end, a distribution of 5.5 cents per stapled security has been declared by the Board of Directors. The total distribution amount of $24.3 million will be paid on or before 31 August 2015 in respect of the half year ended 30 June 2015.
Effective 11 August 2015, the Group completed refinancing of its syndicated loan facilities. This has resulted in an increase in the available USD facilities to US$280.0 million (30 June 2015: US$160.0 million) and an extended tenure maturing in equal tranches of three, four and five years respectively. Australian dollar facilities remain at $200.0 million (30 June 2015: $200.0 million) however have been similarly extended to mature in equal tranches of three, four and five years respectively. Since the end of the financial year, the Directors of the Manager and ALL are not aware of any other matters or circumstances not otherwise dealt with in financial report or the Directors’ report that has significantly affected or may significantly affect the operations of the Group, the results of those operations or the state of affairs of the Group in financial years subsequent to the year ended 30 June 2015.
For
per
sona
l use
onl
y
Directors’ declaration to stapled security holders
116 Ardent Leisure Group | Annual Report 2015
Directors’ declaration to stapled security holders In the opinion of the Directors of Ardent Leisure Management Limited and Ardent Leisure Limited:
(a) The financial statements and notes of Ardent Leisure Trust and its controlled entities, including Ardent Leisure Limited and its controlled entities (Ardent Leisure Group) and Ardent Leisure Limited and its controlled entities (ALL Group) set out on pages 36 to 115 are in accordance with the Corporations Act 2001, including:
(i) complying with Accounting Standards, the Corporations Regulations 2001 and other mandatory professional reporting requirements; and
(ii) giving a true and fair view of the Ardent Leisure Group’s and ALL Group’s financial position as at 30 June 2015 and of their performance, as represented by the results of their operations, their changes in equity and their cash flows, for the financial year ended on that date;
(b) There are reasonable grounds to believe that both the Ardent Leisure Group and ALL Group will be able to pay their debts as and when they become due and payable;
(c) Note 1(a) confirms that the financial statements also comply with International Financial Reporting Standards as issued by International Accounting Standards Board; and
(d) At the date of this declaration, there are reasonable grounds to believe that the members of the Closed Group identified in Note 42 will be able to meet any obligations or liabilities to which they are, or may become, subject by virtue of the Deed of Cross Guarantee as described in Note 42.
The Directors have been given the declarations by the Chief Executive Officer and Chief Financial Officer required by section 295A of the Corporations Act 2001.
This declaration is made in accordance with a resolution of the Boards of Directors.
Neil Balnaves AO Deborah Thomas Chairman Managing Director
Sydney 18 August 2015
For
per
sona
l use
onl
y

PricewaterhouseCoopers, ABN 52 780 433 757Riverside Centre, 123 Eagle Street, BRISBANE QLD 4000, GPO Box 150, BRISBANE QLD 4001T: +61 7 3257 5000, F: +61 7 3257 5999, www.pwc.com.auLiability limited by a scheme approved under Professional Standards Legislation.
Independent auditor’s report to the stapled security holders ofArdent Leisure Group and Ardent Leisure Limited Group
Report on the financial reportWe have audited the accompanying financial report which comprises:
The balance sheet as at 30 June 2015, the income statement, statement of comprehensiveincome, statement of changes in equity and statement of cash flows for the year ended on thatdate, a summary of significant accounting policies, other explanatory notes and the directors’declaration for Ardent Leisure Group (the consolidated stapled entity). The consolidatedstapled entity, as described in Note 1 to the financial report, comprises Ardent Leisure Trust(the trust) and the entities it controlled at year’s end or from time to time during the financialyear.
The balance sheet as at 30 June 2015, the income statement, statement of comprehensiveincome, statement of changes in equity and statement of cash flows for the year ended on thatdate, a summary of significant accounting policies, other explanatory notes and the directors’declaration for Ardent Leisure Limited Group (the ALL Group). The ALL Group, comprisesArdent Leisure Limited (the company or ALL) and the entities it controlled at year’s end orfrom time to time during the financial year.
Directors’ responsibility for the financial reportThe directors of the Ardent Leisure Limited and the Ardent Leisure Management Limited, theresponsible entity of the Ardent Leisure Trust, (collectively referred to as the “directors”) areresponsible for the preparation of the financial report that gives a true and fair view in accordance withAustralian Accounting Standards and the Corporations Act 2001 and for such internal control as thedirectors determine is necessary to enable the preparation of the financial report that is free frommaterial misstatement, whether due to fraud or error. In Note Note 1, the directors also state, inaccordance with Accounting Standard AASB 101 Presentation of Financial Statements, that thefinancial statements comply with International Financial Reporting Standards.
Auditor’s responsibilityOur responsibility is to express an opinion on the financial report based on our audit. We conductedour audit in accordance with Australian Auditing Standards. Those standards require that we complywith relevant ethical requirements relating to audit engagements and plan and perform the audit toobtain reasonable assurance whether the financial report is free from material misstatement.
An audit involves performing procedures to obtain audit evidence about the amounts and disclosuresin the financial report. The procedures selected depend on the auditor’s judgement, including theassessment of the risks of material misstatement of the financial report, whether due to fraud or error.In making those risk assessments, the auditor considers internal control relevant to the entity’spreparation and fair presentation of the financial report in order to design audit procedures that areappropriate in the circumstances, but not for the purpose of expressing an opinion on the effectivenessof the entity’s internal control. An audit also includes evaluating the appropriateness of accountingpolicies used and the reasonableness of accounting estimates made by the directors, as well asevaluating the overall presentation of the financial report.
For
per
sona
l use
onl
y

We believe that the audit evidence we have obtained is sufficient and appropriate to provide a basis forour audit opinion.
IndependenceIn conducting our audit, we have complied with the independence requirements of the CorporationsAct 2001.
Auditor’s opinionIn our opinion:
(a) the financial report of Ardent Leisure Group and Ardent Leisure Limited Group is in accordancewith the Corporations Act 2001, including:
(i) giving a true and fair view of the consolidated stapled entity's and consolidated ALLGroup entity’s financial position as at 30 June 2015 and of their performance for the yearended on that date; and
(ii) complying with Australian Accounting Standards (including the Australian AccountingInterpretations) and the Corporations Regulations 2001.
(b) the financial report and notes also comply with International Financial Reporting Standards asdisclosed in Note Note 1.
Report on the Remuneration ReportWe have audited the remuneration report included in pages 13 to 31 of the directors’ report for the yearended 30 June 2015. The directors are responsible for the preparation and presentation of theremuneration report in accordance with section 300A of the Corporations Act 2001. Ourresponsibility is to express an opinion on the remuneration report, based on our audit conducted inaccordance with Australian Auditing Standards.
Auditor’s opinionIn our opinion, the remuneration report of Ardent Leisure Group and Ardent Leisure Limited for theyear ended 30 June 2015 complies with section 300A of the Corporations Act 2001.
PricewaterhouseCoopers
Timothy J Allman BrisbanePartner 18 August 2015
For
per
sona
l use
onl
y

Investor Analysis
Ardent Leisure Group | Annual Report 2015 119
Investor Analysis Top 20 Investors as at 18 August 2015 No. of Securities %
1 National Nominees Limited 85,147,349 19.252 JP Morgan Nominees Australia Limited 72,164,546 16.313 HSBC Custody Nominees (Australia) Limited 54,674,441 12.364 BNP Paribas Noms Pty Ltd <DRP> 29,642,317 6.705 Citicorp Nominees Pty Limited 24,789,390 5.606 National Nominees Limited <DB AC> 6,673,434 1.517 AMP Life Limited 4,853,420 1.108 Ragusa Pty Ltd <Famdal Super Fund P1 A/C> 4,692,067 1.069 Citicorp Nominees Pty Limited <Colonial First State Inv A/C> 4,227,006 0.9610 Ragusa Pty Ltd <Famdal Super Fund P3 A/C> 3,715,118 0.8411 RBC Investor Services Australia Nominees Pty Limited <PISELECT> 2,673,210 0.6012 Balnaves Foundation Pty Ltd <Balnaves Foundation A/C> 2,066,243 0.4713 BNP Paribas Noms (NZ) Ltd <DRP> 1,933,002 0.4414 Ragusa Pty Ltd <Famdal Super Fund P2 A/C> 1,318,776 0.3015 Ragusa Pty Limited <Famdal Super Fund P3 A/C> 1,061,823 0.2416 The Australian National University 901,603 0.2017 UBS Wealth Management Australia Nominees Pty Ltd 820,332 0.1918 Invia Custodian Pty Limited <GSJBW Managed A/C> 751,848 0.1719 Sevanlab Super Pty Ltd <Sevanlab Nominees Super A/C> 735,267 0.1720 Mr Alan Geoffrey Blackburn <Blackburn Consulting A/C> 622,000 0.14
Total 303,463,192 68.61
Balance of Register 138,858,914 31.39
Grand Total 442,322,106 100.00
Range Report as at 18 August 2015 No. of Securities % No of Holders %
100,001 and Over 328,294,025 74.22 147 1.1810,001 to 100,000 83,406,574 18.86 3,292 26.455,001 to 10,000 16,933,175 3.83 2,223 17.861,001 to 5,000 12,585,237 2.85 4,350 34.951 to 1,000 1,103,095 0.25 2,435 19.56Total 442,322,106 100.00 12,447 100.00
The total number of investors with an unmarketable parcel of 51,958 securities as at 18 August 2015 was 852.
Voting Rights On a poll, each investor has, in relation to resolutions of the Trust, one vote for each dollar value of their total units held in the Trust and in relation to resolutions of the Company, one vote for each share held in the Company.
On-Market Buy-back There is no current on-market buy-back program in place.
Substantial Shareholder Notices Received as at 18 August 2015 No. of Securities %
National Australia Bank Limited 42,526,796 9.61FIL Ltd 40,478,296 9.15Ausbil Investment Management Limited 30,939,841 7.05JCP Investment Partners Ltd 27,951,149 6.32Bennelong Funds Management Group Pty Ltd 23,405,643 5.29BT Investment Management Limited 22,815,453 5.63
Stapling Disclosure
The ASX reserves the right (but without limiting its absolute discretion) to remove the Company or the Trust or both from theofficial list if any of the shares and the units cease to be “stapled” together or any equity securities issued by the Company orTrust which are not stapled to equivalent securities in the other entity.
For
per
sona
l use
onl
y

Investor Relations
120 Ardent Leisure Group | Annual Report 2015
Investor Relations Information relating to Ardent Leisure can be found at www ardentleisure.com.au. The website is a useful source of information about the Group and its business and property portfolio. The site contains a variety of investor information, including presentations, webcasts, newsletters, half year updates, annual reports, distribution history and timetable, security price information and announcements to the ASX.
Corporate Governance Statement In accordance with the ASX Listing Rules, the Group’s Corporate Governance Statement dated 30 June 2015 is published and located in the Corporate Governance page of the Group’s website (http://www.ardentleisure.com.au/Company/Corporate-Governance.aspx). A copy has also been provided to the ASX.
Investor benefits program The investor benefits program aims to provide investors with an opportunity to experience and enjoy Ardent Leisure assets. Investors with a minimum of 2,000 stapled securities are entitled to discounts and incentives to allow investors and their families to engage with and enjoy the various leisure activities offered by the Group. For more details on the current benefits offered under the program and how to participate, please visit the Investor Centre page at www.ardentleisure.com.au. Note that the investor benefits offerings are subject to change and the program terms and conditions. The investor benefits program does not have a material impact on the income of the Group.
Distribution payments and annual taxation statement Distributions are currently payable twice a year and received by investors approximately seven to eight weeks after each half year end. To view your 2014/15 annual taxation statement online, please visit the Link Investor Service Centre at www.linkmarketservices.com.au. Distribution Reinvestment Plan (DRP) The DRP price for the half year ended 30 June 2015 was $2.1553 per stapled security. Please note that the terms and conditions of the DRP may vary from time to time. Details of any changes (and whether the DRP continues to operate or is suspended) will be announced to the ASX.
Contact details Security registry To access information on your holding or to update/change your details, contact: Link Market Services Limited Locked Bag A14 Sydney South NSW 1235 Telephone 1300 720 560 (within Australia) +61 1300 720 560 (outside Australia) Facsimile +61 2 9287 0303
Website www.linkmarketservices.com.au Email [email protected]
Manager All other enquiries relating to your Ardent Leisure Group investment can be directed to: Telephone 1800 ARDENT (within Australia) +61 2 9409 3670 (outside Australia) Email [email protected]
Investor complaints If you have a complaint, please contact us so that we can assist:
Ardent Leisure Group Level 16, 61 Lavender Street Milsons Point NSW 2061 Email [email protected] Telephone 1800 ARDENT (within Australia) Facsimile +61 2 9409 3679
External dispute resolution In the event that a complaint cannot be resolved within a reasonable period of time (usually 45 days) or you are not satisfied with our response, you can seek assistance from Financial Ombudsman Service Limited (FOS). FOS provides a free and independent dispute resolution service to our investors. FOS’s contact details are below:
Financial Ombudsman Service Limited GPO Box 3 Melbourne VIC 3001 Email [email protected] Telephone 1300 780 808 (within Australia) Facsimile +61 3 9613 6399
For
per
sona
l use
onl
y

Corporate Directory
Ardent Leisure Group | Annual Report 2015 121
Corporate Directory
Manager Ardent Leisure Management Limited ABN 36 079 630 676 AFSL No. 247010
Company Ardent Leisure Limited ABN 22 104 529 106 Registered office Level 16, 61 Lavender Street Milsons Point NSW 2061
Directors Neil Balnaves AO (Chairman) Roger Davis David Haslingden Don Morris AO Deborah Thomas George Venardos Melanie Willis Managing Director and Chief Executive Officer Deborah Thomas Chief Financial Officer Richard Johnson Company Secretary Alan Shedden Telephone 1800 ARDENT (within Australia) +61 2 9409 3670 (outside Australia) Facsimile (02) 9409 3679 (within Australia) +61 2 9409 3679 (outside Australia) Email [email protected] Website www.ardentleisure.com.au
ASX code AAD
Custodian Perpetual Level 15, 20 Bond Street Sydney NSW 2000
Auditor of the Group PricewaterhouseCoopers Riverside Centre 123 Eagle Street Brisbane QLD 4000
Security registry Link Market Services Limited Locked Bag A14 Sydney South NSW 1235 Level 12 680 George Street Sydney NSW 2000 Telephone 1300 720 560 (within Australia) +61 1300 720 560 (outside Australia) Email [email protected] Website www.linkmarketservices.com.au To arrange changes of address, or changes in registration of stapled securities, please contact the registry at the address or number listed above.
F
or p
erso
nal u
se o
nly

For
per
sona
l use
onl
y

Page 1 of 18
Corporate Governance Statement
This statement has been approved by the Boards of Directors of Ardent Leisure Management Limited and Ardent Leisure Limited and prepared as at 30 June 2015. Principle 1 – Lay solid foundations for management and oversight
Board Charter The Directors of the Group have adopted a Board Charter that sets out the respective roles and responsibilities of the Board and senior management. The primary role of the Board is to promote the long term health and prosperity of the Group and to build sustainable value for investors. Specifically, the Board is responsible for:
Setting objectives, goals and strategic direction;
Approving and monitoring progress of major capital expenditure, capital management, acquisitions and divestments;
Monitoring financial performance and reporting;
Oversight and approval of accounting, risk management and compliance control systems;
Monitoring the performance of management;
Appointing and removing the Chief Executive Officer (and other Key Management Personnel as decided from time to time);
Approving the remuneration framework for Directors and the Group’s Key Management Personnel;
Monitoring compliance with legal obligations and ethical and responsible behaviour; and
Ensuring effective communications with investors and other stakeholders. The Board Charter also sets out the responsibilities of the Chair and a comprehensive list of matters that are reserved for the Board of Directors of both the Company and the Manager. In accordance with the list of matters reserved for the Board, the Board is responsible for:
The strategic plan and annual operating and capital expenditure budgets;
Treasury policies and risk management strategy;
Establishment, acquisition, cessation or disposal of any division or business unit;
Approval of financial statements and any significant changes to accounting policies;
Approval of Dividend / distributions payments;
Appointment and removal of auditors;
Appointment and removal of any of the Chief Executive Officer, the Key Management Personnel or the Company Secretary;
Committee charters and composition;
Amendments to discretions delegated by the Board;
Key policies including Workplace Health and Safety, Environmental and Sustainability policies;
Changes to the Group’s capital structure including the issue of shares, options, equity instruments or other securities;
Key public statements which relate to significant issues concerning changes to key strategy or Group policy; and
For
per
sona
l use
onl
y

Corporate Governance Statement 30 June 2015
Terms and conditions of the appointment of Directors and the Chief Executive Officer, and employee equity plans and their allocation.
The Board Charter also sets out key delegations of authority in relation to equity investments, assets acquisition and disposal, external credit limits, bonds, guarantees and other contingent liabilities. Directors’ Information Investors are provided with all material information which the Company has about the Director, in an explanatory memorandum to the Notice of Meeting, at which the Director will stand for election or re‐election, to enable them to make an informed decision on whether or not to elect or re‐elect the candidate. Such information includes their relevant qualifications and experience, details of any offices they currently hold and any other material former directorships they held, when the Director was first appointed and, if any, details of the roles they hold in any of the Board’s standing committees. Agreements with Directors and Key Management Personnel Each Director enters into a number of agreements with the Company to provide them with a clear understanding of their roles and responsibilities and of the entity’s expectations of them. These comprise:
the Terms and Conditions of their appointment, the time commitment and any involvement with committee work and any other special duties expected of their position, their remuneration entitlements, the various corporate policies with which they are expected to comply, and the conditions of termination;
a disclosure agreement which obligates them to disclose any relevant and material interests and any matters which may affect their independence; and
a Deed of Access and Indemnity which sets out the indemnity and insurance arrangements, and ongoing rights of access to corporate information.
Each of the Key Management Personnel enters into a Service Agreement which sets out their position description, duties and responsibilities, reporting lines, remuneration entitlements, ongoing confidentiality, obligation to comply with all corporate policies, the circumstances in which their service may be terminated (with or without notice) and any entitlements on termination.
Details on the remuneration of Directors and Key Management Personnel are set out in the Directors’ Report contained within the Annual Financial Report for the year ended 30 June 2015.
Company Secretary In accordance with the Board Charter, the Company Secretary is appointed and if necessary removed by the Board and is therefore accountable directly to the board on all matters to do with the proper functioning of the Board. Each Director also has direct access to the Company Secretary. The Company Secretary’s role includes:
advising the Board and its committees on governance matters;
monitoring that board and committee policy and procedures are followed;
coordinating the timely completion and despatch of Board and committee papers;
ensuring that the business at Board and committee meetings is accurately captured in the minutes; and
helping to organise and facilitate the induction and professional development of Directors. Diversity Policy On 16 December 2010, the Board adopted a Diversity Policy that aims to promote diversity across the Group through a number of initiatives.
For
per
sona
l use
onl
y

Corporate Governance Statement 30 June 2015
Any attempt to change the current status quo is unlikely to drive short term results or change and it was proposed that the Group adopt a long term approach that focuses on increasing diversity at junior levels and addressing the various reasons that hinder female promotion and involvement at executive levels. Accordingly the Directors agreed to target an increase in female participation at a managerial level across the Group from 36% in 2010 to 50% in 2015. Following the release of new reporting guidelines under the Workplace Gender Equity Act 2012, the Group has adopted revised analytics and has segmented our leadership diversity reporting in line with reporting standards and industry best practice. The definition of Managers used in the table below includes Senior Executives, Senior Managers and Managers as recommended under the reporting guidelines.
2014 2015
Female Male Female Male
Board of Directors 28.6% 71.4% 20% 80%
Senior Management 47.0% 53.0% 43% 57%
All Employees 62.1% 37.9% 68% 32%
The table above shows the female participation rates across the Group since the Board adopted the Diversity Policy in December 2010. The Group supports a number of initiatives aimed at achieving the target increase and has adopted policies on flexible working arrangements and paid maternity leave. Director, Board and Committee Evaluation The Board Charter requires that each Director will participate in an annual performance evaluation which will be reviewed by the Chair. The process for conducting Board and Director evaluations is similar to that adopted for the review of the Chief Executive Officer and is conducted in a confidential manner by the Chair of the Board. The evaluations include areas such as role of the Board, composition, meeting conduct, behaviours and competencies, governance and risk, ethics and stakeholder relations. Each committee charter adopted by the Board includes a requirement for an annual self‐assessment by the committee of its performance and charter. These evaluations are conducted against the existing charter and prevailing developments in the corporate governance arena. Key Management Personnel Performance Evaluation In accordance with the Board Charter the Directors have undertaken to formally evaluate the performance of the Chief Executive Officer and other Key Management Personnel on an annual basis. The purpose of the evaluation of the Chief Executive Officer and other Key Management Personnel is to provide the following key benefits:
Assist the Board in meeting its duty to stakeholders in effectively leading the Group;
Ensure the continued development of the Chief Executive Officer and other Key Management Personnel to more effectively conduct their role;
Ensures a formal and documented evaluation process; and
Leaves a record of the Board's impression of the performance of the Chief Executive Officer and other Key Management Personnel.
For
per
sona
l use
onl
y
Corporate Governance Statement 30 June 2015
The process adopted by the Board to assess the performance of the Chief Executive Officer and other Key Management Personnel is as follows:
Each Board member is requested to complete an evaluation table and provide numerical ranking against the criteria for the Chief Executive Officer’s and other Key Management Personnel’s performance during the evaluation period;
Participants are encouraged to provide commentary;
The evaluation tables are then provided directly to the Chair of the Board and upon review the Chair may decide to provide an average ranking for each category; and
Once final rankings are collated the Chair of the Board sits to discuss the findings with the Chief Executive Officer and agrees any specific action points to be addressed.
Principle 2 – Structure the board to add value
Nomination Committee The Directors have established a combined Remuneration and Nomination Committee due to the relatively infrequent need to call upon the services of the previous Nomination Committee. The charter for the combined Remuneration & Nomination Committee remains broadly similar and includes the review process for the Board and its committees and also the time commitment for non‐executive directors. The combined Remuneration and Nomination Committee consists of a minimum of three members with the majority of members required to be independent directors. The Remuneration and Nomination Committee is specifically responsible for making recommendations to the Board in relation to the identification, assessment and enhancement of the competencies of Board members, Board and management succession plans including the appointment of suitably qualified candidates to the Board and the appointment of the Chief Executive Officer, the development of a process for the review of the performance of the Board, Board Committees and individual directors and the assessment of the time required to fulfil the obligations of a non‐executive director and whether directors are able to meet these expectations. Selection Process In order to provide a formal and transparent procedure whereby new appointments to the Board are selected the Remuneration and Nomination Committee has adopted a director selection process to be used once the Board has decided to appoint or replace a Director. Process
Identify the vacant position.
Identify the core competencies of the position.
Identify a preferred candidate background (taking into account the diversity of the Board).
Appoint a search firm if necessary to ensure an appropriate selection of candidates.
If a search firm is appointed, draft and deliver a brief to the search firm explaining the following: o Vacant Position; o Competencies Required; o Preferred Background; o Essential Qualifications (if any); and o Countries in which to extend the search.
Candidates are to be interviewed and a shortlist prepared.
Select preferred candidates from the shortlist provided in consultation with executive management.
Agree a preferred candidate for recommendation to the Board of Directors.
For
per
sona
l use
onl
y
Corporate Governance Statement 30 June 2015
Board Skills and Competencies In conjunction with an independent advisor the Board has undertaken a review of core competencies that should be present across the Board of Directors. Board members should have a working knowledge of finance and accounting, corporate regulation and business strategic theory. The Board aims to gather a breadth of different experience on the Board. The Directors believe that diversity is critical to the effective functioning of the Board. To this end the Board strives to ensure that Directors should not all be from one occupational group or even from the same industrial sector the Group operates in. The Board has undertaken a review of the key skills and competencies of the Board to ensure appropriate oversight of the Group’s current operations and strategy for future growth. The Board comprises a broad and diverse range of skills and understanding gained by Directors from their decades of experience in the general commercial, leisure and entertainment sectors. This expertise is supported by appropriate accounting, banking & finance, property and advertising skills. Director Independence The Board recognises that independent directors are important in assuring investors that the Board is properly fulfilling its role and is diligent in holding management accountable for its performance. A majority of the Board are independent Directors with the only executive Director appointed currently the Chief Executive Officer. The independence of the Directors is assessed annually taking into account such matters as tenure, contractual interests, significant security holdings, relationships with key advisers, suppliers and customers and any prior executive employment within the Group. The Board has assessed the independence of each Director and concluded that none of the Directors has any material interest in securities, contracts or has relevant relationships with material advisers or suppliers / customers. The Board acknowledges that materiality thresholds will differ for each Director and for the Group as a whole. Accordingly, for the purposes of the independence assessment the Board has adopted a materiality threshold of 1% of the Group’s last reported net assets. Notwithstanding, that Neil Balnaves has served on the Board for periods in excess of 10 years, the Board considers that this period of long tenure has not impacted on Mr Balnaves’ ability to remain objective in his judgment and independent of management. As at 30 June 2015, Directors deemed to be independent were: Neil Balnaves AO, Roger Davis, Don Morris AO, and George Venardos. Details of the tenure, current position and previous offices held by each Director which are relevant to the assessment of their independence are disclosed in their respective profiles, along with their interests in securities, and set out in the Annual Financial Report for the year ended 30 June 2015. Board Composition The Directors of the Group have set out in the Board Charter the required composition of the Board subject to any requirements under the constitutions of the Company and the Manager:
Independent directors should comprise a majority of the Board;
Directors appointed to the Board should provide an appropriate range of qualifications and expertise; and
For
per
sona
l use
onl
y

Corporate Governance Statement 30 June 2015
In the event that the Chair ceases to be deemed independent then a lead independent Director should be appointed by the Board.
The Chair of the Board is an independent director and does not occupy a joint position as Chief Executive Officer. Induction Upon appointment each new Director participates in an induction programme. This includes presentations from senior management and site visits to gain an understanding of the Group’s operations. In addition to annual asset tours undertaken by the Board site visits are also arranged on an ad‐hoc basis and as part of the programme of committee meetings. Training Directors are required to keep themselves adequately informed in respect of relevant industry and regulatory issues and changes. In order to assist Directors, each Director may participate in internal training sessions and conferences organised from time to time in respect of relevant industry and regulatory issues and may attend asset tours that are arranged from time to time. Additional training requirements may be arranged by the Company Secretary with the Chair’s approval. Principle 3 – Promote ethical and responsible decision‐making
Ethical Conduct The Board has adopted a suite of policies designed to govern employee’s behaviour whilst employed by the Group and ensure that ethical business practises are adopted in the procurement process. All employees are required to acknowledge that they understand and will comply with the Employee Ethical & Confidentiality Policy. Media Relations Employees are prohibited from communicating with or disclosing to any representative of the media any information of any nature whatsoever relating to the Group, its clients or customers. Only the Chair, Board of Directors, Chief Executive Officer and Chief Financial Officer are authorised to speak to the media on Group issues. Exceptions to this rule must have the prior approval of the Chief Executive Officer. Notwithstanding the general prohibition, the respective Chief Executives of each of the business divisions are authorised to speak to the media on issues specific to their area of business. Intellectual Property All intellectual property created during an employee’s employment with the Group is and remains the property of the Group. Confidentiality All Group related information acquired by Directors during their appointment is confidential to the Group and should not be released, either during the term of the Directors’ appointment or following their termination without prior approval of the Board.
For
per
sona
l use
onl
y

Corporate Governance Statement 30 June 2015
Employees are required to keep secret during and after their employment all information obtained about the business and affairs of the Group, its clients or customers, except as required by law. All documents or written material provided to the employee or used in connection with the Group’s business is the property of the Group and must not be removed, passed on, copied or disclosed to third parties except with the Group's authority. Conflicts of Interest Directors should not have any business or other relationship that could materially influence or interfere with the exercise of their independent judgement apart from those declared to the Board under the Corporations Act 2001, ASX Listing Rules and other general law requirements. Directors with a material personal interest in a matter must not be present at a Board meeting during the consideration of the matter and subsequent vote unless the Board (excluding the relevant Board member) resolves otherwise. Directors with a conflict not involving a material personal interest may be required to absent themselves from the relevant deliberations of the Board. Personal Gain Employees must not misuse their position with the Group or any information received in the course of their employment to produce a personal benefit for themselves, their family, friends or any other person, or to cause a detriment to the Group. In the event of any conflict of interest this must be disclosed to the Group. Employees are prohibited from soliciting or accepting any gift or benefit which induces or influences the Group to enter a transaction, business opportunity or business dealing, or which might reasonably be perceived as such an inducement or influence. Ethical Business Practices All employees and Group suppliers must adopt the following standards:
Suppliers should adhere to applicable laws and regulations that govern them.
Employment should be freely chosen; there should be no forced, bonded or involuntary prison labour, employees should not be required to lodge 'deposits' or identity papers with their employer and should be free to leave their employer after reasonable notice.
Employees should have freedom of association and the right to collective bargaining within the framework of applicable laws.
Working conditions should be safe and healthy; applicable Occupational, Health & Safety laws & regulations must be complied with.
Child labour should be eliminated and suppliers should conform to provisions of International Labour Organization Convention 138 and be consistent with United Nations Convention on Rights of the Child.
Living wages should be paid and they must meet or exceed national standards. Wages must not be paid in kind and employees should be provided with written and understandable information about their employment conditions.
Working hours should not be excessive and should comply with national laws and national benchmark industry standards.
Discrimination based on race, caste, national origin, religion, age, disability, gender, marital status, sexual orientation, union membership or political affiliation is prohibited.
Regular employment should be provided and work performed must be on the basis of recognised employment relationship established through national law and practice.
Harsh or inhumane treatment of employees is prohibited.
For
per
sona
l use
onl
y

Corporate Governance Statement 30 June 2015
The Group seeks to collaborate with suppliers in pursuit of these standards and attempts to guide relationships by the principle of continuous improvement. Similar ethical trading standards will be considered acceptable as a reasonable alternative where suppliers are already working towards this initiative. The Group promotes a risk based approach to implement these standards by focusing attention on those parts of the supply chain where risk of not meeting these standards is highest. This is supported by the provision of appropriate training and guidelines to implement these standards. Suppliers are advised that implementation of these standards may be assessed by the Group or through independent verification. Suppliers are required to use reasonable endeavours to provide workers covered by these standards with a confidential means to report to the suppliers' failure to observe these standards. It is expected that all suppliers will comply with the standards and the Group reserves the right not to do business with suppliers where it can be demonstrated that significant violations exists. In particular, the Group and/or its separate businesses will not bring suppliers onto its supplier list if there is evidence of under‐age workers; forced, bonded or involuntary prison labour, or where the supplier's workers are found to be subjected to potential life threatening working conditions or harsh or inhumane treatment. Whistle‐Blowing The purpose of the Whistle‐Blowing Policy is to establish an internal reporting system for the reporting of disclosures of corrupt conduct, illegality or substantial waste of company assets by the Group or its employees. Protected Disclosures The Whistle‐Blowing Policy clearly defines what disclosures are protected and these included such disclosures that are made in accordance with the process outlined in the policy, that Identify or attempt to identify corrupt conduct, illegality, or serious and substantial waste of company assets by the Group or its employees and that are made voluntarily by an employee of the Group. Frivolous disclosures or those made solely with the motive of avoiding dismissal or other disciplinary action are not covered by the Whistle‐Blowing Policy. The making of a false or misleading statement when making a disclosure under the Whistle‐Blowing Policy constitutes gross misconduct. Making a Disclosure Under the Whistle‐Blowing Policy, disclosures are made to a nominated officer. This can be done in person, by email or via the Group’s third party independent ethics hotline. Disclosures can be made either inside or outside normal working hours and locations. Group employees are encouraged to report known or suspected incidences of corrupt conduct, illegality or substantial waste in accordance with the Whistle‐Blowing Policy. All Group employees must abstain from any activity that is or could be perceived to be victimisation or harassment of persons who make disclosures. The confidentiality of persons they know or suspect to have made disclosures should be maintained. The nominated officer is responsible for receiving, forwarding and acting upon disclosures and must take all necessary and reasonable steps to ensure that the identities of persons who make disclosures, and the subjects of disclosures, are kept confidential. The nominated officer is also responsible for supporting persons who make disclosures and protecting them from victimisation, harassment or any other form of reprisal. External Disclosures
For
per
sona
l use
onl
y

Corporate Governance Statement 30 June 2015
Disclosures to persons or bodies external to the Group will only be protected under the Whistle‐Blowing Policy if the person making the external disclosure has already made the same disclosure through the internal reporting system, the employee has reasonable grounds for believing that the disclosure is substantially true, the disclosure itself must be substantially true and the nominated officer has decided not to investigate the matter, has not completed the investigation within six months of the original disclosure or has not recommended any action in respect of the matter. Liability on Disclosure The Whistle‐Blowing Policy provides that a person is not subject to any liability for making a protected disclosure and no action, claim or demand may be taken or made of or against the person for making the disclosure. A person who has made a protected disclosure under the Whistle‐Blowing Policy is taken not to have committed any offence against any legislation which imposes a duty to maintain confidentiality with respect to any information disclosed. Action Taken A person who makes a disclosure under the Whistle‐Blowing Policy must be notified, within six months of the disclosure being made, of the action taken or proposed to be taken in respect of the disclosure. Fraud The Group operates a Fraud Policy designed to prevent, deter, detect and investigate all forms of fraud. For the purposes of the Fraud Policy, “fraud” is defined as the intentional distortion of financial statements or other records by persons internal or external to the organisation which is carried out to conceal the misappropriation of assets or otherwise for gain. The Group has adopted a "zero tolerance" towards fraud and requires that all reported incidents, including internal fraud, will be thoroughly investigated with utmost confidentiality. Necessary action will be taken against any individual or group who have committed fraud and may involve disciplinary action resulting in dismissal from employment, and civil and/or criminal legal proceedings. Critical business procedures and controls are directed to maintain an effective fraud control environment to assist in fraud prevention and detection. Any employee who suspects a fraudulent activity must notify the business Chief Executive or alternatively email details to a private email address set up exclusively for this purpose. Securities Trading Policy The purpose of the Securities Trading Policy is to regulate trading by all Directors and employees of the Group in any securities issued or nominated by the Group. This also applies to financial products issued or created over such securities (including but not limited to warrants, options and derivatives), entering into financing arrangements over financial products including establishment of a margin loan over such securities. This Securities Trading Policy also applies to trading by Directors’ and employees’:
Spouses;
Children under the age of 18 years;
Dependent children living in the family home;
Trusts under which they or a member of their family are a trustee or beneficiary; and
Companies which they or their family control.
For
per
sona
l use
onl
y

Corporate Governance Statement 30 June 2015
General Prohibition (Insider Trading) At all times Directors and employees are prohibited from trading in securities while in possession of unpublished price sensitive information. Price sensitive information is information which is not generally available and which a reasonable person would expect that if the information were disclosed it would have a material effect on the price of Group securities and it would therefore influence investors in deciding whether or not to buy, hold or sell securities issued by the Group. This prohibition applies even during periods when trading windows are permitted under this policy if a person is in possession of price sensitive information. In addition to not being able to deal, the person in possession of the price sensitive information has an obligation to keep that information confidential and must not communicate it to another person unless it is information, which is required to be brought to the attention of the Company Secretary. Specific Prohibition All Directors and Nominated Employees are bound as a condition of their employment to comply with and observe the Securities Trading Policy. Trading Windows Provided Directors and Nominated Employees are not in possession of unpublished price sensitive information and have received written consent from the Company Secretary, or in the case of Group Directors and the Group’s Key Management Personnel, the Chair. The times during which they are permitted to trade in securities issued by the Group are:
Commencing 24 hours after the announcement of quarterly results until 30 days thereafter;
Commencing 24 hours after the announcement of half yearly results until 30 days thereafter;
Commencing 24 hours after the announcement of yearly results until 30 days thereafter; and
Commencing 24 hours after the Annual General Meeting (“AGM") until 30 days thereafter. Due to reporting timetables some of the trading windows listed above overlap. In order to ensure all Nominated Employees are aware of their obligations the Company Secretary issues an open reminder and a close reminder to all Nominated Employees. In addition, the Group publishes key reporting dates on the Group’s website. The Group may in its discretion vary trading windows by general announcement. Black Out Periods All periods outside of the trading windows are blackout periods in relation to security trading by Directors and Nominated Employees. The Group may in its discretion nominate additional blackout periods by general announcement. These may be required where additional disclosure documents are released offering securities or as a result of certain disclosures being lodged with a stock exchange, e.g. the Australian Stock Exchange. Discretion is vested in the Company Secretary to allow exemptions to trading during blackout periods in special circumstances only, where no price sensitive information is on hand and application of the Policy would cause undue financial hardship. No Short Term Trading
For
per
sona
l use
onl
y

Corporate Governance Statement 30 June 2015
The Board encourages employees to invest in the Group and discourages short term trading. Under the terms of the Securities Trading Policy Nominated Employees must not deal in securities for short term gain. Speculating in short term fluctuations in such securities does not promote investor and market confidence in the integrity of the Group. Accordingly, trading in securities issued by Group entities within 6 months of an acquisition is prohibited. The Group may in its discretion vary this rule in relation to a particular period by general announcement. The Securities Trading Policy does not prevent Directors and employees from passive trading such as participating in a share plan or public offer made by the Group, provided that at the time the individual elects to participate, he or she is not in possession of any price sensitive information. Further, the individual may not subsequently vary that election until such time as they are again not in possession of such information. The Securities Trading Policy also prohibits any hedging of unvested security based incentives by Directors and Nominated Employees. Directors or Nominated Employees wishing to trade in securities must request prior approval to trade. Directors and the Group’s Key Management Personnel must seek prior approval from the Chair while all other employees must contact the Company Secretary. Principle 4 – Safeguard integrity in financial reporting
Audit & Risk Committee The Board has established an Audit & Risk Committee (the “Committee”) consisting of a minimum of three members with the majority of members required to be independent directors. All members must be able to read and understand financial statements, and at least one member must have financial expertise, that is the person must be either a qualified accountant or other financial professional with experience of financial accounting matters. The Chief Executive Officer and the Chief Financial Officer are not members of the Audit and Risk Committee. They may be invited to attend meetings of the Audit and Risk Committee for reasons of efficiency but are not entitled to vote. The Chair of the Committee will be a non‐executive independent director appointed by the Board who is not the Chair of the Board. Any Director may attend a meeting of the Committee at any time. The Committee will meet at least twice per annum and more often if deemed necessary. Meetings may be held by electronic means as allowed under the provisions of the Corporations Act 2001. The Committee is established by the Board of Directors to review, evaluate and make recommendations to the Board in relation to: Risk and Internal Control Environment
Evaluating and monitoring the overall effectiveness of the Group’s risk management, internal control and compliance systems;
Evaluating the current “control culture” of the Company and the underlying consistency, direction and communication to employees of appropriate risk policies therein;
Reviewing existing disaster recovery plans;
Identifying key risks within the organisation and building appropriate risk management controls and policies to minimize the impact and likelihood of same; and
For
per
sona
l use
onl
y

Corporate Governance Statement 30 June 2015
Ensuring adequate resources are allocated to assist management and the Board in implementing an appropriate internal risk culture and discipline;
Evaluating and monitoring the Group’s fraud management policies and exposures; and
Reviewing the entity’s insurance program, having regard to the entity’s business and the insurable risks associated with its business.
Financial Reporting
Approving and monitoring policies, procedures and content of the Group’s statutory and management reporting;
Considering the appropriateness of the Group’s accounting policies and principles and how those principles are applied;
Reviewing and assessing existing management processes so as to ensure compliance with applicable laws, regulations and accounting standards;
Ensuring that significant adjustments, unadjusted differences, disagreements with management and critical accounting policies are discussed in advance with the external auditor;
Reviewing the underlying quality and accuracy of the financial reports from the internal and external auditors and making recommendation to the Board on their approval or amendment;
Evaluating the adequacy and effectiveness of the Company’s administrative, operating and accounting policies through communication with management, internal auditors and external auditors;
Evaluating and monitoring the adequacy of the Group’s management and operational reporting;
Ensuring the effective facilitation of the audit process;
Reviewing and evaluating appropriate disclosures from management, the internal auditors and external auditors on any significant proposed regulatory, accounting or reporting issue, to assess the potential impact upon the Group’s financial reporting process; and
Serving as an independent and objective party to review the financial information presented by management to shareholders, analysts and the general public.
Internal Audit
Making recommendations to the Board on the appointment, and where necessary the removal of the internal auditor;
Reviewing the role, function and performance of the internal auditor, and management’s response to the internal auditor’s recommendations;
Appraising the scope and quality of the audits conducted by the Group’s internal auditor to ensure the widest coverage possible;
Reviewing the findings of the internal audit program and management’s response to the internal auditor’s recommendations; and
Reviewing the resources of the internal audit function and ensuring no unjustified restrictions or limitations are imposed.
External Audit
Making recommendations to the Board on the appointment and where necessary the removal of the external auditor;
Reviewing annually the external auditor’s procedures for independence together with any relationships or services, which may impair the external auditor’s independence, and the rotation of the audit partner;
Reviewing the fees and terms of engagement of the external auditor, including the scope and adequacy of the proposed audit program;
Appraising the scope and quality of the audits conducted by the external auditor to ensure the widest coverage possible;
Ensuring there is appropriate communication and co‐ordination between the internal and external auditors on risks, risks policies and audit results;
For
per
sona
l use
onl
y

Corporate Governance Statement 30 June 2015
Reviewing all financial reports and management representation letters and recommending them to the Board as complete and appropriate; and
Reviewing annually the performance of the external auditor and based on the results of the annual assessment of the external audit services, determine whether the external audit services should be re‐tendered.
Compliance
Monitoring the Company’s various disclosure obligations;
Approving of the Group’s compliance framework and assessing the effectiveness of the framework; and
Based on the information provided by Management in relation to the Group’s compliance framework, ensuring that a proper process is in place for continuous reporting to the ASX.
Right to Obtain Information
The Committee is entitled to consult with expert advisers and seek expert advice where it considers it necessary to carry out its duties at the expense of the Group. The Committee will have a right of access to internal and external auditors and senior management. The Committee will also meet separately with the internal and external auditors at least annually or as otherwise required. Chief Executive Officer and Chief Financial Officer Declarations The Board has received confirmation from both the Chief Executive Officer and Chief Financial Officer that their declarations for both the interim and full year financial reporting periods made in accordance with section 295A of the Corporations Act 2001, were based upon sound system of risk management and internal control and further that the system is operating effectively in all material respects in relation to financial reporting risk. External Auditors The external auditor is requested by the Board to attend each AGM to answer questions about the conduct of the audit and the preparation and contents of the Auditors Report. Principle 5 – Make timely and balanced disclosure
Continuous Disclosure Policy In order to regulate the continuous disclosure regime across the Group in relation to any securities issued by the Group the Board has adopted a Continuous Disclosure Policy. The Continuous Disclosure Policy aims to ensure that the Group complies with the continuous disclosure requirements contained in the Corporations Act 2001 (the Act) and the Australian Stock Exchange (ASX) Listing Rules (the Rules). The successful operation of the Group’s continuous disclosure regime promotes investor confidence by providing full and timely information to the market about the activities of the Group and serves to educate all relevant Group personnel on what continuous disclosure is, and how they can ensure they meet their individual responsibilities. Commitment to Continuous Disclosure Subject to the exceptions contained in the Listing Rules, the Group will immediately notify the market of any information or matter related to the businesses or financial condition of the Group which a reasonable
For
per
sona
l use
onl
y

Corporate Governance Statement 30 June 2015
person would expect to have a material effect on the price or value of those securities. Such notifications will be made by way of an announcement to the ASX. Reporting of Disclosable Information Directors and employees must ensure that any information which may require disclosure is reported to the Company Secretary or his/her nominee as soon as it is known. The Company Secretary will then determine whether any item of information is to be disclosed to ASX. Where the Company Secretary decides that information reported does not warrant an ASX release and the Director or employee who reported the information disagrees with that decision, they may choose to refer the matter to the Chief Executive Officer. ASX Announcement Approval If the Company Secretary determines that an item of information is to be disclosed to the ASX then the draft of the ASX announcement must be approved either verbally or in writing, by the Chief Executive Officer prior to release. ASX announcements deemed to contain price sensitive information must be circulated to the Board of Directors for comment prior to release. Release of Information Price sensitive information must not be released externally until it has first been lodged with the ASX and the ASX has acknowledged that the information has been released to the market. That is, selective disclosure of such information cannot be made to brokers, analysts, the media, professional bodies or any other person until the information has been given to (and released by) the ASX. This includes information that is subject to embargo as the ASX does not accept embargoed information. In the event that at an analyst or media briefing an inadvertent disclosure is made which is price sensitive then that information must be immediately made available to the market through the ASX. Analyst and Media Briefings All material to be presented at an analyst briefing must be approved by or referred through the Company Secretary prior to the briefing. Trading Halts The Company Secretary may, with the approval of the Chair and the Chief Executive Officer, or failing whom, the Chief Executive Officer and any other Non‐Executive Director, or failing whom any two Non‐Executive Directors, request the ASX to halt trading in the securities. Training and Development The Continuous Disclosure Policy requires that relevant employees undergo training with respect to disclosure requirements. Board Procedures The Board of Directors must consider and minute at each full Board meeting whether there are any matters requiring disclosure. If no matters require disclosure this must also be explicitly included in the minutes.
For
per
sona
l use
onl
y

Corporate Governance Statement 30 June 2015
Media Releases Releases, interviews and other communications to the media may be undertaken so long as they do not contain or refer to price sensitive transactions and do not fall within the Group’s materiality thresholds. Any discussions or presentation to third parties should only be undertaken post release to the ASX of the subject matter if they include material information. Website All releases whether material or not are required to be posted to the Group website for access by investors and other interested parties. Principle 6 – Respect the rights of shareholders
Corporate Governance The Group’s website at www.ardentleisure.com has a corporate governance section on its website from where all relevant corporate governance information can be accessed, including the details on the Board of Directors, Management Team, the Company and Trust Constitutions, Board and Committee Charters and various corporate governance policies. Investor Communications The Group has adopted a specific investor communications policy for investors and believes that a flexible approach to investor communications and early adoption of emerging technology is the most effective manner of increasing investor participation in the business of the Group. Throughout the year, the Group follows a calendar of regular disclosures to the market on its financial and operational results. An indicative calendar of events is made available to investors on the Group’s website. In accordance with the Group’s Continuous Disclosure Policy, the Group must ensure it does not communicate inside information to an external party except where that information has previously been disclosed to the market generally. As soon as is practicable all Group announcements and copies of analyst and media briefing are posted to the Group’s website. Other information of relevance to investors is also made available on our website, including, annual and half yearly financial reports, key dates, distribution history, cost base allocations, management fee breakdowns and the management investment trust notices. The website also contains a link to the Group’s security registrars and a live feed from the ASX for the Group’s security price information. Investors Reports The Group prepares annual reports for investors for each financial year ending 30 June and half year for the period ending 31 December. These reports are posted on the website on their day of release to the ASX. Investors may elect to receive a hard‐copy of these reports or an email notification once they become available on the website. The default option for receiving the annual report is via the Group’s website at www.ardentleisure.com.
For
per
sona
l use
onl
y

Corporate Governance Statement 30 June 2015
General Meetings The Group holds an annual general meeting (AGM) in October or November each year. The date, time and venue of the AGM are notified to the ASX when the annual report is lodged with the ASX, generally in September each year. The Board of Directors aims to choose a date, venue and time considered convenient to the greatest number of our investors. All notices of meetings will be accompanied by clear explanatory notes on the items of business. A copy of any such Notice of Meeting will be placed on the Group’s website. Should an investor not be able to attend a general meeting they are able to vote on the resolutions by appointing a proxy. The proxy form included with the notice of meeting will clearly explain how the proxy form is to be completed and submitted. As previously stated, the external auditor attends each AGM to answer questions about the conduct of the audit and the preparation and contents of the Auditors Report. Investor benefit program Investors with 2,000 or more securities are entitled to participate in an Investor Benefits Program. The program aims to provide qualifying investors with an opportunity to experience some of the assets owned by the Group at discounted rates. Principle 7 – Recognise and manage risk
Safety, Sustainability & Environment Committee In addition to the Audit & Risk Committee detailed in Principle 4 the Board has established a Safety, Sustainability & Environment Committee (SSE Committee). The SSE Committee was established to monitor, review, evaluate and make recommendations to the Board in relation to occupational health & safety (OH&S), sustainability and the environment. The Committee was established by the Board of directors to monitor, review, evaluate and make
recommendations to the Board in relation to the following matters:
Safety
The effectiveness of OH&S policies and the safety related aspects of the operational risk management framework necessary to maintain a safe environment for both guests and employees across the Group including drafting, implementing and recommending improvements;
Setting appropriate goals to maintain the Group’s lost time injury frequency rate (LTIFR) below industry benchmarks;
The adequacy of existing OH&S resources as well as their ongoing training and supervision;
The scope and results of periodic internal and external reviews of OH&S and operational risks including the process of identifying and assessing OH&S risks and the adequacy of existing OH&S risk management systems; and
The compliance of the Company with regard to existing and possible future OH&S regulations and determining what changes, if any, need to be made to existing work practices in order to ensure compliance.
Sustainability
Reviewing the Group’s policies and procedures in relation to sustainability;
Monitoring the adequacy of resources applied to sustainability as well as their ongoing training and supervision;
Reviewing any report on sustainability, which is prepared pursuant to any Listing Rule or legislative requirement or which is proposed for inclusion in the annual report; and
For
per
sona
l use
onl
y

Corporate Governance Statement 30 June 2015
The compliance of the Company with regard to current laws and regulations and determining what changes, if any, need to be made to existing work practices in order to ensure compliance.
Environment
Evaluating and monitoring the effectiveness of the Group’s environmental policies and environmental management plans;
Evaluating and monitoring the adequacy of environmental resources as well as their ongoing training and supervision;
Reviewing the scope and results of periodic internal and external reviews of environmental risks including the process of identifying and assessing environmental risks and the adequacy of existing environmental risk management systems; and
The compliance of the Company with regard to current environmental laws and regulations and determining what changes, if any, need to be made to existing work practices in order to ensure compliance.
The Committee will not address matters associated with financial or monetary risk associated with internal financial controls.
Risk Management Framework The Risk Management framework for the Group requires a periodic review by management and the Board. These reviews ensure that the risk management framework continues to be a pro‐active tool across the Group. Scope of Risks considered The risk management review covers five key business risks:
Key Business Risk Risk Categories
Enterprise Continuity, Control, Cost, Culture, Efficiency, Insurance, Knowledge, Legal & Regulatory, Performance, Privacy, Resourcing, Strategic Planning, Strategic Execution, Succession.
Fraud / Error Cash, Brand / Trademark, Consumables & Trading Stock, Procurement, Defamatory, Financial Statements, Furniture & Fittings, Hardware, Information Systems, Information & Knowledge, Job, Management Reporting, Payroll, Personal Property, Software, Office Supplies, Company Income Tax, GST, FBT, PAYG, Payroll Tax, Web.
Business Management Framework Awareness, Change, Confidentiality, Contract, Culture, Detection, Documentation, Escalation, Interpretation, Reporting, Resourcing, Responsibility.
Board Secretarial Admission, Conflict, Documentation, Duties, Governance, Legal, Regulatory, Resolution.
Environmental & Safety Management
Contamination, Media / Publicity, Employee Safety, Guest & Contractor Safety.
Risk Assessment Methodology The risk assessment methodology adopted for these reviews includes a three step process. Firstly, the inherent risk for each risk category is determined by evaluating likelihood & consequence of the risk based on the current and existing processes. Risks are evaluated and ultimately allocated to one of 4 distinct
For
per
sona
l use
onl
y
Corporate Governance Statement 30 June 2015
categories of Extreme, High, and Moderate and Low. Next the effectiveness of existing risk controls is reviewed and a ranking determined on a scale of Good, Fair or Poor. Finally, after the controls have been assessed the residual risk factors are derived into three categories of High, Medium and Low by merging the inherent risk rating and the effectiveness of the controls rating. Risk Gap Analysis During the year the Group’s senior executive reviewed the risk management register and undertook a third party gap analysis designed to identify any material risks that had not otherwise been included in the risk review process and to independently assess the Group’s internal residual risk ratings. Internal Audit The Group has an Internal Audit function which is responsible for assisting with the accomplishment of the Group’s objectives by bringing a systematic, disciplined approach to evaluating and continually improving the effectiveness of its risk management and internal control processes. The Group Internal Audit Manager has a direct reporting line to the board via the Audit and Risk Committee. Principle 8 – Remunerate fairly and responsibly
Remuneration & Nomination Committee The Directors have established a combined Remuneration and Nomination Committee due to the relatively infrequent need to call upon the services of the previous Nomination Committee. The combined Remuneration and Nomination Committee consists of a minimum of three members with the majority of members required to be independent directors. The Remuneration and Nomination Committee is specifically responsible for making recommendations to the Board in relation to setting policies for remuneration programs appropriate to the Group, remuneration and incentive schemes of senior management, reviewing the performance of the Chief Executive Officer on an annual basis, setting the Group’s recruitment, retention and termination policies and procedures for senior management, superannuation, The remuneration framework for directors and the approval of any report on executive remuneration, which is required pursuant to any Listing Rule or legislative requirement or which is proposed for inclusion in the Annual Report. Further details of the Group’s remuneration policies are set out in the Directors’ Report contained in the Annual Financial Report for the year ended 30 June 2015. The Board has adopted a specific clawback clause to be included in grant letters for deferred equity whereby any unvested Performance Rights shall be subject to potential lapse, cancellation, rescission or other action in the event that the Group becomes aware of any misstatement in its financial statements for any of the immediately preceding 3 financial years due to:
(a) a material non‐compliance with any financial reporting requirement; (b) the misconduct of any Key Management Personnel; or (c) the misconduct of any of its other employees, contractors or advisers as a result of the direction
(or lack of direction) by any member of the Key Management Personnel. To the extent that the Performance Rights granted exceed the number, metrics or outcome that would have been applied had the misstatement not been made, then the Group may cause the deferred vesting or lapse of unvested Performance Rights representing all or part of the grant.
For
per
sona
l use
onl
y

For
per
sona
l use
onl
y

For
per
sona
l use
onl
y

For
per
sona
l use
onl
y

For
per
sona
l use
onl
y

For
per
sona
l use
onl
y

For
per
sona
l use
onl
y

For
per
sona
l use
onl
y

For
per
sona
l use
onl
y

For
per
sona
l use
onl
y

For
per
sona
l use
onl
y

For
per
sona
l use
onl
y