for personal use only - asx2015/08/19 · two long standing directors terry williamson and duncan...
TRANSCRIPT

For
per
sona
l use
onl
y

STREAMLINED FINANCIAL STATEMENTS
KEEPING IT SIMPLE ….
These financial statements have been organised into the following six sections to make them less complex and more relevant to unitholders/ securityholders:
• Basis of preparation
• Results for the year
• Operating assets and liabilities
• Capital structure and financing costs
• Group structure and
• Other items.
Each section sets out the accounting policies applied in producing the relevant notes, along with details of any key judgements and estimates used or information required to understand the note. The purpose of this format is to provide readers with a clearer understanding of what drives the financial performance and position of the Group.
The aim of the text in ‘Keeping it simple’ boxes is to provide commentary on more complex sections, or notes, in plain English.
Notes to the financial statements provide information required by statute, accounting standards or ASX Listing Rules to explain a particular feature of the financial statements. The notes to the financial statements which follow will also provide explanations and additional disclosure to assist readers' understanding and interpretation of the financial report.
CONTENTS
Letter from the Chairman 1
Letter from the Managing Director and CEO 3
Directors’ Report 5
Operating and Financial Review 5
Directors 17
Corporate Governance 21
Remuneration Report – Audited 34
Lead Auditor’s Independence Declaration under Section 307C of the Corporations Act 2001 57
Consolidated Statements of Profit or Loss and Other Comprehensive Income 58
Consolidated Balance Sheets 59
Consolidated Statements of Changes in Equity 60
Consolidated Cash Flow Statements 62
Consolidated Notes 63
Directors’ Declaration 130
Independent Auditor’s Report 131
Security Information and key dates 133
For
per
sona
l use
onl
y

Stockland Financial Report 2015 — 1
Letter from the Chairman
Dear Securityholders,
It is a great pleasure to report another year of strong profit growth as we realise the benefits of our strategy and capitalise on supportive market conditions.
Underlying profit grew by 9.4% to $608 million and underlying earnings per security was up 7.8% on FY14. Funds from operations was up 14.7% and statutory profit was $903 million, more than 70 percent higher than the prior year.
Our good results reflect solid increases in earnings across all three businesses – Commercial Property, Residential and Retirement Living. We have been disciplined in implementing our strategy to ensure that the decisions we make today will serve our business well through the business cycle.
Examples of progress on our strategic priorities include nearly $600 million in acquisitions across Retail, Logistics and Business Parks, Residential and Retirement Living, expanded investment in medium density residential product, our strong balance sheet, high customer satisfaction across all areas of our business, and significant cost savings from efficiency improvements.
We have been disciplined in implementing our strategy to ensure that the decisions we make today serve our business well through the business cycle. __
GRAHAM BRADLEY AM CHAIRMAN
For
per
sona
l use
onl
y
Stockland Financial Report 2015 — 2
We have also maintained our leadership position in sustainability, and were named one of the most sustainable real estate companies globally in the Dow Jones Sustainability Index for the eighth consecutive year.
DISTRIBUTION
As promised, our full year distribution was 24 cents per security, representing a payout ratio of 93% of underlying profit.
Looking forward, we have updated our distribution policy to pay the higher of 100% of Trust taxable income or 80-90% of underlying profit. We believe that this is the appropriate level to provide growing returns for securityholders while allowing for investment in future growth.
In line with our new payout policy, and in recognition of consistent profit growth over the last two years, in FY16 we are targeting a distribution of 24.5 cents per security, assuming there is no material change in market conditions.
GOVERNANCE
Following many years of service, two long standing directors Terry Williamson and Duncan Boyle will retire at the Annual General Meeting on 27 October 2015.
Terry and Duncan have been highly valued members of the Stockland Board for many years. They have both contributed greatly to the success of the business through their strategic insights, critical thinking and professionalism. I thank them sincerely for their long and dedicated service.
The Board’s succession planning is in place for the impending retirement of these two senior directors, with Tom Pockett to succeed Terry Williamson as chair of the Audit Committee. Tom’s deep experience as a Chief Financial Officer ideally qualifies him for this role.
At Stockland, we recognise the advantages of having a mix of relevant business, executive and professional experience on the Board, the importance of cultural and ethical values, and the benefits of diversity, including gender diversity. I am, therefore, delighted to welcome our new director, Dr Nora Scheinkestel. Nora’s experience as a company director across a range of sectors including property, financial services, utilities and infrastructure will strongly complement our Board. As required by the Stockland Constitution, Nora will offer herself for election by securityholders at the 2015 Annual General Meeting on 27 October 2015.
To strengthen the alignment of director and securityholder interests, the Board has revised our policy on ownership of securities by directors. The minimum number of securities each Non-Executive Director is now required to acquire, within a reasonable time of joining the Board, has been increased from 10,000 to 40,000. This increase reflects our belief that Directors should hold a meaningful number of Stockland securities. The new minimum equates roughly to one year’s base board fees.
STOCKLAND CARE FOUNDATION
Stockland has a proud history of making a positive contribution to the community through our development activity and employee giving and volunteering. Earlier this year I was delighted to launch the Stockland CARE Foundation with a capital contribution of $8 million to secure our ongoing commitment to continue this important legacy.
Our contribution represents about 10 percent of the one-off gross profit realised from the sale of our shareholding in Australand during the year. Income from the Foundation will be donated to community partners focused on the areas of health, wellbeing and education. The Foundation also boosts our employee giving and volunteering opportunities.
For the next three years, the Foundation will support two outstanding organisations: Touched by Olivia which provides an expanding national network of inclusive play spaces and social enterprises that provide training and employment for people with disabilities, and Redkite, which provides essential support to children and young people with cancer and to their families.
As Chair of the Foundation, I am proud to lead this initiative, which will ensure we continue to support the communities in which we operate.
CONCLUSION
In conclusion, I would like to thank my Board colleagues and Stockland’s talented employees for their commitment and discipline in advancing the Group’s strategy and delivering a strong result for securityholders in FY15. While remaining cautious about the uneven market conditions we face over the next 12 months, I am confident that the operating platform we have established will allow Stockland to sustain solid growth in the year ahead.
GRAHAM BRADLEY AM CHAIRMAN
For
per
sona
l use
onl
y

Stockland Financial Report 2015 — 3
Letter from the Managing Director and CEO
Dear Securityholders,
When I joined Stockland in 2013 we set out a strategy to make the business more resilient and profitable to ensure sustainable earnings growth for our securityholders into the future. I am pleased to report that we are on track, with all of our key metrics showing significant improvement in FY15, underpinned by strong growth in our core businesses and we are well placed to achieve continued growth.
We remain focused on growing returns for securityholders through a disciplined approach to our strategic priorities of growing asset returns and our customer base, maintaining our capital strength, and delivering operational excellence. We made good progress in each of these areas in FY15.
GROW ASSET RETURNS AND CUSTOMER BASE
Commercial Property remains a key driver of our Group’s success. On a comparable basis we achieved operating profit growth of 4.3% across the portfolio, with 4.2% in Retail, 3.1% in Logistics and Business Parks and 6.4% in Office, reflecting our strong focus on property fundamentals.
I am pleased to report that we are on track, with all of our key metrics showing significant improvement in FY15. __
MARK STEINERT MANAGING DIRECTOR AND CEO
For
per
sona
l use
onl
y

Stockland Financial Report 2015 — 4
Our retail portfolio performed strongly with high occupancy, positive leasing spreads on new leases and renewals and lower incentives (which are only paid on new leases). Total Moving Annual Turnover in our shopping centres grew 4.5%, with 7.0% growth from specialty stores. This is the strongest specialty sales growth we have recorded in four years.
We are starting to see the benefit of the major redevelopments we have undertaken over recent years as these assets progressively stabilise. In FY15 we opened major redevelopments at Hervey Bay in Queensland, Baldivis in Perth, and the first stage of Wetherill Park in Sydney. The final stages of Wetherill Park, Point Cook in Melbourne, Glasshouse in the Sydney CBD and stage one of Harrisdale in Perth are all underway and will complete in FY16. These developments represent a combined investment of $550 million with an expected stabilised average yield of 7-8%.
In our Logistics and Business Parks business we are steadily building up a strong portfolio of assets that delivers solid returns and presents opportunities for future growth. In FY15 we acquired three new sites in Sydney and Melbourne and made good progress repositioning our portfolio with asset improvements under way at a number of key sites.
Our exposure to the Office sector remains tactically overweight in Sydney, reflecting our view on the challenging state of the other office markets.
Our Residential business achieved a substantial 73.5% uplift in profit and ended the year with a record 3,742 contracts on hand, up 17% on last year.
This strong result reflected generally positive market conditions in the corridors where we operate and the progress we have made launching six key projects in two years and broadening our customer reach with diverse product offerings. Providing our customers with more choices is proving to be successful and we are now ramping up production for FY16 at selected projects.
During the year we also continued to replenish our land bank with the acquisition of 4,000 lots. We have been quick to activate many of these with the majority of new projects on track to deliver profit within two years of acquisition.
Our Retirement Living operating profit was up 19.9% on FY14 reflecting strong sales, active management and improved efficiency. The business is now two years into our five year plan to achieve a 7% cash return on assets, which is marked by taking a much more active approach to how we manage our village portfolio.
During FY15 we made good progress reshaping our portfolio via capital recycling with the sale of two non-core villages and acquisition of eight villages in South Australia which has a particularly strong Retirement Living market.
CAPITAL STRENGTH
We have maintained our strong balance sheet and A-/stable credit rating, supporting cost effective financing of our future growth.
Our active capital management has improved our weighted average cost of debt and maintained our average debt maturity. Gearing at the end of FY15 was 23.4%, at the lower end of the target range of 20 – 30%, but is expected to move up within our target range over the FY16 year.
OPERATIONAL EXCELLENCE
We maintained a proactive focus on operating efficiency. In FY15 we commenced a project to outsource some functions in finance and IT to provide more flexible and scalable support. This initiative will build on the significant reduction in overheads we achieved following our restructuring in FY14.
Sustainability remains a key focus for Stockland. We are proud to have been named one of the most sustainable real estate companies in the world in the Dow Jones Sustainability Index for the eighth consecutive year. Since FY06 we have saved over $60 million through carbon intensity reductions. This year we were the first Australian company to issue a green bond which, among other things, has been used to fund the largest single rooftop solar system in Australia at our Shellharbour shopping centre.
OUTLOOK
While the outlook for specific markets remains uneven, with some caution among businesses and consumers, we expect conditions to remain reasonably supportive in FY16. Interest rates are anticipated to be stable and we expect the economy to continue to grow, albeit at below trend levels.
We have commenced FY16 with a high level of residential contracts in hand and retirement living net reservations, and with good momentum in retail sales.
I am confident in the strategy we are executing and that Stockland is well placed to continue to deliver profitable growth from our core businesses in FY16 and beyond.
MARK STEINERT MANAGING DIRECTOR AND CEO
For
per
sona
l use
onl
y

Stockland Financial Report 2015 — 5
Directors’ Report Year ended 30 June 2015
The Directors of Stockland Corporation Limited (ACN 000 181 733) and the Directors of Stockland Trust Management Limited (ACN 001 900 741, AFSL 241190), the Responsible Entity of Stockland Trust (ARSN 092 897 348), present their report together with the Financial Report of Stockland and the Financial Report of Stockland Trust Group for the year ended 30 June 2015 and the Independent Auditor’s Report thereon. The Financial Report of Stockland comprises the consolidated Financial Report of Stockland Corporation Limited (‘the Company’) and its controlled entities, including Stockland Trust (‘the Trust’) and its controlled entities, (‘Stockland’). The Financial Report of Stockland Trust Group comprises the consolidated Financial Report of the Trust and its controlled entities (‘Stockland Trust Group’).
Operating and Financial Review1
About Stockland
Stockland is one of the largest diversified property groups in Australia with more than $14.8 billion of real estate assets. Stockland owns, manages and develops shopping centres, logistics centres and business parks, office assets, residential communities, and retirement living villages.
The company was founded in 1952 with a vision to “not merely achieve growth and profits but to make a worthwhile contribution to the development of our cities and great country”. Today Stockland leverages its diversified model, to help create thriving communities where people live, shop and work.
This is an approach that is underpinned by the Group’s purpose “we believe there is a better way to live”. This is brought to life by our employees who are guided by Stockland’s values of community, accountability, respect, and excellence (CARE).
Stockland’s primary objective is to deliver earnings per security growth and total risk-adjusted securityholder returns above the Australian Real Estate Investment Trust index average, by creating quality property assets and delivering value for its customers.
To provide the greatest value to securityholders Stockland is structured as a stapled security; a combination of a unit in a trust and a share in a company that are traded together on the Australian Securities Exchange. This allows the Group to undertake both property investment (via Stockland Trust) and property management and development (via Stockland Corporation).
Stockland strategy
1 All measures of revenue and profit throughout this section are calculated based on underlying profit unless otherwise stated
For
per
sona
l use
onl
y
Directors’ Report Year ended 30 June 2015
Stockland Financial Report 2015 — 6
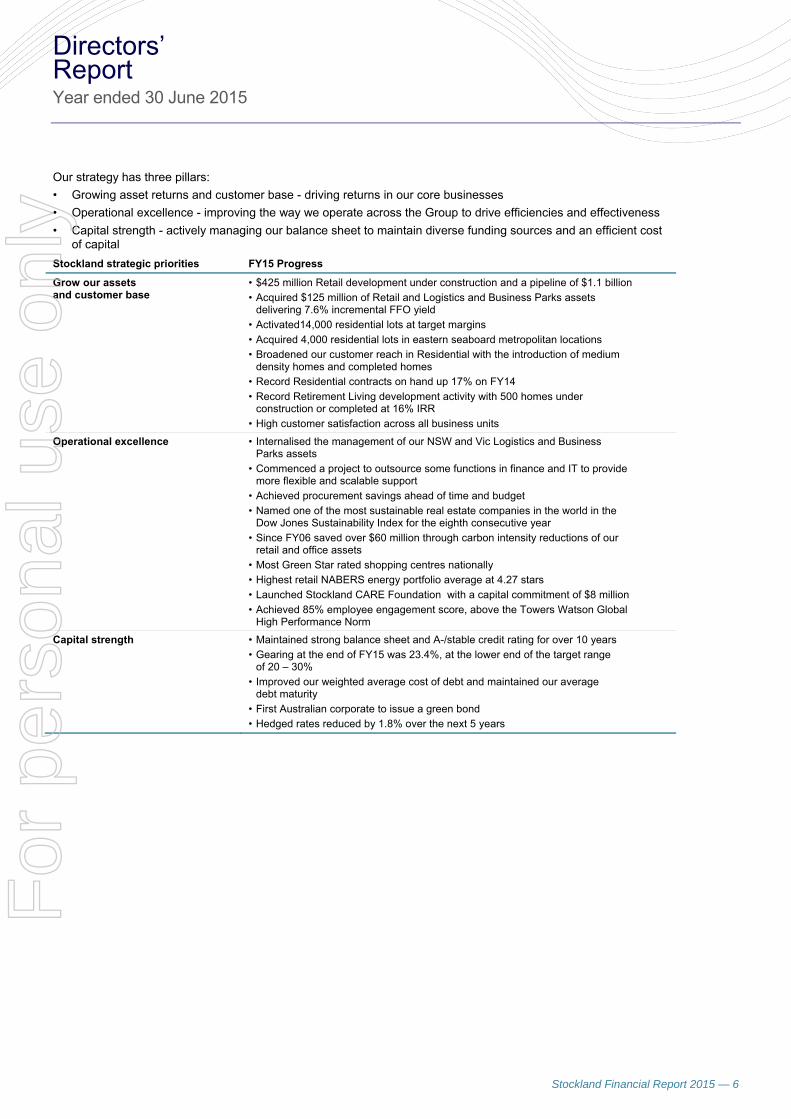
Our strategy has three pillars:
• Growing asset returns and customer base - driving returns in our core businesses
• Operational excellence - improving the way we operate across the Group to drive efficiencies and effectiveness
• Capital strength - actively managing our balance sheet to maintain diverse funding sources and an efficient cost of capital
Stockland strategic priorities FY15 Progress
Grow our assets and customer base
• $425 million Retail development under construction and a pipeline of $1.1 billion
• Acquired $125 million of Retail and Logistics and Business Parks assets delivering 7.6% incremental FFO yield
• Activated14,000 residential lots at target margins
• Acquired 4,000 residential lots in eastern seaboard metropolitan locations
• Broadened our customer reach in Residential with the introduction of medium density homes and completed homes
• Record Residential contracts on hand up 17% on FY14
• Record Retirement Living development activity with 500 homes under construction or completed at 16% IRR
• High customer satisfaction across all business units
Operational excellence
• Internalised the management of our NSW and Vic Logistics and Business Parks assets
• Commenced a project to outsource some functions in finance and IT to provide more flexible and scalable support
• Achieved procurement savings ahead of time and budget
• Named one of the most sustainable real estate companies in the world in the Dow Jones Sustainability Index for the eighth consecutive year
• Since FY06 saved over $60 million through carbon intensity reductions of our retail and office assets
• Most Green Star rated shopping centres nationally
• Highest retail NABERS energy portfolio average at 4.27 stars
• Launched Stockland CARE Foundation with a capital commitment of $8 million
• Achieved 85% employee engagement score, above the Towers Watson Global High Performance Norm
Capital strength
• Maintained strong balance sheet and A-/stable credit rating for over 10 years
• Gearing at the end of FY15 was 23.4%, at the lower end of the target range of 20 – 30%
• Improved our weighted average cost of debt and maintained our average debt maturity
• First Australian corporate to issue a green bond
• Hedged rates reduced by 1.8% over the next 5 years
For
per
sona
l use
onl
y
Directors’ Report Year ended 30 June 2015
Stockland Financial Report 2015 — 7
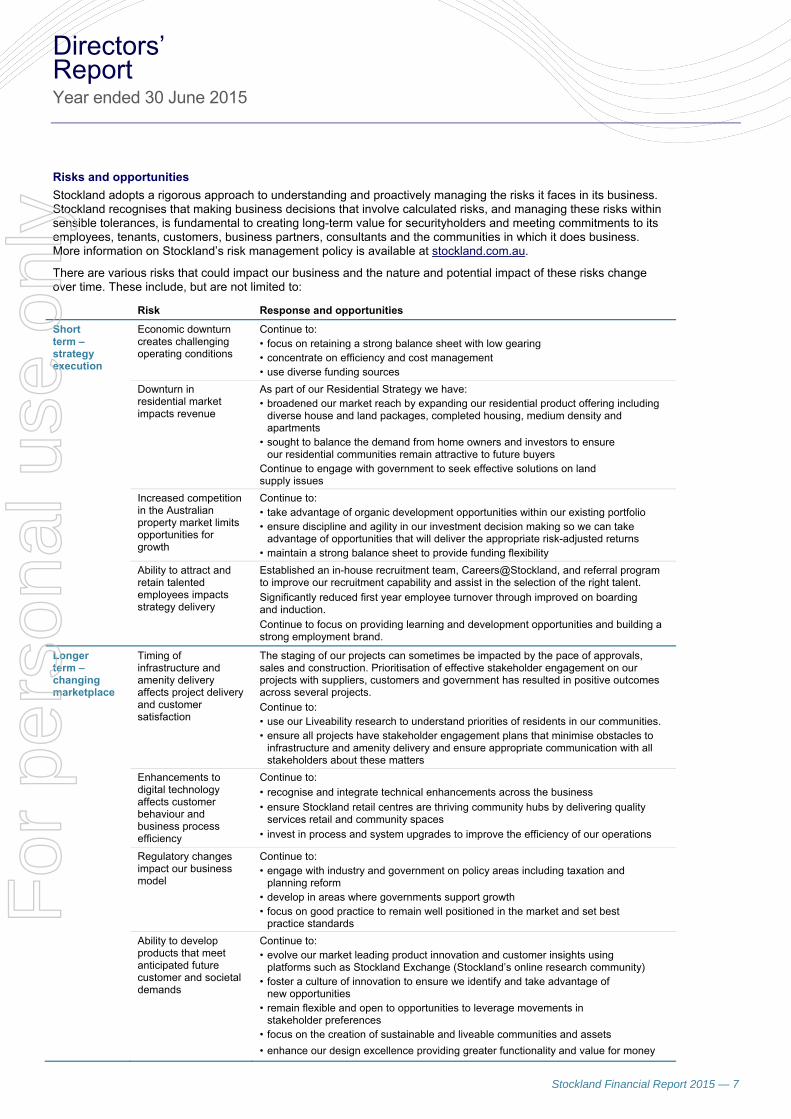
Risks and opportunities
Stockland adopts a rigorous approach to understanding and proactively managing the risks it faces in its business. Stockland recognises that making business decisions that involve calculated risks, and managing these risks within sensible tolerances, is fundamental to creating long-term value for securityholders and meeting commitments to its employees, tenants, customers, business partners, consultants and the communities in which it does business. More information on Stockland’s risk management policy is available at stockland.com.au.
There are various risks that could impact our business and the nature and potential impact of these risks change over time. These include, but are not limited to:
Risk Response and opportunities
Short term –strategy execution
Economic downturn creates challenging operating conditions
Continue to: • focus on retaining a strong balance sheet with low gearing • concentrate on efficiency and cost management • use diverse funding sources
Downturn in residential market impacts revenue
As part of our Residential Strategy we have: • broadened our market reach by expanding our residential product offering including
diverse house and land packages, completed housing, medium density and apartments
• sought to balance the demand from home owners and investors to ensure our residential communities remain attractive to future buyers
Continue to engage with government to seek effective solutions on land supply issues
Increased competition in the Australian property market limits opportunities for growth
Continue to: • take advantage of organic development opportunities within our existing portfolio • ensure discipline and agility in our investment decision making so we can take
advantage of opportunities that will deliver the appropriate risk-adjusted returns • maintain a strong balance sheet to provide funding flexibility
Ability to attract and retain talented employees impacts strategy delivery
Established an in-house recruitment team, Careers@Stockland, and referral program to improve our recruitment capability and assist in the selection of the right talent.
Significantly reduced first year employee turnover through improved on boarding and induction.
Continue to focus on providing learning and development opportunities and building a strong employment brand.
Longer term – changing marketplace
Timing of infrastructure and amenity delivery affects project delivery and customer satisfaction
The staging of our projects can sometimes be impacted by the pace of approvals, sales and construction. Prioritisation of effective stakeholder engagement on our projects with suppliers, customers and government has resulted in positive outcomes across several projects.
Continue to: • use our Liveability research to understand priorities of residents in our communities. • ensure all projects have stakeholder engagement plans that minimise obstacles to
infrastructure and amenity delivery and ensure appropriate communication with all stakeholders about these matters
Enhancements to digital technology affects customer behaviour and business process efficiency
Continue to:
• recognise and integrate technical enhancements across the business
• ensure Stockland retail centres are thriving community hubs by delivering quality services retail and community spaces
• invest in process and system upgrades to improve the efficiency of our operations
Regulatory changes impact our business model
Continue to: • engage with industry and government on policy areas including taxation and
planning reform • develop in areas where governments support growth • focus on good practice to remain well positioned in the market and set best
practice standards
Ability to develop products that meet anticipated future customer and societal demands
Continue to: • evolve our market leading product innovation and customer insights using
platforms such as Stockland Exchange (Stockland’s online research community) • foster a culture of innovation to ensure we identify and take advantage of
new opportunities • remain flexible and open to opportunities to leverage movements in
stakeholder preferences • focus on the creation of sustainable and liveable communities and assets
• enhance our design excellence providing greater functionality and value for money
For
per
sona
l use
onl
y

Directors’ Report Year ended 30 June 2015
Stockland Financial Report 2015 — 8
Stockland results and outlook
Key metrics: • Full year distribution was 24.0 cents per security, representing a payout ratio of 93% of underlying profit • Statutory profit was $903 million, up significantly on FY14 • Statutory earnings per security (EPS) was 38.5 cents, up 71.4% on FY14 • Underlying profit was $608 million, up 9.4% on FY14 • Underlying earnings per security was 25.9 cents, up 7.8% on FY14 • Funds from operations was $657 million, up 14.7% on FY14 • Funds from operations per security was 28.0 cents, up 13.0% on FY14
Stockland has lifted underlying profit 9.4% to deliver $608 million for the full year ended 30 June 2015, reflecting the disciplined implementation of our group strategy and supportive market conditions. Funds from operations (‘FFO’), which is a consistent measure of underlying and recurring earnings defined by the PCA, was up 14.7%.
This result demonstrates our significant success implementing our strategy to deliver sustainable growth, now and through the cycle. All core business areas contributed with Residential, Retirement Living and Logistics and Business Parks each up more than 15%. Retail, which reliably provides around 60% of our group’s earnings, was up 4.2% on a comparable basis.
Statutory profit for the year grew significantly to $903 million and statutory EPS was 38.5 cents. This included $297 million in revaluation uplift on Commercial Property assets and $80 million gross profit from the sale of our securityholding in Australand. Return on equity increased 110 basis points to 9.9%, excluding workout assets.
We are pleased to report that all business units delivered solid growth in earnings and are well placed to achieve continued growth. We have been disciplined in implementing our strategy to deliver strong returns in FY15 while setting up our business for future success. We have capitalised on supportive market conditions through the year, while ensuring the decisions we make now will serve our business well through the cycle.
We have three clear strategic priorities: growing asset returns and customer base; capital strength; and operational excellence. We made good progress in each of these areas in FY15 with key examples including $591 million in strategic acquisitions across Retail, Logistics and Business Parks, Residential and Retirement Living; broadening our customer reach with medium density residential products; maintaining a strong balance sheet; high customer satisfaction across all areas of our business; and significant cost savings through ongoing procurement improvements.
Our Residential business achieved a substantial 73.5% uplift in profit and ended the year with a record 3,742 contracts on hand. This result reflected generally positive market conditions in the corridors where we operate, and the progress we’ve made launching six key projects in two years and broadening our customer reach with diverse and targeted product offerings.
Commercial Property remains a key driver of our success. On a comparable basis we achieved operating profit2 growth of 4.3% across the portfolio, with 4.2% in Retail, 3.1% in Logistics and Business Parks and 6.4% in Office, reflecting our strong focus on property fundamentals.
Our Retirement Living business continues its steady growth recording record profit and improved ROA3. We are confident we will continue this trend with our active portfolio management approach and focus on development.
Stockland has maintained a strong balance sheet and A-/stable credit rating, supporting investment in the future growth of the business. Gearing at the end of FY15 was 23.4%, at the lower end of the target range of 20 – 30%, due to disciplined capital management, but is expected to increase within the range over the FY16 year.
Our active debt management program has seen us improve our weighted average cost of debt and maintain our average debt maturity. Debt maturity on a pro forma basis at 30 June 2015 was 5.3 years following the settlement of our new US private placement debt and repayment of our Yen bond in August.
We maintain a proactive focus on operating efficiency. In FY15, we commenced a project to outsource some activities in finance and IT to provide more flexible and scalable functional support. This will build on the significant reduction in overheads we achieved in FY14. Our FY15 underlying profit was $4.2 million (net of tax) lower due to a provision taken to facilitate this project.
Sustainability remains a key focus for Stockland and we are proud to have been named one of the most sustainable real estate companies in the world in the Dow Jones Sustainability Index for the eighth consecutive year. Since FY06 we’ve saved over $60 million through carbon intensity reductions. This year we were the first Australian corporate to issue a green bond which, among other things, has been used to fund the largest single rooftop solar system in the country at our Shellharbour shopping centre.
2 Refer to Note (B2) for reconciliation of segment earnings before Interest and tax (‘EBIT’) and operating profit. 3 ROA (Return on Assets) is calculated as the earnings before interest and tax, impairments and other non-cash items divided by the average cash invested.
For
per
sona
l use
onl
y

Directors’ Report Year ended 30 June 2015
Stockland Financial Report 2015 — 9
Outlook
Stockland is well placed to continue to deliver profitable growth from its core businesses in FY16 and beyond.
While the outlook for specific markets remains uneven, with some caution among businesses and consumers, we expect conditions to remain reasonably supportive. We have commenced the new year with a high level of residential contracts in hand and retirement living net reservations, and with good momentum in retail sales. Interest rates are anticipated to be stable and we expect the economy to continue to grow, albeit at below trend levels.
We are targeting growth in earnings per security in FY16 by 6–7.5% and FFO per security by 8.5–10%, assuming there is no material change in market conditions. Commercial Property is expected to maintain moderate growth in returns with comparable NOI growth of 2–3% and comparable FFO growth of 3–4%. We expect to achieve around 6,000 residential lot settlements, allowing for some production constraints in Victoria and NSW and continued slowing in the WA market.
We have updated our distribution policy to pay the higher of 100% of Trust taxable income or 80–90% of underlying profit. In line with this, FY16 distribution is targeted at 24.5 cents per security, assuming no material change in market conditions.
Group results summary
Underlying profit is determined following the principles of AICD/Finsia for reporting underlying profit, having regard to the guidance from ASIC’s RG 230 “Disclosing non-IFRS information” (“RG 230”). The reconciliation between underlying profit and statutory profit is provided below for Stockland. The group has reported consistently on this basis for more than seven years to help investors understand the performance of its business.
Stockland underlying profit and statutory profit reconciliation
2015 2014
Year ended 30 June Underlying profit
$M
Statutory adjustments
$M
Statutory profit
$M
Underlying profit
$M
Statutory adjustments
$M
Statutory profit
$M
Revenue 2,087 27 2,114 1,924 11 1,935
Cost of property developments sold:
• Land and development (983) – (983) (926) – (926)
• Capitalised interest (126) – (126) (156) – (156)
• Utilisation of provision for write-down of inventories
113 – 113 180 – 180
Investment property expenses (226) (226) (224) – (224)
Share of profits of equity-accounted investments
44 44 88 36 26 62
Management, administration, marketing and selling expenses
(258) – (258) (248) – (248)
Net change in fair value of investment properties:
• Commercial Property – 253 253 – 93 93
• Retirement Living 18 50 68 16 (94) (78)
Net change in fair value of Retirement Living resident obligations
– (70) (70) – 33 33
Impairment of intangibles – (43) (43) – (23) (23)
Net gain on sale of other financial assets
– 73 73 – 35 35
Net loss on sale of other non-current assets
– (2) (2) – (6) (6)
Finance income 8 1 9 5 – 5
Finance expense (73) (40) (113) (79) (69) (148)
Profit before income tax benefit 604 293 897 528 6 534
Income tax benefit/(expense) 4 2 6 27 (34) (7)
Profit for the year attributable to securityholders
608 295 903 555 (28) 527
Earnings per share (cents) 25.9 – 38.5 24.0 – 22.8
For
per
sona
l use
onl
y

Directors’ Report Year ended 30 June 2015
Stockland Financial Report 2015 — 10
Underlying profit is a non-IFRS measure that is designed to present, in the opinion of the Directors, the results from ongoing operating activities of Stockland in a way that appropriately reflects the group’s underlying performance. Underlying profit excludes items such as unrealised fair value gains/(losses), unrealised provision gains/(losses) and adjustments arising from the effect of revaluing assets/liabilities (such as derivatives, financial instruments and investment properties). These items are required to be included in the statutory profit in accordance with Australian Accounting Standards.
Other statutory profit adjustments are made for realised transactions occurring infrequently and those that are outside the course of Stockland’s core ongoing business activities. Underlying profit is the basis on which distributions are determined.
The increase in our statutory profit in FY15 was primarily driven by strong growth in underlying profit, together with favourable increases in the fair values of the Commercial Property investment properties. Valuation movements in Commercial Property, including equity-accounted investments, contributed $297 million (FY14: $119 million) to statutory profit, primarily due to valuation uplift recognised at Rockhampton, Baulkham Hills, Nowra and Forster retail sites. All of these assets delivered income growth and benefited from capitalisation rate compression. Our Office and Logistics and Business Park assets delivered revaluation gains of $47 million and $25 million respectively.
A core system project review is underway aiming to simplify the business, reduce costs and take advantage of rapid developments in technology to improve customer outcomes. As a result of this technology focus we have impaired the value of our software assets by $25 million (FY14: nil) which were assessed to have no future economic benefit.
In addition, a goodwill impairment of $18 million (FY14: $23 million) arose from adopting more conservative assumptions associated with the development pipeline.
The net profit on sale of other financial assets reflects the $73 million pre-tax profit on sale of Australand shares following the sale of our interest to Frasers Centrepoint in August 2014.
Other movements which affected the statutory profit included a $40 million loss from changes in the market value of the group’s financial instruments.
We also recognised an income tax benefit of $6 million.
Funds from operations reconciliation
$ million FY15 FY14 Change
Group funds from operations (‘FFO’) 657 573 ↑14.7%
Adjust for:
Amortisation of fit out incentives (45) (37)
Amortisation of rent-free incentives (16) (15)
Straight-line rent 8 7
Tax benefit on underlying profit 4 27
Underlying profit 608 555 ↑9.4%
Commercial Property revaluations (including equity investments) 297 119
Change in fair value of Retirement Living investment properties 7 (50)
Impairment of intangibles (43) (23)
Mark to market loss on financial instruments (39) (69)
Net gain on sale of other financial assets 73 35
Net loss on sale of other non-current assets (2) (6)
Tax benefit/(expense) on statutory profit adjustments 2 (34)
Statutory profit 903 527 ↑71.4%
FFO has been determined with reference to the Property Council of Australia’s voluntary disclosure guidelines to help investors and analysts compare Australian real estate organisations. Underlying profit has been adjusted for: amortisation of fitout incentives, amortisation of rent-free incentives, straight-line rent and non-cash income tax expense/benefit included in underlying profit. Apart from Stockland’s Commercial Property business, underlying profit and FFO reported for the other business units remain the same.
For
per
sona
l use
onl
y

Directors’ Report Year ended 30 June 2015
Stockland Financial Report 2015 — 11
Business unit performance and priorities
Commercial Property
Our Commercial Property business comprises retail centres, logistics and business parks, and office assets. We are one of the largest retail property owners, developers and managers in Australia. Our 42 retail centres accommodate more than 3,200 tenants, realising over $6 billion of retail sales per annum. The logistics and business parks portfolio comprises 24 properties with over 1.2 million square metres of building area. These properties are strategically positioned in key locations for logistics, infrastructure and employment. The office portfolio comprises 10 assets in key locations.
Portfolio at 30 June 2015 Approximate value*
42 retail centres $6.1 billion
24 logistics and business parks $1.7 billion
10 office buildings $1.0 billion
76 Commercial Property assets $8.8 billion
*Stockland’s ownership interest
Performance
Funds from operations Underlying profit
Commercial Property ($m, unless otherwise stated)
FY15 FY14 Change Comparablegrowth
FY15 FY14 Change Comparablegrowth
Net operating income:
• Retails 379 369 ↑2.6% ↑4.8% 351 347 ↑1.3% ↑4.2%
• Logistics and Business Parks 131 108 ↑21.0% ↑5.1% 120 100 ↑20.1% ↑3.1%
• Office 78 85 ↓8.9% ↑4.2% 64 70 ↓8.8% ↑6.4%
Total net operating income (NOI) 588 562 ↑4.6% ↑4.8% 535 517 ↑ 4.5% ↑4.3%
Net operating costs (18) (20) ↓13.2% (18) (20) ↓13.2%
Total Commercial Property 570 542 ↑5.1% 517 497 ↑4.0%
ROA 8.4% 8.4%
Commercial Property remains a key driver of our success. On a comparable basis we achieved NOI growth of 4.3% across the portfolio, with 4.2% in Retail, 3.1% in Logistics and Business Parks and 6.4% in Office, reflecting our strong focus on property fundamentals.
Retail
Stockland’s retail portfolio performed strongly in FY15 with NOI up 1.3% to $351 million and FFO up 2.6% to $379 million. These results reflect the portfolio’s high occupancy, positive leasing spreads on new leases and renewals and lower incentives (which are only paid on new leases).
The portfolio recorded the strongest specialty sales growth in four years of 7% with 4.5% Total Moving Annual Turnover. The best performing categories were food catering and fast casual dining, communication technology, services, homewares and apparel.
In FY15 we achieved comparable specialty sales per square metre 12.6% above the Urbis average. This reflects the success of our active management approach which has seen us undertake small projects and remixing in a number of centres to meet the specific needs of their customer base.
We are also starting to see the benefit of the major redevelopments we have undertaken over recent years as these assets progressively stabilise. In FY15 we opened major redevelopments at Hervey Bay in Queensland, Baldivis in Perth and the first stage of Wetherill Park in Sydney. The final stages at Wetherill Park, Point Cook in Melbourne, Glasshouse in the Sydney CBD and Harrisdale stage one in Perth are all underway and will complete in FY16. These developments represent a combined investment of $550 million with an expected stabilised average yield of 7-8%.
For
per
sona
l use
onl
y

Directors’ Report Year ended 30 June 2015
Stockland Financial Report 2015 — 12
Retail strategic priorities
The Retail business maintains its focus on creating market leading or differentiated centres, redeveloping its most productive assets to create community and entertainment hubs and maximise trade area share. With $425 million of retail development under construction and a pipeline of $1.1 billion targeting incremental internal rates of return (IRR) of 11-14 per cent4.
Stockland’s retail mix, underpinned by supermarkets, mini majors, food catering and fast casual dining and speciality food and retail services, is proving to be resilient to online leakage. The business will continue to focus on tailoring its offering to the specific trade area, cultivating retailer relationships and long-term sustainable rent, and invest in industry research to adapt to an evolving retail landscape.
Logistics and Business Parks
Our Logistics and Business Parks portfolio delivered strong profit growth with comparable NOI up 3.1% and comparable FFO up 5.1%, reflecting positive leasing momentum.
We are steadily building up a strong portfolio of assets that delivers solid returns and presents opportunities for future growth. In FY15 we acquired three new sites in Sydney and Melbourne and made good progress repositioning our portfolio with asset improvements under way at a number of key sites.
In FY15 we also internalised management of all business parks and our industrial portfolios in Victoria and NSW and have identified a growing development. We are well positioned to continue to grow returns in this portfolio.
Logistics and Business Parks strategic priorities
Our focus is on growing a quality portfolio of logistics centres and business parks. We will leverage our existing assets and land, strong tenant relationship and asset management skills to become a scale player in this market.
Office
Comparable NOI and FFO improved 6.4% and 4.2%, respectively, following good leasing activity in all Sydney office markets.
Our exposure to the office sector remains tactical, reflecting our view on the state of the market. The majority of our portfolio is located in the improving Sydney market. Brisbane, Perth and ACT markets remain challenging and in late FY15 we entered into a conditional put and call option to sell our half share of Waterfront Place and Eagle Street Pier in Brisbane.
Office strategic priorities
We continue to focus on optimising returns from the portfolio while managing our exposure tactically. We will also consider joint-ventures (or part sales) as appropriate.
4 Unlevered 10 year IRR on incremental development from completion
For
per
sona
l use
onl
y

Directors’ Report Year ended 30 June 2015
Stockland Financial Report 2015 — 13
Residential
Stockland is the largest residential developer in Australia. The business has 63 communities across New South Wales, Queensland, Victoria and Western Australia. The business is focused on delivering a range of masterplanned communities and medium density housing in growth areas across the country with over 81,900 lots remaining in our portfolio, with a total end value of approximately $20.7 billion5.
Residential as at 30 June 2015
Approximate portfolio - active Approximate portfolio - inactive Approximate total end value
30,000 lots 48,500 lots $20.7 billion
Performance
Residential Communities ($m, unless otherwise stated) FY15 FY14 Change
Lots settled (no. of lots) 5,876 5,219 ↑12.6%
Revenue 1,245 1,042 ↑16.3%
EBIT (before interest in COGS) 290 244 ↑19.0%
EBIT margin 23.3% 23.4%
Operating profit 166 95 ↑73.5%
Operating profit margin 13.3% 9.1%
ROA – core projects only5 17.0% 12.2% ↑
ROA – total portfolio 12.7% 5.8% ↑
Our Residential business, which settled 5,876 lots during FY15, achieved significant profit growth and lifted ROA to 17% on the core portfolio. This reflected supportive market conditions, the positive impact of new projects, efficiency initiatives and our broader and more diverse product mix.
Over the last two years we have launched six new projects and these have contributed strongly to our result. We are on track to launch a further five new projects in FY16.
We’ve also broadened our market reach with the introduction of medium density homes and completed homes at a number of our projects. Providing our customers with these offerings is proving very successful and we are now ramping up production for FY16 at selected projects. We are set to start construction on more than 500 town homes this year, reflecting margins in line with our operating profit margins.
During FY15 we continued to replenish our pipeline with the acquisition of 4,000 lots. In line with our strategy these sites are in priority metropolitan growth corridors, close to transport and in many cases leverage our existing brand presence. We have also been quick to activate many of these with the majority of new projects on track to deliver profit within two years of acquisition. The Address in Melbourne already contributed sales in FY15 and construction is underway at Schofields in Sydney.
Residential strategic priorities
The Residential business is making good progress on its plans to make the portfolio more resilient and profitable in the future by continuing to focus on:
(1) Reshaping the portfolio - actively manage the portfolio to improve returns; achieve and maintain an optimal land bank; and preference to acquire land on capital efficient terms. We continue to make good progress working through low margin and impaired stock.
(2) Improving efficiency – continue to tightly manage costs. Project management has been embedded into the business driving cost savings.
(3) Delivering revenue growth – increase revenue by creating a better community value proposition that drives high customer referrals; and broaden market reach through a medium density/built form offering.
5 Excluding properties identified for disposal or workout
For
per
sona
l use
onl
y

Directors’ Report Year ended 30 June 2015
Stockland Financial Report 2015 — 14
Retirement Living
Stockland is a top three retirement living operator within Australia, with a deep development pipeline and over 9,300 established units in 69 villages across five states and the Australian Capital Territory.
Retirement Living as at 30 June 2015
Portfolio Short-medium term development pipeline
Estimated development pipeline end value
9,343 established units Approximately 3,400 units $2.1 billion
Performance
Retirement Living ($m, unless otherwise stated) FY15 FY14 Change
EBIT 54 45 ↑19.8%
Operating profit 48 40 ↑19.9%
Transaction value6 333 321 ↑3.7%
ROA 5.3% 4.5% ↑
Established
Established settlements 663 647 ↑2.5%
Average re-sale price $329k $314k ↑4.8%
Turnover cash per unit $84k $75k ↑11.1%
Turnover cash margin (shown in pre-overheads) 25.4% 24.0% ↑
Reservations on hand (no. of units) 132 115 ↑14.8%
Established occupancy 94.4% 94.9% ↓
Development
Development settlements 282 262 ↑7.6%
Average price $413k $389k ↑6.1%
Average margin6 15.9% 15.8% ↑0.1%
Reservations on hand (no. of units) 119 85 ↑40.0%
Operating profit in Retirement Living was up 19.9% on FY14 reflecting strong sales, active management and improved efficiency. ROA increased to 5.3%.
Our Retirement Living business continue to mature. We are now two years into our five year plan to achieve a 7% ROA, which is marked by taking a much more active approach to how we manage the portfolio. By optimising the use and mix of our assets, recycling capital, driving our development pipeline and maintaining disciplined operating practices, we continue to improve our returns and growth prospects.
During FY15 we made good progress reshaping our portfolio via capital recycling with the sale of two non-core villages and the acquisition of eight villages in South Australia, which is a particularly strong market for retirement living. This acquisition also provides development opportunities, further enhancing our development pipeline which is a key to growing returns.
Our flagship apartment development at Cardinal Freeman in Sydney’s inner west is progressing very well and contributes to the 500 homes we have under construction or available for sale around the country.
Retirement Living strategic priorities
The Retirement Living business remains focused on being a preferred operator and developer of Retirement Living villages. The business has a clear strategy to continue to improve returns on assets by more actively managing the portfolio, growing development volumes and differentiating the customer experience.
6 Includes established villages and new developments
For
per
sona
l use
onl
y
Directors’ Report Year ended 30 June 2015
Stockland Financial Report 2015 — 15
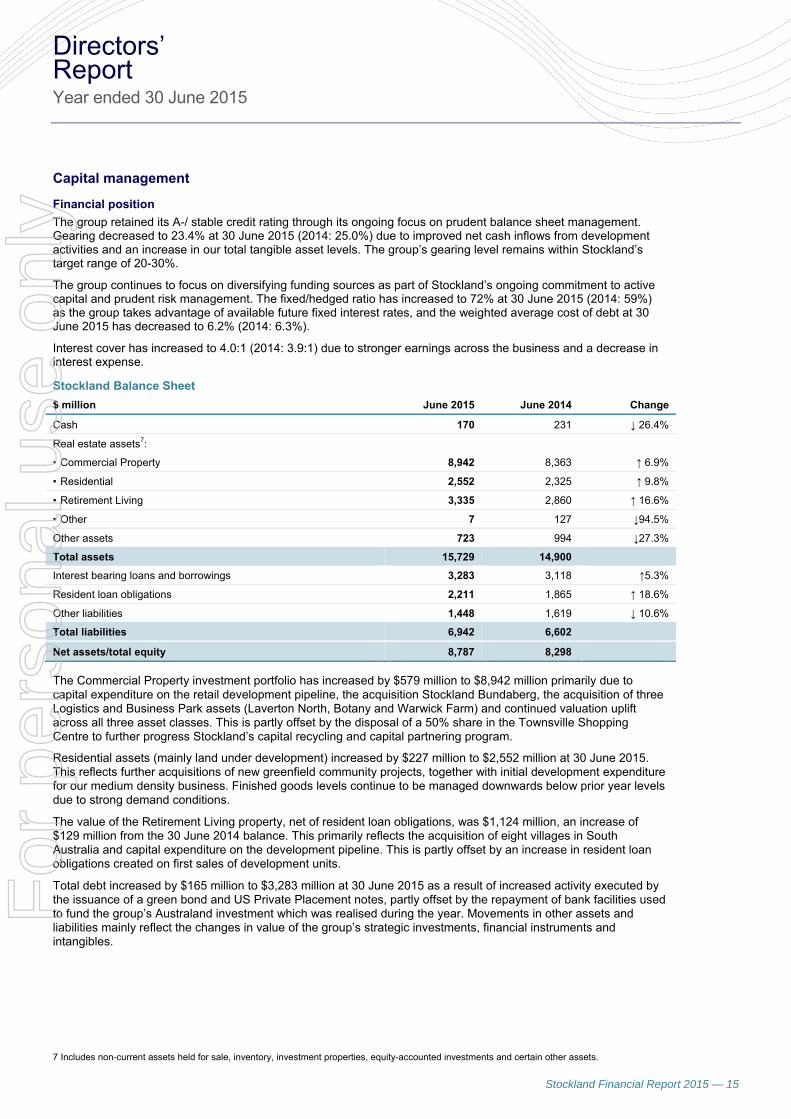
Capital management
Financial position
The group retained its A-/ stable credit rating through its ongoing focus on prudent balance sheet management. Gearing decreased to 23.4% at 30 June 2015 (2014: 25.0%) due to improved net cash inflows from development activities and an increase in our total tangible asset levels. The group’s gearing level remains within Stockland’s target range of 20-30%.
The group continues to focus on diversifying funding sources as part of Stockland’s ongoing commitment to active capital and prudent risk management. The fixed/hedged ratio has increased to 72% at 30 June 2015 (2014: 59%) as the group takes advantage of available future fixed interest rates, and the weighted average cost of debt at 30 June 2015 has decreased to 6.2% (2014: 6.3%).
Interest cover has increased to 4.0:1 (2014: 3.9:1) due to stronger earnings across the business and a decrease in interest expense.
Stockland Balance Sheet
$ million June 2015 June 2014 Change
Cash 170 231 ↓ 26.4%
Real estate assets7:
• Commercial Property 8,942 8,363 ↑ 6.9%
• Residential 2,552 2,325 ↑ 9.8%
• Retirement Living 3,335 2,860 ↑ 16.6%
• Other 7 127 ↓94.5%
Other assets 723 994 ↓27.3%
Total assets 15,729 14,900
Interest bearing loans and borrowings 3,283 3,118 ↑5.3%
Resident loan obligations 2,211 1,865 ↑ 18.6%
Other liabilities 1,448 1,619 ↓ 10.6%
Total liabilities 6,942 6,602
Net assets/total equity 8,787 8,298
The Commercial Property investment portfolio has increased by $579 million to $8,942 million primarily due to capital expenditure on the retail development pipeline, the acquisition Stockland Bundaberg, the acquisition of three Logistics and Business Park assets (Laverton North, Botany and Warwick Farm) and continued valuation uplift across all three asset classes. This is partly offset by the disposal of a 50% share in the Townsville Shopping Centre to further progress Stockland’s capital recycling and capital partnering program.
Residential assets (mainly land under development) increased by $227 million to $2,552 million at 30 June 2015. This reflects further acquisitions of new greenfield community projects, together with initial development expenditure for our medium density business. Finished goods levels continue to be managed downwards below prior year levels due to strong demand conditions.
The value of the Retirement Living property, net of resident loan obligations, was $1,124 million, an increase of $129 million from the 30 June 2014 balance. This primarily reflects the acquisition of eight villages in South Australia and capital expenditure on the development pipeline. This is partly offset by an increase in resident loan obligations created on first sales of development units.
Total debt increased by $165 million to $3,283 million at 30 June 2015 as a result of increased activity executed by the issuance of a green bond and US Private Placement notes, partly offset by the repayment of bank facilities used to fund the group’s Australand investment which was realised during the year. Movements in other assets and liabilities mainly reflect the changes in value of the group’s strategic investments, financial instruments and intangibles.
7 Includes non-current assets held for sale, inventory, investment properties, equity-accounted investments and certain other assets.
For
per
sona
l use
onl
y

Directors’ Report Year ended 30 June 2015
Stockland Financial Report 2015 — 16
Cash flows
Stockland Cash Flows
$ million FY15 FY14 Change %
Operating cash flows 401 752 ↓46.7%
Investing cash flows 184 (693) Nm
Financing cash flows, including FX on cash (646) (55) Nm
Net change in cash and cash equivalents (61) 4 Nm
Cash at the end of the period 170 231 ↓26.4%
Operating cash flows were down on the prior year, primarily as a result of further Residential acquisitions and increased development expenditure to support the growth in settlement volumes.
Net cash inflows from investing activities includes proceeds from the disposal of the group’s investment in Australand. Proceeds generated from the sale of Commercial Properties were broadly in line with the prior year, whilst spend on acquisitions reduced. Retirement Living cash flows reflect the acquisition of eight villages in South Australia together with increased spend on the development pipeline.
Net financing cash flows include proceeds from the issuance of the green bond and US Private Placement notes These proceeds were used to repay short term bank facilities, which had been used earlier to finance the strategic stake in Australand. Net financing cash flows also include payments on termination and maturity of derivatives together with distributions paid to securityholders during the period.
Equity
Dividend/Distribution Reinvestment Plan
Stockland’s Distribution Reinvestment Plan (‘DRP’) has been active since December 2013, enabling investors to reinvest distributions in the group’s securities. On 6 February 2015 the issue price was determined to be $4.33 for each stapled security and 12,971,118 securities were issued on 27 February 2015.
On 22 July 2015, Stockland announced that the DRP would operate for the second half year distribution to 30 June 2015 and that investors participating in the DRP will be entitled to receive a full distribution.
The DRP security price was determined to be $4.15 based on the volume weighted average price over the 15-day trading period from 1 July to 21 July 2015, inclusive, and applying a 1 per cent discount.
Distributions
The dividend and distribution payable for the year ended 30 June 2015 is 24.0 cents per stapled security, consistent with 24.0 cents paid for the year ended 30 June 2014. We have updated our distribution policy to pay the higher of 100% of Trust taxable income or 80-90% of underlying profit. We believe this is the appropriate level to provide growing returns for securityholders while allowing for investment in future growth.
In line with our new distribution policy, in FY16 we are targeting a distribution of 24.5 cents per security assuming no material change in market conditions.
The distribution comprises:
Stockland Consolidated Group FY15
Cents FY14
Cents
Trust distribution 24.0 24.0
Corporation dividend, fully franked – –
Total dividend and distribution 24.0 24.0
Registers closed at 5.00pm on 30 June 2015 to determine entitlement to the year-end dividend and distribution, which will be paid on 31 August 2015.
For
per
sona
l use
onl
y

Directors’ Report Year ended 30 June 2015
Stockland Financial Report 2015 — 17
Directors
The Directors of the Company and the Responsible Entity at any time during or since the end of the financial year (‘the Directors’) were:
Graham Bradley BA, LLB (Hons 1), LLM, FAICD Chairman (Non-Executive)
Mr Bradley was appointed to the Board on 9 February 2004 and was appointed Non-Executive Chairman on 25 October 2005. He is Non-Executive Chairman of HSBC Bank Australia Limited (appointed December 2004), Virgin Australia International Holdings Limited (appointed March 2012), Energy Australia Holdings Limited (appointed June 2012) and Po Valley Energy Limited (appointed September 2004). He is a Non-Executive Director of GI Dynamics Inc. (appointed June 2011) and The Hongkong and Shanghai Banking Corporation Limited (appointed November 2012) and is Chairman of Infrastructure NSW (appointed July 2013). He was formerly Chairman of the Film Finance Corporation of Australia Limited (January 2004-June 2008) and a Director of MBF Australia Limited (November 2003-November 2007), and Singapore Telecommunications Limited (May 2004-July 2011). Mr Bradley is the chair of the Sustainability Committee and a member of the Human Resources Committee.
Former Directorships of listed entities in last three years Mr Bradley was a Director of Singapore Telecommunications Limited from May 2004 to July 2011.
Duncan Boyle BA (Hons), FCII, FAICD (Non-Executive)
Mr Boyle was appointed to the Board on 7 August 2007. He has over forty years’ experience within the insurance industry in Australia, New Zealand, the United Kingdom and Europe. Mr Boyle is a Director of TAL Dai Ichi Life Australia Pty Ltd and TAL Life Limited (appointed May 2014) and formerly a Director of QBE Insurance Group Limited (September 2006-December 2014). He was a Director of O’Connell Street Associates Pty Limited (until 30 June 2013) and Clayton Utz (until June 2014). Mr Boyle is a member of the Human Resources and Sustainability Committees and was a member of the Stockland Audit Committee until 1 October 2014.
Former Directorships of listed entities in last three years Mr Boyle was a Director of QBE Insurance Group Limited from September 2006 to 31 December 2014.
Carolyn Hewson BEc (Hons), MA (Ec), FAICD (Non-Executive)
Ms Hewson was appointed to the Board on 1 March 2009. She has over thirty years’ experience in the financial sector, with extensive financial markets, risk management and investment management expertise. Ms Hewson is a Non-Executive Director of BHP Billiton (appointed March 2010), and previously served as a Director on the Boards of the Australian Gas Light Company, AGL Energy Limited, AMP, CSR Limited, BT Investment Management, South Australia Water, the Economic Development Board of South Australia and Westpac Banking Corporation. Ms Hewson is Chair of the Human Resources Committee and a member of the Sustainability Committee and was Chair of the Risk Committee until 1 October 2014.
Former Directorships of listed entities in last three years Ms Hewson was a Director of Westpac Banking Corporation from February 2003 to June 2012 and BT Investment Management Limited from December 2007 to December 2013.
Barry Neil BEng (Civil) (Non-Executive)
Mr Neil was appointed to the Board on 23 October 2007 and has over forty years’ experience in property, both in Australia and overseas. He is Chairman of Keneco Pty Limited and Bitumen Importers Australia Pty Limited, a Director of Terrace Tower Group Pty Ltd and was previously Director of Property for Woolworths Limited. He also served as Chief Executive Officer, Investment Division (1999 to 2004), and Executive Director (1987 to 2004) of Mirvac Limited. Mr Neil is Chair of Stockland Capital Partners Limited, the Responsible Entity for Stockland’s unlisted funds and a member of the Stockland Audit and Sustainability Committees.
Former Directorships of listed entities in last three years None.
For
per
sona
l use
onl
y
Directors’ Report Year ended 30 June 2015
Stockland Financial Report 2015 — 18
Tom Pockett
BComm, ACA (Non-Executive)
Mr Pockett was appointed to the Board on 1 September 2014. He is a Director of Insurance Australia Group Limited (Appointed 1 January 2015), O’Connell Street Associates Limited, ALH Group Pty Ltd, Hydrox Holdings Pty Ltd, The Quantium Group Holdings Pty Limited (Chairman) and Sunnyfield, a not for profit disability services provider in New South Wales. Mr Pockett was Chief Financial Officer of Woolworths Limited from August 2002 until February 2014. He was an Executive Director of Woolworths Limited from November 2006 to 1 July 2014. He previously held the position of Deputy Chief Financial Officer at the Commonwealth Bank of Australia (CBA) and prior to that held several senior finance roles within the Lend Lease Group following a successful career with Deloitte. Mr Pockett was a member of the Financial Reporting Council from March 2003 to March 2006, National President of G100 from August 2000 to January 2003. He is a member of the Stockland Audit, Risk and Sustainability Committees. Mr Pockett is a Chartered Accountant.
Former Directorships of listed entities in last three years Mr Pockett was a Director of Woolworths Limited November 2006 to 1 July 2014.
Carol Schwartz BA, LLB, MBA, FAICD (Non-Executive)
Ms Schwartz was appointed to the Board on 1 July 2010. She has extensive experience in business, property and community organisations. Ms Schwartz is on the Board of a number of organisations including the Sydney Institute, Bank of Melbourne and Qualitas Property Partners. Her other appointments include Chair of Our Community and Creative Partnerships, Australia. Ms Schwartz serves on the Risk and Sustainability Committees and served on the Stockland Audit Committee until June 2012.
Former Directorships of listed entities in last three years None.
Peter Scott BE (Hons), MEng Sc, FIE. Aust, CPEng, MICE (Non-Executive)
Mr Scott was appointed to the Board on 9 August 2005. He is Chairman of Perpetual Limited, where he was appointed a Director on 31 July 2005 and Perpetual Equity Investment Company Limited (appointed 18 December 2014). Mr Scott is a Director of Igniting Change, a not-for-profit making organisation and O’Connell Street Associates Pty Limited. He was Chairman of Sinclair Knight Mertz Holdings until December 2013, and a member of the Advisory Board of Laing O’Rourke Australia from August 2008 to August 2011. Mr Scott was the Chief Executive Officer of MLC and Executive General Manager, Wealth Management of National Australia Bank until January 2005. Prior to this, he held a number of senior positions with Lend Lease, following a successful career as a consulting engineer in Australia and overseas. Mr Scott is Chair of the Risk Committee and a member of the Sustainability Committee. He also served as Chair of the Human Resources Committee until October 2014.
Former Directorships of listed entities in last three years None.
Mark Steinert BAppSc, G Dip App Fin & Inv (Sec Inst), F Fin, AAPI Managing Director
Mr Steinert was appointed Managing Director & CEO of Stockland on 29 January 2013. He has twenty-six years of experience in property and financial services including eight years in direct property primarily with Jones Lang LaSalle and ten years in listed real estate with UBS. Mr Steinert was appointed as Head of Australasian Equities at UBS in 2004 and as Global Head of Research in New York in late 2005. In 2012 he was appointed as Global Head of Product Development and Management for Global Asset Management at UBS, a $559 billion Global Fund Manager. Mr Steinert is President of the Property Council of Australia, a Director of The Green Building Council of Australia, the Shopping Centre Council of Australia and Stockland Capital Partners Limited, the Responsible Entity for Stockland’s unlisted property funds. He is a member of the Sustainability Committee.
Former Directorships of listed entities in last three years None. F
or p
erso
nal u
se o
nly

Directors’ Report Year ended 30 June 2015
Stockland Financial Report 2015 — 19
Terry Williamson BEc, MBA, FCA, FCIS, MACS (Non-Executive)
Mr Williamson was appointed to the Board in April 2003. He is a Director of Avant Insurance Limited, The Doctors Health Fund, Chairman of OnePath Life Limited, Chairman of OnePath General Insurance Pty Limited, Chairman of ANZ Lenders Mortgage Insurance Limited, a member of the Audit Committee of the Reserve Bank of Australia and member of the University of Sydney School of Business Advisory Board. Mr Williamson was previously the Chief Financial Officer of Bankers Trust Australia Limited/BT Financial Group Pty Limited from 1997 to 2002 and prior to that was a partner of Pricewaterhouse for seventeen years. Mr Williamson is Chair of the Stockland Audit Committee, the Stockland Capital Partners Audit Committee, the Stockland Financial Services Compliance Committee, the Stockland Capital Partners Financial Services Compliance Committee and a member of the Sustainability Committee.
Former Directorships of listed entities in last three years None.
External Independent Committee Members and Independent Directors of Stockland
Anthony Sherlock BEc, FCA, MAICD
Mr Sherlock was appointed as a Director of Stockland Capital Partners Limited, the Responsible Entity for Stockland’s unlisted funds, in August 2004. He is a former Senior Partner of Coopers & Lybrand having national responsibility for credit risk management. In that capacity, he obtained experience in the banking and finance, mining, agriculture, building, construction and development sectors. Mr Sherlock is a non-executive Director of Equatorial Mining Limited and Kerrygold Limited. He is the former Chairman of Australian Wool Corporation Limited and The Woolmark Company Pty Ltd, a former Non-Executive Director of Austral Coal Limited, Sydney Attractions Group Limited, IBA Health Limited and Export Finance Insurance Corporation Limited and has acted on a number of committees for both Federal and State Governments. He is a member of the Stockland Capital Partners Audit Committee, the Stockland and the Stockland Capital Partners Financial Services Compliance Committees and the Stockland Residential Estates Equity Fund No. 1 Investment Committee.
Company Secretaries
Katherine Grace BA (Hons), LLB (Hons 1st Class), MPP, MAICD Company Secretary
Ms Grace was appointed as General Counsel and Company Secretary in August 2014. Ms Grace has over 15 years experience specialising in the property sector. Most recently Ms Grace was General Counsel and Company Secretary for Westfield Retail Trust. She has extensive experience in corporate, property, debt and capital market transactions. Prior to Westfield Retail Trust, Ms Grace was General Counsel at Valad Property Group. She has previously held positions in legal private practice (where she acted for a variety of corporations and financial institutions in relation to landmark developments across Australia and overseas) and at Multiplex Limited and Pacific Capital Partners.
Ms Grace reports directly to the Managing Director and also has accountability directly to the Board of Directors, through the Chairman, on all matters regarding the proper functioning of the Board.
Phillip Hepburn BEc, LLM, Grad Dip CSP, FCIS, FCSA, MAICD Company Secretary (resigned 16 September 2014)
Mr Hepburn joined Stockland as General Counsel and Group Secretary in 2001 and held this position until September 2014. He has over eighteen years’ experience as a Company Secretary and General Counsel. Prior to joining Stockland, he was General Counsel and Company Secretary of IAMA Limited, an Australian Securities Exchange (‘ASX’) listed company. He has also held a number of senior management and legal positions in the finance sector. Mr Hepburn was an Executive Member of the Stockland and the Stockland Capital Partners Financial Services Compliance Committees.
For
per
sona
l use
onl
y

Directors’ Report Year ended 30 June 2015
Stockland Financial Report 2015 — 20
Derwyn Williams BComm, CPA, FCIS, FCSA, MAICD Company Secretary
Mr Williams has over twenty years experience as a Company Secretary, joining Stockland in December 2004 and appointed as Deputy Group Secretary in May 2005. Prior to joining Stockland he was General Manager of Corporate Governance & Group Secretary at Credit Union Services Corporation (Australia) Limited and Deputy Group Secretary at St. George Bank Limited. He has held a number of senior management, accountancy, risk management and internal audit positions across the property, finance, heavy industry and public sectors.
Directors’ meetings
The number of meetings of the Board of Directors (‘the Board’) and of the Board Committees and the number of meetings attended by each of the Directors during the financial year were:
Stockland (Stockland Corporation Limited and Stockland Trust Management Limited)
Scheduled
Board Audit
Committee
Financial Services
Compliance Committee
Human Resources Committee
Sustainability Committee
Risk Committee
A B A B A B A B A B A B
Director
Mr G Bradley 15 15 – – – – 4 4 3 3 – –
Mr D Boyle 14 15 2 2 – – 2 2 3 3 – –
Ms C Hewson 13 15 – – – – 4 4 3 3 1 1
Mr B Neil 15 15 5 6 – – – – 2 3 – –
Mr T Pockett 12 12 4 4 – – – – 3 3 3 3
Ms C Schwartz 12 15 – – – – – – 3 3 4 4
Mr P Scott 15 15 – – – – 2 2 3 3 4 4
Mr M Steinert 15 15 – – – – – – 3 3 – –
Mr T Williamson 15 15 6 6 4 4 – – 3 3 – –
Other members
Ms K Grace – – – – 3 3 – – – – – –
Mr P Hepburn – – – – 1 1 – – – – – –
Mr A Sherlock – – – – 4 4 – – – – – –
Stockland Capital Partners
Scheduled
Board Audit
Committee
Financial Services
Compliance Committee
A B A B A B
Director
Mr B Neil 6 6 – – – –
Mr A Sherlock 6 6 3 3 4 4
Mr M Steinert 5 6 – – – –
Other members
Ms K Grace – – – – 3 3
Mr P Hepburn – – – – 1 1
Mr T Williamson – – 3 3 4 4
A - Meetings attended / B – Meetings eligible to attend
For
per
sona
l use
onl
y

Directors’ Report Year ended 30 June 2015
Stockland Financial Report 2015 — 21
Corporate Governance
The Board takes its governance responsibilities very seriously and believes it has the necessary mix of experience and skills to oversee the high standard of corporate governance, integrity and accountability required of a professional and ethical organisation. The Board believes that Stockland’s governance accords fully with the principles and recommendations of the ASX Corporate Governance Council as summarised in the table at the end of this corporate governance statement.
Role of the Board
The Board has overall responsibility for the good governance of Stockland. The Board:
• oversees the development and implementation of Stockland’s corporate strategy, operational performance objectives and management policies with a view to creating sustainable long-term value for security holders;
• establishes Stockland’s overall framework of governance, risk management, internal control and compliance which underpins the integrity of management information systems and fosters high ethical standards throughout the organisation;
• appoints the Managing Director, approves the appointment of the Company Secretaries and Senior Executives reporting to the Managing Director and determines the level of authority delegated to the Managing Director;
• sets Executive remuneration policy, monitors Senior Executive performance and approves the performance objectives and remuneration of the Managing Director and his direct reports;
• approves the annual budget and monitors financial and operating performance;
• reviews and approves financial and other reports to securityholders and approves dividends from Stockland Corporation and distributions from the Trust;
• approves major capital expenditure, acquisitions and divestitures;
• reviews Executive and Board succession planning and Board performance;
• monitors compliance with laws and regulations which apply to Stockland and its business; and
• appoints and monitors the independence of Stockland’s external auditors.
The Board has delegated responsibility to the Managing Director to manage Stockland’s business and to its various Board Committees to oversee specific areas of governance. Delegated responsibilities are regularly reviewed and the Managing Director regularly consults with the Board on Stockland’s performance. Matters which are not specifically delegated to the Managing Director require Board approval, including capital expenditure decisions above delegated levels, expenditure outside the ordinary course of business, major acquisitions and sales, changes to corporate strategy, the issue of equity or debt by Stockland and key risk management and accounting policies. The Company Secretary is directly accountable to the Board through the Chairman on all matters to do with the proper functioning of the Board.
The Board aims to ensure that its securityholders are kept well-informed of all major developments and business events that are likely to materially affect Stockland’s operations and financial standing and the market price of its securities. Further information in relation to communication with Stockland’s securityholders is located on the Stockland website at stockland.com.au/corporate-governance.
Stockland’s Directors, management and employees are required to maintain high ethical standards of conduct. Stockland’s Code of Conduct and Ethical Behaviour (the ‘Code’) is periodically reviewed and endorsed by the Board and covers dealings with both external parties and internal operations. Further information in relation to the Code is located on the Stockland website at stockland.com.au/corporate-governance.
Role of Stockland Trust Management Limited as Responsible Entity for Stockland Trust
Stockland Trust Management Limited, as Responsible Entity for Stockland Trust, is responsible for the operation of the Trust. The Responsible Entity must exercise its powers and perform its obligations under the Stockland Trust Constitution and the Corporations Act 2001 in the best interests of unitholders to ensure that the activities of the Trust are conducted in a proper and efficient manner. The major activities of the Responsible Entity include:
• ongoing selection and management of property investments;
• management of the Trust’s property portfolio;
• maintenance of the accounting and statutory records of the Trust;
• management of equity and debt raisings and making distributions to unitholders; and
• preparation of notices and reports issued to unitholders.
For
per
sona
l use
onl
y
Directors’ Report Year ended 30 June 2015
Stockland Financial Report 2015 — 22
Composition and diversity of the Board
Stockland is committed to having a Board whose members have the capacity to act independently of management, and have the collective skills and diversity of experience necessary to optimise the long-term financial performance of Stockland so as to sustain superior returns to securityholders.
At the date of this report, the Board comprised one Executive Director and eight Non-Executive Directors. The Boards of Stockland Corporation Limited and Stockland Trust Management Limited have the same Directors. Directors’ details are listed on pages 17 to 19, including details of their other listed and unlisted company Directorships and experience.
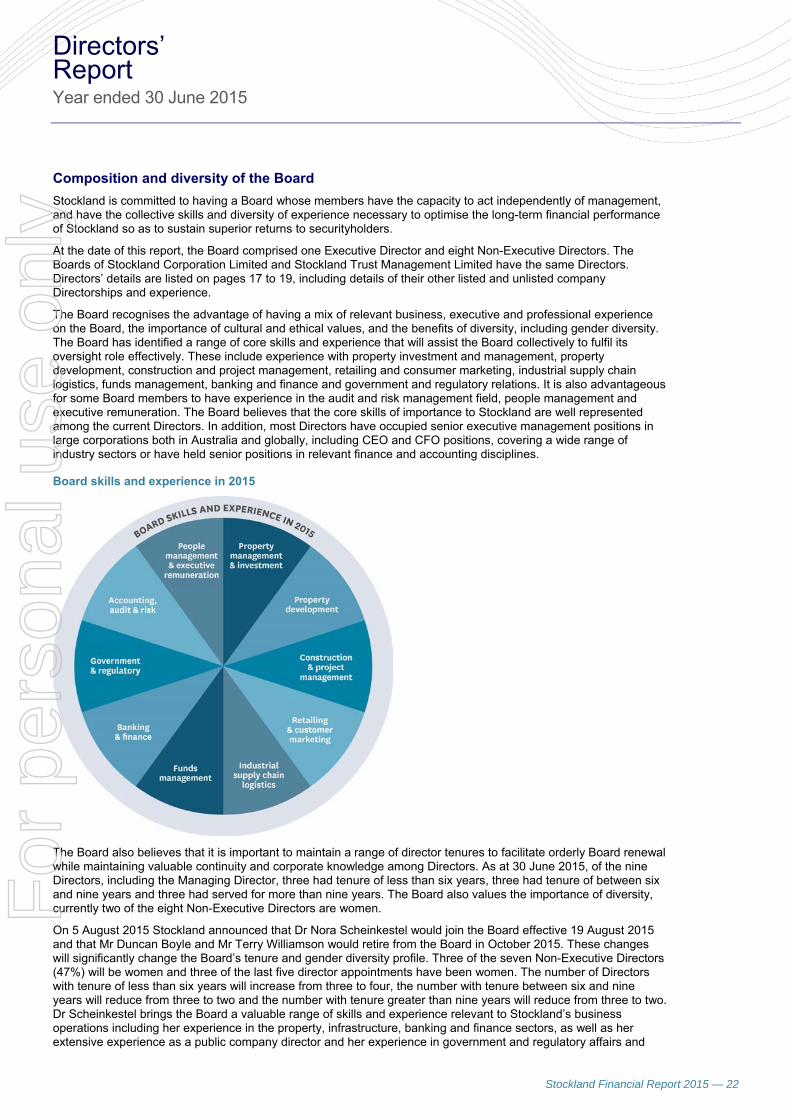
The Board recognises the advantage of having a mix of relevant business, executive and professional experience on the Board, the importance of cultural and ethical values, and the benefits of diversity, including gender diversity. The Board has identified a range of core skills and experience that will assist the Board collectively to fulfil its oversight role effectively. These include experience with property investment and management, property development, construction and project management, retailing and consumer marketing, industrial supply chain logistics, funds management, banking and finance and government and regulatory relations. It is also advantageous for some Board members to have experience in the audit and risk management field, people management and executive remuneration. The Board believes that the core skills of importance to Stockland are well represented among the current Directors. In addition, most Directors have occupied senior executive management positions in large corporations both in Australia and globally, including CEO and CFO positions, covering a wide range of industry sectors or have held senior positions in relevant finance and accounting disciplines.
Board skills and experience in 2015
The Board also believes that it is important to maintain a range of director tenures to facilitate orderly Board renewal while maintaining valuable continuity and corporate knowledge among Directors. As at 30 June 2015, of the nine Directors, including the Managing Director, three had tenure of less than six years, three had tenure of between six and nine years and three had served for more than nine years. The Board also values the importance of diversity, currently two of the eight Non-Executive Directors are women.
On 5 August 2015 Stockland announced that Dr Nora Scheinkestel would join the Board effective 19 August 2015 and that Mr Duncan Boyle and Mr Terry Williamson would retire from the Board in October 2015. These changes will significantly change the Board’s tenure and gender diversity profile. Three of the seven Non-Executive Directors (47%) will be women and three of the last five director appointments have been women. The number of Directors with tenure of less than six years will increase from three to four, the number with tenure between six and nine years will reduce from three to two and the number with tenure greater than nine years will reduce from three to two. Dr Scheinkestel brings the Board a valuable range of skills and experience relevant to Stockland’s business operations including her experience in the property, infrastructure, banking and finance sectors, as well as her extensive experience as a public company director and her experience in government and regulatory affairs and
For
per
sona
l use
onl
y

Directors’ Report Year ended 30 June 2015
Stockland Financial Report 2015 — 23
executive remuneration. The Board’s succession planning is in place for the impending retirement of two senior directors, with Mr Tom Pockett to succeed Mr Williamson as chair of the Audit Committee. Mr Pockett’s deep experience as a CFO and his professional qualifications ideally qualify him for this role
Where a Board vacancy occurs or whenever it is considered that the Board would benefit from the services of an additional director the Board identifies the skills and experience it seeks to complement the competencies of continuing Directors. In defining the Board’s requirements for a new director, consideration is given to the skills, professional experience and educational backgrounds of continuing members of the Board, including any identified skills gaps. Criteria used also include consideration of the value of gender diversity on the Board.
The Human Resources Committee oversees the Director nomination process, and will from time-to-time engage external search firms to ensure that a wide range of candidates are considered. Ultimately, the full Board determines who is invited to fill a casual vacancy after extensive one-on-one and collective interviews with candidates and thorough due diligence and reference checking. Directors coming up for re-election are also reviewed by the Human Resources Committee and, in their absence, the Board considers whether to support their re-election. It is the Board’s policy that Directors offer themselves for re-election only with the agreement of the Board and continue to serve only so long as they have the confidence of their fellow Board members.
Stockland has for many years had a focus on actively encouraging gender diversity at all levels within the organisation and a culture that supports workplace diversity and inclusion. As part of this focus, gender diversity targets are set by management and regularly reviewed and endorsed by the Human Resources Committee. In 2014, we reached our revised 2017 target of having at least 45% women in our management levels (approximately 220 individuals) and we have now revised this target to 50% by 2020.
In addition, we have a formal Diversity and Inclusion Policy which is available on the Stockland website at stockland.com.au/corporate-governance. Further details of this policy and our achievements, including measurable objectives for achieving gender diversity, are set out in the 2015 Remuneration Report on page 34 within the Directors’ Report as well as on the Stockland website at stockland.com.au/sustainability.
Board Independence
Stockland recognises that having a majority of independent Non-Executive Directors provides assurance that the Board is structured properly to fulfil its role in holding management accountable for Stockland’s performance. The Board has resolved that it should continue to have a majority of independent Non-Executive Directors, that the positions of Chairman and Managing Director must be separate, and that the Chairman should be an independent Non-Executive Director.
Stockland has developed criteria for determining the independence of its Board members. A Director is considered to be independent if he or she:
• is not a substantial securityholder of Stockland or of a company holding more than 5% of Stockland’s voting securities, or an officer of or directly or indirectly associated with a securityholder holding more than 5% of Stockland’s voting securities;
• is not and has not within the last three years been an employee of Stockland;
• is not a principal of a material professional advisor to Stockland;
• is not a material supplier or customer of Stockland or an officer of, or directly or indirectly associated with a significant supplier or customer;
• has no material contractual relationship with Stockland or any of its associates other than as a Director of Stockland; and
• has no other interest or relationship that could interfere with the Director’s ability to act in the best interests of Stockland and independently of management.
In this context, the Board considers that any Director-related business relationship that is or is likely in the future to be more than 10% of the Director-related business’s revenue to be material. All Directors are expected to act in the best interests of Stockland at all times.
Having considered carefully the above criteria, the Board has determined that all of Stockland’s Non-Executive Directors are independent Directors for the 2015 financial year.
In making this determination, the Board considered the transactions between Stockland and entities with which Stockland Directors are associated as Directors or advisors. The Board concluded that none of these transactions rendered these entities significant suppliers to, or customers of, Stockland when the relative size of the transactions was compared to the total revenues or business of those entities. Further, in none of these transactions did Stockland Directors receive direct financial benefits as principals, partners, or substantial shareholders of the entities concerned.
For
per
sona
l use
onl
y

Directors’ Report Year ended 30 June 2015
Stockland Financial Report 2015 — 24
Board meetings
The Board currently holds 10 scheduled meetings each financial year. Additional meetings are convened as required. During the 2015 financial year, the Board held 15 meetings.
The Board’s practice is for Non-Executive Directors to meet prior to the full Board meeting in the absence of management and the Non-Executive Directors meet privately on other occasions from time-to-time when necessary.
Board and Director performance
The Board has instituted a formal annual process to review the performance and effectiveness of the Board, the Board Committees and individual Directors. The Human Resources Committee oversees this process.
As part of the review, each Director completes a questionnaire relating to the Board’s role, composition, procedures, practices and behaviour. The questionnaires are confidential. The Chairman leads a discussion of the questionnaire results with the Board as a whole. The Chairman also meets one-on-one with each Director annually to discuss their individual contribution, their views on the Board’s performance and their suggestions for improvement in Board processes or procedures. Following these sessions, the Chairman provides feedback to individual Directors as necessary. The Chairman of the Human Resources Committee follows a similar process of one-on-one discussions with each Director annually to provide feedback to the Chairman on his performance and effectiveness. In 2015 the Board has engaged an external consultant to facilitate a review of Board performance.
The Company has adopted a process requiring each Committee Chairman to lead a discussion on a regular basis on their Committee’s performance and effectiveness.
Director remuneration and securities ownership
Non-Executive Directors receive fees for their services, being an all-inclusive fee including statutory and elected superannuation contributions.
To underpin the alignment of Directors and securityholder interests, the Board believes that Directors should hold a meaningful number of Stockland securities. In August 2015 the Board revised its existing policy to increase the minimum number of securities each Non-Executive Director is required to acquire from 10,000 to 40,000 securities within a reasonable time of becoming a Director. The increased minimum roughly equates to one year’s base Board fees. All new directors will have a period of three years to comply with this policy and any existing directors that hold less than 40,000 securities will have until 30 June 2018 to comply. Stockland also has a policy regarding the minimum securityholdings for Senior Executives as set out in the Remuneration Report. Both these policies are intended to align the personal financial interests of Directors and Senior Executives with those of securityholders.
Board Committees
Five permanent Board Committees have been established to assist in the execution of the Board’s responsibilities as described below. These are the:
(1) Human Resources Committee;
(2) Audit Committee;
(3) Risk Committee;
(4) Sustainability Committee; and
(5) Financial Services Compliance Committee.
The Board’s policy is that a majority of the members of each Board Committee should be independent Directors. The Audit Committee, Risk Committee and the Human Resources Committee comprise only independent Directors. The Financial Services Compliance Committee and the Sustainability Committee are chaired by an independent Director and have a majority of independent Directors, or external independent persons as Members.
The Board reviews the composition of each Committee periodically, balancing the benefits of rotation with those of maintaining continuity of experience and knowledge, and to ensure Committee members have skills appropriate to their roles. Each Committee has its own written charter which it reviews annually and recommends any appropriate changes to the Board.
All Non-Executive Directors may attend any Board Committee meeting. Committees may meet with external advisors in the absence of management. Each Board Committee works in conjunction with other Board Committees to assist the Board in fulfilling its responsibilities for ensuring Stockland has adopted and maintains appropriate corporate governance procedures. The membership and the procedures for the Committee meetings are set out in the Board Committee Charter located, together with the charters for each Board Committee (except the Financial Services Compliance Committee) on the Stockland website at stockland.com.au/corporate-governance.
For
per
sona
l use
onl
y

Directors’ Report Year ended 30 June 2015
Stockland Financial Report 2015 — 25
Human Resources Committee
The Human Resources Committee incorporates the functions of two Board Committees recommended by the ASX Guidelines: a Nominations Committee and a Remuneration Committee.
A copy of the charter for the Human Resources Committee is located at the Stockland website at stockland.com.au/corporate-governance. The Human Resources Committee seeks to ensure that there is a strong link between employee reward, Stockland’s performance and ultimately securityholder returns. The Human Resources Committee also seeks to ensure that remuneration for Non-Executive Directors is designed to attract and retain talented and experienced individuals. Refer to the Remuneration Report on pages 52 to 53 for further information.
Members of the Human Resources Committee during or since the end of the financial year were:
(1) Ms C Hewson (Chair) – Non-Executive Director
(2) Mr G Bradley – Non-Executive Director
(3) Mr D Boyle – Non-Executive Director
The Human Resources Committee meets as frequently as required and held 4 meetings during the 2015 financial year.
Audit Committee
The Board has delegated oversight for the preparation of Stockland’s Financial Reports and the maintenance of a sound financial reporting control environment to the Audit Committee.
The purpose of the Audit Committee is to assist the Board to discharge its responsibilities for:
• the integrity of Stockland’s Financial Reports and external audit;
• the appropriateness of Stockland’s accounting policies and processes;
• the effectiveness of Stockland’s financial reporting controls and procedures;
• the effectiveness of Stockland’s internal control environment; and
• compliance with relevant laws and regulations including any prudential supervision procedures to the extent that they impact the integrity of Stockland’s financial statements.
The Audit Committee works in conjunction with the Sustainability Committee, Financial Services Compliance Committee, Human Resources Committee and Risk Committee to assist the Board in fulfilling its responsibilities for ensuring Stockland has adopted and maintains appropriate corporate governance procedures.
A copy of the charter for the Audit Committee is located on the Stockland website at stockland.com.au/corporate-governance.
In order to appropriately discharge its responsibilities, the Audit Committee is specifically authorised to amend Stockland’s accounting policies which the Audit Committee determines do not require Board approval; and review and approve any NGER’s or emissions reporting by the group.
The external auditor provides a declaration of independence each reporting period, consistent with the requirements of the Corporations Act 2001. The Audit Committee also adopts safeguards to maintain audit independence as follows:
• designating the types of services that may be and may not be performed by the external auditor;
• ensuring management retains responsibility for decision-making on all Non-Audit Services provided by the external auditor; and
• reviewing and approving the external auditor’s process for the rotation and succession of audit and review partners including the approach to managing the transition.
Audit Committee meetings are held at least quarterly and are attended, where appropriate, by the Managing Director, the Chief Financial Officer, Stockland’s external auditor and, as required, other Stockland Executives and external advisors. The Committee meets privately with the external auditor and internal auditor in the absence of management at least once a year.
The Committee has at least three independent Non-Executive members with the majority being independent Directors. The Chairman of the Audit Committee will not also be the Chairman of the Board.
At least one member of the Audit Committee has relevant accounting qualifications and experience and all Members have a good understanding of financial reporting.
For
per
sona
l use
onl
y

Directors’ Report Year ended 30 June 2015
Stockland Financial Report 2015 — 26
The members of the Audit Committee during or since the end of the financial year were:
(1) Mr T Williamson (Chair) – Non-Executive Director
(2) Mr B Neil – Non-Executive Director
(3) Mr T Pockett – Non-Executive Director
The Audit Committee met 6 times during the 2015 financial year.
Tax Control and Governance Policy Framework
Stockland maintains a Tax Control and Governance Framework, reviewed and approved by the Audit Committee, which outlines the principles governing Stockland’s tax strategy and risk management policy.
Stockland’s Tax Control and Governance Framework is consistent with the guidelines published by the Australian Taxation Office regarding tax risk management and governance processes for large business taxpayers.
Stockland undertakes periodic review of the Tax Control and Governance Framework to test the robustness of the design of the framework against ATO benchmarks and to demonstrate the operating effectiveness of internal controls to stakeholders.
The key principles of the Stockland Tax Control and Governance Framework are summarised as follows:
• A tax strategy that ensures all tax affairs are conducted in a transparent, equitable and commercially responsible manner, whilst having full regard to all relevant tax laws, regulations and tax governance processes, to demonstrate good corporate citizenship;
• A balanced tax risk appetite which is consistent with the Board approved risk appetite, to ensure Stockland remains a sustainable business and a reputable and attractive investment proposition;
• A commitment to engage and maintain relationships with tax authorities which are open, transparent and co-operative, consistent with Stockland’s Code of Conduct and Ethical Behaviour policy; and
• An operating and trading business based in Australia, with no strategic intentions of engaging in any tax planning involving the use of offshore entities or low tax jurisdictions.
Risk Committee
The Board as a whole is ultimately responsible for the sound management of risk and compliance across the organisation.
The purpose of the Risk Committee is to assist the Board to fulfil its risk governance responsibilities. The Risk Committee provides a board level forum to oversee Stockland’s risk culture and review the effectiveness of risk identification and management including the structures, processes and management systems within Stockland’s overall risk management framework. The Risk Committee reviews Stockland’s risk management framework on an annual basis including in the 2015 financial year to satisfy itself that it continues to be sound and any material changes are reviewed and resolved at Board level. In addition, Stockland has an internal audit function which also regularly reviews and independently assesses the effectiveness and efficiency of the risk management framework and periodic reporting. Further information risk management at Stockland is available at stockland.com.au/corporate-governance.
The members of the Risk Committee during or since the end of the financial year were:
(1) Mr P Scott (Chair) – Non-Executive Director
(2) Mr T Pockett – Non-Executive Director
(3) Ms C Schwartz – Non-Executive Director
A copy of the charter for the Risk Committee is located on the Stockland website at stockland.com.au/corporate-governance.
The Risk Committee met 4 times during the 2015 financial year.
Sustainability Committee
Stockland recognises that a sustainable future for its business depends upon the sustainability of the communities, economy and society in which it operates.
The purpose of the Sustainability Committee is to consider the social, environmental and ethical impact of Stockland’s business activities; major corporate responsibility and sustainability initiatives and changes in policy; and Stakeholder communication about Stockland’s corporate and sustainability policies.
A copy of the charter for the Sustainability Committee is located on the Stockland website under the heading Corporate Governance at stockland.com.au/corporate-governance.
For
per
sona
l use
onl
y

Directors’ Report Year ended 30 June 2015
Stockland Financial Report 2015 — 27
The Board has charged Executive management with responsibility for managing Stockland’s business operations to a high standard of ethical business practice, corporate citizenship and environmental responsibility.
With regard to environmental regulation, Stockland is committed to achieving high standards of environmental performance. The Sustainability Committee regularly considers issues associated with the environmental impact of Stockland’s operations and, together with management, monitors Stockland’s compliance with relevant statutory requirements as well as published policies and guidelines.
Stockland’s operations are subject to various environmental regulations under both Commonwealth and State legislation, particularly in relation to its property development activities. Stockland undertakes an environmental due diligence and risk assessment of all properties it acquires. The Sustainability Committee monitors environmental performance by setting objectives, monitoring progress against these objectives and identifying remedial action where required.
The Committee comprises the whole Board, and met 3 times during the 2015 financial year.
Financial Services Compliance Committee
The Financial Services Compliance Committee is responsible for monitoring and reviewing the effectiveness of the Compliance Plans in respect of Stockland Trust and its controlled entities, and Macquarie Park Trust and in ensuring adherence to applicable laws and regulations.
The Compliance Plans are designed to protect the interests of securityholders.
The Compliance Plans for Stockland Trust and its controlled entities and for Macquarie Park Trust have been approved by the Australian Securities and Investments Commission (‘ASIC’). The Financial Services Compliance Committee meets regularly and must report breaches of the law and Constitution to the Board which is required to report any material breach of the Compliance Plan to ASIC.
The members of the Committee during or since the end of the financial year were:
(1) Mr T Williamson (Chair) – Non-Executive Director
(2) Mr A Sherlock – External Independent Non-Executive Director
(3) Ms K Grace – Executive Member
The Committee met 4 times during the 2015 financial year.
Stockland Capital Partners
Stockland Capital Partners (‘Capital Partners’) was established in 2005 to offer unlisted property investment opportunities for both small and large investors, provide new sources of capital, facilitate asset growth and generate additional sustainable income. A wholly-owned entity, Stockland Capital Partners Limited (‘SCPL’) operates this business, with a separate Board of Directors (‘SCPL Board’).
SCPL acts as the Responsible Entity or Manager of Stockland’s unlisted funds, except for Macquarie Park Trust. Stockland Trust Management Limited is the Responsible Entity of Macquarie Park Trust.
Since the Capital Partners business has dealings with and may acquire assets from Stockland, the SCPL Board has one external independent Non-Executive Director who is not a member of the Stockland Board. The independent Director must approve each transaction SCPL enters into with Stockland and must be satisfied that such transactions are on arm’s length commercial terms.
In order to protect the unitholders in the event there is a dispute or default by Stockland under the terms of any agreement, the SCPL Board has resolved that the consent of the independent Director must be obtained as to any related party contract with Stockland.
The members of the SCPL Board during or since the end of the financial year were:
(1) Mr B Neil (Chair) – Non-Executive Director
(2) Mr A Sherlock – External Independent Non-Executive Director
(3) Mr M Steinert – Managing Director
The SCPL Board met 6 times during the 2015 financial year.
The Stockland Capital Partners Audit and Risk Committee mirror the Audit Committee and the Risk Committee of Stockland but covers SCPL and the unlisted funds for which SCPL is the Responsible Entity or Manager. In addition a Financial Services Compliance Committee oversees the Compliance Plan approved by SCPL for Stockland Direct Office Trust No. 2 (‘SDOT No. 2’), and Stockland Direct Retail Trust No. 1 (‘SDRT No. 1’). Further information these committees and SCPL generally is located on the Stockland website at stockland.com.au/investor-centre/unlisted-property-funds.htm.
For
per
sona
l use
onl
y

Directors’ Report Year ended 30 June 2015
Stockland Financial Report 2015 — 28
Executive confirmations
In accordance with Stockland’s legal obligations, the Managing Director and the Chief Financial Officer have declared in writing to the Board that, for the year ended 30 June 2015, to the best of their knowledge and belief:
With regard to Stockland’s Financial Reports:
(1) Stockland’s financial records have been properly maintained in accordance with section 286 of the Corporations Act 2001; and
(2) Stockland’s financial statements present a true and fair view of the Stockland’s financial condition and operational results and are prepared in accordance with relevant Australian Accounting Standards.
With regard to risk management and internal compliance and control systems of Stockland:
(1) the statements made with respect to the integrity of Stockland’s Financial Reports are founded on a sound system of risk management and internal compliance and control systems which implement the policies adopted by the Board; and
(2) the risk management and internal compliance and control systems, to the extent they relate to financial reporting, were operating effectively and efficiently in all material respects throughout the period.
Since 30 June 2015, nothing has come to the attention of the Managing Director and the Chief Financial Officer that would indicate any material change to any of the statements made above.
Associates and joint ventures, which Stockland does not control, are not covered for the purposes of this statement or declaration given under S295A of the Corporations Act 2001.
Whilst these statements are comprehensive in nature, they provide a reasonable but not absolute level of assurance about risk management, internal compliance and control systems. They do not imply a guarantee against adverse events or more volatile outcomes occurring in the future.
For
per
sona
l use
onl
y

Directors’ Report Year ended 30 June 2015
Stockland Financial Report 2015 — 29
Corporate Governance Principles and Recommendations
ASX Principles and Recommendations Recommendation
Followed Reference
Principle 1: Lay solid foundations for management and oversight
1.1 A listed entity should disclose:
a) the respective roles and responsibilities of its board and management; and
Yes Annual Report p. 21, and at stockland.com.au/corporate-governance
b) those matters expressly reserved to the board and those delegated to management.
1.2 A listed entity should:
a) undertake appropriate checks before appointing a person, or putting forward to security holders a candidate for election, as a director; and
Yes
Annual Report, p. 22-23, and at stockland.com.au/corporate-governance
b) provide security holders with all material information in its possession relevant to a decision on whether or not to elect or re-elect a director.
Yes See notice of annual general meeting and announcements to securityholders as required from time to time
1.3 A listed entity should have a written agreement with each director and senior executive setting out the terms of their appointment.
Yes stockland.com.au/corporate-governance
1.4 The company secretary of a listed entity should be accountable directly to the board, through the chair, on all matters to do with the proper functioning of the board.
Yes Annual Report p. 21.
1.5 A listed entity should:
a) have a diversity policy which includes requirements for the board or a relevant committee of the board to set measurable objectives for achieving gender diversity and to assess annually both the objectives and the entity’s progress in achieving them;
Yes Annual Report, p. 23 and at stockland.com.au/corporate-governance
b) disclose that policy or a summary of it; and
Yes stockland.com.au/corporate-governance
Annual Report, p. 23 and 35, and at stockland.com.au/corporate-governance
See 1.5(c)(2) below.
See WGEA Report at stockland.com.au/corporate-governance
c) disclose as at the end of each reporting period the measurable objectives for achieving gender diversity set by the board or a relevant committee of the board in accordance with the entity’s diversity policy and its progress towards achieving them, and either:
(1) the respective proportions of men and women on the board, in senior executive positions and across the whole organisation (including how the entity has defined ‘senior executive’ for these purposes); or
(2) if the entity is a ‘relevant employer’ under the Workplace Gender Equality Act, the entity’s most recent ‘Gender Equality Indicators’, as defined in and published under that Act.
Yes
N/A
Yes
1.6 A listed entity should:
a) have and disclose a process for periodically evaluating the performance of the board, its committees and individual directors; and
Yes
Annual Report p. 24
b) disclose, in relation to each reporting period, whether a performance evaluation was undertaken in the reporting period in accordance with that process.
Yes Annual Report p. 24
1.7 A listed entity should:
a) have and disclose a process for periodically evaluating the performance of its senior executives; and
Yes
Remuneration report.
b) disclose, in relation to each reporting period, whether a performance evaluation was undertaken in the reporting period in accordance with that process.
Yes Remuneration report.
For
per
sona
l use
onl
y

Directors’ Report Year ended 30 June 2015
Stockland Financial Report 2015 — 30
ASX Principles and Recommendations Recommendation
Followed Reference
Principle 2: Structure the Board to add value
2.1 The board of a listed entity should:
a) have a nomination committee which:
(1) has at least three members, a majority of whom are independent directors; and
(2) is chaired by an independent director,
and disclose:
(3) the charter of the committee;
(4) the members of the committee; and
(5) as at the end of each reporting period, the number of times the committee met throughout the period and the individual attendances of the members at those meetings; or
Yes Annual Report p. 25 and at stockland.com.au/corporate-governance
Note that the Human Resources Committee carries out the role of the Nomination Committee, see details for this Committee in Section 8.1.
b) if it does not have a nomination committee, disclose that fact and the processes it employs to address board succession issues and to ensure that the board has the appropriate balance of skills, knowledge, experience, independence and diversity to enable it to discharge its duties and responsibilities effectively.
N/A
2.2 A listed entity should have and disclose a board skills matrix setting out the mix of skills and diversity that the board currently has or is looking to achieve in its membership.
Yes Annual Report p. 22-23
2.3 A listed entity should disclose:
a) the names of the directors considered by the board to be independent directors;
Yes Annual Report p. 17-19 and 23
b) if a director has an interest, position, association or relationship of the type described in Box 2.3 but the board is of the opinion that it does not compromise the independence of the director, the nature of the interest, position, association or relationship in question and an explanation of why the board is of that opinion; and
N/A N/A
c) the length of service of each director. Yes Annual Report p. 17-19
2.4 A majority of the board of a listed entity should be independent directors.
Yes Annual Report p. 23
2.5 The chair of the board of a listed entity should be an independent director and, in particular, should not be the same person as the CEO of the entity.
Yes Annual Report p. 23
2.6 A listed entity should have a program for inducting new directors and provide appropriate professional development opportunities for directors to develop and maintain the skills and knowledge needed to perform their role as directors effectively.
Yes stockland.com.au/corporate-governance
Principle 3: Act ethically and responsibly
3.1 A listed entity should:
a) have a code of conduct for its directors, senior executives and employees; and
Yes
Annual Report p.21 and at stockland.com.au/corporate-governance
b) disclose that code or a summary of it. Yes stockland.com.au/corporate-governance
For
per
sona
l use
onl
y

Directors’ Report Year ended 30 June 2015
Stockland Financial Report 2015 — 31
ASX Principles and Recommendations Recommendation
Followed Reference
Principle 4: Safeguard integrity in corporate reporting
4.1 The board of a listed entity should:
a) have an audit committee which:
(1) has at least three members, all of whom are non-executive directors and a majority of whom are independent directors; and
Yes
Annual Report p.25
(2) is chaired by an independent director, who is not the chair of the board,
Yes Annual Report p.25
and disclose:
(3) the charter of the committee;
Yes
stockland.com.au/corporate-governance
(4) the relevant qualifications and experience of the members of the committee; and
Yes Annual Report p.17-19 and 25-26
(5) in relation to each reporting period, the number of times the committee met throughout the period and the individual attendances of the members at those meetings; or
Yes Annual Report p.20 and 26
b) if it does not have an audit committee, disclose that fact and the processes it employs that independently verify and safeguard the integrity of its corporate reporting, including the processes for the appointment and removal of the external auditor and the rotation of the audit engagement partner.
N/A N/A
4.2 The board of a listed entity should, before it approves the entity’s financial statements for a financial period, receive from its CEO and CFO a declaration that, in their opinion, the financial records of the entity have been properly maintained and that the financial statements comply with the appropriate accounting standards and give a true and fair view of the financial position and performance of the entity and that the opinion has been formed on the basis of a sound system of risk management and internal control which is operating effectively.
Yes Annual Report p.28
4.3 A listed entity that has an AGM should ensure that its external auditor attends its AGM and is available to answer questions from security holders relevant to the audit.
Yes stockland.com.au/corporate-governance
Principle 5: Make timely and balanced disclosure
5.1 A listed entity should:
a) have a written policy for complying with its continuous disclosure obligations under the Listing Rules; and
Yes stockland.com.au/corporate-governance
b) disclose that policy or a summary of it. stockland.com.au/corporate-governance
Principle 6: Respect the rights of security holders
6.1 A listed entity should provide information about itself and its governance to investors via its website.
Yes stockland.com.au/corporate-governance
6.2 A listed entity should design and implement an investor relations program to facilitate effective two-way communication with investors.
Yes stockland.com.au/corporate-governance
6.3 A listed entity should disclose the policies and processes it has in place to facilitate and encourage participation at meetings of security holders.
Yes stockland.com.au/corporate-governance
6.4 A listed entity should give security holders the option to receive communications from, and send communications to, the entity and its security registry electronically.
Yes stockland.com.au/corporate-governance
For
per
sona
l use
onl
y

Directors’ Report Year ended 30 June 2015
Stockland Financial Report 2015 — 32
ASX Principles and Recommendations Recommendation
Followed Reference
Principle 7: Recognise and manage risk
7.1 The board of a listed entity should:
a) have a committee or committees to oversee risk, each of which: (1) has at least three members, a majority of whom are
independent directors; and
Yes Annual Report, p.26
(2) is chaired by an independent director, Yes Annual Report. p.26
and disclose:
(3) the charter of the committee;
Yes
stockland.com.au/corporate-governance
(4) the members of the committee; and Yes Annual Report. p.26
(5) as at the end of each reporting period, the number of times the committee met throughout the period and the individual attendances of the members at those meetings; or
Yes Annual Report. p.20 and 26
b) if it does not have a risk committee or committees that satisfy (a) above, disclose that fact and the processes it employs for overseeing the entity’s risk management framework.
N/A N/A
7.2 The board or a committee of the board should:
a) review the entity’s risk management framework at least annually to satisfy itself that it continues to be sound; and
Yes Annual Report. p.26
and at stockland.com.au/corporate-governance
b) disclose, in relation to each reporting period, whether such a review has taken place.
Yes Annual Report. p.26
7.3 A listed entity should disclose:
a) if it has an internal audit function, how the function is structured and what role it performs; or
Yes Annual Report. p.26 and at stockland.com.au/corporate-governance
b) if it does not have an internal audit function, that fact and the processes it employs for evaluating and continually improving the effectiveness of its risk management and internal control processes.
N/A N/A
7.4 A listed entity should disclose whether it has any material exposure to economic, environmental and social sustainability risks and, if it does, how it manages or intends to manage those risks.
Yes stockland.com.au/about/sustainability.htm
Principle 8: Remunerate fairly and responsibly
8.1 The board of a listed entity should:
a) have a remuneration committee which: (1) has at least three members, a majority of whom are
independent directors; and
Yes Annual Report. p.25
(2) is chaired by an independent director, Yes Annual Report. p.25
and disclose:
(3) the charter of the committee;
Yes stockland.com.au/corporate-governance
(4) the members of the committee; and Yes Annual Report. p.25
(5) as at the end of each reporting period, the number of times the committee met throughout the period and the individual attendances of the members at those meetings; or
Yes Annual Report. p.20 and 25.
b) if it does not have a remuneration committee, disclose that fact and the processes it employs for setting the level and composition of remuneration for directors and senior executives and ensuring that such remuneration is appropriate and not excessive.
N/A N/A
For
per
sona
l use
onl
y

Directors’ Report Year ended 30 June 2015
Stockland Financial Report 2015 — 33
ASX Principles and Recommendations Recommendation
Followed Reference
8.2 A listed entity should separately disclose its policies and practices regarding the remuneration of non-executive directors and the remuneration of executive directors and other senior executives.
Yes Remuneration Report
8.3 A listed entity which has an equity-based remuneration scheme should:
a) have a policy on whether participants are permitted to enter into transactions (whether through the use of derivatives or otherwise) which limit the economic risk of participating in the scheme; and
Yes Remuneration Report and at
stockland.com.au/corporate-governance
stockland.com.au/corporate-governance b) disclose that policy or a summary of it.
For
per
sona
l use
onl
y

Directors’ Report Year ended 30 June 2015
Stockland Financial Report 2015 — 34
Remuneration Report – Audited
The Board is pleased to present the Remuneration Report (‘Report’) for Stockland for the year ended 30 June 2015 (‘FY15’), which forms part of the Directors’ Report and has been audited in accordance with section 308(3C) of the Corporations Act 2001. The Remuneration Report covers Stockland and the Stockland Trust Group.
Our Report follows the format we have used for the past four years.
Remuneration policies
The Board is committed to ensuring that Stockland’s remuneration policies are fair, responsible and competitive and that we communicate our remuneration arrangements with full transparency. On an ongoing basis, the Board monitors these policies and practices to ensure that they remain in line with current best practice, are consistent with anticipated regulatory changes and market trends, and continue to be effective to meet Stockland’s changing business priorities and market challenges.
Since 2011, we have made a number of significant adjustments to our remuneration policies including:
• Introducing deferral for part of Short Term Incentive (‘STI’) awards so that at least one-third of any STI awarded to our Senior Executives (and 50% for the Managing Director) is deferred into Stockland securities which vest over two years;
• Extending the vesting period of our Long Term Incentives (‘LTI’) to four years; and
• Introducing clawback provisions on all unvested equity awards.
There was no change to the remuneration arrangements for our Managing Director for FY15 nor to the remuneration framework for the Senior Executives who are Key Management Personnel (‘KMP’).
In FY15, no increases were made in Fixed Pay for the Managing Director and our Senior Executives and no increases were made in base fees paid to Non-Executive Directors (‘NEDs’). We did make some adjustment to some of the Board committee fees to reflect the additional workload for these committees as well as market relativities. Our prudent approach to remuneration will continue in FY16 with no changes being made to the Fixed Pay of the Managing Director and the majority of our Senior Executives. Our policy is to review Executives Fixed Pay and NED fees each year ensuring that we remain competitive with companies of comparable size and complexity in our industry. Our prudent approach to remuneration will continue in FY16 with no changes being made to the Fixed Pay of the Managing Director and the majority of our Senior Executives.
We have increased Fixed Remuneration for three Senior Executives for FY16 to reflect their market relativities but there is no change to the framework for their STI or LTI awards.
We have made a small increase in NED base fees for FY16 as set out on page 52; the first increase in such fees since July 2011.
Remuneration Outcomes
The Short Term Incentive pool awarded to all employees, including those awarded to our Senior Executives totalled $33.0 million in FY15 ($27.4 million in FY14). The increase reflected our improved profit performance in FY15 and the Board’s assessment of performance against the measures outlined in our Corporate Balanced Scorecard set out in this Report. Due to the changes introduced in FY13, over half of the increased STI awarded in FY15 comprised Stockland securities with vesting deferred to future financial years and subject to continued service.
Remuneration Governance
Human Resources Committee
The Human Resources (‘HR’) Committee assists the Board to exercise sound governance of its responsibility for the appointment, performance and remuneration of the Managing Director and Senior Executives.
The HR Committee also oversees all employment and remuneration policies to ensure that, at all levels in the organisation, fairness and balance are maintained between reward, cost and value to the Company.
The HR Committee approves the remuneration framework for all employees, including risk and financial control personnel and employees whose total remuneration includes a significant variable component.
In FY15, following a realignment of the membership of a number of the Board sub-committees in October 2014, Carolyn Hewson replaced Peter Scott as Chair of the HR Committee with Mr Scott replacing Ms Hewson as Chair of the Risk Committee and Duncan Boyle joined the HR Committee. The HR Committee now comprises the following three independent Non-Executive Directors: Carolyn Hewson (Chair), Graham Bradley and Duncan Boyle.
For
per
sona
l use
onl
y

Directors’ Report Year ended 30 June 2015
Stockland Financial Report 2015 — 35
The roles and responsibilities of the HR Committee are outlined in the Human Resources Committee charter which is available on Stockland’s website.
Use of remuneration consultants
Stockland seeks relevant benchmarking and commentary on a number of remuneration issues from a variety of consultants including Ernst & Young. Stockland also subscribes to a number of independent salary and remuneration surveys, including property sector specific surveys run by AON Hewitt and Mercer. During FY15, no remuneration recommendations in relation to Key Management Personnel, as defined by Division 1 of Part 1.2 of Chapter 1 of the Corporations Act 2001 (the ‘Act’), were made by these or other consultants.
Diversity and Inclusion
At Stockland we value diversity and aim to create a vibrant and inclusive workplace which is reflective of the communities in which we operate. Building a more inclusive workplace enables greater diversity of thought, more informed decision making and ultimately better business outcomes.
Diversity, including gender diversity, forms an integral part of our People Strategy, as reflected in our Diversity and Inclusion policies – spanning appropriate gender balance, flexible working, parental leave, and other support, in addition to focusing on the employment of people from a range of ethnic backgrounds and people with disabilities. At a management level, the Diversity and Inclusion Steering Committee is chaired by the Managing Director, Mark Steinert, and oversees the implementation of our diversity and inclusion strategy. Our Diversity and Inclusion Policy is available on our website, with a detailed update against initiatives provided in our Annual Review. A summary of our progress is outlined below:
Focus Area Key Outcomes
Gender balance and Inclusion
• At the end of FY15, 45% of our managers were women which was broadly in line with our FY15 Target
• Our recruitment approach was reviewed and includes specific requirements around the gender mix of both candidates and Stockland interviewers
• During FY15 we were successful in achieving the citation as one of the Workplace Gender Equality Agency’s (‘WGEA’) Employer of Choice for Gender Equality
Inclusive Culture • The favourable Diversity and Inclusion score in our annual employee engagement survey was maintained at 87%
Reflecting the Communities in which we operate
• Our disability recruitment partnerships continue with a number of candidates with disabilities employed during FY15
• Our Reconciliation Action Plan is progressing well with all commitments on track
Flexibility and Work Life Quality
• The return to work rate for employees who took parental leave continued to be approximately 90%
• Over 20% of all employees now work part-time or are casual and the number of employees working remotely continues to increase
Industry Advocacy and Thought Leadership
• We continued to be actively involved in both industry and broader corporate groups through direct participation and sponsorship
Gender Pay • Pay equity is a key part of the annual remuneration review across all roles with particular analysis focusing on pay ratios for men and women occupying similar roles within Stockland compared to market benchmarks. Overall, female fixed pay for similar roles was broadly aligned and, although for a number of roles females were paid above males, there was an overall slightly lower fixed pay for females than males in similar roles.
Key Management Personnel (‘KMP’)
KMP are those people who have the authority and responsibility for planning, directing and controlling Stockland’s activities, directly or indirectly. They include Non-Executive Directors, the Managing Director and those of the Managing Director’s direct reports who are members of the Executive Committee, and who are heads of business units or functional areas (‘Senior Executives’). Individuals who were KMP of the Stockland Consolidated Group at any time during the financial year are listed on page 55.
Stockland has defined the term ‘Executive’ to include the Managing Director and Senior Executives. All Executives are employed by Stockland Development Pty Limited, a subsidiary of Stockland Corporation Limited.
The term ‘remuneration’ has been used in this Report as having the same meaning as the alternative term ‘compensation’ as defined in AASB 124 Related Party Disclosures (‘AASB 124’). The Report contains disclosures required by the Corporations Act 2001 and the Corporations Regulations 2001.
For
per
sona
l use
onl
y

Directors’ Report Year ended 30 June 2015
Stockland Financial Report 2015 — 36
Remuneration Philosophy and Principles
Stockland’s remuneration policies are framed around several key principles:
• Fixed Pay should be fair, competitive and regularly benchmarked against relevant market evidence;
• A significant portion of Executive remuneration should be ‘at risk’ and awarded only if pre-set objectives and/or hurdles are achieved;
• ‘At risk’ or variable pay should be aligned to securityholder interests and individuals should have clear performance criteria set in advance;
• The level of variable pay increases as a portion of total remuneration as responsibility increases;
• Performance-based pay or Short-Term Incentives (‘STIs’) must be affordable and funded from annual underlying profit;
• STI awards depend on individual and company performance against measures reflecting progress against a Balanced Scorecard of Key Performance Indicators (‘KPIs’). A portion of performance-based pay for Executives is awarded as Stockland equity with deferred vesting;
• Long-Term Incentives (‘LTIs’) with vesting dependent on achievement of long-term goals not only help motivate and retain key Executives but also build a sense of ownership of business performance that benefits all securityholders;
• Remuneration policies, framework and decisions take account of risk management and capital management considerations; and
• Unvested incentive awards are forfeited if employees resign during the applicable vesting period and are subject to broadly framed clawback provisions which give the Board discretion to adjust or forfeit these awards in certain circumstances.
Link between remuneration and performance for FY15
Key financial performance measures
Underlying profit, EPS and other key financial performance measures over the last five years are set out below.
FY11 FY12 FY13 FY14 FY15
Underlying profit1 ($M) 726 676 495 555 608
Net tangible assets per security ($) 3.65 3.68 3.50 3.53 3.68
Security price as at 30 June ($) 3.41 3.08 3.48 3.88 4.10
Dividends/Distributions per security (¢) 23.7 24.0 24.0 24.0 24.0
Underlying earnings per security (¢) 30.5 29.3 22.4 24.0 25.9
Stockland TSR – 1 year (%) (5.3) 0.5 17.5 20.5 12.3
A-REIT 200 TSR (exc SGP) – 1 year (%) 4.4 9.9 24.8 11.3 24.2
1 The reconciliation of underlying profit to statutory profit is provided in Note (B2b) to the financial statements of the Annual Report and on page 9 of the Operating and Financial Review.
Short-Term Incentive (‘STI’)
STI is awarded only when an agreed level of performance is achieved by individual employees against a combination of objectives set at the beginning of each financial year. For Stockland, the Board uses a Corporate Balanced Scorecard to set financial and non-financial Key Performance Indicators (‘KPIs’) that are aligned to overall business strategy. The Board’s assessment of the company’s performance against these KPIs informs the quantum of the annual STI pool.
The Board’s assessment of performance against the Corporate Balanced Scorecard is provided in the following table.
For
per
sona
l use
onl
y

Directors’ Report Year ended 30 June 2015
Stockland Financial Report 2015 — 37
Corporate Balanced Scorecard
Key Performance Indicators Commentary Overall Rating
Business and Financial Performance (75%)
Underlying profit performance
• Earnings per security (‘EPS’) growth target of 5% to 6% (25.5-25.7 cps); and
• Return on Equity1 (‘RoE’) of 8.5%.
• Actual underlying EPS growth was 7.8% to 25.9 cps.
• RoE was 9.9%.
Above Target
Above Target
Business Performance
• Operating Business performance in line with plan;
Business unit profitability were all above plan:
• Commercial Property profit of $513m was up on FY14 and above plan.
• Residential profit of $166m was well up on FY14 and significantly above plan.
• Retirement Living profit of $48m was up on FY14 and above plan.
Above Target
• Maintain conservative debt profile and remain within policy limits for gearing, interest cover, asset mix, credit rating and debt profile;
• Credit Rating Maintain A- rating
• Debt Maturity profile >5 Years
• Liquidity Buffer $500m
• Gearing within range 20-30%
• Average Debt Maturity was over 5 years and Credit Rating maintained, with liquidity buffer, gearing and interest cover all within guidelines
At Target
• Deliver against Key Business Priorities • Generally good progress made especially embedding a disciplined approach to investment decisions
Above Target
Customer, Stakeholder and Sustainability Performance
• Achieve independent customer satisfaction ratings goals for each business unit.
• The customer satisfaction scores were above or at target for Commercial and Retirement Living but below target for Residential
At Target
• Embed sustainable business practices across Stockland and make good progress towards environment improvement goals
• Second ranked Global Real Estate firm in DJSI Sustainability Survey. Continued progress across our GHG measures and other sustainability targets
At Target
Organisational Performance (25%)
People Management
• Reduce Employee-Initiated turnover (employees rated good and above) to 12% or less;
• Achieve Employee Engagement target – 80%; and
• Maintain women as percentage of total management 45.5%
• Progress longer term diversity and inclusiveness objectives
• Turnover was 12%;
• Employee engagement score of 85%;
• Women in management was 45%.
• Good progress made including citation as WGEA Employer of Choice for Gender Equality
At Target
Above Target
At Target
At Target
Operational Excellence & Operational Risk/WH&S
• Continued Process Improvement and enhanced innovation
• Embed strong risk compliance and safety management practices.
• Good progress with quantified benefits due to embedded group functions
• Excellent safety record with no major preventable injuries with continued embedding of the compliance framework
At Target
At Target
1 Excluding Residential workout projects. ROE was 8.8% including these projects.
Short-Term Incentives (‘STI’)
The approved STI pool for all employees in FY15 was $33.0 million of which $9.0 million (or 27% of the pool) being deferred into Stockland securities and which remains subject to the risk of forfeiture until vesting dates at the end of FY16 and FY17.
Details of the FY15 and previous years’ STI pools for all employees are provided below. The approved STI pool includes Cash STI awards as well as Deferred STI awards subject to vesting in future years subject to service conditions being met.
For
per
sona
l use
onl
y

Directors’ Report Year ended 30 June 2015
Stockland Financial Report 2015 — 38
FY11 FY12 FY13 FY14 FY15
Underlying profit ($M) 726 676 495 555 608
Cash STI ($M)1 27.2 21.6 17.9 21.4 24.0
Deferred STI ($M)2 6.3 4.2 3.6 6.0 9.0
Total STI pool ($M)2 33.5 25.8 21.5 27.4 33.0
1 Includes applicable superannuation. 2 The STI pools for FY11 to FY12 have been restated using the STI/LTI mix including deferred STI that applied for employees in FY13 to ensure
comparison on a like with like basis.
Until FY15, our total STI pool has not exceeded 5.0% of underlying profit. We have reviewed this self-imposed target in light of several changes in our business and now consider that this limit is no longer appropriate. The changes include the changing mix of executive roles within our company, resulting from our strategy to upskill our executive team, the adoption of more conservative interest and cost capitalisation policies, and the changes to our reward mix we made from FY12 which included introducing deferral of STI awards for all Executives. We now seek to manage the total STI pool so it will not exceed 7.5% of underlying profit and only reach this level in a year of exceptional performance. In FY15, a year of strong performance, the pool was approximately 5.4% of underlying profit.
Long-Term Incentives (‘LTI’)
Our LTI awards are linked to two measures: target underlying EPS growth and relative TSR performance. Despite strong EPS growth over the last two years and three year cumulative TSR of 59%, there was no LTI vesting in FY15 as neither of these two hurdles measured over the period from 1 July 2012 to 30 June 2015 were achieved or exceeded.
Half of the LTI allocated to employees is linked to Stockland’s performance against underlying EPS Growth Targets. The group exceeded the target in FY14 and FY15 but fell short in FY13. Accordingly, there was no vesting for the EPS portion of the 2012 (FY13) LTI awards to any employee.
The other half of the LTI award is linked to the TSR performance hurdle. From 1 July 2012 to 30 June 2015, Stockland’s TSR returned a positive absolute return of 59.0% but underperformed over the period against its peer group benchmark of 72.4% (as measured by the A-REIT Accumulation Index excluding Stockland) so there was no vesting of the TSR portion of the 2012 LTI awards to any employee.
The total LTI value that lapsed due to no vesting for the KMP in FY15 was $5.6 million.
Details on the performance against each hurdle for FY13 grants whose performance period ended as at 30 June 2015 are outlined in the table below:
Hurdle
Target/ benchmark
performance Actual
performance (Under)/Out
performance %
vested Weight Vesting
outcome
EPS
FY13 Underlying EPS Growth (10.0%) (23.5%) (13.5%)
FY14 Underlying EPS Growth 5.0% 7.1% 2.1%
FY15 Underlying EPS Growth 4.5% 7.8% 3.3%
Aggregate Underlying EPS Growth (0.5%) (8.6%) (8.1%) 0% 50% 0%
TSR
Relative TSR FY12-FY15 72.4% 59.0% (13.4%) 0% 50% 0%
Total Vesting 0%
FY15 and FY16 LTI awards – Underlying EPS Growth Target
As advised at the October 2014 AGM, the maximum vesting hurdle based on the Compound Annual Growth Rate (‘CAGR’) for Underlying EPS for LTI awards granted during FY15 was 6.25% for the three years from 1 July 2014 to 30 June 2017, with the threshold vesting hurdle being 4.5% CAGR.
The maximum and threshold hurdles for FY16 LTI will be the same CAGR targets as FY15, being 6.25% (31.1 cps) and 4.5% (29.6 cps) respectively.
For
per
sona
l use
onl
y

Directors’ Report Year ended 30 June 2015
Stockland Financial Report 2015 — 39
Executive Remuneration for FY15 (non statutory)
Executives received a mix of remuneration during FY15 including Fixed Pay, STI awarded as cash and as deferred securities which may vest one or two years later subject to continued employment, and a LTI which may vest three and four years later subject to performance hurdles and continued employment.
The table below outlines the cash remuneration that was received in relation to FY15 which includes Fixed Pay and the non-deferred portion of any FY15 STI. The table also includes the value of a portion of the deferred STI award from FY14 which vested during FY15. No previous years’ LTI vested during FY15. This information differs from that provided in the statutory remuneration of Executives set out in the table on page 40 which was calculated in accordance with statutory rules and applicable Accounting Standards.
Fixed pay1
$
STI awarded and received
as cash$
Total Cash payments in relation to
financial year $
Previous years’ Deferred STI which
were realised3
$
Previous years’ LTI which were realised
LTI$
Awards which lapsed or were
forfeited4
$
Executive Director Mark Steinert 2015 1,500,000 750,0002 2,250,000 590,486 – 2,164,800Managing Director and CEO 2014 1,500,000 750,0002 2,250,000 113,393 – –
Senior Executives Stephen Bull 2015 650,000 390,000 1,040,000 132,267 – 358,570Group Executive and CEO, Retirement Living 2014 650,000 373,333 1,023,333 – – 529,822
Katherine Grace6 2015 430,138 229,407 659,545 – – –General Counsel and Company Secretary 2014 – – – – – –
Tiernan O’Rourke7 2015 850,000 453,333 1,303,333 96,552 – –
Chief Financial Officer 2014 619,452 330,374 949,826 – – –
Darren Rehn5 2015 700,000 420,000 1,120,000 306,802 – –Group Executive and Chief Investment Officer 2014 – – – – – –
Michael Rosmarin 2015 600,000 320,000 920,000 139,913 – 953,250
Chief Operating Officer 2014 600,000 320,000 920,000 104,752 – 884,640
John Schroder 2015 1,050,000 630,000 1,680,000 278,574 – 1,783,500
Group Executive and CEO, Commercial Property 2014 1,050,000 620,000 1,670,000 211,063 – 1,652,880
Simon Shakesheff8 2015 600,000 320,000 920,000 301,294 – –Group Executive, Strategy and Stakeholder Relations 2014 518,356 276,457 794,813 – – –
Andrew Whitson 2015 700,000 420,000 1,120,000 190,446 – 351,329
Group Executive and CEO, Residential 2014 700,000 420,000 1,120,000 – – 519,121
Former Executives Tim Foster 2015 – – – – – –Former Chief Financial Officer 2014 294,863 – 294,863 152,797 1,404,560
David Pitman 2015 – – – – – –
Former Group Executive and CEO, Retirement Living 2014 151,507 – 151,507 – – –
1 Fixed Pay includes salary, superannuation and salary sacrificed items. 2 For Mark Steinert this is 50% (two-thirds for Senior Executives) of his STI awards. The remaining 50% of his STI (one-third for Senior Executives) was deferred in Stockland securities which vests over
two years following the performance year, 50% after year 1 and 50% after year 2 subject to continued employment. 3 This represents the value of all prior years’ deferred STI which vested during FY15 using the 30 June 2015 closing security price of $4.10. No LTI vested during FY15 or in FY14. 4 The value shown represents the value of any previous years’ equity awards which lapsed or were forfeited during the financial year. The FY15 values are based on the closing 30 June 2015 security
price of $4.10 (FY14: $3.88). 5 Darren Rehn was appointed to the Executive Committee on 13 August 2014 with his remuneration arrangements effective from 1 July 2014. 6 Katherine Grace commenced employment on 21 August 2014. 7 Tiernan O’Rourke commenced employment on 8 October 2013. 8 Simon Shakesheff commenced employment on 22 July 2013.
For
per
sona
l use
onl
y

Directors’ Report Year ended 30 June 2015
Stockland Financial Report 2015 — 40
FY15 Statutory Remuneration
Short-term Post-employment Other
long-term Shared-based payments Total Performance
related
Salary1
$
Non-monetary benefits2
$
Other payments
$
STI3
cash$
Total short-term
$
Super-annuation
benefits$
Terminationbenefits
$
Long service
leave4 $
Deferred STI
(‘DSTI’)$
LTI$
Total$
(STI + LTI)
Percentof Total
%
(DSTI+LTI)
Percent of Total
%
Executive Director
Mark Steinert 2015 1,424,182 – – 750,000 2,174,182 18,783 – 5,911 885,250 1,200,321 4,284,447 66.2 48.7 Managing Director 2014 1,553,202 – – 750,000 2,303,202 17,775 – 535 485,667 558,370 3,365,549 53.3 31.0
Senior Executives
Stephen Bull 2015 634,390 12,126 – 390,000 1,036,516 18,783 – 24,920 196,528 203,325 1,480,072 53.4 27.0 CEO Retirement Living 2014 645,575 11,128 – 373,333 1,030,036 17,775 – 30,257 77,778 100,758 1,256,604 43.9 14.2
Katherine Grace6 2015 418,032 – – 229,407 647,439 18,783 – – 68,997 79,395 814,614 46.4 18.2
General Counsel & Company Secretary
2014 – – – – – – – – – – – – –
Tiernan O’Rourke 2015 847,145 – – 453,333 1,300,478 18,783 – 1,708 213,039 266,249 1,800,257 51.8 26.6 Chief Financial officer 2014 638,639 – – 330,374 969,013 12,648 – – 76,927 132,087 1,190,675 45.3 17.6
Darren Rehn5 2015 714,801 – – 420,000 1,134,801 18,783 – 3,091 153,333 111,055 1,421,063 48.2 18.6 Chief Investment Officer 2014 – – – – – – – – – – – – –
Michael Rosmarin 2015 575,520 12,127 – 320,000 907,647 18,783 – 4,550 177,222 246,546 1,354,748 54.9 31.3 Chief Operating Officer 2014 591,002 6,936 – 320,000 917,938 17,775 – 4,347 123,194 135,853 1,199,107 48.3 21.6
John Schroder 2015 1,022,946 12,127 – 630,000 1,665,073 18,783 – 40,257 350,278 438,424 2,512,815 56.5 31.4 CEO Commercial Property 2014 1,001,194 11,128 – 620,000 1,632,322 17,775 – 40,888 240,972 242,805 2,174,762 50.8 22.2
Simon Shakesheff 2015 577,461 – – 320,000 897,461 18,783 – 1,206 283,227 180,322 1,380,999 56.7 33.6
Group Executive, Strategy & Stakeholder Relations
2014 511,334 – – 276,457 787,791 17,091 – – 709,322 85,518 1,599,722 67.0 49.7
Andrew Whitson 2015 676,635 12,127 – 420,000 1,108,762 18,783 – 22,889 286,667 219,632 1,656,733 55.9 30.6 CEO Residential 2014 720,435 6,169 – 420,000 1,146,604 17,775 – 19,036 133,333 108,802 1,425,550 46.4 17.0
Former Executives
Tim Foster7 2015 – – – – – – – – – – – – – Chief Financial Officer 2014 276,925 – – – 276,925 8,546 82,734 (8,863) 65,139 65,160 489,641 26.6 26.6
David Pitman8 2015 – – – – – – – – – – – – – CEO Retirement Living 2014 135,414 507 – – 135,921 4,704 59,006 (29,092) – – 170,539 – –
Total consolidated remuneration
2015 6,891,112 48,507 – 3,932,740 10,872,359 169,047 – 104,532 2,614,541 2,945,269 16,705,748 56.8 33.3
2014 6,073,720 35,868 – 3,090,164 9,199,752 131,864 141,740 57,108 1,912,332 1,429,353 12,872,149 50.0 26.0
1 Includes any change in accruals for annual leave. 2 Comprises salary packaged benefits, including motor vehicle costs, car parking, other salary sacrificed items and FBT payable on these items. 3 STIs (in cash) are earned in the financial year to which they relate and are paid in August of the following financial year. 4 Includes any change in accruals for long service leave. 5 Mr Darren Rehn was appointed to the Executive Committee on 13 August 2014. 6 Ms Katherine Grace commenced employment on 21 August 2014. 7 Mr Tim Foster ceased employment on 31 October 2013. 8 Mr David Pitman ceased employment on 17 September 2013.
For
per
sona
l use
onl
y

Directors’ Report Year ended 30 June 2015
Stockland Financial Report 2015 — 41
Short-Term Incentives for Executives
STIs are directly linked to group, business unit and individual performance measures based on a Balanced Scorecard approach. The objectives for the Executive Committee are approved by the Managing Director, after review by the HR Committee. The actual performance against the objectives is assessed by the Managing Director and approved by the HR Committee. The STI awarded for FY15 is outlined below with the amounts paid as cash and/or awarded and deferred into Stockland securities shown in the last two columns.
A minimum of one-half of any STI awarded for the current Managing Director and one-third for Senior Executives is deferred into Stockland securities which will vest over two years, subject to continued service. The maximum STI that can be awarded to Executives is 125% of Target STI.
Target STI
(as % of Fixed Pay) STI awarded
(as % of Maximum) STI
paid in cash1 STI deferred into equity2
% % $ % $ %
Managing Director
Mark Steinert 100 100 750,000 40 1,125,000 60
Senior Executives
Stephen Bull 90 92 390,000 58 285,000 42
Katherine Grace3 80 92 229,407 58 165,593 42
Tiernan O’Rourke 80 92 453,333 58 326,667 42
Darren Rehn 90 100 420,000 53 368,000 47
Michael Rosmarin 80 90 320,000 59 220,000 41
John Schroder 90 91 630,000 58 450,000 42
Simon Shakesheff 80 94 320,000 57 245,000 43
Andrew Whitson 90 100 420,000 53 368,000 47
1 The portion of STI awarded for the FY15 performance year which is paid as cash. 2 The portion of STI awarded for FY15 performance that is deferred into Stockland securities which will vest over the next two years. 3 Calculations are based on Katherine Grace’s commencement of employment which was 21 August 2014.
For
per
sona
l use
onl
y

Directors’ Report Year ended 30 June 2015
Stockland Financial Report 2015 — 42
Equity Awards received by Executives
The table below outlines for the Managing Director and Senior Executives the number of vested and unvested equity units as at the end of FY15 as well as ordinary holdings held. This table is intended to reflect the direct exposure that each executive has to the Stockland security price. Further detail on current equity incentives then follows.
Employee Holding Balance
1 July 2014
Acquired/
(Disposed)or Granted
Equity Incentives
which lapsed
Equity Incentives
which vested
Balance30 June
2015
Executive Director
Mark Steinert Vested/Personal 287,120 25,079 – 144,021 456,220
Deferred STI Securities (unvested)
258,818 270,432 – (144,021) 385,229
PRP rights (unvested) 1,443,000 811,000 (528,000) – 1,726,000
Senior Executives
Stephen Bull Vested/Personal 8,451 – – 32,260 40,711
Deferred STI Securities (unvested)
56,070 68,510 – (32,260) 92,320
PRP rights (unvested) 325,456 211,000 (87,456) – 449,000
Katherine Grace Vested/Personal – – – – –
Deferred STI Securities (unvested)
– 39,806 – – 39,806
PRP rights (unvested) – 163,000 – – 163,000
Tiernan O’Rourke Vested/Personal – – – 23,549 23,549
Deferred STI Securities (unvested)
47,098 78,526 – (23,549) 102,075
PRP rights (unvested) 312,000 276,000 – – 588,000
Darren Rehn Vested/Personal – – – 74,830 74,830
Deferred STI Securities (unvested)
149,660 84,462 – (74,830) 159,292
PRP rights (unvested) 228,000 228,000 – – 456,000
Michael Rosmarin Vested/Personal 43,333 3,716 – 34,125 81,174
Deferred STI Securities (unvested)
55,809 52,886 – (34,125) 74,570
PRP rights (unvested) 452,500 195,000 (232,500) – 415,000
John Schroder Vested/Personal 299,359 21,584 – 67,945 388,888
Deferred STI Securities (unvested)
107,485 108,174 – (67,945) 147,714
PRP rights (unvested) 820,000 341,000 (435,000) – 726,000
Simon Shakesheff Vested/Personal 145,104 – – 73,486 218,590
Deferred STI Securities (unvested)
108,539 58,894 – (73,486) 93,947
PRP rights (unvested) 202,000 195,000 – – 397,000
Andrew Whitson Vested/Personal 5,634 – – 46,450 52,084
Deferred STI Securities (unvested)
87,266 88,462 – (46,450) 129,278
PRP rights (unvested) 342,690 228,000 (85,690) – 485,000
For
per
sona
l use
onl
y

Directors’ Report Year ended 30 June 2015
Stockland Financial Report 2015 — 43
Vesting profile of deferred STI
A minimum of one-third of any STI awarded for the KMP is deferred into Stockland securities which will vest over two years, subject to continued service. The vesting profile of current deferred STI awards and Fair Value (‘FV’) is shown below:
Deferred STI plan Securities
Granted1 Total FV deferred
FV expensed
FV expensed
in prior years
Vesting date2
Maximum value to be recognised
in future years
Executive Director
Mark Steinert FY13 – Tranche 2 29,225 $103,749 $41,500 $62,249 30/06/2015 –
FY14 – Tranche 1 114,796 $450,000 $225,000 $225,000 30/06/2015 –
FY14 – Tranche 2 114,796 $450,000 $150,000 $150,000 30/06/2016 $150,000
FY15 – Tranche 1 135,216 $562,500 $281,250 – 30/06/2016 $281,250
FY15 – Tranche 2 135,216 $562,500 $187,500 – 30/06/2017 $375,000
Senior Executives
Stephen Bull FY13 – Tranche 2 8,451 $30,000 $10,000 $20,000 30/06/2015 –
FY14 – Tranche 1 23,810 $93,333 $46,667 $46,666 30/06/2015 –
FY14 – Tranche 2 23,810 $93,333 $31,111 $31,111 30/06/2016 $31,111
FY15 – Tranche 1 34,225 $142,500 $71,250 – 30/06/2016 $71,250
FY15 – Tranche 2 34,225 $142,500 $47,500 – 30/06/2017 $95,000
Katherine Grace FY15 – Tranche 1 19,903 $82,797 $41,398 – 30/06/2016 $41,399
FY15 – Tranche 2 19,903 $82,797 $27,599 – 30/06/2017 $55,198
Tiernan O’Rourke FY14 – Tranche 1 23,549 $92,313 $46,157 $46,156 30/06/2015 –
FY14 – Tranche 2 23,549 $92,313 $30,771 $30,771 30/06/2016 $30,771
FY15 – Tranche 1 39,263 $163,333 $81,667 – 30/06/2016 $81,666
FY15 – Tranche 2 39,263 $163,333 $54,444 – 30/06/2017 $108,889
Darren Rehn FY14 – Tranche 1 74,830 $293,333 $146,667 $146,666 30/06/2015 –
FY14 – Tranche 2 74,830 $293,333 $97,778 $97,778 30/06/2016 $97,777
FY15 – Tranche 1 42,231 $184,000 $92,000 – 30/06/2016 $92,000
FY15 – Tranche 2 42,231 $184,000 $61,333 – 30/06/2017 $122,667
Michael Rosmarin FY13 – Tranche 2 12,442 $44,167 $14,722 $29,445 30/06/2015 –
FY14 – Tranche 1 21,684 $85,000 $42,500 $42,500 30/06/2015 –
FY14 – Tranche 2 21,684 $85,000 $28,333 $28,333 30/06/2016 $28,334
FY15 – Tranche 1 26,442 $110,000 $55,000 – 30/06/2016 $55,000
FY15 – Tranche 2 26,442 $110,000 $36,667 – 30/06/2017 $73,333
John Schroder FY13 – Tranche 2 28,404 $100,834 $67,222 $33,612 30/06/2015 –
FY14 – Tranche 1 39,541 $155,000 $77,500 $77,500 30/06/2015 –
FY14 – Tranche 2 39,541 $155,000 $51,667 $51,667 30/06/2016 $51,666
FY15 – Tranche 1 54,087 $225,000 $112,500 – 30/06/2016 $112,500
FY15 – Tranche 2 54,087 $225,000 $75,000 – 30/06/2017 $150,000
Simon Shakesheff FY14 – Sign On Tranche 2
52,626 $191,559 $95,780 $95,779 30/06/2015 –
FY14 – Sign On Tranche 3
14,193 $51,663 $17,221 $17,221 30/06/2016 $17,221
FY14 – Tranche 1 20,860 $81,772 $40,886 $40,886 30/06/2015 –
FY14 – Tranche 2 20,860 $81,772 $27,257 $27,257 30/06/2016 $27,258
FY15 – Tranche 1 29,447 $122,500 $61,250 – 30/06/2016 $61,250
FY15 – Tranche 2 29,447 $122,500 $40,833 – 30/06/2017 $81,667
Andrew Whitson FY13 – Tranche 2 5,634 $20,000 $6,667 $13,333 30/06/2015 –
FY14 – Tranche 1 40,816 $160,000 $80,000 $80,000 30/06/2015 –
FY14 – Tranche 2 40,816 $160,000 $53,333 $53,333 30/06/2016 $53,334
FY15 – Tranche 1 44,231 $184,000 $92,000 – 30/06/2016 $92,000
FY15 – Tranche 2 44,231 $184,000 $61,333 – 30/06/2017 $122,667
1 Securities granted are based on the 10 day volume weighted average price following 30 June of the applicable performance year. 2 Vesting dates refer to when service conditions are met. The Human Resources Committee then confirms vesting during July in the following year
considering whether clawback provisions will apply.
For
per
sona
l use
onl
y

Directors’ Report Year ended 30 June 2015
Stockland Financial Report 2015 — 44
Vesting profile of long-term incentives
Rights previously
granted
Rights granted
during the year
Grantdate
Fair value
per rightat grant
date1 Vesting
date2
No. Vested during
the year3
No. lapsed during
the year4
Maximum value to be recognised
in future years5
Executive Director Mark Steinert 264,000 – 14/01/2013 $1.20 30/06/2015 – 264,000 –
264,000 – 14/01/2013 $1.20 30/06/2016 – 264,000 –
457,500 – 31/08/2013 $2.08 30/06/2016 – – $317,200
457,500 – 31/08/2013 $2.08 30/06/2017 – – $475,800
– 405,500 31/08/2014 $1.84 30/06/2017 – – $497,413
– 405,500 31/08/2014 $1.84 30/06/2018 – – $559,590
Senior Executives Stephen Bull 43,728 – 31/08/2012 $1.20 30/06/2015 – 43,728 –
43,728 – 31/08/2012 $1.20 30/06/2016 – 43,728 –
119,000 – 31/08/2013 $1.45 30/06/2016 – – $57,517
119,000 – 31/08/2013 $1.45 30/06/2017 – – $86,275
– 105,500 31/08/2014 $1.67 30/06/2017 – – $117,457
– 105,500 31/08/2014 $1.67 30/06/2018 – – $132,139
Katherine Grace – 81,500 31/08/2014 $1.67 30/06/2017 – – $90,737
– 81,500 31/08/2014 $1.67 30/06/2018 – – $102,079
Tiernan O’Rourke 156,000 – 31/08/2013 $1.45 30/06/2016 – – $75,400
156,000 – 31/08/2013 $1.45 30/06/2017 – – $113,100
– 138,000 31/08/2014 $1.67 30/06/2017 – – $153,640
– 138,000 31/08/2014 $1.67 30/06/2018 – – $172,845
Darren Rehn 114,000 – 31/08/2013 $1.45 30/06/2016 – – $55,100
114,000 – 31/08/2013 $1.45 30/06/2017 – – $82,650
– 114,000 31/08/2014 $1.67 30/06/2017 – – $126,920
– 114,000 31/08/2014 $1.67 30/06/2018 – – $142,785
Michael Rosmarin 116,250 – 31/08/2012 $1.20 30/06/2015 – 116,250 –
116,250 – 31/08/2012 $1.20 30/06/2016 – 116,250 –
110,000 – 31/08/2013 $1.45 30/06/2016 – – $53,167
110,000 – 31/08/2013 $1.45 30/06/2017 – – $79,750
– 97,500 31/08/2014 $1.67 30/06/2017 – – $108,550
– 97,500 31/08/2014 $1.67 30/06/2018 – – $122,119
John Schroder 217,500 – 31/08/2012 $1.20 30/06/2015 – 217,500 –
217,500 – 31/08/2012 $1.20 30/06/2016 – 217,500 –
192,500 – 31/08/2013 $1.45 30/06/2016 – – $93,042
192,500 – 31/08/2013 $1.45 30/06/2017 – – $139,563
– 170,500 31/08/2014 $1.67 30/06/2017 – – $189,823
– 170,500 31/08/2014 $1.67 30/06/2018 – – $213,551
Simon Shakesheff 101,000 – 31/08/2013 $1.45 30/06/2016 – – $48,817
101,000 – 31/08/2013 $1.45 30/06/2017 – – $73,225
– 97,500 31/08/2014 $1.67 30/06/2017 – – $108,550
– 97,500 31/08/2014 $1.67 30/06/2018 – – $122,119
Andrew Whitson 42,845 – 31/08/2012 $1.20 30/06/2015 – 42,845 –
42,845 – 31/08/2012 $1.20 30/06/2016 – 42,845 –
128,500 – 31/08/2013 $1.45 30/06/2016 – – $62,108
128,500 – 31/08/2013 $1.45 30/06/2017 – – $93,163
– 114,000 31/08/2014 $1.67 30/06/2017 – – $126,920
– 114,000 31/08/2014 $1.67 30/06/2018 – – $142,785
1 Fair value is determined using a Monte Carlo simulation (TSR hurdle) and the Black-Scholes option pricing model (EPS hurdle). Details of the assumptions made in determining fair value are discussed in Note (D7c) of the financial statements.
2 Vesting date refers to the date at which the performance and service conditions are met. The rights convert to securities in July after the vesting date of 30 June. The securities remain in holding lock until the 10th anniversary of the grant date except at Board discretion.
3 There was no vesting reflecting no meeting of performance conditions (see page 38). The full balance of the original grant will lapse. 4 This includes the rights which lapsed due to not meeting performance conditions as well as rights which were forfeited due to termination
of employment. 5 The minimum future value of unvested securities is $Nil as future performance and service criteria may not be met.
For
per
sona
l use
onl
y

Directors’ Report Year ended 30 June 2015
Stockland Financial Report 2015 — 45
Remuneration Framework
Stockland’s remuneration structure has three components:
• fixed remuneration (‘Fixed Pay’);
• performance-based pay, or short-term incentives (‘STI’); and
• long-term incentives (‘LTI’).
Remuneration and variable pay mix
Variable pay (STI and LTI) is a key component of Executives’ remuneration packages. Stockland’s remuneration mix has historically had a greater proportion of the remuneration package ‘at risk’ than is typical of comparable companies. There was no change in FY15 to the total remuneration mix at target for Executives (as a percentage of Fixed Pay) or the weighting of equity-based awards (Deferred STI and LTI) to cash-based awards (Fixed Pay and Cash STI).
Managing Director 50% 50%
33% 17% 17% 33%
Business Unit CEOS 64% 36%
40% 24% 12% 24%
Other Senior Executives 64% 36%
42% 22% 11% 25%
LTI – Performance Rights Plan – Three year performance period. Portion of vesting is based on Stockland’s performance against performance hurdles for relative TSR and EPS growth.
Deferred STI – Stockland Securities – At least one-third of STI award for Managing Director and Senior Executives. Vesting over a maximum of two years following performance year.
STI paid as cash – Maximum of two-thirds of any STI award (less for outperformance) for Managing Director and Senior Executives. Paid in August following performance year.
Fixed Pay – Includes salary, superannuation and salary sacrifice items. Total Cash-based awards – STI paid as cash plus Fixed Pay. Total Equity-based award – Deferred STI plus LTI.
For
per
sona
l use
onl
y
Directors’ Report Year ended 30 June 2015
Stockland Financial Report 2015 — 46
Fixed Pay
Fixed Pay includes salary, superannuation and other employee benefits. Fixed Pay is set individually taking into account external benchmarking by independent firms.
How and when is Fixed Pay determined?
Fixed Pay at Stockland is reviewed annually with changes effective from 1 July.
When reviewing Fixed Pay a number of factors are considered including individuals’ skills and experience relevant to their roles, internal and external relativities and a prudent approach to cost.
We use external benchmarking surveys sourced by a number of organisations including Ernst & Young and AON Hewitt.
What comparator groups are used to benchmark Fixed Pay?
Fixed Pay for the Executives is reviewed against appropriate market benchmarks from the ASX50 group of companies and larger property firms.
Short-Term Incentives
Performance-based pay, or short-term incentive (‘STI’) rewards annual progress towards long-term objectives.
Who participates? All permanent Stockland employees employed at 30 June of the applicable financial year and who have greater than three months service are eligible.
What is the STI opportunity?
An individual’s STI opportunity is based on a percentage of Fixed Pay and varies by job level as defined by employees’ ‘job band’.
Job Band
Target STI(as percentage
of Fixed Pay)
Maximum STI(as percentage
of Fixed Pay)
Managing Director 100% 125%
Senior Executives 80% – 90% 100% – 112.5%
General Managers 45% 90%
Senior Managers 30% 60%
Other Employees 5% – 15% 30%
How is the size of the STI pool determined?
The size of the STI pool is based on the Board’s assessment of Stockland’s performance against its Balance Scorecard objectives as set out on page 37.
Is there a limit on the overall STI poolsize?
The Board expects that the STI pool will not exceed 7.5% of Stockland’s underlying profit and would only approve a STI pool up to that limit in a year of exceptional performance.
For
per
sona
l use
onl
y

Directors’ Report Year ended 30 June 2015
Stockland Financial Report 2015 — 47
When and how are individual STI outcomes decided?
Employees’ objectives are established at the start of the performance year by their manager with reference to Stockland’s Balanced Scorecard.
STI is awarded on an annual basis with any cash STI paid in August. STI outcomes are recommended by the employee’s manager after consideration of their performance against objectives and the size of the relevant year’s STI pool.
Recommendations are calibrated across businesses to ensure consistency and are subject to review and approval by the Executive Committee and Human Resources Committee, and for the Managing Director by the Board.
How is STI delivered? Percentage of STI awarded as Deferred STI
Job Band Up to and
including target STI Above target STI
Managing Director 50% 100%
Senior Executives 33% 100%
General Managers 33% 50%
Senior Managers 33% 33%
Stockland awards STI as a combination of cash and Stockland securities.
The balance of STI not deferred is awarded in cash. The Board retains discretion to award STI entirely in cash in certain circumstances.
How are the number of deferred STI securities determined?
The number of securities awarded is based on the dollar value of the deferred STI award divided by the volume weighted average price for Stockland securities for the 10 working days following 30 June for the applicable year of award.
When does the deferred STI vest?
Deferred STI vests in two equal annual tranches over two years (50% 12 months after award and 50% 24 months after award). Vesting is subject to continued employment with Stockland at the applicable vesting dates.
What happens if an Executive leaves Stockland?
Any unvested deferred STI will lapse. The Board retains discretion to review this in certain circumstances where termination is Stockland initiated, such as redundancy or mutually agreed resignation.
Do participants receive distributions/dividends on Stockland’s securities during the vesting period?
Yes. Unlike LTI awards, deferred STI awards are not subject to additional performance hurdles other than continued employment until vesting. Consistent with LTI awards, distributions are only payable once performance has been assessed against applicable objectives and/or hurdles.
Do clawback provisions apply to the deferred STI?
Yes, the Board may at its absolute discretion determine that some or all of an employee’s deferred STI award be forfeited if, in the Board’s reasonable opinion, adverse circumstances affecting the performance or reputation of the Company have come to their attention.
For
per
sona
l use
onl
y

Directors’ Report Year ended 30 June 2015
Stockland Financial Report 2015 — 48
Long-Term Incentives
Long-term incentive (‘LTI’) aligns Executive remuneration with securityholder returns and helps retain key talent.
Who participates? The Managing Director, Senior Executives, General Managers and Senior Managers participate in LTI. This group represents approximately 13% of all employees.
Annual participation is reviewed and approved by the Board.
What is the LTI opportunity?
An individual’s LTI participation is based on their Fixed Pay and Job Band as follows:
Job Band LTI participation (as % of Fixed Pay)
Managing Director 100%
Senior Executives 60%
General Managers 25%
Senior Managers 10%
How is LTI delivered? Employees are granted a number of rights in the Performance Rights Plan (‘PRP’). Each right is granted over an ordinary security at no cost to the employee.
Grants are made as either Hurdled Rights (subject to performance hurdles) or Restricted Rights (subject to service only). Grants to the Managing Director and Senior Executives are made fully as Hurdled Rights.
What are the performance hurdles?
Each Hurdled Rights grant is divided into two equal tranches, with the following performance hurdles:
• Stockland’s Total Securityholder Return (‘TSR’) measured against the ASX Australian Real Estate Investment Trusts (‘A-REIT’) Accumulation Index (excluding Stockland); and
• Growth in Stockland’s Underlying Earnings Per Security (‘EPS’) measured against a three year target set by the Board.
Restricted Rights which are granted to General and Senior Managers are subject to continued service only.
How are the number of rights determined for each LTI grant?
The number of rights granted is determined by dividing the dollar value of LTI participation by a grant value which includes assumptions for the expected vesting for the EPS growth target.
The grant value of the TSR component is determined based on an accounting valuation methodology using assumptions for expected life of the right, volatility, risk-free interest rate, market price of the Stockland securities at the time of grant and dividend yield.
The grant value for the EPS performance hurdle will be based on the volume weighted average price for Stockland securities over the 10 working days after 30 June 2015 and adjusted for the probability of vesting.
The valuation of both hurdles is calculated by an independent external consultant. For
per
sona
l use
onl
y

Directors’ Report Year ended 30 June 2015
Stockland Financial Report 2015 — 49
When does the LTI vest?
The number of rights which convert to Stockland securities is determined at the end of the three year performance period based on the Board’s assessment of actual performance against the applicable performance hurdles, as advised by an independent external consultant. Half of any rights which convert to securities at the end of the performance period then vest with the remaining securities being subject to an additional twelve month vesting requirement subject to continued employment with Stockland.
Vested securities are also subject to a seven year holding lock following vesting so that they may only be traded subject to approval of the Board or its delegated authority.
What happens if an Executive leaves Stockland?
Any unvested rights lapse. The Board retains discretion to review this in certain circumstances where termination is Stockland initiated such as redundancy or mutually agreed resignation.
Are rights which convert to securities purchased on-market?
At the Board’s discretion, securities which convert are either purchased on-market or issued.
No rights vested in FY15. However, in previous years where vesting did occur, securities have been purchased on-market to avoid dilution.
Do participants receive distributions or dividends on LTI grants?
Participants do not receive distributions on any rights during the three year performance period. If any rights convert to securities post the performance period, distributions will be paid as per other Stockland securities.
Is performance retested if performance hurdles are not exceeded?
There is no retesting with any rights which do not exceed the applicable performance hurdles lapsed at the end of the performance period.
Are there any minimum securityholding requirements for Executives?
Stockland requires that minimum securityholdings for the Managing Director (equal to two times Fixed Pay) and Executive Committee members (equal to one times Fixed Pay) must be maintained if the Executive wishes to sell any Stockland securities which were granted after 1 July 2010 other than to meet any tax obligations of the applicable securities.
Do clawback provisions apply to LTI?
The Board may at its absolute discretion determine that some or all of an employee’s LTI award be forfeited if, in the Board’s reasonable opinion, adverse circumstances affecting the performance or reputation of the Company have come to their attention.
How is performance assessed and rewarded against these hurdles?
The number of performance rights which convert to Stockland securities are based on the following schedule:
Relative TSR Growth over three years
Compound Annual Growth in EPS over three years
Proportion of TSR/EPS related rights vesting
Less than or equal to TSR Target
Less than or equal to EPS Target
0%
Greater than TSR Target Greater than EPS Target 50%
Up to 10% greater than TSR Target
Up to 5% greater than EPS Target
Straight-line between 50% and 100%
10% or more greater than TSR Target
5% (or more) greater than EPS Target
100%
For
per
sona
l use
onl
y

Directors’ Report Year ended 30 June 2015
Stockland Financial Report 2015 — 50
How is TSR defined and how is it calculated?
TSR is defined as security price growth plus the value of dividends and distributions reinvested on the ex-dividend date, adjusted for rights, bonus issues and any capital reconstructions and measured over the three year vesting period.
Stockland and A-REIT TSRs are measured using a volume weighted average price (‘VWAP’) for the 30 days before the start and up to and including the end of the three year measurement period.
Actual TSR for both Stockland and A-REIT is calculated by an independent external consultant.
Why was TSR chosen as a hurdle?
Relative TSR was chosen as a performance hurdle because it reflects Stockland’s success in generating returns for securityholders relative to its peers in both rising and falling markets. The A-REIT Accumulation Index was adopted as the most appropriate comparative group because it represents the listed property companies with whom Stockland competes for capital. Stockland is excluded from the comparator group because Stockland is a large part of the Index and comparison with itself distorts the result.
Why was Underlying EPS growth chosen as a hurdle?
EPS is used as it is a key indicator of Stockland’s financial performance. It is calculated using Stockland’s underlying profit which the Board believes is the appropriate way to view Stockland’s true operating performance from year to year.
How is the Underlying EPS Growth target set?
A three year compound annual growth rate for EPS is set and advised prospectively for the performance period. The Board believes this approach provides a transparent basis for communicating the EPS performance hurdle to both securityholders and LTI participants.
Other equity-based benefit programs
Are there any other equity-based benefits granted to employees?
Stockland also offers the Tax Exempt Employee Security Plan (‘$1,000 Plan’) to eligible permanent employees.
Annual participation is reviewed and approved by the Board.
Who participates? Permanent employees who have completed their probation period as at the time of grant excluding those who participate in the LTI plan. This group represents approximately 87% of all permanent employees.
What is the value of Tax Exempt Employee Security Plan?
Eligible employees receive up to $1,000 worth of Stockland securities. Securities may be either issued or purchased on-market, at the Board’s discretion. Stockland typically purchases securities on-market.
What are the other key terms and conditions of the plan?
Securities cannot be sold or transferred until the earlier of three years after allocation date or the time the participant ceases to be a Stockland employee.
Securities acquired under this plan are not subject to performance hurdles.
Dealing in securities
All employees and Directors are expected to behave responsibly and ethically when dealing with Stockland securities, as outlined in the Company’s Security Trading Policy (available on Stockland’s website).
Are there any restrictions on employees or Directors entering into hedging arrangements?
Yes. All employees and Directors are prohibited from entering into hedging arrangements in relation to Stockland securities. They cannot trade in financial products issued over Stockland securities by third parties or trade in any associated products which limit the economic risk of holding Stockland securities.
For
per
sona
l use
onl
y

Directors’ Report Year ended 30 June 2015
Stockland Financial Report 2015 — 51
Employment and termination arrangements for Managing Director and Senior Executives
Do any Senior Executives have fixed term contracts?
Senior Executives are on rolling contracts until notice is given by either Stockland or the Executive.
What notice period is required under these contracts?
Job Band Notice period
Managing Director Six months
Senior Executives Three months
In appropriate circumstances, payment may be made in lieu of notice.
Where the termination occurs as a result of misconduct or a serious or persistent breach of contract (termination for cause), Stockland may terminate employment immediately without notice or payment in lieu of notice.
Does the Executive receive a termination payment if Stockland initiates termination?
Where Stockland initiates termination, including mutually agreed resignation, the Managing Director or Senior Executive would receive a termination of twelve months Fixed Pay (including applicable notice).
Where termination is made for cause, the Executive is terminated with no payment in lieu of notice or any other termination payment.
On termination (other than for cause or non-mutual resignation) is the Executive eligible for STI?
STI is determined in line with the annual assessment process with any STI awarded.
On termination, how are unvested equity awards (LTI and Deferred STI) treated?
In cases of termination for cause or resignation, all unvested securities or rights lapse. In other circumstances, the Board has the discretion to adjust the vesting conditions. Typically, this discretion is applied as outlined below.
Death or Total and Permanent Disablement Full vesting of any unvested equity awards.
For termination other than for cause or resignation
For unvested Deferred STI, full vesting on 30 June in the year of termination.
For LTI, unvested Hurdled and/or Restricted rights are pro rated based on service to the date of termination. Any applicable prorated Hurdled rights remain subject to the applicable performance hurdles over the full performance period. Any applicable Restricted Rights vest on 30 June in the year of termination. Other unvested LTI awards forfeited.
For
per
sona
l use
onl
y
Directors’ Report Year ended 30 June 2015
Stockland Financial Report 2015 — 52
Non-Executive Director Remuneration
Remuneration policy
Stockland’s remuneration policy for Non-Executive Directors (‘NED’) aims to ensure Stockland can attract and retain suitably skilled, experienced and committed individuals to serve on the Board and remunerate them appropriately for their time and expertise and for their responsibilities and liabilities as public company Directors.
The HR Committee is responsible for reviewing and recommending to the Board any changes to Board Committees’ remuneration, taking into account the size and scope of Stockland’s activities, the responsibilities and liabilities of Directors and the demands placed upon them. In developing its recommendations, the HR Committee may take advice from external consultants.
With the exception of the Chairman, Non-Executive Directors receive additional fees for their work on Board Committees. Where a special purpose Board Committee is established by the Board, a special committee may be payable in line with fees paid for existing Board Committees. Non-Executive Directors do not receive performance-related remuneration or termination benefits other than accumulated superannuation.
The Board decided to continue to take a prudent approach to Board remuneration with no increases in base Board or Committee fees in FY15, the fourth consecutive year without an increase in base fees. Selected Committee fees were, however, increased in FY15 in line with market benchmarks and to reflect the increasing demands placed on directors who serve on committees over recent years.
In FY16, the Board has decided to increase the annual base fees for Non-Executive Directors by $5,000 to $175,000 (an increase of 2.9%). This is the first increase in NED base fees since July 2011. Board committee fees will remain unchanged in FY16 except for a reduction in the fees paid to the independent Director on the SCPL Board (reduced to $30,000 from $45,000) reflecting the reduced number of managed funds and workload expected in FY16. The annual fees paid for the Board and Board Committees are shown in the table below. The amounts shown are inclusive of applicable statutory superannuation contributions.
In all, the net increases in full year annualised director fees resulting from these changes in FY16 is $20,000 and the expected fees in FY16 will be well within the approved remuneration pool for NED as approved in 2007.
Board fees Stockland Board FY16 FY15
Chairman $500,000 $500,000
Non-Executive Director $175,000 $170,000
Stockland Board Committees
Audit Chair $40,000 $40,000
Member $20,000 $20,000
Risk Chair $35,000 $35,000
Member $17,500 $17,500
Financial Services Compliance Chair $10,900 $10,900
Member $6,540 $6,540
Human Resources Chair $35,000 $35,000
Member $17,500 $17,500
SCPL Board
Chairman $32,700 $32,700
Non-Executive Director $32,700 $32,700
Independent Non-Executive Director1 $30,000 $45,000
SCPL Board Committees
Audit Chair $15,260 $15,260
Member $8,720 $8,720
Financial Services Compliance Chair $10,900 $10,900
Member $6,540 $6,540
1 Independent Non-Executive Directors of SCPL are those who are not on the Stockland Board.
For
per
sona
l use
onl
y

Directors’ Report Year ended 30 June 2015
Stockland Financial Report 2015 — 53
Approved Remuneration pool
Total remuneration available to Non-Executive Directors is approved by securityholders and is currently $2,500,000 (including superannuation payments) as approved at the 2007 Annual General Meeting. No increase in the total fee pool is proposed for FY16.
Total fees of $1,933,927 (77% of the approved limit) were paid to Non-Executive Directors in FY15 which was higher than the total fees for FY14 and was due to the appointment of Mr Tom Pockett as an additional director to the Board during FY15 and was well below the NED remuneration pool approved by securityholders. The nature and amount of each element of remuneration for each Non-Executive Director of Stockland are detailed below:
Remuneration paid in FY15
Short-term Post-employment
Board and Committee
Fees
$
Non-monetary
benefits
$
Superannuation contributions
$
Total1
$
Non-Executive Directors
G Bradley (Chairman) 2015 495,304 – 4,696 500,000
2014 495,556 – 4,444 500,000
D Boyle 2015 183,429 – 4,696 188,125
2014 185,556 – 4,444 190,000
C Hewson 2015 204,679 – 4,696 209,375
2014 205,556 – 4,444 210,000
B Neil 2015 218,004 – 4,696 222,700
2014 218,256 – 4,444 222,700
T Pockett 2015 165,096 – 4,696 169,792
2014 – – – –
C Schwartz 2015 182,804 – 4,696 187,500
2014 178,056 – 4,444 182,500
P Scott 2015 204,679 – 4,696 209,375
2014 208,056 – 4,444 212,500
T Williamson 2015 242,364 – 4,696 247,060
2014 242,616 – 4,444 247,060
Total consolidated remuneration 2015 1,896,359 – 37,568 1,933,927
2014 1,733,652 – 31,108 1,764,760
1 The fees for each Director are paid on a total cost basis which includes any applicable compulsory superannuation. The amount of superannuation included in the total fees will vary depending on the timing of payments and in line with applicable legislation.
For
per
sona
l use
onl
y

Directors’ Report Year ended 30 June 2015
Stockland Financial Report 2015 — 54
Directors’ security holdings
The relevant interest of each Director in the securities issued by Stockland and related entities, as notified by the Directors to the ASX in accordance with S205G(1) of the Corporations Act 2001, at the date of this Report are as follows:
Stockland Securities
Units in SDOT No. 21
Units in SDRTNo. 12
Non-Executive Directors
G Bradley 2015 194,571 – –
2014 183,705 750,000 –
D Boyle 2015 61,169 – –
2014 61,169 – –
C Hewson 2015 19,482 – –
2014 18,395 – –
B Neil 2015 55,200 – –
2014 52,119 – –
T Pockett 2015 10,000 – –
2014 – – –
C Schwartz 2015 10,000 – –
2014 10,000 – –
P Scott 2015 30,415 – 20,000
2014 28,973 25,000 20,000
T Williamson 2015 101,178 – –
2014 95,528 100,000 –
Executive Director
M Steinert 2015 571,017 – –
2014 287,120 – –
Total 2015 1,053,032 – 20,000
2014 737,009 875,000 20,000
1 On 30 June 2015, Stockland Direct Office Trust No. 2 (‘SDOT No. 2’) was resolved to be wound up. 2 Stockland Direct Retail Trust No.1 (‘SDRT No.1’).
The above holdings of Executive Directors include vested securities acquired under LTI plans but do not include unvested performance rights or FY15 Deferred STI securities detailed on page 43 of this Report.
To underpin the alignment of Directors and securityholder interests, the Board believes that Directors should hold a meaningful number of Stockland securities. In August 2015 the Board revised its existing policy to increase the minimum number of securities each Non-Executive Director is required to acquire from 10,000 to 40,000 securities within a reasonable time of becoming a Director. The increased minimum roughly equates to one year’s base Board fees. All new directors will have a period of three years to comply with this policy and any existing directors that hold less than 40,000 securities will have until 30 June 2018 to comply. Stockland also has a policy regarding the minimum securityholdings for Senior Executives as set out in the Remuneration Report. Both these policies are intended to align the personal financial interests of Directors and Senior Executives with those of securityholders.
For
per
sona
l use
onl
y

Directors’ Report Year ended 30 June 2015
Stockland Financial Report 2015 — 55
Key Management Personnel
Non-Executive Directors
Mr Graham Bradley Chairman
Mr Duncan Boyle
Ms Carolyn Hewson
Mr Barry Neil
Mr Tom Pockett (appointed 1 September 2014)
Ms Carol Schwartz
Mr Peter Scott
Mr Terry Williamson
Executive Director
Mr Mark Steinert Managing Director and Chief Executive Officer (‘CEO’)
Senior Executives
Mr Stephen Bull Group Executive, CEO, Retirement Living
Ms Katherine Grace General Counsel & Company Secretary (commenced employment 13 August 2014)
Mr Tiernan O’Rourke Chief Financial Officer (‘CFO’)
Mr Darren Rehn Group Executive, Chief Investment Officer (appointed to Group Executive on 13 August 2014)
Mr Michael Rosmarin Group Executive, Chief Operating Officer
Mr John Schroder Group Executive, CEO, Commercial Property
Mr Simon Shakesheff Group Executive, Strategy & Stakeholder Relations
Mr Andrew Whitson Group Executive, CEO, Residential
For
per
sona
l use
onl
y

Directors’ Report Year ended 30 June 2015
Stockland Financial Report 2015 — 56
Indemnities and insurance of officers and auditor
Since the end of the prior year, Stockland has not indemnified or agreed to indemnify any person who is or has been an officer or an auditor of Stockland against any liability.
Since the end of the prior year, Stockland has paid insurance premiums in respect of Directors’ and Officers’ liability insurance contracts, for Directors, Executive Directors, Company Secretaries and Officers. Such insurance contracts insure against certain liabilities (subject to specified exclusions) for persons who are or have been Directors and Officers of Stockland.
Premiums are also paid for Fidelity insurance and Professional Indemnity insurance policies to cover certain risks for a broad range of employees, including Directors and Executives.
Non-audit services
During the financial year Stockland’s auditor, PwC provided certain other services to Stockland in addition to their statutory duties as auditor.
The Board has considered the non-audit services provided during the financial year by the auditor and is satisfied that the provision of those services is compatible with, and did not compromise, the auditor independence requirements of the Corporations Act 2001 for the following reasons:
• the non-audit services were for taxation, regulatory and assurance-related work closely linked to the group’s audit, and none of this work created any conflicts with the auditor’s statutory responsibilities;
• the Audit Committee resolved that the provision of non-audit services during the financial year by PwC as auditor is compatible with, and did not compromise, the auditor independence requirements of the Corporations Act 2001;
• the Board’s own review conducted in conjunction with the Audit Committee, having regard to the Board policy set out in this Report, concluded that it is satisfied the non-audit services did not impact the integrity and objectivity of the auditor; and
• The declaration of independence provided by PwC, as auditor of Stockland.
Details of the amounts paid to the auditor of Stockland, PwC, and its related practices for audit and non-audit services provided during the financial year are set out in Note (F9) of the accompanying financial statements.
Lead Auditor’s Independence Declaration under section 307C of the Corporations Act 2001 The external auditor’s independence declaration is set out on page 57 and forms part of the Directors’ Report for the year ended 30 June 2015.
Rounding off
Stockland is an entity of the kind referred to in ASIC Class Order 98/100 (as amended) and in accordance with that Class Order, amounts in the Financial Report and Directors’ Report have been rounded to the million dollars, unless otherwise stated.
Signed in accordance with a resolution of the Directors:
Graham Bradley Chairman
Mark Steinert Managing Director
Dated at Sydney, 19 August 2015
For
per
sona
l use
onl
y

LeSYe
Au
As lto th
a)
b)
Thisand
S J ParPric
ead Auection
ear ended
uditor’s
lead auditor fohe best of my
no contraven
no contraven
s declaration id the entities it
Hadfield tner
cewaterhouseC
uditor’s307C 30 June 2
Indepen
or the audit of knowledge an
ntions of the a
ntions of any a
s in respect ot controlled du
Coopers
s Indepof the
2015
ndence
Stockland Cond belief, there
uditor indepen
applicable cod
f Stockland Cring the period
penden Corpo
Declara
orporation Limie have been:
ndence require
e of professio
orporation Limd.
nce Deoration
ation
ited and Stock
ements of the
onal conduct in
mited and the e
eclaratns Act 2
kland Trust for
e Corporations
n relation to th
entities it cont
Stock
tion un2001
r the year end
s Act 2001 in re
he audit.
trolled during t
kland Financial
nder
ded 30 June 20
relation to the
the period and
Sydn19 August 20
l Report 2015 —
015, I declare
audit; and
d Stockland Tr
ey 15
— 57
that
rust
For
per
sona
l use
onl
y
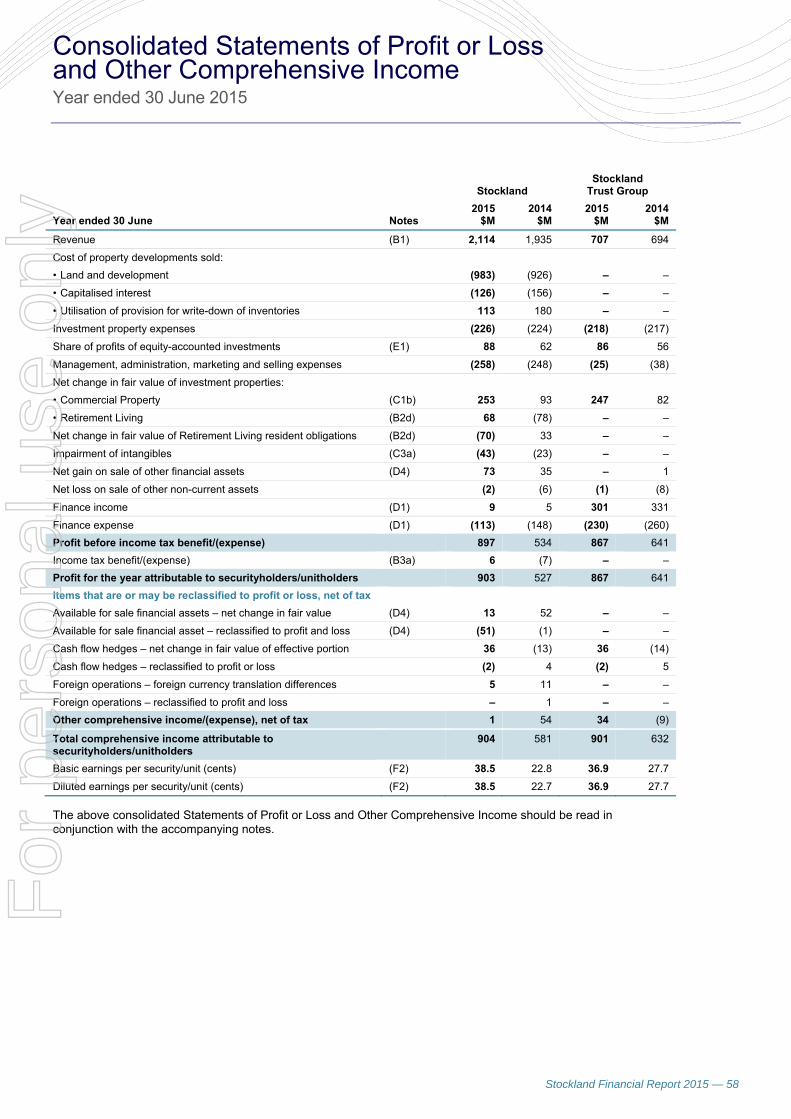
Stockland Financial Report 2015 — 58
Consolidated Statements of Profit or Loss and Other Comprehensive Income Year ended 30 June 2015
Stockland Stockland
Trust Group
Year ended 30 June Notes 2015
$M 2014
$M 2015
$M 2014
$M
Revenue (B1) 2,114 1,935 707 694
Cost of property developments sold:
• Land and development (983) (926) – –
• Capitalised interest (126) (156) – –
• Utilisation of provision for write-down of inventories 113 180 – –
Investment property expenses (226) (224) (218) (217)
Share of profits of equity-accounted investments (E1) 88 62 86 56
Management, administration, marketing and selling expenses (258) (248) (25) (38)
Net change in fair value of investment properties:
• Commercial Property (C1b) 253 93 247 82
• Retirement Living (B2d) 68 (78) – –
Net change in fair value of Retirement Living resident obligations (B2d) (70) 33 – –
Impairment of intangibles (C3a) (43) (23) – –
Net gain on sale of other financial assets (D4) 73 35 – 1
Net loss on sale of other non-current assets (2) (6) (1) (8)
Finance income (D1) 9 5 301 331
Finance expense (D1) (113) (148) (230) (260)
Profit before income tax benefit/(expense) 897 534 867 641
Income tax benefit/(expense) (B3a) 6 (7) – –
Profit for the year attributable to securityholders/unitholders 903 527 867 641
Items that are or may be reclassified to profit or loss, net of tax
Available for sale financial assets – net change in fair value (D4) 13 52 – –
Available for sale financial asset – reclassified to profit and loss (D4) (51) (1) – –
Cash flow hedges – net change in fair value of effective portion 36 (13) 36 (14)
Cash flow hedges – reclassified to profit or loss (2) 4 (2) 5
Foreign operations – foreign currency translation differences 5 11 – –
Foreign operations – reclassified to profit and loss – 1 – –
Other comprehensive income/(expense), net of tax 1 54 34 (9)
Total comprehensive income attributable to securityholders/unitholders
904 581 901 632
Basic earnings per security/unit (cents) (F2) 38.5 22.8 36.9 27.7
Diluted earnings per security/unit (cents) (F2) 38.5 22.7 36.9 27.7
The above consolidated Statements of Profit or Loss and Other Comprehensive Income should be read in conjunction with the accompanying notes.
For
per
sona
l use
onl
y

Stockland Financial Report 2015 — 59
Consolidated Balance Sheets As at 30 June 2015
Stockland Stockland Trust Group
As at 30 June Notes 2015
$M 2014
$M 2015
$M 2014
$M
Current assets
Cash and cash equivalents 0 170 231 89 131
Trade and other receivables (C2a) 103 119 33 34
Inventories (C1a) 549 570 – –
Other financial assets (D4) 2 508 2 7
Other assets 84 58 66 49
908 1,486 190 221
Non-current assets held for sale (C3b) 246 120 222 –
Total current assets 1,154 1,606 412 221
Non-current assets
Trade and other receivables (C2a) 92 77 3,435 3,709
Inventories (C1a) 1,991 1,746 – –
Investment properties – Commercial Property (C1b) 7,917 7,489 7,840 7,412
Investment properties – Retirement Living (C1c) 3,335 2,852 – –
Equity-accounted investments (E1) 518 650 506 608
Other financial assets (D4) 366 126 347 126
Property, plant and equipment 58 73 – –
Intangible assets (C3a) 98 125 – –
Deferred tax assets (B3b) 59 33 – –
Other assets 141 123 144 127
Total non-current assets 14,575 13,294 12,272 11,982
Total assets 15,729 14,900 12,684 12,203
Current liabilities Trade and other payables (C2b) 595 554 379 372
Interest-bearing loans and borrowings (D3) 286 356 286 356
Retirement Living resident obligations (C1c) 1,992 1,666 – –
Development provisions (C1a) 300 213 – –
Other financial liabilities (D4) 33 69 33 16
Other liabilities 87 95 54 64
Total current liabilities 3,293 2,953 752 808
Non-current liabilities
Trade and other payables (C2b) 33 53 – –
Interest-bearing loans and borrowings (D3) 2,997 2,762 2,997 2,762
Retirement Living resident obligations (C1c) 219 199 – –
Development provisions (C1a) 98 162 – –
Other financial liabilities (D4) 284 465 284 465
Other liabilities 18 8 – –
Total non-current liabilities 3,649 3,649 3,281 3,227
Total liabilities 6,942 6,602 4,033 4,035
Net assets 8,787 8,298 8,651 8,168
Securityholders’/unitholders’ funds
Issued capital (D7) 8,560 8,420 7,255 7,116
Reserves 84 73 68 26
Retained earnings/undistributed income 143 (195) 1,328 1,026
Total Securityholders’/unitholders’ funds 8,787 8,298 8,651 8,168
The above consolidated Balance Sheets should be read in conjunction with the accompanying notes.
For
per
sona
l use
onl
y

Stockland Financial Report 2015 — 60
Consolidated Statements of Changes in Equity Year ended 30 June 2015
Attributable to securityholders of Stockland
Notes
Issued capital
$M
Executive remuneration
reserve
$M
Cash flow
hedge reserve
$M
Fair value
reserve
$M
Foreign currency
translation reserve
$M
Retained earnings
$M
Total equity
$M
Balance as at 1 July 2013 8,348 19 11 – (17) (166) 8,195
Profit for the year – – – – – 527 527
Other comprehensive income, net of tax
– – (9) 51 12 – 54
Total comprehensive income – – (9) 51 12 527 581
Securities issued under Distribution/Dividend Reinvestment Plan
(D7a) 77 – – – – – 77
Acquisition of treasury securities
(D7b) (6) – – – – – (6)
Dividends and distributions (D8) – – – – – (556) (556)
Expense relating to rights and securities granted under securities plans, net of tax
(F7) – 7 – – – – 7
Securities vested under securities plans
(D7b) 1 (1) – – – – –
Total of other movements through reserves
72 6 – – – (556) (478)
Balance as at 30 June 2014 8,420 25 2 51 (5) (195) 8,298
Profit for the year – – – – – 903 903
Other comprehensive income, net of tax
– – 34 (38) 5 – 1
Total comprehensive income – – 34 (38) 5 903 904
Securities issued under Distribution/Dividend Reinvestment Plan
(D7a) 141 – – – – – 141
Acquisition of treasury securities
(D7b) (4) – – – – – (4)
Dividends and distributions (D8) – – – – – (565) (565)
Expense relating to rights and securities granted under securities plans, net of tax
(F7) – 13 – – – – 13
Securities vested under securities plans
(D7b) 3 (3) – – – – –
Total of other movements through reserves
140 10 – – – (565) (415)
Balance as at 30 June 2015 8,560 35 36 13 – 143 8,787
The above consolidated Statement of Changes in Equity should be read in conjunction with the accompanying notes.
For
per
sona
l use
onl
y

Consolidated Statements of Changes in Equity Year ended 30 June 2015
Stockland Financial Report 2015 — 61
Attributable to unitholders of the Stockland Trust Group
Notes
Issued capital
$M
Executive remuneration
reserve
$M
Cash flow hedge
reserve
$M
Undistributed income
$M
Total equity
$M
Balance as at 1 July 2013 7,554 17 11 941 8,523
Profit for the year – – – 641 641
Other comprehensive income – – (9) – (9)
Total comprehensive income – – (9) 641 632
Securities issued under Distribution/Dividend Reinvestment Plan
(D7a) 74 – – – 74
Acquisition of treasury securities (D7b) (6) – – – (6)
Distributions (D8) – – – (556) (556)
Expense relating to rights and securities granted under securities plans, net of tax
(F7) – 8 – – 8
Securities vested under securities plans
(D7b) 1 (1) – – –
Transfer of capital (D7a) (507) – – – (507)
Total of other movements through reserves
(438) 7 – (556) (987)
Balance as at 30 June 2014 7,116 24 2 1,026 8,168
Profit for the year – – – 867 867
Other comprehensive income – – 34 – 34
Total comprehensive income – – 34 867 901
Securities issued under Distribution/Dividend Reinvestment Plan
(D7a) 140 – – – 140
Acquisition of treasury securities (D7b) (4) – – – (4)
Distributions (D8) – – – (565) (565)
Expense relating to rights and securities granted under securities plans, net of tax
(F7) – 11 – – 11
Securities vested under securities plans
(D7b) 3 (3) – – –
Total of other movements through reserves
139 8 – (565) (418)
Balance as at 30 June 2015 7,255 32 36 1,328 8,651
The above consolidated Statement of Changes in Equity should be read in conjunction with the accompanying notes.
For
per
sona
l use
onl
y

Stockland Financial Report 2015 — 62
Consolidated Cash Flow Statements Year ended 30 June 2015
Stockland Stockland Trust Group
Year ended 30 June Notes 2015$M
2014$M
2015 $M
2014$M
Cash flows from operating activities
Cash receipts in the course of operations (including GST) 2,243 2,052 797 788
Cash payments in the course of operations (including GST) (1,457) (1,140) (395) (359)
Payments for land (380) (160) – –
Distributions received from equity-accounted investments 38 31 34 30
Distributions received from managed funds 1 – 1 –
Receipts from Retirement Living residents 299 292 – –
Payments to Retirement Living residents, net of Deferred Management Fees (‘DMF’)
(152) (131) – –
Interest received 7 5 301 331
Interest paid (198) (197) (198) (196)
Net cash flow from operating activities (F3) 401 752 540 594
Cash flows from investing activities
Proceeds from sale of investment properties 322 321 233 277
Payments for and development of investment properties
Commercial Property (386) (512) (399) (488)
Retirement Living (199) (86) – –
Payments for plant and equipment and software (15) (19) – –
Proceeds from sale/capital returns from investments 508 139 1 14
Payments for investments, including equity-accounted investments
(63) (539) (65) (75)
Distributions received from other entities 17 3 – –
Net cash flow from / (used in) investing activities 184 (693) (230) (272)
Cash flows from financing activities
Reallocation of capital (D7a) – – – (507)
Payment for securities/units under employee securities plans
(D7b) (4) (6) (4) (6)
Proceeds from borrowings 4,118 4,380 4,118 4,380
Repayment of borrowings (4,300) (3,697) (4,300) (3,697)
Loans to related entities – – 292 236
Payments for termination and restructuring of derivatives (D1) (41) (257) (39) (258)
Dividends and distributions paid (excluding DRP allocation) (419) (475) (419) (477)
Net cash flow used in financing activities (646) (55) (352) (329)
Net increase/(decrease) in cash and cash equivalents (61) 4 (42) (7)
Cash and cash equivalents at the beginning of the year 231 227 131 138
Cash and cash equivalents at the end of the year 170 231 89 131
The above consolidated Cash Flow Statements should be read in conjunction with the accompanying notes.
For
per
sona
l use
onl
y

Stockland Financial Report 2015 — 63
Consolidated Notes Year ended 30 June 2015
(A) Basis of Preparation 64
(B) Results for the year 66
(B1) Revenue 66
(B2) Operating segments 67
(B3) Taxation 72
(C) Operating assets and liabilities 76
(C1) Real Estate assets and liabilities 76
(C2) Financial assets and liabilities 88
(C3) Other non-financial assets and liabilities 89
(D) Capital Structure and Financing Costs 92
(D1) Net financing costs 92
(D2) Cash and cash equivalents 94
(D3) Interest-bearing loans and borrowings 94
(D4) Other financial assets and liabilities 97
(D5) Fair value hierarchy 102
(D6) Financial risk factors 104
(D7) Issued capital 109
(D8) Dividends and distributions 113
(E) Group Structure 114
(E1) Equity-accounted investments 114
(E2) Investments in unconsolidated structured entities 116
(E3) Controlled entities 116
(E4) Deed of Cross Guarantee 119
(E5) Parent entity disclosures 120
(F) Other items 122
(F1) Accounting Policies 122
(F2) Earnings per security/unit 124
(F3) Notes to Cash Flow Statements 125
(F4) Contingent liabilities 126
(F5) Commitments 126
(F6) Related party disclosures 126
(F7) Personnel expenses 128
(F8) Key Management Personnel disclosures 129
(F9) Auditor’s remuneration 129
(F10) Events subsequent to the end of the year 129
For
per
sona
l use
onl
y

Consolidated Notes Year ended 30 June 2015
Stockland Financial Report 2015 — 64
(A) Basis of Preparation
IN THIS SECTION
This section sets out the basis upon which the Group’s financial statements are prepared as a whole. Specific accounting policies are described in the note to which they relate.
Stockland represents the combination or stapling of Stockland Corporation Limited (‘the Company’) and its controlled entities (‘the Stockland Corporation Group’) and Stockland Trust (‘the Trust’) and its controlled entities (‘the Stockland Trust Group’). Both the Company and the Trust (collectively referred to as ‘Stockland’ or ‘the Group’) are for profit entities that were both incorporated, formed and domiciled in Australia.
The constitutions of the Company and the Trust ensure that, for so long as the two entities remain jointly quoted, the number of shares in the Company and the number of units in the Trust shall be equal and that the shareholders and unitholders be identical. Both the Company and the Responsible Entity of the Trust must at all times act in the best interest of Stockland. The stapling arrangement will cease upon the earliest of either the winding up of the Company or the Trust or either entity terminating the stapling arrangement.
The financial statements as at and for the year ended 30 June 2015 were authorised for issue by the Directors on 19 August 2015.
(i) Statement of compliance The financial statements are general purpose financial reports which have been prepared in accordance with Australian Accounting Standards (‘AASBs’) (including Australian Interpretations adopted by the Australian Accounting Standards Board (‘AASB’)) and the Corporations Act 2001. The financial statements of Stockland and the Stockland Trust Group comply with the International Financial Reporting Standards (‘IFRSs’) and interpretations adopted by the International Accounting Standard Board (‘IASB’).
(ii) Basis of preparation As permitted by Class Order 13/1050, issued by the Australian Securities and Investments Commission (‘ASIC’), these financial statements are combined financial statements that present the financial statements and accompanying notes of both Stockland and the Stockland Trust Group.
The financial statements are presented in Australian dollars, which is the Company’s and Trust’s functional currency and the functional currency of the majority of Stockland and the Stockland Trust Group.
The financial statements have been prepared on a going concern basis, using historical cost conventions except for:
• investment properties, derivative financial instruments, certain financial assets and liabilities which are stated at their fair value; and
• non-current assets classified as held for sale which are stated at the lower of carrying amount and fair value less costs to sell.
In accordance with ASIC Class Order 98/100, amounts in the Financial Report have been rounded to the nearest million dollars, unless otherwise stated.
Certain comparative amounts have been restated to conform with the current year’s presentation.
Change in presentation of software
In the current year, software with a carrying value of $39 million was reclassified from property, plant and equipment to intangibles to better reflect the nature of these assets. The adjustment resulted in an increase in intangibles due to the inclusion of this software, as disclosed in note (C3a), with a corresponding reduction in property, plant and equipment.
Comparative disclosures have been restated to ensure consistency between the periods.
The change did not result in any other changes to accounting policies for software.
For
per
sona
l use
onl
y

Consolidated Notes Year ended 30 June 2015
Stockland Financial Report 2015 — 65
(A) BASIS OF PREPARATION (CONTINUED)
Stockland and Stockland Trust Group net current asset deficiency position
Stockland and the Stockland Trust Group have a net current asset deficiency at 30 June 2015.
Based on the profits and net operating cash inflows in the period and forecast for the next 12 months Stockland and the Stockland Trust Group will be able to pay their debts as and when they become due and payable. Undrawn bank facilities of $640 million (refer to Note (D3c)) are also available should they need to be drawn down.
The deficiency in the Stockland Trust Group primarily arises due to the requirement under Accounting Standards to classify the ‘at call’ intercompany loan receivable from the Company or Stockland Corporation Group as a non-current asset. In relation to Stockland, a number of liabilities are classified as current under Accounting Standards that are not expected to actually result in net cash outflows within the next 12 months (in particular Retirement Living Resident Obligations). Similarly, some assets held as non-current will generate cash income in the next 12 months (including Retirement Living DMF included within Investment Properties – Retirement Living, development work in progress and vacant stock).
In addition, current inventory is held on the balance sheet at the lower of cost and net realisable value, whereas this is expected to generate cash inflows above the carrying value.
In relation to Retirement Living resident obligations for existing residents (June 2015: $1,989 million; June 2014: $1,661 million), in the short term 8% of residents are estimated to leave each year and therefore it is not expected that the majority of the obligations to residents will fall due within one year. In the vast majority of transactions involving the turnover of units the resident obligations will be repaid from receipts from incoming residents. However, resident obligations are classified as current under the definitions in the Accounting Standards as there is no unconditional contractual right to defer settlement for at least 12 months (residents may give notice of their intention to vacate their unit with immediate effect). In contrast, the corresponding Retirement Living assets are classified as non-current under Accounting Standards as the majority are not expected to be realised within 12 months.
(iii) Critical accounting estimates and judgements Stockland makes estimates and assumptions concerning the future. The estimates and assumptions that have a significant risk of causing a material adjustment to the carrying amount of assets and liabilities within the next financial year are discussed below.
Estimates and judgements are continually evaluated and are based on historical experience as adjusted for current market conditions and other factors, including expectations of future events that are believed to be reasonable under the circumstances.
Assumptions underlying management’s estimates of fair value and recoverability can be found in the following notes to the financial statements:
Area of Estimation Note
Tax losses – assumptions underlying recoverability (B3b)
Inventories – assumptions underlying net realisable value (C1a)
Commercial properties – assumptions underlying fair value (C1b)
Retirement Living – assumptions underlying fair value (C1c)
Goodwill – assumptions underlying recoverable value (C3a)
Software – assumptions underlying recoverable value (C3a)
Fair value of investment in other entities – assumptions underlying fair value (D4)
Fair value of derivatives – assumptions underlying fair value (D4)
Valuation of share based payments – assumptions underlying fair value (D7c)
For
per
sona
l use
onl
y

Consolidated Notes Year ended 30 June 2015
Stockland Financial Report 2015 — 66
(B) Results for the year
IN THIS SECTION
This section explains the results and performance of Stockland and the Stockland Trust Group.
This section provides additional information about those individual line items in the financial statements that the Directors consider most relevant in the context of the operations of the entity, including:
(a) Accounting policies that are relevant for understanding the items recognised in the financial statements; and
(b) Analysis of the Group’s result for the year by reference to key areas, including: revenue, results by operating segment and income tax.
(B1) Revenue Revenue is recognised at the fair value of the consideration received or receivable, net of the amount of goods and services tax (‘GST’) levied.
Property development sales
Revenue from land and property sales is recognised when Stockland has transferred significant risks and rewards of ownership to the buyer and the amount of revenue can be reliably measured.
Rent from investment properties
Rent is recognised on a straight-line basis over the lease term, net of any incentives.
Rent from investment properties includes $5 million (2014: $9 million) contingent rent billed to tenants. Contingent rent represents 1% (2014: 1%) of gross lease income.
Deferred Management Fees (‘DMF’)
DMF are recognised over the tenancy period and includes both fixed fees recognised on a straight line basis and contingent fees recognised when earned.
DMF calculated on the entry price of the unit are recognised each period, however fees are only realised in cash at the end of the residents tenure.
DMF calculated on the exit price of the unit are recognised and realised in cash at the end of the resident’s tenure.
Accounting for DMF is further explained in Note (B2d).
Dividends and distributions
Revenue from dividends and distributions are recognised in profit or loss on the date they are declared by the relevant entity.
Revenue recognised during the year is set out below:
Stockland Stockland
Trust Group
2015$M
2014$M
2015 $M
2014$M
Property development sales 1,288 1,109 – –
Rent from investment properties 698 679 698 681
Deferred Management Fees from Retirement Living 94 70 – –
Dividend and distribution income 5 19 2 –
Other revenue 29 58 7 13
Total revenue 2,114 1,935 707 694
For
per
sona
l use
onl
y

Consolidated Notes Year ended 30 June 2015
Stockland Financial Report 2015 — 67
(B2) Operating segments
KEEPING IT SIMPLE…
This section shows a reconciliation from underlying profit to the Group’s statutory profit. Underlying profit remains the Group’s key profit indicator. This reflects the way the business is managed and how the Directors and Executive Committee assess the performance of the Group.
Both underlying profit and segment operating profit are presented on a proportionate consolidation basis, whereby earnings from equity accounted investments are grossed up and included in segment EBIT based on Stockland’s proportionate ownership interest.
Operating segments are reported in a manner that is consistent with the internal reporting provided to the Managing Director and the Executive Committee, whom are the chief operating decision makers (‘CODM’).
Stockland has four reportable segments, as listed below.
• Residential – delivers a range of master planned and mixed use residential communities in growth areas;
• Retirement Living – designs, develops and manages communities for retirees;
• Commercial Property – invests in, develops and manages retail, office and logistic & business park properties;
• Other – includes the results from the remaining assets in the UK, the former apartments and aged care businesses, dividends/distributions from strategic investments and other items which are not able to be classified within any of the other defined segments.
The Stockland Trust Group has one reportable segment in which it operates, being Commercial Property, therefore no separate segment note has been prepared.
There is no customer who accounts for more than 10% of the gross revenues of Stockland or the Stockland Trust Group.
(B2a) Underlying profit
The following table shows the contribution to underlying profit by each reportable segment:
Stockland
Year ended 30 June 2015
Residential
$M
Retirement Living
$M
Commercial Property
$M
Other
$M
Consolidated
$M
External segment revenue 1,239 732 715 60 2,087
Total external segment revenue 1,239 73 715 60 2,087
Segment EBIT 290 54 517 4 865
Interest expense in cost of sales (124) (6) – (2) (132)
Share of interest expense in joint ventures – – (4) – (4)
Segment operating profit1 166 48 513 2 729
Interest income 8
Interest expense (73)
Unallocated corporate and other expenses (60)
Underlying profit before tax benefit 604
Income tax benefit on underlying profit 4
Underlying profit after tax benefit 608
1 Included within segment operating profits are the following:
• Straight line rent adjustments – – 8 – 8
• Amortisation of lease incentives – – (61) – (61)
• Share of profits of equity-accounted investments (excluding fair value gains/(losses))
2 – 42 – 44
Total share of profits of equity-accounted investments (including statutory adjustments)
2 – 86 – 88
For
per
sona
l use
onl
y

Consolidated Notes Year ended 30 June 2015
Stockland Financial Report 2015 — 68
(B2A) UNDERLYING PROFIT (CONTINUED)
Year ended 30 June 2014
Residential
$M
Retirement Living
$M
Commercial Property
$M
Other
$M
Consolidated
$M
External segment revenue 1,040 592 696 129 1,924
Total external segment revenue 1,040 59 696 129 1,924
Segment EBIT 244 45 497 34 820
Interest expense in cost of sales (149) (5) – (7) (161)
Share of interest expense in joint ventures – – (5) – (5)
Segment operating profit1 95 40 492 27 654
Interest income 5
Interest expense (79)
Unallocated corporate other expenses (52)
Underlying profit before tax benefit 528
Income tax benefit on underlying profit 27
Underlying profit after tax benefit 555 1 Included within segment operating profits are the following:
• Straight line rent adjustments – – 7 – 7
• Amortisation of lease incentives – – (52) – (52)
• Share of profits of equity-accounted investments (excluding fair value gains/(losses))
1 – 36 – 37
Total share of profits of equity-accounted investments (including statutory adjustments)
1 – 61 – 62
2 $27 million (2014: $11 million) of unrealised DMF revenue is excluded from segment revenues. Refer to the reconciliation of underlying profit to statutory profit below.
(B2b) Reconciliation of underlying profit to statutory profit
Underlying profit is determined following the principles of Australian Institute of Company Directors (‘AICD’) and the Financial Services Institute of Australasia (‘Finsia’) for reporting underlying profit having regard to the guidance from ASIC’s RG 230 Disclosing Non-IFRS Financial Information. These principles include providing a clear reconciliation between statutory profit and underlying profit in the Directors’ Report and financial statements, including both positive and negative adjustments and taking into consideration property industry practices. The Group has reported consistently on this basis for more than seven years to help investors understand the performance of the business.
Underlying profit is a non-IFRS measure that is designed to present, in the opinion of the CODM, the results from ongoing operating activities of Stockland in a way that appropriately reflects the Group’s underlying performance. Underlying profit is the basis on which distributions and dividends are determined and reflects the way the business is managed and how the CODM assess the performance of the Group. It excludes costs of a capital nature and profit or loss made from realised transactions occurring infrequently and those that are outside the course of Stockland’s core ongoing business activities.
Underlying profit excludes items such as unrealised fair value gains/losses (such as revaluing derivatives, financial instruments and investment properties) and unrealised provision gains/losses. These items are required to be included in statutory profit in accordance with Accounting Standards.
For
per
sona
l use
onl
y

Consolidated Notes Year ended 30 June 2015
Stockland Financial Report 2015 — 69
(B2B) RECONCILIATION OF UNDERLYING PROFIT TO STATUTORY PROFIT (CONTINUED)
Stockland 2015 2014
Year ended 30 June Note Underlying profit
$M
Statutory adjustments
$M
Statutory profit
$M
Underlying profit
$M
Statutory adjustments
$M
Statutory profit
$M
Revenue A 2,087 27 2,114 1,924 11 1,935
Cost of property developments sold:
• Land and development (983) – (983) (926) – (926)
• Capitalised interest (126) – (126) (156) – (156)
• Utilisation of provision for write-down of inventories
113 – 113 180 – 180
Investment property expenses (226) (226) (224) – (224)
Share of profits of equity-accounted investments
B 44 44 88 36 26 62
Management, administration, marketing and selling expenses
(258) – (258) (248) – (248)
Net change in fair value of investment properties:
• Commercial Property B – 253 253 – 93 93
• Retirement Living B 18 50 68 16 (94) (78)
Net change in fair value of Retirement Living resident obligations
B – (70) (70) – 33 33
Impairment of intangibles C – (43) (43) – (23) (23)
Net gain on sale of other financial assets
D – 73 73 – 35 35
Net loss on sale of other non-current assets
E – (2) (2) – (6) (6)
Finance income 8 1 9 5 – 5
Finance expense F (73) (40) (113) (79) (69) (148)
Profit before income tax benefit 604 293 897 528 6 534
Income tax benefit/(expense) 4 2 6 27 (34) (7)
Profit for the year attributable to securityholders
608 295 903 555 (28) 527
For
per
sona
l use
onl
y

Consolidated Notes Year ended 30 June 2015
Stockland Financial Report 2015 — 70
(B2B) RECONCILIATION OF UNDERLYING PROFIT TO STATUTORY PROFIT (CONTINUED)
Stockland Trust Group 2015 2014
Year ended 30 June Note Underlying profit
$M
Statutory adjustments
$M
Statutory profit
$M
Underlying profit
$M
Statutory adjustments
$M
Statutory profit
$M
Revenue 707 – 707 694 – 694
Investment property expenses (218) – (218) (217) – (217)
Share of profits of equity-accounted investments
B 41 45 86 36 20 56
Management, administration, marketing and selling expenses
(25) – (25) (38) – (38)
Net change in fair value of Commercial Property
B – 247 247 – 82 82
Net gain on sale of other financial assets
– – – – 1 1
Net loss on sale of other non-current assets
E – (1) (1) – (8) (8)
Finance income 301 – 301 331 – 331
Finance expense F (190) (40) (230) (192) (68) (260)
Profit before income tax benefit 616 251 867 614 27 641
Income tax benefit/(expense) – – – – – –
Profit for the year attributable to securityholders
616 251 867 614 27 641
Explanation of statutory adjustments A DMF revenue is excluded from underlying profit until it is realised in cash. Refer to Note (B2d). B Underlying profit excludes the net change in fair value of investment properties for properties held by Stockland both directly and indirectly through
equity-accounted investments. Similarly, the net change in fair value of Retirement Living Resident Obligations are excluded from underlying profit. Refer to Section C for further information on fair value adjustments for the Residential (C1a), Commercial Properties (C1b) and Retirement Living (C1c) businesses.
C Underlying profit excludes impairment of intangibles, which comprise write-downs to goodwill (2015: $18 million; 2014: $23 million) and software ($25 million; 2014: nil). Refer to Note (C3a).
D Net gain on sale of other financial assets for the year ended 30 June 2015 includes the realised profit on the sale of securities in Australand, net of transaction costs. For the year ended 30 June 2014, the gain primarily comprised the realised profit on the sale of securities in AVEO Group (formerly FKP Property Group).
E Net loss on sale of other non-current assets predominantly relate to the loss on the sale of investment properties. F Net change in fair value of financial instruments and foreign exchange movements, classified as finance expense, are excluded from underlying
profit. Refer to Note (D1).
(B2c) Balance Sheet by Operating Segment
Stockland
30 June 2015 Residential
$M
Retirement Living
$M
Commercial Property
$M Other
$M Unallocated
$M Consolidated
$M
Assets
Cash – – – – 170 170
Real estate related assets1 2,552 3,335 8,902 7 40 14,836
Intangibles – 76 – – 22 98
Other financial assets – – – – 368 368
Other assets 120 18 67 – 52 257
Total assets 2,672 3,429 8,969 7 652 15,729
Liabilities
Interest-bearing liabilities – – – – 3,283 3,283
Retirement Living resident obligations
– 2,211 – – – 2,211
Other financial liabilities – – – – 317 317
Other liabilities 569 18 121 15 408 1,131
Total liabilities 569 2,229 121 15 4,008 6,942
Net assets/(liabilities) 2,103 1,200 8,848 (8) (3,356) 8,787
Other items
Acquisition of investment properties – 81 72 – – 153
For
per
sona
l use
onl
y

Consolidated Notes Year ended 30 June 2015
Stockland Financial Report 2015 — 71
(B2C) BALANCE SHEET BY OPERATING SEGMENTS (CONTINUED)
30 June 2014 Residential
$M
Retirement Living
$M
Commercial Property
$M Other
$M Unallocated
$M Consolidated
$M
Assets Cash – – – – 231 231
Real estate related assets1 2,325 2,860 8,321 127 42 13,675
Intangibles – 94 – – 31 125
Other financial assets – – – – 634 634
Other assets 135 2 71 2 25 235
Total assets 2,460 2,956 8,392 129 963 14,900
Liabilities
Interest-bearing liabilities – – – – 3,118 3,118
Retirement Living resident obligations
– 1,865 – – – 1,865
Other financial liabilities – – – – 534 534
Other liabilities 528 17 296 63 181 1,085
Total liabilities 528 1,882 296 63 3,833 6,602
Net assets/(liabilities) 1,932 1,074 8,096 66 (2,870) 8,298
Other items Acquisition of investment properties – – 224 – – 224
1 Includes non-current assets held for sale, inventory, investment properties, equity-accounted investments and certain other assets.
(B2d) Retirement Living segment result
KEEPING IT SIMPLE …
As accounting for Retirement Living assets is not straight forward we have included a section specifically in relation to it.
Retirement Living residents generally lend Stockland an amount equivalent to the value of the unit in exchange for a lease to live in the unit and access to community facilities. This loan is recorded as a resident obligation liability.
During the resident’s tenure, Stockland earns Deferred Management Fees (‘DMF’) which are calculated based on the individual resident contract (‘DMF contract’). There are various contractual arrangements, however a standard contract will typically provide for DMF to be earned at a rate of 8% in the first year and 3% in subsequent years, capped at 35%, with Stockland and the resident sharing in any net capital gain when the unit is re-leased to the next resident. The DMF on an individual unit covers, to a significant extent, the resident’s share of up-front capital costs of building the common infrastructure of the village, which includes amenities such as a pool, bowling green and community hall, and allow the resident to pay for these at the end of their tenancy, instead of the start. The DMF revenue is included in the Retirement Living segment results when Stockland receives the accumulated DMF in cash when a resident leaves and a new resident enters the unit.
The Retirement Living segment result also includes the development margin realised on settlement of newly developed units (‘settled development margin’). This settled development margin represents the unit price realised on first lease less the cost of development. Refer to Note (C1c) for further information on the fair value measurement and valuation technique used for Retirement Living Investment Properties and Resident Obligations.
For
per
sona
l use
onl
y

Consolidated Notes Year ended 30 June 2015
Stockland Financial Report 2015 — 72
(B2D) RETIREMENT LIVING SEGMENT RESULT (CONTINUED)
Reconciliation of Retirement Living statutory profit to segment results
2015 2014
Year ended 30 June Note Underlying profit
$M
Statutory adjustments
$M
Statutory profit
$M
Underlying profit
$M
Statutory adjustments
$M
Statutory profit
$M
Total realised revenue 67 – 67 59 – 59
DMF base fees earned, unrealised
A – 27 27 – 11 11
DMF Revenue 67 27 94 59 11 70
Net change in fair value of investment properties:
• settled development margin 18 – 18 16 – 16
• operating villages and villages under development
B – 50 50 – (94) (94)
Total net change in fair value of investment properties
18 50 68 16 (94) (78)
Net change in fair value of Retirement Living resident obligations
B – (70) (70) – 33 33
Impairment of intangibles C – (18) (18) – (23) (23)
Management, administration, marketing and selling expenses
(33) – (33) (29) – (29)
Other income/(expenses) (4) – (4) (6) – (6)
Retirement Living profit/(loss) 48 (11) 37 40 (73) (33)
Explanation of statutory adjustments A DMF base fees earned comprise DMF which is calculated on the entry price of a unit. For statutory profit these fees are accrued progressively as
Stockland becomes entitled to the fee but is not recognised in underlying profit until the DMF accrued is realised in cash. The prior year was restated by $4 million to correct the presentation of accrued DMF on entry price contracts not earned in the prior year.
B Underlying profit excludes the net change in fair value for both investment properties and Retirement Living Resident Obligations. Refer to Note (C1c).
C Underlying profit excludes the write-down of goodwill related to the Retirement Living business (2015: $18 million; 2014: $23 million). Refer to Note (C3a).
(B3) Taxation
KEEPING IT SIMPLE…
This note sets out the Group tax accounting policies and provides an analysis of the Group’s income tax expense/benefit and deferred tax balances, including a reconciliation of tax expense to accounting profit.
Income tax is accounted for using the balance sheet method. Accounting income is not always the same as taxable income, creating timing differences. These differences usually reverse over time. Until they reverse a deferred asset or liability must be recognised on the balance sheet. This is known as the balance sheet method.
Stockland
Accounting for income tax
Income tax expense is recognised in profit or loss except to the extent that it relates to items recognised in other comprehensive income or directly in equity. Income tax expense is calculated at the applicable corporate tax rate of 30%, and is comprised of current and deferred tax expense.
Current tax expense represents the expense relating to the expected taxable income at the applicable tax rate for the financial year. Deferred tax expense represents the tax expense in respect of the future tax consequences of recovering or settling the carrying amount of an asset or liability.
For
per
sona
l use
onl
y

Consolidated Notes Year ended 30 June 2015
Stockland Financial Report 2015 — 73
(B3) TAXATION (CONTINUED)
Tax consolidation
The Company and its wholly owned Australian resident subsidiaries are part of a tax consolidated group (‘TCG’). As a consequence, all members of the TCG are taxed as a single entity. The head entity in the TCG is the Company.
The Company, in conjunction with other members of the TCG, has entered into a tax funding arrangement. The arrangement requires that the Company assumes the current tax liabilities and deferred tax assets arising from unused tax losses, with payments to or from subsidiaries settled via intercompany loan. Any subsequent period adjustments are recognised by the Company only and do not result in further amounts being payable or receivable under the tax funding arrangement. The tax liabilities of the entities included in the TCG will be governed by the tax sharing agreement should the Company default on its tax obligations.
Stockland Trust Group
Under current Australian income tax legislation, the Trust and its sub-trusts are not liable for income tax on their taxable income (including any assessable component of capital gains) provided that the unitholders are presently entitled to the income of the Trust.
(B3a) Income tax benefit/(expense)
Year ended 30 June 2015
$M 2014
$M
Current tax benefit/(expense)
Current year 35 100
Adjustments for prior years (1) -
34 100
Deferred tax benefit/(expense)
Origination and reversal of temporary differences (28) (74)
6 26
Derecognition of tax losses and temporary differences – (33)
Total income tax benefit/(expense) 6 (7)
Numerical reconciliation between income tax benefit and pre-tax net profit
Stockland
2015 2014
Year ended 30 June Statutory profit
$M
Underlying profit
$M
Statutory profit
$M
Underlying profit
$M
Profit before income tax benefit 897 604 534 528
Less: Profit from Trust (867) (616) (641) (614)
Less: Intergroup eliminations 7 – (13) –
Profit/(Loss) before income tax 37 (12) (120) (86)
Prima facie income tax benefit/(expense) calculated at 30% (11) 4 36 26
Increase/(decrease) in income tax expense due to:
Other assessable income (7) – – –
Other non-assessable income 2 2 1 1
Other non-deductible expenses (5) – (7) –
Tax effect of FX loss transferred from Foreign Currency Translation Reserve (3) (1) (4) –
Underprovided in prior years (1) (1) – –
Non-recognition of Australian tax losses – – (33) –
Temporary differences recognised on future RL gain on turnover deductions1 31 – – –
Income tax benefit/(expense) 6 4 (7) 27
Effective tax rate 30% 31%
1 Tax benefit relates to the temporary difference on future deductions of Retirement Living Gain on Turnover (‘GOT’) liabilities assumed on prior period RL village acquisitions which, following an amended ATO tax ruling, are now treated as tax deductible.
For
per
sona
l use
onl
y

Consolidated Notes Year ended 30 June 2015
Stockland Financial Report 2015 — 74
(B3A) INCOME TAX EXPENSE/(BENEFIT) (CONTINUED)
Tax benefit/(expense) relating to items of other comprehensive income (‘OCI’)
Stockland
Year ended 30 June 2015$M
2014$M
Fair value reserve 16 (22)
Tax benefit/(expense) relating to items of other comprehensive income 16 (22)
(B3b) Deferred tax
Stockland
A deferred tax asset is recognised to the extent that it is probable that future taxable profits will be available against which the temporary differences can be utilised. Deferred tax assets are reviewed at each balance date and are reduced to the extent that it is no longer probable that the related tax benefit will be realised.
Deferred tax is based upon the expected manner of realisation or settlement of the carrying amount of assets and liabilities using the applicable tax rates.
Deferred tax arises due to temporary differences between the carrying amount of assets and liabilities for financial reporting purposes and the amounts used for taxation purposes. Deferred tax is not recognised for the following temporary differences:
(i) initial recognition of goodwill;
(ii) the initial recognition of assets or liabilities that affect neither accounting nor taxable profit; and
(iii) differences relating to investments in subsidiaries to the extent that they are unlikely to reverse in the foreseeable future.
Deferred tax assets and liabilities are attributable to the following:
Assets Liabilities Net
As at 30 June 2015$M
2014$M
2015$M
2014$M
2015 $M
2014$M
Inventories 118 137 (152) (156) (34) (19)
Investment properties 12 15 (249) (200) (237) (185)
Other financial assets – – (6) (22) (6) (22)
Property, plant and equipment 9 3 – – 9 3
Trade and other payables 17 14 – – 17 14
Retirement Living resident obligations 33 9 – – 33 9
Provisions 5 4 – – 5 4
Reserves 7 5 – – 7 5
Tax losses carried forward 404 397 – – 404 397
Tax assets/(liabilities) 605 584 (407) (378) 198 206
Less: Tax losses not recognised (139) (173) – – (139) (173)
Recognised tax assets/(liabilities) 466 411 (407) (378) 59 33
Set-off of deferred tax liabilities (407) (378) 407 378 – –
Net tax asset 59 33 – – 59 33
For
per
sona
l use
onl
y

Consolidated Notes Year ended 30 June 2015
Stockland Financial Report 2015 — 75
(B3B) DEFERRED TAX (CONTINUED)
Movement in temporary differences during the financial year
Balance1 July
2013
$M
Recognised in profit or loss
$M
Recognisedin OCI
$M
Balance30 June
2014
$M
Recognisedin profitor loss
$M
Recognised in OCI
$M
Balance30 June
2015
$M
Inventories 4 (23) – (19) (15) – (34)
Investment properties (174) (11) – (185) (52) – (237)
Other financial assets 32 (32) (22) (22) – 16 (6)
Property, plant and equipment
– 3 – 3 6 – 9
Trade and other payables 11 3 – 14 3 – 17
Interest-bearing loans and borrowings
(1) 1 – – – – –
Retirement Living resident obligations
13 (4) – 9 24 – 33
Provisions 4 – – 4 1 – 5
Reserves 4 1 – 5 2 – 7
Recognised tax losses carried forward
166 58 – 224 41 – 265
59 (4) (22) 33 10 16 59
Recoverability of deferred tax assets (‘DTA’)
An assessment of the recoverability of the net DTA has been made to determine if the carrying value should be reduced or more tax losses should be recognised with reference to the latest available profit forecasts, to determine the availability of suitable taxable profits or taxable temporary differences. The assessment for the period determined that the current DTA was considered to be recoverable with sufficient certainty and accordingly no additional DTA write off required.
At each reporting period, the net DTA and unrecognised tax losses will be assessed for recoverability and recognition, respectively. This may lead to the partial or full recognition of this unrecognised tax benefit in future reporting periods.
The Group has $139 million (2014: $173 million) of unrecognised deferred tax assets. This balance consists of $133 million (2014: $128 million) Australian income tax losses, $6 million (2014: $15 million) Australian capital losses; nil (2014: $10 million) UK capital losses and nil (2014: $20 million) UK trading losses. Following the liquidation of the UK investment for tax purposes, the UK capital and trading tax losses are no longer available.
Stockland Trust Group
There are no deferred tax assets or liabilities in the Stockland Trust Group.
For
per
sona
l use
onl
y

Consolidated Notes Year ended 30 June 2015
Stockland Financial Report 2015 — 76
(C) Operating assets and liabilities
IN THIS SECTION
This section shows the real estate assets used to generate Stockland’s and Stockland Trust Group’s trading performance and the liabilities incurred as a result. Information on other assets and liabilities are in the following sections:
• Section B – Deferred tax assets and liabilities
• Section D – Financing activities
• Section E – Equity-accounted investments
(C1) Real Estate assets and liabilities
(C1a) Inventories
Properties held for development and resale are stated at the lower of cost and net realisable value. Cost includes the costs of acquisition, development and holding costs such as borrowing costs, rates and taxes. Holding costs incurred after completion of development activities are expensed.
Cost of acquisition
The cost of acquisition comprises the purchase price of the land, including land under option, along with any direct costs incurred as part of the acquisition including legal, valuation and stamp duty costs.
Land under options
Stockland has a number of arrangements with third parties primarily relating to the purchase of land on capital efficient terms, through call or put and call option arrangements.
Where the arrangement uses call options only, the decision to proceed with a purchase is controlled by Stockland. A future obligation under a call option is only triggered if Stockland exercises the option. No asset or liability for the land under option is recognised on the balance sheet until the option has been exercised. The call option is not disclosed as a capital commitment as there is no commitment to purchase until the option is exercised.
Where Stockland enters into put and call options it is with a fixed exercise price. Where such an arrangement exists, the put option requires Stockland to purchase the land at the discretion of the seller, creating a present obligation once the option is exercised by the holder. If Stockland also presently exhibits control over the future economic benefits of the asset such as via a presently exercisable call option or physical control of the asset, the land is recognised in inventory with a corresponding liability recognised in provisions for development costs at the exercise price of the option.
For both put and call options, any costs incurred in relation to the options including option fees are included in inventory.
Development and other costs
Cost includes variable and fixed costs directly related to specific contracts, costs related to general contract activity which can be allocated to specific projects on a reasonable basis, and other costs specifically chargeable under the contract including under rectification provisions.
Interest capitalised
Financing costs on qualifying assets are also included in the cost of inventory. Finance costs were capitalised at interest rates ranging from 6.1% to 6.7% during the financial year (2014: 6.1% to 7.1%). Capitalised finance costs are further explained in Note (D1).
Impairment provision
The net realisable value (‘NRV’) of inventories is the estimated selling price in the ordinary course of business less estimated costs of completion and costs to sell. NRV is based on the most reliable evidence available at the time of the amount the inventories are expected to realise (using estimates such as revenue escalations) and the estimate of total costs (including costs to complete). These estimates take into consideration fluctuations of price or cost directly relating to events occurring after the end of the period to the extent that such events confirm conditions existing at the end of the period.
Each reporting period, key estimates are reviewed including the costs of completion, dates of completion and revenue escalations. As a result of this review, no net impairment provisions have been recognised in the profit or loss for the year ended 30 June 2015 (2014: Nil).
For
per
sona
l use
onl
y

Consolidated Notes Year ended 30 June 2015
Stockland Financial Report 2015 — 77
(C1A) INVENTORIES (CONTINUED)
Development provisions
The provision for development costs relates to obligated future costs including land acquired on capital efficient deferred terms. The development provision is recorded as a separate liability in the balance sheet, however, a corresponding asset will be recognised in inventory as either a cost of acquisition or development and other costs.
Provisions are determined by discounting the expected future cash flows at a pre-tax rate that reflects current market assessments of the time value of money and, where appropriate, the risks specific to the liability. This includes present obligations that are recognised in relation to put options.
The composition of inventory is presented in the table below:
2015 2014
As at 30 June Current$M
Non-current
$M
Total$M
Current$M
Non-current
$M
Total$M
Finished development stock held for sale1
• cost of acquisition 59 – 59 73 – 73
• development and other costs 149 – 149 165 – 165
• interest capitalised 29 – 29 43 – 43
• impairment provision (1) – (1) (36) – (36)
Total finished stock held for sale 236 – 236 245 – 245
Development work in progress
Residential communities under development
• cost of acquisition 182 1,389 1,571 245 1,223 1,468
• development and other costs 116 449 565 195 288 483
• interest capitalised 50 376 426 102 325 427
• impairment provision (44) (266) (310) (218) (136) (354)
Total residential communities under development 304 1,948 2,252 324 1,700 2,024
Apartments
• cost of acquisition 15 – 15 14 – 14
• development and other costs 18 – 18 18 – 18
• interest capitalised 5 – 5 5 – 5
• impairment provision (31) – (31) (36) – (36)
Total apartments 7 – 7 1 – 1
Logistics & business parks projects
• cost of acquisition 9 30 39 – 29 29
• development and other costs 12 17 29 – 16 16
• interest capitalised 7 5 12 – 7 7
• impairment provision (26) (9) (35) – (6) (6)
Total logistics & business parks projects 2 43 45 – 46 46
Total inventory 549 1,991 2,540 570 1,746 2,316
1 Included within current finished development stock held for sale are logistics and business parks of $11 million (2014: $17 million). There are no apartments included in finished development stock held for sale (2014: $15 million).
For
per
sona
l use
onl
y

Consolidated Notes Year ended 30 June 2015
Stockland Financial Report 2015 — 78
(C1A) INVENTORIES (CONTINUED)
The following impairment provisions are included in the inventory balance with movements for the year recognised in the profit or loss:
Residential communities
$M
Apartments
$M
Logistics & business parks
$M
Total
$M
Balance as at 1 July 2014 386 40 6 432
Transfers2 (29) – 29 –
Amounts utilised (46) (9) – (55)1
Balance as at 30 June 2015 311 31 35 377
1 The Consolidated Statements of Profit or Loss include an additional $58 million in provisions utilised relating to UK assets that were transferred to Assets Held for Sale at 30 June 2014. Refer to Note (C3b).
2 In the current year, $30 million of project costs and $29 million of impairment provisions were transferred from residential communities under development to logistics and business park projects, in line with the highest and best use of the asset.
Development cost provisions
The following development provisions are recorded as a separate liability on the balance sheet and are not netted in the inventory balance:
As at 30 June
2015
$M
2014
$M
Current 300 213
Non-current 98 162
Total development cost provision 398 375
Movement in development cost provisions
$M
Balance as at 1 July 2014 375
Additional provisions recognised 284
Amounts used during the financial year (261)
Balance as at 30 June 2015 398
(C1b) Commercial properties
Commercial properties comprise investment interests in land and buildings including integral plant and equipment held for the purpose of producing rental income, capital appreciation, or both.
Commercial properties are initially recognised at cost including any acquisition costs and subsequently stated at fair value at each balance date. Fair value is based on the latest independent valuation adjusting for capital expenditure and capitalisation and amortisation of lease incentives since the date of the independent valuation report. Any gain or loss arising from a change in fair value is recognised in the profit or loss in the period.
Commercial properties under development are classified as investment properties and stated at fair value at each balance date. Fair value is assessed with reference to reliable estimates of future cash flows, status of the development and the associated risk profile. Finance costs incurred on properties undergoing development or redevelopment are included in the cost of the development.
As at 30 June 2015, fair value for commercial properties in development has been assessed by the Directors after considering the latest valuations and subsequent capital works-in-progress. An independent valuation of the property will be undertaken upon completion of the works.
A property interest under an operating lease is classified and accounted for as an investment property on a property-by-property basis when Stockland holds it to earn rentals or for capital appreciation or both. Any such property interest under an operating lease classified as an investment property is carried at fair value.
Subsequent costs
Stockland recognises in the carrying amount of an investment property the cost of replacing part of that investment property if it is probable that the future economic benefits embodied within the item will flow to Stockland and the cost can be measured reliably. All other costs are recognised in the profit or loss as an expense as incurred.
For
per
sona
l use
onl
y

Consolidated Notes Year ended 30 June 2015
Stockland Financial Report 2015 — 79
(C1B) COMMERCIAL PROPERTIES (CONTINUED)
Lease incentives
Lease incentives provided by Stockland to lessees, and rental guarantees which may be received by Stockland from third parties (arising from the acquisition of investment properties) are included in the measurement of fair value of investment property and are treated as separate assets. Such assets are amortised over the respective periods to which the lease incentives and rental guarantees apply using a straight-line basis.
If an investment property becomes owner-occupied, it is reclassified as property, plant and equipment and its fair value at the date of reclassification becomes its cost for accounting purposes.
Disposal of revalued assets
The gain or loss on disposal of revalued assets is calculated as the difference between the carrying amount of the asset at the time of disposal and the net proceeds on disposal and is recognised in the profit or loss in the year of disposal.
During the year, net losses of $2 million were recognised on disposal of 50% of Stockland Townsville.
Commercial properties including Stockland’s share of property held by equity-accounted investments
Stockland Stockland Trust Group
2015
$M 2014
$M 2015
$M 2014
$M
Retail 6,022 5,483 5,992 5,457
Office 1,102 1,043 1,108 1,045
Logistics & Business Parks 1,699 1,572 1,699 1,570
Capital works in progress and sundry properties 195 341 87 233
Book value of commercial properties 9,0181 8,439 8,886 8,305
Less amounts classified as:
• Property, plant and equipment (44) (45) – –
• Other assets (including lease incentives and lease fees) (185) (158) (191) (165)
• Other assets (including lease incentives and lease fees) attributable to equity-accounted investments
(26) (22) (25) (21)
• Other receivables (straight-lining of operating lease rental income) (54) (49) (58) (52)
• Other receivables (straight-lining of operating lease rental income) attributable to equity-accounted investments
(18) (18) (18) (18)
Total investment properties (including share of investment property held by equity-accounted investments)
8,691 8,147 8,594 8,049
Less: Stockland’s share of investment properties held by equity-accounted investments
(774)1 (658) (754) (637)
Total investment properties 7,917 7,489 7,840 7,412
Investment property reconciliation
Direct investments and controlled entities
Carrying amount at the beginning of the financial year 7,489 6,991 7,412 6,988
Acquisitions 72 224 72 216
Disposals (233) (177) (233) (177)
Expenditure capitalised 336 306 342 303
Transfers from property, plant and equipment2 – 52 – –
Net gain from fair value adjustment of investment properties 253 93 247 82
Balance at the end of the financial year 7,917 7,489 7,840 7,412
1 Includes joint ventures holding the Waterfront Place and Eagle Street Pier assets which have been reclassified as an Asset Held for Sale at 30 June 2015. Refer to (C3b) and (E1a).
2 In the year ended 30 June 2014, 50% of Piccadilly Complex was disposed, resulting in a transfer of 50% for the owner-occupied property, plant & equipment in investment properties.
For
per
sona
l use
onl
y

Consolidated Notes Year ended 30 June 2015
Stockland Financial Report 2015 — 80
(C1B) COMMERCIAL PROPERTIES (CONTINUED)
Description
Independent valuation
date
Independent valuation
$M
Independent Cap rate6
%
Book value 30 June
2015 $M
Book value 30 June
2014 $M
Retail
Directly owned
Stockland Shellharbour, Shellharbour NSW Dec 2013 680 6.00 688 683
Stockland Wetherill Park, Western Sydney NSW Dec 2011 358 6.75 522 372
Stockland Merrylands, Merrylands NSW Dec 2014 506 6.00 506 475
Stockland Rockhampton, Rockhampton QLD Jun 2015 404 6.00 404 367
Stockland Green Hills, East Maitland NSW Jun 2014 308 6.50 308 308
Stockland Glendale, Newcastle NSW Jun 2014 270 6.50 274 270
Stockland Cairns, Cairns QLD Jun 2015 230 6.25 230 221
Stockland Townsville, Townsville QLD (2015: 50%; 2014: 100%)1,2
Jun 2015 227 6.00-7.00 227 432
Stockland Hervey Bay, Hervey Bay QLD Jun 2015 195 6.25 195 72
Stockland Point Cook, Point Cook VIC Dec 2013 184 7.25 185 185
Stockland Burleigh Heads, Burleigh Heads QLD Dec 2014 180 7.00-8.25 181 170
Stockland Baldivis, Baldivis WA Jun 2011 45 7.50 172 46
Stockland Forster, Forster NSW Jun 2015 158 6.75 158 149
Stockland The Pines, Doncaster East VIC Dec 2014 156 7.00 157 140
Stockland Gladstone, Gladstone QLD Dec 2014 148 7.00 149 137
Stockland Jesmond, Newcastle NSW Jun 2015 144 7.00 144 127
Stockland Wendouree, Wendouree VIC Dec 2014 136 7.00 138 129
Stockland Baulkham Hills, Baulkham Hills NSW Jun 2015 130 6.75 130 117
Stockland Balgowlah, Balgowlah NSW Dec 2014 126 6.75 126 116
Stockland Caloundra, Caloundra QLD Dec 2014 117 7.00 117 111
Stockland Nowra, Nowra NSW Jun 2015 110 6.75 110 90
Stockland Bull Creek, Bull Creek WA Dec 2014 100 6.75 101 93
Stockland Traralgon, Traralgon VIC Dec 2014 98 7.00 99 87
Stockland Cleveland, Cleveland QLD Dec 2014 94 7.00 94 89
Stockland Bathurst, Bathurst NSW Dec 2014 89 7.25 92 81
Stockland Corrimal, Corrimal NSW Dec 2014 70 7.25 70 63
Stockland Wallsend, Wallsend NSW Jun 2015 67 7.25 67 58
Stockland Tooronga, Tooronga VIC Dec 2014 53 6.75 53 51
Shellharbour Retail Park, Shellharbour NSW Dec 2014 52 7.75 52 50
Stockland Cammeray, Cammeray NSW Dec 2014 37 6.75 37 33
Stockland Highlands, Craigieburn VIC4 Jun 2015 31 7.00 31 26
North Shore Townsville, Townsville QLD Jun 2015 22 7.00 22 21
Stockland Jimboomba Village Shopping Centre, Jimboomba QLD (50%)1
Jun 2015 14 8.00 14 16
Woolworths Toowong, Toowong QLD5 Jun 2013 14 n/a 14 14
Stockland Vincentia Shopping Centre, Vincentia NSW Dec 2014 13 8.00 13 12
Stockland Merrylands Court, Merrylands NSW Dec 2014 10 7.50 10 9
Stockland Townsville Kingsvale Sunvale, QLD (2015: 50%; 2014: 100%)1,3
Dec 2012 5 n/a 2 6
Owned through equity-accounted investments
Stockland Bundaberg, QLD (50%) Jun 2015 67 6.75 67 –
Stockland Riverton, Riverton WA (50%) Dec 2014 64 6.75 64 61
Total Retail7 6,022 5,483
1 Stockland’s share of this property is held through a direct interest in the asset. 2 Independent valuation based on 50% ownership. 3 Independent valuation based on 100% ownership. 4 This property is not held by Stockland Trust. 5 This property is valued as land. 6 A range of cap rates are disclosed for a complex comprising of a number of properties. 7 Totals may not add due to rounding.
For
per
sona
l use
onl
y

Consolidated Notes Year ended 30 June 2015
Stockland Financial Report 2015 — 81
(C1B) COMMERCIAL PROPERTIES (CONTINUED)
Description
Independent valuation
date
Independent valuation
$M
Independent Cap rate4
%
Book value 30 June 2015
$M
Book value 30 June 2014
$M
Office
Directly owned
Stockland Piccadilly, 133-145 Castlereagh Street, Sydney NSW (50%)1, 2, 3
Dec 2014 206 6.63-7.75 206 195
Durack Centre, 263 Adelaide Terrace, Perth WA3 Jun 2014 157 8.25-8.75 158 157
601 Pacific Highway, St Leonards NSW Jun 2015 87 7.75 87 80
77 Pacific Highway, North Sydney NSW Jun 2015 59 7.75 59 56
40 Cameron Avenue, Belconnen ACT3 Jun 2014 43 10.50 42 43
Garden Square, Mt Gravatt QLD Jun 2014 37 9.25 38 36
110 Walker Street, North Sydney NSW Jun 2015 28 7.75 28 27
80-88 Jephson Street, Toowong QLD Jun 2013 19 9.00 19 19
23 High St, Toowong QLD Jun 2013 4 8.25 4 4
27-29 High Street, Toowong QLD Jun 2013 3 8.50 4 3
Owned through equity-accounted investments
Waterfront Place, Eagle Street, Brisbane QLD (50%)5 Jun 2015 296 6.75 296 287
135 King Street, Sydney NSW (50%)2 Dec 2014 162 5.75-6.50 161 135
Total Office7 1,102 1,043
Logistics & Business Parks
Directly owned
Yennora Distribution Centre, Yennora NSW Dec 2013 351 7.75 369 360
Triniti Business Campus, North Ryde NSW Jun 2014 168 7.75 170 168
Port Adelaide Distribution Centre, Port Adelaide SA Jun 2015 95 9.25 95 85
Hendra Distribution Centre, Brisbane QLD Jun 2015 85 8.75 85 84
Brooklyn Estate, Brooklyn VIC Dec 2012 80 9.25 83 83
60-66 Waterloo Road, Macquarie Park NSW Jun 2015 80 7.25-7.50 80 73
Forrester Distribution Centre, St Marys NSW Dec 2014 77 7.75 78 78
Ingleburn Distribution Centre, Ingleburn, NSW6 – – – 77 77
Balcatta Distribution Centre, Balcatta WA Jun 2015 57 7.25 57 57
9-11a Ferndell Street, Granville NSW Dec 2014 46 8.50-9.75 47 45
Macquarie Technology Centre, Macquarie Park NSW Jun 2015 43 7.25-8.50 43 34
16 Giffnock Avenue, Macquarie Park NSW Jun 2014 37 8.75 38 37
20-50 Fillo Drive & 10 Stubb Street, Somerton VIC Jun 2014 32 8.75 32 32
1090-1124 Centre Road, Oakleigh VIC6 Dec 2012 32 9.25 32 32
Cherry Lane, Laverton North VIC – – – 31 –
Altona Distribution Centre, Altona VIC Dec 2014 29 8.75 29 28
Baker Street, Botany NSW6 – – – 22 –
2 Davis Road, Wetherill Park NSW Dec 2014 19 8.00 19 17
Coopers Paddock, Warwick Farm NSW6 – – – 19 –
56-60 Toll Drive, Altona North VIC Jun 2013 15 8.25 17 15
11-25 Toll Drive, Altona North VIC Dec 2012 16 8.25 16 16
32-54 Toll Drive, Altona VIC Dec 2012 15 8.25 15 15
76-82 Fillo Drive, Somerton VIC Jun 2014 15 9.00 14 15
Export Park, 9-13 Viola Place, Brisbane Airport QLD3 Jun 2013 12 9.75 12 12
M1 Yatala Enterprise Park, Yatala QLD Jun 2013 9 n/a 10 10
40 Scanlon Drive, Epping VIC Dec 2014 9 8.00 8 8
Owned through equity-accounted investments
Optus Centre, Macquarie Park NSW (51%) Dec 2014 203 7.25 204 192
Total Logistics & Business Parks7 1,699 1,572
1 Stockland’s share of this property is held through a direct interest in the asset. 2 Book value includes the retail component of the property. 3 This property is a leasehold property. 4 A range of cap rates are disclosed for a complex comprising of a number of properties. 5 At 30 June 2015, the trust holding Waterfront Place, has been reclassified as an Asset Held for sale. Refer to (C3b) and (E1a). 6 Ingleburn Distribution Centre, Ingleburn NSW, Cherry Lane, Laverton North VIC, Baker Street, Botany NSW and Coopers Paddock, Warwick Farm
NSW were acquired on 20 June 2014, 6 February 2015, 27 March 2015, and 7 April 2015, respectively. The values adopted above are a result of a Directors’ valuation as at 30 June 2015.
7 Totals may not add due to rounding.
For
per
sona
l use
onl
y

Consolidated Notes Year ended 30 June 2015
Stockland Financial Report 2015 — 82
(C1B) COMMERCIAL PROPERTIES (CONTINUED)
Fair value measurement, valuation techniques and inputs
The adopted valuations (both internal and external) for investment properties in the Retail, Office and Logistics & Business Parks portfolios are a combination of the valuations determined using the discounted cash flow (‘DCF’) method and the income capitalisation method.
The adopted value of properties in the properties under development portfolio is based on an internal tolerance check performed by the Directors’ at each reporting date. The tolerance check takes into account the expected cost of completion, the stage of completion, the risk associated with the project, expected underlying income and applying the income capitalisation method.
The following table shows the valuation techniques used in measuring the fair value of commercial properties, as well as significant unobservable inputs used.
Class of property
Fair value hierarchy
Fair value 30 June 2015
$M Valuation technique Inputs used to measure fair value
Range of unobservable
inputs
30 June 2015
Retail Level 3 6,022 DCF and income capitalisation method
Net market rent (per sqm p.a.)
10 year average specialty market rental growth
Adopted capitalisation rate
Adopted terminal yield
Adopted discount rate
$119 - $794
3.0% - 4.3%
6.0% - 9.5%
6.25% - 9.75%
8.25% - 9.5%
Office Level 3 1,102 DCF and income capitalisation method
Net market rent (per sqm p.a.)
10 year average market rental growth
Adopted capitalisation rate
Adopted terminal yield
Adopted discount rate
$326 - $695
2.9% - 3.9%
6.5% - 10.5%
6.75% - 10.5%
8.0% - 10.5%
Logistics & Business Parks
Level 3 1,699 DCF and income capitalisation method
Net market rent (per sqm p.a.)
10 year average market rental growth
Adopted capitalisation rate
Adopted terminal yield
Adopted discount rate
$56 - $434
2.6% - 3.6%
7.0% - 9.75%
7.25% - 11.0%
8.5% - 10.0%
Properties under development
Level 3 195 Income capitalisation method
Net market rent (per sqm p.a.)
Adopted capitalisation rate
$309 - $1,190
5.5% - 7.0%
Total 9,018
Both the DCF and income capitalisation methods use inputs which are unobservable frequently, in determining fair value, as per the table above.
The table below explains the key inputs used to measure fair value for commercial properties:
DCF method Under the DCF method, a property’s fair value is estimated using explicit assumptions regarding the benefits and liabilities of ownership over the asset’s life including an exit or terminal value. The DCF method involves the projection of a series of cash flows on a real property interest. To this projected cash flow series, an appropriate, market-derived discount rate is applied to establish the present value of the income stream associated with the real property.
Income capitalisation method
This method involves assessing the total net market income receivable from the property and capitalising this in perpetuity to derive a capital value, with allowances for capital expenditure reversions.
Net market rent A net market rent is the estimated amount for which a property or space within a property should lease between a willing lessor and a willing lessee on appropriate lease terms in an arm’s length transaction, after proper marketing and wherein the parties have each acted knowledgeably, prudently and without compulsion. In a net rent, the owner recovers outgoings from the tenant on a pro-rata basis (where applicable).
10 year average specialty market rental growth
An average of a 10 year period of forecast annual percentage growth rates in Retail specialty tenancy rents. Specialty tenants are those tenancies with a gross lettable area of less than 400 square metres (excludes ATMs and kiosks).
For
per
sona
l use
onl
y

Consolidated Notes Year ended 30 June 2015
Stockland Financial Report 2015 — 83
(C1B) COMMERCIAL PROPERTIES (CONTINUED)
10 year average market rental growth
The expected annual rate of change in market rent over a 10 year forecast period in alignment with expected market movements.
Adopted capitalisation rate The rate at which net market income is capitalised to determine the value of a property. The rate is determined with regards to market evidence and the prior external valuation.
Adopted terminal yield The capitalisation rate used to convert income into an indication of the anticipated value of the property at the end of the holding period when carrying out a DCF calculation. The rate is determined with regards to market evidence and the prior external valuation.
Adopted discount rate The rate of return used to convert a monetary sum, payable or receivable in the future, into present value. It reflects the opportunity cost of capital, that is, the rate of return the capital can earn if put to other uses having similar risk. The rate is determined with regards to market evidence and the prior external valuation.
Valuation process
The Commercial Property valuation team are responsible for managing the bi-annual valuation process across Stockland’s balance sheet investment portfolio. The aim of the valuation process is to ensure that assets are held at fair value in Stockland’s accounts and that the Group is compliant with applicable regulations (for example the Corporations Act and ASIC regulations) and the STML RE Constitution and Compliance Plan.
Stockland’s external valuations are performed by independent professionally qualified valuers who hold a recognised relevant professional qualification and have specialised expertise in the investment properties valued. Internal tolerance checks have been performed by Stockland’s internal valuers who hold recognised relevant professional qualifications.
Internal tolerance check
An internal tolerance check is performed every six months with the exception of those properties being independently valued during the current reporting period. Stockland’s internal valuers perform tolerance checks by utilising the information from a combination of asset plans and forecasting tools prepared by the asset management teams. For the Retail, Office and Logistics & Business Parks classes, appropriate capitalisation rates, terminal yields and discount rates based on comparable market evidence and recent external valuation parameters are used to produce a capitalisation and DCF valuation. The internal tolerance check is generally weighted more to the capitalisation value (75% weighting) than the DCF valuation (25% weighting).
The current book value, which is the value per the asset’s most recent external valuation plus any capital expenditure since the valuation date, is compared to the internal tolerance check.
• If the internal tolerance check is within 5.0% of the current book value, then the current book value is retained, and judgement is taken that this remains the fair value of the property.
• If the internal tolerance check varies by more than 5.0% to the current book value (higher or lower), then an external independent valuation will be undertaken and adopted after assessment by the Commercial Property valuation team to provide an appropriate level of evidence to support fair value.
The internal tolerance checks are reviewed by Commercial Property senior management who recommend the adopted valuation to the Board in accordance with Stockland’s internal valuation protocol above.
A development feasibility is prepared for each commercial property under development. The feasibility includes an estimated valuation upon project completion based on the income capitalisation method. During the development period, fair value is assessed by reference to the value of the property when complete, less deductions for costs required to complete the project and appropriate adjustments for profit and risk. Through this process, we arrive at fair value. The fair value is compared to the current book value.
• If the internal tolerance check is within 5.0% of the current book value, then the current book value is retained, and judgement is taken that this remains the fair value of the property under development.
• If the internal tolerance check varies by more than 5.0% to the current book value (higher or lower), then the Directors’ valuation will be adopted.
For
per
sona
l use
onl
y
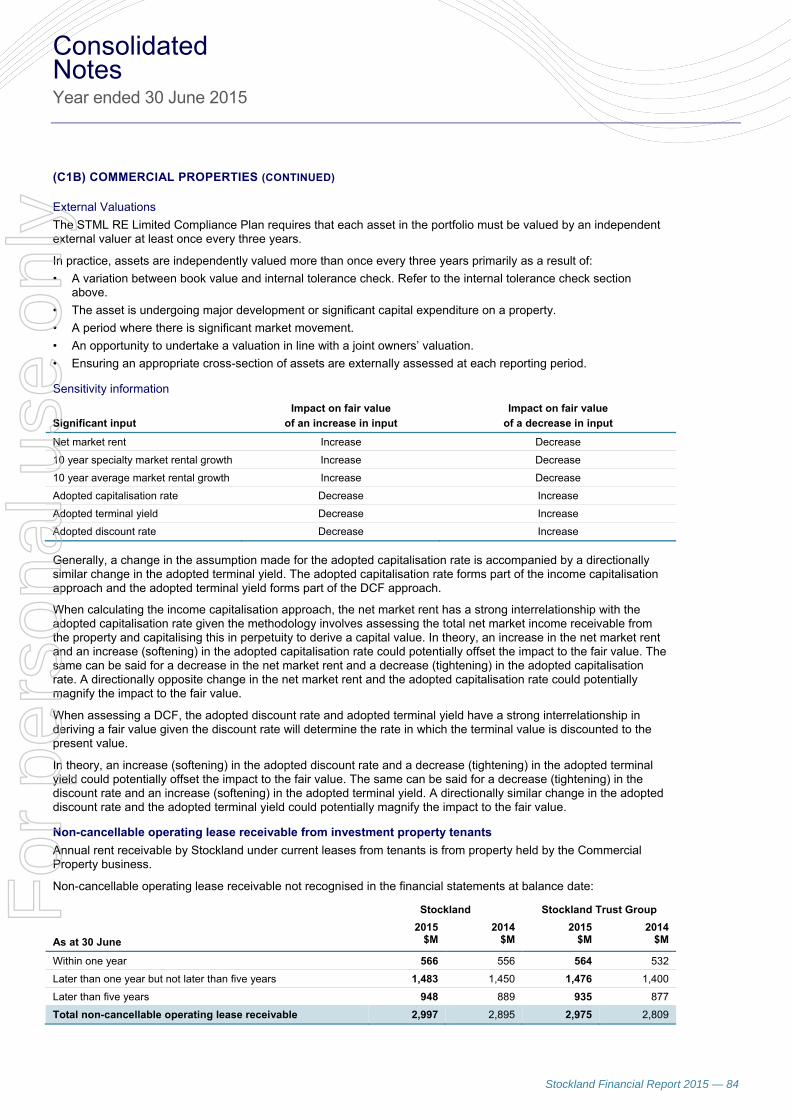
Consolidated Notes Year ended 30 June 2015
Stockland Financial Report 2015 — 84
(C1B) COMMERCIAL PROPERTIES (CONTINUED)
External Valuations
The STML RE Limited Compliance Plan requires that each asset in the portfolio must be valued by an independent external valuer at least once every three years.
In practice, assets are independently valued more than once every three years primarily as a result of:
• A variation between book value and internal tolerance check. Refer to the internal tolerance check section above.
• The asset is undergoing major development or significant capital expenditure on a property.
• A period where there is significant market movement.
• An opportunity to undertake a valuation in line with a joint owners’ valuation.
• Ensuring an appropriate cross-section of assets are externally assessed at each reporting period.
Sensitivity information
Significant input
Impact on fair value
of an increase in input
Impact on fair value
of a decrease in input
Net market rent Increase Decrease
10 year specialty market rental growth Increase Decrease
10 year average market rental growth Increase Decrease
Adopted capitalisation rate Decrease Increase
Adopted terminal yield Decrease Increase
Adopted discount rate Decrease Increase
Generally, a change in the assumption made for the adopted capitalisation rate is accompanied by a directionally similar change in the adopted terminal yield. The adopted capitalisation rate forms part of the income capitalisation approach and the adopted terminal yield forms part of the DCF approach.
When calculating the income capitalisation approach, the net market rent has a strong interrelationship with the adopted capitalisation rate given the methodology involves assessing the total net market income receivable from the property and capitalising this in perpetuity to derive a capital value. In theory, an increase in the net market rent and an increase (softening) in the adopted capitalisation rate could potentially offset the impact to the fair value. The same can be said for a decrease in the net market rent and a decrease (tightening) in the adopted capitalisation rate. A directionally opposite change in the net market rent and the adopted capitalisation rate could potentially magnify the impact to the fair value.
When assessing a DCF, the adopted discount rate and adopted terminal yield have a strong interrelationship in deriving a fair value given the discount rate will determine the rate in which the terminal value is discounted to the present value.
In theory, an increase (softening) in the adopted discount rate and a decrease (tightening) in the adopted terminal yield could potentially offset the impact to the fair value. The same can be said for a decrease (tightening) in the discount rate and an increase (softening) in the adopted terminal yield. A directionally similar change in the adopted discount rate and the adopted terminal yield could potentially magnify the impact to the fair value.
Non-cancellable operating lease receivable from investment property tenants
Annual rent receivable by Stockland under current leases from tenants is from property held by the Commercial Property business.
Non-cancellable operating lease receivable not recognised in the financial statements at balance date:
Stockland Stockland Trust Group
As at 30 June
2015$M
2014$M
2015 $M
2014$M
Within one year 566 556 564 532
Later than one year but not later than five years 1,483 1,450 1,476 1,400
Later than five years 948 889 935 877
Total non-cancellable operating lease receivable 2,997 2,895 2,975 2,809
For
per
sona
l use
onl
y

Consolidated Notes Year ended 30 June 2015
Stockland Financial Report 2015 — 85
(C1c) Retirement Living
For information on results of the Retirement Living business refer to Note (B2d).
Investment properties
Retirement Living investment properties comprise retirement villages (both operating villages and villages under development) held to earn revenue and capital appreciation over the long-term. Retirement villages comprise independent living units (‘ILU’s’), serviced apartments, community facilities and integral plant and equipment.
Stockland
As at 30 June 2015
$M 2014
$M
Net investment in Retirement Living
Operating villages 3,111 2,639
Villages under development 224 213
Total Retirement Living investment properties 3,335 2,852
Existing resident obligations (2,198) (1,849)
Net carrying value of Retirement Living villages 1,137 1,003
Retirement Living net carrying value movement during the year
Balance at the beginning of the financial year 1,003 1,057
Acquisition 81 –
Disposal (20) –
Expenditure capitalised 130 85
Realised fair value movements 21 18
Cash received on first sales (115) (103)
Change in fair value of investment properties 6 (50)
Other movements 31 (4)
Balance at the end of the financial year 1,137 1,003
Acquisitions
On 30 June 2015, Stockland purchased eight established Retirement Living villages in South Australia for a total cost of $81 million. The transaction included the recognition of operating villages ($245 million), development land ($11 million) and the assumption of resident obligations ($175 million).
Disposals
On 5 February 2015, Stockland disposed of two established Retirement Living villages in Victoria for total proceeds of $20 million. The villages contained units on strata title and did not have an associated resident obligation.
Fair value measurement, valuation techniques and inputs
The fair value of Retirement Living investment properties (including villages under development) is the value of the Retirement Living assets and the future cash flows associated with the contracts. Changes in fair value of investment properties are recognised in profit or loss.
The fair value is determined by the Directors’ using a DCF methodology.
Both the investment properties and resident obligations are considered to be level 3 in the Fair Value Hierarchy Refer to Note (D5).
For
per
sona
l use
onl
y

Consolidated Notes Year ended 30 June 2015
Stockland Financial Report 2015 — 86
(C1C) RETIREMENT LIVING (CONTINUED)
The following inputs are used to measure the fair value of the investment properties:
Inputs Range of unobservable inputs 30 June 2015
Discount rate 12.5% – 14.0% (Average: 13.0%)
Average 20 year growth rate 3.6%
Average length of stay of existing and future residents 10.3 years
Current market value of unit $0.1 million - $1.0 million
Renovation/Reinstatement cost $5k - $80k
Renovation recoupment 0% – 100%
The DCF methodology uses unobservable inputs as shown in the table above. These are further explained below:
Item Description
DCF method Under the DCF method, an asset or liability’s fair value is estimated using explicit assumptions regarding the benefits and liabilities of ownership over the asset’s life including an exit or terminal value. The DCF method involves the projection of a series of cash flows the property asset will generate. To this projected cash flow series, an appropriate, market-derived discount rate is applied to establish the present value of the income stream associated with the real property.
Discount rate The rate of return used to convert a monetary sum, payable or receivable in the future, into present value. It reflects the opportunity cost of capital, that is, the rate of return the capital can earn if put to other uses having similar risk. The rate is determined with regards to market evidence and the external valuations performed.
20 year growth rate This is the rate that it is expected the unit will increase in value over 20 years. Growth rates from the external valuation reports are taken as a base to estimate the 20 year rate on a semi-annual basis.
Average length of stay of existing and future residents
Assumptions on future resident gender and entry age based upon analysis of historical entrant profiles are used to estimate average length of stay.
Current market value Market values are generally reviewed semi-annually by the sales and operational teams, and approved by the National Sales Manager and CEO Retirement Living.
Renovation/Reinstatement cost The cost that is required to maintain the ILUs and serviced apartments to the appropriate condition.
Renovation recoupment The percentage of renovation costs that will be recouped from the residents based on contractual terms.
Valuation process
The Retirement Living finance team are responsible for managing the bi-annual valuation process across Stockland’s Retirement Living portfolio. The aim of the valuation process is to ensure that assets are held at fair value on Stockland’s balance sheet.
DMF Internal valuations are completed every six months using valuation models with reference to external market data. An independent professionally qualified valuer who holds a recognised relevant professional qualification and has specialised expertise in the investment properties valued provides assurance on the key assumptions used. The most recent independent assessment was obtained at 30 June 2015.
Villages under construction Villages under construction are carried at fair value. There are two elements to the value of villages under construction – the value of land and other development expenditure and the value of discounted future cash flows from the DMF asset. The land and other development expenditure is made up of costs incurred to date plus a development margin. Development margin is recognised on a percentage of completion basis and is based on an internally certified level of completion of the stage. Development margin recognition is also described in Note (B2d). The DMF asset is recognised on a percentage completion basis.
Units are transferred from villages under construction to established villages once they have been leased for the first time. This transfer is at the cost of the unit plus development profit recognised during construction.
For
per
sona
l use
onl
y

Consolidated Notes Year ended 30 June 2015
Stockland Financial Report 2015 — 87
(C1C) RETIREMENT LIVING (CONTINUED)
Sensitivity information
Significant input Impact on fair value of an increase in input
Impact on fair value of a decrease in input
Discount rate Decrease Increase
20 year growth rate Increase Decrease
Average length of stay of existing and future residents1 Decrease Increase
Current market value of unit Increase Decrease
Renovation cost Decrease Increase
Renovation recoupment Increase Decrease
1 This is dependent on the length of stay as the majority of contracts have maximum DMF periods.
When assessing a DCF, the adopted discount rate and adopted terminal yield have a strong interrelationship in deriving a fair value given the discount rate will determine the rate in which the terminal value is discounted to the present value.
In theory, an increase (softening) in the discount rate and a decrease (tightening) in the adopted terminal yield could potentially offset the impact to the fair value. The same can be said for a decrease (tightening) in the discount rate and an increase (softening) in the adopted terminal yield. A directionally similar change in the discount rate and the adopted terminal yield could potentially magnify the impact to the fair value.
Resident obligations
Resident obligations represent the net amount owed by Stockland to current and former residents. Resident obligations are non-interest bearing and recognised at fair value.
Current resident obligations
Based on actuarial turnover calculations, in the short term 8% of residents are estimated to leave each year and therefore it is not expected that the full obligation to residents will fall due within one year. In the vast majority of cases, the resident obligations are able to be repaid from receipts from incoming residents.
Accounting Standards require that resident obligations are classified as current because all residents have the right to terminate their occupancy contract with immediate effect, and Stockland has no unconditional contractual right to defer settlement for at least 12 months.
Non-current resident obligations
Certain legacy contracts are classified as non-current as these contracts give Stockland a right to defer settlement for up to eight years.
Current
$M
Non-Current
$M
Total
$M
30 June 2015
Existing resident obligations 1,989 209 2,198
Former resident obligations 3 10 13
Total resident obligations 1,992 219 2,211
30 June 2014
Existing resident obligations 1,661 188 1,849
Former resident obligations 5 11 16
Total resident obligations 1,666 199 1,865
Fair value measurement, valuation techniques and inputs
The fair value of the resident obligations is the amount payable on demand to residents and comprises the initial loan amount plus the resident’s share of any capital gains in accordance with their contracts less DMF earned to date. Changes in fair value of resident obligations are recognised in profit or loss.
Inputs used in relation to the resident obligations are identical to those used for Investment Properties. Refer above for a detailed description of the inputs used.
For
per
sona
l use
onl
y

Consolidated Notes Year ended 30 June 2015
Stockland Financial Report 2015 — 88
(C1C) RETIREMENT LIVING (CONTINUED)
Valuation process
Resident obligations are calculated in the valuation model, as at the measurement date based on the initial loan amount paid by the resident adjusted for DMF and their share of capital gain or loss arising on the unit.
It is not possible to have the resident obligations valued externally, therefore these are valued every six months by the Directors as described above.
Sensitivity information
As the resident obligations are a financial liability, a quantitative sensitivity analysis as required by AASB 13 Fair Value Measurement has been disclosed. Sensitivity of the resident obligations to changes in the weighted assumptions are shown in the table below.
Increase/(Decrease) in resident obligations
Increase in input Decrease in input
Significant input Change in
assumption
2015
$M
2014
$M
2015
$M
2014
$M
Current market value 10% 124 114 (124) (114)
Current market value is the only input that will significantly impact the fair value of the resident obligation since this impacts the amount of any capital gain that will be shared between Stockland and the resident upon exit.
(C2) Financial assets and liabilities
KEEPING IT SIMPLE …
This section shows the financial assets and liabilities the Group generates through its trading activity.
Careful management of working capital ensures that the Group can meet its trading and financing obligations within its ordinary operating cycle. Cash and cash equivalents are disclosed in Note D2.
(C2a) Trade and other receivables
Trade and other receivables are recognised initially at fair value and subsequently measured at amortised cost using the effective interest rate method, less an allowance for impairment. Collectability of trade receivables is reviewed on an ongoing basis and at balance date, specific impairment losses are recorded for any doubtful accounts.
Stockland Stockland Trust Group
As at 30 June
2015$M
2014$M
2015 $M
2014$M
Current
Trade receivables 40 39 10 8
Provision for impairment (1) (1) – (1)
Net trade receivables 39 38 10 7
Other receivables 64 81 23 27
Total current trade and other receivables 103 119 33 34
Non-current
Straight-lining of rental income 54 49 57 52
Other receivables 38 28 – –
Receivables due from related companies – – 3,378 3,657
Total non-current trade and other receivables 92 77 3,435 3,709
For
per
sona
l use
onl
y

Consolidated Notes Year ended 30 June 2015
Stockland Financial Report 2015 — 89
(C2b) Trade and other payables
Trade and other payables are initially recognised at fair value less transaction costs and subsequently carried at amortised cost.
Stockland Stockland Trust Group
As at 30 June
Note 2015$M
2014$M
2015 $M
2014$M
Current
Trade payables and accruals 243 224 98 94
Land purchases 37 27 – –
Distributions payable (D8) 283 280 283 280
Goods and services tax (‘GST’) payable/(receivable) 32 23 (2) (2)
Total current trade and other payables 595 554 379 372
Non-current
Land purchases 33 49 – –
Other payables – 4 – –
Total non-current trade and other payables 33 53 – –
(C3) Other non-financial assets and liabilities
(C3a) Intangible assets
Intangible assets are an identifiable non-monetary asset without physical substance. Stockland has two types of intangible assets: goodwill and software. There are no intangible assets held in Stockland Trust Group.
Stockland
Goodwill
$M
Software
$M
Total
$M
Cost
Balance as at 1 July 2013 117 40 157
Additions – 18 18
Balance as at 30 June 2014 117 58 175
Additions – 22 22
Balance as at 30 June 2015 117 80 197
Amortisation and impairment losses
Balance as at 1 July 2013 – (17) (17)
Amortisation – (10) (10)
Impairment loss (23) – (23)
Balance as at 30 June 2014 (23) (27) (50)
Amortisation – (6) (6)
Impairment loss (18) (25) (43)
Balance as at 30 June 2015 (41) (58) (99)
Carrying amounts
As at 30 June 2014 94 31 125
As at 30 June 2015 76 22 98
For
per
sona
l use
onl
y

Consolidated Notes Year ended 30 June 2015
Stockland Financial Report 2015 — 90
(C3A) INTANGIBLE ASSETS (CONTINUED)
Goodwill
Goodwill represents the excess of the cost of an acquisition over the fair value of Stockland’s share of the net identifiable assets of the acquired subsidiary at the date of acquisition.
Goodwill that has an indefinite useful life is not subject to amortisation and is tested annually for impairment, or more frequently if events or changes in circumstances indicate that they might be impaired. An impairment loss is recognised for the amount by which the asset’s carrying amount exceeds its recoverable amount. The recoverable amount is the higher of an asset’s fair value less costs to sell and value in use.
For the purposes of assessing impairment, assets are grouped at the lowest levels for which goodwill is monitored for internal management purposes and allocated to cash-generating units (‘CGU’). The allocation is made to each CGU or groups of CGU that are expected to benefit from the business combination in which the goodwill arose, identified according to operating segments.
Goodwill arose on the acquisition of the Retirement Living division of Australian Retirement Communities (‘ARC’) on 28 February 2007, the acquisition of the Rylands Retirement Living business on 17 July 2008 and the acquisition of Aevum Limited on 31 October 2010.
Impairment Test
An impairment loss of $18 million (2014: $23 million) was fully allocated against goodwill and included in ‘impairment of intangibles’ in the profit or loss in the year. The goodwill impairment test is based upon the value in use method using cash flow projections for Retirement Living unrecognised development profits. Unrecognised development profits comprises of cash flows from both the development pipeline and deferred repayment contracts which are considered to benefit from the acquisitions.
An impairment arose as a result of cash flows related to the development pipeline and deferred repayment contracts. Changes to the mix and timing of development projects in the pipeline as well as changes in assumptions in the calculation of the net present value of the future cash flows for the development pipeline and development repayment contracts were the primary reasons for the impairment.
Deferred Repayment (‘DR’) Contracts
The ARC portfolio acquired in 2007, included a number of DR contracts. These DR contracts were initially sold prior to the Stockland acquisition at a wholesale price on development, and therefore were expected to result in higher conversion profit upon next settlement when they are priced at retail value and converted to Stockland target contracts.
The cash flows are discounted over their forecast maturity at 13.0% (2014: 12.8%) and cash flows beyond the five year period have been determined by applying a growth rate of 3.8% p.a. (2014: 3.9% p.a.). The growth rate applied does not exceed the long-term average rate for the Australian retirement living property market.
Development Pipeline
Future development cash flows are based on formal budgets approved by management expected to commence in the next five year period and future development pipeline assumptions. The cash flows incorporate projections for development costs, selling price and associated DMF for the Retirement Living Communities in the development pipeline.
Future cash flows are discounted at 15.0% (2014: 15.0%). Cash flows beyond the five year period have been determined by applying a growth rate of 3.8% p.a. (2014: 3.9% p.a.). The growth rate applied does not exceed the long-term average rate for the Australian Retirement Living property market.
Management believe that due to the extended time it takes to develop a village and the general long-term nature of Retirement Living Communities, where Stockland has the ability to manage assets over that extended period, it is reasonable to use a cash flow period of greater than five years.
Following the impairment loss recognised in the Retirement Living CGU, the recoverable amount is equal to the carrying amount. Therefore, any adverse movement in a key assumption would lead to further impairment.
For
per
sona
l use
onl
y

Consolidated Notes Year ended 30 June 2015
Stockland Financial Report 2015 — 91
(C3A) INTANGIBLE ASSETS (CONTINUED)
Software
Software is stated at cost less accumulated amortisation and impairment losses. Amounts incurred in design and testing of software are capitalised including employee costs and an appropriate part of relevant overheads where the software will generate probable future economic benefits.
Costs associated with maintaining software are recognised as an expense as incurred.
All software is amortised based on the straight-line method and using rates between 20-33% from the point at which the asset is ready for use. Amortisation is recognised in profit or loss. Rates used are consistent with the prior year.
The residual value, the useful life and the amortisation method applied to an asset are reviewed at least annually.
Impairment Test
An impairment loss of $25 million (2014: $ nil) was fully allocated against software and included in ‘impairment of intangibles’ in the profit or loss in the year. The impairment test is based upon the value in use method using the future benefit derived from the internal use of software. A strategic review of the IT systems identified software that will be abandoned or phased out over the next three years.
(C3b) Non-current assets held for sale
Non-current assets and disposal groups classified as held for sale are measured at the lower of their carrying amount and fair value less costs to sell. Investment Property held for sale will continue to be carried at fair value. Non-current assets and disposal groups are classified as held for sale if their carrying amounts will be recovered principally through a sale transaction rather than through continuing use. This condition is met only when the sale is highly probable and the asset or disposal group is available for immediate sale in its present condition. Management must be committed to the sale, which should be expected to qualify for recognition as a completed sale within one year from the date of classification.
Property, plant and equipment are not depreciated once classified as held for sale.
Stockland Stockland Trust Group
2015
$M 2014
$M 2015
$M 2014
$M
Waterfront Place & Eagle Street Pier joint ventures 246 – 222 –
Inventory transferred from UK – 39 – –
Investment Properties transferred from Retirement Living – 8 – –
Property, plant & equipment – Aged Care – 73 – –
Total non-current assets held for sale 246 120 222 –
At 30 June 2015, Stockland has reclassified the Waterfront Place & Eagle Street Pier joint ventures as held for sale which are owned by the Trust and the Company, respectively. Refer to Note (E1a).
During the year, Stockland completed the sale of all assets classified as held for sale at 30 June 2014. These assets were previously written down to their sale value at 30 June 2014.
For
per
sona
l use
onl
y

Consolidated Notes Year ended 30 June 2015
Stockland Financial Report 2015 — 92
(D) Capital Structure and Financing Costs
IN THIS SECTION
This section outlines how Stockland and the Stockland Trust Group manages its capital structure and related financing costs, including its balance sheet liquidity and access to capital markets.
The Board determines the appropriate capital structure of Stockland, specifically, how much is raised from shareholders (equity) and how much is borrowed from financial institutions and capital markets (debt), in order to finance Stockland's activities both now and in the future.
The Board considers Stockland’s and the Stockland Trust Group's capital structure and its dividend and distribution policy at least twice a year ahead of announcing results, in the context of its ability to continue as a going concern, to execute the strategy and to deliver its business plan. During the year Stockland’s credit rating remained unchanged at A-/Stable, and the Board continued to focus on improving the efficiency of the balance sheet.
Stockland and Stockland Trust Group is exposed to changes in interest rates on its net borrowings and to changes in foreign exchange rates on its foreign currency transactions and net assets. In accordance with risk management policies, Stockland and Stockland Trust Group uses derivatives to hedge these underlying exposures.
(D1) Net financing costs
KEEPING IT SIMPLE …
This section details the interest income generated on the Group's cash and other financial assets and the interest expense incurred on borrowings and other financial assets and liabilities. The presentation of the net financing costs in this note reflects income and expenses according to the classification of the financial instruments.
Mark-to-market movements reflect the change in value of our derivative instruments between the later of inception or 1 July 2014 and 30 June 2015. The value at year end is not necessarily the same as the value at which they will be settled at maturity.
Finance income includes interest receivable on funds invested, any net gains on fair value movement of effective and ineffective hedged items, financial instruments and any net foreign exchange gains recognised in profit or loss.
Interest income is recognised in profit or loss as it accrues using the effective interest method and if not received at balance date, is reflected in the balance sheet as a receivable.
Finance costs include interest payable on short-term and long-term borrowings calculated using the effective interest method, payments on derivatives, losses on hedging instruments that are recognised in profit or loss and amortisation of ancillary costs incurred in connection with arrangement of borrowings.
Finance costs are expensed as incurred except to the extent that they are directly attributable to the acquisition, construction or production of a qualifying asset such as investment properties or inventories. Qualifying assets are assets that necessarily take a substantial period of time to reach the stage of their intended use or sale.
In these circumstances, borrowing costs are capitalised to the cost of the assets whilst in active development until the assets are ready for their intended use or sale. Total interest capitalised must not exceed the net interest expense in any period. Project carrying values, including all capitalised interest attributable to projects, must continue to be recoverable based on the latest project feasibilities. In the event that development is suspended for an extended period of time or the decision is taken to dispose of the asset, the capitalisation of borrowing costs is also suspended.
The rate at which interest has been capitalised to qualifying assets is disclosed in Note (C1).
Where funds are borrowed generally, borrowing costs are capitalised using a weighted average capitalisation rate applied to the expenditures on the asset excluding specific borrowings.
The fair value of derivatives is discussed further at Note (D5).
For
per
sona
l use
onl
y
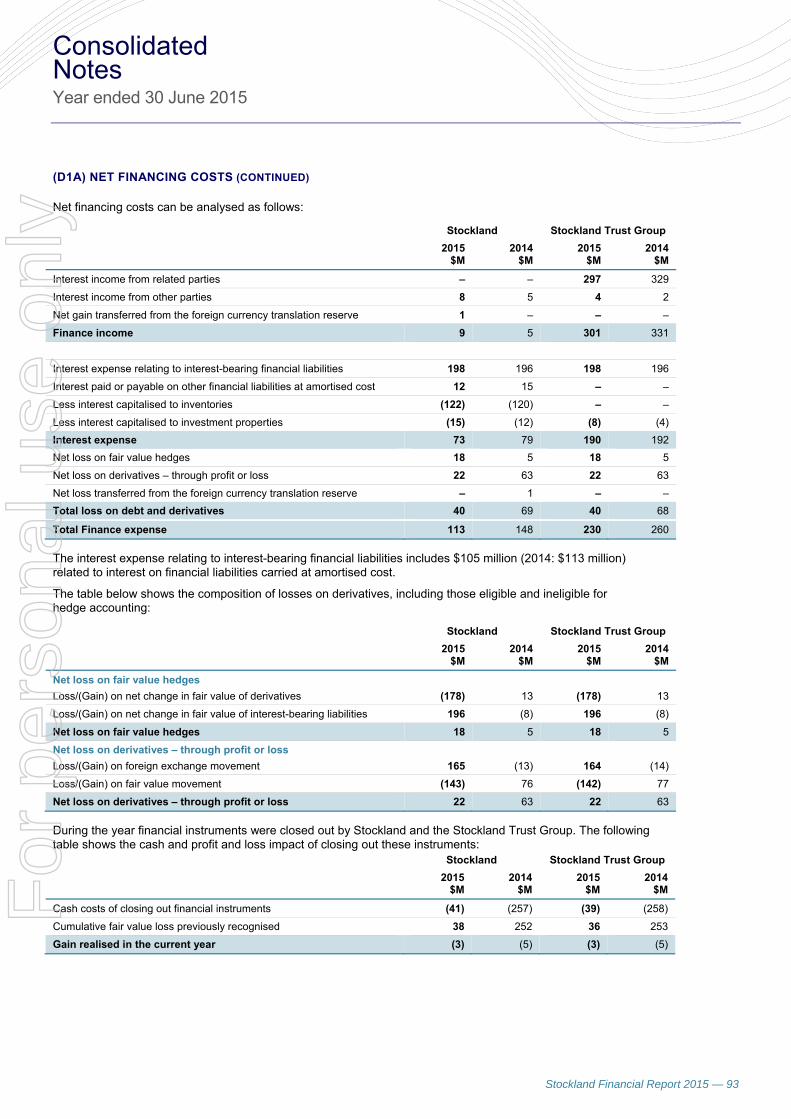
Consolidated Notes Year ended 30 June 2015
Stockland Financial Report 2015 — 93
(D1A) NET FINANCING COSTS (CONTINUED)
Net financing costs can be analysed as follows:
Stockland Stockland Trust Group
2015
$M 2014
$M 2015
$M 2014
$M
Interest income from related parties – – 297 329
Interest income from other parties 8 5 4 2
Net gain transferred from the foreign currency translation reserve 1 – – –
Finance income 9 5 301 331
Interest expense relating to interest-bearing financial liabilities 198 196 198 196
Interest paid or payable on other financial liabilities at amortised cost 12 15 – –
Less interest capitalised to inventories (122) (120) – –
Less interest capitalised to investment properties (15) (12) (8) (4)
Interest expense 73 79 190 192
Net loss on fair value hedges 18 5 18 5
Net loss on derivatives – through profit or loss 22 63 22 63
Net loss transferred from the foreign currency translation reserve – 1 – –
Total loss on debt and derivatives 40 69 40 68
Total Finance expense 113 148 230 260
The interest expense relating to interest-bearing financial liabilities includes $105 million (2014: $113 million) related to interest on financial liabilities carried at amortised cost.
The table below shows the composition of losses on derivatives, including those eligible and ineligible for hedge accounting:
Stockland Stockland Trust Group
2015
$M 2014
$M 2015
$M 2014
$M
Net loss on fair value hedges
Loss/(Gain) on net change in fair value of derivatives (178) 13 (178) 13
Loss/(Gain) on net change in fair value of interest-bearing liabilities 196 (8) 196 (8)
Net loss on fair value hedges 18 5 18 5
Net loss on derivatives – through profit or loss
Loss/(Gain) on foreign exchange movement 165 (13) 164 (14)
Loss/(Gain) on fair value movement (143) 76 (142) 77
Net loss on derivatives – through profit or loss 22 63 22 63
During the year financial instruments were closed out by Stockland and the Stockland Trust Group. The following table shows the cash and profit and loss impact of closing out these instruments:
Stockland Stockland Trust Group
2015
$M 2014
$M 2015
$M 2014
$M
Cash costs of closing out financial instruments (41) (257) (39) (258)
Cumulative fair value loss previously recognised 38 252 36 253
Gain realised in the current year (3) (5) (3) (5)
For
per
sona
l use
onl
y

Consolidated Notes Year ended 30 June 2015
Stockland Financial Report 2015 — 94
(D2) Cash and cash equivalents Cash and cash equivalents comprise cash balances and at call deposits. Bank overdrafts that are repayable on demand form an integral part of Stockland’s cash management and are included as a component of cash and cash equivalents for the purpose of the Cash Flow Statement. As at 30 June 2015 Stockland does not have any bank overdrafts.
Included in the cash and cash equivalents balance is $58 million (2014: $49 million) in cash that is held to satisfy real estate and financial services licensing requirements and is not immediately available for use by the Group.
(D3) Interest-bearing loans and borrowings
KEEPING IT SIMPLE …
Stockland and the Stockland Trust Group borrow money from financial institutions and debt investors in the form of bonds and other financial instruments. Stockland and the Stockland Trust Group’s bonds generally have fixed interest rates and are for a fixed term.
The interest payable and receivable on these instruments are shown in the net financing costs note in (D1).
Interest-bearing loans and borrowings are recognised initially at fair value less attributable transaction costs and subsequently are stated at amortised cost. Any difference between cost and redemption value are recognised in profit or loss over the period of the borrowings using the effective interest method. However, where an effective fair value hedge is in place, borrowings are carried at fair value and changes in the fair value are recognised in profit or loss. Refer to Note (D5) for further details of measuring fair value of interest-bearing loans and borrowings.
Stockland Stockland Trust Group
Note 2015
$M 2014
$M 2015
$M 2014
$M
Current
Unsecured
Foreign medium term notes (D3a) 286 92 286 92
Domestic medium term notes (D3b) – 264 – 264
Total current debt 286 356 286 356
Non-current
Unsecured
Foreign medium term notes (D3a) 2,259 1,778 2,259 1,778
Domestic medium term notes (D3b) 458 458 458 458
Bank facilities (D3c) 280 526 280 526
Total non-current debt 2,997 2,762 2,997 2,762
Fair values versus carrying amounts
All financial instruments recognised on the balance sheet are recognised at amounts that represent a reasonable approximation of fair value, with the exception of the following borrowings:
Stockland and Stockland Trust Group
Carrying amount
2015
$M
Fairvalue2015
$M
Carrying amount
2014
$M
Fairvalue2014
$M
Foreign medium term notes 2,545 2,740 1,870 2,017
Domestic medium term notes 458 510 722 781
Total medium notes 3,003 3,250 2,592 2,798
The difference of $247 million (2014: $206 million) between the carrying amount and fair value of the domestic and foreign medium term notes is due to certain notes being carried at amortised cost under AASB 139 Financial Instruments: Recognition and Measurement, while the fair value represents the amount required to replicate at balance date the principal and duration of these notes based on current market interest rates and conditions.
For
per
sona
l use
onl
y

Consolidated Notes Year ended 30 June 2015
Stockland Financial Report 2015 — 95
(D3a) Foreign medium term notes
Stockland and Stockland Trust Group
US private placement During previous financial years, Stockland issued notes in the US private placement market. All notes were issued at a fixed coupon and all notes that were issued in USD were converted back to AUD principal and AUD floating coupons through Cross Currency Interest Rate Swaps (‘CCIRS’).
During the year, Stockland repaid USD 85 million (AUD 103 million) of its notes that were issued in the US private placement market and matured in July 2014 and June 2015.
The fair value of the US private placements as at 30 June 2015 is $1,977 million (2014: $1,742 million). Details of the foreign medium term notes on issue in the US private placement market are set out below.
In June 2015, Stockland secured new 10, 12 and 15 year notes in the US private placement market to the equivalent of AUD 359 million. The placement was issued in three tranches; USD 120 million (AUD 157 million) of 10 year notes, USD 100 million (AUD 130 million) of 12 year notes and USD 55 million (AUD 72 million) of 15 year notes. These three USD tranches were fully hedged into AUD in terms of both principal and interest components through CCIRS. Although there is a firm commitment from investors, the funding will not be delivered until 24 August 2015 and in accordance with Accounting Standards the debt principal has not been booked in the balance sheet at 30 June 2015. A total fair value of $6 million has been recognised at 30 June 2015, representing the difference in fair value of the notes between trade date and balance date.
Face value1 Carrying amount
Maturity date Fixed rate
coupon FloatingCCIRS2
2015$M
2014$M
2015 $M
2014$M
July 2014 4.89% 0.71% - 0.70% – 28 – 23
June 2015 5.81% 0.39% – 75 – 69
July 2015 4.99% 0.78% - 0.77% 64 64 65 54
October 2015 5.72% 0.70% - 0.60% 99 99 86 73
July 2016 5.04% 0.79% - 0.78% 62 62 63 52
October 2016 5.87% 0.76% 27 27 25 21
June 2017 5.93% 0.48% - 0.76% 188 179 239 201
October 2017 5.96% 0.76% 61 61 57 48
June 2018 5.98% 0.25% 250 250 217 179
October 2018 6.01% 0.73% - 0.65% 269 269 257 215
July 2019 5.19% 0.85% - 0.83% 71 71 73 60
July 2020 5.24% 0.87% - 0.86% 90 90 94 78
September 2021 4.32% 2.44% - 2.48% 176 176 246 198
June 2022 6.15% 1.00% 28 28 40 34
August 2022 3.99%/6.80% 2.93% - 3.08% 105 105 104 102
August 2024 4.14% 2.99% 50 50 47 47
August 2025 3.75% 1.62% –3 – 2 –
June 2027 6.28% 0.87% 20 20 32 28
August 2027 3.85% 1.63% –3 – 2 –
February 2029 4.67% 1.52% 141 141 180 142
August 2030 4.00% 1.69% –3 – 2 –
Total 1,701 1,795 1,831 1,624
Less: attributable transaction costs (2) (3)
Total Balance Sheet carrying amount 1,829 1,621
1 Face value of the notes in Australian dollars after the effect of the CCIRS. 2 Variable interest rate margin above the 90 day bank bill rate. The 90 day bank bill rate as at 30 June 2015 was 2.15% (2014: 2.71%). 3 New US private placement notes were transacted in June 2015 and will settle in August 2015. The carrying amount represents the fair value
movement in the notes from trade date to balance date.
For
per
sona
l use
onl
y

Consolidated Notes Year ended 30 June 2015
Stockland Financial Report 2015 — 96
(D3A) FOREIGN MEDIUM TERM NOTES (CONTINUED)
Asian and European private placement Stockland issued medium term notes into the Asian private placement market with a face value of $151 million (JPY 13,000 million) in the 2006 financial year and further placements of $62 million (HKD 470 million) in the 2013 financial year and $55 million (HKD 400 million) in the 2014 financial year.
During the year, Stockland issued a seven year Green Bond with a face value of EUR 300 million (AUD 433 million) into the European private placement market.
At 30 June 2015, notes outstanding in the Asian private placement market with a face value of $151 million (JPY 13,000 million) have been classified as a current liability based on management’s intent to redeem these notes within 12 months. On 24 August 2015, Stockland will redeem these notes ahead of the 2035 maturity date, as part of its ongoing capital management program.
All notes were issued at a fixed coupon payable in USD, HKD or EUR and converted back to AUD floating coupons through cross currency principal and interest rate swaps.
The fair value of the notes as at 30 June 2015 is $763 million (2014: $275 million). Details of the foreign medium term notes on issue in the Asian and European private placement market are set out below:
Face value1 Carrying amount
Maturity date Fixed rate
coupon Floating CCIRS2
2015$M
2014$M
2015 $M
2014$M
August 20153 3.99% 0.80% 151 151 135 133
November 2021 1.50% 1.48% 433 – 435 –
May 2025 3.37% 1.63% 62 62 77 60
October 2025 4.00% 1.63% 55 55 73 57
Total 701 268 720 250
Less: attributable transaction costs (4) (1)
Total Balance Sheet carrying amount 716 249
1 Face value of the notes in Australian dollars after the effect of the CCIRS. 2 Variable interest rate margin above the 90 day bank bill rate. The 90 day bank bill rate as at 30 June 2015 was 2.15% (2014: 2.71%). 3 Prior to Stockland’s election to early redeem these notes on August 2015, the maturity was August 2035.
(D3b) Domestic medium term notes
Medium term notes have been issued at either face value, or at a discount or premium to face value and are carried at amortised cost. The discount or premium is amortised to finance costs over the term of the notes. The medium term notes are issued on either fixed or floating interest rate terms.
During the year, $264 million of maturing medium term notes were repaid in February 2015.
The fair value of the notes as at 30 June 2015 is $510 million (2014: $781 million). Details of unsecured domestic medium term notes on issue are set out below:
Maturity date Fixed rate
coupon 2015
$M 2014
$M
February 2015 8.50% – 264
July 2016 7.50% 150 150
September 2019 5.50% 150 150
November 2020 8.25% 160 160
Total 460 724
Less: attributable transaction costs (2) (2)
Total Balance Sheet carrying amount at amortised cost 458 722
For
per
sona
l use
onl
y

Consolidated Notes Year ended 30 June 2015
Stockland Financial Report 2015 — 97
(D3c) Bank facilities
Stockland and Stockland Trust Group
The bank facilities are multi-use facilities which may be used partially for bank guarantees. Bank facilities are unsecured and held at amortised cost. Details of maturity dates and security for facilities, excluding bank guarantee facilities (refer to Note (F4)), are set out below:
2015 $M
2014 $M Maturity date
2015$M
2014$M
– 100 July 2015 – –
– 470 August 2015 – 346
– 100 September 2015 – –
– 100 December 2015 – –
100 – July 2016 – –
120 – August 2016 – –
200 175 December 2016 – –
– 100 January 2017 – –
250 – January 2018 30 –
– 150 February 2018 – 140
– 175 November 2018 – 40
150 – February 2019 150 –
100 – November 2019 100 –
920 1,370 280 526
(D4) Other financial assets and liabilities
KEEPING IT SIMPLE …
A derivative is a type of financial instrument typically used to manage risk. A derivative's value changes over time in response to underlying variables such as exchange rates or interest rates and is entered into for a fixed period. A hedge is where a derivative is used to manage an underlying exposure. Stockland uses derivatives to manage exposure to foreign exchange and interest rate risk.
Investments in other financial assets are managed in accordance with Stockland’s documented risk policy. Based on the nature of the asset and its purpose, movements in the fair value of other financial assets are recognised in either through profit or loss or other comprehensive income.
Investments in other entities
The fair value of ‘Securities in listed entities’ is determined by reference to the quoted bid price of the entity at balance date.
The fair value of ‘Units in unlisted entities’ is determined by reference to the net assets of the underlying investments at balance date.
These investments are included in ‘Non-current assets – Other financial assets’ unless Stockland intends to dispose of the investment within 12 months of balance date in which case the investment is classified as ‘Current assets – Other financial assets’.
An investment is derecognised when Stockland has transferred the contractual rights to receive cash flows from the investment and substantially all the risks and rewards of ownership of the investment to a third party. If an investment does not qualify for derecognition, the investment will continue to be recognised and a liability recognised for the consideration received. If the investment will qualify for derecognition within 12 months of balance date, the liability is recorded as ‘Current liabilities – Other liabilities’.
For
per
sona
l use
onl
y
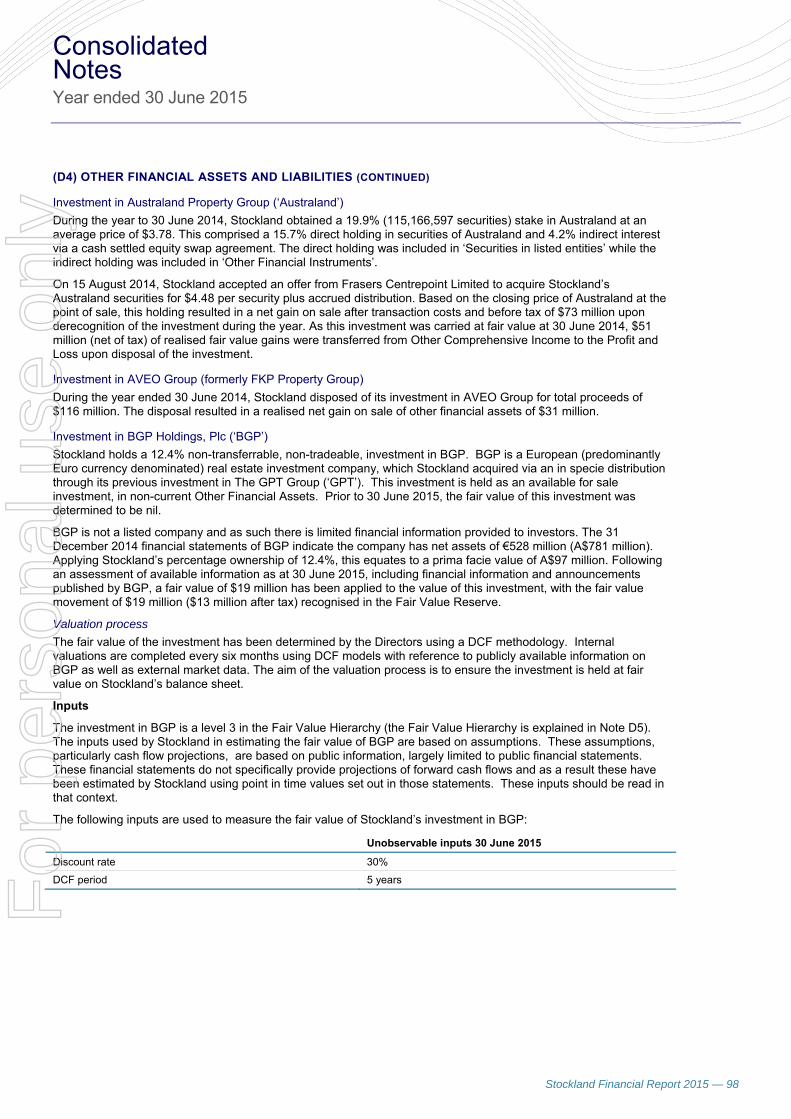
Consolidated Notes Year ended 30 June 2015
Stockland Financial Report 2015 — 98
(D4) OTHER FINANCIAL ASSETS AND LIABILITIES (CONTINUED)
Investment in Australand Property Group (‘Australand’)
During the year to 30 June 2014, Stockland obtained a 19.9% (115,166,597 securities) stake in Australand at an average price of $3.78. This comprised a 15.7% direct holding in securities of Australand and 4.2% indirect interest via a cash settled equity swap agreement. The direct holding was included in ‘Securities in listed entities’ while the indirect holding was included in ‘Other Financial Instruments’.
On 15 August 2014, Stockland accepted an offer from Frasers Centrepoint Limited to acquire Stockland’s Australand securities for $4.48 per security plus accrued distribution. Based on the closing price of Australand at the point of sale, this holding resulted in a net gain on sale after transaction costs and before tax of $73 million upon derecognition of the investment during the year. As this investment was carried at fair value at 30 June 2014, $51 million (net of tax) of realised fair value gains were transferred from Other Comprehensive Income to the Profit and Loss upon disposal of the investment.
Investment in AVEO Group (formerly FKP Property Group)
During the year ended 30 June 2014, Stockland disposed of its investment in AVEO Group for total proceeds of $116 million. The disposal resulted in a realised net gain on sale of other financial assets of $31 million.
Investment in BGP Holdings, Plc (‘BGP’)
Stockland holds a 12.4% non-transferrable, non-tradeable, investment in BGP. BGP is a European (predominantly Euro currency denominated) real estate investment company, which Stockland acquired via an in specie distribution through its previous investment in The GPT Group (‘GPT’). This investment is held as an available for sale investment, in non-current Other Financial Assets. Prior to 30 June 2015, the fair value of this investment was determined to be nil.
BGP is not a listed company and as such there is limited financial information provided to investors. The 31 December 2014 financial statements of BGP indicate the company has net assets of €528 million (A$781 million). Applying Stockland’s percentage ownership of 12.4%, this equates to a prima facie value of A$97 million. Following an assessment of available information as at 30 June 2015, including financial information and announcements published by BGP, a fair value of $19 million has been applied to the value of this investment, with the fair value movement of $19 million ($13 million after tax) recognised in the Fair Value Reserve.
Valuation process
The fair value of the investment has been determined by the Directors using a DCF methodology. Internal valuations are completed every six months using DCF models with reference to publicly available information on BGP as well as external market data. The aim of the valuation process is to ensure the investment is held at fair value on Stockland’s balance sheet.
Inputs
The investment in BGP is a level 3 in the Fair Value Hierarchy (the Fair Value Hierarchy is explained in Note D5). The inputs used by Stockland in estimating the fair value of BGP are based on assumptions. These assumptions, particularly cash flow projections, are based on public information, largely limited to public financial statements. These financial statements do not specifically provide projections of forward cash flows and as a result these have been estimated by Stockland using point in time values set out in those statements. These inputs should be read in that context.
The following inputs are used to measure the fair value of Stockland’s investment in BGP:
Unobservable inputs 30 June 2015
Discount rate 30%
DCF period 5 years
For
per
sona
l use
onl
y

Consolidated Notes Year ended 30 June 2015
Stockland Financial Report 2015 — 99
(D4) OTHER FINANCIAL ASSETS AND LIABILITIES (CONTINUED)
These unobservable inputs are further explained below:
Item Description
DCF method Under the DCF method, an asset or liability’s fair value is estimated using explicit assumptions regarding the benefits and liabilities of ownership over the asset’s life. The DCF method involves the assumption of a series of cash flows based on the valuations of BGP’s assets contained within BGP’s financial statements. To this projected cash flow series, an appropriate, market-derived discount rate is assumed to estimate the present value of the income stream associated with the asset.
Discount rate The rate of return used to convert a monetary sum, payable or receivable in the future, into present value. It reflects the opportunity cost of capital, that is, the rate of return the capital can earn if put to other uses having similar risk. In the case of BGP, this includes having regard to public statements by BGP on the progress of its asset disposal process as well as an assessment of the current European economic climate and the impact that might have on asset values. BGP is a highly illiquid asset and the assumed cash flows are highly uncertain, therefore a discount rate of 30% has been used as the unobservable input.
DCF period This represents an assumption of the number of years it will take in order for the shareholders to receive a distribution following the sale of assets or Initial Public Offering (IPO). Notwithstanding BGP’s stated intention to divest its investment asset portfolio there is a risk any such disposal process will be prolonged given the current environment in Europe. Sensitivities around unobservable inputs are set out below.
Sensitivity information
When assessing the valuation of the BGP investment, a change in the assumed discount rate or DCF period, would impact the valuation. In theory, a decrease in the discount rate and/or DCF period would increase the fair value of the investment, and an increase in the discount rate and/or DCF period would decrease the fair value. Sensitivity of the investment fair value (pre-tax) to changes in the weighted assumptions is shown in the table below.
Increase / (Decrease) in Fair Value
Increase in input Decrease in input
Significant input Change in
assumption
2015
$M
2015
$M
Discount rate 10% (6) 9
DCF period 2 years (8) 19
Derivative financial instruments
Stockland holds a number of derivative instruments including interest rate swaps, foreign exchange contracts and CCIRS.
Derivative financial instruments are recognised initially at fair value and remeasured at each balance date.
The fair value of interest rate swaps is the estimated amount that the Group would receive or pay to transfer the swap at the reporting date, taking into account current interest rates and the current creditworthiness of swap counterparties.
The fair value of forward foreign exchange contracts is determined by using the difference between the contract exchange rate and the quoted forward exchange rate at the reporting date.
Third party valuations are used to determine the fair value of the Group's derivatives. The valuation techniques use inputs such as interest rate yield curves and currency prices/yields, volatilities of underlying instruments and correlations between inputs.
The gain or loss on re-measurement to fair value is recognised in profit or loss. However, where derivatives qualify for hedge accounting, recognition of any resultant gain or loss depends on the nature of the item being hedged, refer below.
Stockland enters into ISDA Master Agreements with its derivative counterparties. Under the terms of these arrangements, where certain credit events occur, the net position owing/receivable to a single counterparty in relation to all outstanding derivatives with that counterparty, will be taken as owing/receivable and all the relevant arrangements terminated. As Stockland does not presently have a legally enforceable right of set-off, these amounts have not been offset in the balance sheet. In the event a credit event occurred, the ISDA Master Agreement would allow reduction to derivative assets and derivative liabilities of the same amount of $123 million (2014: $110 million).
For
per
sona
l use
onl
y

Consolidated Notes Year ended 30 June 2015
Stockland Financial Report 2015 — 100
(D4) OTHER FINANCIAL ASSETS AND LIABILITIES (CONTINUED)
Derivatives that qualify for hedge accounting
Stockland uses a limited number of derivative financial instruments to hedge its exposure to fluctuations in interest and foreign exchange rates. At the inception of the transaction, Stockland designates and documents these derivative instruments into a hedging relationship with the hedged items, as well as its risk management objective and strategy for undertaking various hedge transactions.
Stockland also documents its assessment, both at hedge inception and on an ongoing basis, of whether the derivatives that are used in hedging transactions have been and will continue to be highly effective in offsetting changes in fair values or cash flows of hedged items.
Fair value hedge
A fair value hedge is a hedge of the exposure to changes in fair value of an asset or liability that is attributable to a particular risk.
Changes in the fair value of derivatives that are designated and qualify as fair value hedges are recorded in profit or loss, together with any changes in the fair value of the hedged asset or liability that are attributable to the hedged risk.
Hedge accounting is discontinued when the hedging instrument matures or is sold, terminated or exercised, no longer qualifies for hedge accounting, or when Stockland revokes designation. Any adjustment between the carrying amount and the face value of a hedged financial instrument is amortised to profit or loss using the effective interest rate method. Amortisation begins when the hedged item ceases to be adjusted for changes in its fair value attributable to the risk being hedged.
Cash flow hedge
A cash flow hedge is a hedge of the exposure to variability in cash flows attributable to a particular risk associated with an asset, liability or highly probable forecast transaction that could affect profit or loss.
The effective portion of changes in the fair value of derivatives that are designated and qualify as cash flow hedges is recognised in equity in the cash flow hedge reserve. The gain or loss relating to the ineffective portion is recognised immediately in profit or loss within finance income or expense.
Amounts in the cash flow hedge reserve are recognised in profit or loss in the periods when the hedged item is recognised in profit or loss.
When the forecast transaction that is hedged results in the recognition of a non-financial asset or a non-financial liability, the gains and losses previously in the cash flow hedge reserve are transferred from equity and included in the initial measurement of the cost of the asset or liability.
Hedge accounting is discontinued when the hedging instrument matures or is sold, terminated or exercised, no longer qualifies for hedge accounting, or when Stockland revokes designation. Any cumulative gain or loss recognised in equity at that time remains in equity and is recognised when the forecast transaction is ultimately recognised in profit or loss. When a forecast transaction is no longer expected to occur, the cumulative gain or loss that was recognised in equity is recognised immediately in profit or loss.
For
per
sona
l use
onl
y
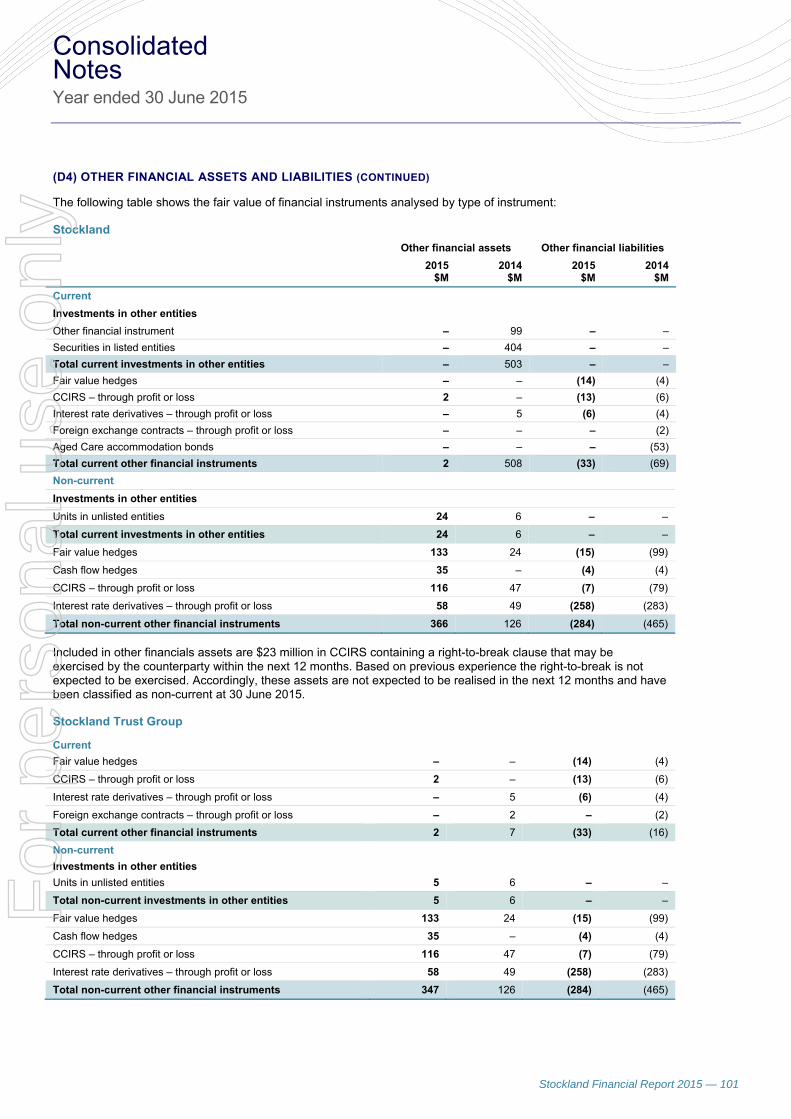
Consolidated Notes Year ended 30 June 2015
Stockland Financial Report 2015 — 101
(D4) OTHER FINANCIAL ASSETS AND LIABILITIES (CONTINUED)
The following table shows the fair value of financial instruments analysed by type of instrument:
Stockland Other financial assets Other financial liabilities
2015
$M 2014
$M 2015
$M 2014
$M
Current
Investments in other entities
Other financial instrument – 99 – –
Securities in listed entities – 404 – –
Total current investments in other entities – 503 – –
Fair value hedges – – (14) (4)
CCIRS – through profit or loss 2 – (13) (6)
Interest rate derivatives – through profit or loss – 5 (6) (4)
Foreign exchange contracts – through profit or loss – – – (2)
Aged Care accommodation bonds – – – (53)
Total current other financial instruments 2 508 (33) (69)
Non-current
Investments in other entities
Units in unlisted entities 24 6 – –
Total current investments in other entities 24 6 – –
Fair value hedges 133 24 (15) (99)
Cash flow hedges 35 – (4) (4)
CCIRS – through profit or loss 116 47 (7) (79)
Interest rate derivatives – through profit or loss 58 49 (258) (283)
Total non-current other financial instruments 366 126 (284) (465)
Included in other financials assets are $23 million in CCIRS containing a right-to-break clause that may be exercised by the counterparty within the next 12 months. Based on previous experience the right-to-break is not expected to be exercised. Accordingly, these assets are not expected to be realised in the next 12 months and have been classified as non-current at 30 June 2015.
Stockland Trust Group
Current
Fair value hedges – – (14) (4)
CCIRS – through profit or loss 2 – (13) (6)
Interest rate derivatives – through profit or loss – 5 (6) (4)
Foreign exchange contracts – through profit or loss – 2 – (2)
Total current other financial instruments 2 7 (33) (16)
Non-current
Investments in other entities
Units in unlisted entities 5 6 – –
Total non-current investments in other entities 5 6 – –
Fair value hedges 133 24 (15) (99)
Cash flow hedges 35 – (4) (4)
CCIRS – through profit or loss 116 47 (7) (79)
Interest rate derivatives – through profit or loss 58 49 (258) (283)
Total non-current other financial instruments 347 126 (284) (465)
For
per
sona
l use
onl
y

Consolidated Notes Year ended 30 June 2015
Stockland Financial Report 2015 — 102
(D5) Fair value hierarchy
KEEPING IT SIMPLE …
The financial instruments included on the Balance Sheet are measured at either fair value or amortised cost. The measurement of this fair value may in some cases be subjective and may depend on the inputs used in the calculations. Stockland generally uses external valuations based on market inputs or market values (e.g. external share prices). The different valuation methods are called ‘hierarchies’ and are described below.
• Level 1: quoted prices (unadjusted) in active markets for identical assets or liabilities;
• Level 2: inputs other than quoted prices included within Level 1 that are observable for the asset or liability, either directly (i.e. as prices) or indirectly (i.e. derived from prices); and
• Level 3: inputs for the asset or liability that are not based on observable market data (‘unobservable inputs’).
Determination of fair value
The fair value of derivative financial instruments, including domestic and foreign medium term notes, interest rate derivatives and CCIRS, is determined in accordance with generally accepted pricing models by discounting the expected future cash flows using assumptions supported by observable market rates. Whilst certain derivatives are not quoted in an active market, Stockland has determined the fair value of these derivatives using quoted market inputs (e.g. interest rates, volatility, and exchange rates) adjusted for specific features of the instruments and debit or credit value adjustments based on Stockland or the derivative counterparties current credit worthiness.
The fair value of forward exchange contracts is the quoted market price of the derivative at balance date, being the present value of the quoted forward price.
The table below sets out the financial instruments included on the Balance Sheet at ‘fair value’.
Quantitative sensitivities required under AASB 13 Fair Value Measurement in relation to the Retirement Living resident obligations have been disclosed in Note (C1c).
Stockland
Level 1
$M Level 2
$M Level 3
$M Total
$M
2015
Financial assets carried at fair value
Units in unlisted entities – – 24 24
Derivative assets – 344 – 344
Total financial assets carried at fair value – 344 24 368
Financial liabilities carried at fair value
Derivative liabilities – (304) (13) (317)
Retirement Living resident obligations – – (2,211) (2,211)
Total financial liabilities carried at fair value – (304) (2,224) (2,528)
Net position – 40 (2,200) (2,160)
2014
Financial assets carried at fair value
Securities in listed entities 404 – – 404
Units in unlisted entities – – 6 6
Derivative assets – 125 – 125
Other financial instrument – 99 – 99
Total financial assets carried at fair value 404 224 6 634
Financial liabilities carried at fair value
Derivative liabilities – (470) (11) (481)
Aged care accommodation bonds – – (53) (53)
Retirement Living resident obligations – – (1,865) (1,865)
Total financial liabilities carried at fair value – (470) (1,929) (2,399)
Net position 404 (246) (1,923) (1,765)
For
per
sona
l use
onl
y

Consolidated Notes Year ended 30 June 2015
Stockland Financial Report 2015 — 103
(D5) FAIR VALUE HIERARCHY (CONTINUED)
Stockland Trust Group
Level 1
$M Level 2
$M Level 3
$M Total
$M
2015
Financial assets carried at fair value
Units in unlisted entities – – 5 5
Derivative assets – 344 - 344
Total financial assets carried at fair value – 344 5 349
Financial liabilities carried at fair value
Derivative liabilities – (304) (13) (317)
Total financial liabilities carried at fair value – (304) (13) (317)
Net position – 40 (8) 32
2014
Financial assets carried at fair value
Units in unlisted entities – – 6 6
Derivative assets – 127 – 127
Total financial assets carried at fair value – 127 6 133
Financial liabilities carried at fair value
Derivative liabilities – (470) (11) (481)
Total financial liabilities carried at fair value – (470) (11) (481)
Net position – (343) (5) (348)
Derivative financial assets and liabilities are not offset in the balance sheet as under agreements held with derivative counterparties, Stockland and the Stockland Trust Group do not have a legally enforceable right to set-off the position payable/receivable to a single counterparty.
The following table shows a reconciliation from the opening balances to the closing balances for fair value measurements in Level 3 of the fair value hierarchy:
Stockland
Units in unlisted entities
$M
Derivatives
$M
Aged Care bonds
$M
Retirement Living
resident obligations
$M
Total
$M
Balance at 1 July 2013 20 1 (56) (1,774) (1,809)
Total gains and losses recognised in:
• profit or loss – (12) – 72 60
Other transfers – – (7) 7 –
Net cash settled on resident turnover – – 10 (170) (160)
Capital distributions (14) – – – (14)
Balance at 30 June 2014 6 (11) (53) (1,865) (1,923)
Total gains and losses recognised in:
• profit or loss – (2) – (25) (27)
• other comprehensive income 19 – – – 19
Net cash settled on resident turnover – – – (146) (146)
Purchased – – – (175) (175)
Disposal of Aged Care bonds – – 53 – 53
Capital distributions (1) – – – (1)
Balance at 30 June 2015 24 (13) – (2,211) (2,200)
For
per
sona
l use
onl
y
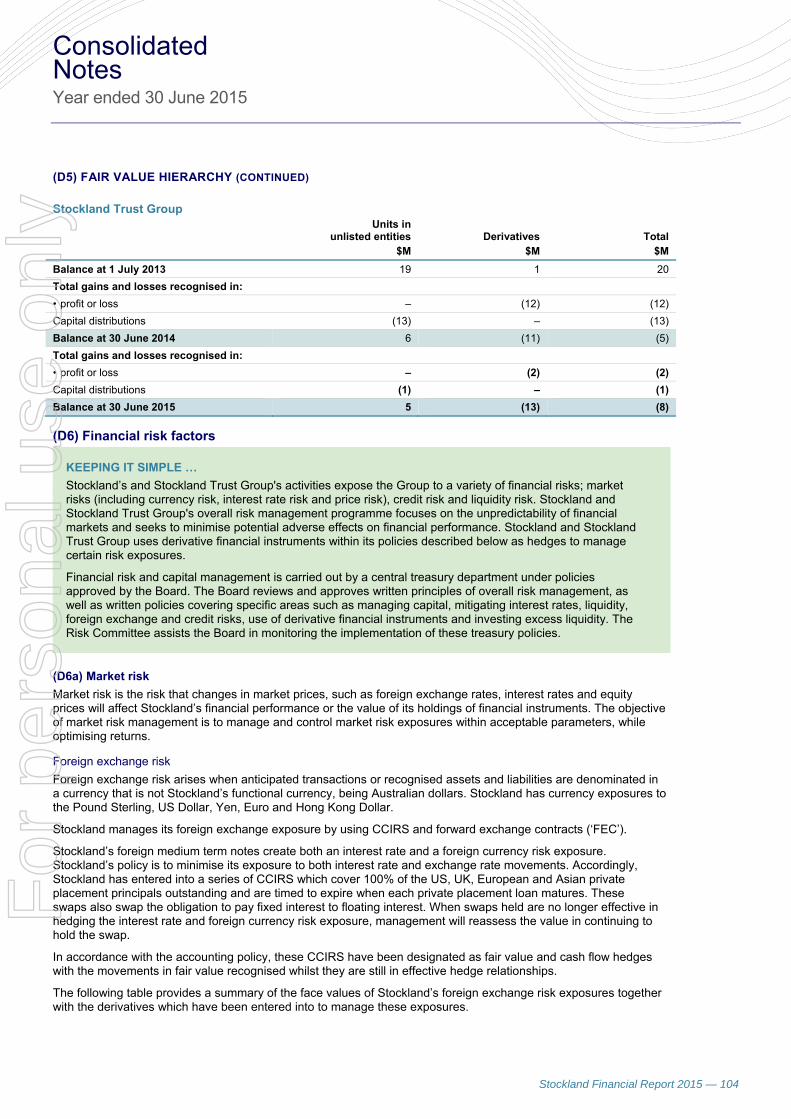
Consolidated Notes Year ended 30 June 2015
Stockland Financial Report 2015 — 104
(D5) FAIR VALUE HIERARCHY (CONTINUED)
Stockland Trust Group Units in
unlisted entities $M
Derivatives $M
Total $M
Balance at 1 July 2013 19 1 20
Total gains and losses recognised in:
• profit or loss – (12) (12)
Capital distributions (13) – (13)
Balance at 30 June 2014 6 (11) (5)
Total gains and losses recognised in:
• profit or loss – (2) (2)
Capital distributions (1) – (1)
Balance at 30 June 2015 5 (13) (8)
(D6) Financial risk factors
KEEPING IT SIMPLE …
Stockland’s and Stockland Trust Group's activities expose the Group to a variety of financial risks; market risks (including currency risk, interest rate risk and price risk), credit risk and liquidity risk. Stockland and Stockland Trust Group's overall risk management programme focuses on the unpredictability of financial markets and seeks to minimise potential adverse effects on financial performance. Stockland and Stockland Trust Group uses derivative financial instruments within its policies described below as hedges to manage certain risk exposures.
Financial risk and capital management is carried out by a central treasury department under policies approved by the Board. The Board reviews and approves written principles of overall risk management, as well as written policies covering specific areas such as managing capital, mitigating interest rates, liquidity, foreign exchange and credit risks, use of derivative financial instruments and investing excess liquidity. The Risk Committee assists the Board in monitoring the implementation of these treasury policies.
(D6a) Market risk
Market risk is the risk that changes in market prices, such as foreign exchange rates, interest rates and equity prices will affect Stockland’s financial performance or the value of its holdings of financial instruments. The objective of market risk management is to manage and control market risk exposures within acceptable parameters, while optimising returns.
Foreign exchange risk
Foreign exchange risk arises when anticipated transactions or recognised assets and liabilities are denominated in a currency that is not Stockland’s functional currency, being Australian dollars. Stockland has currency exposures to the Pound Sterling, US Dollar, Yen, Euro and Hong Kong Dollar.
Stockland manages its foreign exchange exposure by using CCIRS and forward exchange contracts (‘FEC’).
Stockland’s foreign medium term notes create both an interest rate and a foreign currency risk exposure. Stockland’s policy is to minimise its exposure to both interest rate and exchange rate movements. Accordingly, Stockland has entered into a series of CCIRS which cover 100% of the US, UK, European and Asian private placement principals outstanding and are timed to expire when each private placement loan matures. These swaps also swap the obligation to pay fixed interest to floating interest. When swaps held are no longer effective in hedging the interest rate and foreign currency risk exposure, management will reassess the value in continuing to hold the swap.
In accordance with the accounting policy, these CCIRS have been designated as fair value and cash flow hedges with the movements in fair value recognised whilst they are still in effective hedge relationships.
The following table provides a summary of the face values of Stockland’s foreign exchange risk exposures together with the derivatives which have been entered into to manage these exposures.
For
per
sona
l use
onl
y

Consolidated Notes Year ended 30 June 2015
Stockland Financial Report 2015 — 105
(D6A) MARKET RISK (CONTINUED)
Stockland Stockland Trust Group
GBP
£M
USD
$M
Yen
¥M
Euro
€M
HKD
$M
GBP
£M
USD
$M
Yen
¥M
Euro
€M
HKD
$M
2015
Borrowings – (1,426) (13,000) (300) (870) – (1,426) (13,000) (300) (870)
Other net assets – – – 17 – – – – – –
CCIRS – 1,426 13,000 300 870 – 1,426 13,000 300 870
FEC – – – (3) – – – – – –
Total exposure – – – 14 – – – – – –
2014
Borrowings – (1,511) (13,000) – (870) – (1,511) (13,000) – (870)
Other net assets 24 – – 4 – – – – – –
CCIRS (54) 1,511 13,000 – 870 (54) 1,511 13,000 – 870
FEC 22 – – (3) – – – – – –
Total exposure (8) – – 1 – (54) – – – –
Sensitivity analysis – foreign exchange risk The following sensitivity analysis shows the impact on the profit or loss and equity if there was an increase/decrease in exchange rates of 10% (2014:10%) at balance date with all other variables held constant.
Stockland Profit or loss Equity
Increase$M
Decrease$M
Increase $M
Decrease$M
30 June 2015
GBP – – – –
USD – – (21) 26
YEN – – – –
EUR (2) 2 (46) 45
HKD – – (1) 2
Total impact (2) 2 (68) 73
30 June 2014
GBP 6 (6) (4) 5
USD (12) 7 (15) 18
YEN (3) – – –
EUR 1 – – –
HKD – – (1) 2
Total impact (8) 1 (20) 25
Stockland Trust Group Profit or loss Equity
Increase$M
Decrease$M
Increase $M
Decrease$M
30 June 2015
GBP – – – –
USD – – (21) 26
YEN – – – –
EUR – – (46) 45
HKD – – (1) 2
Total impact – – (68) 73
For
per
sona
l use
onl
y

Consolidated Notes Year ended 30 June 2015
Stockland Financial Report 2015 — 106
(D6A) MARKET RISK (CONTINUED)
Profit or loss Equity
Increase$M
Decrease$M
Increase $M
Decrease$M
30 June 2014
GBP 10 (10) – –
USD (12) 7 (15) 18
YEN (3) – – –
HKD – – (1) 2
Total impact (5) (3) (16) 20
Interest rate risk
Interest rate risk is the risk that the fair value or cash flows of financial instruments will fluctuate due to changes in market interest rates.
Stockland’s interest rate risk arises from borrowings. Borrowings issued at variable rates expose Stockland to cash flow interest rate risk. Borrowings issued at fixed rates expose Stockland to fair value interest rate risk. Stockland’s treasury policy allows Stockland to enter into a variety of approved derivative instruments to manage the risk profile of the total debt portfolio to achieve an appropriate mix of fixed and floating interest rate exposures. Stockland manages its cash flow interest rate risk by using floating-to-fixed interest rate swaps. Such interest rate swaps have the economic effect of converting borrowings from floating rates to fixed rates. Stockland manages its fair value interest rate risk through CCIRS and fixed-to-floating interest rate swaps.
These derivatives have been recorded on the balance sheet at their fair value in accordance with AASB 139 Financial Instruments: Recognition and Measurement. These derivatives have not been designated as hedges for accounting purposes, nevertheless management believe the hedges are effective economically. As a result movements in the fair value of these instruments are recognised in profit or loss.
The table below provides a summary of Stockland’s interest rate risk exposure on interest-bearing loans and borrowings after the effect of the interest rate derivatives.
Stockland and Stockland Trust Group
Net exposure
(after the effect of derivatives)
As at 30 June 2015
$M 2014
$M
Fixed rate interest-bearing loans and borrowings1 2,255 1,969
Floating rate interest-bearing loans and borrowings1 887 1,344
Total interest-bearing loans and borrowings 3,142 3,313
1 Notional principal amounts
Sensitivity analysis – interest rate risk The following sensitivity analysis shows the impact on profit or loss and equity if market interest rates at balance date had been 100 basis points higher/lower (2014: 100 basis points) with all other variables held constant.
Stockland 2015 2014
As at 30 June
100bp higher
$M
100bp lower
$M
100bp higher
$M
100bp lower
$M
Impact on profit or loss
Impact on interest income/expense 2 (2) 2 (2)
Impact on net gain/loss on derivatives – through profit or loss 130 (142) 47 (68)
Total impact on profit or loss 132 (144) 49 (70)
Impact on equity
Total impact on equity 42 (49) 9 (10)
For
per
sona
l use
onl
y

Consolidated Notes Year ended 30 June 2015
Stockland Financial Report 2015 — 107
(D6A) MARKET RISK (CONTINUED)
Stockland Trust Group 2015 2014
As at 30 June
100bp higher
$M
100bp lower
$M
100bp higher
$M
100bp lower
$M
Impact on profit or loss
Impact on interest income/expense 35 (35) 38 (38)
Impact on net gain/loss on derivatives – through profit or loss 130 (142) 47 (68)
Total impact of on profit or loss 165 (177) 85 (106)
Impact on equity
Total impact on equity 42 (49) 9 (10)
Equity price risk
Equity price risk is the risk that the fair value of investments in listed/unlisted entities fluctuate due to changes in the underlying share/unit price. Stockland’s equity price risk arises from investments in listed securities and units in unlisted funds. These investments are classified as financial assets carried at fair value, with any resultant gain or loss recognised in other comprehensive income.
Material investments within the portfolio are managed on an individual basis and all buy and sell decisions are approved by the Risk Committee.
Sensitivity analysis - equity price risk The following sensitivity analysis shows the impact on profit or loss and equity if the market price of the underlying equity securities/units at balance date had been 10% higher/lower (2014: 10%) with all other variables held constant.
2015 2014
As at 30 June
10% higher
$M
10% lower
$M
10% higher
$M
10% lower
$M
Stockland
Total impact on profit or loss – – 1 (1)
Total impact on equity – – 50 (50)
Stockland Trust Group
Total impact on profit or loss – – 1 (1)
Total impact on equity – – – –
(D6b) Credit risk
Credit risk is the risk that a customer or counterparty to a financial instrument fails to meet its contractual obligations resulting in a financial loss to Stockland.
Stockland has no significant concentrations of credit risk to any single counterparty and has policies to review the aggregate exposure of tenancies across its portfolio. Stockland also has policies to ensure that sales of properties and development services are made to customers with an appropriate credit history.
Derivative counterparties and cash deposits are currently limited to financial institutions approved by the Risk Committee. There are also policies that limit the amount of credit risk exposure to any one of the approved financial institutions based on their credit rating and country of origin.
The maximum exposure to credit risk at the end of the reporting period is the carrying amount of each class of financial assets mentioned above.
As at 30 June 2015, these financial institutions had an S&P credit rating of A- or above (2014: A- or above).
Bank guarantees and mortgages over land are held as security over certain trade and other receivables balances.
As at 30 June 2015 and 30 June 2014, there were no significant financial assets that were past due.
For
per
sona
l use
onl
y

Consolidated Notes Year ended 30 June 2015
Stockland Financial Report 2015 — 108
(D6c) Liquidity risk
Liquidity risk is the risk that Stockland will not be able to meet its financial obligations as they fall due. Due to the dynamic nature of the underlying businesses, Stockland aims to maintain flexibility in funding by keeping sufficient cash and/or committed credit lines available whilst maintaining a low cost of holding these facilities. Management prepares and monitors rolling forecasts of liquidity requirements on the basis of expected cash flow.
Stockland manages liquidity risk through monitoring the maturity of its debt portfolio. Stockland also manages liquidity risk by maintaining a liquidity buffer of cash and undrawn credit facilities. The current weighted average debt maturity is 4.6 years (2014: 5.2 years).
KEEPING IT SIMPLE …
The table below analyses the Group’s financial liabilities including derivatives into relevant maturity groupings based on the period remaining until the contractual maturity date. The amounts disclosed in the table are the contractual undiscounted cash flows (including interest), and therefore may not reconcile with the amounts disclosed on the Balance Sheet.
As derivative assets have been excluded from this table, refer to Note (D5) for the fair value of the derivative assets to provide a meaningful analysis of Stockland’s total derivatives.
Stockland Carrying amount
$M
Contractual cash flows
$M
1 year or less
$M
1 – 2years
$M
2 – 5 years
$M
Over 5 years
$M
30 June 2015
Non-derivative financial liabilities
Trade and other payables (exc. GST) (313) (316) (280) (36) – –
Dividends and distributions payable (283) (283) (283) – – –
Interest-bearing loans and borrowings (3,283) (4,497) (449) (622) (1,306) (2,120)
Retirement Living resident obligations (2,211) (2,212) (1,992) (1) (11) (208)
Derivative financial liabilities
Interest rate derivatives (264) (293) (80) (71) (110) (32)
Cross currency interest rate swaps (53)
• inflow 1,363 266 68 571 458
• outflow (1,489) (278) (58) (651) (502)
Total financial liabilities (6,407) (7,727) (3,096) (720) (1,507) (2,404)
30 June 2014
Non-derivative financial liabilities
Trade and other payables (exc. GST) (304) (310) (251) (23) (36) –
Dividends and distributions payable (280) (280) (280) – – –
Interest-bearing loans and borrowings (3,118) (3,898) (527) (600) (1,272) (1,499)
Aged Care accommodation bonds (53) (53) (53) – – –
Retirement Living resident obligations (1,865) (1,867) (1,666) (1) (9) (191)
Derivative financial liabilities
Interest rate derivatives (287) (321) (77) (72) (132) (40)
Cross currency interest rate swaps (192)
• inflow 1,600 154 312 587 547
• outflow (1,941) (157) (362) (790) (632)
Forward exchange contracts (2) (2) (2) – – –
Total financial liabilities (6,101) (7,072) (2,859) (746) (1,652) (1,815)
For
per
sona
l use
onl
y

Consolidated Notes Year ended 30 June 2015
Stockland Financial Report 2015 — 109
(D6C) LIQUIDITY RISK (CONTINUED)
In most cases settlement of Retirement Living resident obligations occurs simultaneously with receipt of the incoming resident’s contribution. Of the total Retirement Living resident obligations, $2,198 million (2014: $1,849 million) does not represent an anticipated net cash outflow as it is expected to be covered by receipts from incoming residents. Refer to Note (C1c) for further details on Retirement Living resident obligations.
Stockland Trust Group Carrying amount
$M
Contractual cash flows
$M
1 year or less
$M
1 – 2years
$M
2 – 5 years
$M
Over 5 years
$M
30 June 2015
Non-derivative financial liabilities
Trade and other payables (exc. GST) (98) (98) (98) – – –
Distributions payable (283) (283) (283) – – –
Interest-bearing loans and borrowings (3,283) (4,497) (449) (622) (1,306) (2,120)
Derivative financial liabilities
Interest rate derivatives (264) (293) (80) (71) (110) (32)
Cross currency interest rate swaps (53)
• inflow 1,363 266 68 571 458
• outflow (1,489) (278) (58) (651) (502)
Total financial liabilities (3,981) (5,297) (922) (683) (1,496) (2,196)
30 June 2014
Non-derivative financial liabilities
Trade and other payables (exc. GST) (94) (94) (94) – – –
Distributions payable (280) (280) (280) – – –
Interest-bearing loans and borrowings (3,118) (3,898) (527) (600) (1,272) (1,499)
Derivative financial liabilities
Interest rate derivatives (287) (321) (77) (72) (132) (40)
Cross currency interest rate swaps (192)
• inflow 1,600 154 312 587 547
• outflow (1,941) (157) (362) (790) (632)
Forward exchange contracts (2) (2) (2) – – –
Total financial liabilities (3,973) (4,936) (983) (722) (1,607) (1,624)
(D7) Issued capital
KEEPING IT SIMPLE …
This section explains material movements recorded in issued capital that are not explained elsewhere in the financial statements. The movements in equity of Stockland and Stockland Trust Group and the balances are presented in the Statements of Changes in Equity.
Issued capital represents the amount of consideration received for stapled securities issued by Stockland. Transaction costs of an equity transaction are accounted for as a deduction from equity, net of any related income tax benefit.
For so long as Stockland remains jointly quoted, the number of shares in the Company and the number of units in the Trust shall be equal and the securityholders and unitholders shall be identical. Unitholders of the Trust are only entitled to distributions and voting rights upon stapling.
For
per
sona
l use
onl
y

Consolidated Notes Year ended 30 June 2015
Stockland Financial Report 2015 — 110
(D7) ISSUED CAPITAL (CONTINUED)
Holders of stapled securities are entitled to receive dividends and distributions as declared from time to time and are entitled to one vote per stapled security at securityholder meetings. The liability of a member is limited to the amount, if any, remaining unpaid in relation to a member’s subscription for securities. A member is entitled to receive a distribution following termination of the stapling arrangement (for whatever reason). The net proceeds of realisation must be distributed to members, after making an allowance for payment of all liabilities (actual and anticipated) and meeting any actual or anticipated expenses of termination.
The following table provides details of Stockland’s issued securities and Stockland Trust Group’s issued units.
Stockland and
Stockland Trust Group Stockland Stockland Trust Group
Details
Number of securities/
units
2015
Number of securities/
units
2014
2015
$M
2014
$M
2015
$M
2014
$M
Ordinary securities/units on issue
Issued and fully paid 2,361,717,862 2,326,978,560 8,571 8,430 7,266 7,126
Other equity securities/units
Treasury Shares (2,621,149) (2,704,874) (11) (10) (11) (10)
Total Issued Capital 2,359,096,713 2,324,273,686 8,560 8,420 7,255 7,116
(D7a) Ordinary securities/units
The following table provides details of movements in Stockland’s issued securities and Stockland Trust Group’s issued units.
Details
Stockland and Stockland Trust Group
Number of securities/units
Stockland
$M
Stockland Trust Group
$M
Movement of securities/units issued
Balance as at 1 July 2013 2,305,750,747 8,353 7,559
Securities/units issued as part of the distribution reinvestment plan 21,227,813 77 74
Transfer of capital to Stockland Corporation Limited – – (507)
Balance as at 30 June 2014 2,326,978,560 8,430 7,126
Securities/units issued as part of the distribution reinvestment plan 34,739,302 141 140
Balance as at 30 June 2015 2,361,717,862 8,571 7,266
Dividend Reinvestment Plan
During the year, Stockland issued 34,739,302 securities (2014: 21,227,813) under the Dividend Reinvestment Plan (‘DRP’). The DRP security price for each period was determined by the average of the daily volume weighted averages over a 15-day trading period and applying a 1.0 per cent discount.
On 22 June 2015, Stockland announced that the DRP would operate for the final distribution to 30 June 2015. Securityholders participating in the DRP will be entitled to receive a full distribution. The DRP security price of $4.15 was determined by the average of the daily volume weighted averages of the selling price over a 15-day trading period immediately preceding 22 July 2015 and applying a 1.0 per cent discount.
Transfer of Capital
In the prior year, Stockland Trust Group reallocated $507 million of issued capital (equivalent to $0.22 per security) from the Stockland Trust to Stockland Corporation Limited following securityholders approval at the Annual General Meeting of Stockland Corporation Limited and Meeting of Unitholders of Stockland Trust on 29 October 2013. The number of units and the number of shares on issue remained unchanged following the reallocation.
For
per
sona
l use
onl
y

Consolidated Notes Year ended 30 June 2015
Stockland Financial Report 2015 — 111
(D7b) Other equity securities/units
Treasury Shares
Treasury shares are securities/units in Stockland that are held by the Stockland Employee Securities Plan Trust for the purpose of issuing shares under the Deferred Short Term Incentive (‘DSTI’) scheme.
The securities/units are held on behalf of Executives and Senior Management eligible under the scheme until the end of the vesting period. During the vesting period, the Executives and Senior Management are entitled to the distributions and dividends.
Movement of other equity securities/units
Details
Stockland and Stockland Trust Group
Number of securities/units
Stockland
$M
Stockland Trust Group
$M
Opening balance as at 1 July 2014 2,704,874 (10) (10)
Acquisition of securities/units by the Trust 870,187 (4) (4)
Transferred to ordinary shares on vesting (953,912) 3 3
Balance as at 30 June 2015 2,621,149 (11) (11)
Acquisition of securities by the Trust
During the year, 870,187 securities (2014: 1,508,503) were acquired on market for the purpose of issuing securities under the Deferred Short Term Incentive (‘DSTI’) scheme.
The securities are held by the Stockland Employee Securities Plan Trust on behalf of Executives and Senior Management eligible under the scheme until the end of the vesting period affixed to the securities. During the vesting period, the Executives and Senior Management are entitled to the distributions and dividends.
Transferred to ordinary securities on vesting
During the year, 953,912 securities (2014: 178,390) vested with Executives and Senior Management under the DSTI scheme.
(D7c) Share based payments
KEEPING IT SIMPLE …
Stockland operates three share based compensation schemes which are described below.
Performance Rights Plan (‘PRP’) Under the PRP, employees have the right to acquire Stockland securities at nil consideration when certain performance conditions are met. Each grant will comprise two equal tranches, each of which vest based on separate performance hurdles (being underlying earnings per security (‘underlying EPS’) growth and relative Total Securityholder Return (‘TSR’)) and has a three year vesting period. Eligibility is by invitation of the Board and is reviewed annually.
Deferred Short Term Incentive awards (‘DSTI’) For Executives and Senior Management there is a compulsory deferral of at least one third of short term incentives (‘STI’) into Stockland securities to further align remuneration outcomes with securityholders. Half of the awarded STI securities will vest 12 months after award with the remaining half vesting 24 months after award, provided employment continues to the applicable vesting date.
$1,000 Plan Under this plan, eligible employees receive up to $1,000 worth of Stockland securities.
For
per
sona
l use
onl
y

Consolidated Notes Year ended 30 June 2015
Stockland Financial Report 2015 — 112
(D7C) SHARE BASED PAYMENTS (CONTINUED)
The number and weighted average fair value of rights/securities under the PRP and DSTI share plans are as follows:
Weighted average price
per right/security Number of
rights/securities
Details 2015 2014 2015 2014
Rights/securities outstanding at the beginning of the year $2.19 $3.14 9,981,793 9,328,574
Rights granted during the year $2.50 $2.30 6,446,993 5,633,380
Rights/securities forfeited and lapsed during the year $1.82 $1.71 (4,097,446) (4,208,925)
Securities exercised during the year – – – –
Rights converted to Stockland stapled securities $3.84 $3.56 (1,341,217) (771,236)
Rights/securities outstanding at the end of the year $2.29 $2.19 10,990,123 9,981,793
PRP
The fair value of PRP rights is measured at grant date using the Black-Scholes and Monte Carlo Simulation option pricing models taking into account the terms and conditions upon which the rights were granted. The fair value is expensed on a straight-line basis over the vesting period, the period over which the rights are subject to performance and service conditions, with a corresponding increase in reserves.
Where the individual forfeits the rights due to failure to meet a service or performance condition, the cumulative expense is reversed through profit or loss in the current year. The cumulative expenditure for rights forfeited due to market conditions are not reversed.
Where amendments are made to the terms and conditions subsequent to the grant, the value of the grant immediately prior to and following the modification is determined. This occurs upon resignation or termination where the amendment relates to rights becoming vested in terms of beneficial ownership, which would otherwise have been forfeited due to the failure to meet future service conditions. In this situation, the value that would have been recognised in future periods in respect of the rights not forfeited is recognised in the period that the rights vest.
The number of rights granted to employees under the plan for the year ended 30 June 2015 was 4,335,343 (2014: 3,968,989).
Assumptions made in determining the fair value of rights granted under the share plans are detailed below.
Details 2015 2014
Grant date 29 August 2014 31 August 2013
Fair value of rights granted under plan $2.47 $2.15
Spot price of the Stapled Securities at grant date $4.25 $3.73
Exercise price – –
Distribution yield 6.5% 7.3%
Risk-free rate at grant date 2.7% 2.8%
Expected remaining life at grant date 2.8 years 2.8 years
Volatility of Stockland 20.0% 20.0%
Volatility of Index price 15.0% 15.0%
The PRP rights of 8,158,801 (2014: 7,815,679) are outstanding as at 30 June 2015, which have fair values ranging from $1.45 to $2.08 (2014: $1.79 to $2.15) per right and a weighted average restricted period remaining of 1.5 years (2014: 1.5 years).
As at 30 June 2015, no PRP rights vested (2014: Nil). As no PRP rights vested, the weighted average fair value of vested rights during the financial year was $Nil (2014: $Nil).
During the year, no PRP rights converted to Stockland stapled securities, as vesting conditions determined during the previous financial year were not met (2014: no rights).
For
per
sona
l use
onl
y

Consolidated Notes Year ended 30 June 2015
Stockland Financial Report 2015 — 113
(D7C) SHARE BASED PAYMENTS (CONTINUED)
DSTI
The fair value of securities granted under the DSTI has been calculated based on the 10 day volume weighted average price post 30 June 2015 of $4.16 (2014: $3.99).
The DSTI rights outstanding as at 30 June 2015, included in the table above, are 2,831,322 (2014: 2,166,114). The rights outstanding have fair values ranging from $3.55 to $4.16 (2014: $3.55 to $3.99) per right.
$1,000 Plan
Stockland securities issued to eligible employees under the Tax Exempt Employee Security Plan (‘$1,000 Plan’) are recognised as an expense with a corresponding increase in issued capital. The value recognised is the market price of the securities granted at grant date.
(D8) Dividends and distributions Dividends and distributions recognised in the financial year by the Stockland and the Stockland Trust Group are detailed below.
The tax preferred component represents income of the Stockland Trust which is not included in the trust’s taxable income. The tax preferred component includes concessional capital gain amount not included in the trust’s taxable income and tax deferred amounts, being the amount distributed in excess of the trust’s taxable income.
Stockland Corporation Limited
There was no dividend from Stockland Corporation Limited during the current, or previous, financial year.
The dividend franking account balance as at 30 June 2015 is $13 million based on a 30% tax rate (2014: $13 million).
Stockland Trust
Cents per unit
Total amount
$M Date of payment
Tax preferred
%
Year ended 30 June 2015
Interim distribution 12.0 282 27 February 2015 13.3
Final distribution 12.0 283 31 August 2015 13.3
Total distribution 24.0 565
Year ended 30 June 2014
Interim distribution 12.0 277 28 February 2014 16.5
Final distribution 12.0 279 29 August 2014 16.5
Total distribution 24.0 556
For
per
sona
l use
onl
y

Consolidated Notes Year ended 30 June 2015
Stockland Financial Report 2015 — 114
(E) Group Structure
IN THIS SECTION
This section provides information which will help users understand how the group structure affects the financial position and performance of the Group as a whole. The Group includes entities that are classified as joint ventures, joint operations, associates and structured entities.
Joint ventures and associates are accounted for using the equity method, while joint operations are proportionately consolidated and structured entities are recorded as investments at cost.
In this section of the notes there is information about:
(1) Interests in joint operations;
(2) Transactions with non-controlling interests; and
(3) Changes to the structure that occurred during the year as a result of business combinations or the disposal of a discontinued operation
(E1) Equity-accounted investments
The following table provides details of the share of profits of equity-accounted investments:
Stockland Stockland
Trust Group
Year ended 30 June Notes 2015
$M 2014
$M 2015
$M 2014
$M
Share of profits from equity-accounted investments:
Investments in joint venture entities (E1a) 88 56 86 50
Investments in associates (E1b) – 6 – 6
Total share of profits of equity-accounted investments 88 62 86 56
Stockland and the Stockland Group Trust have interests in a number of individually immaterial associates and joint ventures that are accounted for using the equity method.
(E1a) Investments in joint venture entities
A joint venture is either a venture or operation over whose activities Stockland has joint control, established by contractual agreement. Investments in joint venture entities are accounted for on an equity accounted basis. Investments in joint ventures are assessed for impairment when indicators of impairment are present and if required, written down to the recoverable amount.
Stockland’s share of the joint venture’s profit or loss and other comprehensive income is from the date joint control commences until the date joint control ceases.
If Stockland’s share of losses exceeds its interest in a joint venture, the carrying amount is reduced to nil and recognition of further losses is discontinued except to the extent that Stockland has incurred legal or constructive obligations or made payments on behalf of the joint venture.
Transactions with the joint venture are eliminated to the extent of Stockland’s interest in the joint venture until such time as they are realised by the joint venture on consumption or sale.
The following table analyses, in aggregate, the carrying amount and share of profit or loss and other comprehensive income of these joint venture entities.
For
per
sona
l use
onl
y

Consolidated Notes Year ended 30 June 2015
Stockland Financial Report 2015 — 115
(E1A) INVESTMENTS IN JOINT VENTURE ENTITIES (CONTINUED)
Stockland Stockland
Trust Group
2015
$M 2014
$M 2015
$M 2014
$M
Aggregate carrying amount of individually immaterial joint venture entities
518 650 506 608
Aggregate share of:
Profit from continuing operations 88 56 86 50
Other comprehensive income – – – –
Total comprehensive income 88 56 86 50
Changes to Joint Ventures
Waterfront Place and Eagle Street Pier
On 19 June 2015, Stockland entered into an agreement to sell the Waterfront Place and Eagle Street Pier properties. The joint venture entities holding these properties have been classified as Assets Held for Sale. Net assets of $246 million comprises the Waterfront Place and Eagle Street Pier properties, valued at $296 million and $22 million, respectively, an external loan of $73 million and other net assets of $1 million were reclassified to Assets Held for Sale at 30 June 2015.
The joint venture entities contributed $15 million (2014: $14 million) of net operating profit with a further $2 million (2014: $22 million) in net gain from fair value of investment properties for the year ended 30 June 2015.
Stockland Bundaberg
On 10 October 2014, Stockland Trust acquired a 50% interest in Sugarland Shopping Centre Trust which owns Sugarland Shoppingtown in Bundaberg, Queensland, subsequently re-named to Stockland Bundaberg. The owners have joint control over the asset with strategic decisions requiring unanimous approval from the Unitholders’ Committee comprising equal representation of the owners. The Group’s share of profits from Stockland Bundaberg is included in Stockland and the Stockland Trust Group’s investments in joint venture entities for the period 10 October 2014 to 30 June 2015.
At the time of acquiring the 50% interest in Sugarland Shopping Centre Trust, Stockland Trust entered into a Put and Call option to acquire the remaining 50% interest.
The Put option can be exercised within 12 months from 10 April 2015. The Call option period will commence no later than 10 October 2015 for a period of six months. When exercised, a liability in the range of $60 million to $62 million will be recognised if the Put or Call options are exercised.
Joint operations
Interests in unincorporated joint operations are consolidated by recognising Stockland’s proportionate share of the joint operations’ assets, liabilities, revenues and expenses and the joint operation’s revenue from the sale of their share of goods or services on a line-by-line basis, from the date joint control commences to the date joint control ceases and are not included in the above table.
Changes to Joint Operations
Stockland Townsville
On 15 October 2014, Stockland Trust sold a direct 50% stake in Stockland Townsville. The owners have joint control over the asset with strategic decisions requiring unanimous approval from the Management Committee comprising equal representation of the owners. Therefore, Stockland and the Stockland Trust Group’s share of the results from Stockland Townsville Shopping Centre are recognised on a proportionately consolidated basis for the period 16 October 2014 to 30 June 2015. Stockland Townsville Shopping Centre’s results were fully consolidated until 16 October 2014.
At the time of disposal, a Put and Call Option Deed was established in relation to selected sundry assets located in Townsville.
For
per
sona
l use
onl
y

Consolidated Notes Year ended 30 June 2015
Stockland Financial Report 2015 — 116
(E1b) Investments in associates
Associates are those entities over which Stockland have significant influence, but not control or joint control, over the financial and operating policies. The financial statements include Stockland’s share of the total recognised gains and losses of associates on an equity accounted basis, from the date that significant influence commences until the date that significant influence ceases.
If Stockland’s share of losses exceeds its interest in an associate, their carrying amount is reduced to nil and recognition of further losses is discontinued except to the extent that Stockland has incurred legal or constructive obligations or made payments on behalf of the associate.
Unrealised gains on transactions between Stockland and Stockland Trust Group and their associates are eliminated to the extent of Stockland’s interest in the associates. Unrealised losses are also eliminated unless the transaction provides evidence of an impairment of the asset transferred.
Stockland and the Stockland Group Trust did not have investments in associates at 30 June 2015.
In the prior period, Stockland and Stockland Group Trust’s equity interest in one of its associates, Macquarie Park Trust, increased from 31% to 51% becoming a joint venture from 7 February 2014. Total comprehensive income from investments in associates includes $6 million of profits from Macquarie Park Trust for the period from 1 July 2013 to 7 February 2014.
(E2) Investments in unconsolidated structured entities
A structured entity is an entity that has been designed so that voting or similar rights are not the dominant factor in deciding who controls the entity. Stockland considers all Retail Funds in which it currently holds an investment, and from which it currently earns fee income, to be structured entities.
Stockland holds an interest in a number of closed-end, unlisted property funds (the Funds) that invest in real estate assets in Australia for the purpose of generating investment income and for capital appreciation. These funds have been determined to meet the definition of a structured entity.
On 30 June 2015, Stockland Direct Office Trust No. 2 (‘SDOT No.2’) was resolved to be wound up. At 30 June 2014, Stockland held a 19.9% interest in SDOT No.2 which was valued at $3 million. Stockland held a 19.9% interest in Stockland Direct Retail Trust No.1 (‘SDRT No.1’) (2014; 19.9%), valued at $7 million at 30 June 2015 (2014: $6 million). Stockland’s interest in each of these Funds is included in the ‘Other Financial Assets’ line item on the Balance Sheet. Stockland is also entitled to responsible entity and other fees from these funds and Stockland Residential Estates Equity Fund No. 1 (‘SREEF No.1’) which are detailed in Note (F6). The amount receivable for these fees at 30 June 2015 is $3 million (2014: $4 million) which is disclosed within other receivables in Note (C2a).
The Funds finance their operations through unitholder contributions and also through external banking facilities. Stockland also provides a loan facility offer to SDRT No.1 which is considered in Note (F6). The maximum exposure to risk for SDOT No.2 is the carrying value of Stockland’s investment in the Fund, and for SDRT No.1 its maximum exposure to risk is the carrying value of its investment in the Fund and the amount of the loan facility extended to the Fund.
(E3) Controlled entities The following entities were 100% controlled during the current and prior years:
Controlled entities of Stockland Trust
9 Castlereagh Street Unit Trust SDRT 3 Property # 1 Trust
ADP Trust SDRT 3 Property # 2 Trust
Advance Property Fund SDRT 3 Property # 3 Trust
Capricornia Property Trust Shellharbour Property Trust
Endeavour (No. 1) Unit Trust Stockland Castlereagh St Trust
Flinders Industrial Property Trust Stockland Direct Diversified Fund
Hervey Bay Holding Trust Stockland Direct Office Trust No. 4
Hervey Bay Sub Trust Stockland Direct Retail Trust No. 3
Industrial Property Trust Stockland Finance Holdings Pty Limited
Jimboomba Village Shopping Centre and Tavern Trust Stockland Finance Pty Limited
SDOT 4 Property # 1 Trust Stockland Industrial No. 1 Property 1 Trust
SDOT 4 Property # 2 Trust Stockland Industrial No. 1 Property 4 Trust
SDOT 4 Property # 3 Trust Stockland Industrial No. 1 Property 5 Trust
For
per
sona
l use
onl
y

Consolidated Notes Year ended 30 June 2015
Stockland Financial Report 2015 — 117
(E3) CONTROLLED ENTITIES (CONTINUED)
Controlled entities of Stockland Trust (continued)
Stockland Industrial No. 1 Property 6 Trust Stockland Retail Holding Trust No. 1
Stockland Industrial No. 1 Property 7 Trust Stockland Wholesale Office Trust No. 1
Stockland Industrial No. 1 Property 8 Trust Stockland Wholesale Office Trust No. 2
Stockland Industrial No. 1 Property 9 Trust SWOT2 Sub Trust No. 1
Stockland Industrial No. 1 Property 11 Trust SWOT2 Sub Trust No. 2
Stockland Retail Holding Sub-Trust No. 1 SWOT2 Sub Trust No. 3
Controlled entities of Stockland Corporation Limited
Albert & Co. Pty Limited1, 2 Retirement Living Holding Trust No. 6
A.C.N 116 788 713 Pty Limited1, 2 Retirement Living Unit Trust No. 1
Aevum Limited1, 2 Retirement Living Unit Trust No. 2
Aevum SPV Finance No. 1 Pty Limited Ridgecrest Village Management Services Pty Limited
Affinity Retirement Village Pty Limited Ridgecrest Village Pty Limited
ARC Joint Ventures Pty Limited1, 2 Rogan's Hill Retirement Village Trust
Bayview Road Property Trust Rosebud Village Pty Limited1, 2
Bellevue Gardens Pty Limited RVG (Queensland) Pty Limited
Bellevue Gardens Trust Salford Living Pty Limited1, 2
Castlehaven Pty Limited SDRT 2 Property 1 Trust
Castleridge Pty Limited SDRT 2 Property 2 Trust
CReAM (GP No. 4) Limited (75%)3, 4 SDRT 2 Property 3 Trust
CReAM (GP No. 5) Limited (75%)3, 4 SDRT 2 Property 4 Trust
Endeavour (No. 2) Unit Trust Selandra Rise Retirement Village Pty Limited
Farrington Grove Retirement Village Pty Limited Stockland (Billingham) Limited3, 4
Golden Ponds Forster Pty Limited Stockland (Boardwalk Sub2) Pty Limited
Greenleaves Management Services Pty Limited Stockland (IH) No. 1 Pty Limited
Greenleaves Village Pty Limited Stockland (NSW) No. 1 Pty Limited
Hibernian Investment Company Pty Limited1, 2 Stockland (NSW) No. 2 Pty Limited
Highlands Retirement Village Pty Limited Stockland (Queen Street) Limited3, 4
IOR Friendly Society Pty Limited1, 2 Stockland (Queensland) Pty Limited1, 2
IOR Group Pty Limited1, 2 Stockland (Russell Street) Pty Limited1, 2
Jimboomba Trust Stockland (St Andrew) Limited3, 4
Knowles Property Management Unit Trust Stockland (Stafford) Limited3, 4
Knox Unit Trust Stockland (UK) Limited3, 4
Knox Village Pty Limited1, 2 Stockland (Warminster) Limited3, 4
Lensworth Glenmore Park Limited1 Stockland (William Hunter) Limited3, 4
Lincoln Gardens Pty Limited Stockland Bells Creek Pty Limited1, 2
Long Island Village Pty Limited1, 2 Stockland Buddina Pty Limited1
Maybrook Manor Pty Limited Stockland Caboolture Waters Pty Limited1, 2
Mernda Retirement Village Pty Limited Stockland Caloundra Downs Pty Limited1, 2
Midlands Terrace Adult Community Pty Limited1, 2 Stockland Capital Partners Limited1, 2
Mount Gravatt Retirement Village Unit Trust Stockland Catering Pty Limited
Nowra Property Unit Trust Stockland Development (Holdings No. 1) Pty Limited1, 2
Oak Grange Pty Limited1, 2 Stockland Development (Holdings) Pty Limited1, 2
Patterson Lakes Unit Trust Stockland Development (NAPA NSW) Pty Limited1, 2
Patterson Village Pty Limited1, 2 Stockland Development (NAPA QLD) Pty Limited1, 2
Pine Lake Management Services Pty Limited Stockland Development (NAPA VIC) Pty Limited1, 2
Pine Lake Management Services Unit Trust Stockland Development (PHH) Pty Limited1, 2
Pine Lake Village Pty Limited Stockland Development (PR1) Pty Limited
Queenslake Village Pty Limited Stockland Development (PR2) Pty Limited
Retirement Living Acquisition Trust Stockland Development (PR3) Pty Limited
Retirement Living Holding Trust No. 1 Stockland Development (PR4) Pty Limited
Retirement Living Holding Trust No. 2 Stockland Development (Sub3) Pty Limited
Retirement Living Holding Trust No. 3 Stockland Development (Sub4) Pty Limited
Retirement Living Holding Trust No. 4 Stockland Development (Sub5) Pty Limited
Retirement Living Holding Trust No. 5 Stockland Development (Sub6) Pty Limited
For
per
sona
l use
onl
y

Consolidated Notes Year ended 30 June 2015
Stockland Financial Report 2015 — 118
(E3) CONTROLLED ENTITIES (CONTINUED)
Controlled entities of Stockland Corporation Limited (continued)
Stockland Development (Sub7) Pty Limited Stockland Property Services Pty Limited1, 2
Stockland Development Pty Limited1 Stockland Retirement Pty Limited1, 2
Stockland Direct Retail Trust No. 2 Stockland Scrip Holdings Pty Limited
Stockland Eurofinance Pty Limited1, 2 Stockland Services Pty Limited1, 2
Stockland Financial Services Pty Limited1, 2 Stockland Singapore Pte Limited
Stockland Highlands Pty Limited1 Stockland South Beach Pty Limited1, 2
Stockland Holding Trust No. 3 Stockland Trust Management Limited1, 2
Stockland Holding Trust No. 4 Stockland WA (Estates) Pty Limited1, 2
Stockland Holding Trust No. 5 Stockland WA Development (Realty) Pty Limited1, 2
Stockland Holding Trust No. 6 Stockland WA Development (Sub 6) Pty Limited
Stockland Holdings Limited3, 4 Stockland WA Development (VERTU Sub 1) Pty Limited
Stockland Kawana Waters Pty Limited1 Stockland WA Development Pty Limited1
Stockland Lake Doonella Pty Limited1, 2 Stockland Wallarah Peninsula Management Pty Limited1, 2
Stockland Management Limited1, 2 Stockland Wallarah Peninsula Pty Limited1, 2
Stockland North Lakes Development Pty Limited1, 2 Templestowe Retirement Village Pty Limited1, 2
Stockland North Lakes Pty Limited1 Templestowe Unit Trust
Stockland PR1 Trust The Hastings Valley Parklands Village Pty Limited
Stockland PR2 Trust Vermont Retirement Village Pty Limited1, 2
Stockland PR3 Trust Vermont Unit Trust
Stockland PR4 Trust Wantirna Village Pty Limited1, 2
Stockland Property Holdings Limited3, 4 Willows Retirement Village Services Pty Limited
Stockland Property Management Pty Limited1, 2
1 These companies are parties to the Deed of Cross Guarantee and members of the Closed Group, as at 30 June 2015. 2 These companies are parties to the Deed of Cross Guarantee but are currently ineligible for relief under the Class Order. 3 These companies are registered in the UK. 4 These companies/trusts are in liquidation as at 30 June 2015.
The following entities were formed/incorporated or acquired during the financial year and are 100% controlled:
Controlled entities of Stockland Trust
Flinders Industrial Property Trust (No. 1) Stockland Harrisdale Trust
Stockland Bundaberg Trust
Controlled entities of Stockland Corporation Limited Stockland Retail Services Pty Limited1, 2 Willowdale Retirement Village Pty Limited
Stockland Care Foundation Pty Limited
1 These companies are parties to the Deed of Cross Guarantee and members of the Closed Group, as at 30 June 2015. 2 These companies are parties to the Deed of Cross Guarantee but are currently ineligible for relief under the Class Order.
The following entities are no longer controlled entities and were sold or liquidated during the financial year:
Controlled entities of Stockland Corporation Limited ARVT1 Trust Stockland (Yeovil) Limited
ARVT2 Trust Stockland Developments (UK) Limited
Blue Valley Enterprises Pty Limited Stockland Management (UK) Limited
CReAM (GP) Limited Macquarie Grove Management Pty Limited
Stockland (CReAM) Limited Macquarie Waratah Holdings (NSW) Pty Limited
Stockland (Cumbernauld) Limited Macquarie Waratah Holdings Pty Limited
Stockland (Dalgety Bay) Limited Macquarie Waratah Management Pty Limited
Stockland (Lowestoft) Limited Macquarie Waratah Villages Pty Limited
Stockland (Rylands) No. 1 Pty Limited Waratah Highlands Management Pty Limited
Stockland (Rylands) No. 2 Pty Limited
All Stockland entities were formed/incorporated in Australia with the exception of Stockland Singapore Pte Limited which is incorporated in Singapore and all UK subsidiaries identified as being incorporated in the UK.
Stockland owns all the issued units/shares of the respective controlled entities (unless otherwise stated) and such units/shares carry the voting, dividend and distribution and equitable rights.
For
per
sona
l use
onl
y

Consolidated Notes Year ended 30 June 2015
Stockland Financial Report 2015 — 119
(E4) Deed of Cross Guarantee Stockland Corporation Limited and certain wholly-owned companies (the ‘Closed Group’), identified in Note (E3), are parties to a Deed of Cross Guarantee (the ‘Deed’). The effect of the Deed is that the members of the Closed Group guarantee to each creditor, payment in full of any debt, in the event of winding up of any of the members under certain provisions of the Corporations Act 2001.
ASIC Class Order 98/1418 (as amended) dated 13 August 1998, provides relief to parties to the Deed from the Corporations Act 2001 requirements for preparation, audit and lodgement of Financial Reports and Directors’ reports, subject to certain conditions as set out therein. This Class Order does not apply to trusts.
Pursuant to the requirements of this Class Order, a summarised consolidated Statement of Comprehensive Income for the year ended 30 June 2015 and consolidated Balance Sheet as at 30 June 2015, comprising the members of the Closed Group after eliminating all transactions between members are set out on the following pages.
Closed Group
2015 $M
2014$M
Balance Sheet
Current assets
Cash and cash equivalents 64 80
Trade and other receivables 69 656
Inventories 548 566
Other financial assets – 502
Other assets 8 10
689 1,814
Non-current assets held for sale – 73
Total current assets 689 1,887
Non-current assets
Trade and other receivables 22 11
Inventories 1,991 1,746
Investment properties 1,906 1,591
Other financial assets 1 30
Equity-accounted investments 25 24
Property, plant and equipment 40 62
Intangibles 10 10
Deferred tax assets 64 30
Total non-current assets 4,059 3,504
Total assets 4,748 5,391
Current liabilities
Trade and other payables 291 166
Interest-bearing loans and borrowings 2,701 –
Retirement Living resident obligations 1,084 836
Provisions 319 226
Other liabilities 6 66
Other financial liabilities – 2
Total current liabilities 4,401 1,296
Non-current liabilities
Other payables 33 53
Interest-bearing loans and borrowings – 3,656
Retirement Living resident obligations 38 38
Provisions 115 170
Total non-current liabilities 186 3,917
Total liabilities 4,587 5,213
Net assets 161 178
Equity
Issued capital 1,305 1,303
Reserves 2 50
Accumulated losses (1,146) (1,175)
Total equity 161 178
For
per
sona
l use
onl
y

Consolidated Notes Year ended 30 June 2015
Stockland Financial Report 2015 — 120
(E4) DEED OF CROSS GUARANTEE (CONTINUED)
Closed Group
2015
$M 2014
$M
Summarised Statement of Comprehensive Income
Profit/(loss) before income tax benefit 23 (166)
Income tax benefit / (expense) 6 (7)
Profit/(Loss) for the year/Total comprehensive income/(expense) 29 (173)
Summary of movements in Closed Group’s accumulated losses
Closed Group
2015
$M 2014
$M
Summary of movements in accumulated losses
Accumulated losses at 1 July (1,175) (1,002)
Profit/(Loss) for the year 29 (173)
Accumulated losses at 30 June (1,146) (1,175)
(E5) Parent entity disclosures The financial information of the parent entity of Stockland has been prepared on the same basis as the consolidated financial report, except as set out below:
Investments in subsidiaries and equity-accounted investments
Investments in subsidiaries and equity-accounted investments are accounted for at cost in the financial report of the parent. Distributions received from the subsidiaries and equity-accounted investments are recognised in the parent entity’s profit or loss rather than being deducted from the carrying amount of the investments.
As at and for the year ended 30 June 2015 and 30 June 2014 the parent entity of Stockland was the Company. The parent entity of the Stockland Trust Group was the Trust.
Stockland
Corporation Limited Stockland
Trust
2015
$M
2014
$M
2015
$M
2014
$M
Results for the year ended 30 June
Profit/(Loss) for the year 60 (115) 876 781
Other comprehensive income (51) 51 – –
Total comprehensive income for the year 9 (64) 876 781
Financial position as at 30 June
Current assets 3,802 3,881 251 604
Total assets1 3,984 3,975 16,674 16,914
Current liabilities 3,831 3,832 6,150 7,160
Total liabilities 3,831 3,832 8,106 8,835
Net assets 153 143 8,568 8,079
Issued capital 1,305 1,304 7,255 7,116
Reserves 2 53 63 24
Retained earnings (1,154) (1,214) 1,250 939
Total equity 153 143 8,568 8,079
1 No intangible assets are included in total assets (2014: $Nil).
For
per
sona
l use
onl
y

Consolidated Notes Year ended 30 June 2015
Stockland Financial Report 2015 — 121
(E5) PARENT ENTITY DISCLOSURES (CONTINUED)
Stockland Corporation Limited net asset deficiency position
Stockland Corporation Group has a net current asset deficiency as at 30 June 2015.
The net current liabilities includes a $3,831 million related party loan from Stockland Trust Group. The loan is repayable ‘at call’, however, the Stockland Trust Group does not intend to call the loan within the next 12 months.
Parent Entity contingencies
There are no contingencies within either parent entity as at 30 June 2015 (2014: $Nil).
Parent entity capital commitments
Neither parent entity has entered into any capital commitments as at 30 June 2015 (2014: $Nil).
Parent entity guarantees in respect of debts of its subsidiaries
The Company has entered into a Deed of Cross Guarantee with the effect that the Company guarantees debts in respect of its subsidiaries. Further details of the Deed of Cross Guarantee and the subsidiaries subject to the deed are disclosed in Note (E4).
For
per
sona
l use
onl
y

Consolidated Notes Year ended 30 June 2015
Stockland Financial Report 2015 — 122
(F) Other items
IN THIS SECTION
This section includes information that the Directors do not consider to be significant in understanding the financial performance and position of the Group, but must be disclosed to comply with the Accounting Standards, the Corporations Act 2001 or the Corporations Regulations.
(F1) Accounting Policies
KEEPING IT SIMPLE …
To aid the reader, accounting policies that apply to a specific category in the profit and loss or balance sheet have been included within the relevant notes.
The accounting policies listed below are those that apply across a number of the Group’s profit and loss and balance sheet categories and are not specific to a single category.
Principles of consolidation
Controlled entities
The consolidated financial statements of Stockland and the Stockland Trust Group incorporate the assets, liabilities and results of all controlled entities as at 30 June 2015.
Controlled entities are all entities over which the Company or the Trust has the power to govern the financial and operating policies, generally accompanying a shareholding of more than one-half of the voting rights. The existence and effect of potential voting rights that are currently exercisable or convertible are considered when assessing whether the Company or Trust controls another entity.
Intercompany transactions, balances and unrealised gains on transactions between controlled entities are eliminated. Unrealised losses are also eliminated unless the transaction provides evidence of the impairment of the asset transferred.
Foreign currency
Transactions
Foreign currency transactions are translated into the entity’s functional currency at the exchange rate on the transaction date.
Assets and liabilities denominated in foreign currencies are translated to Australian dollars at balance date using the following applicable exchange rates:
Foreign currency amount Applicable exchange rate
Monetary assets and liabilities Balance date
Non-monetary assets and liabilities measured at historical cost Date of transaction
Non-monetary assets and liabilities measured at fair value Date fair value is determined
Foreign exchange differences arising on translation are recognised in the profit or loss.
Translation of financial reports of foreign operations
Financial reports of foreign operations are translated to Australian dollars using the following applicable exchange rates:
Foreign currency amount Applicable exchange rate
Revenues and expenses of foreign operations Date of transaction
Assets and liabilities of foreign operations, including goodwill and fair value adjustments arising on consolidation
Balance date
Equity items Historical rates
For
per
sona
l use
onl
y
Consolidated Notes Year ended 30 June 2015
Stockland Financial Report 2015 — 123
(F1) ACCOUNTING POLICIES (CONTINUED)
The following foreign exchange differences are recognised directly in the Foreign Currency Translation Reserve (‘FCTR’), a separate component of equity:
• Foreign currency differences arising on translation of foreign operations;
• Exchange differences arising from the translation of the net investment in foreign entities and of related hedges. They are recycled into the profit or loss upon disposal.
• Foreign exchange gains and losses arising from a monetary item receivable from or payable to a foreign operation, the settlement of which is neither planned nor likely in the foreseeable future. These monetary items are considered to form part of the net investment in a foreign operation.
Reserves
Executive remuneration reserve
The executive remuneration reserve arises due to the rights and deferred shares awarded under the PRP and DSTI being accounted for as share based payments. The fair value of the rights is recognised as an employee expense in the profit or loss with a corresponding increase in reserves and decrease upon vesting.
Cash flow hedge reserve
The cash flow hedge reserve is used to record the effective portion of changes in the fair value of derivatives that are designated and qualify as cash flow hedges. Refer to Note (D4).
Fair value reserve
The fair value reserve comprises the cumulative net change in the fair value of available-for-sale financial assets until the assets are derecognised or impaired.
Foreign currency translation reserve
The foreign currency translation reserve comprises all foreign currency differences arising from the translation of the financial statements of foreign operations and from derivatives used to hedge operations/funding.
New and amended Accounting Standards
Mandatory for the year to 30 June 2015
Stockland has adopted all the mandatory amended accounting standards issued that are relevant to its operations and effective for the current reporting period. Of the accounting standards that have been amended and published that are mandatory for this reporting period, the following have been noted for their material impact on Stockland:
• AASB 2013-3 Amendments to AASB 136 Recoverable Amount Disclosures for Non-Financial Assets (effective 1 January 2014). The AASB has made small changes to some of the disclosures that are required under AASB 136 Impairment of Assets. These may result in additional disclosures when recognising an impairment loss or the reversal of an impairment loss during the period. They do not affect any of the amounts recognised in the financial statements. Application of this standard by the Group does not affect any of the amounts recognised in the financial statements, but impacts the type of information disclosed in relation to the Group's impairment losses and reversals.
• AASB 2013-4 Amendments to Australian Accounting Standards - Novation of Derivatives and Continuation of Hedge Accounting (effective 1 January 2014). The AASB has made small amendments to AASB 139 Financial Instruments: Recognition and measurement. The amendments will allow entities to continue hedge accounting, where a derivative contract that was designated as a hedge has been novated to a central counterparty as a consequence of laws or regulations. The Group has not novated any hedging contracts in the current or prior periods, applying the amendments did not affect any of the amounts recognised in the financial statements.
Mandatory in future years
Certain new accounting standards and interpretations have been published that are not mandatory for the year ended 30 June 2015. Stockland’s assessment of the impact of these new standards and interpretations is set out below:
AASB 9 Financial Instruments (effective for annual reporting periods beginning on or after 1 January 2018)
AASB 9 Financial Instruments addresses the classification, measurement and derecognition of financial assets and financial liabilities. The standard is not applicable until 1 January 2018 but is available for early adoption. When adopted, the standard will affect in particular Stockland’s accounting for its available-for-sale financial assets, but no impact is expected on Stockland’s financial liabilities. Stockland has not yet decided when to adopt AASB 9.
For
per
sona
l use
onl
y

Consolidated Notes Year ended 30 June 2015
Stockland Financial Report 2015 — 124
(F1) ACCOUNTING POLICIES (CONTINUED)
AASB 15 Revenue from Contracts with Customers (effective for annual reporting periods beginning on or after 1 January 2017)
AASB 15 Revenue from Contracts with Customers establishes a comprehensive framework for determining whether, how much and when revenue is recognised. It replaces existing revenue recognition guidance, including AASB 118 Revenue, AASB 111 Construction Contracts and IFRIC 13 Customer Loyalty Programmes. AASB 15 is effective for annual reporting periods beginning on or after 1 January 2018, with early adoption permitted. Stockland is assessing the potential impact on its consolidated financial statements resulting from the application of AASB 15.
(F2) Earnings per security/unit
KEEPING IT SIMPLE …
Earnings per security (‘EPS’) is the amount of post-tax profit attributable to each security.
Basic EPS is calculated on Stockland’s and the Stockland Trust Group’s statutory profit for the year divided by the weighted average number of securities outstanding.
Diluted EPS adjusts the Basic EPS for the dilutive effect of any instruments, such as options, that could be converted into ordinary securities.
Basic underlying earnings per security are disclosed in the Directors’ Report on page 9.
The calculation of basic earnings per security has been based on the following profit attributable to ordinary securityholders and weighted-average number of ordinary securities outstanding.
Stockland Stockland Trust Group
Year ended 30 June 2015
cents 2014
cents 2015
cents 2014
cents
Basic and diluted earnings per security/unit
Basic earnings per security/unit 38.5 22.8 36.9 27.7
Diluted earnings per security/unit 38.5 22.7 36.9 27.7
Reconciliations of earnings used in calculating earnings per security/unit
Stockland Stockland Trust Group
Year ended 30 June
2015
$M
2014
$M
2015
$M
2014
$M
Basic and diluted earnings
Profit attributable to securityholders/unitholders 903 527 867 641
Weighted average number of securities/units used as the denominator Stockland and Stockland Trust Group
As at 30 June 2015
No. 2014
No.
Weighted average number of securities/units (basic)
Weighted average number of securities/units 2,346,566,571 2,311,367,784
Weighted average number of securities/units (diluted)
Weighted average number of securities/units (basic) 2,346,566,571 2,311,367,784
Effect of rights and securities/units granted under share plans 2,715,233 7,153,903
Weighted average number of securities/units (diluted) 2,349,281,804 2,318,521,687
Rights and securities/units granted under security plans are only included in diluted earnings per security/unit where Stockland is meeting performance hurdles for contingently issuable share based payment rights.
For
per
sona
l use
onl
y

Consolidated Notes Year ended 30 June 2015
Stockland Financial Report 2015 — 125
(F3) Notes to Cash Flow Statements
Stockland Stockland Trust Group
2015
$M
2014
$M
2015
$M
2014
$M
Reconciliation of profit to net cash flow from operating activities:
Profit 903 527 867 641
Add/(less) items classified as investing/financing activities:
Net loss on fair value hedges 18 5 18 5
Net loss on derivatives – through profit and loss 22 63 22 63
Interest capitalised to investment properties (15) (12) (8) (4)
Net loss on sale of non-current assets 2 6 1 8
Net gain on sale of other financial assets (73) (35) – 1
Dividends and distributions income (5) (19) (2) –
Add/(less) non-cash items:
DMF base fee earned, unrealised (27) (11) – –
Depreciation 15 16 – –
Impairment of intangibles 43 23 – –
Straight-line rent adjustment (8) (7) (8) (7)
Net change in fair value of investment properties (including equity-accounted investments) (344) (36) (292) (102)
Share of profits of equity-accounted investments, net of distributions received (6) (5) (7) (4)
Equity-settled share based payments 13 7 – –
Other items (8) 4 (1) –
Net cash flow from operating activities before change in assets and liabilities 530 526 590 601
Decrease in receivables 1 48 8 26
Increase in other assets (31) (3) (34) (5)
Increase in inventories (268) (41) – –
Increase/(Decrease) in deferred tax assets (9) 3 – –
Increase/(Decrease) in payables and other liabilities 20 7 (19) (28)
Increase in resident obligations 170 91 – –
Increase/(Decrease) in employee benefits 2 (1) – –
Increase/(Decrease) in other provisions (14) 122 (5) –
Net cash flow from operating activities 401 752 540 594
For
per
sona
l use
onl
y

Consolidated Notes Year ended 30 June 2015
Stockland Financial Report 2015 — 126
(F4) Contingent liabilities
KEEPING IT SIMPLE …
A contingent liability is a liability that is not sufficiently certain to qualify for recognition as a provision where uncertainty may exist regarding the outcome of future events.
The only known contingent liabilities at 30 June 2015, other than the Stockland Bundaberg put option disclosed in note (E1a), are the bank guarantees and insurance bonds.
Stockland Stockland
Trust Group
2015
$M
2014
$M
2015
$M
2014
$M
Guarantees
Bank guarantees and insurance bonds issued to semi and local government and other authorities against performance contracts, maximum facility $450 million (2014: $450 million)
300 262 300 262
No deficiencies of assets exist in relation to any of the companies to which bank guarantees apply.
(F5) Commitments
Capital expenditure commitments
Commitments for the acquisition of land and future development costs not recognised in the financial statements at balance date:
Inventory commitments 183 240 – –
Investment property commitments 152 305 54 229
Total capital expenditure commitments 335 545 54 229
Operating lease commitments
Commitments for the operating lease expenditure not recognised in the financial statements at balance date:
Within one year 4 4 – –
Later than one year but not later than five years 8 8 – –
Later than five years – 1 – –
Total operating lease commitments 12 13 – –
During the current financial year, $4 million was recognised as an expense in Stockland’s profit or loss in respect of operating leases (2014: $7 million).
(F6) Related party disclosures Details of related party dealings with the Stockland and Stockland Trust Group companies are set out below:
Responsible Entity and other management fees
Stockland received Responsible Entity and other Management Fees from the unlisted property funds managed by Stockland during the financial year.
The Stockland Trust Group paid Responsible Entity fees to Stockland Trust Management Limited, calculated at 0.2% of gross assets of the Stockland Trust Group less intercompany loans (2014: 0.2%).
Property management expenses were paid by Stockland Trust Group to Stockland Trust Management Limited (the Responsible Entity) or its related parties provided in the normal course of business and on normal terms and conditions.
Rental income
Rent was paid by Stockland Corporation Limited, a related party of the Responsible Entity to the Stockland Trust Group in the normal course of business and on normal terms and conditions.
For
per
sona
l use
onl
y

Consolidated Notes Year ended 30 June 2015
Stockland Financial Report 2015 — 127
(F6) RELATED PARTY DISCLOSURES (CONTINUED)
Finance income
Stockland Trust Management Limited (a controlled entity of Stockland Corporation Limited) or a nominated subsidiary of Stockland has provided loan facility offers to two unlisted property funds managed by Stockland on market terms and conditions available at the date of acceptance of the loan facility offer. The loan facility offers have not yet been accepted by the related parties. The loan facility offer to Stockland Direct Retail Trust No. 1 (‘SDRT No. 1’) of $40 million was extinguished on 19 December 2014. SDRT No. 1 was charged a line fee of 30 basis points on this facility offer. The loan facility offer to Stockland Residential Estates Equity Fund No. 1 (‘SREEF No.1’) of $11 million expires on 30 September 2017. SREEF No. 1 was charged a line fee of 20 basis points on this facility offer.
The Stockland Trust Group has an unsecured loan to Stockland Corporation Limited Group repayable at call to the Stockland Trust Group of $3,378 million (2014: $3,657 million). Interest on the loan is payable monthly in arrears at interest rates within the range of 8.6% to 9.2% during the year ended 30 June 2015 (2014: 8.6% to 9.6%). The Stockland Trust Group has not called on this loan at 30 June 2015.
Interest was paid by the Company to the Stockland Trust Group, a related party of the Responsible Entity provided in the normal course of business and on normal terms and conditions.
Development Management Fee
A development management deed was executed between Stockland Trust and Stockland Development Pty Limited (a controlled entity of the Company) effective 1 July 2012 in relation to a management fee in respect of Retail developments. The fee represents remuneration for the Corporation’s property development expertise and is calculated as 50 per cent of the total valuation gain or loss on the completion of a development. Fees are paid by Stockland Trust to Stockland Development Pty Limited.
Stockland Stockland Trust Group
2015$’000s
2014$’000s
2015
$’000s
2014
$’000s
Revenue
Responsible Entity fees 1,003 1,789 – –
Management and service fee 2,900 1,363 – –
Property management and leasing fees 2,787 2,313 – –
Rental income – – 4,557 9,324
Finance income 195 408 296,991 328,293
Total revenue from related parties 6,885 5,873 301,548 337,617
Expenses
Responsible Entity fees – – 18,043 17,020
Property management and leasing fees – – 24,336 24,966
Recoupment of expenses – – 70,193 49,746
Development management fee capitalised to investment property
– – 13,260 11,300
Total expenses to related parties – – 125,832 103,032
Stockland has trade receivables of $2,921 thousand (2014: $4,369 thousand) due from the unlisted property funds.
As at 30 June 2015, the carrying amount of Stockland’s investment in the unlisted property funds was $5,237 thousand (2014: $6,029 thousand).
For
per
sona
l use
onl
y

Consolidated Notes Year ended 30 June 2015
Stockland Financial Report 2015 — 128
(F7) Personnel expenses
Personnel expenses comprised of the following: Stockland Stockland Trust Group
Year ended 30 June 2015
$M 2014
$M 2015
$M 2014
$M
Wages and salaries (including on-costs) 173 162 – –
Contributions to defined contribution plans 12 11 – –
Equity-settled share based payment transactions 13 7 – –
Increase in annual and long service leave provisions 2 3 – –
$1,000 Employee Security Plan (including associated costs) 1 1 – –
Total personnel expenses 201 184 – –
This disclosure note includes the accounting policies for all items related to personnel expenses. This includes the treatment of balance sheet items that relate to personnel expenses such as provision for employee benefits, which are included in Other Liabilities on the balance sheet.
Annual leave
Accrued annual leave of $7 million (2014: $7 million) is presented as current, since the Group does not have an unconditional right to defer settlement for any of these obligations. Based on past experience, the Group expects all employees to take the full amount of accrued leave within the next 12 months.
Long service leave
The current portion of long service leave includes all unconditional entitlements where employees have completed the required period of service and also those where employees are entitled to pro-rata payments in certain circumstances.
The liability for long service leave expected to be settled more than 12 months from the balance date is recognised in the provision for employee benefits and measured as the present value of expected payments to be made in respect of services provided by employees up to the balance date.
Consideration is given to expected future wage and salary levels, past experience of employee departures and periods of service. Expected future payments are discounted using market yields at the balance date on corporate bonds with terms to maturity that match, as closely as possible, the estimated future cash outflows.
Bonus entitlements
A liability is recognised in current trade and other payables for employee benefits in the form of employee bonus entitlements where there is a contractual obligation or where there is a past practice that has created a constructive obligation. Liabilities for employee bonus entitlements are expected to be settled within 12 months and are measured at the amounts expected to be paid when they are settled.
Superannuation plan
The Company contributes to several defined contribution superannuation plans. Contributions are recognised as a personnel expense as they are incurred.
For
per
sona
l use
onl
y

Consolidated Notes Year ended 30 June 2015
Stockland Financial Report 2015 — 129
(F8) Key Management Personnel disclosures Key management personnel compensation comprised of the following:
Year ended 30 June 2015
$’000s 2014
$’000s
Short term employee benefits 12,769 10,933
Post-employment benefits 207 167
Other long term benefits 104 (66)
Termination benefits – 305
Share based payments 5,560 3,342
Total key management personnel compensation 18,640 14,681
Information regarding individual Directors’ and Executives’ remuneration is provided in the Remuneration Report on pages 34 to 55 of the Directors’ Report.
Other transactions with KMP
There are transactions between Stockland and entities with which Directors have an association. These transactions do not meet the definition of related parties since the Directors as individuals are not considered to have control or significant influence over the financial or operating activities of the respective non-Stockland entities. Furthermore, the terms and conditions of those transactions were no more favourable than those available, or might reasonably be available, on similar transactions to non-Director related entities on an arm’s length basis.
(F9) Auditor’s remuneration
Stockland Stockland
Trust Group
2015
$’000s
2014
$’000s
2015
$’000s
2014
$’000s
Auditor of Stockland – PricewaterhouseCoopers Australia
Audit services
Audit and review of the Financial Report 1,524 1,406 476 490
Audit of Unlisted Property Fund Financial Reports 189 233 – –
Regulatory audit and assurance services 561 559 417 421
Other audit and assurance services 308 130 – –
Total remuneration in relation to audit services 2,582 2,328 893 911
Other non-audit related services
Taxation compliance services 224 232 152 152
Other taxation and restructuring services – 32 – –
Other non-audit services 706 164 – –
Total remuneration in relation to non-audit services 930 428 152 152
Total auditor remuneration 3,512 2,756 1,045 1,063
Auditor’s fees are paid by Stockland Development Pty Limited on behalf of Stockland and Stockland Trust Group.
(F10) Events subsequent to the end of the year
Stockland and Stockland Trust Group
Other than disclosed elsewhere in this report, there has not arisen in the interval between the end of the current financial year and the date of this report any item, transaction or event of a material or unusual nature, likely, in the opinion of the Directors, to affect significantly the operations, the results of operations, or the state of the affairs in future years of Stockland and the Stockland Trust Group.
For
per
sona
l use
onl
y

Stockland Financial Report 2015 — 130
Directors’ Declaration Year ended 30 June 2015
(1) In the opinion of the Directors of Stockland Corporation Limited (‘the Company’), and the Directors of the Responsible Entity of Stockland Trust (‘the Trust’), Stockland Trust Management Limited (collectively referred to as ‘the Directors’):
(a) the financial statements and Notes, in the Directors’ Report of Stockland Corporation Limited and its controlled entities, including Stockland Trust and its controlled entities (‘Stockland’) and Stockland Trust and its controlled entities (‘Stockland Trust Group’), set out on pages 58 to 129, are in accordance with the Corporations Act 2001, including:
(i) giving a true and fair view of Stockland’s and Stockland Trust Group’s financial position as at 30 June 2015 and of their performance, for the financial year ended on that date; and
(ii) complying with Australian Accounting Standards (including Australian Accounting Interpretations) and the Corporations Regulations 2001;
(b) there are reasonable grounds to believe that both Stockland and Stockland Trust Group will be able to pay their debts as and when they become due and payable.
(2) There are reasonable grounds to believe that the Company and the Group entities identified in Note (E3) will be able to meet any obligations or liabilities to which they are or may become subject to by virtue of the Deed of Cross Guarantee between those Group entities pursuant to ASIC Class Order 98/1418.
(3) The Trust has operated during the year ended 30 June 2015 in accordance with the provisions of the Trust Constitution of 24 October 2006, as amended.
(4) The Register of Unitholders has, during the year ended 30 June 2015, been properly drawn up and maintained so as to give a true account of the unitholders of the Trust.
(5) The Directors have been given the declarations required by Section 295A of the Corporations Act 2001 from the Managing Director and Chief Financial Officer for the year ended 30 June 2015.
(6) The Directors draw attention to Note A to the financial statements, which includes a Statement of Compliance with International Financial Reporting Standards.
Signed in accordance with a resolution of the Directors:
Graham Bradley Chairman
Mark Steinert Managing Director
Dated at Sydney, 19 August 2015
For
per
sona
l use
onl
y

Stockland Financial Report 2015 — 131
Independent Auditor’s Report
Independent auditor’s report to the stapled securityholders of Stockland Consolidated Group and the unitholders of Stockland Trust Group
Report on the financial report
We have audited the accompanying financial report which comprises:
the Consolidated Balance Sheet as at 30 June 2015, the Consolidated Statement of Profit or Loss and Other Comprehensive Income, Consolidated Statement of Changes in Equity and Consolidated Cash Flow Statement for the year ended on that date, a summary of significant accounting policies, other explanatory notes and the directors’ declaration for Stockland Consolidated Group, being the consolidated stapled entity (“Stockland Consolidated Group”). The consolidated stapled entity, as disclosed in Note A of the financial report, comprises Stockland Corporation Limited and the entities it controlled at year’s end or from time to time during the financial year, including Stockland Trust and the entities it controlled at year’s end or from time to time during the financial year, and
the Consolidated Balance Sheet as at 30 June 2015, the Consolidated Statement of Profit or Loss and Other Comprehensive Income, Consolidated Statement of Changes in Equity and Consolidated Cash Flow Statement for the year ended on that date, a summary of significant accounting policies, other explanatory notes and the directors’ declaration for Stockland Trust Group, being the consolidated entity (“Stockland Trust Group”). The consolidated entity comprises Stockland Trust and the entities it controlled at year’s end or from time to time during the financial year.
Directors’ responsibility for the financial report
The directors of Stockland Corporation Limited and the directors of Stockland Trust Management Limited, the Responsible Entity of Stockland Trust, (collectively referred to as “the directors”) are responsible for the preparation of the financial report that gives a true and fair view in accordance with Australian Accounting Standards and the Corporations Act 2001 and for such internal control as the directors determine is necessary to enable the preparation of the financial report that is free from material misstatement, whether due to fraud or error. In Note A, the directors also state, in accordance with Accounting Standard AASB 101 Presentation of Financial Statements, that the financial statements comply with International Financial Reporting Standards.
Auditor’s responsibility
Our responsibility is to express an opinion on the financial report based on our audit. We conducted our audit in accordance with Australian Auditing Standards. Those standards require that we comply with relevant ethical requirements relating to audit engagements and plan and perform the audit to obtain reasonable assurance whether the financial report is free from material misstatement.
PricewaterhouseCoopers, ABN 52 780 433 757 Darling Park Tower 2, 201 Sussex Street, GPO BOX 2650, SYDNEY NSW 1171 T: +61 2 8266 0000, F: +61 2 8266 9999, www.pwc.com.au
Liability limited by a scheme approved under Professional Standards Legislation.
For
per
sona
l use
onl
y
InA
An aprocfinathe deseffeevadire
We
Ind
In c
Aud
In o
a)
b)
Re
We direaccrepo
Aud
In o300
Pric
S J Par
ndepenuditor’
audit involvescedures selec
ancial report, wStockland Co
sign audit procectiveness of taluating the apectors, as well
believe that th
dependence
conducting our
ditor’s opinio
our opinion:
the financial 2001, includi
i. giving aJune 2
ii. complyCorpor
the financial
eport on th
have audited ectors of Stockordance with sort, based on
ditor’s opinio
our opinion, the0A of the Corp
cewaterhouseC
Hadfield tner
ndent s Repo
performing pcted depend owhether due toonsolidated Grcedures that ahe Stockland
ppropriatenessas evaluating
he audit evide
r audit, we hav
on
report of Stocing:
a true and fair015 and of the
ying with Austrrations Regula
report also co
he Remun
the remunerakland Consolidsection 300A our audit cond
on
e remuneratioporations Act 2
Coopers
ort
rocedures to on the auditor’s
o fraud or erroroup and Stocre appropriateConsolidated
s of accountingg the overall pr
ence we have
ve complied w
ckland Consoli
r view of Stockeir performanc
ralian Accountations 2001.
omplies with In
neration Re
ation report incdated Group aof the Corporaducted in acco
on report of Sto2001.
obtain audit evs judgement, ir. In making thkland Trust G
e in the circumGroup and St
g policies usedresentation of
obtained is su
with the indepe
idated Group
kland Consolidce for the year
ting Standards
nternational Fi
eport
cluded in pageare responsibleations Act 200ordance with A
ockland Cons
N R McConn Partner
vidence aboutncluding the ahose risk asseroup’s prepara
mstances, but ntockland Trustd and the reasthe financial r
ufficient and a
endence requi
and Stockland
dated Group ar ended on tha
s (including th
inancial Repo
es 34 to 55 of e for the prepa01. Our responAustralian Aud
olidated Grou
nell
t the amounts assessment ofessments, the ation and fair not for the purt Group’s intersonableness oreport.
ppropriate to p
rements of the
d Trust Group
and Stocklandat date; and
he Australian A
rting Standard
the directors’ aration and prnsibility is to editing Standard
p for the year
Stockla
and disclosurf the risks of mauditor considpresentation orpose of exprernal control. Aof accounting
provide a basi
e Corporations
is in accordan
Trust Group’s
Accounting Int
ds as disclosed
report for the resentation of express an opids.
ended 30 Jun
and Financial R
res in the finanmaterial misstaders internal cof the financiaessing an opinAn audit also in
estimates ma
is for our audi
s Act 2001.
nce with the C
s financial pos
terpretations)
d in Note A.
year ended 3the remunerainion on the re
ne 2015, comp
Report 2015 —
ncial report. Tatement of thecontrol relevanal report in ordnion on the ncludes de by the
t opinions.
Corporations A
sitions as at 30
and the
30 June 2015. ation report in emuneration
plies with sect
Sydn19 August 20
— 132
he e nt to er to
Act
0
The
tion
ney 015
For
per
sona
l use
onl
y

Stockland Financial Report 2015 — 133
Security Information and key dates
Securityholders
The information set out below was prepared as at 31 July 2015 and applies equally to Stockland Trust and Stockland Corporation Limited, as members are required to hold equal numbers of units in the Trust and shares in the Corporation under the terms of the joint quotation on the Australian Securities Exchange. As at 31 July 2015, there were on issue 2,361,717,862 ordinary units in the Trust and ordinary shares in the Corporation. There is no current on-market buy back.
Largest Twenty Ordinary Unitholders/Securityholders Number of securities
Percentage of issued securities
HSBC Custody Nominees (Australia) Limited 787,666,594 33.35
JP Morgan Nominees Australia Limited 412,161,123 17.45
National Nominees Limited 351,323,352 14.88
Citicorp Nominees Pty Limited 171,125,913 7.25
BNP Paribas Noms Pty Ltd <DRP> 100,465,774 4.25
Citicorp Nominees Pty Limited <Colonial First State Inv A/C> 35,307,335 1.49
AMP Life Limited 27,692,787 1.17
RBC Investor Services Australia Nominees Pty Limited <APN A/C> 26,196,866 1.11
RBC Investor Services Australia Nominees Pty Limited <BKCUST A/C> 12,696,795 0.54
Questor Financial Services Limited <TPS RF A/C> 10,818,873 0.46
SBN Nominees Pty Limited <10004 Account> 8,000,000 0.34
UBS Wealth Management Australia Nominees Pty Ltd 7,839,174 0.33
RBC Investor Services Australia Nominees Pty Limited <PI POOLED A/C> 7,478,205 0.32
RBC Investor Services Australia Nominees Pty Limited <PISELECT> 7,091,544 0.30
EG Holdings Pty Limited 6,411,632 0.27
Bond Street Custodians Limited <ENH Property Securities A/C> 6,279,838 0.27
BNP Paribas Nominees Pty Ltd <Agency Lending DRP A/C> 6,274,822 0.27
National Nominees Limited <N A/C> 5,122,000 0.22
Merrill Lynch (Australia) Nominees Pty Limited <MLPRO A/C> 4,497,900 0.19
UBS Nominees Pty Ltd 4,497,222 0.19
Distribution of securityholders Number of securities
Percentage of securityholders
1 – 1,000 4,487,852 0.19
1,001 – 5,000 61,480,896 2.60
5,001 – 10,000 66,293,168 2.81
10,001 - 100,000 125,241,403 5.30
100,001 - over 2,104,214,543 89.10
There were 1,861 securityholders holding less than a marketable parcel (118) at close of trading on 31 July 2015.
Substantial securityholders Number of units/shares
Vanguard Investments Australia Limited/Vanguard Group Inc. 167,110,561
BlackRock Group (BlackRock Inc. and subsidiaries) 157,018,611
State Street Corporate and subsidiaries 136,943,104
National Australia Bank Limited and its associated entities 118,198,190
AMP Limited (and its related bodies corporate) 118,142,950
For
per
sona
l use
onl
y

Security Information and key dates
Stockland Financial Report 2015 — 134
End of Financial Year Tax Statement
After 30 June each year you will receive a comprehensive tax statement. This statement summarises the distributions and dividends paid to you during the year, and includes information required to complete your tax return.
Shareholder Review and Financial Report
Members have a choice of whether they receive:
• the Shareholder Review only;
• a Financial Report;
• the Shareholder Review plus Financial Report; or
• electronic versions of the Shareholder Review and Financial Report.
Registry
Computershare Investor Services Pty Limited operates a freecall number on behalf of Stockland. Contact Computershare on 1800 804 985 for:
• change of address details;
• request to receive communications online;
• request to have payments made directly to a bank account;
• provision of tax file numbers; or
• general queries about your securityholding.
Distribution Periods
1 July – 31 December
1 January – 30 June
Record Dates
31 December 2015
30 June 2016
Annual General Meeting
To be held at the Radisson Blu Hotel Sydney, 27 O’Connell Street, Sydney, New South Wales at 2.30pm on Tuesday 27 October 2015.
For
per
sona
l use
onl
y

Security Information and key dates
Stockland Financial Report 2015 — 135
Key Dates
27 October 2015
Annual General Meeting Radisson Blu Hotel Sydney, 27 O’Connell Street, Sydney, NSW 2000 at 2.30pm
On or about 17 December 2015
Announcement of estimated dividend/distribution
31 December 2015
Record date
10 February 2016
Half-year result announcement
On or about 20 June 2016
Announcement of estimated dividend/distribution
30 June 2016
Record date
17 August 2016
Full-year result announcement
For
per
sona
l use
onl
y

F
or p
erso
nal u
se o
nly