for personal use only · mcgrath limited is a company limited by shares, incorporated and domiciled...
TRANSCRIPT

McGrath Limited and Controlled Entities
Report ACN 608 153 799
For
per
sona
l use
onl
y

McGrath Limited and Controlled Entities
McGrath Limited and Controlled Entities A.C.N. 608 153 779 Corporate Information McGrath Limited is a company limited by shares, incorporated and domiciled in Australia. McGrath Limited listed on the Australian Securities Exchange on 7 December 2015 (ASX: MEA). Its registered office and principal place of business is: McGrath Limited 191 New South Head Road EDGECLIFF NSW 2027 All press releases and other company background information is available on our website: www.mcgrath.com.au. In this report, McGrath Limited is referred to as the Company McGrath, McGrath Limited and the subsidiaries that it controlled at the end of the period and from time to time throughout the period are together referred to as the Consolidated Entity.
What we do Founded in 1988 by John McGrath, McGrath has been established as one of the leading residential real estate service providers in Australia with a strong market presence in New South Wales and the Australian Capital Territory, a growing presence in Queensland and entered the Victorian market during financial year 2016. McGrath is an integrated residential real estate services company providing a range of services including residential property sales, property management, mortgage broking, auction services and real estate training.
For
per
sona
l use
onl
y

McGrath Limited and Controlled EntitiesMcGrath Limited and Controlled Entities
McGrath Limited and Controlled Entities A.C.N. 608 153 779
Annual Financial Report 2017
E Other information E1 Taxation 61-63 E2 Other assets 64 E3 Provisions 64 E4 Capital and reserves 65 E5 Subsidiaries and non-controlling interests 66-67 E6 Parent entity disclosures 67 E7 Auditor's remuneration 68 E8 Deed of cross guarantee 68-70 E9 General accounting policies 71-74
Directors’ Declaration 75 Independent Auditor’s report 76-80 Shareholder Information 81-82 Corporate Directory 83
Notes to the financial statements 34
B Financial position B1 Trade and other receivables 42 B2 Property, plant & equipment 43-44 B3 Intangible assets 45-46 B4 Trade and other payables 47 B5 Interest bearing loans and borrowings 47-48 B6 Business Combinations 48-49
A Financial performance and cash flows A1 Revenues and other income 36 A2 Operating Segments 36-37 A3 Cash and cash flow related information 38 A4 Employee benefit expenses 39 A5 Earnings per share 40
Letter from Chair 2 Letter from CEO 3 Operating and financial review 4-7 Corporate Governance 8-10 Remuneration Report 11-23 Directors Report 24-26 Auditor’s Independence Declaration 27
D Unrecognised items D1 Commitments for expenditure 59 D2 Contingent liabilities 59 D3 Events subsequent to reporting date 59
C Risk, capital management and related parties
C1 Financial risk management 51-53 C2 Capital management 54 C3 Dividends paid and proposed 54 C4 Key management personnel disclosure 55-57 C5 Related party transactions 57
Financial statements Consolidated statement of profit or loss and other comprehensive income 29 Consolidated statement of financial position 30 Consolidated statement of changes in equity 31 Consolidated statement of cash flows 32
For
per
sona
l use
onl
y

McGrath Limited and Controlled Entities McGrath Limited and Controlled Entities
Letter from the Chair
Dear fellow shareholder,
We are pleased to present our 2017 Annual Report.
We believe this Report is best read in context with the 2016 Results and macro environment. You will recall that last year we reported year-on-year revenue growth in every operating segment, but a 3% EBITDA decline in the largest earnings segment of company owned sales. At the AGM we also reported the then-unprecedented low listings volumes had much to do with the underperformance of that business, and our assessment of the reasons behind those low volumes.
Since then, low listing volumes have translated into lower sales volumes, and our business has not been immune. According to RP Data, FY17 saw approximately $20 billion less residential sales in the markets in which our company owned and franchise offices operate than FY16. Our company owned offices lost approximately $850m in sales value over the same period, while our franchise business gained approximately $1.5bn of sales value. Pleasingly, almost $500m of that gain was on a same store basis, pointing to decent market share growth.
Our skew towards premium price properties is evident in the fact that our market share by value is materially higher than our market share by volume. Our sales agents continue to strive for the best prices for their clients, and have had many impressive successes.
Overall market prices increased by around 10% in our key markets outside of Queensland, indicating just how large a drop in sales volumes has been experienced. To date, we have not seen much recovery of volumes, and still believe people are spending longer in their homes due to higher transaction costs and other reasons. We applaud the Federal Government’s May 2017 Budget initiatives for downsizers, and again appeal to State and Territory Governments to reduce their top Stamp Duty thresholds to ease the stock shortage.
Finally, I again thank Cameron and his team for their contributions to the Company, which have been broad, concerted and much appreciated. With the more recent appointments of a number of high calibre executives to the leadership team, and the commitment and invaluable contributions of each of our Board members, McGrath is positioned as best it can be in challenging markets.
Sincerely,
Cass O’Connor
Chair
2
For
per
sona
l use
onl
y

McGrath Limited and Controlled Entities McGrath Limited and Controlled Entities
Letter from the CEO
Dear Shareholder,
Your Company celebrated its 29th year of operation, and its first full year as an ASX listed entity.
Notwithstanding the challenging market environment in FY17, particularly as a result of the low volume of listings and sales throughout the financial year, and the loss of a number of high performing sales agents in the Company Owned segment in December 2016 and January 2017, the strength of our business model saw us deliver $15.6 million EBITDA.
In the year, we continued to grow into new markets with the addition of 15 offices to our network, with 3 company owned offices in NSW, and 12 franchise offices in NSW and Victoria. As at 30 June 2017, the McGrath network comprised 102 offices and over 2,300 people. Year on year we maintained our market share by sales value at 3.4% nationally.
Particularly pleasing has been the strength of our annuity businesses, Property Management and Franchise, which have delivered revenue and EBITDA growth year on year.
In addition, across the McGrath network:
• Pro-forma property sales volume increased 5% to 12,841 sales. Sales value increased 5% to $13.9 billion.
• Agent numbers have increased 2%. We now have 657 agents, with 222 in company owned offices and 435 in franchise offices.
• Managed properties grew to over 32,000. This representsmore than $21.7 billion in value of properties under management.
• Mortgage broking – the total value of loans settled byOxygen Home Loans was $915m, which was up 12% on FY16.
• We achieved a 100% clearance rate and sold a further 57 properties in Millers Point for $160 million on behalf of Property NSW in the year.
• The Australasian Real Estate Conference celebrated its 20th anniversary and continues to grow with a record number of delegates in attendance at the FY17 conference.
As one of Australia’s largest residential real estate service companies we continue to leverage the underlying strength of the McGrath brand, quality of sales agents and network reach.
We are a people business and with a concerted, ongoing focus on talent, McGrath continues to attract, develop and retain emerging and high performing sales agents. We have an unparalleled track record of growing and nurturing the best real estate agents in Australia.
We have added leadership capability and depth to our team, with the recent appointments of Adrian Wilson and Chris Mourd, who will support Kon Stathopoulos and our plans for growth.
We continue to focus on improving the productivity and performance of each of our existing segments and McGrath is exploring new revenue opportunities in adjacent property services.
Our aim is to continue to grow the relative contributions of each of our annuity businesses in Property Management, Franchise and Oxygen and de-risk the volatility of our earnings in Company Owned Sales, and take a disciplined approach to investment in the business to build long-term shareholder value.
Lastly and most importantly, I would like to thank all our team and franchise partners for their energy, commitment and dedication during what has been a challenging year.
Cameron Judson
CEO
3
For
per
sona
l use
onl
y

McGrath Limited and Controlled Entities
McGrath Limited and Controlled Entities
Operating and financial review
Operations
The Consolidated Entity operates a diverse business model which provides a range of services that include residential property sales, property management, mortgage broking, auction services and real estate training. The McGrath Network of real estate offices includes both sales offices operated by the Consolidated Entity (Company owned offices) and sales offices operated by franchisees of the Consolidated Entity (Franchise offices). The operating segments are: Company owned sales: This segment undertakes residential property sales on behalf of property vendors through the Company owned offices and agents. The segment generates revenue by charging a sales commission to a property vendor upon successful sale of a property. The commission is generally based on a percentage of the property’s value. Company owned property management: This segment directly manages residential properties on behalf of owner clients. The segment generates revenue through charging a commission to manage a property and leasing fees earned upon successful letting of a property. Franchise services: This segment manages franchise offices that undertake both property sales and property management activities. The segment receives fees from its franchisees that include: • An initial grant fee on the issue of a franchise or on a franchise renewal; • An ongoing franchise fee based on a fixed percentage of the total sales commission paid on the sale of a property (Gross Commission Income) generated; • An ongoing marketing fund contribution based on a fixed percentage of the gross commission income generated by the franchisee; and • A fixed percentage of the Franchisees’ property management fees. Other services: The Consolidated Entity also has a number of other services which complement the service offerings of the segments above. These include: • Mortgage broking services which earn revenue based on an up-front fee and an ongoing trailing commission • Training services organise a number of Australian residential real estate conferences and receives revenue from fees paid by attendees, exhibitors and sponsors • Auction service group generates revenue based on a fixed fee per auction.
Agents and office locations
As at 30 June 2017 the network comprised 28 Company owned offices and 74 Franchise offices with over 650 agents operating within those offices. The spread of offices is across the Eastern seaboard as seen in the graphic in figure 1 below. A total of 17 offices opened in FY17. Total agents have increased to 657, which is a 2% increase on FY16, driven by the new Franchise office openings. McGrath continues to attract, retain, develop and reward high performing sales agents. Our focus is on growing the office network and market share in New South Wales, ACT, Queensland and Victoria. Productivity increases for existing and new agents will be achieved through new tools and software.
Figure 1: McGrath office Network
Company owned offices
Franchise offices
165
23
28
10
4574
3
4
For
per
sona
l use
onl
y

McGrath Limited and Controlled Entities
McGrath Limited and Controlled Entities
Company owned sales
$6.4 billion in sales value from 4,504 sales for FY17 compared to $7.1 billion and 5,126 sales in FY16. In FY17 new offices were opened in Blacktown and Wahroonga. The office Forestville was transferred from franchisee ownership. Segment EBITDA of $15.5m was 42% down on FY16 driven by continued low listings volume decline, loss of agents over the December/January period and increased commission costs in the second half with the launch of McGrath Future (see below). Company owned property management
Properties under management increased to 7,463 in FY17, generating $7.0m EBITDA, which was up 34% on FY16. This was driven by the higher number of managed properties, and cost efficiency measures driving profit margins. Franchise services
Our franchise network exchanged 8,337 sales during FY17, generating EBITDA of $7.2 million, which was up 15% on FY16. This was driven by higher GCI from a larger office footprint, and flat operating expenses year on year. FY17 saw the franchise network grow by an additional 12 franchise offices. 7 new offices in New South Wales, 6 in Victoria and 1 in Queensland. 1 office was transferred to company owned and 1 office closed during the year. The 100th McGrath office milestone was passed in April with the opening of the Toukley sales office.
Mortgage broking
Oxygen Home Loans total settlements value of $915 million was up 12% on FY16. At the end of FY17 there were 36 brokers supporting the network. McGrath Future
McGrath Future is a program designed to reward and retain the Company’s best sales agents, and attract the industry’s top performers. There are 3 elements to the McGrath Future program. The first is to reward high performance, the second is to build a virtual asset for the future and the third is to create an annuity stream. The first element, rewarding high performance comes in the form of a bonus commission plan. The second element is a property management partnership program. Agents will share ownership of the referrals into our property management business. The third element is a recruitment trail, providing agents with an annuity stream.
Pro forma segment revenues and EBITDA
2017 2016 $’000 $’000 Revenue Company owned sales 85,683 96,948 Company owned property management 20,012 18,972 Franchise services 11,460 10,574 Other operating segments 11,887 10,483 Total Revenue 129,042 136,977 EBITDA Company owned sales 15,475 26,751 Company owned property management 7,022 5,236 Franchise services 7,229 6,287 Other operating segments (589) 486 Corporate (13,883) (12,516) Total EBITDA 15,254 26,244
5
For
per
sona
l use
onl
y

McGrath Limited and Controlled Entities
McGrath Limited and Controlled Entities
Pro Forma Income Statement
To assist in the interpretation of the underlying performance of the consolidated entity a pro forma income statement is presented below. Underlying pro forma performance is reconciled to statutory results further below. 2017 2016 $'000 $'000 Revenue 129,042 136,977 Cost of sales (49,943) (54,148) Pro forma Gross profit 79,099 82,829 Employee benefits expenses (36,913) (33,927) Other expenses (26,932) (22,658) Pro forma earnings before interest, tax, depreciation and amortisation (EBITDA) 15,254 26,244 Depreciation (1,397) (1,929) Amortisation (8,357) (3,842) Pro forma earnings before interest and tax (EBIT) 5,500 20,473 Net finance income
37 101
Pro forma profit before tax 5,537 20,574 Income tax expense
(987) (5,980)
Pro forma NPAT 4,550 14,594 Reconciliation of statutory to pro forma amounts
2017* 2016* $'000 $'000
Statutory revenues and other income 129,363 120,957 Acquisition1 0 18,356 Fair value adjustment of deferred consideration2 (321) (2,336) Pro forma revenues and other income 129,042 136,977 Statutory NPAT 4,871 8,411 Acquisition1 0 5,285 Fair value adjustment of deferred consideration2 (321) (2,336) Transaction and acquisition costs3 0 6,841 Total pro forma adjustments impacting EBITDA (321) 9,790 Impact of Acquisition on Depreciation and amortisation 0 (2,122) Net finance costs 0 300 Tax effect of pro forma adjustments 0 (1,785) Total pro forma adjustments impacting NPAT (321) 6,183 Pro forma NPAT 4,550 14,594 * EBITDA is a non-IFRS measure and represents earnings before interest, tax, depreciation, and amortisation. The reconciliation between statutory revenues and NPAT and pro forma revenues and NPAT includes non-IFRS measures and was not subject to audit. 1 Adjustments reflect the recognition of the Smollen Group’s revenue and operating expenses as though the acquisition had taken place on 1 July 2015. This adjustment included treating the Smollen Group as a company owned operation for the period 1 July 2015 to 7 December 2015. The adjustment includes two components being the recognition of revenue, operating expenses and one off transaction costs, offset by the elimination of any franchise fees recognised in this period. 2 Adjustment to remove the fair value adjustment of the deferred consideration related to the acquisition of the Smollen group 3 Adjustment to remove transaction costs incurred in respect of the IPO and acquisition costs.
6
For
per
sona
l use
onl
y

McGrath Limited and Controlled Entities
McGrath Limited and Controlled Entities
Key Business Risks
The Consolidated Entity is subject to various risk factors. Some of these are specific to its business activities. Others are of a more general nature. Individually, or in combination, these risk factors may affect the future operating and financial performance of the Consolidated Entity.
� Australian residential real estate market – McGrath generates the majority of its income from the Australian residential real estate market through commission revenue generated by agents on the sale of properties, property management commissions and commissions on the arranging of mortgages. The risk of a reduction in sales transaction volumes or prices is a material risk for McGrath and could be impacted by general economic conditions and factors beyond the Company’s control such as housing affordability, employment, interest rates, domestic investor growth and demand, foreign investment and consumer confidence.
� Increased competition and disintermediation – McGrath operates in a highly competitive environment and constantly monitors the market and the competitive environment. McGrath is also potentially exposed to disintermediation whereby buyers and sellers are able to transact directly in private sale without using the services of an agent. McGrath prides itself on delivering exceptional client service and providing a market-leading experience.
� Digital disruption – McGrath focuses on five key service offerings including residential property sales, property management, mortgage broking, auction services and career training. As technological advancements occur there is a risk that new entrants into the market or larger established corporates that may offer alternative services and products to that of the traditional real estate service offerings. These may impact on McGrath’s market share. McGrath continues to monitor the emergence of these disruptor technologies, and as part of its longer-term strategy is placing additional emphasis on innovation and technology throughout the Group to add value to its existing service offerings.
� Loss of key agents – McGrath relies significantly on its agents to deliver its services to its clients and promote the reputation of the Company through their dealings with clients and there is a risk that McGrath may lose agents to competitors and/or other industries. McGrath recently launched the McGrath Future Program, a commission and incentive program designed to assist in attracting and retaining high performing residential sales agents. McGrath currently has in place an Equity Incentive Plan that provides McGrath with the ability to offer equity, subject to specific performance and vesting criteria, in the Company as an incentive and retention tool to continue to attract and retain professional, experienced and highly qualified agents.
� Regulatory risks – McGrath currently has business operations in four states within Australia, with regulations and legislation varying in each state. McGrath relies on licences and approvals issued by various regulatory bodies to carry out its services. Non-compliance may result in penalties and a negative impact to McGrath’s operations and reputation. Additionally, changes and developments in legislation and/or regulation and policy in different jurisdictions may impact McGrath’s operations. McGrath mitigates regulatory risks through monitoring the regulatory and legislative environment, providing appropriate staff training, and maintaining relationships with regulatory bodies or industry organisations. McGrath also participates in various industry events.
The Consolidated Entity’s strategy takes into account these risks, however predicting future conditions is inherently uncertain.
7
For
per
sona
l use
onl
y

McGrath Limited and Controlled Entities
McGrath Limited and Controlled Entities
Corporate governance
McGrath’s corporate governance framework
The Board is committed to implementing the highest standards of corporate governance appropriate for McGrath, taking into account McGrath’s size, structure and nature of operations. Delegation to Board Committees and Management
The Board has established two standing committees, the Audit and Risk Committee and Remuneration and Nomination Committee, to support the Board in discharging its powers and responsibilities. In addition, the Strategy, Innovation, Technology and Execution (SITE) Committee was established during the reporting period to assist the Board and Management with the overall strategic planning and innovation initiatives of McGrath, as well as to provide specific assistance to Management with respect to technology implementation. The Board Charter and Committee Charters set out the responsibilities of the Board and each of the Committees. Day-to-day management and operations are delegated to Management who operates within the agreed framework and reports to, and seeks approvals from, the Board as required. The Chief Executive Officer is responsible for the overall operational and business management of McGrath. Board of Directors
The following persons were Directors of McGrath Limited during the year ended 30 June 2017: Cass O’Connor Chair and Non-executive Director. � McGrath Operations Limited, appointed 25 August 2000 � McGrath Limited, appointed 8 September 2015 � Appointed Chair 25 August 2016. Cass is also a member of the Audit and Risk Committee and was appointed chair of the Remuneration and Nomination Committee on 1 June 2017. Cass has over 30 years’ experience as a corporate advisor, private equity investor and equities research analyst. Currently running her own advisory and investment firm, she has previously been a senior banker with Carnegie, Wylie & Company (now Lazard Australia); an Executive Director with Goldman Sachs Australia LLC; Director of Turnbull & Partners Limited and equities research analyst with Bain & Company (now Deutsche Bank). Her industry specialisations include media, telecommunications, entertainment, property, luxury consumables and the not-for-profit sector. Cass has held and continues to hold a number of directorships on the boards of ASX listed, private and public sector entities.
Cass is currently a non-Executive Director of ASX listed Prime Media Group Limited, and unlisted Goalpost Pictures Pty Ltd among other entities. She was previously a Director of Bundanon Trust (2011 to 2015), Lifetime Care and Support Authority of NSW (2006 to 2012), Motor Accidents Authority of NSW (2010 to 2012), WorkCover Authority of NSW (2011 to 2012) and other government and private sector entities. Cass holds a Bachelor of Business from the University of Technology Sydney and is a Graduate of the Australian Institute of Company Directors. John McGrath Executive Director. � McGrath Operations Limited, appointed 2 March 2000 � McGrath Limited, appointed 8 September 2015 John founded McGrath in 1988 and is considered one of the most influential figures in the Australian property industry. John has grown McGrath Estate Agents to be one Australia's most successful integrated real estate service groups.
In 2003, John was awarded a Centenary Medal for service to business. In 2008, he was honored by the Real Estate Institute of NSW with the Woodrow Weight OBE Award, a lifetime achievement award for his outstanding contribution to the real estate industry.
John is a best-selling author, a Director of REA Group (since 1999), a Member of the REA Group HR Committee, and sits on the Board of the South Sydney “Rabbitohs”.
8
For
per
sona
l use
onl
y

McGrath Limited and Controlled Entities
McGrath Limited and Controlled Entities
Elizabeth Crouch Independent Non-executive Director. � Appointed 25 August 2016. Elizabeth is also the Chair of the Audit and Risk Committee and a member of the Remuneration and Nomination Committee. Elizabeth, an experienced and highly regarded non-executive director with ASX listed companies, was appointed to the McGrath Board in August 2016 and is Chair of the Audit and Risk Committee. She spent 16 years with the Federal government before moving to the private sector where she held various positions, including the role of Chief Executive of the Housing Industry of Australia for nine years. Elizabeth is currently on the Board of the Western Sydney Local Health District, is Chair of the Audit and Risk committees of the City of Sydney, Railcorp and the Office of Environment and Heritage, Deputy Chancellor of Macquarie University, and non-executive director of Macquarie University Hospital and SGS Economics and Planning. She is also a Trustee of the Museum of Applied Arts and Sciences. Elizabeth holds a Bachelor of Economics and is a Fellow of the Australian Institute of Company Directors. Nigel Dews Independent Non-executive Director. � Appointed 23 November 2016. Nigel was the Chair of the Remuneration and Nomination Committee and a member of the Audit and Risk Committee from the time of his appointment to the Board. He stepped down from both committees on 1 June 2017. Nigel’s professional experience encompasses more than 15 years in corporate leadership roles, often leading high-growth start-ups, as well as eight years in strategy consulting. He has been a leader in the digital media and telecommunications industries in Australia, as CEO of Vodafone Hutchison Australia and 3 Mobile, and as Chief Executive of the Fairfax Media digital business. Nigel completed an MBA with Distinction from London Business School after working in the Reserve Bank of Australia research department. He then spent five years with McKinsey & Company’s Sydney, New York and London offices in financial services and telecommunications. He is Chief Executive Officer of Message Media Group.
Cath Rogers Independent Non-executive Director. � Appointed 23 November 2016. Cath is also a member of the Audit and Risk Committee and the Remuneration and Nomination Committee. Cath brings more than 15 years of global experience in venture capital and private equity, investment banking, strategy consulting and technology ventures with firms including AirTree Ventures, Credit Suisse, The World Bank, Accenture, ABN Amro and Anchorage Capital Partners. Cath also serves as a Director of the Heart Research Institute and Heads Over Heels. Cath holds an MBA from INSEAD in France, a Bachelor of Commerce from UNSW and is a Chartered Financial Analyst and is a Graduate of the Australian Institute of Company Directors. David Mackay Chairman and Independent Non-executive Director. � Retired 25 August 2016. David was also a member of the Audit and Risk Committee and the Remuneration and Nomination Committee. David has had a long career with Kellogg Company in America and internationally, retiring as Chief Executive Officer and President of Kellogg Company in 2011 after holding a number of key positions within the company. David is a Director of Fortune Brands Home & Security Inc. (since 2011), a Director of Clorox Company Inc. (since August 2016) and has a Bachelor of Business Administration from Charles Sturt University. David was previously a non-Executive Director of Woolworths Limited (2012 to October 2015), an independent Director of Keurig Green Mountain, Inc. (2012 to March 2016), an independent Director and non-Executive Chairman of Beam, Inc. (2011 to April 2014), Managing Director of Sara Lee Bakery in Australia (1992 to 1998) and a former Director and Board Member of the Grocery Manufacturers of Australia, the Australian Food Council, the Industry Affairs Council of the Grocery Manufacturers of America, the Executive Committee of the Biscuit and Cracker Manufacturers’ Association and a member of the Global Consumer Goods Forum.
9
For
per
sona
l use
onl
y

McGrath Limited and Controlled Entities
McGrath Limited and Controlled Entities
Daniel Petre Independent Non-executive Director. � Retired 23 November 2016. Daniel was the Chair of the Remuneration and Nomination Committee and a member of the Audit and Risk Committee prior to retiring from the Board. Daniel has over 30 years of experience in Australia’s technology industry having founded AirTree Ventures, Ecorp Pty Ltd and Netus Pty Ltd. Daniel has held leadership positions in technology based businesses, including working at Microsoft’s headquarters in the U.S.
Daniel has served on a range of not for profit boards and is currently on the Sydney Theatre Company Board amongst other advisory roles. Daniel is currently a Director of Oneview Healthcare. Daniel was previously a Director of Nine Entertainment Company Holdings Ltd (2010 to 2011), Publishing and Broadcasting Limited (1997 to 2001) and was the Chairman of Ecorp (1997 to 2001). Daniel holds a Bachelor of Science with majors in Computer Science and Statistics from UNSW, a MBA from the University of Sydney and a Hon DBus from UNSW. Daniel is also a Graduate of the Australian Institute of Company Directors.
Attendance at meetings
The number of meetings of the Board of Directors and of each standing Board committee, of which the relevant Director was a member, held during the year ended 30 June 2017 and the number of meetings attended by each Director are detailed below:
Role and responsibilities of the Board � Represent and serve the interests of Shareholders by
considering and approving McGrath’s strategies, policies and performance
� Ensure that an appropriate corporate governance framework is established and operating
� Provide guidance and oversight in critical areas including: o strategic direction o financial oversight o risk management and internal controls o managerial oversight o delegations o corporate governance
The responsibilities of the Board are detailed in the Board Charter on McGrath’s website. The Board’s conduct is also governed by McGrath’s constitution. Both the Board Charter and McGrath’s constitution are available on McGrath’s website under About Us / Investor Centre (www.mcgrath.com.au/about/investorcentre)
Board composition and independence The Board currently consists of three independent Non-executive Directors and two non-independent Directors. Further information Further details are provided in McGrath’s Corporate Governance Statement available on McGrath’s website under About Us / Investor Centre (www.mcgrath.com.au/about/investorcentre).
Board Meeting Audit & Risk Committee Meeting
Remuneration & Nomination Committee Meeting
Eligible Attended Eligible Attended Eligible Attended D Mackay 2 2 2 2 1 1 J. McGrath 13 12 - - - - C. O’Connor 13 13 5 5 3 3 D. Petre 4 2 2 1 1 1 E. Crouch 11 11 3 3 2 2 C. Rogers 9 9 3 3 2 2 N. Dews 9 9 3 3 2 2
10
For
per
sona
l use
onl
y

McGrath Limited and Controlled Entities
McGrath Limited and Controlled Entities
Remuneration report Key management personnel covered in this report
Non-executive and executive directors (see pages 5-7 for details about each director)
Name Position
Cass O’Connor (appointed Chair 25 August 2016) John McGrath Elizabeth Crouch (appointed 25 August 2016) Nigel Dews (appointed 23 November 2016) Cath Rogers (appointed 23 November 2016) David Mackay (retired 25 August 2016) Daniel Petre (retired 23 November 2016)
Chair, Non-executive Director Executive Director Independent Non-executive Director Independent Non-executive Director Independent Non-executive Director Chair, Independent Non-executive Director Independent Non-executive Director
Other key management personnel
Name Position Cameron Judson (appointed 14 July 2016) Kon Stathopoulos (appointed 10 October 2016) Paul Hauenschild Christopher Mourd (appointed 13 June 2017) Geoff Lucas (resigned 12 August 2016) Matt Lahood (resigned 31 December 2016) Gary Vouris (resigned 3 April 2017)
Chief Executive Officer Head of Sales Chief Financial Officer Head of Franchise Services Chief Operating Officer Director of Sales General Manager of Franchise
1. Remuneration policy and link to performance
The Remuneration and Nomination Committee consists of a minimum of three members with a majority of independent Directors. The overall objective of the Remuneration and Nomination Committee is to assist the Board of Directors of McGrath Limited (the Company) and its subsidiaries to: � Align the Company’s remuneration approach with
shareholder interests to allow the organisation to attract, motivate and retain its staff to enhance the Company’s performance in a manner that supports the long-term financial soundness of the Company.
� Provide appropriate corporate governance by identifying the mix of skills and individuals required in Directors to allow the Board to contribute to the successful oversight and stewardship of the Company and discharge their duties under the law diligently and efficiently.
Balancing short-term and long-term performance Short-term incentives for the Company’s executives are set at a maximum of 40% of fixed annual remuneration with potential for “stretch” performance up to 125% of target. The targets are set to drive performance without encouraging undue risk-taking. Targets are set against financial and non-financial strategic objectives. The targets act to incentivise growth, achieve strategy and corporate objectives in line with expectations of shareholders. The minimum value of incentive is nil if targets are not met. The long-term incentive plan (LTI) is designed to align the interests of executives and senior management with the interests of shareholders by providing an opportunity for the participants to receive an equity interest in McGrath, which is also set at a maximum of 40% of fixed annual remuneration. A summary of McGrath’s remuneration mix including fixed annual remuneration, short-term incentive and long-term incentive is set out in figure 1.
11
For
per
sona
l use
onl
y

McGrath Limited and Controlled Entities
McGrath Limited and Controlled Entities
Figure 1: Remuneration framework
COMPONENT PERFORMANCE MEASURE WEIGHTING STRATEGIC OBJECTIVE/
PERFORMANCE LINK
FIXED ANNUAL REMUNERATION (FAR) Salary and other non-cash benefits +
FAR consists of base salary and superannuation and non-monetary benefits. Remuneration is structured to ensure executives are accountable for driving group strategy and corporate objectives in line with expectations of shareholders. Executives are targeted to achieve specific outcomes in these areas as part of their annual salary. STI’s and LTI’s are used to incentivise executives to achieve targets beyond fixed annual remuneration expectations.
Remuneration is set to ensure the attraction and retention of industry leading talent. Consideration is given to background and skillsets, seniority of role, level of responsibility, industry benchmarks, core values and cultural alignment.
SHORT-TERM INCENTIVES (STI) Percentage of fixed annual remuneration +
� Group Financial Measure (GFM) Net Profit After Tax (NPAT). Additional specific financial objectives may also apply to certain executives.
� Divisional Financial Measures (DM) Divisional Earnings Before Interest, Tax, Depreciation and Amortisation (EBITDA) Contribution which is EBITDA excluding corporate costs.
� Non-financial Measures (NFM) Specified strategic objective targets
Maximum of 40% of total fixed remuneration, with potential for “stretch” performance up to 125% of target
GFM rewards performance at group level. NPAT was chosen to ensure alignment with Consolidated Entity and shareholder objectives. DM – rewards performance at a divisional level under the direct control of the specific executive. NFM recognises differing drivers of performance across different Business Units
LONG-TERM INCENTIVES (LTI) Performance rights +
� EBITDA Target Achievement of Consolidated Entity’s EBITDA target. Measured over a three-year performance period1. Weighted at 50% of LTI.
� Total Shareholder Return (TSR) Relative to a group of 12 selected comparative entities listed on the ASX. Measured over a three-year performance period. Weighted at 50% of LTI.
Maximum of 40% of total fixed remuneration
EBITDA was chosen because it is the appropriate measure of group operating performance growth. TSR is chosen because it provides a relative, external market performance measure against McGrath’s comparable peers.
= TOTAL REMUNERATION The remuneration mix is designed to reflect the different components of the McGrath business and is structured to reward executives for performance at a Consolidated Entity level and, for divisional executives, also at a divisional level, and to align executives and stakeholder interests through share ownership. Assessing performance
The Remuneration and Nomination Committee is responsible for assessing performance against KPI’s and determining the STI and LTI to be paid to Key Management Personnel. To assist in this assessment, the committee receives detailed reports on performance from management which are based on independently verifiable data such as financial measures, market share and data from independently run surveys.
1 The measurement period of the EBITDA target for the FY16 LTI was one year, being FY16.
12
For
per
sona
l use
onl
y

McGrath Limited and Controlled Entities
McGrath Limited and Controlled Entities
Target remuneration mix
Our executive remuneration framework for FY17 is shown in figure 2 below. The framework comprises fixed annual remuneration, an annual or short-term incentive and a long-term incentive. The graph shows each of the components as a percentage of total target remuneration on the basis that the performance conditions for the STI and LTI are fully satisfied.
The target remuneration mix for the CEO excludes the performance rights awarded upon commencement with McGrath and promotion from Joint-CEO to CEO.
Figure 2: Target remuneration mix for FY17
The actual remuneration mix achieved by KMP is shown in figure 10.
Elements of remuneration
(i) Fixed annual remuneration (FAR)
Executives may receive their FAR as cash, or salary sacrificed benefits. FAR is reviewed annually, or on promotion. It is benchmarked against data for comparable roles within companies in similar industries and with similar market capitalisation. The committee aims to position executives at or near the median, with flexibility to take into account capability, experience, value to the organisation and performance of the individual.
Superannuation is included in FAR for all executives.
(ii) Short-term incentives (STI)
Certain employees are entitled to participate in McGrath’s STI Plan. The amount of the award under the STI Plan to which each participant may become entitled (if any) will be determined by the Remuneration and Nomination Committee and the senior management team (as appropriate) based on achievement against set performance targets. Further detail is shown in Figure 4 below.
(iii) Long-term incentives (LTI)
The Board has discretion to make offers to employees of McGrath or its related bodies corporate that the Board determines to be eligible to receive a grant under the LTI Plan. Under the LTI Plan, performance rights are subject to vesting or performance conditions determined by the Board and specified in the offer document. Any performance rights, will either not be offered, lapse or be forfeited if the relevant vesting and performance conditions are not satisfied.
56%
22%
22%56%
CEO
58%
21%
21%58%
Other Senior Executives
LTI STI FAR
13
For
per
sona
l use
onl
y

McGrath Limited and Controlled Entities
McGrath Limited and Controlled Entities
2. Statutory performance indicators
We aim to align our executive remuneration to our strategic and business objectives and the creation of shareholder wealth. Figure 3 shows measures of the group’s financial performance over the last five years as required by the Corporations Act 2001. However, these are not necessarily consistent with the measures used in determining the variable amounts of remuneration to be awarded to KMPs, see figure 6. As a consequence, there may not always be a direct correlation between the statutory key performance measures and the variable remuneration awarded.
Figure 3: key performance indicators of the group over the last five years 2017 2016 2015 2014 2013 Profit for the year attributable to owners of McGrath Limited ($’000)
4,871 8,358 6,727 8,993 4,390
Pro forma EBITDA1 ($’000) 15,254 26,244 27,160 21,288 10,019
Pro forma NPAT1 ($’000) 4,550 14,594 15,662 12,027 4,192
Basic earnings per share (cents) 3.58 8.58 14.84 20.58 10.04
Dividend payments ($’000) 6,142 11,000 6,428 1,539 1,710
Dividend payout ratio (%)2 126% 132% 96% 17% 39%
Closing share price ($ as at 30 June) 0.56 0.92 n/a n/a n/a
1 Pro forma EBITDA and pro forma NPAT are non-IFRS (non-statutory) measures and have not been subject to audit or review. 2 The dividend pay-out ratio is calculated based on dividends paid and statutory net profit after tax for the year.
3. Annual incentive overview
Figure 4: Structure of the short-term incentive plan
Feature Description Maximum opportunity
The CEO and certain members of the senior management team will be entitled to an STI award up to a maximum percentage of their FAR (the maximum on track earning potential is typically 30% but up to 40% of total FAR, with the potential for stretch performance of up to 125% on the on-track amount).
Performance period
Financial year
Performance metrics
The STI metrics align with our strategic priorities of market competitiveness, operational excellence, shareholder value and fostering talented and engaged people. Category Measure Reason for selection
Financial
Group Financial Measure: NPAT. 50% weighting.
Rewards performance at group level. NPAT was chosen to ensure alignment with Consolidated Entity and shareholder objectives.
Divisional Measure: EBITDA Contribution, other specific financial measures. Typically, 20 to 25% weighting.
Encourages and rewards performance at a divisional level or specific financial measure that is under direct control of the executive or manager.
Non-financial measures – specific strategic objective targets
Typically, 25 to 30% weighting but may be up to 50% for executives not responsible for revenue generating business units.
Recognises and rewards leadership behavior, internal culture, greater customer satisfaction and service development consistent with shareholder objectives.
Delivery of STI Each year performance will be measured for the twelve-month period ended 30 June. Participants will need to be employed after the lodgement of the Consolidated Entity’s accounts when the payment falls due to be eligible for an STI award, except in good leaver cases including retirement or bona fide redundancy, where some or all of the payment may be made at the discretion of the Board and senior management team (as appropriate).
Board discretion The Board has discretion to adjust remuneration outcomes up or down to prevent any inappropriate reward outcomes, including deferral of part of the STI award.
14
For
per
sona
l use
onl
y

McGrath Limited and Controlled Entities
McGrath Limited and Controlled Entities
Weighting of performance conditions and outcomes
The table below sets out the performance conditions for the FY17 short-term incentive, the extent to which they were achieved and the weighting between these measures for KMP.
Figure 5: Weighting of performance conditions and outcomes
Weighting of financial measures Weighting of non-financial measures
Name Consolidated Entity NPAT
Divisional EBITDA contribution
Other specific objectives
Strategic objectives
Other agreed objectives
C. Judson 50% 25% 10% 15% K. Stathopoulos 50% 20% 15% 15%
P. Hauenschild 50% 25% 15% 10%
Threshold not met Threshold met or exceeded Target met or exceeded Stretch target achieved
G. Lucas, M. Lahood and G. Vouris resigned during the year and forfeited their FY17 short-term incentive opportunity. C. Mourd joined the Company on 13 June 2017 and was not eligible for an FY17 STI.
FY17 short-term incentive outcome
The table below sets out specific information relating to the actual short-term incentives awarded for FY17.
Figure 6: Performance based remuneration award
Name Total STI Opportunity1
Awarded1
Awarded Forfeited
$ $ % %
C. Judson 260,000 72,800 28 72
K. Stathopoulos2 180,000 100,000 56 44
P. Hauenschild 78,213 14,900 19 81 1 Amounts include superannuation. 2 STI agreement for FY17 included a payment floor of $100,000.
15
For
per
sona
l use
onl
y

McGrath Limited and Controlled Entities
McGrath Limited and Controlled Entities
4. Long-term incentive overview
Figure 7: Structure of the long-term incentive plan
1 The measurement period of the EBITDA target for the FY16 LTI was one year, being FY16. Figure 8: Comparator group
Company ASX code Sector Industry group HFA Holdings Ltd HFA Financials Diversified Financials Silver Chef Ltd SIV Industrials Capital Goods iSelect Limited ISU Consumer Discretionary Consumer Services Wellcom Group Ltd WLL Industrials Commercial & Professional Services CVC Limited CVC Financials Diversified Financials Money3 Corporation Limited MNY Financials Diversified Financials GR Engineering Services Limited GNG Industrials Capital Goods Shine Corporate Ltd SHJ Consumer Discretionary Consumer Services Collection House Limited CLH Industrials Commercial & Professional Services Pacific Current Group Ltd PAC Financials Diversified Financials Mortgage Choice Limited MOC Financials Banks Villa World Limited VLW Financials Real Estate
Feature Description Maximum opportunity
The CEO and certain members of the senior management team will be entitled to be awarded performance rights to a value up to a maximum percentage of their FAR (the maximum is typically 30% but will not exceed 40% of total FAR).
Performance period
Three years
Performance metrics
The LTI metrics align with our strategic objectives and the creation of shareholder value. Category Weighting Conditions and vesting
EBITDA
50% The board, at its discretion, sets the EBITDA target for the financial year of the grant, with compound targets for the two following years. Performance rights will vest in three tranches depending upon the EBITDA performance of the Consolidated Entity at the end of each financial year1.
Total shareholder return (TSR)
50% Performance of the Company is measured against the performance of twelve comparator entities chosen based on similarity of industry structure, operating model and market capitalisation. (see figure 8). Performance rights will vest in three tranches depending upon the TSR of the Company over one, two and three years respectively. The following vesting schedule applies to the TSR performance hurdle:
Percentile ranking Percentage of awards vesting
Below 50th percentile Nil Equal to the 50th percentile 50% Between the 50th and the 85th percentile
50-100% on a straight-line basis
Above the 85th percentile 100%
Delivery of LTI Each year performance will be measured for the twelve-month period ended 30 June. If the performance hurdle for the period is met in relation to the specific hurdle, one third of the performance rights will vest. Following assessment, any performance rights that do not vest will lapse. Any shares that vest during the performance period are subject to forfeiture in the event the KMP does not remain employed by the Consolidated Entity for the full period over which the performance right grant is measured.
16
For
per
sona
l use
onl
y

McGrath Limited and Controlled Entities
McGrath Limited and Controlled Entities
LTI awarded during the year
The long-term incentive is issued as performance rights granted under a long-term incentive plan each year.
Performance rights were allocated to continuing KMP under the FY16 LTI plan in May 2017. The performance hurdle for the EBITDA component of the LTI was subject to a single performance period ending 30 June 2016. As the EBITDA performance hurdle was not satisfied, this portion of the FY16 grant was not allocated. In addition, the first tranche of performance rights that were subject to the FY16 TSR hurdle were also not allocated as the performance hurdle was not satisfied. The remaining performance rights, tranche two and tranche three subject to TSR hurdles, were issued at $2.10, the initial public offer share price.
The allocation of performance rights in accordance the FY17 LTI plan was also made in May 2017 and are subject to a three-year performance period as set out in figure 7. The performance rights were issued at $1.17, the share price at 30 September 2016.
Mr. Judson was also allocated performance rights in accordance with his contract of employment from his appointment and promotion to Chief Executive Officer. The performance rights vest in three tranches and are subject to a three-year continuity of service condition only. Performance rights with a total value of $250,000 were issued at $1.03, the share price at 14 July 2016 upon Mr. Judson’s appointment. Performance rights with a total value of $500,000 were issued at $1.175, the share price at 25 August 2016 when Mr. Judson was promoted to CEO.
Figure 9: LTI awarded during the year
Performance Rights Held at 1 July
2016 Granted Fair value at
grant date1 Lapsed Vested Held at 30 June
2017
EBITDA TSR EBITDA TSR EBITDA TSR EBITDA TSR EBITDA TSR EBITDA TSR
Number Number Number Number $ $ Number Number Number Number Number Number.
J. McGrath1 IPO Grant - - - 27,776 - - - - - - - 27,776
C. Judson 2017 Grant - - 111,045 111,045 - 5,922 (37,015) (37,015) - - 74,030 74,030
Sign on Grant3
- - 242,718 - 138,350 - - - - - 242,718 -
Promotion Grant3
- - 425,532 - 242,553 - - - - - 425,532 -
K. Stathopoulos IPO Grant - - - 11,904 - - - - - - - 11,904
2017 Grant - - 76,923 76,923 - 4,103 (25,641) (25,641) - - 51,282 51,282
P. Hauenschild IPO Grant - - - 15,873 - - - - - - - 15,873
2017 Grant - - 33,424 33,424 - 1,783 (11,141) (11,141) - - 22,283 22,283
1 The performance rights granted to Mr. McGrath do not create any entitlements to receive any shares in McGrath Limited. They are to be settled in cash in the event the rights vest. 2 For accounting purposes, the fair value at grant is shown above, in accordance with AASB 2: Share-Based Payment. The rights subject to market conditions (TSR hurdle) have been independently valued using the Monte Carlo simulation using the Black-Scholes framework. The rights subject to non-market conditions (EBITDA hurdle) have been valued using the Black-Scholes option pricing model. 3Mr Judson’s performance rights are not subject to EBITDA hurdles. They are awarded and will vest on the basis of a service condition as per his contract of employment.
17
For
per
sona
l use
onl
y

McGrath Limited and Controlled Entities
McGrath Limited and Controlled Entities
Relative proportions of fixed vs variable remuneration expense
Figure 10 reflects the relative proportions of FAR and STI of remuneration received based on the actual performance based amount awarded. Where the performance conditions for the STI were not met 100% of the remuneration will be FAR. The proportions are based on the amounts disclosed as statutory remuneration expense in figure 11.
Figure 10: Relative proportion of fixed vs variable remuneration expense
2017 2016
Fixed annual
remuneration STI/LTI Fixed annual remuneration STI/LTI
$ % $ % $ % $ %
Chief Executive Officer
C. Judson 654,793 77 190,543 23 - - - -
Executive Director
J. McGrath 529,902 100 - - 328,209 100 - 0
Other Key Management Personnel
K. Stathopoulos1 459,310 82 101,365 18 - - - -
P. Hauenschild 264,270 94 15,493 6 249,466 83 50,000 17
C. Mourd 23,329 100 - 0 - - - -
G. Lucas 115,528 100 - 0 596,332 100 - 0
M. Lahood 400,533 100 - 0 679,307 100 - 0
G. Vouris 330,411 100 - 0 349,282 87 50,000 13 1 K. Stathopoulos was internally promoted to Head of Sales and became classified as a KMP during FY17.
5. Remuneration expenses for executive KMP
The following table shows details of the remuneration expense recognised for the group’s executive key management personnel for the current and previous financial year measured in accordance with the requirements of the accounting standards.
Figure 11: Executive remuneration.
Fixed annual remuneration Variable remuneration
Short-term Long-term
Short-term Long-term
Name Year Salary
Non-monetary benefits1 Other2
Annual and long ser-
vice leave3
Post-employme-nt benefits4 STI LTI Total
Chief Executive Officer
C. Judson 2017 570,590 - 9,153 55,434 19,616 72,800 117,743 845,336 2016 - - - - - - - -
Executive Director
J. McGrath 2017 453,328 - 9,153 47,831 19,590 - - 529,902 2016 230,194 - 11,399 68,075 18,541 - - 328,209
18
For
per
sona
l use
onl
y

McGrath Limited and Controlled Entities
McGrath Limited and Controlled Entities
5. Remuneration expenses for executive KMP (continued)
Figure 11: Executive remuneration (continued)
Fixed annual remuneration Variable remuneration
Short-term Long-term
Short-term
Long-term
Name Year Salary
Non-monetary benefits1 Other2
Annual and long service
leave3
Post-employment
benefits4 STI LTI Total
Other Key Management Personnel
K. Stathopoulos5 2017 385,704 - 14,865 39,151 19,590 100,000 1,365 560,675
2016 286,400 - 6,712 32,915 18,541 - - 344,568
P. Hauenschild 2017 212,350 - 9,763 22,567 19,590 14,900 593 279,763
2016 199,368 - 7,957 23,600 18,541 50,000 - 299,466
C. Mourd 2017 19,498 - 763 2,099 969 - - 23,329
2016 - - - - - - - -
G. Lucas 2017 105,509 - 1,526 6,067 2,426 - - 115,528
2016 480,028 30,498 9,959 57,307 18,541 - - 596,333
M. Lahood 2017 358,904 - 4,577 27,270 9,782 - - 400,533
2016 579,759 - 16,207 64,800 18,541 - - 679,307
G. Vouris 2017 285,211 - 6,865 19,100 19,236 - - 330,412
2016 260,685 30,498 7,950 29,833 20,316 50,000 - 399,282
Total KMPs 2017 2,391,094 - 60,184 219,519 110,799 187,700 119,701 3,085,478
2016 2,036,434 60,996 59,263 276,530 113,021 100,000 - 2,647,165 1 Motor vehicle benefits. 2 Includes implied benefit of interest free loans, shares granted at IPO, commissions and the cost of directors and officer insurance. 3 Reflects the net cost of annual and long service leave accrued in the period. 4 Reflects the cost of superannuation. 5 K. Stathopoulos was internally promoted to Head of Sales and became classified as a KMP on 10 October 2016. The amounts shown in this table include the remuneration as an employee of the company throughout this period.
19
For
per
sona
l use
onl
y
McGrath Limited and Controlled Entities
McGrath Limited and Controlled Entities
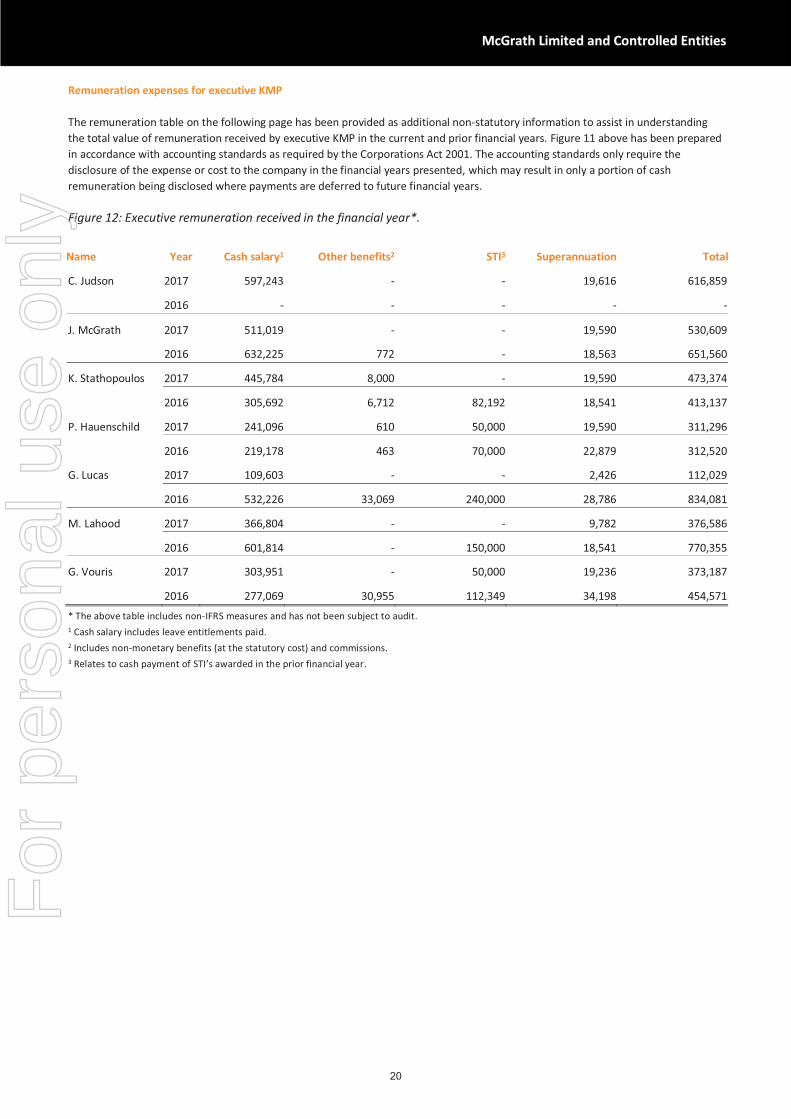
Remuneration expenses for executive KMP
The remuneration table on the following page has been provided as additional non-statutory information to assist in understanding the total value of remuneration received by executive KMP in the current and prior financial years. Figure 11 above has been prepared in accordance with accounting standards as required by the Corporations Act 2001. The accounting standards only require the disclosure of the expense or cost to the company in the financial years presented, which may result in only a portion of cash remuneration being disclosed where payments are deferred to future financial years.
Figure 12: Executive remuneration received in the financial year*.
Name Year Cash salary1 Other benefits2 STI3 Superannuation Total
C. Judson 2017 597,243 - - 19,616 616,859
2016 - - - - -
J. McGrath 2017 511,019 - - 19,590 530,609
2016 632,225 772 - 18,563 651,560
K. Stathopoulos 2017 445,784 8,000 - 19,590 473,374
2016 305,692 6,712 82,192 18,541 413,137
P. Hauenschild 2017 241,096 610 50,000 19,590 311,296
2016 219,178 463 70,000 22,879 312,520
G. Lucas 2017 109,603 - - 2,426 112,029
2016 532,226 33,069 240,000 28,786 834,081
M. Lahood 2017 366,804 - - 9,782 376,586
2016 601,814 - 150,000 18,541 770,355
G. Vouris 2017 303,951 - 50,000 19,236 373,187
2016 277,069 30,955 112,349 34,198 454,571
* The above table includes non-IFRS measures and has not been subject to audit. 1 Cash salary includes leave entitlements paid. 2 Includes non-monetary benefits (at the statutory cost) and commissions. 3 Relates to cash payment of STI’s awarded in the prior financial year.
20
For
per
sona
l use
onl
y

McGrath Limited and Controlled Entities
McGrath Limited and Controlled Entities
Contractual arrangements with executive KMP
Component CEO description
Fixed annual remuneration $660,049 Contract duration Ongoing contract Notice by the individual/company 12 months
Termination of employment (without cause)
STI Participants will need to be employed and not under notice of resignation or termination until at least 30 June of the relevant year to be eligible for an STI award.
LTI Participants will need to be employed until the end of the three-year performance period to be eligible to receive the performance rights that have vested during the performance period.
Termination of employment (with cause) or by the individual
STI For good leaver cases including retirement or bona fide redundancy, where some or all of the payment may be made at the discretion of the Board and senior management team (where appropriate).
LTI If the participant ceases employment for cause, resigns, or their employment is terminated by mutual agreement with McGrath, unless the Board determines otherwise, the performance rights will automatically lapse.
Component Other executive KMP
Fixed annual remuneration Range between $260,711 to $520,000
Contract duration Ongoing contract
Notice by the individual/company Up to 12 months Termination of employment (without cause)
STI Participants will need to be employed and not under notice of resignation or termination until at least 30 June of the relevant year to be eligible for an STI award.
LTI Participants will need to be employed until the end of the three-year performance period to be eligible to receive the performance rights that have vested during the performance period.
Termination of employment (with cause) or by the individual
STI For good leaver cases including retirement or bona fide redundancy, some or all of the payment may be made at the discretion of the Board and senior management team (where appropriate).
LTI If the participant ceases employment for cause, resigns, or their employment is terminated by mutual agreement with McGrath, unless the Board determines otherwise, the performance rights will automatically lapse.
21
For
per
sona
l use
onl
y

McGrath Limited and Controlled Entities
McGrath Limited and Controlled Entities
6. Non-executive director arrangements
Total amount paid to all Non-executive directors for their services must not exceed in aggregate in any financial year the amount fixed by McGrath’s general meeting. This amount has been fixed by McGrath at $600,000, not including the value of shares granted at IPO. The fees shown in the table at right (inclusive of superannuation) took effect from 1 June 2017. All non-executive directors enter into a service agreement with the company in the form of a letter of appointment. The letter summarises the board policies and terms, including remuneration, relevant to the office of director. The fees paid to the non-executive directors in relation to the relevant financial year are set out below.
Figure 13: Non-executive director remuneration
Name Year Fees Other* Superannuation Total C. O’Connor 2017 153,085 9,153 14,543 176,781
2016 102,742 106,223 9,760 218,725
E. Crouch 2017 96,972 7,628 9,212 113,812
2016 - - - -
N. Dews 2017 67,465 5,339 6,409 79,213
2016 - - - -
C. Rogers 2017 56,490 5,339 5,366 67,195
2016 - - - -
D. Mackay1 2017 26,635 1,526 2,531 30,692
2016 149,895 106,494 14,240 270,629
D. Petre2 2017 45,370 3,814 3,615 52,799
2016 82,252 104,600 7,814 194,666
S. Hassen3 2017 - - - -
2016 - 2,751 - 2,751
Total non-executive director remuneration
2017 446,017 32,799 41,676 520,492
2016 334,889 320,068 31,814 686,771
*Includes value of shares granted at IPO and the cost of directors and officer insurance. 1D. Mackay retired from the board on 25 August 2016. 2D. Petre retired from the board on 23 November 2016. 3S. Hassen retired from the board on 11 November 2015.
2017 Board fees Chair $150,000 Other non-executive directors
$100,000
Committee fees Committee Chair $15,000 Committee Member $5,000
22
For
per
sona
l use
onl
y
McGrath Limited and Controlled Entities
McGrath Limited and Controlled Entities
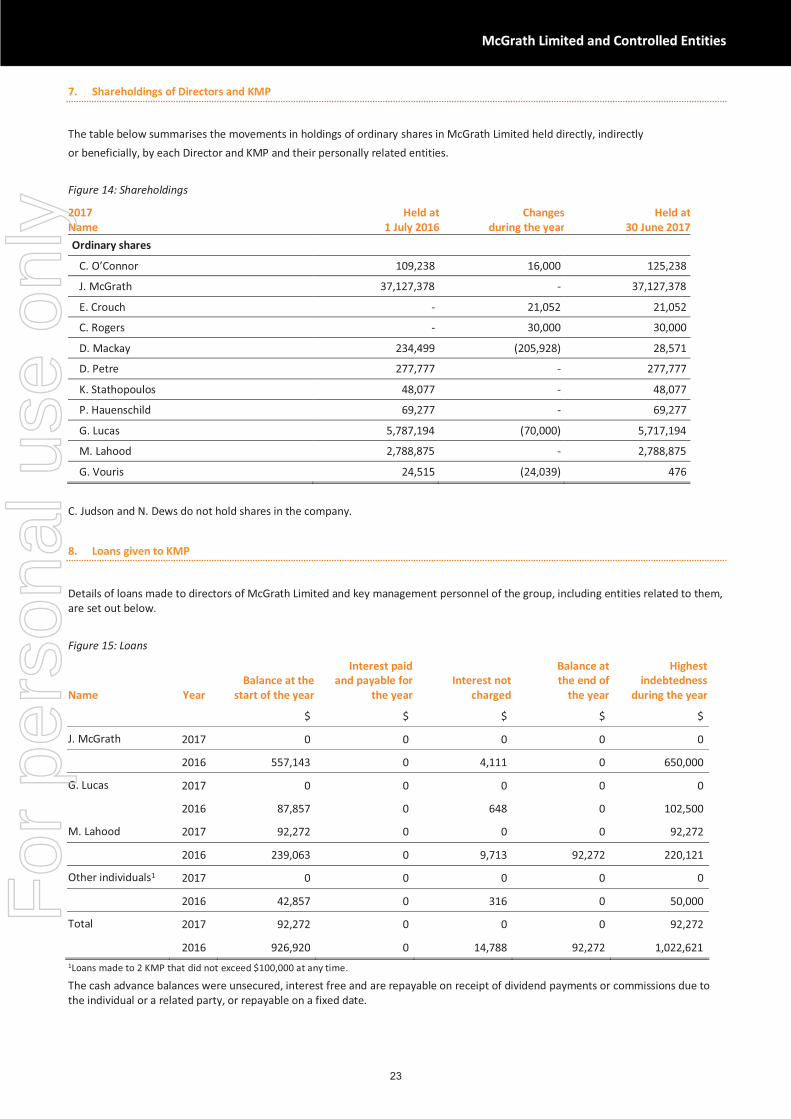
7. Shareholdings of Directors and KMP
The table below summarises the movements in holdings of ordinary shares in McGrath Limited held directly, indirectly or beneficially, by each Director and KMP and their personally related entities. Figure 14: Shareholdings
C. Judson and N. Dews do not hold shares in the company.
8. Loans given to KMP
Details of loans made to directors of McGrath Limited and key management personnel of the group, including entities related to them, are set out below. Figure 15: Loans
Name Year Balance at the
start of the year
Interest paid and payable for
the year Interest not
charged
Balance at the end of
the year
Highest indebtedness
during the year
$ $ $ $ $
J. McGrath 2017 0 0 0 0 0
2016 557,143 0 4,111 0 650,000
G. Lucas 2017 0 0 0 0 0
2016 87,857 0 648 0 102,500
M. Lahood 2017 92,272 0 0 0 92,272
2016 239,063 0 9,713 92,272 220,121
Other individuals1 2017 0 0 0 0 0
2016 42,857 0 316 0 50,000
Total 2017 92,272 0 0 0 92,272
2016 926,920 0 14,788 92,272 1,022,621 1Loans made to 2 KMP that did not exceed $100,000 at any time.
The cash advance balances were unsecured, interest free and are repayable on receipt of dividend payments or commissions due to the individual or a related party, or repayable on a fixed date.
2017 Name
Held at1 July 2016
Changes during the year
Held at 30 June 2017
Ordinary shares
C. O’Connor 109,238 16,000 125,238
J. McGrath 37,127,378 - 37,127,378
E. Crouch - 21,052 21,052
C. Rogers - 30,000 30,000
D. Mackay 234,499 (205,928) 28,571
D. Petre 277,777 - 277,777
K. Stathopoulos 48,077 - 48,077
P. Hauenschild 69,277 - 69,277
G. Lucas 5,787,194 (70,000) 5,717,194
M. Lahood 2,788,875 - 2,788,875
G. Vouris 24,515 (24,039) 476
23
For
per
sona
l use
onl
y

McGrath Limited and Controlled Entities
McGrath Limited and Controlled Entities
Directors' Report for the Year Ended 30 June 2017 The Directors present their report, together with the financial statements of McGrath Limited (the Company or McGrath) and the subsidiaries that it controlled at the end of the period and from time to time throughout the period (together referred to as the Consolidated Entity), for the year ended 30 June 2017 and the auditor’s report thereon. The financial statements have been reviewed and approved by the directors on the recommendation of the McGrath Audit and Risk Committee. The Consolidated Entity profit after providing for income tax amounted to $4,871,157 (2016: $8,411,859).
Principal activities and review of operations
The principal activities of the Consolidated Entity during the financial year were the facilitation of real estate sales and property management services. Revenue is generated from franchise and company owned operations. Information on the operations and financial position of the Group and its business strategies and prospects is set out in the Operating and Financial Review on pages 1-4 of this Annual Financial Statement.
Directors
The following persons were Directors of McGrath Limited during the year ended 30 June 2017: Ms. Cass O’Connor Chair and Non-executive Director. � Appointed Chair 25 August 2016. Mr. John McGrath Executive Director.
Ms. Elizabeth Crouch Independent Non-executive Director. � Appointed 25 August 2016. Mr. Nigel Dews Independent Non-executive Director. � Appointed 23 November 2016. Ms. Cath Rogers Independent Non-executive Director. � Appointed 23 November 2016. Mr. David Mackay Chairman and Independent Non-executive Director. � Retired 25 August 2016. Mr. Daniel Petre Independent Non-executive Director. � Retired 23 November 2016.
Company Secretary
Morgan Sloper � Appointed 23 August 2016. Morgan has worked for listed companies both in Australia and internationally at the senior executive level, and joined McGrath Limited in August 2016, bringing a wealth of professional and operational experience. He is a highly-respected lawyer with in-house and private practice experience, delivering commercial insight, and operational and technical expertise, in negotiations and contracting, M&A, intellectual property, human capital, and risk and governance. Morgan holds a Masters of Law and Management from UNSW. Dividends
Dividends totalling $6,142,000 were declared and paid during the year. (2016: $11,000,000). Final dividends for the year ending 30 June 2017 were declared on 24 August 2017 with a record date of 21 September 2017 and a payment date of 5 October 2017, totalling $1,392,852.
Significant changes in state of affairs
There were no significant changes in the state of affairs of the Consolidated Entity.
24
For
per
sona
l use
onl
y

McGrath Limited and Controlled Entities
McGrath Limited and Controlled Entities
Subsequent events
On 24 August, the Company announced that it intends to establish an on-market share buy-back, which is expected to be in effect on or after 8 September 2017. The number of shares bought back and timing of any purchases will depend on the Company’s share price and other market factors. The buy-back will be conducted within the 10/12 limit permitted in accordance with section 257B(4) of the Corporations Act 2001 (Cth) and ASX Listing Rules. As such, no shareholder approval is required.
Other than the above there has not arisen, in the interval between the end of the financial year and the date of this report, any item, transaction or event which significantly affected or may significantly affect the operations of the Consolidated Entity, the results of those operations, or the state of affairs of the Consolidated Entity in the future financial years.
Likely developments
The Consolidated Entity has a clear organic growth strategy of expanding its market share via agent attraction and franchise office roll-outs, as well as entering new operating territories.
Further information about likely developments in the operations of the Consolidated Entity and the expected results of those operations in future financial years have not been included in this report as the Directors’ believe inclusion of such information is likely to result in unreasonable speculation concerning the Consolidated Entity.
Environmental issues
The Consolidated Entity's operations are not regulated by any significant environmental regulation under a law of the Commonwealth or of a State or Territory. The Consolidated Entity is not subject to the reporting requirements of the National Green House and Energy Act 2007.
Indemnification and insurance of officers
Indemnification
The Company has agreed to indemnify the directors and officers of the Company against all liabilities to another person (other than the Company or a related body corporate) that may arise from their position as directors or officers of the company and its controlled entities, except where the liability arises out of conduct involving a lack of good faith.
Insurance
During the financial year, the Consolidated Entity has paid an insurance premium of $88,500 in respect of Directors' and Officers' liability, for current and former Directors and senior executives of the Company and directors and senior executives of its controlled entities.
The insurance premium relates to:
� costs and expenses incurred by the relevant Directors’ or Officers in defending proceedings, whether civil or criminal and whatever their outcome; and
� other liabilities that may arise from their position, with the exception of conduct involving a wilful breach of duty or improper use of information or position to gain a personal advantage.
The insurance policy outlined above does not contain details of any premium paid in respect of individual officers of the Consolidated Entity. Directors’ interests
The relevant interest of each director in the shares issued by the Company at the date of this report is as follows:
Director Ordinary Shares Cass O’Connor 125,238 John McGrath 37,127,378 Elizabeth Crouch 21,052 Cath Rogers 30,000 Nigel Dews does not own shares in the company. No options over issued shares or interests in the Company or a controlled entity were granted to directors or key management personnel during or since the end of the financial year. Remuneration report – audited
Information on McGrath’s remuneration framework and the outcomes for FY17 for the McGrath Limited Board and key management personnel, is included in the remuneration report on pages 8-20 of this Annual Financial Report. Corporate governance
Consolidated Entity governance matters are discussed on page 5 of this Annual Financial Report and are also available on the Consolidated Entity’s website: https://www.mcgrath.com.au/about/investorCentre
25
For
per
sona
l use
onl
y

McGrath Limited and Controlled Entities
McGrath Limited and Controlled Entities
Non-audit services
McGrath may decide to employ the auditor on assignment additional to their statutory audit duties where the auditor’s expertise and experience with the Company are relevant. Details of the amounts paid or payable to the auditor (KPMG) for audit and non-audit services provided during the year ended 30 June 2017 are set out in note E7 to the financial statements. The Board has considered its position and, in accordance with the advice received from the Audit and Risk Committee, is satisfied that the provision of non-audit services is compatible with the general standard of independence for auditors imposed by the Corporations Act 2001. The Directors are satisfied that the provision of non-audit services by the auditor, did not compromise the auditor independence requirements of the Corporations Act 2001 for the following reasons: � all non-audit services have been reviewed by the Audit
and Risk Committee to ensure they do not affect the impartiality and objectivity of the auditor; and
� none of the services undermines the general principles relating to auditor independence as set out in Accounting Professional & Ethical Standards 110 Code of Ethics for Professional Accountants, including reviewing or auditing the auditor’s own work, acting in a management or a decision-making capacity for the Company, acting as advocate for the Company or jointly sharing economic risk and rewards.
A copy of the auditor’s independence declaration as required under section 307C of the Corporations Act 2001 is on page 24.
Rounding of amounts
In accordance with ASIC Corporations (Rounding in Financial/ Directors’ Reports) Instrument 2016/191, amounts in the Financial Statements and the Directors’ report have been rounded to the nearest thousand dollars unless otherwise indicated.
Signed in accordance with a resolution of the Directors Cass O’Connor Chair - 24 August 2017
26
For
per
sona
l use
onl
y

Lead Auditor’s Independence Declaration under
Section 307C of the Corporations Act 2001
To the Directors of McGrath Limited
I declare that, to the best of my knowledge and belief, in relation to the audit of McGrath Limited for the financial year ended 30 June 2017 there have been:
i. no contraventions of the auditor independence requirements as set out in theCorporations Act 2001 in relation to the audit; and
ii. no contraventions of any applicable code of professional conduct in relation to the audit.
KPMG
Stuart Marshall Partner
Sydney 24 August 2017
27
For
per
sona
l use
onl
y

McGrath Limited and Controlled Entities A.C.N. 608 153 779 Financial Statements For The Year Ended 30thJune 2017
Financial statements Consolidated statement of profit or loss and other comprehensive income
Consolidated statement of financial position
Consolidated statement of changes in equity Consolidated statement of cash flows
28
For
per
sona
l use
onl
y

Financial statements
Consolidated statement of profit or loss and other comprehensive income for the year ended 30 June 2017
Notes 2017 2016 $'000 $'000
Revenues and other income A1 129,363 120,957Cost of sales (49,943) (46,230)Employee benefits expense A4 (36,913) (31,045)Directors' fees (449) (593)Professional fees (2,347) (7,764)Doubtful debts (138) (116)Occupancy (7,824) (5,836)Communications (2,582) (2,373)Advertising and promotions (2,528) (2,146)Other expenses (11,064) (8,411)Earnings before interest, tax, depreciation and amortisation (EBITDA)
15,575 16,443
Depreciation and amortisation expenses (7,574) (3,635)Impairment of software asset (2,180) - Finance income 98 98Finance costs (61) (300)Net finance costs 37 (202) Profit before income tax expense 5,858 12,606 Income tax expense E1 (987) (4,195) Profit after income tax expense 4,871 8,411
Other comprehensive income - -Total profit and other comprehensive income for the year 4,871 8,411)
Profit after income tax expense attributable to: Owners of the Company 4,871 8,358Non-controlling interest - 53Profit after income tax expense 4,871 8,411
Basic earnings per share (cents) A5 3.58 8.58Diluted earnings per share (cents) A5 3.34 8.19
The consolidated statement of profit or loss and other comprehensive income is to be read in conjunction with the accompanying notes.
29
For
per
sona
l use
onl
y

Consolidated statement of financial position as at 30 June 2017
Notes 2017 2016 $'000 $'000 CURRENT ASSETS Cash and cash equivalents A3 7,999 12,493Trade and other receivables B1 28,298 28,305Other E2 2,782 2,238Current tax assets 102 1,198TOTAL CURRENT ASSETS 39,181 44,234 NON CURRENT ASSETS Trade and other receivables B1 4,551 3,156Property, plant and equipment B2 9,035 7,711Intangible assets B3 74,806 78,915TOTAL NON CURRENT ASSETS 88,392 89,782 TOTAL ASSETS 127,573 134,016 CURRENT LIABILITIES Trade and other payables B4 14,118 16,089Loans and borrowings B5 6,125 6,099Provisions E3 1,554 1,928TOTAL CURRENT LIABILITIES 21,797 24,116 NON CURRENT LIABILITIES Trade and other payables B4 1,523 1,104Loans and borrowings B5 - 6,472Provisions E3 1,402 1,276Deferred tax liabilities E1 4,160 4,746TOTAL NON CURRENT LIABILITIES 7,085 13,598 TOTAL LIABILITIES 28,882 37,714 NET ASSETS 98,691 96,302
EQUITY Contributed equity E4 95,194 92,132Share -based payment reserve E4 672 74Retained profits/(accumulated losses) 2,825 4,096Total Equity attributable to equity holders
98,691 96,302
TOTAL EQUITY 98,691 96,302
The consolidated statement of financial position is to be read in conjunction with the accompanying notes.
30
For
per
sona
l use
onl
y

Consolidated statement of changes in equity as at 30 June 2017
Notes Contributed equity
Retained profits/
(accumulated losses)
Share Based
Payment Reserve
Total attributable
to owners of the
Company
Non- controlling
interest
Total equity
$'000 $'000 $'000 $'000 $'000 $'000 Balance at 30 June 2016 92,132 4,096 74 96,302 - 96,302
Profit after income tax expense - 4,871 - 4,871 - 4,871 Other comprehensive income - - - - - - Total comprehensive income for the year - 4,871 - 4,871 - 4,871 Issue of Equity 3,062 - - 3,062 - 3,062 Share based payment transactions
- - 598 598 - 598
Dividends to equity holders C3 - (6,142) - (6,142) - (6,142) Distributions to non-controlling interests
- - - - - -
Transactions with owners, recorded directly in equity
3,062 (6,142) 598 (2,482) - (2,482)
Balance at 30 June 2017 95,194 2,825 672 98,691 - 98,691
Balance at 30 June 2015 6,333 7,971 - 14,304 - 14,304
Profit after income tax expense - 8,358 - 8,358 53 8,411 Other comprehensive income - - - - - - Total comprehensive income for the year - 8,358 - 8,358 53 8,411 Issue of equity 87,050 - - 87,050 - 87,050 Acquisition of non-controlling interests
1,233 (1,233) - - - -
Equity raising costs deducted from equity after tax
(2,484) - - (2,484) - (2,484)
Share based payment transactions - - 74 74 - 74 Dividends to equity holders C3 - (11,000) - (11,000) - (11,000) Distributions to non-controlling interests - - - - (53) (53) Transactions with owners, recorded directly in equity 85,799 (12,233) 74 73,640 (53) 73,587 Balance at 30 June 2016 92,132 4,096 74 96,302 - 96,302
The consolidated statement of changes in equity is to be read in conjunction with the accompanying notes.
31
For
per
sona
l use
onl
y

Consolidated statement of cash flows for the year ended 30 June 2017
Notes 2017 2016 $'000 $'000 CASH FLOWS FROM OPERATING ACTIVITIES Receipts from customers 140,873 124,459Payments to suppliers and employees (128,076) (111,855)Interest paid (61) (300)Interest received 98 98Income tax paid (478) (4,962)NET CASH INFLOW FROM OPERATING ACTIVITIES A3 12,356 7,440 CASH FLOWS FROM INVESTING ACTIVITIES Purchase of controlled entities, net of cash acquired B6 (185) (29,076)Payment of transaction costs related to acquisition - (1,702)Purchase of property, plant and equipment (3,726) (4,993)Purchase of intangibles (2,943) (3,091)Loans granted (827) (539)Loan repayments received 86 2,121NET CASH OUTFLOW FROM INVESTING ACTIVITIES (7,595) (37,280)
CASH FLOWS FROM FINANCING ACTIVITIES Proceeds from issue of share capital - 66,050Payment of transaction costs related to IPO - (5,057)Payment of capitalised transaction costs related to IPO - (3,528)Proceeds from borrowings - 9,000Repayment of borrowings (3,113) (15,366)Repayment of finance lease principal - (549)Dividends paid C3 (6,142) (11,000)Distribution paid - (53)NET CASH (OUTFLOW)/INFLOW FROM FINANCING ACTIVITIES (9,255) 39,497 Net increase/(decrease) in cash and cash equivalents (4,494) 9,657Cash and cash equivalents at the beginning of the financial year 12,493 2,836CASH AND CASH EQUIVALENTS AT THE END OF THE FINANCIAL YEAR A3 7,999 12,493
The consolidated statement of cash flows is to be read in conjunction with the accompanying notes.
32
For
per
sona
l use
onl
y

Contents of the notes to the consolidated financial statements
Notes to the financial statements 3 A. Financial performance and cash flows
A1 Revenues and other income
A2 Operating segments
A3 Cash and cash flow related information A4 Employee benefit expenses
A5 EPS
B. Financial position B1 Trade and other receivables
B2 Property, plant & equipment B3 Intangible assets 4 B4 Trade and other payables
B5 Interest bearing loans and borrowings B6 Business combinations 4
C. Risk, capital management and related parties C1 Financial risk management
C2 Capital management 5 C3 Dividends paid and proposed 5 C4 Key management personnel disclosure 5 C5 Related party transactions 5
D. Unrecognised items D1 Commitments for expenditure 5 D2 Contingent liabilities 5
D3 Events subsequent to reporting date 5
E. Other information E1 Taxation E2 Other assets 6 E3 Provisions 6 E4 Capital and reserves 6 E5 Subsidiaries and non-controlling interests 6 E6 Parent entity disclosures 6 E7 Auditor’s remuneration 6 E8 Deed of cross guarantee 6 - E9 General accounting policies
33
For
per
sona
l use
onl
y

Notes to the financial statements The consolidated financial statements of McGrath Limited (the Company) as at and for the year ended 30 June 2017 comprise the Company and its controlled entities, (together referred to as the Consolidated Entity).
An internal restructure took place in connection with the 7 December 2015 initial public offering (IPO) of McGrath Limited (ASX code: MEA). This resulted in a newly incorporated company, McGrath Holding Company Limited, becoming the ultimate parent company of the Consolidated Entity. This entity was subsequently renamed McGrath Limited. The Directors elected to account for the restructure as a capital re-organisation rather than a business combination. In the Directors’ judgement, the continuation of the existing accounting values is consistent with the accounting that would have occurred if the assets and liabilities had already been in a structure suitable to IPO and most appropriately reflects the substance of the internal restructure. As such, the consolidated financial statements of the new Consolidated Entity have been presented as a continuation of the pre-existing accounting values of assets and liabilities in the previous parent company’s financial statements, the previous parent company, then named McGrath Limited, was renamed McGrath Operations Limited in the restructure.
The Directors note that there is an alternate view that such a restructure undertaken for an IPO could be accounted for as a business combination that follows the legal structure of McGrath Holding Company Limited being the acquirer. If this view had been taken, the net assets of the Consolidated Entity would have been increased to fair value by $244.8 million, based on a market capitalisation at IPO of $260.7 million, with consequential impacts on the consolidated statement of profit or loss and other comprehensive income and consolidated statement of financial position.
The financial report represents the consolidated results, for the Consolidated Entity, for the period 1 July 2016 to 30 June 2017. The comparative information presented in the financial report represents the financial position of the Consolidated Entity as at 30 June 2016 and the Consolidated Entity’s performance for the year ended on that date.
McGrath Limited is a for-profit company limited by shares incorporated and domiciled in Australia.
The financial report is presented in Australian dollars which is the Company's functional currency.
The financial statements were approved by the Board of Directors on 24 August 2017.
The notes are set out in the following main sections:
A: Financial performance and cash flows
This section explains the drivers of the Consolidated Entity's performance, operating segment disclosures, taxation and also provides information necessary to assess the Consolidated Entity’s cash flows.
B: Financial position
This section provides a breakdown and further information about those balance sheet items that the Directors consider most relevant in assessing the financial position of the Consolidated Entity.
C: Risk, capital management and related parties
This section explains the Consolidated Entity's risk and capital management, including dividend payments and transactions with related parties, particularly Directors and executives.
D: Unrecognised items
Provides information about items that are not recognised in the financial statements but could potentially have a significant impact on the Consolidated Entity's financial position and performance.
E: Other information
Sets out information that the Directors do not consider significant in the context of the Consolidated Entity’s operations and covers statutory information that must be disclosed to satisfy the requirements of the Corporations Act 2001.
34
For
per
sona
l use
onl
y

A1 Revenues and other income 3
A2 Operating segments 3
A3 Cash and cash flow related information
A4 Employee benefit expenses 3
A5 EPS
A Financial performance and cash flows
This section explains the drivers of McGrath’s performance, operating segments, taxation and also provides information necessary to assess our cash flows.
35
For
per
sona
l use
onl
y

Notes to the Financial Statements for the year ended 30 June 2017
Financial performance and cash flows
A1 Revenues and other income
Notes 2017 2016$'000 $'000
Commission 89,514 83,826Fees 39,478 34,795Fair value adjustment to deferred consideration B6 371 2,336Total revenue and other income 129,363 120,957
Recognition and Measurement Revenue is recognised for the major business activities using the methods outlined below: � Sales commission and related income, including franchise fee income, derived from real estate sales is
recognised at the time of unconditional exchange of contracts between vendors and purchasers. � Property management fee income is recognised over the period to which the underlying rental payments for
managed properties relate. � Mortgage commissions are recognised upon loan settlement.� Interest income is recognised upon control of the right to receive the interest payment.� Dividends and distributions are recognised when declared.
A2 Operating segments
Description of segments The Consolidated Entity has identified reportable segments based on the internal reports that are regularly reviewed and used by the Chief Executive Officer (the chief operating decision maker – CODM) in order to assess segment performance and in determining the allocation of resources to the segment. These divisions offer different services and are managed separately. The following describes the operations of each segment:
Company owned sales
This represents the company owned sales offices for which McGrath earns sales commissions revenue. It includes property marketing fees paid by vendor clients of the company owned sales segment.
Company owned property management
This represents the company owned property management business for which McGrath earns property management fee revenue.
Franchise services
This includes franchise sales offices and franchise property management for which McGrath earns franchise fees.
Other
This represents non-reportable segments including mortgage broking, auction services, training and events and other network services.
Head office and corporate costs are not allocated to segments.
Inter-segment transactions are conducted on normal commercial terms and conditions. The majority of inter-segment transactions relate to levies charged by network services to other business units for marketing, training and IT.
The accounting policies of each operating segment are the same as those described for the Consolidated Entity.
36
For
per
sona
l use
onl
y

A2 Operating segments (continued)
The Consolidated Entity’s operations are from Australian sources and therefore no geographical segments are disclosed.
Assets and liabilities have not been reported on a segmented basis as the CODM is provided with consolidated information.
2017 Company owned Sales
Companyowned
propertymanagement
Franchise services
Total reportable segments
Other segments
Consolidatedtotal
$'000 $'000 $'000 $'000 $'000 $'000 External revenues 85,683 20,012 11,460 117,155 11,800 128,955Inter-segment revenues - - - - 5,541 5,541Segment Revenue 85,683 20,012 11,460 117,155 17,341 134,496
Unallocated revenue 408Eliminations (5,541)Consolidated Revenue 129,363
Segment profit before interest, tax, depreciation and amortisation 15,475 7,022 7,229 29,726 (589) 29,137Unallocated corporate costs (13,562)EBITDA 15,575Depreciation and amortisation (1,801) (3,038) (3) (4,842) (1,937) (6,779)Impairment of software asset - - - - (2,180) (2,180)Unallocated corporate depreciation and amortisation (795)Net finance costs 37Profit before income tax expense 5,858
2016 Company
owned Sales Company
ownedproperty
management
Franchise services
Total reportable segments
Other segments
Consolidated total
$'000 $'000 $'000 $'000 $'000 $'000 External revenues 79,075 16,157 12,052 107,284 11,155 118,439Inter-segment revenues - - - - 5,221 5,221Segment Revenue 79,075 16,157 12,052 107,284 16,376 123,660 Unallocated revenue 2,518Eliminations (5,221)Consolidated Revenue 120,957
Segment profit before interest, tax, depreciation and amortisation 18,837 4,646 7,764 31,247 723 31,970Unallocated corporate costs (15,527)EBITDA 16,443Depreciation and amortisation (1,021) (1,972) (5) (2,998) (254) (3,252)Unallocated corporate depreciation and amortisation (383)Net finance costs (202)Profit before income tax expense 12,606
37
For
per
sona
l use
onl
y

A3 Cash and Cash flow related information
2017 2016 $'000 $'000
Cash at bank 2,993 5,487 Short term deposits 5,006 7,006 Cash and cash equivalents 7,999 12,493
Recognition and Measurement Cash and cash equivalents in the consolidated statement of financial position comprise cash at bank and in hand and short term deposits with an original maturity of three months or less. For the purposes of the consolidated statement of cash flows, cash and cash equivalents consist of cash and cash equivalents as defined above, net of outstanding bank overdrafts.
Cash at bank earns interest at floating rates based on daily bank deposit rates. Short term deposits are made for varying periods of between one day and three months, depending on the immediate cash requirements of the Consolidated Entity and earn interest at the respective short term deposit rates.
Reconciliation of net cash flow from operations to profit from ordinary activities after income tax 2017 2016
$'000 $'000
Profit after income tax expense 4,871 8,411 Adjustments for: Depreciation and amortisation expense 9,754 3,635 Doubtful debts expense 138 116 Share-based payments 598 74 Fair value adjustment of deferred consideration (371) (2,336) IPO transaction costs recognised in financing activities - 5,057 Acquisition transaction costs recognised in investing activities - 1,702 Net cash inflow from ordinary activities before changes in assets and liabilities 14,990 16,659 (Decrease)/Increase in payables and other liabilities (1,551) 2,876 (Decrease) in other provisions (265) (3,767) (Increase)/Decrease in deferred tax items (587) 1,682 Increase in prepayments (45) (1,273) (Increase) in receivables (544) (8,908) (Increase) in inventory (226) (32) (Increase)/Decrease in other assets (513) 2,651 Decrease in current tax asset 1,097 - (Decrease) in current tax liabilities - (2,448) 12,356 7,440
38
For
per
sona
l use
onl
y

A4 Employee benefit expenses
Notes 2017 2016 $'000 $'000 Wages and salaries 32,190 27,255Leave provisions 2,340 1,769Contributions to defined contribution plans 2,383 2,021 36,913 31,045
Accounting for employee benefits Wages, salaries, annual leave and sick leave Recognition and Measurement: Short term employee benefits are expensed as the related service is provided. Liabilities for wages and salaries, including non-monetary benefits and annual leave expected to be settled within twelve months of the reporting date are recognised in respect of employees' services up to the reporting date. Liabilities for non-accumulating sick leave are recognised when the leave is taken. Liabilities for wages, salaries, annual leave and sick leave are measured at the amounts expected to be paid when the liabilities are settled. Liabilities for non-accumulating sick leave are measured at the rates paid or payable. Long service leave Recognition and Measurement: The liability for long service leave is recognised in the provision for employee benefits. The liability for long service leave is measured as the present value of expected future payments to be made in respect of services provided by employees up to the reporting date. Consideration is given to expected future wage and salary levels, experience of employee departures, and periods of service. Expected future payments are discounted using market yields at the reporting date on a corporate rate with terms to maturity that match, as closely as possible, the estimated future cash outflows. Defined contribution plans Recognition and Measurement: A defined contribution plan is a post-employment benefit plan under which the entity pays fixed contributions into a separate entity with no legal or constructive obligation to pay further amounts. Obligations for contributions to defined contribution plans are recognised as an employee benefit expense in profit or loss when they are due. Prepaid contributions are recognised as an asset to the extent that a cash refund or a reduction in future payments is available.
39
For
per
sona
l use
onl
y

A5 Earnings per share
(a) Basic earnings per share The calculation of basic earnings per share has been based on the following net profit attributable to ordinary shareholders and weighted-average number of ordinary shares outstanding. (i) Profit attributable to ordinary shareholders (basic)
2017 2016 $'000 $'000
Net profit attributable to owners of the Company 4,871 8,358 (ii) Weighted-average number of ordinary shares
In thousands of shares Shares on issue at 1 July 134,153 43,706 Issue of shares – share options exercised 12 September 2014 - 2,186 Issue of shares – MAUT acquisition 1 September 2015 - 459 Issue of shares – share split and restructure 24 November 2015 - 46,350 Issue of shares – public float 7 December 2015 - 31,452 Issue of shares – Smollen acquisition 8 December 2015 - 10,000 Issue of shares – High Performing agent plan 13 September 2016 2,336 - Issue of shares – Smollen acquisition 30 June 2017 2,573 - Shares on issue at 30 June 139,062 134,153 Weighted-average number of ordinary shares at 30 June 136,014 97,449 Basic earnings per share (units) 3.58 8.58
(b) Diluted earnings per share
The calculation of diluted earnings per share has been based on the following profit attributable to ordinary shareholders and weighted-average number of ordinary shares outstanding after adjustment for the dilutive potential ordinary shares. 2017 2016 $'000 $'000 Net profit attributable to owners of the Company 4,871 8,358
(ii) Weighted-average number of ordinary shares In thousands of shares Weighted-average number of ordinary shares (basic) 136,014 97,449 Convertible redeemable preference shares (CRPS)1 8,579 3,837 High performing agent share plan2 1,013 748 Performance Rights3 126 - Weighted-average number of ordinary shares (diluted) at 30 June 145,732 102,034 Diluted earnings per share (units) 3.34 8.19
1The CRPS convert to shares in two tranches. The calculation considers the dilutive effect of the CRPS tranche one converted at a share price of $1.19 and potential dilutive effect of tranche two if they were to be converted at the share price at 30 June 2017 per the share purchase agreement for the Smollen Group. 2 High performing agents who achieved specified commission thresholds in FY16 were invited to purchase shares. The amount of shares that each agent was eligible to purchase was determined by the commission threshold they achieved. The shares were issued at a price of $1.1731. The Company provided agents with a limited recourse loan to acquire shares. 3 Performance rights were issued to certain senior executives under a Long-Term Incentive Plan as part of their employment agreements. The performance rights convert to ordinary shares upon the achievement of EBITDA, TSR and continuity of service obligations. The calculation considers the potential dilutive effect of the performance rights if they were to be converted to ordinary shares at the share price at 30 June 2017. The Consolidated Entity presents basic and diluted earnings per share. Basic earnings per share is calculated by dividing the net profit attributable to ordinary shareholders of McGrath by the weighted average number of ordinary shares outstanding. The diluted earnings per share is determined by adjusting the net profit attributable to ordinary shareholders and the weighted average number of ordinary shares outstanding for the effects of all dilutive potential ordinary shares. McGrath uses the treasury stock method for calculating diluted earnings per share. The diluted earnings per share calculation considers the impact of potentially dilutive instruments, if any.
40
For
per
sona
l use
onl
y

B Financial position
This section provides a breakdown and further information about those balance sheet items that the Directors consider most relevant in assessing the financial position of McGrath.
B1 Trade and other receivables B2 Property, plant & equipment 4
B3 Intangible assets 4 B4 Trade and other payables 4
B5 Loans and borrowings 4 B6 Business Combinations
41
For
per
sona
l use
onl
y

B1 Trade and other receivables
Notes 2017 2016 $'000 $'000Current Trade receivables (i) 21,967 23,233Doubtful debts provision (ii) (301) (509) 21,666 22,724Other Receivables (iii) 5,762 5,522Loans – other (iv) 870 59 28,298 28,305
Non-current Trade receivables (i) 4,457 2,991Loans - other (iv) 94 165 4,551 3,156
Recognition and Measurement (i) Trade receivables, which are generally due on settlement or have 30 day terms, are recognised and carried at original invoice amount less an allowance for any uncollectible amounts. Where settlement is due more than 12 months, the receivable is classified as non-current. (ii) Details of the ageing of trade receivables is disclosed in C1. An impairment for doubtful debts is made when there is objective evidence that the Consolidated Entity will not be able to collect the debts. Bad debts are written off when identified. (iii) Other receivables is largely related to franchise fees owing from franchise businesses which is paid the month following sales settlement. (iv) Other loans are predominantly unsecured and may be interest bearing or interest free. They are repaid on an ongoing basis from agent commissions or agreed payment arrangements.
42
For
per
sona
l use
onl
y
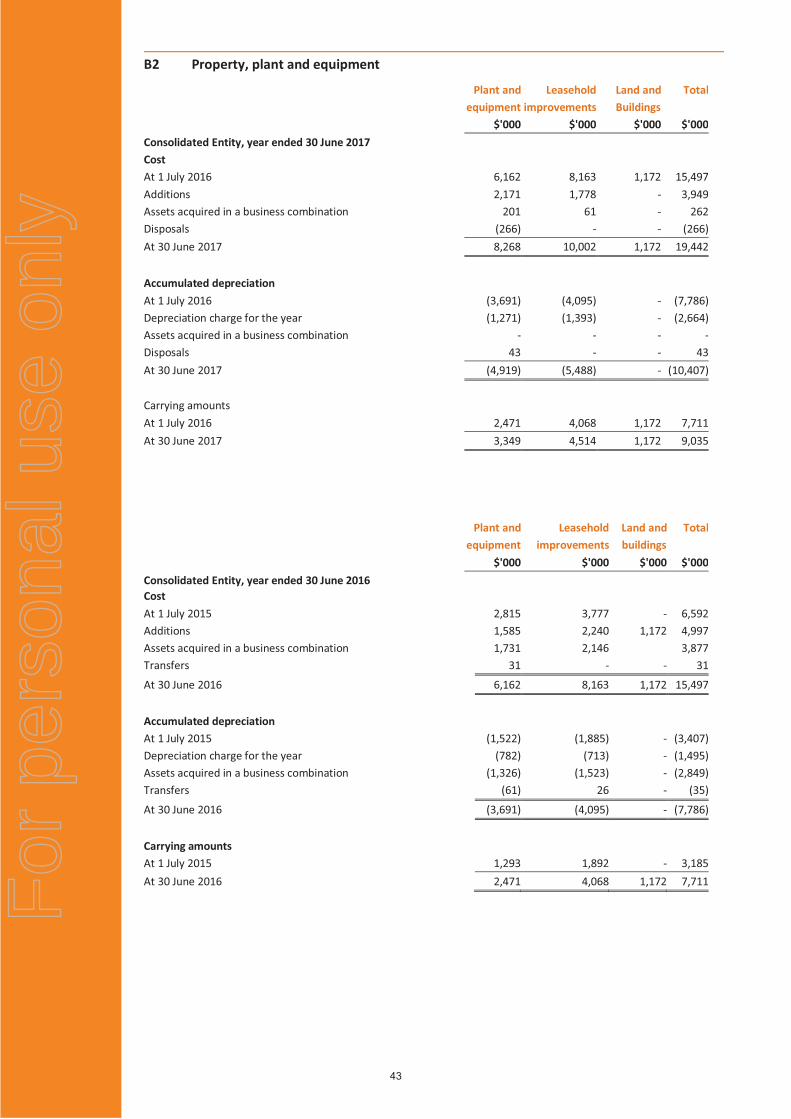
B2 Property, plant and equipment
Plant and Leasehold Land and Total equipment improvements Buildings $'000 $'000 $'000 $'000Consolidated Entity, year ended 30 June 2017 Cost At 1 July 2016 6,162 8,163 1,172 15,497Additions 2,171 1,778 - 3,949Assets acquired in a business combination 201 61 - 262Disposals (266) - - (266)At 30 June 2017 8,268 10,002 1,172 19,442
Accumulated depreciation At 1 July 2016 (3,691) (4,095) - (7,786)Depreciation charge for the year (1,271) (1,393) - (2,664)Assets acquired in a business combination - - - -Disposals 43 - - 43At 30 June 2017 (4,919) (5,488) - (10,407) Carrying amounts
At 1 July 2016 2,471 4,068 1,172 7,711At 30 June 2017 3,349 4,514 1,172 9,035
Plant and Leasehold Land and Total equipment improvements buildings
$'000 $'000 $'000 $'000Consolidated Entity, year ended 30 June 2016 Cost
At 1 July 2015 2,815 3,777 - 6,592Additions 1,585 2,240 1,172 4,997Assets acquired in a business combination 1,731 2,146 3,877Transfers 31 - - 31
At 30 June 2016 6,162 8,163 1,172 15,497
Accumulated depreciation At 1 July 2015 (1,522) (1,885) - (3,407)Depreciation charge for the year (782) (713) - (1,495)Assets acquired in a business combination (1,326) (1,523) - (2,849)Transfers (61) 26 - (35)
At 30 June 2016 (3,691) (4,095) - (7,786) Carrying amounts At 1 July 2015 1,293 1,892 - 3,185At 30 June 2016 2,471 4,068 1,172 7,711
43
For
per
sona
l use
onl
y

B2 Property, plant and equipment (continued)
Recognition and Measurement
Plant and equipment is stated at cost less accumulated depreciation and any accumulated impairment losses.
Depreciation is based on the cost of an asset less its residual value.
Depreciation is calculated on a straight-line basis over the estimated useful life of the assets as follows:
� Plant and equipment - 2.5 to 10 years � Leasehold improvements - remaining lease term � Land and buildings are not depreciated
The assets’ residual values, useful lives and depreciation methods are reviewed, and adjusted if appropriate, at each reporting date.
(i) Impairment
The carrying values of plant and equipment are reviewed for impairment at each reporting date, with recoverable amount being estimated when events or changes in circumstances indicate that the carrying value may be impaired.
The recoverable amount of plant and equipment is the higher of fair value less costs to sell and value in use. In assessing value in use, the estimated future cash flows are discounted to their present value using a pre-tax discount rate that reflects current market assessments of the time value of money and the risks specific to the asset.
For an asset that does not generate largely independent cash inflows, recoverable amount is determined for the cash- generating unit to which the asset belongs, unless the asset's value in use can be estimated to be close to its fair value.
An impairment exists when the carrying value of an asset or cash-generating unit exceeds its estimated recoverable amount. The asset or cash-generating unit is then written down to its recoverable amount. For plant and equipment, impairment losses are recognised in the profit and loss.
(ii) Derecognition and disposal
An item of property, plant and equipment is derecognised upon disposal or when no further future economic benefits are expected from its use or disposal. Any gain or loss arising on derecognition of the asset (calculated as the difference between the net disposal proceeds and the carrying amount of the asset) is included in profit or loss in the year the asset is derecognised.
44
For
per
sona
l use
onl
y

B3 Intangible assets
Goodwill Property Software Total Management Rights $’000 $'000 $'000 $'000Consolidated Entity, year ended 30 June 2017 Cost
At 1 July 2016 53,289 22,363 9,579 85,231Additions - - 2,942 2,942Assets acquired in a business combination 39 - - 39Disposals - - - -Transfers - - - -At 30 June 2017 53,328 22,363 12,521 88,212 Accumulated amortisation At 1 July 2016 - (3,938) (2,378) (6,316)Transfers - - - -Disposals - - - -Amortisation charge for the year - (3,033) (1,877) (4,910)Impairment of software asset - - (2,180) (2,180)At 30 June 2017 - (6,971) (6,435) (13,406) Carrying amounts At 1 July 2016 53,289 18,425 7,201 78,915At 30 June 2017 53,328 15,392 6,086 74,806
Property Goodwill Management Software Total Rights $’000 $'000 $'000 $'000Consolidated Entity, year ended 30 June 2016 Cost At 1 July 2015 300 6,349 6,502 13,151Additions - - 3,108 3,108Assets acquired in a business combination 52,989 16,033 - 69,022Transfers - - (31) (31)Disposals - (19) - (19)At 30 June 2016 53,289 22,363 9,579 85,231
Accumulated amortisation At 1 July 2015 - (2,030) (2,180) (4,210)Transfers - - 34 34Disposals - - - -Amortisation charge for the year - (1,908) (232) (2,140)At 30 June 2016 - (3,938) (2,378) (6,316) Carrying amounts At 1 July 2015 300 4,319 4,322 8,941At 30 June 2016 53,289 18,425 7,201 78,915 The impairment charge relates to in-house software development costs capitalised during FY14 and FY15. During the reporting period, external software developers were engaged to provide enhanced software applications. It was assessed that these applications superseded a proportion of in-house software development costs capitalised during FY14 and FY15.
45
For
per
sona
l use
onl
y

B3 Intangible assets (continued)
Recognition and Measurement – Property Management Rights & Software Intangible assets acquired separately or in a business combination have finite useful lives are initially measured at cost. The cost of an intangible asset acquired in a business combination is its fair value as at the date of acquisition. Following initial recognition, acquired intangible assets are carried at cost less any accumulated amortisation and any accumulated impairment losses. Property Management Rights are amortised using the diminishing balance method at a rate of 15%. Expenditure on internally generated intangible assets, excluding software development costs, is not capitalised. Software assets are amortised on a straight-line basis over 2.5 to 5 years commencing from implementation of the software. At each reporting date, the Consolidated Entity reviews the carrying amount of intangibles to determine whether there is any indication of impairment. If any such indication exists, then the asset’s recoverable amount is estimated. The assets' residual values, useful lives and amortisation methods are reviewed, and adjusted if appropriate, at each reporting period. Recognition and Measurement – Goodwill Goodwill arising on the acquisition of businesses is measured at cost less accumulated impairment losses. Goodwill is tested annually for impairment. $'000
Year Ended 30 June 2017
Consolidated Entity
Carrying amount at beginning of financial year 53,289Additions during the year 39Carrying amount at end of financial year 53,328
Year Ended 30 June 2016 Consolidated Entity
Carrying amount at beginning of financial year 300Additions during the year 52,989Carrying amount at end of financial year 53,289
Significant accounting judgements, estimates and assumptions utilised in impairment testing Goodwill recognised in the acquisition of businesses has been allocated to the Company Owned sales operating segment on the basis that the businesses will benefit the Company Owned sales operating segment as a whole. The recoverable amount is the greater of its value in use and its fair value less costs to sell. The value in use methodology has been used to determine the recoverable amount. The key assumption used in assessing value in use are set out below. The values assigned to the key assumptions represent management’s assessment of future trends in real estate considering predicted property values, sales agent numbers, commission rates achieved and costs that have been based on historical data from internal and external sources.
In percent 2017 Discount rate (pre-tax) 13.8 Nominal average revenue growth 5.9 Terminal value in growth rate 2.5
The discount rate was a pre-tax measure estimated based on the Consolidated Entity’s weighted-average cost of capital adjusted for a risk premium. The cash flow projections included an average estimate for five years excluding the effect of acquisition or expansion and a terminal growth rate thereafter. Expected future profits for the first year were based on internal financial forecasts and reflect management’s expectations of growth. The terminal growth rate was determined on management’s estimate of the long-term growth in EBITDA.
An impairment loss is recognised if the carrying amount of an asset exceeds its recoverable amount. Impairment losses are recognised in the profit or loss. An impairment loss in respect of goodwill is not reversed.
46
For
per
sona
l use
onl
y

B4 Trade and other payables
2017 2016 $'000 $'000 Current Trade creditors 1,228 5,172 Other creditors 1,647 2,121 Accrued expenses 7,960 5,992 Accrued sales commission 2,721 2,240 Unearned income 562 564 14,118 16,089
Non-current Accrued sales commission 1,523 1,104 1,523 1,104 Recognition and Measurement Trade and other payables are carried at amortised costs and represent liabilities for goods and services provided to the Consolidated Entity prior to the end of the financial year that are unpaid and arise when the Consolidated Entity becomes obliged to make future payments in respect of the purchase of these goods and services.
B5 Loans and borrowings
Notes 2017 2016 $'000 $'000Current Deferred consideration B6 6,125 6,099 6,125 6,099 Deferred consideration B6 - 6,472 - 6,472
The deferred consideration relates to the acquisition of the Smollen Group. The deferred consideration has been presented at fair value as determined at 30 June 2017 (refer Note B6). On 7 September 2016, a payment of $3,062,500 was made to the Smollen Group in settlement of the cash component of the first tranche of deferred consideration. On 30 June 2017, the equity component of the first tranche of deferred consideration was settled by the issue of 2,573,520 ordinary shares in McGrath Limited. $6,125,000 for the Smollen Group second tranche deferred consideration is to be settled 50% in cash and 50% in convertible redeemable preference shares during FY18. The consolidated entity has no bank loans at 30 June 2017 (30 June 2016 – nil).
47
For
per
sona
l use
onl
y

B5 Loans and borrowings (continued)
Facility Limit Facility Limit Drawn Amount Drawn Amount 2017 2016 2017 2016 $'000 $'000 $'000 $'000 Secured loan facilities Line of credit - 11,500 - - - 11,500 - -
The line of credit facility was cancelled on 21 October 2016. Recognition and Measurement
All loans and borrowings are initially recognised at the fair value of the consideration received less directly attributable transaction costs. After initial recognition, interest bearing loans and borrowings are subsequently measured at amortised cost using the effective interest method.
B6 Business combinations B6 (a) On 1 July 2016, McGrath acquired CP Frenchs Forest Sales Proprietary Limited. Details of the fair value of the assets and liabilities acquired are as follows: $'000 Fair value of consideration transferred Amount settled in cash 186 Amount of deferred consideration 100 Total consideration pre adjustment 286 Working capital adjustment (1) Adjusted consideration 285 Recognised amounts of identifiable net assets Property, plant and equipment 261 Total non-current assets 261 Payroll liabilities (15) Total current liabilities (15) Identifiable net assets 246 Goodwill on acquisition 39 The fair values of the identifiable net assets has been measured on a provisional basis. If new information is obtained within one year of the date of acquisition about facts and circumstances that existed at the date of acquisition, then the accounting for the acquisition will be revised.
Deferred consideration of $100,000 was initially recognised as a liability based upon the fair value of earn outs payable in accordance with the purchase agreement. The deferred consideration was payable in cash on the achievement of gross commission income hurdles within 12 months from the date of sale.
Two of the four gross commission income hurdles were met during the 12 months following the sale date. This resulted in a reduction of the liability and a gain of $50,000 being recognised in the profit and loss for the period.
48
For
per
sona
l use
onl
y

B6 Business combinations (continued)
B6 (b) On 8 December 2015, McGrath completed the acquisition of the Smollen Group consisting of 10 entities. Prior to acquisition the Smollen Group represented the network’s largest franchisee and consisted of 10 offices across Sydney’s North Shore, North West and Northern Beaches.
$'000 Fair value of consideration transferred Amount settled in cash
31,500
Amount settled in ordinary shares 21,000 Amount of deferred consideration 12,250 Fair value adjustment of deferred consideration recognised in the profit and loss 2,657 Total consideration pre working capital adjustment 67,407 Working capital adjustment (1,945) Adjusted consideration 65,462 Identifiable net assets 12,473 Goodwill on acquisition
52,989
As at 30 June 2017, the deferred consideration was revalued based on management’s updated assessment of the probability of the Smollen Group meeting the earn out hurdles resulting in a reduction of the liability and a gain of $320,687 being recognised in the profit and loss for the period.
Recognition and Measurement
Business combinations are accounted for using the acquisition method. The consideration transferred in the acquisition is measured at fair value, as are the identifiable net assets acquired. For each business combination, the acquirer measures the non-controlling interest in the acquirer either at fair value or at the proportionate share of the acquiree’s identifiable net assets. Acquisition-related costs are expensed as incurred.
When the Consolidated Entity acquires a business, it assesses the financial assets and liabilities assumed for appropriate classification and designation in accordance with the contractual terms, economic conditions, the consolidated entities operating or accounting policies and other pertinent conditions as at the acquisition date.
If the business combination is achieved in stages, the acquisition date fair value of the acquirer’s previously held equity interest in the acquiree is remeasured at fair value as at the acquisition date through profit or loss.
Any contingent consideration is measured at fair value at the acquisition date. If an obligation to pay contingent consideration that meets the definition of a financial instrument is classified as equity, then it is not remeasured and settlement is accounted for within equity. Otherwise subsequent changes in the fair value of contingent consideration is recognised in profit or loss.
Significant accounting judgements, estimates and assumptions
The fair value of identifiable assets and liabilities are assessed by applying judgement in their identification, classification and measurement in accordance with McGrath’s accounting policies and other pertinent conditions as at the acquisition date.
Any contingent consideration to be transferred will be recognised at fair value at the acquisition date. Subsequent changes to the fair value of the contingent consideration which is deemed to be an asset or a liability will be recognised in the profit or loss.
Estimates and underlying assumptions are reviewed on an ongoing basis. Revisions to accounting estimates are recognised in the period in which the estimates are revised and in any future periods affected.
49
For
per
sona
l use
onl
y

C Risk, capital management and related parties
This section explains McGrath’s risk and capital management, including dividend payments and transactions with related parties, particularly Directors and executives.
C1 Financial risk management
C2 Capital management 5
C3 Dividends paid and proposed 5 C4 Key management personnel Disclosure 5
C5 Related party transactions 5
50
For
per
sona
l use
onl
y

C1 Financial risk management
The Consolidated Entity has exposure to the following financial risks: � Credit risk � Liquidity risk � Market risk
Risk Management Framework The Consolidated Entity’s board of directors has overall responsibility for the establishment and oversight of the risk management framework. The Consolidated Entity’s risk management policies are established to identify and analyse the risks faced by the Consolidated Entity, to set appropriate risk limits and controls and to monitor risks and adherence to limits. Credit risk Credit risk is the risk of financial loss to the Consolidated Entity if a customer or counterparty to a financial asset fails to meet its contractual obligations and arises principally from the Consolidated Entity’s receivables from customers. Exposure The maximum exposure to credit risk at balance date is the carrying amount of financial assets, net of any provisions for doubtful debts, as disclosed in the statements of financial position and notes to the financial statements. The Consolidated Entity closely monitors the age of trade and other receivables on a continuous basis to determine collectability and whether there is any risk of impairment. The Consolidated Entity does not have any material credit risk exposure to any single debtor or group of debtors.
51
For
per
sona
l use
onl
y
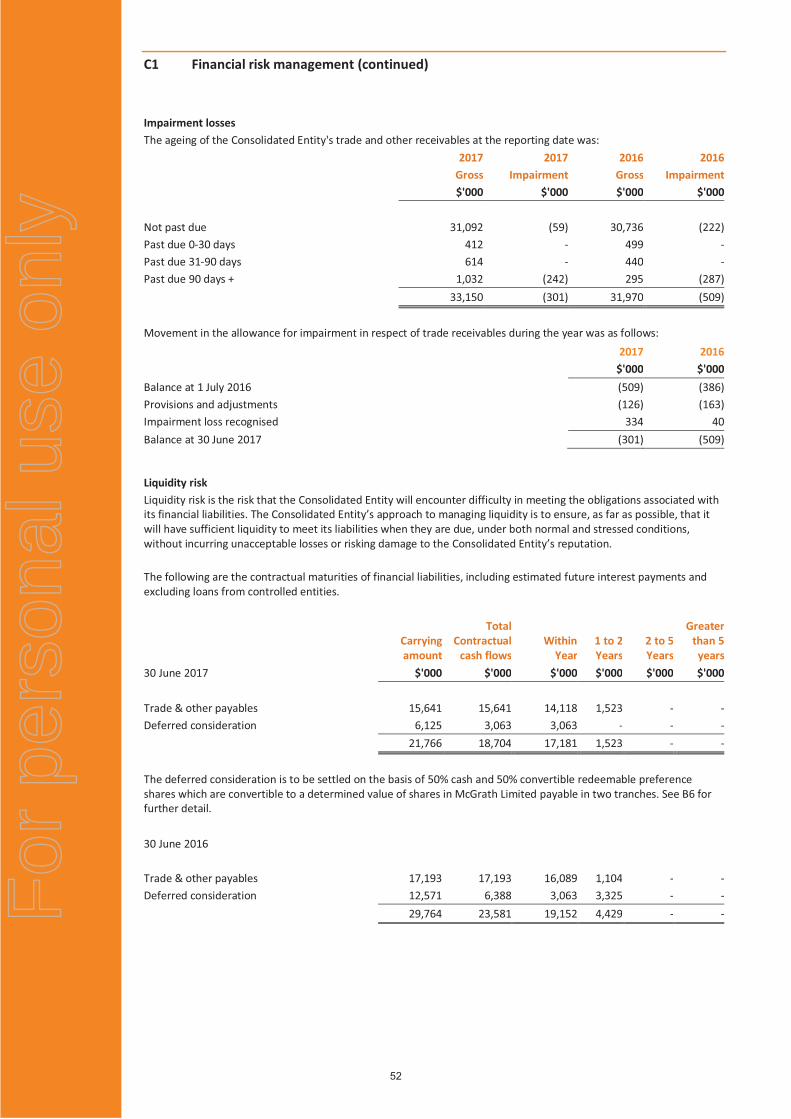
C1 Financial risk management (continued)
Liquidity risk Liquidity risk is the risk that the Consolidated Entity will encounter difficulty in meeting the obligations associated with its financial liabilities. The Consolidated Entity’s approach to managing liquidity is to ensure, as far as possible, that it will have sufficient liquidity to meet its liabilities when they are due, under both normal and stressed conditions, without incurring unacceptable losses or risking damage to the Consolidated Entity’s reputation. The following are the contractual maturities of financial liabilities, including estimated future interest payments and excluding loans from controlled entities.
Carrying amount
Total Contractual
cash flows Within
Year 1 to 2 Years
2 to 5 Years
Greater than 5 years
30 June 2017 $'000 $'000 $'000 $'000 $'000 $'000 Trade & other payables 15,641 15,641 14,118 1,523 - -Deferred consideration 6,125 3,063 3,063 - - - 21,766 18,704 17,181 1,523 - -
The deferred consideration is to be settled on the basis of 50% cash and 50% convertible redeemable preference shares which are convertible to a determined value of shares in McGrath Limited payable in two tranches. See B6 for further detail.
30 June 2016 Trade & other payables 17,193 17,193 16,089 1,104 - -Deferred consideration 12,571 6,388 3,063 3,325 - - 29,764 23,581 19,152 4,429 - -
Impairment losses The ageing of the Consolidated Entity's trade and other receivables at the reporting date was: 2017 2017 2016 2016 Gross Impairment Gross Impairment $'000 $'000 $'000 $'000 Not past due 31,092 (59) 30,736 (222)Past due 0-30 days 412 - 499 -Past due 31-90 days 614 - 440 -Past due 90 days + 1,032 (242) 295 (287) 33,150 (301) 31,970 (509)
Movement in the allowance for impairment in respect of trade receivables during the year was as follows: 2017 2016 $'000 $'000Balance at 1 July 2016 (509) (386)Provisions and adjustments (126) (163)Impairment loss recognised 334 40Balance at 30 June 2017 (301) (509)
52
For
per
sona
l use
onl
y

C1 Financial risk management (continued)
Market risk Market risk is the risk that changes in market prices, such as interest rates, will affect the Consolidated Entity’s financial performance and position. Interest rate risk Profile At reporting date, all interest bearing loans are variable instruments. At the reporting date the interest rate profile of the interest bearing financial assets and liabilities was: Carrying Amount Carrying Amount Weighted average
floating interest rate Weighted average
floating interest rate 2017 2016 2017 2016 Financial assets: $'000 $'000 % % Cash at bank 2,993 5,487 0.00% 0.21% Short term deposits 5,006 7,006 0.67% 0.73% Total financial assets 7,999 12,493
Financial liabilities: Deferred consideration 6,125 12,571
Total financial liabilities 6,125 12,571
Interest rate sensitivity A change of 100 basis points in interest rates would have increased or decreased the Consolidated Entity's profit and equity by $53,492 (2016: $44,296).
Other Market risks At 30 June 2017 the Consolidated Entity did not hold any available-for-sale equity securities assets (2016: nil) or have exposure to currency risk.
Fair values For financial assets and financial liabilities the fair value approximates their carrying value. The aggregate carrying amounts of financial assets and financial liabilities are disclosed in the consolidated statement of financial position and in the notes to the financial statements.
53
For
per
sona
l use
onl
y

C2 Capital management
C3 Dividends paid and proposed
2017 2016 $'000 $'000 Declared and paid during the year:
Dividends on ordinary shares:
Final franked dividend for 2016: 6.1¢ (2014: 5.41¢) paid August 2016 - 2,800
Pre IPO franked dividend for 2017: 17.7¢ (2016: nil) paid December 2016 - 8,200
Final franked dividend for 2016: 3.5¢ (2015: 6.1¢) paid September 2016 4,777 -
Interim franked dividend for 2017: 1¢ (2016: nil) paid March 2017 1,365 -
6,142 11,000
The tax rate at which dividends paid have been franked is 30% (2016: 30%). Dividend Payout Ratio 126% 132%
Dividend franking account $'000 $'000
Amount of franking credits available to shareholders 5,752 6,191 The ability to utilise franking credits is dependent upon the ability to declare dividends.
Risk management Capital is defined as the combination of contributed equity, reserves and net debt (borrowings less cash). The board is responsible for monitoring and approving the capital management framework within which management operates. The Consolidated Entity’s objective when managing capital is to safeguard its ability to continue as a going concern, so that it can continue to provide returns for shareholders and benefits for other stakeholders such as employees. The Consolidated Entity focuses on interrelated financial parameters, including its gearing ratio, earnings growth, average cost of debt, gearing, weighted average debt maturity and borrowing capacity. The Consolidated Entity also monitors its interest coverage ratio and weighted average cost of debt. These are all taken into account when the Consolidated Entity makes decisions on how to invest its capital and evaluate its existing investments. The capital structure of the Consolidated Entity can be changed by paying distributions to shareholders, returning capital to shareholders, issuing new shares or selling assets. Loan covenants Under the terms of the borrowing facilities, the Consolidated Entity is required to comply with certain financial covenants including minimum annual earnings before interest, tax, depreciation and amortisation, minimum property management commissions and minimum average term of franchise agreements. The Consolidated Entity has complied with these covenants throughout the reporting period.
54
For
per
sona
l use
onl
y

C4 Key management personnel disclosure
Non-executive Directors
C. O’Connor Chair and Non-executive Director E. Crouch Non-executive Director Appointed 25 August 2016 N. Dews Non-executive Director Appointed 23 November 2016
C. Rogers Non-executive Director Appointed 23 November 2016 D. Mackay Chair and Non-executive Director Retired 25 August 2016
D. Petre Non-executive Director Retired 23 November 2016
Executive Director
J. McGrath Executive Director
Executives
C. Judson Chief Executive Officer Appointed 14 July 2016 P. Hauenschild Chief Financial Officer K. Stathopoulos Head of Sales Appointed 10 October 2016 C. Mourd Head of Franchise Services Appointed 13 June 2017 G. Vouris General Manager Franchise Resigned 3 April 2017 G. Lucas Chief Operating Officer Resigned 12 August 2016 M. Lahood Director of Sales Resigned 31 December 2016
Compensation of key management personnel
The key management personnel of the Company are the Directors and Executives of the Consolidated Entity who have the authority and responsibility for planning, directing and controlling the activities of the Company, either directly or indirectly. Key management personnel compensation included in Employee Benefit Expenses (refer to A4) is as follows.
2017 2016 $ $
Short term employee benefits 3,453,496 2,863,074 Post-employment benefits 152,475 126,294 3,605,971 2,989,368
Dividends have been paid during the year ended 30 June 2017 amounting to $6,142,000 (2016: $11,000,000) which include amounts paid to Directors and other key management personnel.
(b) Equity holdings of key management personnel
Financial year
Shares held at
beginning of financial year
Impact of share split and
restructure
Shares acquired
during the year
Shares disposed
during the year
Sharesheld at
30 June
Shares Shares Shares Shares Shares
D. Mackay 2017 234,499 - - 205,928 28,571 2016 - - 234,499 - 234,499
C. O'Connor 2017 109,238 - 16,000 - 125,238 2016 - - 109,238 - 109,238D. Petre 2017 277,777 - - - 277,777 2016 - - 277,777 - 277,777
J. McGrath 2017 37,127,378 - - - 37,127,378 2016 27,056,252 27,056,252 872,000 17,857,126 37,127,378
E. Crouch 2017 - - 21,052 - 21,052 2016 - - - - -
C. Rogers 2017 - - 30,000 - 30,000 2016 - - - - -
Sub Total 2017 37,748,892 - 67,052 205,928 37,610,016 2016 27,056,252 27,056,252 1,493,514 17,857,126 37,748,892
55
For
per
sona
l use
onl
y

C4 Key management personnel disclosure (continued)
(b) Equity holdings of key management personnel (continued)
Financialyear
Shares held at
beginning of financial year
Impact of share split and
restructure
Shares acquired
during the year
Shares disposed
during the year
Sharesheld at
31 December
Shares Shares Shares Shares Shares
G. Lucas 2017 5,787,194 - - 70,000 5,717,194
2016 4,266,563 4,266,563 70,000 2,815,932 5,787,194
P. Hauenschild 2017 69,277 - - - 69,277
2016 - - 69,277 - 69,277
M. Lahood 2017 2,788,875 - - - 2,788,875
2016 2,081,250 2,081,250 - 1,373,625 2,788,875
G. Vouris 2017 24,515 - - 24,039 476
2016 - - 24,515 - 24,515
K. Stathopoulos 2017 48,077 - - - 48,077
2016 - - 48,077 - 48,077
Sub Total 2017 8,717,938 - - 94,039 8,623,899
2016 6,347,813 6,347,813 211,869 4,189,557 8,717,938
Grand Total 2017 46,466,830 - 67,052 299,967 46,233,915
2016 33,404,065 33,404,065 1,705,383 22,046,683 46,466,830 C. Judson, N. Dews and C. Mourd do not hold shares in the Company. Except for the movement in equity holdings of key management personnel, there have been no other new significant related party transactions during the period.
(c) Loans to key management personnel
Year
Cash advance balance at
beginning of financial year
Advances received during
the year
Repayments made
during the year
Cash advancebalance at
end offinancial year
$ $ $ $ J. McGrath 2017 - - - - 2016 557,143 1,372,222 1,929,365 -
G. Lucas 2017 - - - - 2016 87,857 216,389 304,246 -
M. Lahood 2017 92,272 - 92,272 - 2016 239,063 160,222 307,012 92,272 Other individuals1 2017 - - - - 2016 42,857 - 42,857 -
Total 2017 92,272 - 92,272 - 2016 926,920 1,748,833 2,583,480 92,272
1 Loans made to 2 KMP that did not exceed $100,000 at any time.
The cash advance balances are unsecured, interest free and have no fixed repayment date. Repayments are made from dividend distributions or commissions due to the individual or a related entity.
56
For
per
sona
l use
onl
y

C4 Key management personnel disclosure (continued)
Key management personnel related party transactions
Several key management personnel, or their related parties, hold positions in other entities that result in them having control or significant influence over the financial or operating policies of those entities.
A number of these entities transacted in conjunction with the Consolidated Entity in the reporting period or prior period. The terms and conditions of the transactions with key management personnel and their related parties were no more favorable than those available, or which might reasonably be expected to be available, on similar transactions to non-key management personnel related entities on an arm’s length basis.
Share-based payments
During the 2016 financial year, agents in Company Owned sales offices were given the opportunity to participate in the High Performing Agents (HPA) share plan. Under the plan, HPA who achieved specified commission thresholds during the year were invited to purchase shares. The amount of shares that each agent was eligible to purchase was determined by the commission threshold they achieved. The Company provided the agents with a limited recourse loan to acquire shares. The plan was formally granted in April 2016 with 27 HPA qualifying at 30 June 2016. The shares were awarded on 13 September 2016. Long-term Incentive Plans During the 2017 financial year, the Chief Executive Officer and other senior executives were given the opportunity to participate in long-term incentive plans, with performance rights awarded up to a maximum percentage of their fixed annual remuneration. The performance rights will vest in three tranches, measured for each 12 month period ending 30 June, depending on the EBITDA performance of the Consolidated Entity and total shareholder return against comparator entities. If the performance hurdle for the period is achieved, the rights will vest. Following assessment any performance rights that do not vest will lapse. Mr. Judson was allocated performance rights in accordance with his contract of employment from his appointment and promotion to Chief Executive Officer. The performance rights are subject to a three-year continuity of service condition. At 30 June 2017, there are no further share-based payment arrangements.
C5 Related Party Transactions
A number of subsidiaries within the Consolidated Entity enter into related party transactions. These transactions are conducted in the normal course of business and under arms-length terms and conditions. The majority of related party transactions between subsidiaries relate to levies and fees charged by MG Logistics Pty Ltd, McGrath Australasia Pty Ltd and McGrath Auctions Unit Trust for marketing, training, IT and auction services. The segment note at A2 discloses the quantum of these transactions. Other related party transactions between subsidiaries occur due to the Consolidated Entity using centralised bank accounts in managing their treasury operations. Refer to E5 for a listing of the intercompany balances outstanding between McGrath Limited and its subsidiaries.
57
For
per
sona
l use
onl
y

D Unrecognised items
Provides information about items that are not recognised in the financial statements but could potentially have a significant impact on McGrath’s financial position and performance.
D1 Commitments for expenditure D2 Contingent liabilities 5
D3 Events subsequent to reporting date 5
58
For
per
sona
l use
onl
y
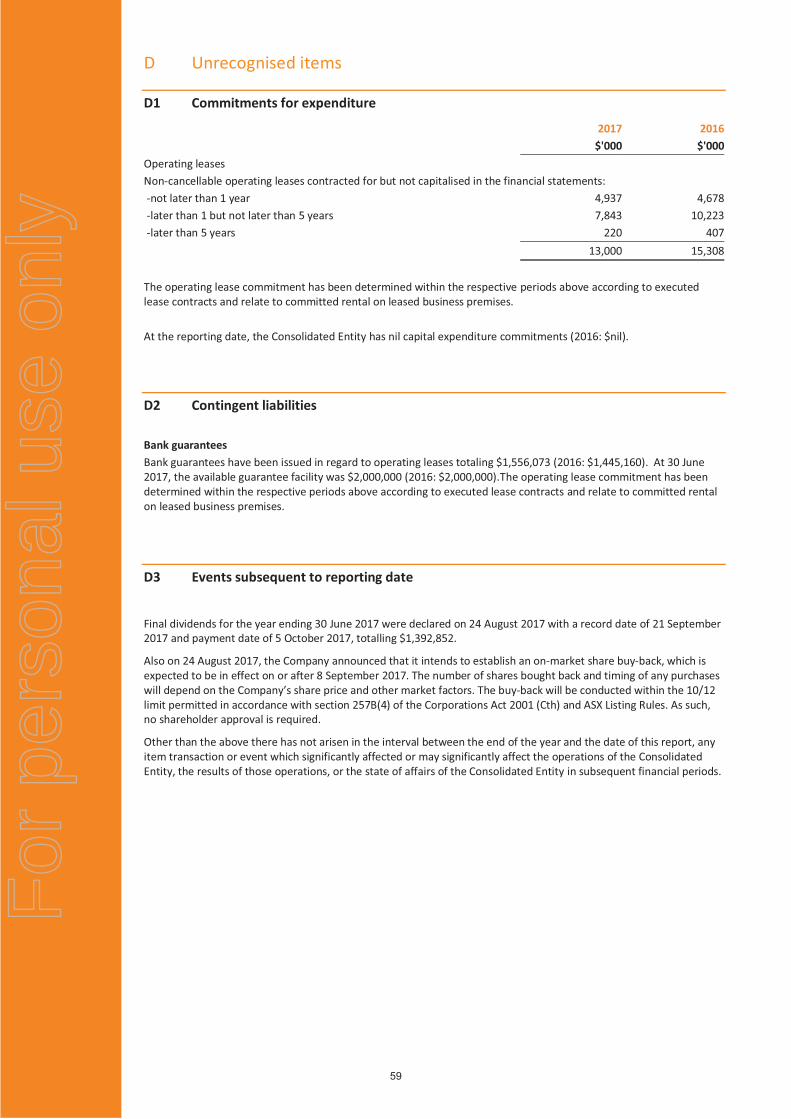
D Unrecognised items
D1 Commitments for expenditure
2017 2016 $'000 $'000
Operating leases Non-cancellable operating leases contracted for but not capitalised in the financial statements: -not later than 1 year 4,937 4,678 -later than 1 but not later than 5 years 7,843 10,223 -later than 5 years 220 407 13,000 15,308
The operating lease commitment has been determined within the respective periods above according to executed lease contracts and relate to committed rental on leased business premises. At the reporting date, the Consolidated Entity has nil capital expenditure commitments (2016: $nil).
D2 Contingent liabilities Bank guarantees Bank guarantees have been issued in regard to operating leases totaling $1,556,073 (2016: $1,445,160). At 30 June 2017, the available guarantee facility was $2,000,000 (2016: $2,000,000).The operating lease commitment has been determined within the respective periods above according to executed lease contracts and relate to committed rental on leased business premises.
D3 Events subsequent to reporting date
Final dividends for the year ending 30 June 2017 were declared on 24 August 2017 with a record date of 21 September 2017 and payment date of 5 October 2017, totalling $1,392,852.
Also on 24 August 2017, the Company announced that it intends to establish an on-market share buy-back, which is expected to be in effect on or after 8 September 2017. The number of shares bought back and timing of any purchases will depend on the Company’s share price and other market factors. The buy-back will be conducted within the 10/12 limit permitted in accordance with section 257B(4) of the Corporations Act 2001 (Cth) and ASX Listing Rules. As such, no shareholder approval is required.
Other than the above there has not arisen in the interval between the end of the year and the date of this report, any item transaction or event which significantly affected or may significantly affect the operations of the Consolidated Entity, the results of those operations, or the state of affairs of the Consolidated Entity in subsequent financial periods.
59
For
per
sona
l use
onl
y

E Other information
The Appendix sets out information that the directors do not consider significant in the context of McGrath’s operations and covers statutory information that must be disclosed to satisfy the requirements of the Corporations Act 2001.
E1 Taxation E2 Other assets 6 E3 Provisions 6 E4 Capital and reserves 6 E5 Subsidiaries and non-controlling interests 6 E6 Parent entity disclosures 6 E7 Auditor’s remuneration 6 E8 Deed of cross guarantee 6 E9 General accounting policies
60
For
per
sona
l use
onl
y

E Other information
E1 Taxation
This note provides an analysis of the Consolidated Entity's income tax expense, shows what amounts are recognised directly in equity and in other comprehensive income, and how the tax expense is affected by non-assessable and non-deductible items. It also explains how the Consolidated Entity accounts for unsettled sales commission costs and tax losses.
2017 2016$'000 $'000
Income tax expense Current tax expense Current year 2,333 2,883Adjustments in respect of income tax of previous years (730) (213)Tax losses utilised (29) (156)
1,574 2,514Deferred tax expense Origination and reversal of temporary differences (616) 1,525Tax losses utilised 29 156
(587) 1,681Total income tax expense 987 4,195
Reconciliation of income tax expense/(benefit) Profit before tax 5,858 12,606At the statutory income tax rate of 30% (2016: 30%) 1,757 3,782(Over) provision in respect of previous years income tax (730) (213)Non-assessable income (111) -Non-deductible expenses 71 626Income tax expense 987 4,195
61
For
per
sona
l use
onl
y

E1 Taxation (continued)
Balance and movement in deferred tax assets and liabilities
Net deferred tax balance 1 July 2016
Recognised in profit
or loss Recognised
in equity
Acquired in business
combinations
Net deferred tax balance 30
June 2017 Deferred tax
assets Deferred tax
liabilities Intangible assets (3,252) 555 - - (2,697) - (2,697)Sales commission revenue
(5,957) 131 - - (5,826) - (5,826)
IPO transaction costs 2,062 (516) - - 1,546 1,546 Capitalised expenses 1 - - - 1 1 -Provisions 1,114 (137) - - 977 977 -Accruals 266 89 - - 355 355 -Sales commission costs 991 (175) - - 816 816 -Software assets - 668 - - 668 668 -Change in previously recognised tax losses 29 (29) - - - - - (4,746) 586 - - (4,160) 4,363 (8,523)
Net deferred tax balance 1 July 2015
Recognisedin profit
or lossRecognised
in equity
Acquired in business
combinations
Net deferred tax balance 30
June 2016 Deferred tax
assets Deferred tax
liabilities Intangible assets - 289 - (3,541) (3,252) - (3,252)Sales commission revenue (3,268) (2,689) - - (5,957) - (5,957)IPO transaction costs - 1,017 1,045 - 2,062 2,062 Capitalised expenses 1 - - - 1 1 -Provisions 854 55 - 205 1,114 1,114 -Accruals 282 (61) - 45 266 266 -Sales commission costs 480 (136) - 647 991 991 -Change in previously recognised tax losses 185 (156) - - 29 29 - (1,466) (1,681) 1,045 (2,644) (4,746) 4,463 (9,209)
Tax losses
The Consolidated Entity has capital tax losses for which no deferred tax asset is recognised on the consolidated statement of financial position of $948,977 (2016: $948,977) which are available for offset against future capital gains subject to continuing to meet relevant statutory tests.
The Consolidated Entity does not have income tax losses for which no deferred tax asset is recognised on the consolidated statement of financial position (2016: $nil).
62
For
per
sona
l use
onl
y

E1 Taxation (continued)
Income tax
Income tax expense comprises current and deferred tax.
Current tax assets and liabilities are measured at the amount expected to be recovered from or paid to the taxation authorities. The tax rates and tax laws used to compute the amount are those that are enacted or substantively enacted by the reporting date.
Deferred tax is provided on all temporary differences at the reporting date between the tax bases used for taxation purposes of assets and liabilities and their carrying amounts for financial reporting purposes.
Deferred tax is recognised for all taxable temporary differences except:
� When the temporary differences arises from the initial recognition of goodwill or of an asset or liability in a transaction that is not a business combination and that, at the time of the transaction, affects neither the accounting profit nor taxable profit or loss; or
� When the taxable temporary difference is associated with investments in subsidiaries and the timing of the reversal of the temporary difference can be controlled and it is probable that the temporary difference will not reverse in the foreseeable future.
Deferred tax assets are recognised for all deductible temporary differences, carry-forward of unused tax assets and unused tax losses, to the extent that it is probable that taxable profit will be available against which the deductible temporary differences and the carry-forward of unused tax credits and unused tax losses can be utilized.
The carrying amount of deferred tax assets is reviewed at each reporting date and reduced to the extent that it is no longer probable that sufficient taxable profit will be available to allow all or part of the deferred income tax asset to be utilised.
Unrecognised deferred tax assets are reassessed at each reporting date and are recognised to the extent that it has become probable that future taxable profit will be available against which they can be used.
Deferred tax assets and liabilities are measured at the tax rates that are expected to apply to the year when the asset is realised or the liability is settled, based on tax rates and tax laws that have been enacted or substantively enacted at the reporting date.
Income taxes relating to items recognised directly in equity are recognised in other comprehensive income.
Deferred tax assets and deferred tax liabilities are offset only if a legally enforceable right exists to set off current tax assets against current tax liabilities and the deferred tax assets and liabilities relate to the same taxable entity and the same taxation authority.
Tax Consolidation Legislation
McGrath Limited and its wholly-owned controlled entities apply the tax consolidation legislation.
The deferred tax balances recognised by the parent entity and the consolidated entity in relation to wholly-owned entities joining the tax consolidated group are initially measured and remeasured based on the carrying amounts of the assets and liabilities of those entities at the level of the tax consolidated group and their tax values, as applicable under the tax consolidation legislation.
McGrath Limited, as the head entity in the tax consolidated group, recognises current and deferred tax amounts relating to transactions, events and balances of the controlled entities in this group as if those transactions, events and balances were its own, in addition to the current and deferred tax amounts arising in relation to its own transactions, events and balances. Amounts receivable or payable under a tax sharing agreement with the tax consolidated entities are recognised as tax-related amounts receivable or payable. Expenses and revenues arising under the tax sharing agreement are recognised as a component of income tax (expense)/benefit.
63
For
per
sona
l use
onl
y

E2 Other assets
2017 2016 Current: $'000 $'000 Prepayments 1,962 1,918 Stock on hand 299 73 Other 521 247 2,782 2,238
Recognition and Measurement
Stock on hand is measured at the lower of cost and net realisable value. The cost of stock is based on the weighted average principle and includes expenditure incurred in acquiring the stock, production or conversion costs and other costs incurred in bringing them to their existing location and condition.
Net realisable value is the estimated selling price in the ordinary course of business, less the estimated costs of completion and selling expenses.
E3 Provisions
2017 2016 $'000 $'000Current: Provision for annual leave 1,480 1,796Provision for long service leave 74 132Balance at 30 June 2017 1,554 1,928 Non-current: Make good provision 838 710Provision for long service leave 564 566Balance at 30 June 2017 1,402 1,276
(a) Aggregate employee entitlements 2,118 2,494 (b) Average number of employees 517 430
64
For
per
sona
l use
onl
y

E4 Capital and reserves
2017 2016 $'000 $'000139,062,433 fully paid ordinary shares (2016: 134,153,229). 95,194 92,132
Issue of ordinary shares On 13 September 2016 2,335,684 ordinary shares were issued in accordance with the terms and conditions of the High Performing Agent Plan. On 30 June 2017 2,573,520 ordinary shares were issued as deferred consideration for the acquisition of the Smollen Group (see B6). $’000 Shares On issue at 1 July 2016 92,132 134,153,229 Issue of shares – High performing agent plan - 2,335,684 Issue of shares – Smollen Acquisition 3,062 2,573,520 Balance at 30 June 2017 95,194 139,062,433
On 1 September 2015 458,916 ordinary shares at a price of $2.69 per share were issued as a result of the acquisition of 50% of McGrath Auctions Unit Trust. On 24 November 2015 at a general meeting of the shareholders a share split was approved whereby each ordinary share was split into 2 shares. On 7 December 2015 McGrath Limited listed on the ASX, following the issue of 31,452,270 shares. On 8 December 2015 10,000,000 ordinary shares at a price of $2.10 per share were issued as a result of the acquisition of the Smollen Group (see B6). $’000 Shares On issue at 1 July 2015 6,333 45,891,563 Issue of shares - MAUT acquisition 1,233 458,916 Issue of shares - share split and restructure - 46,350,480 Issue of shares - public float 66,050 31,452,270 Transaction costs deducted from equity (2,484) - Issue of shares - Smollen acquisition 21,000 10,000,000 Balance at 30 June 2016 92,132 134,153,229 Ordinary shares are classified as equity. Incremental costs directly attributable to the issue of shares are recognised as a deduction from equity. Where ordinary shares are issued, any consideration received, net of any directly attributable incremental transaction costs and the related income tax effects, is included in equity attributable to the Company’s equity holders. Ordinary shares participate in dividends and the proceeds on winding up of the parent entity in proportion to the number of shares held. At shareholder meetings each ordinary share is entitled to one vote on show of hands, otherwise each shareholder has one vote when a poll is called. 2017 2016 $'000 $'000Share-based payment reserve Balance at July 1 74 -Provisions made 598 74Balance at end of the year 672 74 The share-based payment reserve relates to the HPA share plan disclosed at note A5 and the LTIP plan disclosed ate note 4 of the remuneration report. Significant accounting judgements, estimates and assumptions
The determination as to whether costs are directly attributable to the issue of shares is a significant judgement. This determination is based on the nature of the costs incurred and allocated on a reasonable basis. Costs that are determined to be attributable are recognised as a deduction from equity.
65
For
per
sona
l use
onl
y

E5 Subsidiaries and non-controlling interests Parent entity The Parent entity within the Consolidated Entity is McGrath Limited. Controlled Entity The consolidated financial statements include the financial statements of McGrath Limited and its controlled entities listed in the following table. Company name Ownership
% Investment
$ 2017 2016 2017 2016 McGrath Operations Limited 100 100 7,566,460 7,566,460McGrath Sales Pty Limited 100 100 1 1McGrath Property Management Pty Limited 100 100 1 1Total Real Estate Training Pty Limited 100 100 1 1Architype Marketing Pty Limited 100 100 2 2McGrath Oxygen Home Loans Pty Limited 100 100 1 1MG Logistics Pty Limited 100 100 1 1McGrath Australasia Pty Ltd 100 100 100 100McGrath Auctions Pty Limited 100 100 100 100McGrath Auctions Unit Trust 100 100 100 100McGrath Sales (QLD) Pty Ltd 100 100 100 100McGrath Property Management (QLD) Pty Ltd 100 100 100 100McGrath Sales Paddington Pty Ltd 100 100 100 100McGrath Bulimba Sales Unit Trust 100 100 100 100McGrath Bulimba (No. 1) Pty Ltd 100 100 100 100McGrath Bulimba Property Management Unit Trust 100 100 100 100McGrath Bulimba (No. 2) Pty Ltd 100 100 100 100McGrath Asia Pty Ltd 100 100 100 100McGrath Sales (VIC) Pty Ltd 100 100 100 100SPG (Australian Portfolio Management) Pty Ltd 100 100 100 100Australian Portfolio Management Pty Ltd 100 100 100 100Australian Portfolio Management Unit Trust 100 100 100 100SPG (NDH Property) Pty Ltd 100 100 100 100NDH Property Pty Limited 100 100 100 100NDH Property Unit Trust 100 100 100 100SPG (MNS Property) Pty Ltd 100 100 100 100MNS Property Pty Ltd 100 100 100 100MNS Property Unit Trust 100 100 100 100SPG (NB Property) Pty Ltd 100 100 100 100NB Property Pty Ltd 100 100 100 100NB Property Unit Trust 100 100 100 100SPG (HH Property) Pty Ltd 100 100 100 100HH Property Pty Ltd 100 100 100 100HH Property Unit Trust 100 100 100 100SPG (UNS Property) Pty Ltd 100 100 100 100UNS Property Pty Ltd 100 100 100 100UNS Property Unit Trust 100 100 100 100SPG (Engage Property) Pty Ltd 100 100 100 100Engage Property Management Pty Limited 100 100 100 100Engage Property Management Unit Trust 100 100 100 100SPG (Market Pod) Pty Ltd 100 100 100 100Market Pod Pty Limited 100 100 100 100Market Pod Unit Trust 100 100 100 100SPG (Hills Property) Pty Ltd 100 100 100 100Hills Property Pty Ltd 100 100 100 100Hills Property Unit Trust 100 100 100 100SPG (Pymble Property) Pty Ltd 100 100 100 100Pymble Property Pty Ltd 100 100 100 100Pymble Property Unit Trust 100 100 100 100
7,570,667 7,570,667
66
For
per
sona
l use
onl
y

E5 Subsidiaries and non-controlling interests (continued) Balances outstanding The following table provides the total amount outstanding between McGrath Limited and its wholly-owned subsidiaries at reporting date.
2017 2016Receivables McGrath Sales Pty Limited 5,535,460 2,597,004MG Logistics Pty Limted 36,995,683 44,420,243McGrath Auctions Unit Trust 25,388 -Australian Portfolio Management Unit Trust 665,338 1,145,514McGrath Operations Limited 2,978,480 - 46,200,349 48,162,762Payables McGrath Bulimba Sales Unit Trust 38,051 38,051Engage Property Management Unit Trust 300,000 300,000McGrath Operations Limited - 7,024,641 338,051 7,362,692 Loans to and from controlled entities arise in the ordinary course of business. The balances are unsecured, non-interest bearing and are subject to no fixed repayment terms.
E6 Parent entity disclosures 2017 2016 $'000 $'000 Result of parent entity Profit/(loss) after income tax expense 13,175 (3,292) Total profit/(loss) and other comprehensive income for the year 13,175 (3,292)
Financial position of parent entity at year end Current assets 45,864 48,163 Total assets 99,480 101,181 Current liabilities (7,437) (14,436) Total liabilities (7,437) (20,908) Net assets 92,043 80,273 Total equity of parent entity comprising of: Contributed equity 87,629 83,522 Share based payment reserve 672 43 Retained earnings 3,742 (3,292) Total equity 92,043 80,273 No capital expenditure commitments contracted for at reporting date (2016: $ nil)
67
For
per
sona
l use
onl
y

E7 Auditor’s Remuneration 2017 2016 $'000 $'000 Audit and review services – KPMG Audit and review of financial statements 280 240 Other regulatory audit services - 11 Total 280 251 Other Services – KPMG
Assurance, taxation and due diligence services
148 1,214 Total other services 148 1,214
E8 Deed of cross guarantee
Nature
During FY16, McGrath Limited and certain wholly-owned entities (collectively the ‘Closed Group’) entered into a Deed of Cross Guarantee (the ‘Deed’). The members of the Closed Group guarantee to pay any deficiency in the event that another member winds up. Parties to the Deeds
The parties to the deed consist of the following:
Holding Entity
- McGrath Limited
Group Entities other than Holding Entity
- McGrath Operations Limited
- McGrath Sales Pty Limited
- MG Logistics Proprietary Limited.
Trustee
- McGrath Operations Limited
Alternative Trustee
- McGrath Sales Pty Limited
Parties added or removed during or since the relevant financial year
No parties were added or removed during the year.
Details of entities which obtained relief in the immediately preceding financial year
Other than the above no parties obtained relief in the immediately preceding financial year.
68
For
per
sona
l use
onl
y

E8 Deed of cross guarantee (continued)
The consolidated statement of profit or loss and other comprehensive income and the consolidated statement of financial position for the Closed Group are as follows:
Closed Group consolidated statement of profit or loss and other comprehensive income for the year ended 30 June
2017 2016
$'000 $'000
Revenues and other income 57,340 57,360
Cost of sales (11,292) (10,833)
Employee benefits expense (17,923) (14,231)
Directors' fees (449) (593)
Professional fees (2,228) (7,254)
Doubtful debts (26) (89)
Occupancy (4,130) (3,059)
Communications (1,494) (1,381)
Advertising and promotions (602) (956)
Loss on disposal of assets - -
Other expenses from ordinary activities (6,486) (4,728) Earnings before interest, tax, depreciation and amortisation (EBITDA) 12,710 14,236
Depreciation and amortisation expenses (5,370) (930)
Finance income 115 94
Finance costs (61) (291)
Net finance costs 54 -197
Profit before income tax expense 7,394 13,109
Income tax expense/benefit 603 (2,580)
Profit after income tax expense 7,997 10,529
Other comprehensive income - -
Total profit and other comprehensive income for the year 7,997 10,529
69
For
per
sona
l use
onl
y

E8 Deed of cross guarantee (continued)
Closed group consolidated statement of financial position as at 30 June
2017 2016 $'000 $'000
CURRENT ASSETS Cash and cash equivalents 7,939 10,071 Trade and other receivables 67,893 55,328 Other 1,609 1,740 Current tax assets 332 1,482 TOTAL CURRENT ASSETS 77,773 68,621
NON CURRENT ASSETS Receivables 4,227 2,991 Intangible assets 57,861 59,163 Other Financial assets 1 - Property, plant and equipment 5,913 5,016 Deferred tax assets - 51 TOTAL NON CURRENT ASSETS 68,002 67,221
TOTAL ASSETS 145,775 135,842
CURRENT LIABILITIES Trade and other payables 29,420 18,950 Financial liabilities 6,125 6,154 Provisions 1,554 1,528 TOTAL CURRENT LIABILITIES 37,099 26,632
NON CURRENT LIABILITIES Trade and other payables 1,522 1,104 Interest bearing liabilities - 6,472 Deferred tax liabilities 53 - Provisions 1,018 978 TOTAL NON CURRENT LIABILITIES 2,593 8,554
TOTAL LIABILITIES 39,692 35,186
NET ASSETS 106,083 100,656
EQUITY Contributed equity 95,195 92,132 Share based payment reserve 672 43 Retained profits/(losses) 10,216 8,481 TOTAL EQUITY 106,083 100,656
70
For
per
sona
l use
onl
y

E9 General accounting policies
(a) Basis of preparation
These general purpose financial statements have been prepared in accordance with Australian Accounting Standards and Interpretations issued by the Australian Accounting Standards Board (AASB) and the Corporations Act 2001. The Consolidated Entity is a for-profit entity for the purpose of preparing the financial statements and is domiciled in Australia.
The Company’s registered address is 191 New South Head Road Edgecliff NSW 2027.
(i) Compliance with IFRS
The consolidated financial statements of the Consolidated Entity also comply with International Financial Reporting Standards (IFRS) as issued by the International Accounting Standards Board (IASB).
(ii) Historical cost convention These financial statements have been prepared on a historical cost basis, except as identified within the notes.
(b) Principles of consolidation
The consolidated financial statements comprise the financial statements of the Company and its subsidiaries as at 30 June each year.
In preparing the consolidated financial statements, intercompany balances and transactions, income and expenses and profit and losses resulting from intra-Consolidated Entity transactions have been eliminated in full.
Subsidiaries are all entities over which the Consolidated Entity has control. The Consolidated Entity controls an entity when the Consolidated Entity is exposed to, or has rights to, variable returns from its involvement with the entity and has the ability to affect those returns through its power to direct the activities of the entity.
Subsidiaries are fully consolidated from the date on which control is transferred to the Consolidated Entity. They are deconsolidated from the date that control ceases.
The acquisition method of accounting is used to account for business combinations by the Consolidated Entity, refer to B6.
Non-controlling interests in the results and equity of subsidiaries are shown separately in the consolidated statement of profit or loss and other comprehensive income, consolidated statement of changes in equity and the consolidated statement of financial position respectively. The Consolidated Entity applies a policy of treating transactions with non-controlling interests as transactions with parties external to the Consolidated Entity. Disposals to non-controlling interests result in gains and losses for the Consolidated Entity that are recorded in the consolidated statement of profit or loss and other comprehensive income.
(c) Significant accounting judgements, estimates and assumptions
The preparation of financial statements in conformity with AASB’s requires management to make judgements, estimates and assumptions that affect the application of accounting policies and the reported amounts of assets, liabilities, income and expenses. Actual results may differ from these estimates.
Estimates and underlying assumptions are reviewed on an ongoing basis. Revisions to accounting estimates are recognised in the period in which the estimates are revised and in any future periods affected.
Information about assumptions and estimation uncertainties that have a significant risk of resulting in material adjustment in the year ending 30 June 2017 are included in the following notes:
� Note B3 – impairment testing of intangible assets including goodwill.
� Note B6 – purchase price allocation from a business combination.
� Note E1 – recognition of deferred tax assets: availability of future taxable profit against which carryforward tax losses can be used.
� Note E4 – cost allocation attributable to the issue of shares.
71
For
per
sona
l use
onl
y
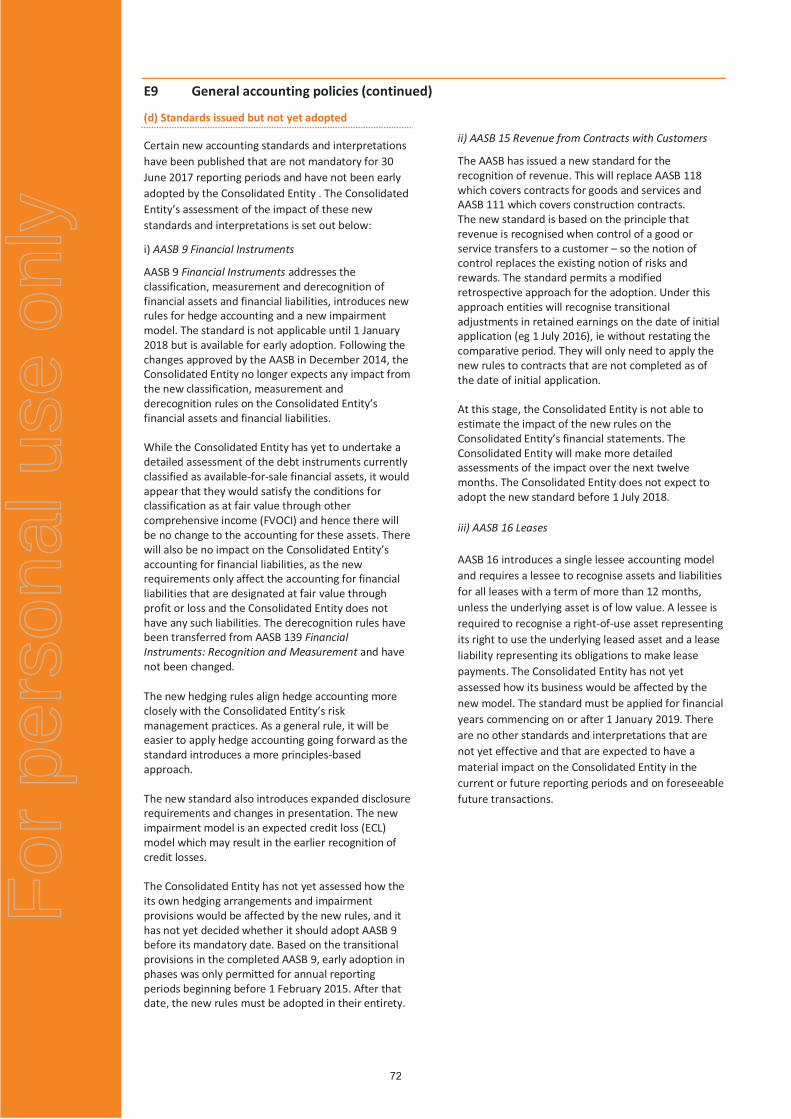
E9 General accounting policies (continued)
(d) Standards issued but not yet adopted
Certain new accounting standards and interpretations have been published that are not mandatory for 30 June 2017 reporting periods and have not been early adopted by the Consolidated Entity . The Consolidated Entity’s assessment of the impact of these new standards and interpretations is set out below:
i) AASB 9 Financial Instruments
AASB 9 Financial Instruments addresses the classification, measurement and derecognition of financial assets and financial liabilities, introduces new rules for hedge accounting and a new impairment model. The standard is not applicable until 1 January 2018 but is available for early adoption. Following the changes approved by the AASB in December 2014, the Consolidated Entity no longer expects any impact from the new classification, measurement and derecognition rules on the Consolidated Entity’s financial assets and financial liabilities. While the Consolidated Entity has yet to undertake a detailed assessment of the debt instruments currently classified as available-for-sale financial assets, it would appear that they would satisfy the conditions for classification as at fair value through other comprehensive income (FVOCI) and hence there will be no change to the accounting for these assets. There will also be no impact on the Consolidated Entity’s accounting for financial liabilities, as the new requirements only affect the accounting for financial liabilities that are designated at fair value through profit or loss and the Consolidated Entity does not have any such liabilities. The derecognition rules have been transferred from AASB 139 Financial Instruments: Recognition and Measurement and have not been changed. The new hedging rules align hedge accounting more closely with the Consolidated Entity’s risk management practices. As a general rule, it will be easier to apply hedge accounting going forward as the standard introduces a more principles-based approach. The new standard also introduces expanded disclosure requirements and changes in presentation. The new impairment model is an expected credit loss (ECL) model which may result in the earlier recognition of credit losses. The Consolidated Entity has not yet assessed how the its own hedging arrangements and impairment provisions would be affected by the new rules, and it has not yet decided whether it should adopt AASB 9 before its mandatory date. Based on the transitional provisions in the completed AASB 9, early adoption in phases was only permitted for annual reporting periods beginning before 1 February 2015. After that date, the new rules must be adopted in their entirety.
ii) AASB 15 Revenue from Contracts with Customers
The AASB has issued a new standard for the recognition of revenue. This will replace AASB 118 which covers contracts for goods and services and AASB 111 which covers construction contracts. The new standard is based on the principle that revenue is recognised when control of a good or service transfers to a customer – so the notion of control replaces the existing notion of risks and rewards. The standard permits a modified retrospective approach for the adoption. Under this approach entities will recognise transitional adjustments in retained earnings on the date of initial application (eg 1 July 2016), ie without restating the comparative period. They will only need to apply the new rules to contracts that are not completed as of the date of initial application. At this stage, the Consolidated Entity is not able to estimate the impact of the new rules on the Consolidated Entity’s financial statements. The Consolidated Entity will make more detailed assessments of the impact over the next twelve months. The Consolidated Entity does not expect to adopt the new standard before 1 July 2018.
iii) AASB 16 Leases
AASB 16 introduces a single lessee accounting model and requires a lessee to recognise assets and liabilities for all leases with a term of more than 12 months, unless the underlying asset is of low value. A lessee is required to recognise a right-of-use asset representing its right to use the underlying leased asset and a lease liability representing its obligations to make lease payments. The Consolidated Entity has not yet assessed how its business would be affected by the new model. The standard must be applied for financial years commencing on or after 1 January 2019. There are no other standards and interpretations that are not yet effective and that are expected to have a material impact on the Consolidated Entity in the current or future reporting periods and on foreseeable future transactions.
72
For
per
sona
l use
onl
y

E9 General accounting policies (continued)
(e) Goods and services tax
Revenues, expenses and assets are recognised net of the amount of goods and services tax (GST) except:
� When the GST incurred on a purchase of goods and services is not recoverable from the taxation authority, in which case the GST is recognised as part of the cost of acquisition of the asset or as part of the expense item as applicable; and
� Receivables and payables, which are stated with the amount of GST included.
The net amount of GST recoverable from, or payable to, the taxation authority is included as part of receivables or payables in the statement of financial position.
Cash flows are included in the statement of cash flows on a gross basis and the GST component of cash flows arising from investing and financing activities, which is recoverable from, or payable to, the taxation authority are classified as operating cash flows.
Commitments and contingencies are disclosed net of the amount of GST recoverable from, or payable to, the taxation authority.
(f) Investments and other financial assets
Financial assets are classified as either financial assets at fair value through profit or loss, loans and receivables, held-to-maturity investments, or available-for-sale financial assets, as appropriate. When financial assets are recognised initially, they are measured at fair value. The Consolidated Entity determines the classification of its financial assets after initial recognition and, when allowed and
appropriate, re-evaluates this designation at each financial year-end.
The Consolidated Entity derecognises a financial asset when the contractual rights to the cash flows from the asset expire, or it transfers the rights to receive the contractual cash flows on the financial asset in a transaction in which substantially all the risks and rewards of ownership of the financial asset are transferred. Any interest in transferred financial assets that is created or retained by the Consolidated Entity is recognised as a separate asset or liability.
(i) Loans and receivables
Loans and receivables are non-derivative financial assets with fixed or determinable payments that are not quoted in an active market. Such assets are carried at amortised cost using the effective interest method less any impairment losses. Gains and losses are recognised in profit or loss when the loans and receivables are derecognised or impaired.
(g) Impairment of financial assets
A financial asset is assessed at each reporting date to determine whether there is objective evidence that it is impaired. A financial asset is impaired if objective evidence indicates that a loss event has occurred after the initial recognition of the asset, and that the loss event had a negative effect on the estimated future cash flows of that asset that can be estimated reliably.
Objective evidence that financial assets (including equity securities) are impaired can include default or delinquency by a debtor, restructuring of an amount due to the Consolidated Entity on terms that the Consolidated Entity would not consider otherwise, indications that a debtor or issuer will enter bankruptcy, the disappearance of an active market for a security.
73
For
per
sona
l use
onl
y

E9 General accounting policies (continued)
(g) Impairment of financial assets (continued)
The Consolidated Entity considers evidence of impairment for receivables at both a specific asset and collective level. All individually significant receivables are assessed for specific impairment. All individually significant receivables found not to be specifically impaired are then collectively assessed for any impairment that has been incurred but not yet identified. Receivables that are not individually significant are collectively assessed for impairment by grouping together receivables with similar risk characteristics.
In assessing collective impairment the Consolidated Entity uses historical trends of the probability of default, timing of recoveries and the amount of loss incurred, adjusted for management’s judgement as to whether current economic and credit conditions are such that the actual losses are likely to be greater or less than suggested by historical trends.
An impairment loss is calculated as the difference between its carrying amount and the present value of the estimated future cash flows discounted at the asset’s original effective interest rate. Losses are recognised in profit or loss and reflected in an allowance account against receivables. Interest on the impaired asset continues to be recognised through the unwinding of the discount. When a subsequent event causes the amount of impairment loss to decrease, the decrease in impairment loss is reversed through profit or loss.
(h) Provisions
Provisions are recognised when the Consolidated Entity has a present obligation (legal or constructive) as a result of a past event, it is probable that an outflow of resources embodying economic benefits will be required to settle the obligation and a reliable estimate can be made of the amount of the obligation.
Provisions are discounted using a current pre-tax rate that reflects the risks specific to the liability.
When discounting is used, the increase in the provision due to the passage of time is recognised as a finance cost.
(i) Share based-payments
The grant-date fair value of share-based payment awards granted to employees is recognised as an employee expense, with a corresponding increase in equity, over the period that the employees unconditionally become entitled to the awards. The amount recognised as an expense is adjusted to reflect the number of awards for which the related service and non-market vesting conditions are expected to be met, such that the amount ultimately recognised as an expense is based on the number of awards that meet the related service and non-market performance conditions at the vesting date. For share-based payment awards with non-vesting conditions, the grant date fair value of the share-based payment is measured to reflect such conditions and there is no true-up for differences between expected and actual outcomes.
The fair value of the amount payable to employees in respect of share appreciation rights, which are settled in cash, is recognised as an expense with a corresponding increase in liabilities, over the period that the employees unconditionally become entitled to payment. The liability is remeasured at each reporting date and at settlement date. Any changes in the fair value of the liability are recognised as personnel expense in profit or loss.
(j) Contributed equity
Ordinary shares are classified as equity. Incremental costs directly attributable to the issue of new shares or options are shown in equity as a deduction, net of tax, from the proceeds.
74
For
per
sona
l use
onl
y

Directors' Declaration For the Year Ended 30 June 2017 In the opinion of the directors of McGrath Limited: (a) the consolidated financial statements and notes that are set out on pages 26 to 71 are in accordance with the Corporations Act 2001, including:
(i) complying with Australian Accounting Standards, the Corporations Regulations 2001 and other mandatory professional reporting requirements, and (ii) giving a true and fair view of the Consolidated Entity’s financial position as at 30 June 2017 and of its performance, for the financial year ended on that date, and
(b) there are reasonable grounds to believe that the Company will be able to pay its debts as and when they become due and payable. (c) at the date of this declaration, there are reasonable grounds to believe that the members of the closed group identified in note E8 will be able to meet any obligations or liabilities to which they are, or may become, subject by virtue of the deed of cross guarantee described in note E9.
(d) the directors draw attention to Note E8 to the consolidated financial statements, which includes a statement of compliance with International Financial Reporting Standards. The Directors have been given the declarations by the CEO & Managing Director and Chief Financial Officer required by section 295A of the Corporations Act 2001. This declaration is made in accordance with a resolution of the Directors.
Cass O’Connor
Chair
24 August 2017
75
For
per
sona
l use
onl
y

Independent Auditor’s Report
To the shareholders of McGrath Limited
Report on the audit of the Financial Report
Opinion
We have audited the Financial Report of McGrath Limited (the Group).
In our opinion, the accompanying Financial Report of the Group is in accordance with the Corporations Act 2001, including:
Group’s financial position as at 30 June 2017 and of its financial performance for the year ended on that date; and
complying with Australian Accounting Standards and the Corporations Regulations 2001.
The Financial Report comprises: Consolidated statements of financial position as at
30 June 2017
Consolidated statements of profit or loss and other comprehensive income, Consolidated statement of changes in equity, and Consolidated statement of cash flows for the year then ended
Notes including a summary of significant accounting policies
Directors’ Declaration.
The Group consists of the Company and the entities it controlled at the year-end or from time to time during the financial year.
Basis for opinion
We conducted our audit in accordance with Australian Auditing Standards. We believe that the audit evidence we have obtained is sufficient and appropriate to provide a basis for our opinion.
Our responsibilities under those standards are further described in the Auditor’s responsibilities for the audit of the Financial Report section of our report.
We are independent of the Group in accordance with the Corporations Act 2001 and the ethical requirements of the Accounting Professional and Ethical Standards Board’s APES 110 Code of Ethics for Professional Accountants (the Code) that are relevant to our audit of the Financial Report in Australia. We have fulfilled our other ethical responsibilities in accordance with the Code.
76
For
per
sona
l use
onl
y

Key Audit Matters
The Key Audit Matters we identified are:
Carrying value of Goodwill
Recoverability of trade receivables from development projects
Key Audit Matters are those matters that, in our professional judgment, were of most significance in our audit of the Financial Report of the current period.
These matters were addressed in the context of our audit of the Financial Report as a whole, and in forming our opinion thereon, and we do not provide a separate opinion on these matters.
Carrying value of Goodwill
Refer to Note B3 to the Financial Report
The key audit matter How the matter was addressed in our audit
Carrying value of Goodwill allocated to the Company Owned Sales segment is a Key Audit Matter due to:
The level of judgement required by us in evaluating management’s assessment of impairment, particularly given:
- The market reduction of Real Estate listings year on year;
- The reduction of Company Owned Sales agent numbers during 2017; and
- McGrath is the only ASX listed Real Estate agency and therefore has no direct comparable entities to assess Weighted Average Cost of Capital (‘WACC’).
The size of the balance, being 54% of net assets at year end.
The Group has used the value in use method in assessing the carrying value of Goodwill. The value in use model includes the following significant judgements, which were the focus of our work:
5 Year cashflow forecast of the Company Owned Sales segment and growth rates
WACC and Terminal value rates
Our procedures included:
Performing stress testing on key growth rates, including agent numbers, to see by how much cashflows would have to deteriorate, before an impairment existed;
Obtaining an understanding of the budget setting and monitoring process used to develop the 5 year cashflow forecast;
Comparing previous actual results to prior period budgets to assess the accuracy of McGrath’s forecasting;
Assessing the 5 Year cash flow forecasts and growth rates, in particular the impact of downward trends in Real Estate listings, the timing of recovery and McGrath’s specific business. We discussed these features with management and compared them against our industry knowledge and experience as well as the Board approved budget for FY18; and
Working with our valuation specialists to compare the WACC and terminal value rates to entities of comparable size and nature of business / business model, such as broking services companies.
77
For
per
sona
l use
onl
y

Recoverability of trade receivables from development projects
Refer to Note B1 to the Financial Report
The key audit matter How the matter was addressed in our audit
Recoverability of trade receivables from development projects (‘Project debtors’) is a Key Audit Matter due to level of judgement required by us in assessing the likelihood of apartment development projects being completed within the sunset period (development risk) and the purchasers settling (sales risk).
Commission income from off-the-plan apartment sales is recognised on unconditional exchange, with payments due:
50% on unconditional exchange; and
50% on settlement.
The long timeframe between unconditional exchange and settlement gives rise to two types of recoverability risk, being from:
1) Sales risk: The risk that the buyer will not settle on the sale. This is influenced by availability of finance and property market movements between exchange and settlements;
2) Development risk: The risk that the developer will not complete the development, thereby invalidate the sale and expected recoverability of the associated trade receivable. This risk is influenced by the availability of project finance to the developer, pending achievement of pre-sales targets and delays in construction completion beyond the contract sunset date.
Assessing the conditions giving rise to these recoverability risks are our focus.
Our audit procedures included:
Recalculating a sample of trade receivables from development projects based on sales price in contract of exchange;
Obtaining an understanding of the company’s monitoring and analysis of the progress of apartment development such as status of sales, finance and construction, including the process for recognising and monitoring doubtful debt provisions for these project debtors;
Research industry data for identification of matters that could impact sales risk, such as market price deterioration. We compare this research to the Group’s judgements for consistency; and
Analysis of historical trends for recovery of off-the-plan apartment sales commission. We compare these trends to the Group’s judgements of future recovery, and our knowledge of current and forecasted industry trends.
Other Information
Other Information is financial and non-financial information in McGrath Limited’s annual reporting which is provided in addition to the Financial Report and the Auditor's Report. This includes the Letter from the Chairman, Letter from the CEO, Operating and Financial Review, Corporate
78
For
per
sona
l use
onl
y

Governance information, Directors’ Report and Remuneration Report. The Directors are responsible for the Other Information.
The Other Information we obtained prior to the date of this Auditor’s Report was the Operating and Financial Review, Corporate Governance information, Directors’ Report and Remuneration Report. The Letter from the Chairman and Letter from the CEO are expected to be made available to us after the date of the Auditor's Report.
Our opinion on the Financial Report does not cover the Other Information and, accordingly, we do not and will not express an audit opinion or any form of assurance conclusion thereon, with the exception of the Remuneration Report and our related assurance opinion.
In connection with our audit of the Financial Report, our responsibility is to read the Other Information. In doing so, we consider whether the Other Information is materially inconsistent with the Financial Report or our knowledge obtained in the audit, or otherwise appears to be materially misstated.
We are required to report if we conclude that there is a material misstatement of this Other Information, and based on the work we have performed on the Other Information that we obtained prior to the date of this Auditor’s Report we have nothing to report.
Responsibilities of the Directors for the Financial Report
The Directors are responsible for:
preparing the Financial Report that gives a true and fair view in accordance with Australian Accounting Standards and the Corporations Act 2001;
implementing necessary internal control to enable the preparation of a Financial Report that gives a true and fair view and is free from material misstatement, whether due to fraud or error; and
assessing the Group’s ability to continue as a going concern. This includes disclosing, as applicable, matters related to going concern and using the going concern basis of accounting unless they either intend to liquidate the Group or to cease operations, or have no realistic alternative but to do so.
Auditor’s responsibilities for the audit of the Financial Report
Our objective is:
to obtain reasonable assurance about whether the Financial Report as a whole is free from material misstatement, whether due to fraud or error; and
to issue an Auditor’s Report that includes our opinion.
Reasonable assurance is a high level of assurance, but is not a guarantee that an audit conducted in accordance with Australian Auditing Standards will always detect a material misstatement when it exists.
Misstatements can arise from fraud or error. They are considered material if, individually or in the aggregate, they could reasonably be expected to influence the economic decisions of users taken on the basis of this Financial Report.
A further description of our responsibilities for the audit of the Financial Report is located at the Auditing and Assurance Standards Board website at: http://www.auasb.gov.au/auditors_files/ar2.pdf. This description forms part of our Auditor’s Report.
79
For
per
sona
l use
onl
y

Report on the Remuneration Report
Opinion
In our opinion, the Remuneration Report of McGrath Limited for the year ended 30 June 2017, complies with Section 300A of the Corporations Act 2001.
Directors’ responsibilities
The Directors of the Company are responsible for the preparation and presentation of the Remuneration Report in accordance with Section 300A of the Corporations Act 2001.
Our responsibilities
We have audited the Remuneration Report included in pages 8 to 20 of the Annual Financial Report referenced to in the Director’s report for the year ended 30 June 2017.
Our responsibility is to express an opinion on the Remuneration Report, based on our Audit conducted in accordance with Australian Auditing Standards.
KPM_INI_01
KPMG Stuart Marshall Partner
Sydney 24 August 2017
80
For
per
sona
l use
onl
y

Shareholder information The information set out below was prepared at 29 September and applies to McGrath’s securities (ASX code: MEA). As at 29 September 2017 there were 143.3 million securities on issue.
Substantial shareholders As disclosed in substantial holding notices lodged with the ASX at 29 September 2017:
Shareholder Date of change
Number of shares
Percentage of issued equity %1
McGrath Limited 07/09/2017 10,000,000 7.18 Shane Smollen and entities controlled by him 8/12/2015 7,500,000 5,59 Perpetual Limited and subsidiaries 12/09/2017 19,722,700 14.16 John McGrath & Fondurru 07/09/2017 47,127,378 33.84 Argo Investments 12/09/2017 10,000,000 7.18 1 Percentage of issued equity held as at the date notice provided.
Range of shareholders
Range Number of holders Number of securities 1 to 1,000 612 353,606 1,001 to 5,000 824 2,590,877 5,001 to 10,000 498 4,114,020 10,001 to 100,000 596 17,594,073 100,001 and over 65 118,609,866 Total number of shareholders 2,595 143,262,442 Number of security holders holding less than a marketable parcel (being 820 securities at the closing market price of $0.61 on 29 September 2017):264.
20 largest shareholders (as of 29 September)
No. Shareholder Number of
shares Percentage of issued
equity % 1 Fondurru Pty Ltd 21,195,450 14.79 2 UBS Nominees Pty Ltd 15,750,058 11.06 3 John Damian McGrath 15,059,928 10.51 4 Smollen Property Pty Limited 12,413,085 8.66 5 Argo Investments Limited 10,000,000 6.98 6 JP Morgan Nominees Australia 7,253,821 5.06 7 HSBC Custody Nominees (Australia) Limited 6,493,102 4.53 8 Citicorp Nominees Pty Limited 5,269,263 3.68 9 The Rockshore Horizon Investment Company Pty Ltd 2,502,911 1.75 10 UBS Nominess Pty Ltd 2,476,526 1.73 11 Invia Custodian Pty Limited 2,308,653 1.61 12 Lindway Investments Pty Limited 1,238,000 0.86 13 Mr John Damian McGrath 872,000 0.61 14 Courntey Holdings Pty Ltd 827,539 0.58 14 Paranchi Investments Pty Ltd 827,539 0.58 14 Peter Chauncy Investments Pty Ltd 827,539 0.58 14 Vaughan Investment Group Pty 827,539 0.58 15 CAV & Associates Pty Ltd 780,468 0.54 16 CLK Consultancy Pty Ltd 697,218 0.49 16 Alexandra Stamatiou-Buda 597,218 0.49 17 CS Fourth Nominees Pty Limited 596,500 0.42 18 Sale-O Group Limited 551,318 0.38 19 Mr Junchen He 505,580 0.35 20 Dalelan Pty Limited 475,000 0.33 Top 20 holders of Shares 111,366,820 77.75 Balance of Shares 31,895,622 22.26 Total Shares on issue 143,262,442 100.00
8
For
per
sona
l use
onl
y

Shareholder information (continued) Voting rights Subject to the Constitutions of McGrath Limited and to any rights or restrictions for the time being attached to any class or classes of shares, units or stapled securities:
� on a show of hands, each Member present in person or by proxy, attorney, or representative has one vote; and� on a poll, each Member has:
> in the case of a resolution of McGrath Limited, one vote for each share in McGrath Limited held.
Restricted securities
Shareholders Number of
shares Escrow period Shane Smollen 7,500,000 Until 30 September 2017 Other Smollen Sellers 2,500,000 Until 30 September 2017 Total 10,000,000 -
8
For
per
sona
l use
onl
y

ACN: 608 153 779
DIRECTORS
Cass O’Connor Chair and Non-executive Director
John McGrath Executive Director
Elizabeth Crouch Independent Non-executive Director
Nigel Dews Independent Non-executive Director
Cath Rogers Independent Non-executive Director
CHIEF EXECUTIVE OFFICER Cameron Judson
COMPANY SECRETARY Morgan Sloper
REGISTERED OFFICE Address 191 New South Head Rd Edgecliff NSW 2027 Telephone +61 2 9386 3333 Website www.mcgrath.com.au
SHARE REGISTRY Address Link Market Services Limited Locked Bag A14 Sydney South NSW 1235 Telephone (Australia) 1300 554 474
Email [email protected] Website www.linkmarketservices.com.au
AUDITORS KPMG Tower Three International Towers Sydney 300 Barangaroo Avenue Sydney NSW 2000 Australia
83
STOCK EXCHANGE LISTING The shares of McGrath Limited are listed on the Australian Securities Exchange trading under the ASX Listing Code “MEA”.
Corporate Directory
For
per
sona
l use
onl
y

This page has been left intentionally blankF
or p
erso
nal u
se o
nly

This page has been left intentionally blankF
or p
erso
nal u
se o
nly

For
per
sona
l use
onl
y