for personal use only · auditor’s independence declaration 31 ... continued rigorous and...
TRANSCRIPT

ANNUAL FINANCIAL
REPORT30 JUNE 2016
CH
ALIC
E GO
LD M
INES LIM
ITED |
AN
NU
AL REPO
RT 20
16
CHALICE GOLD MINES LIMITEDABN 47 116 648 956
Chalice Gold Mines LimitedLevel 2, 1292 Hay Street
West Perth, Western Australia 6005
T (+618) 9322 3960
F (+618) 9322 5800
W chalicegold.com
For
per
sona
l use
onl
y
Corporate DirectoryChalice Gold Mines Limited Corporate Directory
Directors Anthony Kiernan Non-executive Chairman Timothy (Tim) Goyder Managing Director Stephen Quin Non-executive Director Morgan Ball Non-executive Director Company Secretary Leanne Stevens Principal Place of Business & Registered Office Level 2, 1292 Hay Street WEST PERTH WA 6005 Tel: (+61) (8) 9322 3960 Fax: (+61) (8) 9322 5800 Web: www.chalicegold.com Email: [email protected] Auditors HLB Mann Judd Level 4, 130 Stirling Street PERTH WESTERN AUSTRALIA 6000 Home Exchange Australian Securities Exchange Limited Level 40, Central Park 152-158 St Georges Terrace PERTH WESTERN AUSTRALIA 6000 Toronto Stock Exchange The Exchange Tower P.O Box 421 130 King Street West Toronto, Ontario M5X 1J2 Share Registry Australia Computershare Investor Services Pty Limited Level 11, 172 St Georges Terrace PERTH WESTERN AUSTRALIA 6000 Tel: 1300 787 272 Canada Computershare Investor Services 100 University Avenue, 8th Floor Toronto, Ontario M5J 2Y1 ASX Share Code: CHN TSX Share Code: CXN
For
per
sona
l use
onl
y

Contents
Chalice Gold Mines Limited Contents
Chairman’s letter 1
Operating and Financial Review 2
Tenement Schedules 8
Directors’ Report 15
Corporate Governance Statement 30
Auditor’s Independence Declaration 31
Consolidated Statement of Comprehensive Income 32
Consolidated Statement of Financial Position 33
Consolidated Statement of Changes in Equity 34
Consolidated Statement of Cash Flows 36
Notes to the Consolidated Financial Statements 37
Directors’ Declaration 68
Independent Auditor’s Report 69
ASX Additional Information 71
For
per
sona
l use
onl
y

1 CHALICE GOLD MINES | ANNUAL REPORT 2016
Chairman’s Letter
1
Chalice Gold Mines Limited Chairman’s letter Dear Shareholders
I am pleased to report to you on what has been a positive year for Chalice on several fronts. Achievements include the successful sale of the Cameron Gold Project in Ontario, Canada, to emerging North American gold development company First Mining Finance Corp, the continued rigorous and disciplined assessment of numerous cornerstone investment opportunities, and the establishment of a high-quality portfolio of exploration projects.
Since acquiring the Cameron Gold Project from Coventry Resources in 2014, the Company upgraded the Cameron resource, consolidated a regional tenement position and identified a number of promising targets both proximal to the deposit and regionally. As a result of the transaction with First Mining, the Company received 32.3 million shares in First Mining and a one percent Net Smelter Return royalty over certain exploration licences at Cameron. This transaction has allowed us to crystallise significant value from our investment in the Cameron Project, giving shareholders exposure both to First Mining’s diversified portfolio of advanced gold exploration projects in central and eastern Canada and the upside of the Cameron Project.
In addition to the Company’s cash balance of A$32 million and the current market value of the shares in First Mining of approximately A$26.4 million at the time of writing, our strong balance sheet provides the Company with an opportunity to deploy its capital at the lower end of the resource cycle.
The Board is committed to actively managing the Company’s capital requirements, and taking into account the Company’s cash backing per share, the Company announced a discretionary on-market share buy-back facility on 16 June 2016. To date, under the share buy-back facility, the Company has acquired 12.8 million shares for approximately $2.4 million.
We will continue to apply a disciplined and analytical approach in the search for new business development opportunities and, while this process has not yet resulted in a transaction that meets our investment criteria, we are determined to ensure that any such transaction provides shareholders with significant upside while minimizing risk.
With this in mind, the Board has endorsed a strategy whereby, in addition to targeting more advanced resource opportunities where Chalice’s capital could provide a funding solution to development assets, it will also allocate a small percentage of its overall funds to target high quality, high potential base and precious metal exploration assets, preferably in lower risk mining jurisdictions.
As a result of this strategy, Chalice has executed three exploration joint venture agreements in recent months – with Meteoric Resources, Red Hill Iron and Traka Resources. In combination, these three joint ventures have minimum obligations to spend A$2 million within approximately the next 12 months.
A disciplined assessment of exploration results at each key decision point will be made, ensuring that we remain focused on our exploration goals and upside potential – when we see the upside has diminished below our expectations, we will withdraw. With our in-house technical capability, Chalice is able to take advantage of these types of opportunities as they arise; however, we will not lose sight of our main objective of securing a cornerstone asset.
In conclusion, I would like to acknowledge the efforts and drive of our Managing Director, Tim Goyder – who has been relentless in the pursuit of adding value for shareholders – as well as the Board, management team and staff for their efforts. To our shareholders generally, thank you also for your ongoing support.
With a strong balance sheet, a highly skilled and disciplined team and a clear corporate strategy, I am confident that Chalice is well placed for growth and success at a time of renewed opportunity in the resource sector.
Kind Regards
Anthony (Tony) Kiernan Chairman
For
per
sona
l use
onl
y
CHALICE GOLD MINES | ANNUAL REPORT 2016 2
Operating and Financial Review
2
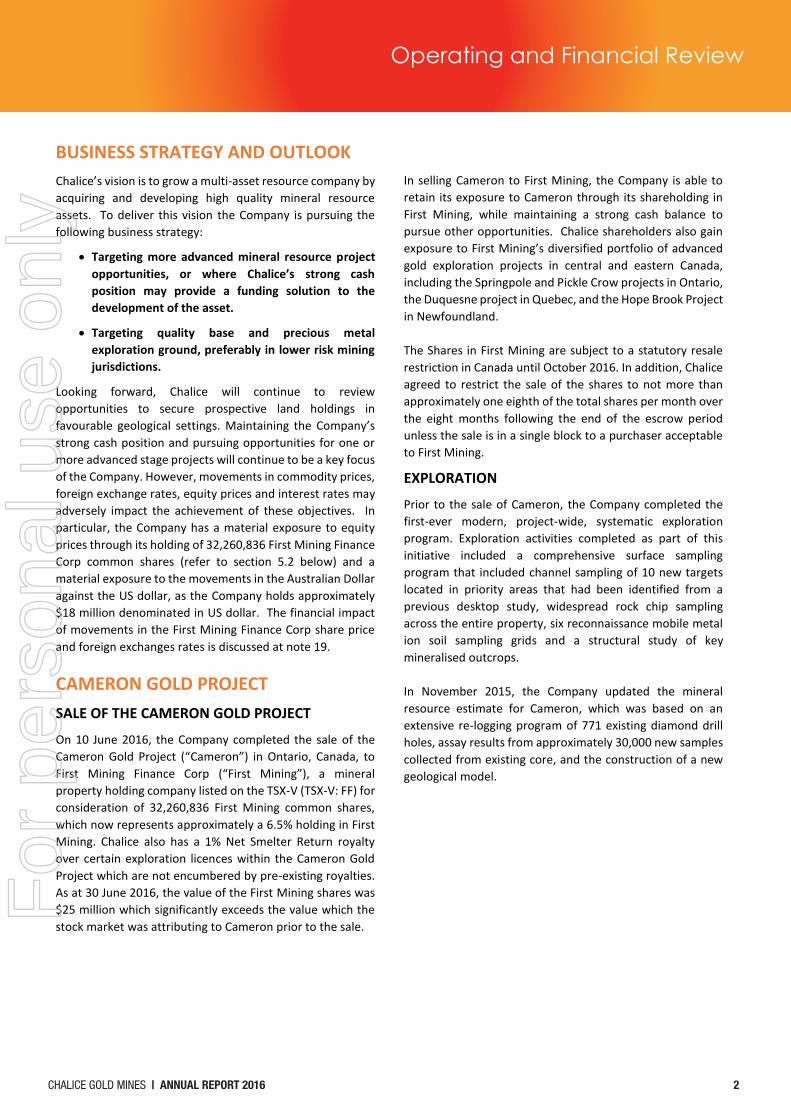
Operating and Financial Review BUSINESS STRATEGY AND OUTLOOK Chalice’s vision is to grow a multi-asset resource company by acquiring and developing high quality mineral resource assets. To deliver this vision the Company is pursuing the following business strategy:
Targeting more advanced mineral resource project opportunities, or where Chalice’s strong cash position may provide a funding solution to the development of the asset.
Targeting quality base and precious metal exploration ground, preferably in lower risk mining jurisdictions.
Looking forward, Chalice will continue to review opportunities to secure prospective land holdings in favourable geological settings. Maintaining the Company’s strong cash position and pursuing opportunities for one or more advanced stage projects will continue to be a key focus of the Company. However, movements in commodity prices, foreign exchange rates, equity prices and interest rates may adversely impact the achievement of these objectives. In particular, the Company has a material exposure to equity prices through its holding of 32,260,836 First Mining Finance Corp common shares (refer to section 5.2 below) and a material exposure to the movements in the Australian Dollar against the US dollar, as the Company holds approximately $18 million denominated in US dollar. The financial impact of movements in the First Mining Finance Corp share price and foreign exchanges rates is discussed at note 19.
CAMERON GOLD PROJECT SALE OF THE CAMERON GOLD PROJECT
On 10 June 2016, the Company completed the sale of the Cameron Gold Project (“Cameron”) in Ontario, Canada, to First Mining Finance Corp (“First Mining”), a mineral property holding company listed on the TSX-V (TSX-V: FF) for consideration of 32,260,836 First Mining common shares, which now represents approximately a 6.5% holding in First Mining. Chalice also has a 1% Net Smelter Return royalty over certain exploration licences within the Cameron Gold Project which are not encumbered by pre-existing royalties. As at 30 June 2016, the value of the First Mining shares was $25 million which significantly exceeds the value which the stock market was attributing to Cameron prior to the sale.
In selling Cameron to First Mining, the Company is able to retain its exposure to Cameron through its shareholding in First Mining, while maintaining a strong cash balance to pursue other opportunities. Chalice shareholders also gain exposure to First Mining’s diversified portfolio of advanced gold exploration projects in central and eastern Canada, including the Springpole and Pickle Crow projects in Ontario, the Duquesne project in Quebec, and the Hope Brook Project in Newfoundland. The Shares in First Mining are subject to a statutory resale restriction in Canada until October 2016. In addition, Chalice agreed to restrict the sale of the shares to not more than approximately one eighth of the total shares per month over the eight months following the end of the escrow period unless the sale is in a single block to a purchaser acceptable to First Mining.
EXPLORATION
Prior to the sale of Cameron, the Company completed the first-ever modern, project-wide, systematic exploration program. Exploration activities completed as part of this initiative included a comprehensive surface sampling program that included channel sampling of 10 new targets located in priority areas that had been identified from a previous desktop study, widespread rock chip sampling across the entire property, six reconnaissance mobile metal ion soil sampling grids and a structural study of key mineralised outcrops. In November 2015, the Company updated the mineral resource estimate for Cameron, which was based on an extensive re-logging program of 771 existing diamond drill holes, assay results from approximately 30,000 new samples collected from existing core, and the construction of a new geological model.
For
per
sona
l use
onl
y

3 CHALICE GOLD MINES | ANNUAL REPORT 2016
Operating and Financial ReviewOperating and Financial Review
3
WARREGO NORTH, NORTHERN TERRITORY, AUSTRALIA (RIGHT TO EARN A 70% INTEREST) In June 2016, Chalice secured rights to a prospective copper-gold exploration opportunity adjacent to the historic high-grade Warrego copper-gold mine in the Tennant Creek Mineral Field of the Northern Territory after entering into a farm-in agreement with Meteoric Resources NL (ASX: MEI) (“Meteoric”) owner of the Warrego North copper-gold project.
The farm-in agreement gives Chalice the right to earn up to a 70% interest by sole funding $800,000 in exploration expenditure. Chalice may earn an initial 51% by sole funding $400,000. Chalice is required to drill at least one diamond drill hole of at least 300m within 12 months before it can withdraw. The project contains several high-priority exploration targets that include prominent magnetic anomalies identified by aeromagnetic surveys, and
anomalous copper, bismuth and gold results from historical drilling. Chalice plans to undertake an initial 2-hole (800m) Reverse Circulation/diamond drilling program as soon as relevant government approvals are obtained to test the Parakeet target at depth (~300m depth). Drilling is targeted to test an overlapping magnetic and gravity inversion model where it is interpreted to intersect an apparent trend of anomalous low-grade copper-gold-bismuth mineralisation associated with typical Tennant Creek-style iron oxide copper gold alterations as defined from previous RC drilling results.
NEW EXPLORATION INITIATIVES As part of the Company’s strategy of identifying low-cost and potentially high-impact exploration opportunities in high-quality jurisdictions, Chalice has applied for extensive tenement positions in two of the world’s leading gold provinces, the Yilgarn Craton of Western Australia and the Abitibi terrane of the Superior Craton, eastern Canada. This exploration initiative is consistent with one of Chalice’s core strategies, which is to identify and pursue innovative and low-cost generative exploration opportunities with the potential to deliver significant upside. These opportunities, including the Warrego North farm-in deal, can be advanced without detracting from the Company’s focus of acquiring a substantial resource asset.
YILGARN CRATON, WESTERN AUSTRALIA
During year, the Company applied for 13 Exploration Licenses (“ELAs”) and 13 Prospecting Licenses (“PLAs”) in the Western Australian goldfields. These tenements are grouped into 10 projects for a total of 1,480km2 under application in three main regions in the Yilgarn Craton, Western Australia. Chalice is currently reviewing previous exploration on the areas covered by the tenement applications with a view to being able to initiate field work when the applications are granted. The tenement applications cover areas with indications of gold anomalism in the surface sampling datasets, and inferred extensions and trends in other Western Australia Mineral Exploration GIS datasets (“WAMEX”) – including geology, aeromagnetic, regolith mapping and digital drill collar-only location datasets.
Figure 2: Parakeet target showing previous drilling and interpreted
mineralised structure on a TMI image.
Figure 1: Location map of Warrego North Project (EL23764) in the
Tennant Creek Mineral Field
For
per
sona
l use
onl
y

CHALICE GOLD MINES | ANNUAL REPORT 2016 4
Operating and Financial ReviewOperating and Financial Review
4 Figure 4: Simplified geology of the Abitibi terrane showing location of new staking area in Quebec, Canada
ABITIBI TERRANE, QUÉBEC, CANADA In June 2016, the Company staked a contiguous block of 303 claims totalling 16,930ha and extending over a 30km strike length of the Casa Berardi fault in the northern Abitibi terrane of the Superior Province. The land package is located between several significant gold deposits and was selected as an area which is considered prospective for orogenic gold mineralisation. The geological attributes of this part of the Casa Beradi faults are interpreted to indicate a prospective setting for orogenic gold mineralisation including: (i) a significant bend in a late tectonic fault; (ii) preserved Timiskaming-type sediments in one or more fault panels; (iii) proximity to late tectonic intrusions; and (iv) proximity to historical gold deposits and occurrences.
In late July, the Company commenced a first-pass reconnaissance surface mapping, rock chip sampling and a soil sampling program. Results from this program are expected in the second quarter of the 2017 financial year.
Figure 3: Location plan of tenement applications, Yilgarn Craton,
Western Australia
Figure 5 & 6: Reconnaissance surface mapping, rock chip sampling and
soil sampling program at the Kinebik Project, Quebec Canada.
Operating and Financial Review
4 Figure 4: Simplified geology of the Abitibi terrane showing location of new staking area in Quebec, Canada
ABITIBI TERRANE, QUÉBEC, CANADA In June 2016, the Company staked a contiguous block of 303 claims totalling 16,930ha and extending over a 30km strike length of the Casa Berardi fault in the northern Abitibi terrane of the Superior Province. The land package is located between several significant gold deposits and was selected as an area which is considered prospective for orogenic gold mineralisation. The geological attributes of this part of the Casa Beradi faults are interpreted to indicate a prospective setting for orogenic gold mineralisation including: (i) a significant bend in a late tectonic fault; (ii) preserved Timiskaming-type sediments in one or more fault panels; (iii) proximity to late tectonic intrusions; and (iv) proximity to historical gold deposits and occurrences.
In late July, the Company commenced a first-pass reconnaissance surface mapping, rock chip sampling and a soil sampling program. Results from this program are expected in the second quarter of the 2017 financial year.
Figure 3: Location plan of tenement applications, Yilgarn Craton,
Western Australia
Figure 5 & 6: Reconnaissance surface mapping, rock chip sampling and
soil sampling program at the Kinebik Project, Quebec Canada.
For
per
sona
l use
onl
y
5 CHALICE GOLD MINES | ANNUAL REPORT 2016
Operating and Financial ReviewOperating and Financial Review
5
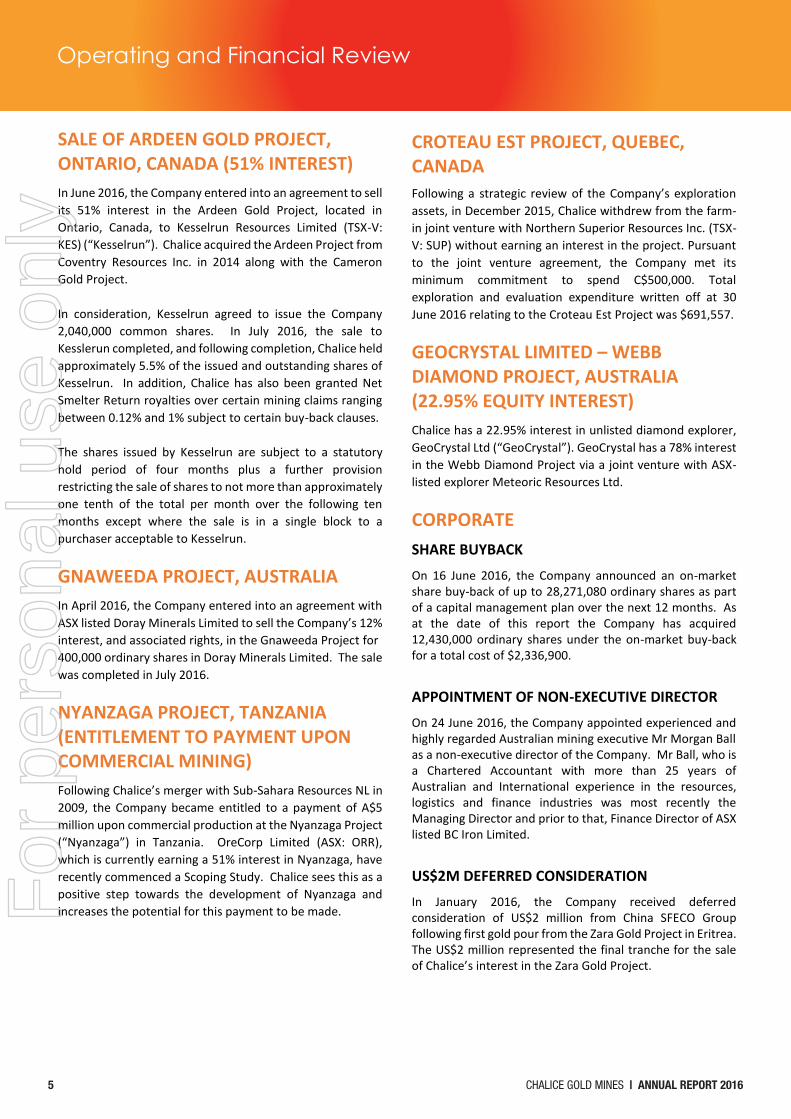
SALE OF ARDEEN GOLD PROJECT, ONTARIO, CANADA (51% INTEREST) In June 2016, the Company entered into an agreement to sell its 51% interest in the Ardeen Gold Project, located in Ontario, Canada, to Kesselrun Resources Limited (TSX-V: KES) (“Kesselrun”). Chalice acquired the Ardeen Project from Coventry Resources Inc. in 2014 along with the Cameron Gold Project. In consideration, Kesselrun agreed to issue the Company 2,040,000 common shares. In July 2016, the sale to Kesslerun completed, and following completion, Chalice held approximately 5.5% of the issued and outstanding shares of Kesselrun. In addition, Chalice has also been granted Net Smelter Return royalties over certain mining claims ranging between 0.12% and 1% subject to certain buy-back clauses. The shares issued by Kesselrun are subject to a statutory hold period of four months plus a further provision restricting the sale of shares to not more than approximately one tenth of the total per month over the following ten months except where the sale is in a single block to a purchaser acceptable to Kesselrun.
GNAWEEDA PROJECT, AUSTRALIA In April 2016, the Company entered into an agreement with ASX listed Doray Minerals Limited to sell the Company’s 12% interest, and associated rights, in the Gnaweeda Project for 400,000 ordinary shares in Doray Minerals Limited. The sale was completed in July 2016.
NYANZAGA PROJECT, TANZANIA (ENTITLEMENT TO PAYMENT UPON COMMERCIAL MINING) Following Chalice’s merger with Sub-Sahara Resources NL in 2009, the Company became entitled to a payment of A$5 million upon commercial production at the Nyanzaga Project (“Nyanzaga”) in Tanzania. OreCorp Limited (ASX: ORR), which is currently earning a 51% interest in Nyanzaga, have recently commenced a Scoping Study. Chalice sees this as a positive step towards the development of Nyanzaga and increases the potential for this payment to be made.
CROTEAU EST PROJECT, QUEBEC, CANADA Following a strategic review of the Company’s exploration assets, in December 2015, Chalice withdrew from the farm-in joint venture with Northern Superior Resources Inc. (TSX-V: SUP) without earning an interest in the project. Pursuant to the joint venture agreement, the Company met its minimum commitment to spend C$500,000. Total exploration and evaluation expenditure written off at 30 June 2016 relating to the Croteau Est Project was $691,557.
GEOCRYSTAL LIMITED – WEBB DIAMOND PROJECT, AUSTRALIA (22.95% EQUITY INTEREST) Chalice has a 22.95% interest in unlisted diamond explorer, GeoCrystal Ltd (“GeoCrystal”). GeoCrystal has a 78% interest in the Webb Diamond Project via a joint venture with ASX-listed explorer Meteoric Resources Ltd.
CORPORATE SHARE BUYBACK On 16 June 2016, the Company announced an on-market share buy-back of up to 28,271,080 ordinary shares as part of a capital management plan over the next 12 months. As at the date of this report the Company has acquired 12,430,000 ordinary shares under the on-market buy-back for a total cost of $2,336,900.
APPOINTMENT OF NON-EXECUTIVE DIRECTOR On 24 June 2016, the Company appointed experienced and highly regarded Australian mining executive Mr Morgan Ball as a non-executive director of the Company. Mr Ball, who is a Chartered Accountant with more than 25 years of Australian and International experience in the resources, logistics and finance industries was most recently the Managing Director and prior to that, Finance Director of ASX listed BC Iron Limited.
US$2M DEFERRED CONSIDERATION In January 2016, the Company received deferred consideration of US$2 million from China SFECO Group following first gold pour from the Zara Gold Project in Eritrea. The US$2 million represented the final tranche for the sale of Chalice’s interest in the Zara Gold Project.
For
per
sona
l use
onl
y

CHALICE GOLD MINES | ANNUAL REPORT 2016 6
Operating and Financial ReviewOperating and Financial Review
6
TSX DELISTING REVIEW Following the sale of the Cameron Gold Project, the Toronto Stock Exchange (“TSX”) commenced a review on the ordinary shares of the Company in respect to its continued listing requirements of the TSX. The TSX will normally require that, following a change in business (i.e. the sale of the Cameron Gold Project), the relevant company will need to continue to meet its original listing requirements, which in the Company’s case included the ownership of Cameron, an advanced mineral property. However as noted, this project is now sold. The Company was granted 120 days in which to regain compliance with these requirements, pursuant to the TSX’s Remedial Review Process. If the Company does not regain compliance by 12 October 2016, the Company’s securities may be delisted from the TSX 30 days from that date. The TSX review does not impact the Company’s listing on the ASX.
FINANCIAL PERFORMANCE The Group reported a net gain after income tax of $7.4 million for the year compared to a net gain of $0.3 million for the year ended 30 June 2015. This increase of $7.1 million is largely related to net profit from discontinued operations of $13.1 million (i.e. the sale of Cameron) which is offset by income tax expense ($1.4 million), corporate administrative expenses ($1.3 million), business development and project acquisition costs ($1.4 million) and exploration and evaluation assets written off ($2.2 million). The $0.9 million net foreign exchange gain (2015: net gain of $4.9 million) resulted from the impact of movements in the Australian Dollar against the US Dollar on the Company’s US Dollar cash balances. Corporate administrative expenses of $1.3 million (2015: $2.0 million) decreased due to the inclusion of termination and redundancy payments made during 2015 of $0.6 million. Aside from these payments, corporate administrative expenses decreased significantly due to a concerted effort to reduce overheads.
STATEMENT OF CASH FLOWS
Cash and cash equivalents at 30 June 2016 were $35.7 million (30 June 2015: $39.9 million). The reduction in cash of $4.2 million is predominately due to:
exploration costs of $5.2 million; $1.4 million being spent on business development
activities related to assessing and reviewing projects for acquisition or investment; and
costs associated with the sale of the Cameron Gold Project of $0.5 million.
These items are offset by the deferred consideration of $2.9 million (US$2 million) received from China SFECO Group from the sale of the Zara Project in Eritrea that took place in 2012. In comparison to the 2015 financial year, net cash flows used in operating activities decreased by 44% from $1.6 million in 2015 to $0.9 million. Net cash flows from investing activities decreased by 41% from a net outflow of $7.1 million in 2015 to a net outflow of $4.2 million in 2016. This was primarily due to the receipt of the deferred consideration of $2.9 million as noted above. Net cash used in financing activities decreased by $0.5 million (100%) as there were no financing related activities during the year. The effect of exchange rates on cash and cash equivalents at 30 June 2016 was a gain of $0.9 million (2015: gain of $4.9 million). The Company held approximately US$18 million in US$ denominated bank accounts at 30 June 2016 (30 June 2015: US$27 million).
FINANCIAL POSITION At balance date the Group had net assets of $61.5 million and an excess of current assets over current liabilities of $61.1 million. Current assets increased by 54% to $61.9 million (2015: $40.1 million) mainly due to the receipt of 32,260,836 common shares in First Mining received in consideration for the sale of Cameron. The value of the First Mining shares at 30 June 2016 was $25,421,978, based on a closing share price of C$0.76 and converted to Australian Dollars using an exchange rate of A$1:C$0.9644. Cash and cash equivalents decreased by 10.5% to $35.7 million (2015: $39.9 million). Refer to the statement of cash flows discussion above for further details regarding the movements in the 2016 cash balance. Non-current assets decreased by 89% to $1.7 million (2015: $16.5 million), as a result of the sale of Cameron which reduced exploration and evaluation assets by $15.8 million. Current liabilities decreased by 22% to $0.7 million (2015: $0.9 million) mainly due to the reduction in net tax payable at 30 June 2016. Non-current liabilities increased due to the recognition of a deferred tax liability in respect of the sale of the Cameron Gold Project in 2016.
For
per
sona
l use
onl
y

7 CHALICE GOLD MINES | ANNUAL REPORT 2016
7
COMPETENT PERSON AND QUALIFYING PERSON STATEMENTS The information in this report that relates to the Yilgarn Craton and Abitibi Terrane Projects is extracted from the announcement entitled “Chalice advances gold exploration initiatives in Australia and Canada” dated 4 July 2016 and the information that relates to the Warrego North Project is extracted from the announcement entitled “Chalice secures prospective copper-gold exploration opportunity in Tenant Creek Mineral Field, Northern Territory” dated 15 June 2016. Both announcements are available to view on www.chalicegold.com. The Company confirms that it is not aware of any new information or data that materially affects the information included in the original market announcements and that all material assumptions in the market announcement continue to apply and have not materially changed. The Company confirms that the form and context in which the Competent Person’s and Qualifying Persons findings are presented have not been materially modified from the original market announcement.
FORWARD LOOKING STATEMENTS This financial report may contain forward-looking information within the meaning of Canadian securities legislation and forward-looking statements within the meaning of the United States Private Securities Litigation Reform Act of 1995 (collectively, forward-looking statements). These forward-looking statements are made as of the date of this report and Chalice Gold Mines Limited (the Company) does not intend, and does not assume any obligation, to update these forward-looking statements.
Forward-looking statements relate to future events or future performance and reflect Company management’s expectations or beliefs regarding future events and include, but are not limited to, the results of business development activities which may result in a corporate transaction or investment, the actual number of shares and price which may be purchased pursuant to the share buy-back, the future share price performance of First Mining Finance Corp, Kesselrun Resources and Doray Minerals, the likelihood of exploration success, the timing and amount of estimated future production, costs of production, capital expenditures, success of mining operations, environmental risks, unanticipated reclamation expenses, title disputes or claims and limitations on insurance coverage.
In certain cases, forward-looking statements can be identified by the use of words such as plans, expects or does not expect, is expected, will, may would, budget, scheduled, estimates, forecasts, intends, anticipates or does not anticipate, or believes, or variations of such words and phrases or statements that certain actions, events or results may, could, would, might or will be taken, occur or be achieved or the negative of these terms or comparable terminology. By their very nature forward-looking statements involve known and unknown risks, uncertainties and other factors which may cause the actual results, performance or achievements of the Company to be materially different from any future results, performance or achievements expressed or implied by the forward-looking statements. Such factors may include, among others, risks related to actual results of current exploration activities; changes in project parameters as plans continue to be refined; future prices of mineral resources; possible variations in mineral resources or ore reserves, grade or recovery rates; accidents, labour disputes and other risks of the mining industry; delays in obtaining governmental approvals or financing or in the completion of development or construction activities; as well as those factors detailed from time to time in the Company’s interim and annual financial statements, all of which are filed and available for review on SEDAR at sedar.com. Although the Company has attempted to identify important factors that could cause actual actions, events or results to differ materially from those described in forward-looking statements, there may be other factors that cause actions, events or results not to be as anticipated, estimated or intended. There can be no assurance that forward-looking statements will prove to be accurate, as actual results and future events could differ materially from those anticipated in such statements.
Accordingly, readers should not place undue reliance on forward-looking statements
For
per
sona
l use
onl
y

CHALICE GOLD MINES | ANNUAL REPORT 2016 8
Tenement Schedules
8
Tenement Schedules
AUSTRALIA
Location Project Tenement No./Claim No.
Registered holder Nature of interest
Western Australia E37/1250 CGM (WA) Pty Ltd
100% E39/1914
E77/2353 E77/2354
P39/5600 P39/5601
Northern Territory Warrego North EL23764 Meteoric Resources NL 0% - farm-in agreement, right to earn up to 51% interest or 70% as applicable.
Western Australia West Pilbara E08/1227 Red Hill Iron Limited – 40% API Management Pty Ltd – 60%
0% - farm-in agreement, right to earn up to 51% interest or 70% as applicable ( in all minerals other than iron ore).
E08/1283
E08/1289 E08/1293
E08/1294 E08/1295
E08/1430 E08/1473
E08/1516 E08/1537
E47/1141 E47/1693
Western Australia Latitude Hill ELA69/2817 Traka Resources Limited (application holder)
0% - farm-in agreement, right to earn up to 51% interest or 70% as applicable
ELA69/2610 ELA69/2592 ELA69/3421 ELA69/3399
CANADA
Location Project Claim Number Registered Holder Nature of interest Quebec Kinebik 2448108 Chalice Gold Mines (Quebec) Inc. 100% Quebec Kinebik 2448109 Chalice Gold Mines (Quebec) Inc. 100% Quebec Kinebik 2448110 Chalice Gold Mines (Quebec) Inc. 100% Quebec Kinebik 2448111 Chalice Gold Mines (Quebec) Inc. 100% Quebec Kinebik 2448112 Chalice Gold Mines (Quebec) Inc. 100% Quebec Kinebik 2448113 Chalice Gold Mines (Quebec) Inc. 100% Quebec Kinebik 2448114 Chalice Gold Mines (Quebec) Inc. 100% Quebec Kinebik 2448115 Chalice Gold Mines (Quebec) Inc. 100% Quebec Kinebik 2448116 Chalice Gold Mines (Quebec) Inc. 100% Quebec Kinebik 2448117 Chalice Gold Mines (Quebec) Inc. 100% Quebec Kinebik 2448118 Chalice Gold Mines (Quebec) Inc. 100% Quebec Kinebik 2448119 Chalice Gold Mines (Quebec) Inc. 100% Quebec Kinebik 2448120 Chalice Gold Mines (Quebec) Inc. 100% Quebec Kinebik 2448121 Chalice Gold Mines (Quebec) Inc. 100% Quebec Kinebik 2448122 Chalice Gold Mines (Quebec) Inc. 100% Quebec Kinebik 2448123 Chalice Gold Mines (Quebec) Inc. 100%
For
per
sona
l use
onl
y

9 CHALICE GOLD MINES | ANNUAL REPORT 2016
9
Location Project Claim Number Registered Holder Nature of interest Quebec Kinebik 2448124 Chalice Gold Mines (Quebec) Inc. 100% Quebec Kinebik 2448125 Chalice Gold Mines (Quebec) Inc. 100% Quebec Kinebik 2448126 Chalice Gold Mines (Quebec) Inc. 100% Quebec Kinebik 2448127 Chalice Gold Mines (Quebec) Inc. 100% Quebec Kinebik 2448128 Chalice Gold Mines (Quebec) Inc. 100% Quebec Kinebik 2448129 Chalice Gold Mines (Quebec) Inc. 100% Quebec Kinebik 2448130 Chalice Gold Mines (Quebec) Inc. 100% Quebec Kinebik 2448131 Chalice Gold Mines (Quebec) Inc. 100% Quebec Kinebik 2448132 Chalice Gold Mines (Quebec) Inc. 100% Quebec Kinebik 2448133 Chalice Gold Mines (Quebec) Inc. 100% Quebec Kinebik 2448134 Chalice Gold Mines (Quebec) Inc. 100% Quebec Kinebik 2448135 Chalice Gold Mines (Quebec) Inc. 100% Quebec Kinebik 2448136 Chalice Gold Mines (Quebec) Inc. 100% Quebec Kinebik 2448137 Chalice Gold Mines (Quebec) Inc. 100% Quebec Kinebik 2448138 Chalice Gold Mines (Quebec) Inc. 100% Quebec Kinebik 2448139 Chalice Gold Mines (Quebec) Inc. 100% Quebec Kinebik 2448140 Chalice Gold Mines (Quebec) Inc. 100% Quebec Kinebik 2448141 Chalice Gold Mines (Quebec) Inc. 100% Quebec Kinebik 2448142 Chalice Gold Mines (Quebec) Inc. 100% Quebec Kinebik 2448143 Chalice Gold Mines (Quebec) Inc. 100% Quebec Kinebik 2448144 Chalice Gold Mines (Quebec) Inc. 100% Quebec Kinebik 2448145 Chalice Gold Mines (Quebec) Inc. 100% Quebec Kinebik 2448146 Chalice Gold Mines (Quebec) Inc. 100% Quebec Kinebik 2448147 Chalice Gold Mines (Quebec) Inc. 100% Quebec Kinebik 2448148 Chalice Gold Mines (Quebec) Inc. 100% Quebec Kinebik 2448149 Chalice Gold Mines (Quebec) Inc. 100% Quebec Kinebik 2448150 Chalice Gold Mines (Quebec) Inc. 100% Quebec Kinebik 2448151 Chalice Gold Mines (Quebec) Inc. 100% Quebec Kinebik 2448152 Chalice Gold Mines (Quebec) Inc. 100% Quebec Kinebik 2448153 Chalice Gold Mines (Quebec) Inc. 100% Quebec Kinebik 2448154 Chalice Gold Mines (Quebec) Inc. 100% Quebec Kinebik 2448155 Chalice Gold Mines (Quebec) Inc. 100% Quebec Kinebik 2448156 Chalice Gold Mines (Quebec) Inc. 100% Quebec Kinebik 2448157 Chalice Gold Mines (Quebec) Inc. 100% Quebec Kinebik 2448158 Chalice Gold Mines (Quebec) Inc. 100% Quebec Kinebik 2448159 Chalice Gold Mines (Quebec) Inc. 100% Quebec Kinebik 2448160 Chalice Gold Mines (Quebec) Inc. 100% Quebec Kinebik 2448161 Chalice Gold Mines (Quebec) Inc. 100% Quebec Kinebik 2448162 Chalice Gold Mines (Quebec) Inc. 100% Quebec Kinebik 2448163 Chalice Gold Mines (Quebec) Inc. 100% Quebec Kinebik 2448164 Chalice Gold Mines (Quebec) Inc. 100% Quebec Kinebik 2448165 Chalice Gold Mines (Quebec) Inc. 100% Quebec Kinebik 2448166 Chalice Gold Mines (Quebec) Inc. 100% Quebec Kinebik 2448167 Chalice Gold Mines (Quebec) Inc. 100% Quebec Kinebik 2448168 Chalice Gold Mines (Quebec) Inc. 100% Quebec Kinebik 2448169 Chalice Gold Mines (Quebec) Inc. 100% Quebec Kinebik 2448170 Chalice Gold Mines (Quebec) Inc. 100% Quebec Kinebik 2448171 Chalice Gold Mines (Quebec) Inc. 100% Quebec Kinebik 2448172 Chalice Gold Mines (Quebec) Inc. 100% Quebec Kinebik 2448173 Chalice Gold Mines (Quebec) Inc. 100% Quebec Kinebik 2448174 Chalice Gold Mines (Quebec) Inc. 100%
Tenement SchedulesF
or p
erso
nal u
se o
nly

CHALICE GOLD MINES | ANNUAL REPORT 2016 10
Tenement Schedules
10
Location Project Claim Number Registered Holder Nature of interest Quebec Kinebik 2448175 Chalice Gold Mines (Quebec) Inc. 100% Quebec Kinebik 2448176 Chalice Gold Mines (Quebec) Inc. 100% Quebec Kinebik 2448177 Chalice Gold Mines (Quebec) Inc. 100% Quebec Kinebik 2448178 Chalice Gold Mines (Quebec) Inc. 100% Quebec Kinebik 2448179 Chalice Gold Mines (Quebec) Inc. 100% Quebec Kinebik 2448180 Chalice Gold Mines (Quebec) Inc. 100% Quebec Kinebik 2448181 Chalice Gold Mines (Quebec) Inc. 100% Quebec Kinebik 2448182 Chalice Gold Mines (Quebec) Inc. 100% Quebec Kinebik 2448183 Chalice Gold Mines (Quebec) Inc. 100% Quebec Kinebik 2448184 Chalice Gold Mines (Quebec) Inc. 100% Quebec Kinebik 2448185 Chalice Gold Mines (Quebec) Inc. 100% Quebec Kinebik 2448186 Chalice Gold Mines (Quebec) Inc. 100% Quebec Kinebik 2448187 Chalice Gold Mines (Quebec) Inc. 100% Quebec Kinebik 2448188 Chalice Gold Mines (Quebec) Inc. 100% Quebec Kinebik 2448189 Chalice Gold Mines (Quebec) Inc. 100% Quebec Kinebik 2448190 Chalice Gold Mines (Quebec) Inc. 100% Quebec Kinebik 2448191 Chalice Gold Mines (Quebec) Inc. 100% Quebec Kinebik 2448192 Chalice Gold Mines (Quebec) Inc. 100% Quebec Kinebik 2448193 Chalice Gold Mines (Quebec) Inc. 100% Quebec Kinebik 2448194 Chalice Gold Mines (Quebec) Inc. 100% Quebec Kinebik 2448195 Chalice Gold Mines (Quebec) Inc. 100% Quebec Kinebik 2448196 Chalice Gold Mines (Quebec) Inc. 100% Quebec Kinebik 2448197 Chalice Gold Mines (Quebec) Inc. 100% Quebec Kinebik 2448198 Chalice Gold Mines (Quebec) Inc. 100% Quebec Kinebik 2448199 Chalice Gold Mines (Quebec) Inc. 100% Quebec Kinebik 2448200 Chalice Gold Mines (Quebec) Inc. 100% Quebec Kinebik 2448201 Chalice Gold Mines (Quebec) Inc. 100% Quebec Kinebik 2448202 Chalice Gold Mines (Quebec) Inc. 100% Quebec Kinebik 2448203 Chalice Gold Mines (Quebec) Inc. 100% Quebec Kinebik 2448204 Chalice Gold Mines (Quebec) Inc. 100% Quebec Kinebik 2448205 Chalice Gold Mines (Quebec) Inc. 100% Quebec Kinebik 2448206 Chalice Gold Mines (Quebec) Inc. 100% Quebec Kinebik 2448207 Chalice Gold Mines (Quebec) Inc. 100% Quebec Kinebik 2448409 Chalice Gold Mines (Quebec) Inc. 100% Quebec Kinebik 2448410 Chalice Gold Mines (Quebec) Inc. 100% Quebec Kinebik 2448411 Chalice Gold Mines (Quebec) Inc. 100% Quebec Kinebik 2448412 Chalice Gold Mines (Quebec) Inc. 100% Quebec Kinebik 2448413 Chalice Gold Mines (Quebec) Inc. 100% Quebec Kinebik 2448414 Chalice Gold Mines (Quebec) Inc. 100% Quebec Kinebik 2448415 Chalice Gold Mines (Quebec) Inc. 100% Quebec Kinebik 2448416 Chalice Gold Mines (Quebec) Inc. 100% Quebec Kinebik 2448417 Chalice Gold Mines (Quebec) Inc. 100% Quebec Kinebik 2448418 Chalice Gold Mines (Quebec) Inc. 100% Quebec Kinebik 2448419 Chalice Gold Mines (Quebec) Inc. 100% Quebec Kinebik 2448420 Chalice Gold Mines (Quebec) Inc. 100% Quebec Kinebik 2448421 Chalice Gold Mines (Quebec) Inc. 100% Quebec Kinebik 2448422 Chalice Gold Mines (Quebec) Inc. 100% Quebec Kinebik 2448423 Chalice Gold Mines (Quebec) Inc. 100% Quebec Kinebik 2448424 Chalice Gold Mines (Quebec) Inc. 100% Quebec Kinebik 2448425 Chalice Gold Mines (Quebec) Inc. 100% Quebec Kinebik 2448426 Chalice Gold Mines (Quebec) Inc. 100%
For
per
sona
l use
onl
y
11 CHALICE GOLD MINES | ANNUAL REPORT 2016
Tenement Schedules
11
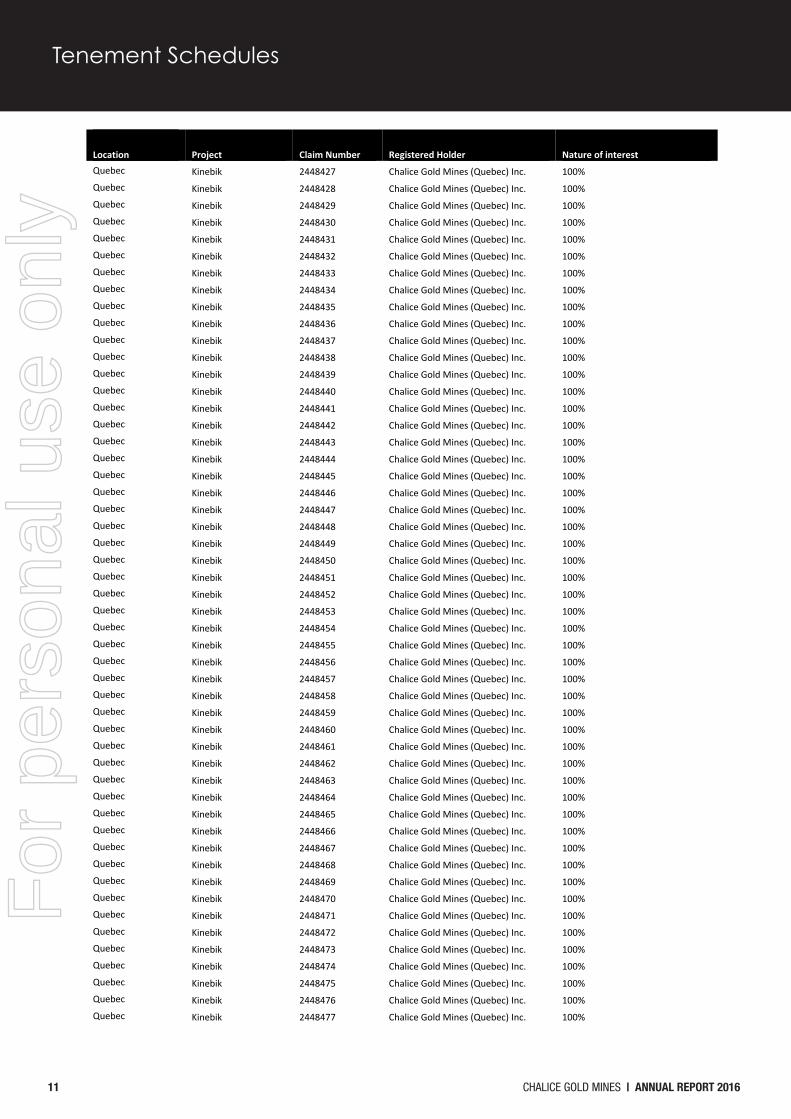
Location Project Claim Number Registered Holder Nature of interest Quebec Kinebik 2448427 Chalice Gold Mines (Quebec) Inc. 100% Quebec Kinebik 2448428 Chalice Gold Mines (Quebec) Inc. 100% Quebec Kinebik 2448429 Chalice Gold Mines (Quebec) Inc. 100% Quebec Kinebik 2448430 Chalice Gold Mines (Quebec) Inc. 100% Quebec Kinebik 2448431 Chalice Gold Mines (Quebec) Inc. 100% Quebec Kinebik 2448432 Chalice Gold Mines (Quebec) Inc. 100% Quebec Kinebik 2448433 Chalice Gold Mines (Quebec) Inc. 100% Quebec Kinebik 2448434 Chalice Gold Mines (Quebec) Inc. 100% Quebec Kinebik 2448435 Chalice Gold Mines (Quebec) Inc. 100% Quebec Kinebik 2448436 Chalice Gold Mines (Quebec) Inc. 100% Quebec Kinebik 2448437 Chalice Gold Mines (Quebec) Inc. 100% Quebec Kinebik 2448438 Chalice Gold Mines (Quebec) Inc. 100% Quebec Kinebik 2448439 Chalice Gold Mines (Quebec) Inc. 100% Quebec Kinebik 2448440 Chalice Gold Mines (Quebec) Inc. 100% Quebec Kinebik 2448441 Chalice Gold Mines (Quebec) Inc. 100% Quebec Kinebik 2448442 Chalice Gold Mines (Quebec) Inc. 100% Quebec Kinebik 2448443 Chalice Gold Mines (Quebec) Inc. 100% Quebec Kinebik 2448444 Chalice Gold Mines (Quebec) Inc. 100% Quebec Kinebik 2448445 Chalice Gold Mines (Quebec) Inc. 100% Quebec Kinebik 2448446 Chalice Gold Mines (Quebec) Inc. 100% Quebec Kinebik 2448447 Chalice Gold Mines (Quebec) Inc. 100% Quebec Kinebik 2448448 Chalice Gold Mines (Quebec) Inc. 100% Quebec Kinebik 2448449 Chalice Gold Mines (Quebec) Inc. 100% Quebec Kinebik 2448450 Chalice Gold Mines (Quebec) Inc. 100% Quebec Kinebik 2448451 Chalice Gold Mines (Quebec) Inc. 100% Quebec Kinebik 2448452 Chalice Gold Mines (Quebec) Inc. 100% Quebec Kinebik 2448453 Chalice Gold Mines (Quebec) Inc. 100% Quebec Kinebik 2448454 Chalice Gold Mines (Quebec) Inc. 100% Quebec Kinebik 2448455 Chalice Gold Mines (Quebec) Inc. 100% Quebec Kinebik 2448456 Chalice Gold Mines (Quebec) Inc. 100% Quebec Kinebik 2448457 Chalice Gold Mines (Quebec) Inc. 100% Quebec Kinebik 2448458 Chalice Gold Mines (Quebec) Inc. 100% Quebec Kinebik 2448459 Chalice Gold Mines (Quebec) Inc. 100% Quebec Kinebik 2448460 Chalice Gold Mines (Quebec) Inc. 100% Quebec Kinebik 2448461 Chalice Gold Mines (Quebec) Inc. 100% Quebec Kinebik 2448462 Chalice Gold Mines (Quebec) Inc. 100% Quebec Kinebik 2448463 Chalice Gold Mines (Quebec) Inc. 100% Quebec Kinebik 2448464 Chalice Gold Mines (Quebec) Inc. 100% Quebec Kinebik 2448465 Chalice Gold Mines (Quebec) Inc. 100% Quebec Kinebik 2448466 Chalice Gold Mines (Quebec) Inc. 100% Quebec Kinebik 2448467 Chalice Gold Mines (Quebec) Inc. 100% Quebec Kinebik 2448468 Chalice Gold Mines (Quebec) Inc. 100% Quebec Kinebik 2448469 Chalice Gold Mines (Quebec) Inc. 100% Quebec Kinebik 2448470 Chalice Gold Mines (Quebec) Inc. 100% Quebec Kinebik 2448471 Chalice Gold Mines (Quebec) Inc. 100% Quebec Kinebik 2448472 Chalice Gold Mines (Quebec) Inc. 100% Quebec Kinebik 2448473 Chalice Gold Mines (Quebec) Inc. 100% Quebec Kinebik 2448474 Chalice Gold Mines (Quebec) Inc. 100% Quebec Kinebik 2448475 Chalice Gold Mines (Quebec) Inc. 100% Quebec Kinebik 2448476 Chalice Gold Mines (Quebec) Inc. 100% Quebec Kinebik 2448477 Chalice Gold Mines (Quebec) Inc. 100%
For
per
sona
l use
onl
y

CHALICE GOLD MINES | ANNUAL REPORT 2016 12
Tenement Schedules
12
Location Project Claim Number Registered Holder Nature of interest Quebec Kinebik 2448478 Chalice Gold Mines (Quebec) Inc. 100% Quebec Kinebik 2448479 Chalice Gold Mines (Quebec) Inc. 100% Quebec Kinebik 2448480 Chalice Gold Mines (Quebec) Inc. 100% Quebec Kinebik 2448481 Chalice Gold Mines (Quebec) Inc. 100% Quebec Kinebik 2448482 Chalice Gold Mines (Quebec) Inc. 100% Quebec Kinebik 2448483 Chalice Gold Mines (Quebec) Inc. 100% Quebec Kinebik 2448484 Chalice Gold Mines (Quebec) Inc. 100% Quebec Kinebik 2448485 Chalice Gold Mines (Quebec) Inc. 100% Quebec Kinebik 2448486 Chalice Gold Mines (Quebec) Inc. 100% Quebec Kinebik 2448487 Chalice Gold Mines (Quebec) Inc. 100% Quebec Kinebik 2448488 Chalice Gold Mines (Quebec) Inc. 100% Quebec Kinebik 2448489 Chalice Gold Mines (Quebec) Inc. 100% Quebec Kinebik 2448490 Chalice Gold Mines (Quebec) Inc. 100% Quebec Kinebik 2448491 Chalice Gold Mines (Quebec) Inc. 100% Quebec Kinebik 2448492 Chalice Gold Mines (Quebec) Inc. 100% Quebec Kinebik 2448493 Chalice Gold Mines (Quebec) Inc. 100% Quebec Kinebik 2448494 Chalice Gold Mines (Quebec) Inc. 100% Quebec Kinebik 2448495 Chalice Gold Mines (Quebec) Inc. 100% Quebec Kinebik 2448496 Chalice Gold Mines (Quebec) Inc. 100% Quebec Kinebik 2448497 Chalice Gold Mines (Quebec) Inc. 100% Quebec Kinebik 2449277 Chalice Gold Mines (Quebec) Inc. 100% Quebec Kinebik 2449278 Chalice Gold Mines (Quebec) Inc. 100% Quebec Kinebik 2449279 Chalice Gold Mines (Quebec) Inc. 100% Quebec Kinebik 2449280 Chalice Gold Mines (Quebec) Inc. 100% Quebec Kinebik 2449281 Chalice Gold Mines (Quebec) Inc. 100% Quebec Kinebik 2449282 Chalice Gold Mines (Quebec) Inc. 100% Quebec Kinebik 2449283 Chalice Gold Mines (Quebec) Inc. 100% Quebec Kinebik 2449284 Chalice Gold Mines (Quebec) Inc. 100% Quebec Kinebik 2449285 Chalice Gold Mines (Quebec) Inc. 100% Quebec Kinebik 2449286 Chalice Gold Mines (Quebec) Inc. 100% Quebec Kinebik 2449287 Chalice Gold Mines (Quebec) Inc. 100% Quebec Kinebik 2449288 Chalice Gold Mines (Quebec) Inc. 100% Quebec Kinebik 2449289 Chalice Gold Mines (Quebec) Inc. 100% Quebec Kinebik 2449290 Chalice Gold Mines (Quebec) Inc. 100% Quebec Kinebik 2449291 Chalice Gold Mines (Quebec) Inc. 100% Quebec Kinebik 2449292 Chalice Gold Mines (Quebec) Inc. 100% Quebec Kinebik 2449293 Chalice Gold Mines (Quebec) Inc. 100% Quebec Kinebik 2449294 Chalice Gold Mines (Quebec) Inc. 100% Quebec Kinebik 2449295 Chalice Gold Mines (Quebec) Inc. 100% Quebec Kinebik 2449296 Chalice Gold Mines (Quebec) Inc. 100% Quebec Kinebik 2449297 Chalice Gold Mines (Quebec) Inc. 100% Quebec Kinebik 2449298 Chalice Gold Mines (Quebec) Inc. 100% Quebec Kinebik 2449299 Chalice Gold Mines (Quebec) Inc. 100% Quebec Kinebik 2449300 Chalice Gold Mines (Quebec) Inc. 100% Quebec Kinebik 2449301 Chalice Gold Mines (Quebec) Inc. 100% Quebec Kinebik 2449302 Chalice Gold Mines (Quebec) Inc. 100% Quebec Kinebik 2449303 Chalice Gold Mines (Quebec) Inc. 100% Quebec Kinebik 2449304 Chalice Gold Mines (Quebec) Inc. 100% Quebec Kinebik 2449305 Chalice Gold Mines (Quebec) Inc. 100% Quebec Kinebik 2449306 Chalice Gold Mines (Quebec) Inc. 100% Quebec Kinebik 2449307 Chalice Gold Mines (Quebec) Inc. 100%
For
per
sona
l use
onl
y

13 CHALICE GOLD MINES | ANNUAL REPORT 2016
Tenement Schedules
13
Location Project Claim Number Registered Holder Nature of interest Quebec Kinebik 2449308 Chalice Gold Mines (Quebec) Inc. 100% Quebec Kinebik 2449309 Chalice Gold Mines (Quebec) Inc. 100% Quebec Kinebik 2449310 Chalice Gold Mines (Quebec) Inc. 100% Quebec Kinebik 2449311 Chalice Gold Mines (Quebec) Inc. 100% Quebec Kinebik 2449312 Chalice Gold Mines (Quebec) Inc. 100% Quebec Kinebik 2449313 Chalice Gold Mines (Quebec) Inc. 100% Quebec Kinebik 2449314 Chalice Gold Mines (Quebec) Inc. 100% Quebec Kinebik 2449315 Chalice Gold Mines (Quebec) Inc. 100% Quebec Kinebik 2449316 Chalice Gold Mines (Quebec) Inc. 100% Quebec Kinebik 2449317 Chalice Gold Mines (Quebec) Inc. 100% Quebec Kinebik 2449318 Chalice Gold Mines (Quebec) Inc. 100% Quebec Kinebik 2449319 Chalice Gold Mines (Quebec) Inc. 100% Quebec Kinebik 2449320 Chalice Gold Mines (Quebec) Inc. 100% Quebec Kinebik 2449321 Chalice Gold Mines (Quebec) Inc. 100% Quebec Kinebik 2449322 Chalice Gold Mines (Quebec) Inc. 100% Quebec Kinebik 2449323 Chalice Gold Mines (Quebec) Inc. 100% Quebec Kinebik 2449324 Chalice Gold Mines (Quebec) Inc. 100% Quebec Kinebik 2449325 Chalice Gold Mines (Quebec) Inc. 100% Quebec Kinebik 2449326 Chalice Gold Mines (Quebec) Inc. 100% Quebec Kinebik 2449327 Chalice Gold Mines (Quebec) Inc. 100% Quebec Kinebik 2449328 Chalice Gold Mines (Quebec) Inc. 100% Quebec Kinebik 2449329 Chalice Gold Mines (Quebec) Inc. 100% Quebec Kinebik 2449330 Chalice Gold Mines (Quebec) Inc. 100% Quebec Kinebik 2449331 Chalice Gold Mines (Quebec) Inc. 100% Quebec Kinebik 2449332 Chalice Gold Mines (Quebec) Inc. 100% Quebec Kinebik 2449333 Chalice Gold Mines (Quebec) Inc. 100% Quebec Kinebik 2449334 Chalice Gold Mines (Quebec) Inc. 100% Quebec Kinebik 2449335 Chalice Gold Mines (Quebec) Inc. 100% Quebec Kinebik 2449336 Chalice Gold Mines (Quebec) Inc. 100% Quebec Kinebik 2449337 Chalice Gold Mines (Quebec) Inc. 100% Quebec Kinebik 2449338 Chalice Gold Mines (Quebec) Inc. 100% Quebec Kinebik 2449339 Chalice Gold Mines (Quebec) Inc. 100% Quebec Kinebik 2449340 Chalice Gold Mines (Quebec) Inc. 100% Quebec Kinebik 2449341 Chalice Gold Mines (Quebec) Inc. 100% Quebec Kinebik 2449342 Chalice Gold Mines (Quebec) Inc. 100% Quebec Kinebik 2449343 Chalice Gold Mines (Quebec) Inc. 100% Quebec Kinebik 2449344 Chalice Gold Mines (Quebec) Inc. 100% Quebec Kinebik 2449345 Chalice Gold Mines (Quebec) Inc. 100% Quebec Kinebik 2449346 Chalice Gold Mines (Quebec) Inc. 100% Quebec Kinebik 2449347 Chalice Gold Mines (Quebec) Inc. 100% Quebec Kinebik 2449348 Chalice Gold Mines (Quebec) Inc. 100% Quebec Kinebik 2449349 Chalice Gold Mines (Quebec) Inc. 100% Quebec Kinebik 2449350 Chalice Gold Mines (Quebec) Inc. 100% Quebec Kinebik 2449351 Chalice Gold Mines (Quebec) Inc. 100% Quebec Kinebik 2449352 Chalice Gold Mines (Quebec) Inc. 100% Quebec Kinebik 2449353 Chalice Gold Mines (Quebec) Inc. 100% Quebec Kinebik 2449354 Chalice Gold Mines (Quebec) Inc. 100% Quebec Kinebik 2449355 Chalice Gold Mines (Quebec) Inc. 100% Quebec Kinebik 2449356 Chalice Gold Mines (Quebec) Inc. 100% Quebec Kinebik 2449357 Chalice Gold Mines (Quebec) Inc. 100% Quebec Kinebik 2449358 Chalice Gold Mines (Quebec) Inc. 100%
For
per
sona
l use
onl
y

CHALICE GOLD MINES | ANNUAL REPORT 2016 14
Tenement Schedules
14
Location Project Claim Number Registered Holder Nature of interest Quebec Kinebik 2449359 Chalice Gold Mines (Quebec) Inc. 100% Quebec Kinebik 2449360 Chalice Gold Mines (Quebec) Inc. 100% Quebec Kinebik 2449361 Chalice Gold Mines (Quebec) Inc. 100% Quebec Kinebik 2449362 Chalice Gold Mines (Quebec) Inc. 100% Quebec Kinebik 2449363 Chalice Gold Mines (Quebec) Inc. 100% Quebec Kinebik 2449364 Chalice Gold Mines (Quebec) Inc. 100% Quebec Kinebik 2449365 Chalice Gold Mines (Quebec) Inc. 100% Quebec Kinebik 2449366 Chalice Gold Mines (Quebec) Inc. 100% Quebec Kinebik 2449367 Chalice Gold Mines (Quebec) Inc. 100% Quebec Kinebik 2449368 Chalice Gold Mines (Quebec) Inc. 100% Quebec Kinebik 2449369 Chalice Gold Mines (Quebec) Inc. 100% Quebec Kinebik 2449370 Chalice Gold Mines (Quebec) Inc. 100% Quebec Kinebik 2449371 Chalice Gold Mines (Quebec) Inc. 100% Quebec Kinebik 2449372 Chalice Gold Mines (Quebec) Inc. 100% Quebec Kinebik 2449373 Chalice Gold Mines (Quebec) Inc. 100% Quebec Kinebik 2449374 Chalice Gold Mines (Quebec) Inc. 100% Quebec Kinebik 2449375 Chalice Gold Mines (Quebec) Inc. 100% Quebec Kinebik 2454112 Chalice Gold Mines (Quebec) Inc. 100% Quebec Kinebik 2454113 Chalice Gold Mines (Quebec) Inc. 100% Quebec Kinebik 2454308 Chalice Gold Mines (Quebec) Inc. 100% Quebec Kinebik 2454309 Chalice Gold Mines (Quebec) Inc. 100% Quebec Kinebik 2454310 Chalice Gold Mines (Quebec) Inc. 100% Quebec Kinebik 2454311 Chalice Gold Mines (Quebec) Inc. 100% Quebec Kinebik 2454312 Chalice Gold Mines (Quebec) Inc. 100% Quebec Kinebik 2454313 Chalice Gold Mines (Quebec) Inc. 100% Quebec Kinebik 2454314 Chalice Gold Mines (Quebec) Inc. 100% Quebec Kinebik 2454315 Chalice Gold Mines (Quebec) Inc. 100% Quebec Kinebik 2454316 Chalice Gold Mines (Quebec) Inc. 100% Quebec Kinebik 2454317 Chalice Gold Mines (Quebec) Inc. 100% Quebec Kinebik 2454318 Chalice Gold Mines (Quebec) Inc. 100% Quebec Kinebik 2454319 Chalice Gold Mines (Quebec) Inc. 100% Quebec Kinebik 2454320 Chalice Gold Mines (Quebec) Inc. 100%
For
per
sona
l use
onl
y

15 CHALICE GOLD MINES | ANNUAL REPORT 2016
Directors’ Report
15
Chalice Gold Mines Limited Directors’ Report The Directors present their report together with the financial report of Chalice Gold Mines Limited (‘Chalice’ or ‘the Company’) and its subsidiaries (together ‘the Group’) for the financial year ended 30 June 2016 and the independent auditor’s report thereon. The names and details of the Company’s directors in office during the financial year and until the date of this report are as follows. Directors were in office for the entire period unless otherwise stated.
1. DIRECTORS
Anthony (Tony) W Kiernan LLB Non-executive Chairman
Tony, previously a practising lawyer, is a corporate advisor with extensive experience in the administration and operation of listed public companies. He is the Chairman of BC Iron Limited, Pilbara Minerals Limited, Venturex Resources Limited and is a director of Danakali Limited (previously South Boulder Mines Limited), all listed on ASX. During the past three years, Tony was a director of ASX listed Uranium Equities Limited and Liontown Resources Limited. Tony was appointed Chairman on 10 October 2014, and previously held the position of Non-executive Director. Tony is a member of the Audit Committee and Chairman of the Remuneration Committee and has been a director since 2007 (9 years).
Timothy (Tim) R B Goyder Managing Director
Tim has considerable experience in the resource industry as an executive and investor. He has been involved in the formation and management of a number of publicly-listed and private companies and is currently Chairman of Uranium Equities Limited and Liontown Resources Limited, both listed on ASX. During the past three years Tim also served as a director of Strike Energy Limited. Tim has been a director since 2005 (11 years) and was appointed Managing Director on 10 October 2014. Tim previously held the position of Executive Chairman.
Stephen P Quin PGeo, FGAC, FSEG, MIOM3 Independent Non-executive Director
Stephen is a geologist with over 35 years’ experience in the mining and exploration industry. Stephen is based in Vancouver, Canada, and has been the President & CEO of Midas Gold Corp. and its predecessor since January 2011. Stephen was previously President and COO of TSX listed copper producer Capstone Mining Corp. and, up until its merger with Capstone, President and CEO of TSX listed copper producer Sherwood Copper Corp. Prior to joining Sherwood, Stephen spent 18 years as Vice President and subsequently Executive Vice President of TSX listed Miramar Mining Corporation, a Canadian focused gold producer and developer. Stephen has extensive experience in the resources sector, and in the financing, development and operation of production companies. Stephen is a member of the Audit Committee and Remuneration Committee and has been an independent non-executive director since 2010 (6 years).
Morgan S Ball B.Com, CA, FFin Independent Non-executive Director
Morgan is a Chartered Accountant with more than 25 years of Australian and international experience in the resources, logistics and finance industries. During the past three years, Morgan was Managing Director, and prior to that Finance Director of ASX listed BC Iron Limited. Morgan is Chairman of the Audit Committee and a member of the Remuneration Committee and was appointed to the Board as an independent non-executive director on 24 June 2016.
For
per
sona
l use
onl
y
CHALICE GOLD MINES | ANNUAL REPORT 2016 16
Directors’ ReportChalice Gold Mines Limited Directors’ Report
16
2. CHIEF FINANCIAL OFFICER AND COMPANY SECRETARY
Richard K Hacker B.Com, ACA, ACIS Chief Financial Officer
Richard is a Chartered Accountant and Chartered Secretary with over 20 years of professional and corporate experience in the energy and resources sector in Australia and the United Kingdom. Richard has previously worked in senior finance roles with global energy companies including Woodside Petroleum Limited and Centrica Plc. Prior to this, Richard was in private practice with major accounting practices. Richard is a director of ASX listed Uranium Equities Limited.
Leanne Stevens B.Com, CA, ACIS Company Secretary
Leanne is a Chartered Accountant and Chartered Secretary who has 13 years of accounting and governance experience within the mining and energy industries. Leanne is also Company Secretary of ASX listed Liontown Resources Limited. Leanne has been Company Secretary of Chalice since 2012.
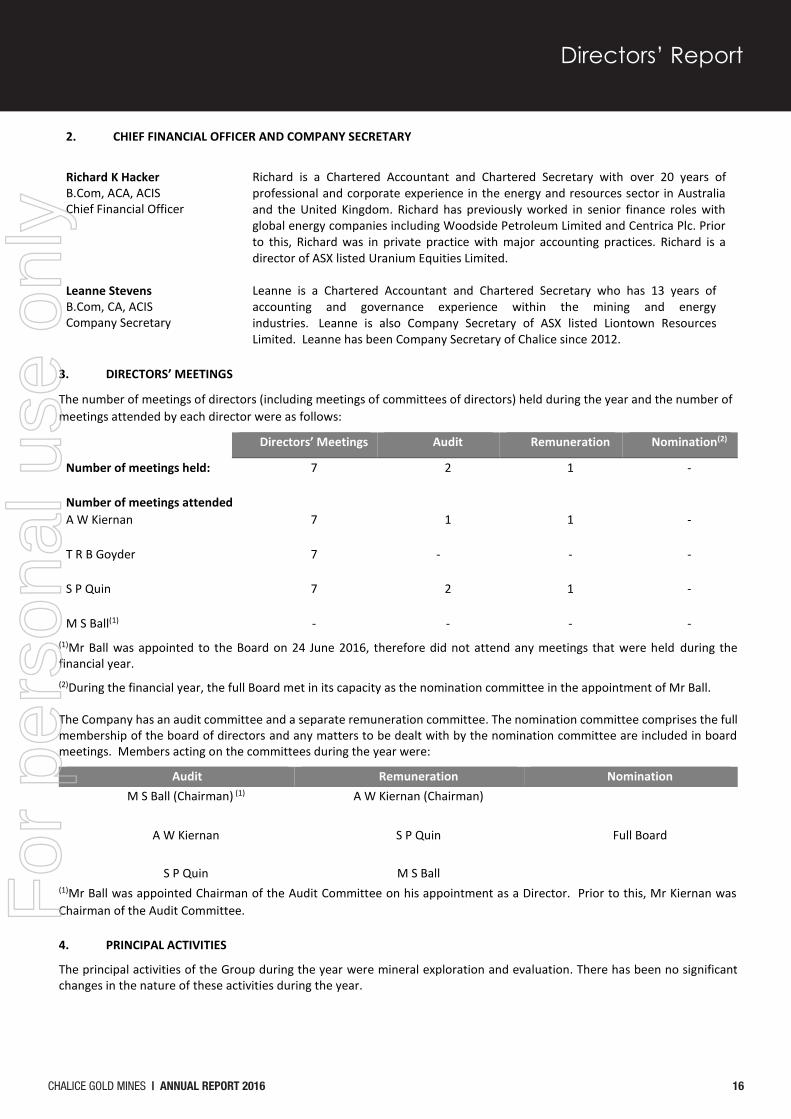
3. DIRECTORS’ MEETINGS
The number of meetings of directors (including meetings of committees of directors) held during the year and the number of meetings attended by each director were as follows:
Directors’ Meetings Audit Remuneration Nomination(2)
Number of meetings held: 7 2 1 - Number of meetings attended:
A W Kiernan 7 1 1 - T R B Goyder 7 - - - S P Quin 7 2 1 - M S Ball(1) - - - -
(1)Mr Ball was appointed to the Board on 24 June 2016, therefore did not attend any meetings that were held during the financial year. (2)During the financial year, the full Board met in its capacity as the nomination committee in the appointment of Mr Ball.
The Company has an audit committee and a separate remuneration committee. The nomination committee comprises the full membership of the board of directors and any matters to be dealt with by the nomination committee are included in board meetings. Members acting on the committees during the year were:
Audit Remuneration Nomination M S Ball (Chairman) (1) A W Kiernan (Chairman)
A W Kiernan S P Quin Full Board
S P Quin M S Ball
(1)Mr Ball was appointed Chairman of the Audit Committee on his appointment as a Director. Prior to this, Mr Kiernan was Chairman of the Audit Committee.
4. PRINCIPAL ACTIVITIES
The principal activities of the Group during the year were mineral exploration and evaluation. There has been no significant changes in the nature of these activities during the year.
For
per
sona
l use
onl
y
17 CHALICE GOLD MINES | ANNUAL REPORT 2016
Directors’ ReportChalice Gold Mines Limited Directors’ Report
17
5. OPERATING AND FINANCIAL REVIEW
The directors of Chalice Gold Mines Limited present the Operating and Financial Review of the Group, prepared in accordance with section 299A of the Corporations Act 2001 for the year ended 30 June 2016. The information provided in this review forms part of the Directors’ Report and provides information to assist users in assessing the operations, financial position and business strategies of the Group. Please refer to page 2 for further details.
6. SIGNIFICANT CHANGES IN STATE OF AFFAIRS
Other than the progress documented above, the state of affairs of the Company was not affected by any other significant changes during the year. 7. REMUNERATION REPORT – AUDITED
This report for the year ended 30 June 2016 outlines remuneration arrangements in place for directors and executives of Chalice Gold Mines Limited in accordance with the requirements of the Corporations Act 2001 (the “Act”) and its regulations. This information has been audited as required by section 308 (3C) of the Act. 7.1 Message from the Board
The Company’s remuneration policy is structured to ensure it is aligned to the business strategy, shareholder interests and to ensure effective executive remuneration and retention. These objectives are designed to be achieved through the Company’s short term and long term incentive plans which link the achievement of these objectives to the variable compensation of the Managing Director and staff. Further details are provided in this report. 7.2 Introduction
The remuneration report details the remuneration arrangements for Key Management Personnel (‘KMP’) who are defined as those individuals who have the authority and responsibility for planning, directing and controlling the activities of the Company and the Group directly or indirectly. The following were the KMP for the Group at any time during the year:
Anthony Kiernan Chairman Tim Goyder Managing Director Stephen Quin Non-executive Director Morgan Ball Non-executive Director (appointed 24 June 2016) Gary Snow Chief Operating Officer (resigned 18 March 2016) Richard Hacker Chief Financial Officer Kevin Frost General Manager – Exploration (appointed 1 March 2016)
There were no changes in KMP after the reporting date and before the financial report was authorised for issue. 7.3 Principles of compensation
7.3.1 Remuneration governance
Remuneration committee
The Board is responsible for ensuring Chalice’s remuneration strategy is aligned with Company performance and shareholder interests and is equitable for participants. To assist with this, the Board has established a Remuneration Committee consisting of the following directors:
Anthony Kiernan (Chairman) Stephen Quin Morgan Ball (appointed 24 June 2016)
The Remuneration Committee has delegated decision-making authority for some matters related to the remuneration arrangements for KMP, and is required to make recommendations to the Board on other matters.
Specifically, the Board approves the remuneration arrangements of the Managing Director and other executives including awards made under the Short Term Incentive Plan (“STIP”) and Employee Long Term Incentive Plan (“ELTIP”), following recommendations from the Remuneration Committee. The Board also sets the aggregate fee pool for Non-executive Directors (“NED”) (which is subject to shareholder approval) and NED fee levels.
For
per
sona
l use
onl
y
CHALICE GOLD MINES | ANNUAL REPORT 2016 18
Directors’ ReportChalice Gold Mines Limited Directors’ Report
18
The Remuneration Committee meets through the year when appropriate. The Managing Director may attend certain Remuneration Committee meetings by invitation, where management input is required. The Managing Director is not present during any discussions related to his own remuneration arrangements.
Further information on the Remuneration Committee’s role, responsibilities and membership can be seen at www.chalicegold.com. Use of remuneration consultants
To ensure the Remuneration Committee is fully informed when making remuneration decisions, the Remuneration Committee may seek external advice, as it requires, on remuneration policies and practices. Remuneration consultants are able to be engaged by, and report directly to, the Committee. In selecting remuneration consultants, the Committee would consider potential conflicts of interest and independence from the Group’s key management personnel and other executives. During the financial year, the Remuneration Committee did not seek specific advice or recommendations from external consultants. Remuneration report approval at 2015 Annual General Meeting
The Remuneration Report for the financial year ended 30 June 2015 received positive shareholder support at the 2015 Annual General Meeting (‘AGM’) with a vote of 99.4% in favour.
7.3.2 Remuneration principles and components of remuneration
The Company has adopted the following principles in its remuneration framework:
1. Seeking aggregate remuneration at a level which provides the Company with the ability to attract and retain directors and executives of high calibre at a cost which is acceptable to shareholders; and
2. Key management personnel interest being aligned with shareholder value and Company performance by:
providing fair, consistent and competitive compensation and rewards to attract and retain appropriate employees;
ensuring that total remuneration is competitive with its peers by market standards; incorporating in the remuneration framework both short and long term incentives linked to the strategic goals
and performance of the individuals and the Company and shareholder returns; demonstrating a clear relationship between individual performance and remuneration; and motivating employees to pursue and achieve the long term growth and success of the Company.
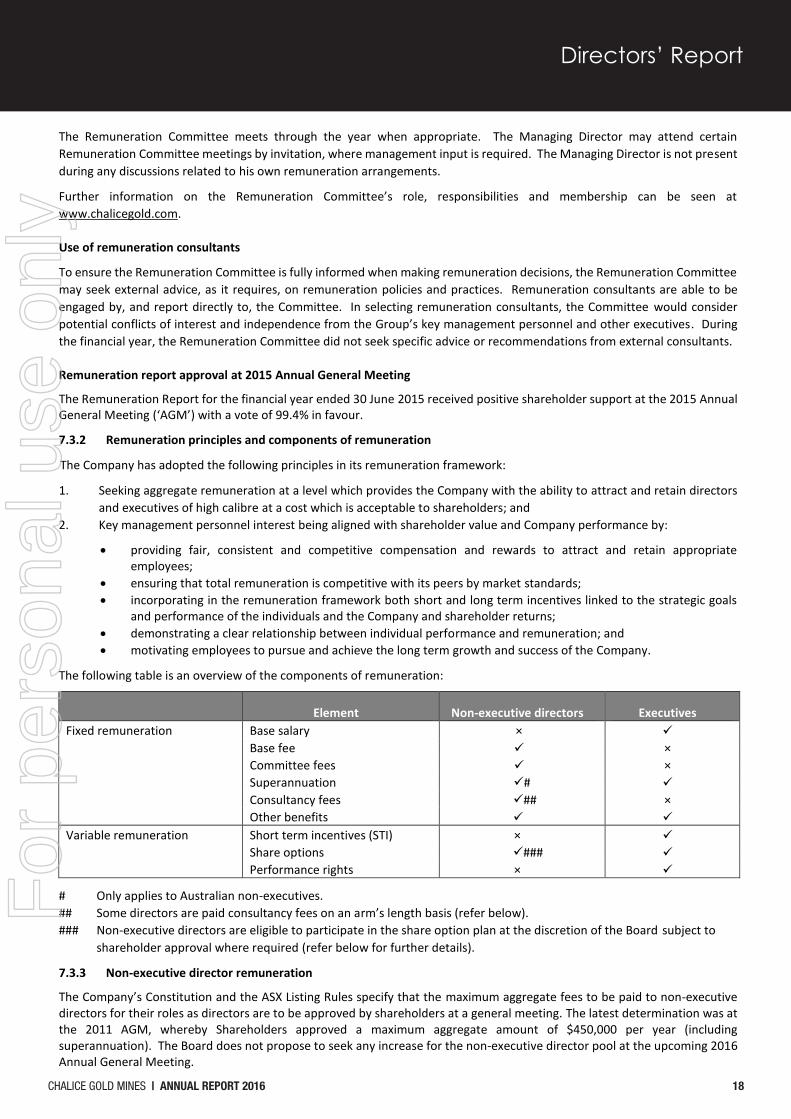
The following table is an overview of the components of remuneration:
Element Non-executive directors Executives
Fixed remuneration Base salary × Base fee × Committee fees × Superannuation # Consultancy fees ## × Other benefits
Variable remuneration Short term incentives (STI) × Share options ### Performance rights ×
# Only applies to Australian non-executives. ## Some directors are paid consultancy fees on an arm’s length basis (refer below). ### Non-executive directors are eligible to participate in the share option plan at the discretion of the Board subject to
shareholder approval where required (refer below for further details).
7.3.3 Non-executive director remuneration
The Company’s Constitution and the ASX Listing Rules specify that the maximum aggregate fees to be paid to non-executive directors for their roles as directors are to be approved by shareholders at a general meeting. The latest determination was at the 2011 AGM, whereby Shareholders approved a maximum aggregate amount of $450,000 per year (including superannuation). The Board does not propose to seek any increase for the non-executive director pool at the upcoming 2016 Annual General Meeting.
For
per
sona
l use
onl
y

19 CHALICE GOLD MINES | ANNUAL REPORT 2016
Directors’ ReportChalice Gold Mines Limited Directors’ Report
19
The fee structure for non-executive directors is reviewed annually and the Remuneration Committee and the Board may consider advice from external consultants, and undertake comparative analyses of the fees paid to non-executive directors of comparable companies in the resources sector with similar market capitalisations. Generally, the Company will position itself within the 50th and 75th percentile band of the comparative market data.
For the 2016 financial year, a non-executive director (excluding the Chairman) receives a fee of $60,000 (inclusive of superannuation, where applicable) and the Chairman receives a fee of $80,000 (inclusive of superannuation). Members of the Audit Committee and Remuneration Committee also receive an additional $5,000 (inclusive of superannuation) for their roles on each of those Committees. The additional payments recognise the additional time commitment by non-executive directors who serve on committees.
The non-executive directors are not entitled to receive retirement benefits. Non-executive directors, at the discretion of the Board, may participate in the Employee Share Option Plan (“ESOP”), subject to approvals required by shareholders. The Board is conscious of the issue of share options to non-executive directors and will continue to balance the cost benefit of issuing share options to attract and retain quality directors against paying higher fixed directors’ fees.
Non-executive directors are not eligible to participate in the Company’s Long Term Incentive Plan (“LTIP”).
Apart from their duties as directors, non-executive directors may undertake additional work for the Company on a consultancy basis on market terms. The use of consultancy by non-executive directors in addition to their duties as directors enables the Company to better utilise the skills offered by the Board particularly in light of the Company’s current small management team. Under the terms of these consultancy agreements, non-executive directors typically receive a daily rate or monthly retainer for the work performed at a rate comparable to market rates that they would otherwise receive for their consultancy services.
The remuneration of non-executive directors for the years ended 30 June 2016 and 30 June 2015 is detailed further in this Remuneration Report. The amounts listed under ‘Salary & Fees’ include both director fees and consultancy fees received by non-executive directors.
7.3.4 Executive remuneration
Executive remuneration consists of fixed remuneration and may also comprise variable remuneration in the form of performance based cash bonuses (Short Term Incentive Plan (“STIP”)), share options and performance rights (issued under the terms of the ESOP and Long Term Incentive Plan (“LTIP”) respectively). The LTIP was approved by the Company’s shareholders at the 2014 AGM. The structure of the plan is detailed below.
(a) Fixed remuneration
The level of fixed remuneration is set to provide a base level of remuneration which is both appropriate for the position and competitive in the market. The Company aims to pay within the 50th and 75th percentile band of benchmark data, but the Board has the discretion to pay above this to attract and retain key employees in achieving the Company’s strategic goals.
Fixed remuneration is reviewed at appropriate times (and no less than on an annual basis) by the Remuneration Committee and approved by the Board having regard to the Company and individual performance, relevant comparable remuneration for similarly capitalised companies in the mining industry and independently compiled market data. Executives receive their fixed remuneration in the form of cash.
The fixed remuneration for executives is detailed further in this Report.
(b) Variable remuneration - STIP
The Board has implemented a formal STIP which includes cash bonuses to executives upon achievement of predefined targets. The maximum bonus percentage (“MBP”) ranges between 10% and 50% of an executive’s fixed annual salary depending on the position held and responsibilities to be undertaken. The STIP is based on achieving “Expected” and “Stretch” targets for the year. Achieving the expected target attracts 20% of the relevant MBP and achieving the stretch target or better attracts up to 100% of the relevant MBP.
In 2014, the Remuneration Committee recommended to the Board to suspend the STIP and move 100% of eligible KMP’s incentive entitlements exclusively to the LTIP for the foreseeable future. The justification for this recommendation being that at this stage of the Company’s development, all the key business objectives of KMP have longer dated time frames than the STIP’s 12 month time frame.
Therefore, during the 2016 and 2015 financial year, no formal cash bonuses were paid to executives pursuant to the STIP, however as compensation for completing the sale of Cameron, the Remuneration Committee recommended to the Board that a once off transaction related cash bonus of $50,000 be awarded to Mr Hacker. No other cash bonuses were awarded to KMP during the year. Please refer to section 7.4 for further details.
For
per
sona
l use
onl
y

CHALICE GOLD MINES | ANNUAL REPORT 2016 20
Directors’ ReportChalice Gold Mines Limited Directors’ Report
20
(c) Variable remuneration – employee long term incentive plan (LTIP)
Under the LTIP, the Board has the discretion to make annual awards of performance rights (which is a right to convert into ordinary shares after achievement of applicable criteria and targets) to executives and employees. The level of the award of performance rights is dependent on an employee’s position within the Company. Subject to the performance criteria set out in the terms of the LTIP, performance rights held by an employee may convert into ordinary fully paid shares in the Company. In the event performance criteria are not achieved by the measurement date, the employee’s performance rights lapse with no shares being issued.
A summary of the LTIP is set out below:
Key Design Feature Design Eligibility All full-time employees and permanent part-time employees (including executive
directors and the managing director) of the Company are eligible participants. Shareholder approval is required before any director or related party of the Company can participate in the LTIP.
Award quantum The award quantum will be determined in consideration of total remuneration of the individual, market relativities and business affordability. The LTIP does not set out a maximum number of shares that may be issuable to any one person, other than the 5% limit of the total number of issued shares.
Performance conditions The performance conditions that must be satisfied in order for the performance rights to vest are determined by the Board. The performance conditions may include one or more of the following:
Employment of a minimum period of time; Achievement of specific objectives by the participant and/or the Company.
This may include the achievement of share price targets and other major long term milestone targets; or
Such other performance objectives as the Board may determine.
Vesting Vesting will occur at the end of a defined period, usually three years, and upon the achievement of the performance conditions.
Term and lapse The term of the performance rights is determined by the Board in its discretion, but will ordinarily have a three year term up to a maximum of five years. Performance Rights are subject to lapsing if performance conditions are not met by the relevant measurement date or expiry dates (if no other measurement date is specified) or if employment is terminated for cause or in circumstances as described below.
Price Payable by Participant No consideration.
Cessation of Employment If an employee leaves the Company prior to the expiration of the relevant vesting period for a particular award of performance rights, such performance rights would, as a general rule lapse, except in certain limited defined situations such as disability, redundancy or death.
Annual grant of performance rights - 2016/2017
The table below outlines the performance rights granted to KMP subsequent to 30 June 2016:
Annual Award KMP Number of Rights Measurement Date Vesting Date
2016/2017 Tim Goyder* 1,200,738 30 June 2019 30 June 2019
Richard Hacker 754,087 30 June 2019 30 June 2019
Kevin Frost 804,058 30 June 2019 30 June 2019 *Those to Mr Goyder being subject to shareholder approval at the Company’s 2016 AGM.
For
per
sona
l use
onl
y

21 CHALICE GOLD MINES | ANNUAL REPORT 2016
Directors’ ReportChalice Gold Mines Limited Directors’ Report
21
The performance rights shown above will not vest (and the underlying shares will not be issued) unless the performance conditions set by the Board have been satisfied. For the 2016/2017 annual grant of performance rights, the Remuneration Committee recommended to the Board that 100% of KMP’s incentive entitlements are offered via the LTIP and that 50% of the LTIP is to be based on meeting Total Shareholder Return (“TSR”) and the remaining 50% is to be based on achieving key business objectives.
The following table outlines key business objectives and the weightings of the performance condition:
Overall Performance Condition Specific Performance Conditions
Percentage of granted performance rights that will vest if performance conditions are met
Strategic objectives
Undertake a significant acquisition or corporate transaction: acquire one or more assets or undertake a corporate transaction with potential to generate an IRR of at least 20% using consensus commodity prices and board approved cost assumptions. AND/OR
50%
Value generation through: Making a significant new discovery which shows the
potential to be economic based on consensus commodity prices and board approved cost assumptions; or
Substantially increasing the Company’s resource base; or Conducting economic/feasibility studies which show the
potential to generate an IRR of at least 20% using consensus commodity prices and board approved cost assumptions; or
The sale of an asset(s) at a significant profit. NB: The determination as to whether the above objectives have been met will be done by the Board of the Company in a timely manner, acting reasonably and in good faith.
TSR objectives The performance conditions for performance rights issued will be measured by comparing the Company’s TSR with that of an appropriate comparator group of companies as determined by the Remuneration Committee over the period from the grant of the performance rights, to the end of the financial year that is 3 years after that date (vesting date). The performance rights will vest depending on the Company’s percentile ranking within the comparator group on the relevant vesting date as follows:
Below 50th Percentile 0%
Between 50th and 75th percentile Pro rata between 16.5% and 50%
At or above 75th percentile 50%
The test date for the performance rights are set at 30 June 2019, being 3 years from the date of grant.
Annual grant of performance rights - 2015/2016
The table below outlines the performance rights that were granted for 2015/16 financial year and have not yet vested.
Annual Award KMP Number of Rights Measurement Date Vesting Date
2015/2016 Tim Goyder 1,664,707 30 June 2017 30 June 2018
Gary Snow(1) 1,378,826 30 June 2017 30 June 2018
Richard Hacker 1,306,837 30 June 2017 30 June 2018
(1)Mr Snow ceased employment on 18 March 2016. The above performance rights lapsed prior to the measurement date.
For
per
sona
l use
onl
y

CHALICE GOLD MINES | ANNUAL REPORT 2016 22
Directors’ ReportChalice Gold Mines Limited Directors’ Report
22
The performance rights shown above will not vest (and the underlying shares will not be issued) unless the performance conditions set by the Board have been satisfied. For the 2015/2016 annual grant of performance rights, the Remuneration Committee recommended to the Board that 100% of KMPs incentive entitlements are offered via the LTIP and that 50% of the LTIP is to be based on share price and remaining 50% to be based on achieving key business objectives. The following table outlines key business objectives and the weightings of the performance condition:
Overall Performance Condition Specific Performance Conditions
Percentage of granted performance rights that will vest if performance conditions are met
Strategic objectives
Undertake a significant acquisition: acquire one or more assets in addition to the Cameron Gold Project with potential to generate an IRR of at least 20% using consensus commodity prices and board approved cost assumptions. AND/OR
50%
Value generation at existing assets through: Making a significant new discovery which shows the potential
to be economic based on consensus commodity prices and board approved cost assumptions; or
Substantially increasing the Company’s resource base; or Conducting economic/feasibility studies which show the
potential to generate an IRR of at least 20% using consensus commodity prices and board approved cost assumptions; or
The sale of an asset(s) at a significant profit. NB: The determination as to whether the above objectives have been met will be done by the Board of the Company in a timely manner, acting reasonably and in good faith.
Share price objectives
If the 30 Day VWAP as at the measurement date is:
Below 15 cents 0%
15 cents 16.5%
Between 15 cents and 30 cents Pro rata between 16.5% and 50%
Above 30 cents 50%
In addition to the measurement period of 1 July 2015 to 30 June 2017, a 12 month service period must also be completed by each KMP, meaning that performance rights will not vest or convert into shares until 30 June 2018 at the earliest.
Annual grant of performance rights - 2014/2015
The following KMP were granted performance rights for 2014/2015:
Annual Award KMP Number of Rights Measurement Date Vesting Date
2014/2015 Gary Snow(1) 1,399,775 30 June 2016 30 June 2017
Richard Hacker 1,326,693 30 June 2016 30 June 2017
(1)Mr Snow ceased employment on 18 March 2016. The above performance rights lapsed prior to the measurement date.
For
per
sona
l use
onl
y

23 CHALICE GOLD MINES | ANNUAL REPORT 2016
Directors’ ReportChalice Gold Mines Limited Directors’ Report
23
The following performance conditions were applicable to those performance rights:
Overall Performance Condition Specific Performance Conditions
Percentage of granted performance rights that will vest if performance conditions are met
Strategic objectives
Undertake a significant acquisition: acquire one or more assets in addition to the Cameron Gold Project with potential to generate returns above the Company’s internal hurdle rates based on consensus commodity prices and cost assumptions. AND/OR
50% Make a significant new discovery: at the Cameron Gold Project or
any other Projects/Joint Venture acquired by the Company which shows potential to be economic based on consensus commodity prices and cost assumptions.
Share price objectives
If the 60 Day VWAP as at the measurement date is:
Below 23 cents 0%
23 cents 16.5%
Between 23 cents and 38 cents Pro rata between 16.5% and 50%
Above 38 cents 50%
The testing date for the above performance rights was 30 June 2016, and at this date the Remuneration Committee determined that the above objectives had not been met, and thus the Remuneration Committee recommended to the Board that the above performance rights lapse (i.e. those performance rights granted to Mr Hacker). These performance rights lapsed on 15 July 2016.
(d) Variable remuneration – share option plan
Equity grants to executives have previously been delivered in the form of employee share options under the Company’s Employee Share Option Plan which was last approved by shareholders in 2013. Options are issued at an exercise price determined by the Board at the time of issue.
Generally, no performance hurdles were set on options issued to executives. The Company considered that as options were issued at a price in excess of the Company’s current share price (at the date of issue of those options), there was an inherent performance hurdle as the share price of the Company’s shares had to increase before any reward could accrue to the executive.
The vesting period for share options is at the discretion of the Board and the expiry date of share options is usually between 3 and 5 years.
Upon cessation of employment, participants have 3 months from the date of cessation to exercise the share options. This requirement may be waived at the Board’s discretion.
It is currently the Board’s preference to issue performance rights under the LTIP to KMP rather than share options.
7.3.5 Link between performance and executive remuneration
The focus of executive remuneration over the financial year was fixed remuneration and performance rights under the LTIP (i.e. growing the value of the Company as reflected through share price) which seeks to ensure that executive remuneration is appropriately aligned with the business strategy and shareholder interests.
The share price performance over the last 5 years, adjusted to reflect the capital return of 10 cents per share in 2012, is as follows:
30 June 2012 30 June 2013 30 June 2014 30 June 2015 30 June 2016 Share price $0.10 $0.16 $0.15 $0.11 $0.18
For
per
sona
l use
onl
y

CHALICE GOLD MINES | ANNUAL REPORT 2016 24
Directors’ ReportCh
alic
e Go
ld M
ines
Lim
ited
Dire
ctor
s’ R
epor
t
24
7.4
4 Key
man
agem
ent p
erso
nnel
rem
uner
atio
n
Shor
t-te
rm b
enef
its
Post
-em
ploy
men
t O
ther
long
-te
rm b
enef
its
Shar
e-ba
sed
paym
ents
Te
rmin
atio
n be
nefit
s To
tal
Prop
ortio
n of
re
mun
erat
ion
perf
orm
ance
re
late
d
Key
Man
agem
ent
Pers
onne
l
Sala
ry &
fees
Non
-m
onet
ary
bene
fits
O
ther
Su
pera
nnua
tion
bene
fits
Lo
ng se
rvic
e le
ave
Long
Ter
m
Ince
ntiv
es (5
)
$
$ $
$ $
$ $
$ %
D
irect
ors
T R
B Go
yder
20
16
356,
164
5,69
1 -
33,8
36
- 59
,229
-
454,
920
13
20
15
333,
585
4,16
4 -
31,6
91
- -
- 36
9,44
0 -
W B
Ben
t(2)
2016
-
- -
- -
- -
- -
20
15
100,
458
2,23
1 -
26,5
39
- -
377,
681
506,
909
- D
A Jo
nes(2
) 20
16
- -
- -
- -
- -
-
2015
92
,141
2,
748
- 18
,421
-
- 17
1,92
8 28
5,23
8 -
A W
Kie
rnan
(1)
2016
12
2,69
2 2,
906
- 7,
808
- -
- 13
3,40
6 -
20
15
146,
759
1,29
9 -
7,05
5 -
- -
155,
113
- S
P Q
uin
2016
70
,000
6,
910
- -
- -
- 76
,910
-
20
15
66,2
50
6,54
4 -
- -
- -
72,7
94
- M
S B
all(3
) 20
16
1,21
1 48
-
115
- -
- 1,
374
-
2015
-
- -
- -
- -
- -
Exec
utiv
e
R
K Ha
cker
20
16
279,
358
4,14
6 50
,000
31
,289
-
62,0
45
- 42
6,83
8 15
2015
30
0,80
7 2,
582
- 29
,014
4,
605
47,9
85
- 38
4,99
3 12
K
M F
rost
(4)
2016
88
,333
96
3 -
8,39
2 -
- -
97,6
88
-
2015
-
- -
- -
- -
- -
G Sn
ow(4
) 20
16
226,
633
9,89
5 -
20,1
92
- -
- 25
6,72
0 -
20
15
256,
545
971
- 34
,999
-
50,5
19
- 34
3,03
4 15
Tota
l Com
pens
atio
n 20
16
1,14
4,39
1 30
,559
50
,000
10
1,63
2 -
121,
274
- 1,
447,
856
2015
1,
296,
545
20,5
39
- 14
7,71
9 4,
605
98,5
04
549,
609
2,11
7,52
1
(1) In
clud
es th
e co
nsul
ting
serv
ices
of M
r Kie
rnan
($40
,500
) dur
ing
the
cour
se o
f the
fina
ncia
l yea
r. A
mou
nts
wer
e bi
lled
base
d on
nor
mal
mar
ket r
ates
for
such
ser
vice
s an
d w
ere
due
and
paya
ble
unde
r no
rmal
pay
men
t ter
ms.
(2
) Mr B
ent r
esig
ned
as M
anag
ing
Dire
ctor
on
10 O
ctob
er 2
014
and
Dr Jo
nes r
esig
ned
as E
xecu
tive
Dire
ctor
on
10 O
ctob
er 2
014
and
ceas
ed e
mpl
oym
ent o
n 31
Oct
ober
201
4.
(3) M
r Bal
l was
app
oint
ed 2
4 Ju
ne 2
016
(4) M
r Sno
w c
ease
d em
ploy
men
t on
18 M
arch
201
6 an
d M
r Fro
st w
as a
ppoi
nted
Gen
eral
Man
ager
– E
xplo
ratio
n on
1 M
arch
201
6.
(5) T
he fa
ir va
lue
of th
e op
tions
is c
alcu
late
d at
the
date
of g
rant
usin
g a
Blac
k-Sc
hole
s Opt
ion-
pric
ing
mod
el a
nd a
lloca
ted
to e
ach
repo
rtin
g pe
riod
even
ly o
ver t
he p
erio
d fr
om g
rant
dat
e to
ves
ting
date
. The
va
lue
disc
lose
d is
the
port
ion
of th
e fa
ir va
lue
of th
e op
tions
allo
cate
d to
this
repo
rtin
g pe
riod.
The
fair
valu
e of
the
perf
orm
ance
righ
ts is
calc
ulat
ed a
t the
dat
e of
gra
nt u
sing
a bi
nom
ial o
ptio
n-pr
icin
g m
odel
. In
val
uing
the
optio
ns a
nd p
erfo
rman
ce ri
ghts
, mar
ket b
ased
ves
ting
cond
ition
s hav
e be
en ta
ken
into
acc
ount
.
For
per
sona
l use
onl
y

25 CHALICE GOLD MINES | ANNUAL REPORT 2016
Directors’ ReportChalice Gold Mines Limited Directors’ Report
25
7.5 Equity instruments
7.5.1 Employee share options
During the reporting period, subject to shareholder approval at the Company’s 2016 AGM, 500,000 options were granted to Mr Ball on his appointment as non-executive director. The options have an exercise price of 25 cents per share, with an expiry date of 30 June 2019. No further options over ordinary shares in the Group were granted or vested as compensation to key management personnel.
On 30 June 2016, 1,050,000 options over ordinary shares granted to KMP lapsed.
7.5.2 Employee long term incentive plan - performance rights
During the reporting period the following performance rights were granted as compensation to KMP and details of performance rights that vested during the reporting period are as follows:
Number of rights granted during 2016 Grant date
Fair value of rights at grant
date $
Expiry date
Number of rights
vested during 2016 Directors T Goyder 1,664,707 24 November 2015 158,397 30 June 2019 -
During the reporting period, no shares were issued on the exercise of performance rights granted as compensation. Refer below.
Details of the vesting profile of performance rights granted as remuneration to each KMP of the Group are outlined below.
Number of rights Grant date % vested in year % forfeited in year Vesting date
Directors T Goyder 1,664,707 24 November 2015 - - 30 June 2017 Executive G Snow 1,257,425 1 October 2014 - 100% - 142,350 17 November 2014 - 100% - 1,378,826 25 June 2015 - 100% - R Hacker 1,326,693 1 October 2014 - - 30 June 2016 1,306,837 25 June 2015 - - 30 June 2017
The movement during the reporting period, by value of performance rights over ordinary shares in the Group held by each KMP is detailed below:
Value of performance rights
granted in year(A) Value of performance rights
exercised in year(B) Value of performance
rights lapsed in year(C) $ $ $ Directors T Goyder 158,397 - - Executives G Snow - - 333,432
(A) The value of performance rights granted in the year is the fair value of performance rights calculated at grant date using a binomial option-pricing model. The total value of the performance rights granted is included in the table above. This amount is allocated to remuneration over the vesting period.
(B) The value of performance rights exercised during the year is calculated as the market price of shares of the Company on ASX as at close of trading on the date the performance rights were exercised after deducting the price paid to exercise the performance right.
(C) The value of performance rights that lapsed during the year represents the benefit foregone and is calculated at the date the performance right lapsed using the binomial option-pricing model or market value of shares with no adjustments for whether performance criteria have or have not been achieved.
For
per
sona
l use
onl
y
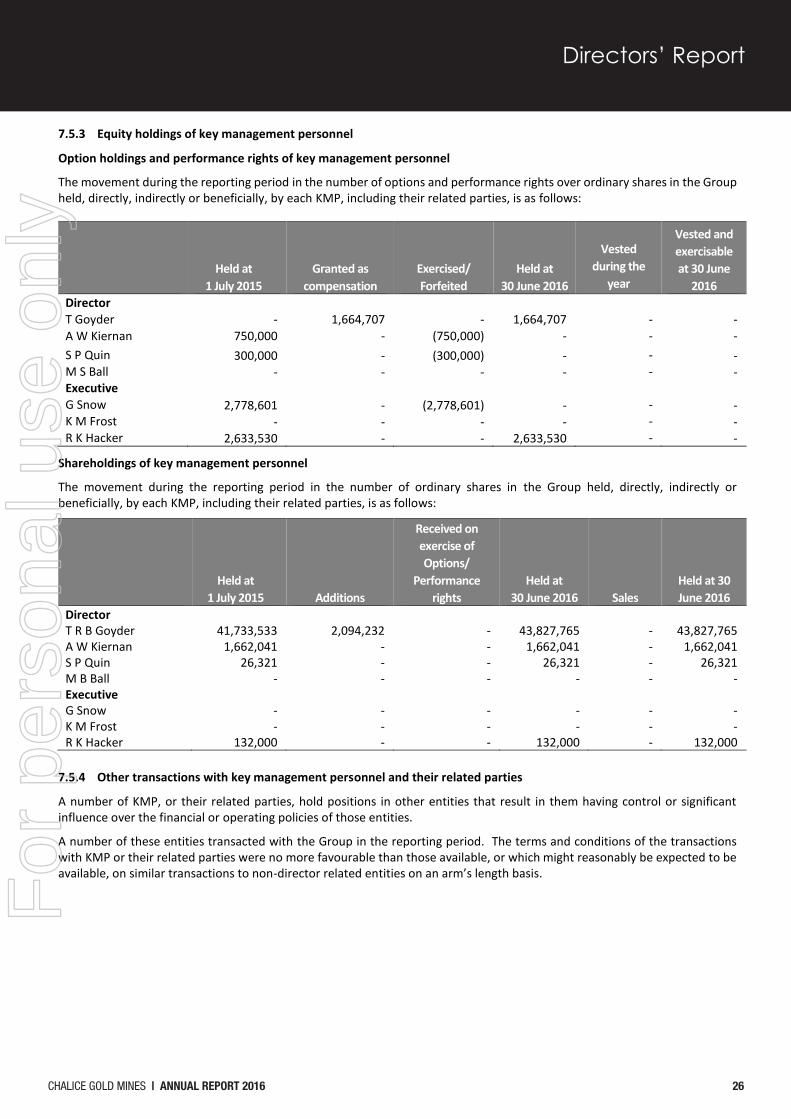
CHALICE GOLD MINES | ANNUAL REPORT 2016 26
Directors’ ReportChalice Gold Mines Limited Directors’ Report
26
7.5.3 Equity holdings of key management personnel
Option holdings and performance rights of key management personnel
The movement during the reporting period in the number of options and performance rights over ordinary shares in the Group held, directly, indirectly or beneficially, by each KMP, including their related parties, is as follows:
Held at
1 July 2015 Granted as
compensation
Exercised/ Forfeited
Held at 30 June 2016
Vested
during the year
Vested and exercisable at 30 June
2016 Director T Goyder - 1,664,707 - 1,664,707 - - A W Kiernan 750,000 - (750,000) - - - S P Quin 300,000 - (300,000) - - - M S Ball - - - - - - Executive G Snow 2,778,601 - (2,778,601) - - - K M Frost - - - - - - R K Hacker 2,633,530 - - 2,633,530 - -
Shareholdings of key management personnel
The movement during the reporting period in the number of ordinary shares in the Group held, directly, indirectly or beneficially, by each KMP, including their related parties, is as follows:
Held at
1 July 2015 Additions
Received on exercise of Options/
Performance rights
Held at 30 June 2016 Sales
Held at 30 June 2016
Director T R B Goyder 41,733,533 2,094,232 - 43,827,765 - 43,827,765 A W Kiernan 1,662,041 - - 1,662,041 - 1,662,041 S P Quin 26,321 - - 26,321 - 26,321 M B Ball - - - - - - Executive G Snow - - - - - - K M Frost - - - - - - R K Hacker 132,000 - - 132,000 - 132,000
7.5.4 Other transactions with key management personnel and their related parties
A number of KMP, or their related parties, hold positions in other entities that result in them having control or significant influence over the financial or operating policies of those entities.
A number of these entities transacted with the Group in the reporting period. The terms and conditions of the transactions with KMP or their related parties were no more favourable than those available, or which might reasonably be expected to be available, on similar transactions to non-director related entities on an arm’s length basis.
For
per
sona
l use
onl
y
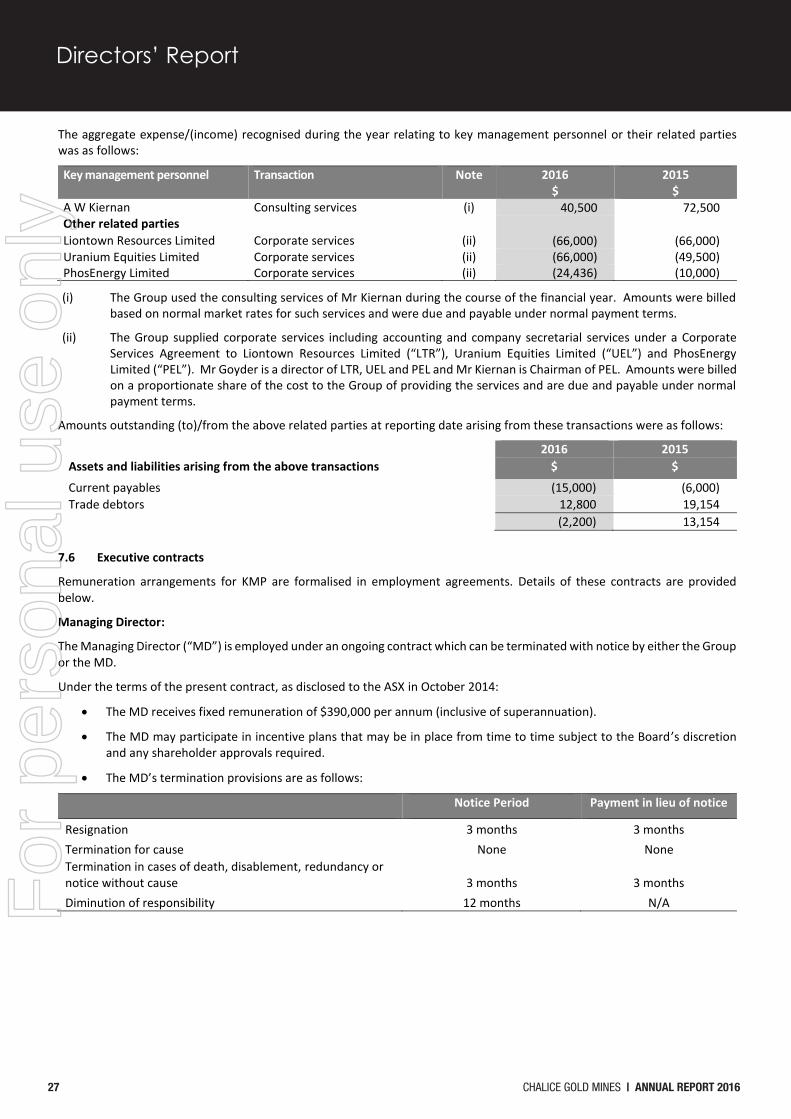
27 CHALICE GOLD MINES | ANNUAL REPORT 2016
Directors’ ReportChalice Gold Mines Limited Directors’ Report
27
The aggregate expense/(income) recognised during the year relating to key management personnel or their related parties was as follows:
Key management personnel Transaction Note 2016 $
2015 $
A W Kiernan Consulting services (i) 40,500 72,500 Other related parties Liontown Resources Limited Corporate services (ii) (66,000) (66,000) Uranium Equities Limited Corporate services (ii) (66,000) (49,500) PhosEnergy Limited Corporate services (ii) (24,436) (10,000)
(i) The Group used the consulting services of Mr Kiernan during the course of the financial year. Amounts were billed based on normal market rates for such services and were due and payable under normal payment terms.
(ii) The Group supplied corporate services including accounting and company secretarial services under a Corporate Services Agreement to Liontown Resources Limited (“LTR”), Uranium Equities Limited (“UEL”) and PhosEnergy Limited (“PEL”). Mr Goyder is a director of LTR, UEL and PEL and Mr Kiernan is Chairman of PEL. Amounts were billed on a proportionate share of the cost to the Group of providing the services and are due and payable under normal payment terms.
Amounts outstanding (to)/from the above related parties at reporting date arising from these transactions were as follows:
2016 2015 Assets and liabilities arising from the above transactions $ $
Current payables (15,000) (6,000) Trade debtors 12,800 19,154
(2,200) 13,154
7.6 Executive contracts
Remuneration arrangements for KMP are formalised in employment agreements. Details of these contracts are provided below.
Managing Director:
The Managing Director (“MD”) is employed under an ongoing contract which can be terminated with notice by either the Group or the MD.
Under the terms of the present contract, as disclosed to the ASX in October 2014:
The MD receives fixed remuneration of $390,000 per annum (inclusive of superannuation).
The MD may participate in incentive plans that may be in place from time to time subject to the Board’s discretion and any shareholder approvals required.
The MD’s termination provisions are as follows:
Notice Period Payment in lieu of notice
Resignation 3 months 3 months Termination for cause None None Termination in cases of death, disablement, redundancy or notice without cause 3 months 3 months Diminution of responsibility 12 months N/A
For
per
sona
l use
onl
y

CHALICE GOLD MINES | ANNUAL REPORT 2016 28
Directors’ ReportChalice Gold Mines Limited Directors’ Report
28
Other KMP:
Notice Period Payment in lieu of notice
Resignation 3 months 3 months Termination for cause None None Termination in cases of death, disablement, redundancy or notice without cause 3 months 3 months Diminution of responsibility 6 months N/A
8. DIVIDENDS
No dividends were declared or paid during the year and the directors recommend that no dividend be paid.
9. LIKELY DEVELOPMENTS
There are no likely developments that will impact on the Company other than as disclosed elsewhere in this report.
10. SIGNIFICANT EVENTS AFTER BALANCE DATE
On 4 July 2016, the Company commenced acquiring shares via the Company’s on-market share buy-back facility. To date the Company has acquired 12,430,000 shares on market for a total value of $2.3 million. At the date of this report, the Company’s total shares on issue was 270,280,802.
On 4 July 2016, the Company completed the sale of the Gnaweeda project and in consideration, the Company received 400,000 shares in Doray Mining Limited. In addition, the sale of the Ardeen Project completed and the Company received 2,050,000 shares in Kesselrun Resources Inc.
11. DIRECTORS’ INTERESTS
The relevant interest of each director in the shares, rights or options over such instruments issued by Chalice and other related bodies corporate, as notified by the directors to the ASX in accordance with S205G(1) of the Corporations Act 2001, at the date of this report is as follows:
Ordinary shares
Options over ordinary shares
Performance rights
T R B Goyder 43,827,765 - 1,664,707 S P Quin 26,321 - - M B Ball - - - A W Kiernan 1,662,041 - -
12. SHARE OPTIONS AND PERFORMANCE RIGHTS
Unissued shares under option
At the date of this report 500,000 unissued ordinary shares (500,000 at reporting date) of the Company are under option on the following terms and conditions:
Expiry date Exercise price ($) Number of options 31 October 2017 0.25 500,000
Unless exercised, these options do not entitle the holder to participate in any share issue of Chalice or any other body corporate.
On 24 June 2016, subject to Shareholder approval at the Company’s 2016 AGM, the Board resolved to grant Mr Ball 500,000 unlisted options with an exercise price of 25 cents, expiring 30 June 2019.
In addition, in July 2016, the Board resolved, subject to shareholder approval at the Company’s 2016 AGM, to grant Mr Quin and Mr Kiernan 500,000 unlisted options (for a total of 1,000,000) with an exercise price of 25 cents and expiry date of 30 November 2019.
For
per
sona
l use
onl
y

29 CHALICE GOLD MINES | ANNUAL REPORT 2016
Directors’ ReportChalice Gold Mines Limited Directors’ Report
29
Performance rights
At the date of this report 6,825,988 performance rights (5,817,236 at reporting date) have been issued on the following terms and conditions:
Exercise price ($) Number of rights Expiry date Nil 4,069,554 30 June 2019 Nil 2,756,434 30 June 2020
In addition to the above, the Board has resolved, subject to shareholder approval at the Company’s 2016 AGM to grant Mr Goyder 1,200,738 performance rights, in accordance with the terms and conditions of the Company’s LTIP, and with the same performance conditions as those granted to KMP (refer to the above section 7.3.4).
Shares issued on exercise of options or performance rights
No shares were issued during or since the end of the year as a result of the exercise of options or performance rights.
13. ENVIRONMENTAL LEGISLATION
The Group is subject to environmental legislation and obligations within the jurisdictions in which it operates, which during the period has been primarily Canada.
14. PROCEEDINGS ON BEHALF OF THE COMPANY
No person has applied for leave of court to bring proceedings on behalf of the Company or intervene in any proceedings to which the Company is a party for the purpose of taking responsibility on behalf of the Company for all or any part of those proceedings.
15. INDEMNIFICATION AND INSURANCE OF DIRECTORS AND OFFICERS
Chalice has agreed to indemnify all the directors and officers who have held office during the year, against all liabilities to another person (other than Chalice or a related body corporate) that may arise from their position as directors and officers of Chalice, except where the liability arises out of conduct involving a lack of good faith. The agreement stipulates that Chalice will meet the full amount of any such liabilities, including costs and expenses.
During the year the Group paid insurance premiums of $13,465 in respect of directors and officers indemnity insurance contracts, for current and former directors and officers. The insurance premiums relate to:
costs and expenses incurred by the relevant officers in defending proceedings, whether civil or criminal and whatever their outcome; and
other liabilities that may arise from their position, with the exception of conduct involving a wilful breach of duty or improper use of information or position to gain a personal advantage.
The amount of insurance paid is included in KMP remuneration in section 7.4 of the Remuneration Report.
16. NON-AUDIT SERVICES
During the year HLB Mann Judd, the Company’s auditors, provided services in addition to their statutory duties. These additional services totalled $1,000.
17. AUDITOR’S INDEPENDENCE DECLARATION
The auditor’s independence declaration is set out on page 31 and forms part of the Directors’ Report for the year ended 30 June 2016.
This Report is made in accordance with a resolution of the Directors:
Tim Goyder Managing Director Dated at Perth the 13th day of September 2016
For
per
sona
l use
onl
y
CHALICE GOLD MINES | ANNUAL REPORT 2016 30
Corporate Governance Statement
30
Chalice Gold Mines Limited Corporate Governance Statement
Chalice Gold Mines Limited ACN 116 648 956 (Company) has established a corporate governance framework, the key features of which are set out in its Corporate Governance statement which can be found on the Company’s website at www.chalicegold.com, under the section marked “Governance”.
In establishing its corporate governance framework, the Company has referred to the recommendations set out in the ASX Corporate Governance Council's Corporate Governance Principles and Recommendations 3rd edition (Principles & Recommendations). The Company has followed each recommendation where the Board has considered the recommendation to be an appropriate benchmark for its corporate governance practices. Where the Company's corporate governance practices follow a recommendation, the Board has made appropriate statements reporting on the adoption of the recommendation. In compliance with the "if not, why not" reporting regime, where, after due consideration, the Company's corporate governance practices do not follow a recommendation, the Board has explained it reasons for not following the recommendation and disclosed what, if any, alternative practices the Company has adopted instead of those in the recommendation.
For
per
sona
l use
onl
y
31 CHALICE GOLD MINES | ANNUAL REPORT 2016
Auditor’s Independence Declaration
HLB Mann Judd (WA Partnership) ABN 22 193 232 714 Level 4, 130 Stirling Street Perth WA 6000. PO Box 8124 Perth BC 6849 Telephone +61 (08) 9227 7500. Fax +61 (08) 9227 7533. Email: [email protected]. Website: http://www.hlb.com.auLiability limited by a scheme approved under Professional Standards Legislation
HLB Mann Judd (WA Partnership) is a member of
International, a worldwide organisation of accounting firms and business advisers.
34
AUDITOR’S INDEPENDENCE DECLARATION
As lead auditor for the audit of the consolidated financial report of Chalice Gold Mines Limited for the year ended 30 June 2016, I declare that to the best of my knowledge and belief, there have been no contraventions of:
a) the auditor independence requirements of the Corporations Act 2001 in relation to the audit; and
b) any applicable code of professional conduct in relation to the audit.
Perth, Western Australia 13 September 2016
L Di Giallonardo Partner
For
per
sona
l use
onl
y

CHALICE GOLD MINES | ANNUAL REPORT 2016 32
Consolidated Statement of Comprehensive IncomeFor the Year Ended 30 June 2016
32
Chalice Gold Mines Limited Consolidated Statement of Comprehensive Income For the year ended 30 June 2016
The above statement of comprehensive income should be read in conjunction with the accompanying notes.
Note 2016 $
2015 $
Continuing operations Revenue 3(a) 338,455 608,263 Foreign exchange gains 917,214 4,925,210 Net gain on sale of fixed assets - 270,439 Share of associate’s gain/(loss) 8 48,998 (45,510) Impairment of investment in associate 8 (790,050) - Exploration and evaluation assets written off 12 (2,201,005) (1,207,782) Corporate administrative expenses 3(b) (1,277,968) (2,057,106) Business development and project acquisition costs 3(d) (1,413,600) (1,796,800) Depreciation and amortisation expense (64,197) (92,694) (Loss)/profit before tax from continuing operations (4,442,153) 604,020 Income tax benefit/(expense) 6 182,379 (259,529) (Loss)/profit for the year from continuing operations (4,259,774) 344,491
Discontinued operations Net profit for the year from discontinued operations 13,109,976 - Overprovision for income tax expense - 10,958 Income tax expense 6 (1,417,703) - Profit for the year from discontinued operations 4 11,692,273 10,958 Total profit for the year 7,432,499 355,449 Total profit for the year attributable to owners of the parent 7,432,499 355,449 Other comprehensive income/(loss) Items that may be reclassified to profit or loss Net change in fair value of available for sale investments (1,121,101) (96,154) Exchange differences on discontinued operations (242,331) - Exchanges differences on translation of foreign operations (316,127) 788,764 Other comprehensive (loss)/income for the year (1,679,559) 692,610 Total comprehensive income for the year 5,752,940 1,048,059 Total comprehensive income for the year attributable to owners of the parent 5,752,940 1,048,059 Basic and diluted (loss)/earnings per share from continuing operations (cents) 7 (1.5) 0.1 Basic and diluted earnings per share from discontinued operations 7 4.1 0.0 Basic and diluted earnings per share from continuing and discontinued operations (cents) 7 2.6 0.1
For
per
sona
l use
onl
y

33 CHALICE GOLD MINES | ANNUAL REPORT 2016
Consolidated Statement of Financial PositionAs at 30 June 2016
33
Chalice Gold Mines Limited Consolidated Statement of Financial Position As at 30 June 2016
Note 2016
$ 2015
$ Current assets Cash and cash equivalents 22 35,733,786 39,864,989 Trade and other receivables 9 209,932 231,020 Financial assets 11 25,421,978 - Assets held for sale 10 520,078 - Total current assets 61,885,774 40,096,009 Non-current assets Financial assets 11 202,908 182,216 Investment in associate 8 968,333 1,826,987 Exploration and evaluation assets 12 296,609 13,982,545 Property, plant and equipment 13 274,733 554,154 Total non-current assets 1,742,583 16,545,902 Total assets 63,628,357 56,641,911 Current liabilities Trade and other payables 14 557,608 625,138 Income tax payable 127,614 259,951 Employee benefits 15 59,489 44,522 Total current liabilities 744,711 929,611 Non-current liabilities Other 16 46,591 43,132 Deferred tax liabilities 6 1,367,635 - Total non-current liabilities 1,414,226 43,132 Total liabilities 2,158,937 972,743 Net assets 61,469,420 55,669,168 Equity Issued capital 17 43,622,887 43,622,887 Retained earnings 18(a) 22,388,512 14,890,400 Reserves 18(b) (4,541,979) (2,844,119) Total equity 61,469,420 55,669,168
The above statement of financial position should be read in conjunction with the accompanying notes.
For
per
sona
l use
onl
y
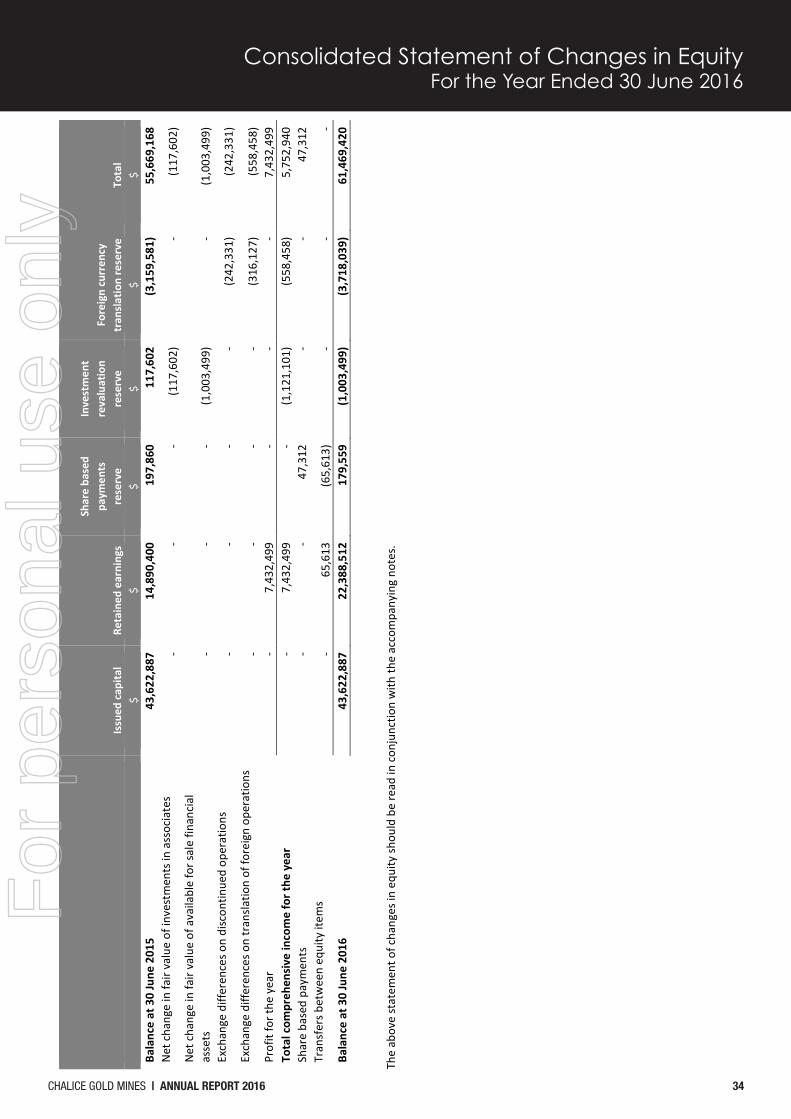
CHALICE GOLD MINES | ANNUAL REPORT 2016 34
Consolidated Statement of Changes in EquityFor the Year Ended 30 June 2016
34
Chal
ice
Gold
Min
es L
imite
d Co
nsol
idat
ed S
tate
men
t of C
hang
es in
Equ
ity
For t
he y
ear e
nded
30
June
201
6
Is
sued
cap
ital
Re
tain
ed e
arni
ngs
Shar
e ba
sed
paym
ents
re
serv
e
In
vest
men
t re
valu
atio
n re
serv
e Fo
reig
n cu
rren
cy
tran
slat
ion
rese
rve
To
tal
$
$ $
$$
$Ba
lanc
e at
30
June
201
5 43
,622
,887
14
,890
,400
19
7,86
0 11
7,60
2 (3
,159
,581
) 55
,669
,168
N
et c
hang
e in
fair
valu
e of
inve
stm
ents
in a
ssoc
iate
s -
- -
(117
,602
) -
(117
,602
) N
et c
hang
e in
fair
valu
e of
ava
ilabl
e fo
r sal
e fin
anci
al
asse
ts
- -
- (1
,003
,499
) -
(1,0
03,4
99)
Exch
ange
diff
eren
ces o
n di
scon
tinue
d op
erat
ions
-
- -
- (2
42,3
31)
(242
,331
) Ex
chan
ge d
iffer
ence
s on
tran
slatio
n of
fore
ign
oper
atio
ns
- -
- -
(316
,127
) (5
58,4
58)
Prof
it fo
r the
yea
r -
7,43
2,49
9 -
- -
7,43
2,49
9 To
tal c
ompr
ehen
sive
inco
me
for t
he y
ear
- 7,
432,
499
- (1
,121
,101
) (5
58,4
58)
5,75
2,94
0 Sh
are
base
d pa
ymen
ts
- -
47,3
12
- -
47,3
12
Tran
sfer
s bet
wee
n eq
uity
item
s -
65,6
13
(65,
613)
-
- -
Bala
nce
at 3
0 Ju
ne 2
016
43,6
22,8
87
22,3
88,5
12
179,
559
(1,0
03,4
99)
(3,7
18,0
39)
61,4
69,4
20
The
abov
e st
atem
ent o
f cha
nges
in e
quity
shou
ld b
e re
ad in
con
junc
tion
with
the
acco
mpa
nyin
g no
tes.
For
per
sona
l use
onl
y

35 CHALICE GOLD MINES | ANNUAL REPORT 2016
Consolidated Statement of Changes in EquityFor the Year Ended 30 June 2016
Chal
ice
Gold
Min
es L
imite
d Co
nsol
idat
ed S
tate
men
t of C
hang
es in
Equ
ity
For t
he y
ear e
nded
30
June
201
6
35
Is
sued
cap
ital
Re
tain
ed e
arni
ngs
Shar
e ba
sed
paym
ents
re
serv
e
In
vest
men
t re
valu
atio
n re
serv
e Fo
reig
n cu
rren
cy
tran
slat
ion
rese
rve
To
tal
$
$ $
$$
$Ba
lanc
e at
30
June
201
4 44
,140
,306
14
,421
,779
24
7,52
4 21
3,75
6 (3
,948
,345
) 55
,075
,020
N
et c
hang
e in
fair
valu
e of
inve
stm
ents
in a
ssoc
iate
s -
- -
(96,
154)
-
(96,
154)
Ex
chan
ge d
iffer
ence
s on
tran
slatio
n of
fore
ign
oper
atio
ns
- -
- -
788,
764
788,
764
Prof
it fo
r the
yea
r -
355,
449
- -
- 35
5,44
9
Tota
l com
preh
ensi
ve in
com
e fo
r the
yea
r -
355,
449
- (9
6,15
4)
788,
764
1,04
8,05
9 Sh
are
buy-
back
(3
11,1
24)
- -
- -
(311
,124
) M
inim
um h
oldi
ng sh
are
buy-
back
(2
06,2
95)
- -
- -
(206
,295
) Sh
are
base
d pa
ymen
ts
- -
63,5
08
- -
63,5
08
Tran
sfer
s bet
wee
n eq
uity
item
s -
113,
172
(113
,172
) -
- -
Bala
nce
at 3
0 Ju
ne 2
015
43,6
22,8
87
14,8
90,4
00
197,
860
117,
602
(3,1
59,5
81)
55,6
69,1
68
The
abov
e st
atem
ent o
f cha
nges
in e
quity
shou
ld b
e re
ad in
con
junc
tion
with
the
acco
mpa
nyin
g no
tes.
For
per
sona
l use
onl
y

CHALICE GOLD MINES | ANNUAL REPORT 2016 36
Consolidated Statement of Cash FlowsFor the Year Ended 30 June 2016
36
Chalice Gold Mines Limited Consolidated Statement of Cash Flows For the year ended 30 June 2016
Note 2016 2015 $ $ Cash flows from operating activities Cash receipts from operations 208,145 125,258 Cash paid to suppliers and employees (1,188,498) (2,114,343) Income tax paid - (379,043) Research and development tax credit - 259,952 Interest received 119,980 479,068 Net cash used in operating activities 22 (860,373) (1,629,108) Cash flows from investing activities Payments for mining exploration and evaluation (5,155,365) (2,822,084) Payments associated with the sale of the Cameron Gold Project (543,503) - Payments for business development activities (1,350,974) (1,823,283) Deferred consideration received 2,908,400 - Acquisition of the Dubenski Gold Project - (725,321) Buy-back of Cameron Royalty 12 - (2,075,327) Acquisition of property, plant and equipment (47,796) (120,765) Proceeds from sale of fixed assets 1,194 449,050 Net cash used in investing activities (4,188,044) (7,117,730) Cash flows from financing activities Share buy-back - (311,124) Minimum shareholding buy-back - (206,295) Net cash used in financing activities - (517,419) Net decrease in cash and cash equivalents (5,048,417) (9,264,257) Cash and cash equivalents at the beginning of the year 39,864,989 44,204,036 Effect of exchange rate fluctuations on cash held 917,214 4,925,210 Cash and cash equivalents at 30 June 22 35,733,786 39,864,989
The above statement of cash flows should be read in conjunction with the accompanying notes.
For
per
sona
l use
onl
y

37 CHALICE GOLD MINES | ANNUAL REPORT 2016
Notes to the Concolidated Financial StatementsFor the Year Ended 30 June 2016
37
Chalice Gold Mines Limited Notes to the Consolidated Financial Statements For the year ended 30 June 2016
1. Significant accounting policies Chalice Gold Mines Limited is a dual listed Australian Securities Exchange (‘ASX’) and Toronto Stock Exchange (‘TSX’) listed public company domiciled in Australia at Level 2, 1292 Hay Street, West Perth, Western Australia. The consolidated financial report comprises the financial statements of Chalice Gold Mines Limited (‘Company’) and its subsidiaries (‘the Group’) for the year ended 30 June 2016. (a) Basis of preparation The financial report is a general purpose financial report which has been prepared in accordance with the requirements of the Corporations Act 2001, Australian Accounting Standards and other authoritative pronouncements of the Australian Accounting Standards Board. The financial report has also been prepared on a historical cost basis, except for available-for-sale investments, which have been measured at fair value. Cost is based on the fair values of the consideration given in exchange for assets. Chalice is domiciled in Australia and all amounts are presented in Australian dollars, unless otherwise noted. The consolidated financial statements provide comparative information in respect of the previous period. In addition, the Group presents an additional statement of financial position at the beginning of the earliest period presented when there is a retrospective application of an accounting policy, a retrospective restatement, or a reclassification of items in financial statements. The financial report was authorised for issue by the directors on 13 September 2016. (b) Compliance with IFRS The financial report also complies with International Financial Reporting Standards (IFRS) as issued by the International Accounting Standards Board. (c) Adoption of new and revised standards
(i) Standards and interpretations applicable to 30 June 2016 For the year ended 30 June 2016, the Directors have reviewed all of the new and revised Standards and Interpretations issued by the AASB that are relevant to the Group’s operations and that are effective for annual reporting period. It has been determined that there is no impact, material or otherwise, of the new and revised Standards and Interpretations on the Group and, therefore, no material change is necessary to Group accounting policies. The Group has adopted the following new and amended Standards and AASB Interpretations as of 1 July 2015: AASB 1057 Application of Australian Accounting Standards AASB 2015-9 Amendments to Australian Accounting Standards – Scope and Application Paragraphs AASB 2015-5 Amendments to Australian Accounting Standards – Investment Entities: Applying the
Consolidation Exception AASB 2015-5 Amendments to Australian Accounting Standards – Disclosure Initiative: Amendments to AASB
101 AASB 2015-1 Amendments to Australian Accounting Standards – Annual Improvements to Australian
Accounting Standards 2012-2014 Cycle AASB 2014-9 Amendments to Australian Accounting Standards – Equity Method in Separate Financial
Statements AASB 2014-4 Amendments to Australian Accounting Standards – Clarification of Acceptable Methods of
Depreciation and Amortisation AASB 2014-3 Amendments to Australian Accounting Standards – Accounting for Acquisitions in Joint Venture
Operations
For
per
sona
l use
onl
y
CHALICE GOLD MINES | ANNUAL REPORT 2016 38
Notes to the Consolidated Financial StatementsFor the Year Ended 30 June 2016
Chalice Gold Mines Limited Notes to the Consolidated Financial Statements For the year ended 30 June 2016
38
(ii) Accounting Standards and Interpretations issued but not yet effective The following new accounting standards and interpretations which are not yet effective and have not been applied by the Company, have been assessed to have no material impact on the Company:
AASB 2016-1 Amendments to Australian Accounting Standards – Recognition of Deferred Tax Assets for Unrealised Losses
AASB 2016-2 Amendments to Australian Accounting Standards – Disclosure Initiative: Amendments to AASB 107
AASB 9 Financial Instruments AASB 2014-7 Amendments to Australian Accounting Standards arising from AASB 9 AASB 2014-8 Amendments to Australian Accounting Standards arising from AASB 9 Application of AASB 9 (December 2009) and AASB 9 (December 2010) AASB 15 Revenue from Contracts with Customers AASB 2014-5 Amendments to Australian Accounting Standards arising from AASB 15 AASB 2015-8 - Amendments to Australian Accounting Standards – Effective Date of AASB 15 AASB 2014-10 – Amendments to Australian Accounting Standards- Sale or Contribution of Assets between
an Investor and its Associate of Joint Venture AASB 2015-10 – Amendments to Australian Accounting Standards- Effective Date of Amendments to AASB
10 and AASB 128 AASB 16 Leases
(d) Basis of consolidation The consolidated financial statements comprise the financial statements of Chalice Gold Mines Limited (‘Company’ or ‘Parent’) and its subsidiaries as at 30 June each year (the ‘Group’). Interests in associates are equity accounted and are not part of the consolidated Group.
Subsidiaries are all those entities controlled by the Group. The Group controls an entity when it is exposed to, or has rights to, variable returns from its involvement with the entity and has the ability to affect those returns through its power over the entity. Special purpose entities are those entities over which the Group has no ownership interest but in effect the substance of the relationship is such that the Group controls the entity so as to obtain the majority of benefits from its operation. The financial statements of the subsidiaries are prepared for the same reporting period as the parent company, using consistent accounting policies. In preparing the consolidated financial statements, all intercompany balances and transactions, income and expenses and profit and losses resulting from intra-group transactions have been eliminated in full. Subsidiaries and special purpose entities are fully consolidated from the date on which control is transferred to the Company and cease to be consolidated from the date on which control is transferred out of the Group. Investments in subsidiaries held by Chalice Gold Mines Limited are accounted for at cost in the financial statements of the parent entity less any impairment charges. The acquisition of subsidiaries is accounted for using the acquisition method of accounting. The acquisition method of accounting involves recognising at acquisition date, separately from goodwill, the identifiable assets acquired, the liabilities assumed and any non-controlling interest in the acquired. The identifiable assets acquired and the liabilities assumed are measured at their acquisition date fair values. The difference between the above items and the fair value of consideration (including the fair value of any pre-existing investment in the acquiree) is goodwill or a discount on acquisition. After initial recognition, goodwill is measured at cost less any accumulated impairment losses. For the purpose of impairment testing, goodwill acquired in a business combination is, from the acquisition date, allocated to each of the
For
per
sona
l use
onl
y
39 CHALICE GOLD MINES | ANNUAL REPORT 2016
Notes to the Consolidated Financial StatementsFor the Year Ended 30 June 2016
Chalice Gold Mines Limited Notes to the Consolidated Financial Statements For the year ended 30 June 2016
39
Group’s cash-generating units that are expected to benefit from the combination, irrespective of whether other assets or liabilities of the acquire are assigned to those units. Where goodwill forms part of a cash-generating unit and part of the operation within that unit disposal of, the goodwill associated with the operation disposed of is included in the carrying amount of the operation when determining the gain or loss on disposal of the operation. Goodwill disposed of in this circumstance is measured based on the relative values of the operation disposed of and the portion of the cash-generating unit retained. Non-controlling interests are allocated their share of net result after tax in the consolidated statement of comprehensive income and are presented in equity in the consolidated statement of financial position, separately from the equity of the owners of the Parent. Total comprehensive income within a subsidiary is attributed to the non-controlling interest even if that results in a deficit balance. A change in ownership interest of a subsidiary, without a loss of control, is accounted for as an equity transaction. If the Group loses control over a subsidiary it:
Derecognises the assets (including goodwill) and liabilities of the subsidiary Derecognises the carrying amount of any non-controlling interest Derecognises the cumulative translation differences recorded in equity Recognises the fair value of the consideration received Recognises the fair value of any investment retained Recognises any surplus or deficit in profit or loss Reclassifies the Parent’s share of components previously recognised in other comprehensive income to
profit or loss or retained earnings, as appropriate.
(e) Significant accounting judgements, estimates and assumptions The preparation of a financial report in conformity with Australian Accounting Standards requires management to make judgements, estimates and assumptions that affect the application of policies and reported amounts of assets, liabilities, income and expenses. The estimates and associated assumptions are based on historical experience and various other factors that are believed to be reasonable under the circumstance-s, the results of which form the basis of making the judgements about carrying values of assets and liabilities that are not readily apparent from other sources. Actual results may differ from these estimates. These accounting policies have been consistently applied by the Group. The key estimates and assumptions that have a significant risk of causing a material adjustment to the carrying amounts of certain assets and liabilities within the next annual reporting period are:
(i) Recoverability of exploration expenditure The recoverability of the carrying amount of exploration and evaluation expenditure carried forward is
dependent on the future successful outcome from exploration activity or alternatively the sale of the respective areas of interest. Where exploration results are unsuccessful, or no further work is to be undertaken, the directors will then assess whether an impairment write-down is required, which will be recognised in the statement of comprehensive income.
(ii) Share-based payment transactions The Group measures the cost of equity-settled share-based payments at fair value at the grant date using a Black-Scholes Option model taking into account the terms and conditions upon which the instruments were granted. The details and assumptions used in determining the value of these transactions are detailed in note 15.
(iii) Impairment of available-for-sale financial assets The Group follows the guidance of AASB 139 Financial Instruments: Recognition and Measurement to determine when an available-for-sale asset is impaired. This determination requires significant judgment. In making this judgement the Group evaluates, among other factors, the duration and extent to which the fair value of an investment is less than its cost and the financial health of a short-term business outlook for the investee, including factors such as industry and sector performance, changes in technology and operational and financing cash flows.
For
per
sona
l use
onl
y

CHALICE GOLD MINES | ANNUAL REPORT 2016 40
Notes to the Consolidated Financial StatementsFor the Year Ended 30 June 2016
Chalice Gold Mines Limited Notes to the Consolidated Financial Statements For the year ended 30 June 2016
40
(f) Foreign currency translation The functional currency of the Company is Australian dollars and the functional currency of subsidiaries based in Canada is Canadian Dollars (CAN$). The presentation currency of the Group is Australian dollars. Transactions in foreign currencies are initially recorded in the functional currency by applying the exchange rates ruling at the date of the transaction. Monetary assets and liabilities denominated in foreign currencies are retranslated at the rate of the exchange ruling at the reporting date. All exchange differences in the consolidated financial report are taken to profit or loss as incurred. Non-monetary items that are measured in terms of historical cost in a foreign currency are translated at exchange rates as at the date of the initial transaction. As at the balance date the assets and liabilities of these subsidiaries are translated into the presentation currency of Chalice Gold Mines Limited at the rate of exchange ruling at the balance date and their statements of comprehensive income are translated at the average exchange rate for the year. The exchange differences arising on the translation are taken directly to a separate component of recognised foreign currency translation reserve in equity. On disposal of a foreign entity, the deferred cumulative amount recognised in equity relating to that particular foreign operation is recognised in profit or loss. (g) Segment reporting An operating segment is a component of an entity that engages in business activities from which it may earn revenues and incur expenses (including revenues and expenses relating to transactions with other components of the same entity, whose operating results are regularly reviewed by the entity’s chief operating decision maker to make decisions about resources to be allocated to the segment and assess its performance and for which discrete financial information is available. This includes start up operations which are yet to earn revenues. Management will also consider other factors in determining operating segments such as the existence of a line manager and the level of segment information presented to the board of directors. Operating segments have been identified based on the information provided to the chief operating decision makers – being the board of directors. (h) Revenue recognition Revenue is recognised to the extent that it is probable that the economic benefits will flow to the Group and the revenue can be reliably measured. Revenue is measured at the fair value of the consideration received or receivable, net of returns, trade allowances, rebates and amounts collected on behalf of third parties.
(i) Sale of goods Revenue is recognised when the significant risks and rewards of ownership of the goods have passed to the buyer and the costs incurred or to be incurred in respect of the transaction can be reliably measured. Risks and rewards of ownership are considered passed to the buyer at the time of delivery of the goods to the buyer.
(ii) Services rendered Revenue from services rendered is recognised in the statement of comprehensive income in proportion to the stage of completion of the transaction at balance date. The stage of completion is assessed by reference to surveys of work performed. No revenue is recognised if there are significant uncertainties regarding recovery of the consideration due and the costs incurred or to be incurred cannot be measured reliably.
(iii) Interest received Interest income is recognised in the statement of comprehensive income as it accrues, using the effective interest method. The interest expense component of finance lease payments is recognised in the statement of comprehensive income using the effective interest method.
For
per
sona
l use
onl
y
41 CHALICE GOLD MINES | ANNUAL REPORT 2016
Notes to the Consolidated Financial StatementsFor the Year Ended 30 June 2016
Chalice Gold Mines Limited Notes to the Consolidated Financial Statements For the year ended 30 June 2016
41
(i) Expenses (i) Operating lease payments
Payments made under operating leases are recognised in the statement of comprehensive income on a straight-line basis over the term of the lease. Lease incentives received are recognised in the statement of comprehensive income as an integral part of the total lease expense and spread over the lease term.
(ii) Depreciation Depreciation is calculated on a diminishing value basis over the estimated useful lives of each part of an item of property, plant and equipment. Land is not depreciated. The depreciation rates used in the current and comparative periods are as follows:
plant and equipment 7%-40% fixtures and fittings 11%-22% motor vehicles 18.75%-25%
the residual value, if not insignificant, is reassessed annually.
(j) Income taxes and other taxes The income tax expense for the period is the tax payable on the current period’s taxable income based on the applicable income tax rate for each jurisdiction adjusted by changes in deferred tax assets and liabilities attributable to temporary differences and to unused tax losses. The current income tax charge is calculated on the basis of the tax laws enacted or substantially enacted at the end of the reporting period in the country where the company’s subsidiaries operate and generate taxable income. Provisions are established where appropriate on the basis of amounts expected to be paid to the tax authorities. Current tax liabilities for the current period and prior periods are measured at the amount expected to be recovered from or paid to taxation authorities. The tax rates and tax laws used to compute the amount are those that are enacted or substantially enacted by the balance date. Income tax in the statement of comprehensive income comprises current and deferred tax. Income tax is recognised in the statement of comprehensive income except to the extent that it relates to items recognised directly in equity, in which case it is recognised in equity. Deferred income tax is provided on all temporary differences at reporting date between the tax bases of assets and liabilities and their carrying amounts for financial reporting purposes. The amount of deferred tax provided is based on the expected manner of realisation or settlement of the carrying amount of assets and liabilities, using tax rates enacted or substantively enacted at reporting date.
Deferred income tax liabilities are recognised for all taxable temporary differences except:
when the deferred income tax liability arises from the initial recognition of goodwill or of an asset or liability in a transaction that is not a business combination and that, at the time of the transaction, affects neither the accounting profit nor taxable profit or loss; or
when the taxable temporary difference is associated with investments in subsidiaries, associates or interests in joint ventures, and the timing of the reversal of the temporary difference can be controlled and it is probable that the temporary difference will not reverse in the foreseeable future.
Deferred tax assets are recognised for all deductible temporary differences, carry-forward of unused tax assets and unused tax losses, to the extent that it is probable that taxable profit will be available against which the deductible temporary differences and the carry-forward of unused tax credits and unused tax losses can be utilised, except:
when the deferred income tax asset relating to the deductible temporary difference arises from the initial recognition of an asset or liability in a transaction that is not a business combination and, at the time of the transaction, affects neither the accounting profit nor taxable profit or loss; or
For
per
sona
l use
onl
y

CHALICE GOLD MINES | ANNUAL REPORT 2016 42
Notes to the Consolidated Financial StatementsFor the Year Ended 30 June 2016
Chalice Gold Mines Limited Notes to the Consolidated Financial Statements For the year ended 30 June 2016
42
when the deductible temporary difference is associated with investments in subsidiaries, associates or interests in joint ventures, in which case a deferred tax asset is only recognised to the extent that it is probable that the temporary difference will reverse in the foreseeable future and taxable profit will be available against which the temporary difference can be utilised.
The carrying amount of deferred income tax assets is reviewed at each balance date and reduced to the extent that it is no longer probable that sufficient taxable profit will be available to allow all or part of the deferred income tax asset to be utilised. Unrecognised deferred income tax assets are reassessed at each balance date and are recognised to the extent that it has become probable that future taxable profit will allow the deferred tax asset to be recovered. Deferred income tax assets and liabilities are measured at the tax rates that are expected to apply to the year when the asset is realised or the liability is settled, based on tax rates (and tax laws) that have been enacted or substantially enacted at the balance date. Income taxes relating to items recognised directly in equity are recognised in equity and not profit or loss. Deferred tax assets and deferred tax liabilities are offset only if a legally enforceable right exists to set off current tax assets against current tax liabilities and the deferred tax assets and liabilities relate to the same taxable entity and the same taxation authority.
(k) Other taxes Revenue, expenses and assets are recognised net of the amount of goods and services tax (’GST’) or other taxes, except where the amount of GST or other taxes incurred are not recoverable from the taxation authority. In these circumstances, the GST or other taxes incurred, are recognised as part of the cost of acquisition of the asset or as part of the expense. Receivables and payables are stated with the amount of GST included. The net amount of GST recoverable from, or payable to, the Australian Taxation Office (’ATO’) is included as a current asset or liability in the statement of financial position. Other taxes payable in foreign jurisdictions are included as a current payable in the statement of financial position. Cash flows are included in the statement of cash flows on a gross basis. The GST components of cash flows arising from investing and financing activities which are recoverable from, or payable to, the ATO are classified as operating cash flows. Taxes paid in foreign jurisdictions are classified as investing cash flows in the statement of cash flows. (l) Impairment of assets other than financial assets At each reporting date, the Group assesses whether there is any indication that an asset may be impaired. Where an indicator of impairment exists, the Group makes a formal estimate of recoverable amount. Where the carrying amount of an asset exceeds its recoverable amount the asset is considered impaired and is written down to its recoverable amount. Recoverable amount is the greater of fair value less costs to sell and value in use. Value in use is the present value of the future cash flows expected to be derived from the asset or cash generating unit. In estimating value in use, a pre-tax discount rate is used which reflects current market assessments of the time value of money and the risks specific to the asset. For an asset that does not generate largely independent cashflows, the recoverable amount is determined for the cash generating unit to which the asset belongs. Impairment losses are recognised in the statement of comprehensive income unless the asset has previously been revalued, in which case the impairment loss is recognised as a reversal to the extent of that previous revaluation with any excess recognised through the statement of comprehensive income. Receivables with a short duration are not discounted. A previously recognised impairment loss is reversed only if there has been a change in the estimates used to determine the asset’s recoverable amount since the last impairment loss was recognised. If that is the case the carrying amount of the asset is increased to its recoverable amount. That increased amount cannot exceed the carrying amount that would
For
per
sona
l use
onl
y
43 CHALICE GOLD MINES | ANNUAL REPORT 2016
Notes to the Consolidated Financial StatementsFor the Year Ended 30 June 2016
Chalice Gold Mines Limited Notes to the Consolidated Financial Statements For the year ended 30 June 2016
43
have been determined, net of depreciation, had no impairment loss been recognised for the asset in prior years. Such reversal is recognised in profit or loss unless the asset is carried at revalued amount, in which case the reversal is treated as a revaluation increase. After such a reversal the depreciation charge is adjusted in future periods to allocate the asset’s revised carrying amount, less any residual value, on a systematic basis over its remaining useful life.
(m) Cash and cash equivalents Cash and cash equivalents comprise cash balances and call deposits with an original maturity of six months or less. Bank overdrafts that are repayable on demand and form an integral part of the Group’s cash management are included as a component of cash and cash equivalents for the purpose of the statement of cash flows.
(n) Trade and other receivables Trade and other receivables are stated at cost less impairment losses (see accounting policy (l)). (o) Non-current assets held for sale and discontinued operations Immediately before classification as held-for-sale, the measurement of the assets (and all assets and liabilities in a disposal group) is brought up to date in accordance with applicable AIFRS. Then, on initial classification as held-for-sale, non-current assets and disposal groups are recognised at the lower of carrying amount and fair value less costs to sell. Non-current assets and disposal groups are classified as held for sale if their carrying amounts will be recovered principally through a sale transaction rather than through continuing use. This condition is regarded as met only when the sale is highly probable and the asset or disposal group is available for immediate sale in its present condition. Management must be committed to the sale, which should be expected to qualify for recognition as a completed sale within one year from the date of classification. In the statement of comprehensive income, income and expenses from the discontinued operations are reported separately from income and expenses from continuing operations, down to the level of profit after taxes, even when the Group retains a non-controlling interest in the subsidiary after the sale. The resulting profit or loss (after taxes) is reported separately in the statement of comprehensive income. Property, plant and equipment and tangible assets once classified as held for sale are not depreciated or amortised.
(p) Plant and equipment Plant and equipment is stated at cost less accumulated depreciation and any accumulated impairment losses. Such cost includes the cost of replacing parts that are eligible for capitalisation when the cost of replacing the parts is incurred. The assets' residual values, useful lives and amortisation methods are reviewed, and adjusted if appropriate, at each financial year end. An item of property, plant and equipment is derecognised upon disposal or when no further future economic benefits are expected from its use or disposal. Any gain or loss arising on derecognition of the asset (calculated as the difference between the net disposal proceeds and the carrying amount of the asset) is included in profit or loss in the year the asset is derecognised. The carrying values of plant and equipment are reviewed for impairment at each balance date in line with the Group’s impairment policy (see accounting policy (l)).
(q) Financial assets Financial assets in the scope of AASB 139 Financial Instruments: Recognition and Measurement are classified as either financial assets at fair value through profit or loss, loans and receivables, held-to-maturity investments, or available-for-sale investments, as appropriate. When financial assets are recognised initially, they are measured at fair value, plus, in the case of investments not at fair value, through profit or loss, directly attributable transactions costs. The Group determines the classification of its financial assets at initial recognition and, when allowed and appropriate, re-evaluates this designation at each financial year end.
For
per
sona
l use
onl
y
CHALICE GOLD MINES | ANNUAL REPORT 2016 44
Notes to the Consolidated Financial StatementsFor the Year Ended 30 June 2016
Chalice Gold Mines Limited Notes to the Consolidated Financial Statements For the year ended 30 June 2016
(i) Financial assets at fair value through profit or loss Financial assets classified as held-for-trading are included in the category ’financial assets at fair value through profit or loss’. Financial assets are classified as held for trading if they are acquired for the purpose of selling in the near term. Derivatives are also classified as held-for-trading unless they are designated as effective hedging instruments. Gains or losses on investments held-for-trading are recognised in profit or loss.
(ii) Held-to-maturity investments If the Group has the positive intent and ability to hold debt securities to maturity, then they are classified as held-to-maturity. Held-to-maturity investments are measured at amortised cost using the effective interest method, less any impairment losses.
(iii) Loans and receivables Loans and receivables are non-derivative financial assets with fixed or determinable payments that are not quoted in an active market. Such assets are carried at amortised cost using the effective interest method. Gains and losses are recognised in profit or loss when the loans and receivables are derecognised or impaired, as well as through the amortisation process.
(iv) Available-for-sale investments Available-for-sale investments are those non-derivative financial assets that are designated as available-for-sale or are not classified as any of the three preceding categories. After initial recognition available-for sale investments are measured at fair value with gains or losses being recognised as a separate component of equity until the investment is derecognised or until the investment is determined to be impaired, at which time the cumulative gain or loss previously reported in equity is recognised in profit or loss.
(r) Derecognition of financial assets and financial liabilities
(i) Financial assets A financial asset (or, where applicable, a part of a financial asset or part of a group of similar financial assets) are derecognised when:
the rights to receive cash flows from the asset have expired; and/or
the Group has transferred its rights to receive cash flows from the asset or has assumed an obligation to pay the received cash flows in full without material delay to a third party under a ‘pass-through’ arrangement; and either (a) the Group has transferred substantially all the risk and rewards of the asset, or (b) the Group has neither transferred nor retained substantially all the risks and rewards of the asset, but has transferred control of the asset.
When the Group has transferred its rights to receive cash flows from an asset or has entered into a pass-through arrangement, it evaluates if and to what extent it has retained the risk and rewards of ownership.
When it has neither transferred nor retained substantially all of the risk and rewards of the asset, nor transferred control of the asset, the asset is recognised to the extent of the Group’s continuing involved in the asset. In that case, the Group also recognises an associated liability. The transferred asset and the associated liability are measured on a basis that reflects the rights and obligations that the Group has retained.
Continuing involvement that takes the form of a guarantee over the transferred asset is measured at the lower of the original carrying amount of the asset and the maximum amount of consideration that the Group could be required to repay.
(ii) Financial liabilities A financial liability is derecognised when the obligation under the liability is discharged or cancelled or expires. When an existing financial liability is replaced by another from the same lender on substantially different terms, or the terms of an existing liability are substantially modified, such an exchange or modification is treated as a derecognition of the original liability and the recognition of a new liability, and the difference in the respective carrying amounts is recognised in profit or loss.
For
per
sona
l use
onl
y
45 CHALICE GOLD MINES | ANNUAL REPORT 2016
Notes to the Consolidated Financial StatementsFor the Year Ended 30 June 2016
Chalice Gold Mines Limited Notes to the Consolidated Financial Statements For the year ended 30 June 2016
45
The fair value of investments that are actively traded in organised financial markets is determined by reference to quoted market bid prices at the close of business on reporting date. For investments with no active market, fair value is determined using valuation techniques. Such techniques include using recent arm’s length market transactions; reference to the current market value of another instrument that is substantially the same; discounted cash flow analysis and option-pricing models.
(s) Impairment of financial assets The Group assesses, at each reporting date, whether there is any objective evidence that a financial asset or a group of financial assets is impaired. A financial asset or a group of a financial assets is deemed to be impaired if, and only if, there is objective evidence of impairment as a result of one or more events that has occurred after the initial recognition of the asset (an incurred ’loss event’) and that loss event has an impact on estimated future cash flows of the financial asset or the group of financial assets that can be reliably estimated. Evidence of impairment may include indications that debtors or a group of debtors is experiencing significant financial difficulty, default or delinquency in interest or principal payments, the probability that they will enter bankruptcy or other financial reorganisation and when observable data indicate that there is a measurable decrease in the estimated future cash flows, such as changes in arrears or economic conditions that correlate with defaults.
(i) Financial assets carried at amortised cost For financial assets carried at amortised cost, the Group first assess whether objective evidence of impairment exists individually for financial assets that are individually significant, or collectively for financial assets that are not individually significant. If the Group determines that no objective evidence of impairment exists for an individually assessed financial asset, whether significant or not, it includes the asset in a group of financial assets with similar credit risk characteristics and collectively assess them for impairment. Assets that are individually assessed for impairment and for which an impairment loss is or continues to be, recognised are not included in a collective assessment of impairment. If there are objective evidence that an impairment loss has been incurred, the amount of the loss is measured as the difference between the asset’s carrying amount and the present value of estimated future cash flows (excluding future expected credit losses that have not yet been incurred). The present value of the estimated future cash flows is discounted at the financial asset’s original effective interest rate.
(ii) Financial assets carried at cost If there is objective evidence that an impairment loss has been incurred on an unquoted equity instrument that is not carried at fair value (because its fair value cannot be reliably measured), or on a derivative asset that is linked to and must be settled by delivery of such an unquoted equity instrument, the amount of the loss is measured as the difference between the asset’s carrying amount and the present value of estimated future cash flows, discounted at the current market rate of return for a similar financial asset. Such impairment loss shall not be reversed in subsequent periods.
(iii) Available-for-sale investments If there is objective evidence that an available-for-sale investment is impaired, an amount comprising the difference between its cost (net of any principal repayment and amortisation) and its current fair value, less any impairment loss previously recognised in profit or loss, is transferred from equity to the statement of comprehensive income. Reversals of impairment losses for equity instruments classified as available-for-sale are not recognised in profit. Reversals of impairment losses for debt instruments are reversed through profit or loss if the increase in an instrument's fair value can be objectively related to an event occurring after the impairment loss was recognised in profit or loss.
(t) Exploration, evaluation and tenement acquisition costs Exploration, evaluation and tenement acquisition costs in relation to separate areas of interest for which rights of tenure are current, are capitalised in the period in which they are incurred and are carried at cost less accumulated impairment losses. The cost of acquisition of an area of interest and exploration expenditure relating to that area of interest is carried forward as an asset in the statement of financial position so long as the following conditions are satisfied:
For
per
sona
l use
onl
y

CHALICE GOLD MINES | ANNUAL REPORT 2016 46
Notes to the Consolidated Financial StatementsFor the Year Ended 30 June 2016
Chalice Gold Mines Limited Notes to the Consolidated Financial Statements For the year ended 30 June 2016
46
(1) the rights to tenure of the area of interest are current; and
(2) at least one of the following conditions is also met:
(i) the exploration and evaluation expenditures are expected to be recouped through successful development and exploitation of the area of interest, or alternatively, by its sale; or
(ii) exploration and evaluation activities in the area of interest have not at the reporting date reached a stage which permits a reasonable assessment of the existence or otherwise of economically recoverable reserves, and active and significant operations in, or in relation to, the area of interest are continuing.
Exploration and evaluation expenditure is initially measured at cost and include acquisition of rights to explore, studies, exploratory drilling, trenching and sampling and associated activities. General and administrative costs are only included in the measurement of exploration and evaluation expenditures where they are related directly to operational activities in a particular area of interest. Exploration and evaluation expenditure is assessed for impairment when facts and circumstances suggest that their carrying amount exceeds their recoverable amount and where this is the case an impairment loss is recognised. Should a project or an area of interest be abandoned, the expenditure will be written off in the period in which the decision is made. Where a decision is made to proceed with development, accumulated expenditure will be tested for impairment, reclassified to development costs and then amortised over the life of the reserves associated with the area of interest once mining operations have commenced.
(u) Trade and other payables Trade and other payables are stated at amortised cost. Trade and other payables are presented as current liabilities unless payment is not due within 12 months.
(v) Provisions and employee benefits A provision is recognised when the Group has a present legal or constructive obligation as a result of a past event, and it is probable that an outflow of economic benefits will be required to settle the obligation. If the effect is material, provisions are determined by discounting the expected future cash flows at a pre-tax rate that reflects current market assessments of the time value of money and, when appropriate, the risks specific to the liability. (w) Employee benefits
(i) Wages, salaries and annual leave Liabilities for employee benefits for wages, salaries, annual leave and sick leave represent present obligations resulting from employees' services provided to reporting date, calculated at undiscounted amounts based on remuneration wage and salary rates that the Group expects to pay as at reporting date including related on-costs, such as superannuation, workers’ compensation insurance and payroll tax.
(ii) Long service leave and other long term employee benefits The Group’s net obligation in respect of long-term employee benefits other than defined benefit plans is the amount of future benefit that employees have earned in return for their service in the current and prior periods plus related on-costs. This benefit is discounted to determine its present value, and the fair value of any related assets is deducted. The discount rate is the yield at the reporting date on government bonds that have maturity dates approximating the terms of the Group’s obligations. The calculation is performed using the projected unit cost method.
(iii) Superannuation Obligations for contributions to defined contribution pension plans are recognised as an expense in the statement of comprehensive income as incurred.
(iv) Share-based payment transactions The Group currently provides benefits under an Employee Share Option Plan. The cost of these equity-settled transactions with employees and directors is measured by reference to the fair value at the date at which they are granted. The fair value is determined using an appropriate valuation model and further details are provided
For
per
sona
l use
onl
y
47 CHALICE GOLD MINES | ANNUAL REPORT 2016
Notes to the Consolidated Financial StatementsFor the Year Ended 30 June 2016
Chalice Gold Mines Limited Notes to the Consolidated Financial Statements For the year ended 30 June 2016
47
at note 15. The cost is recognised, together with a corresponding increase in other capital reserves in equity, over the period in which the performance and/or service conditions are fulfilled in employee benefits expense. The cumulative expense recognised for equity-settled transactions at each reporting date until the vesting date reflects the extent to which the vesting period has expired and the Group’s best estimate of the number of equity instruments that will ultimately vest. The statement of profit or loss expense or credit for a period represents the movement in cumulative expense recognised as at the beginning and end of that period and is recognised in employee benefits expense. No expense is recognised for awards that do not ultimately vest, except for equity-settled transactions for which vesting is conditional upon a market or non-vesting condition. These are treated as vesting irrespective of whether or not the market or non-vesting condition is satisfied, provided that all other performance and/or service conditions are satisfied. Where the terms of an equity-settled award are modified, as a minimum an expense is recognised as if the terms had not been modified. In addition, an expense is recognised for any increase in the value of the transaction as a result of the modification, measured at the date of modification. Where an equity-settled award is cancelled, it is treated as if it had vested on the date of cancellation, and any expense not yet recognised for the award is recognised immediately. However, if a new award is substituted for the cancelled award, and designated as a replacement award on the date that it is granted, the cancelled and new award are treated as if they were a modification of the original award, as described in the previous paragraph. The dilutive effect, if any, of outstanding options is reflected as additional share dilution in the computation of earnings per share.
(x) Share Capital (i) Ordinary share capital
Ordinary shares and partly paid shares are classified as equity.
(ii) Transaction costs Transaction costs of an equity transaction are accounted for as a deduction from equity, net of any related income tax benefit
(y) Investments in associates An associate is an entity over which the Group has significant influence. Significant influence is the power to participate in the financial and operating policy decisions of the investee, but is not control or joint control over those policies. The considerations made in determining significant influence or joint control are similar to those necessary to determine control over subsidiaries. The Group’s investment in associates is accounted for using the equity method of accounting in the consolidated financial statements. Under the equity method, investments in associates are carried in the consolidated statement of financial position at cost plus post acquisition changes in the Group’s share of net assets of the associates. Goodwill relating to an associate is included in the carrying amount of the investment and is not amortised. After application of the equity method, the Group determines whether it is necessary to recognise any impairment loss with respect to the Group’s net investment in associates. Goodwill included in the carrying amount of the investment in the associate is not tested separately; rather the entire carrying amount of the investment is tested for impairment as a single asset. If an impairment is recognised, the amount is not allocated to the goodwill of the associate. The Group’s share of its associates’ post acquisition profits or losses is recognised in the statement of comprehensive income, and its share of post-acquisition movements are adjusted against the carrying amount of the investment. Dividends receivable from the associates are recognised in the parent entity’s statement of comprehensive income as a component of other income.
For
per
sona
l use
onl
y

CHALICE GOLD MINES | ANNUAL REPORT 2016 48
Notes to the Consolidated Financial StatementsFor the Year Ended 30 June 2016
Chalice Gold Mines Limited Notes to the Consolidated Financial Statements For the year ended 30 June 2016
48
When the Group’s share of losses in an associate equals or exceeds its interest in the associate, including any unsecured long term receivables and loans, the Group does not recognise further losses unless it has incurred obligations or made payments on behalf of the associate. (z) Parent entity financial information The financial information for the parent entity, Chalice Gold Mines Limited, disclosed in note 20 has been prepared on the same basis as the consolidated financial statements.
For
per
sona
l use
onl
y
49 CHALICE GOLD MINES | ANNUAL REPORT 2016
Notes to the Consolidated Financial StatementsFor the Year Ended 30 June 2016
Chal
ice
Gold
Min
es L
imite
d N
otes
to th
e Co
nsol
idat
ed F
inan
cial
Sta
tem
ents
Fo
r the
yea
r end
ed 3
0 Ju
ne 2
016
49
2.
Segm
ent r
epor
ting
Th
e Gr
oup
has i
dent
ified
its o
pera
ting
segm
ents
bas
ed o
n in
tern
al re
port
s tha
t are
revi
ewed
and
use
d by
the
Boar
d of
Dire
ctor
s in
asse
ssin
g pe
rfor
man
ce a
nd in
det
erm
inin
g th
e al
loca
tion
of re
sour
ces.
Th
e op
erat
ing
segm
ents
are
iden
tifie
d by
man
agem
ent
base
d on
the
allo
catio
n of
cos
ts; w
heth
er t
hey
are
expl
orat
ion
and
eval
uatio
n co
sts,
bus
ines
s de
velo
pmen
t co
sts
or c
orpo
rate
re
late
d co
sts.
Res
ults
of t
hose
segm
ents
are
repo
rted
to th
e Bo
ard
of D
irect
ors a
t eac
h Bo
ard
mee
ting.
T
he e
xplo
ratio
n an
d ev
alua
tion
segm
ent i
nclu
des a
ll of
the
Com
pany
’s e
xplo
ratio
n pr
ojec
ts g
roup
ed in
to o
ne c
ombi
ned
segm
ent.
Expl
orat
ion
and
Eval
uatio
n Bu
sine
ss d
evel
opm
ent
Corp
orat
e To
tal
2016
20
15
2016
20
15
2016
20
15
2016
20
15
$ $
$ $
$ $
$ $
Re
venu
e -
- -
- 20
2,44
5 12
5,75
8 20
2,44
5 12
5,75
8
Net
gai
n on
sale
of f
ixed
ass
ets
- 27
0,43
9 -
- -
- -
270,
439
Ex
plor
atio
n an
d ev
alua
tion
asse
ts
writ
ten
off
(2,2
01,0
05)
(1,2
07,7
82)
- -
- -
(2,2
01,0
05)
(1,2
07,7
82)
De
prec
iatio
n -
- -
- (6
4,19
7)
(92,
694)
(6
4,19
7)
(92,
694)
Busin
ess d
evel
opm
ent a
nd p
roje
ct
acqu
isitio
n co
sts
- -
(1,4
13,6
00)
(1,7
96,8
00)
- -
(1,4
13,6
00)
(1,7
96,8
00)
Co
rpor
ate
adm
inist
rativ
e ex
pens
es
- -
- -
(1,2
77,9
68)
(2,0
57,1
06)
(1,2
77,9
68)
(2,0
57,1
06)
Se
gmen
t los
s bef
ore
tax
(2,2
01,0
05)
(937
,343
) (1
,413
,600
) (1
,796
,800
) (1
,139
,720
) (2
,024
,042
) (4
,754
,325
) (4
,758
,185
)
Una
lloca
ted
inco
me/
(exp
ense
s)
Net
fina
ncin
g in
com
e
136,
010
482,
505
Fo
reig
n ex
chan
ge g
ains
917,
214
4,92
5,21
0
Inco
me
tax
(ben
efit)
/exp
ense
182,
379
(259
,529
)
Shar
e of
ass
ocia
te’s
net
gai
n/(lo
ss)
48
,998
(4
5,51
0)
Im
pairm
ent o
f inv
estm
ent i
n as
soci
ate
(7
90,0
50)
-
Prof
it fr
om d
iscon
tinue
d op
erat
ions
11,6
92,2
73
10,9
58
Pr
ofit
attr
ibut
able
to o
wne
rs o
f the
pa
rent
7,43
2,49
9 35
5,44
9
For
per
sona
l use
onl
y

CHALICE GOLD MINES | ANNUAL REPORT 2016 50
Notes to the Consolidated Financial StatementsFor the Year Ended 30 June 2016
Chal
ice
Gold
Min
es L
imite
d N
otes
to th
e Co
nsol
idat
ed F
inan
cial
Sta
tem
ents
Fo
r the
yea
r end
ed 3
0 Ju
ne 2
016
50
Expl
orat
ion
and
Eval
uatio
n Bu
sine
ss d
evel
opm
ent
Corp
orat
e To
tal
30 Ju
ne 2
016
30 Ju
ne 2
015
30 Ju
ne 2
016
30 Ju
ne 2
015
30 Ju
ne 2
016
30 Ju
ne 2
015
30 Ju
ne 2
016
30 Ju
ne 2
015
$ $
$ $
$ $
$ $
Se
gmen
t ass
ets:
Expl
orat
ion
and
eval
uatio
n as
sets
29
6,60
9 13
,982
,545
-
- -
- 29
6,60
9 13
,982
,545
Inve
stm
ent i
n as
soci
ate
968,
333
1,82
6,98
7 -
- -
- 96
8,33
3 1,
826,
987
As
sets
hel
d fo
r sal
e 52
0,07
8 -
- -
- -
520,
078
-
Oth
er
290,
496
491,
098
- -
311,
494
338,
258
601,
990
829,
356
2,07
5,51
6 16
,300
,630
-
- 31
1,49
4 33
8,25
8 2,
387,
010
16,6
38,8
88
U
nallo
cate
d as
sets
61
,241
,347
40
,003
,023
Tota
l ass
ets
63,6
28,3
57
56,6
41,9
11
Se
gmen
t lia
bilit
ies
(483
,400
) (7
03,3
81)
(14,
089)
(2
0,67
2)
(293
,813
) (2
48,6
90)
(791
,302
) (9
72,7
43)
(483
,400
) (7
03,3
81)
(14,
089)
(2
0,67
2)
(293
,813
) (2
48,6
90)
(791
,302
) (9
72,7
43)
U
nallo
cate
d lia
bilit
ies
(1,3
67,6
35)
-
Tota
l Lia
bilit
ies
(2,1
58,9
37)
(972
,743
)
Geog
raph
ical
info
rmat
ion
Re
venu
es fr
om e
xter
nal c
usto
mer
s 30
June
201
6 30
June
201
5
$
$
Aust
ralia
20
2,44
5 12
5,75
8
Afric
a -
270,
439
To
tal
202,
445
396,
197
N
on-c
urre
nt a
sset
s 30
June
201
6 30
June
201
5
$
$
Aust
ralia
1,
315,
474
2,03
6,66
6
Cana
da
224,
201
14,3
27,0
20
To
tal
1,53
9,67
5 16
,363
,686
Non
-cur
rent
ass
ets f
or th
is pu
rpos
e co
nsist
of p
rope
rty,
pla
nt a
nd e
quip
men
t, ex
plor
atio
n an
d ev
alua
tion
asse
ts, a
nd in
vest
men
t in
asso
ciat
es.
For
per
sona
l use
onl
y
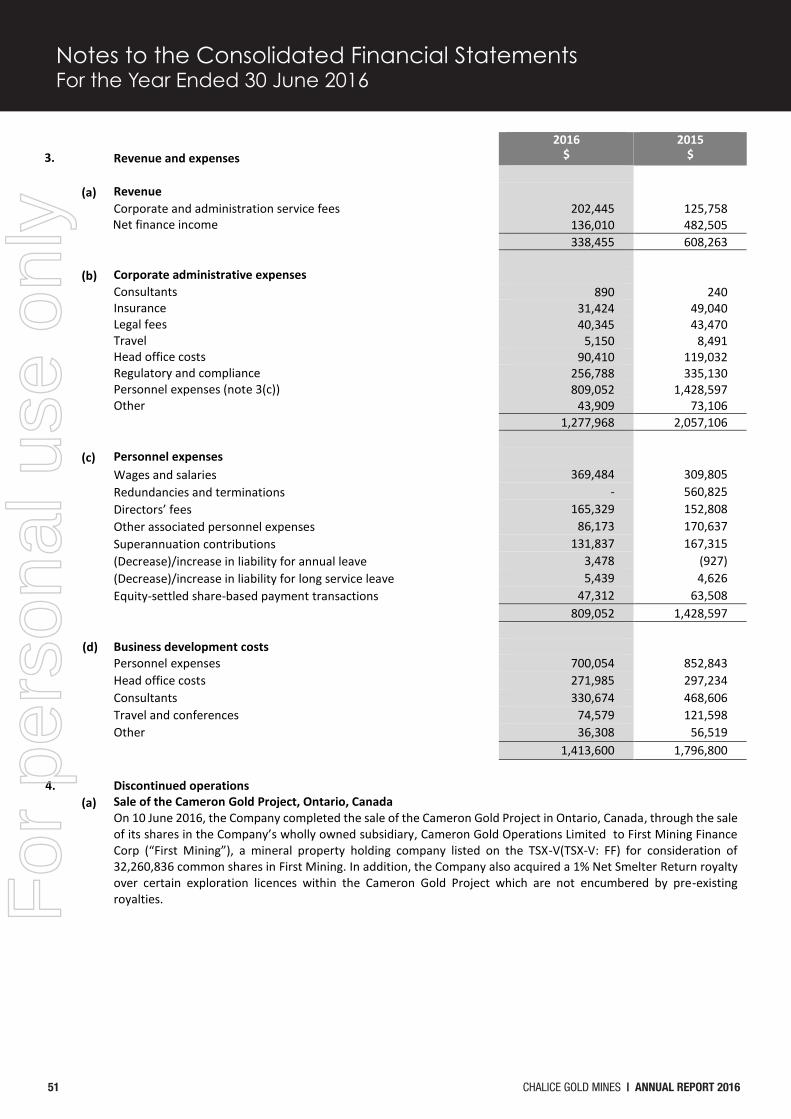
51 CHALICE GOLD MINES | ANNUAL REPORT 2016
Notes to the Consolidated Financial StatementsFor the Year Ended 30 June 2016
Chalice Gold Mines Limited Notes to the Consolidated Financial Statements For the year ended 30 June 2016
51
3. Revenue and expenses 2016
$ 2015
$ (a) Revenue Corporate and administration service fees 202,445 125,758
Net finance income 136,010 482,505 338,455 608,263 (b) Corporate administrative expenses Consultants 890 240 Insurance 31,424 49,040 Legal fees 40,345 43,470 Travel 5,150 8,491 Head office costs 90,410 119,032 Regulatory and compliance 256,788 335,130 Personnel expenses (note 3(c)) 809,052 1,428,597 Other 43,909 73,106 1,277,968 2,057,106 (c) Personnel expenses Wages and salaries 369,484 309,805 Redundancies and terminations - 560,825 Directors’ fees 165,329 152,808 Other associated personnel expenses 86,173 170,637 Superannuation contributions 131,837 167,315 (Decrease)/increase in liability for annual leave 3,478 (927) (Decrease)/increase in liability for long service leave 5,439 4,626 Equity-settled share-based payment transactions 47,312 63,508 809,052 1,428,597 (d) Business development costs Personnel expenses 700,054 852,843 Head office costs 271,985 297,234 Consultants 330,674 468,606 Travel and conferences 74,579 121,598 Other 36,308 56,519 1,413,600 1,796,800 4. Discontinued operations (a) Sale of the Cameron Gold Project, Ontario, Canada
On 10 June 2016, the Company completed the sale of the Cameron Gold Project in Ontario, Canada, through the sale of its shares in the Company’s wholly owned subsidiary, Cameron Gold Operations Limited to First Mining Finance Corp (“First Mining”), a mineral property holding company listed on the TSX-V(TSX-V: FF) for consideration of 32,260,836 common shares in First Mining. In addition, the Company also acquired a 1% Net Smelter Return royalty over certain exploration licences within the Cameron Gold Project which are not encumbered by pre-existing royalties.
For
per
sona
l use
onl
y

CHALICE GOLD MINES | ANNUAL REPORT 2016 52
Notes to the Consolidated Financial StatementsFor the Year Ended 30 June 2016
Chalice Gold Mines Limited Notes to the Consolidated Financial Statements For the year ended 30 June 2016
52
2016 2015
$ $ Consideration received First Mining shares received 27,013,950 - Total consideration 27,013,950 - Less: Net assets disposed of 16,144,308 - Transaction costs 668,066 - Profit on disposal before income taxes 10,201,576 - Income tax expense (1,367,635) - Profit on disposal after tax 8,833,941 - Net assets at date of sale The carrying amount of assets and liabilities as at date of sale were: Trade and other receivables 2,790 - Property , plant and equipment (note 13) 167,716 - Exploration and evaluation expenditure (note 12) 15,973,802 - Total assets 16,144,308 - Trade and other payables - - Total liabilities - - Net assets 16,144,308 - (b) Deferred consideration – Sale of the Zara Gold Project, Eritrea In January 2016, the Company received deferred consideration of US$2 million from China SFECO Group, following
first gold pour at the Zara Gold Project in Eritrea. The US$2 million represents the final tranche for the sale of Chalice’s interest in the Zara Gold Project which was completed in 2012.
2016 2015 $ $ Deferred consideration 2,908,400 - Profit on disposal before income tax 2,908,400 - Income tax expense (50,068) - Overprovision for income tax - 10,958 Profit on disposal after tax 2,858,332 10,958 (c) Total profit after tax from discontinued operations: Cameron Gold Project 8,833,941 - Zara Gold Project 2,858,332 10,958 11,692,273 10,958 5. Auditor’s remuneration Audit services HLB Mann Judd: Audit and review of financial reports 35,000 43,000 Other services 1,000 - 36,000 43,000
For
per
sona
l use
onl
y

53 CHALICE GOLD MINES | ANNUAL REPORT 2016
Notes to the Consolidated Financial StatementsFor the Year Ended 30 June 2016
Chalice Gold Mines Limited Notes to the Consolidated Financial Statements For the year ended 30 June 2016
53
6. Income tax The major components of income tax expense are as follows: 2016 2015 $ $ Current income tax: Current income tax expense (50,068) (259,529) Foreign exploration incentive tax credits 182,379 - 132,311 (259,529) Deferred tax: Temporary differences relating to available for sale investments (1,367,635) - Total income tax reported in the statement of comprehensive income (1,235,324) (259,529) The prima facie income tax expense on pre-tax accounting result on operations and discontinued operations
reconciles to the income tax expense in the financial statements as follows: 2016 2015 $ $ Accounting (loss)/profit from continuing operations (4,442,153) 604,020 Accounting profit from discontinued operations 13,109,976 - 8,667,823 604,020 Income tax calculated at the Australian corporate rate of 30% 2,600,347 181,206 Non-deductible expenses 815,799 277,142 Share based payments 14,194 19,053 Non-assessable foreign income (2,208,302) - Deferred tax assets and liabilities not recognised 483,216 (477,401) Foreign exploration incentive tax credits (182,379) - Research and development tax claim (payable)/benefit - (259,529) Effect of differences in tax rates (287,551) - Income tax expense reported in the statement of comprehensive
income (1,235,324) (259,529)
The tax rate used in the above reconciliation is the corporate rate of 30% payable by Australian corporate entities on taxable profits under Australian tax law. There has been no change in this tax rate since the previous reporting period.
Unrecognised deferred tax balances The following deferred tax assets and liabilities have not been brought to account: 2016 2015 Deferred tax assets comprise: $ $ Revenue losses available for offset against future taxable income 3,785,240 2,995,094 Other deferred tax assets 1,209,714 1,006,136 4,994,954 4,001,230 Deferred tax liabilities comprise: Unrealised foreign exchange gains - (338,048) Other deferred tax liabilities (93,465) (1,997) (93,465) (340,045) Income tax benefit not recognised directly in equity during the year: Share issue costs - (3,830)
For
per
sona
l use
onl
y
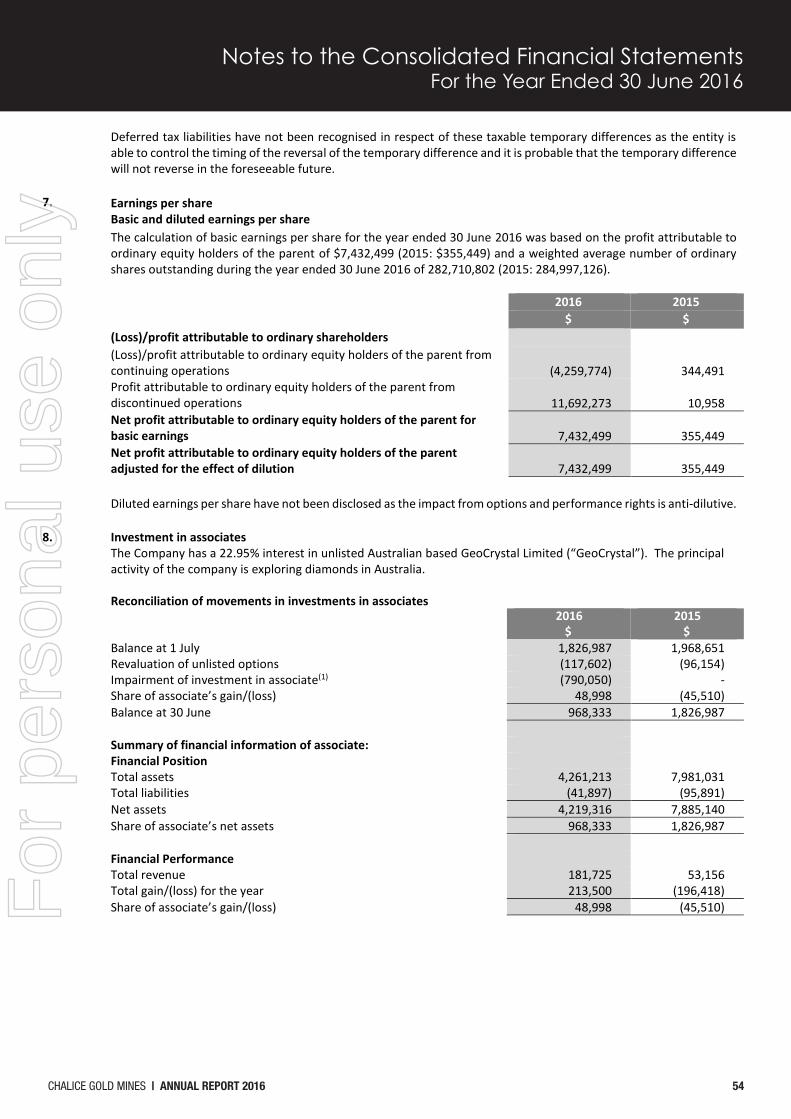
CHALICE GOLD MINES | ANNUAL REPORT 2016 54
Notes to the Consolidated Financial StatementsFor the Year Ended 30 June 2016
Chalice Gold Mines Limited Notes to the Consolidated Financial Statements For the year ended 30 June 2016
54
Deferred tax liabilities have not been recognised in respect of these taxable temporary differences as the entity is able to control the timing of the reversal of the temporary difference and it is probable that the temporary difference will not reverse in the foreseeable future.
7. Earnings per share Basic and diluted earnings per share The calculation of basic earnings per share for the year ended 30 June 2016 was based on the profit attributable to
ordinary equity holders of the parent of $7,432,499 (2015: $355,449) and a weighted average number of ordinary shares outstanding during the year ended 30 June 2016 of 282,710,802 (2015: 284,997,126).
2016 2015 $ $ (Loss)/profit attributable to ordinary shareholders (Loss)/profit attributable to ordinary equity holders of the parent from
continuing operations (4,259,774) 344,491 Profit attributable to ordinary equity holders of the parent from
discontinued operations 11,692,273 10,958 Net profit attributable to ordinary equity holders of the parent for
basic earnings 7,432,499 355,449 Net profit attributable to ordinary equity holders of the parent
adjusted for the effect of dilution 7,432,499 355,449
Diluted earnings per share have not been disclosed as the impact from options and performance rights is anti-dilutive.
8. Investment in associates The Company has a 22.95% interest in unlisted Australian based GeoCrystal Limited (“GeoCrystal”). The principal
activity of the company is exploring diamonds in Australia. Reconciliation of movements in investments in associates 2016
$ 2015
$ Balance at 1 July 1,826,987 1,968,651 Revaluation of unlisted options (117,602) (96,154) Impairment of investment in associate(1) (790,050) - Share of associate’s gain/(loss) 48,998 (45,510) Balance at 30 June 968,333 1,826,987 Summary of financial information of associate: Financial Position Total assets 4,261,213 7,981,031 Total liabilities (41,897) (95,891) Net assets 4,219,316 7,885,140 Share of associate’s net assets 968,333 1,826,987 Financial Performance Total revenue 181,725 53,156 Total gain/(loss) for the year 213,500 (196,418) Share of associate’s gain/(loss) 48,998 (45,510) F
or p
erso
nal u
se o
nly
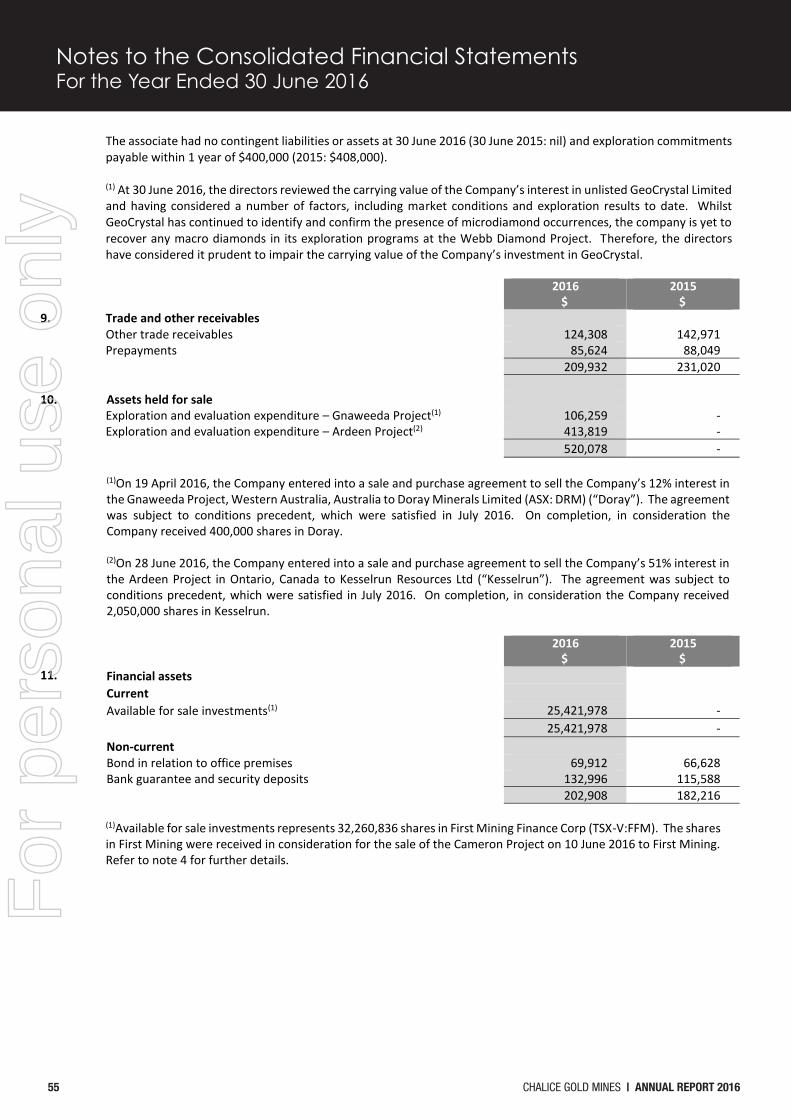
55 CHALICE GOLD MINES | ANNUAL REPORT 2016
Notes to the Consolidated Financial StatementsFor the Year Ended 30 June 2016
Chalice Gold Mines Limited Notes to the Consolidated Financial Statements For the year ended 30 June 2016
55
The associate had no contingent liabilities or assets at 30 June 2016 (30 June 2015: nil) and exploration commitments payable within 1 year of $400,000 (2015: $408,000). (1) At 30 June 2016, the directors reviewed the carrying value of the Company’s interest in unlisted GeoCrystal Limited and having considered a number of factors, including market conditions and exploration results to date. Whilst GeoCrystal has continued to identify and confirm the presence of microdiamond occurrences, the company is yet to recover any macro diamonds in its exploration programs at the Webb Diamond Project. Therefore, the directors have considered it prudent to impair the carrying value of the Company’s investment in GeoCrystal.
2016 $
2015 $
9. Trade and other receivables Other trade receivables 124,308 142,971 Prepayments 85,624 88,049 209,932 231,020 10. Assets held for sale Exploration and evaluation expenditure – Gnaweeda Project(1) 106,259 - Exploration and evaluation expenditure – Ardeen Project(2) 413,819 - 520,078 - (1)On 19 April 2016, the Company entered into a sale and purchase agreement to sell the Company’s 12% interest in
the Gnaweeda Project, Western Australia, Australia to Doray Minerals Limited (ASX: DRM) (“Doray”). The agreement was subject to conditions precedent, which were satisfied in July 2016. On completion, in consideration the Company received 400,000 shares in Doray. (2)On 28 June 2016, the Company entered into a sale and purchase agreement to sell the Company’s 51% interest in the Ardeen Project in Ontario, Canada to Kesselrun Resources Ltd (“Kesselrun”). The agreement was subject to conditions precedent, which were satisfied in July 2016. On completion, in consideration the Company received 2,050,000 shares in Kesselrun.
2016
$ 2015
$ 11. Financial assets Current Available for sale investments(1) 25,421,978 - 25,421,978 - Non-current Bond in relation to office premises 69,912 66,628 Bank guarantee and security deposits 132,996 115,588 202,908 182,216 (1)Available for sale investments represents 32,260,836 shares in First Mining Finance Corp (TSX-V:FFM). The shares
in First Mining were received in consideration for the sale of the Cameron Project on 10 June 2016 to First Mining. Refer to note 4 for further details.
For
per
sona
l use
onl
y

CHALICE GOLD MINES | ANNUAL REPORT 2016 56
Notes to the Consolidated Financial StatementsFor the Year Ended 30 June 2016
Chalice Gold Mines Limited Notes to the Consolidated Financial Statements For the year ended 30 June 2016
56
2016 $
2015 $
12. Exploration and evaluation expenditure Costs carried forward in respect of: Exploration and evaluation phase – at cost Balance at beginning of year 13,982,545 9,056,705 Expenditure incurred 5,016,791 3,383,788 Acquisition of two thirds of a 3% royalty at the Cameron Project - 2,075,327 Sale of the Cameron Gold Project (see note 4(a)) (15,973,802) - Transferred to assets held for sale (see note 10) (520,078) - Exploration and evaluation assets written off (2,201,005) (1,207,782) Effects of movements in exchange rate (7,842) 674,507 Total exploration expenditure 296,609 13,982,545 The recoupment of costs carried forward in relation to areas of interest in the exploration and evaluation phases is
dependent on the successful development and commercial exploitation or sale of the respective areas.
2016
$ 2015
$ 13. Property, plant and equipment Cost 1,015,593 1,561,552 Accumulated depreciation and impairment (740,860) (1,007,398) Net carrying amount 274,733 554,154 Movements in property, plant and equipment: At 1 July net of accumulated depreciation 554,154 771,588 Additions 48,797 129,764 Reclassified as discontinued operations (see note 4(a)) (167,716) - Disposals (5,442) (200,083) Exchange differences (6,243) 35,619 Depreciation charge for the year (148,817) (182,734) At 30 June net of accumulated depreciation and impairment 274,733 554,154 2016
$ 2015
$ 14. Trade and other payables Trade payables 7,138 27,521 Other payables 58,739 47,702 Accrued expenses 491,731 549,915 557,608 625,138 2016
$ 2015
$ 15. Employee benefits Annual leave accrued 53,604 44,076 Provision for long service leave 5,885 446 59,489 44,522
For
per
sona
l use
onl
y
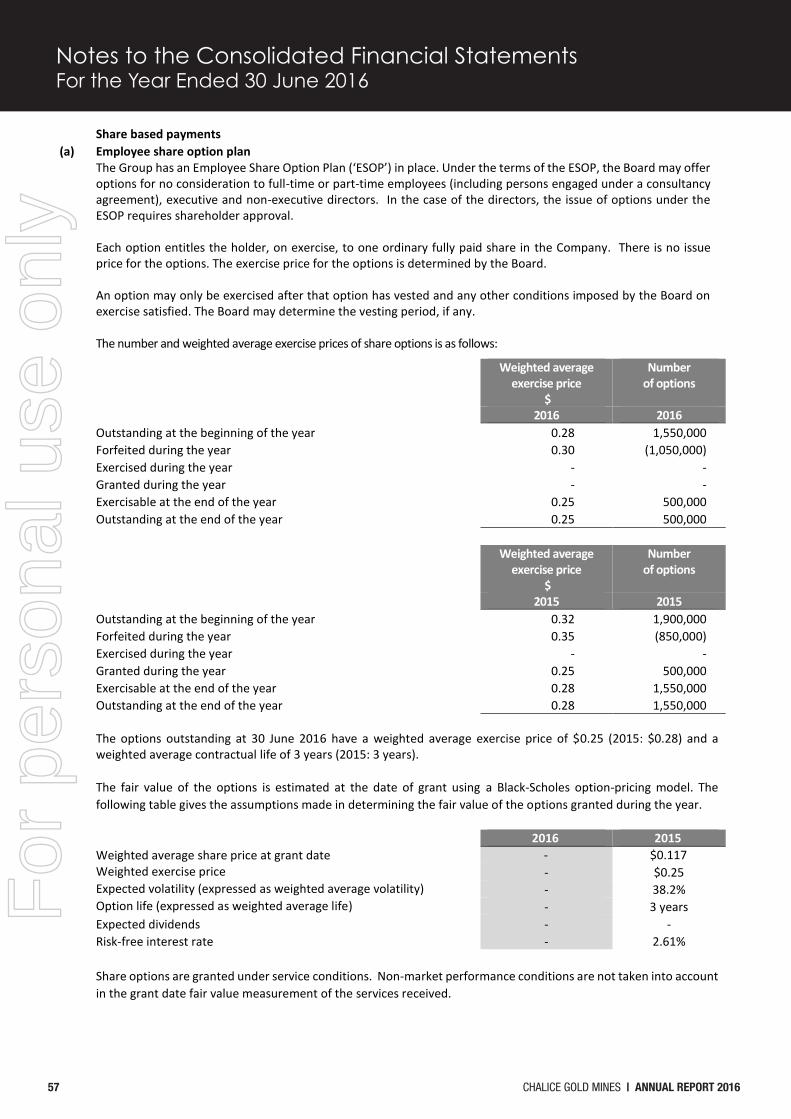
57 CHALICE GOLD MINES | ANNUAL REPORT 2016
Notes to the Consolidated Financial StatementsFor the Year Ended 30 June 2016
Chalice Gold Mines Limited Notes to the Consolidated Financial Statements For the year ended 30 June 2016
57
Share based payments (a) Employee share option plan The Group has an Employee Share Option Plan (‘ESOP’) in place. Under the terms of the ESOP, the Board may offer
options for no consideration to full-time or part-time employees (including persons engaged under a consultancy agreement), executive and non-executive directors. In the case of the directors, the issue of options under the ESOP requires shareholder approval.
Each option entitles the holder, on exercise, to one ordinary fully paid share in the Company. There is no issue price for the options. The exercise price for the options is determined by the Board. An option may only be exercised after that option has vested and any other conditions imposed by the Board on exercise satisfied. The Board may determine the vesting period, if any.
The number and weighted average exercise prices of share options is as follows:
Weighted average exercise price
$
Number of options
2016 2016 Outstanding at the beginning of the year 0.28 1,550,000 Forfeited during the year 0.30 (1,050,000) Exercised during the year - - Granted during the year - - Exercisable at the end of the year 0.25 500,000 Outstanding at the end of the year 0.25 500,000
Weighted average exercise price
$
Number of options
2015 2015 Outstanding at the beginning of the year 0.32 1,900,000 Forfeited during the year 0.35 (850,000) Exercised during the year - - Granted during the year 0.25 500,000 Exercisable at the end of the year 0.28 1,550,000 Outstanding at the end of the year 0.28 1,550,000
The options outstanding at 30 June 2016 have a weighted average exercise price of $0.25 (2015: $0.28) and a weighted average contractual life of 3 years (2015: 3 years). The fair value of the options is estimated at the date of grant using a Black-Scholes option-pricing model. The following table gives the assumptions made in determining the fair value of the options granted during the year.
2016 2015 Weighted average share price at grant date - $0.117 Weighted exercise price - $0.25 Expected volatility (expressed as weighted average volatility) - 38.2% Option life (expressed as weighted average life) - 3 years Expected dividends - - Risk-free interest rate - 2.61% Share options are granted under service conditions. Non-market performance conditions are not taken into account
in the grant date fair value measurement of the services received.
For
per
sona
l use
onl
y
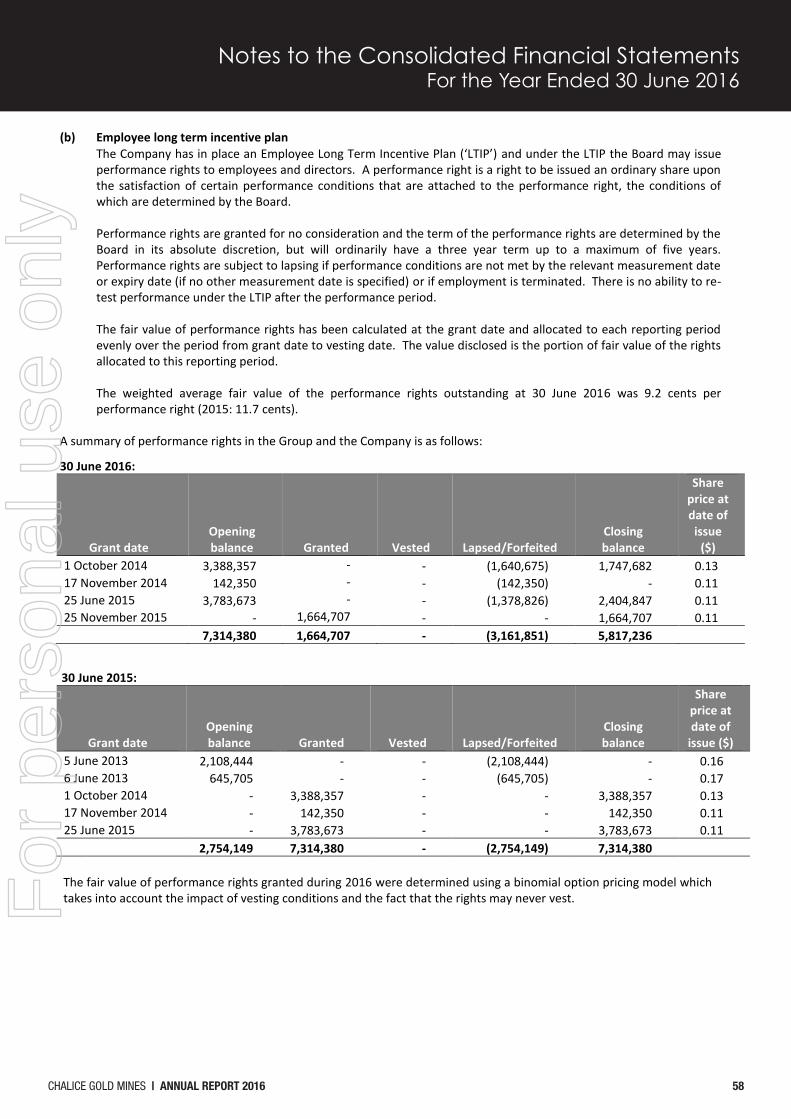
CHALICE GOLD MINES | ANNUAL REPORT 2016 58
Notes to the Consolidated Financial StatementsFor the Year Ended 30 June 2016
Chalice Gold Mines Limited Notes to the Consolidated Financial Statements For the year ended 30 June 2016
58
(b) Employee long term incentive plan The Company has in place an Employee Long Term Incentive Plan (‘LTIP’) and under the LTIP the Board may issue
performance rights to employees and directors. A performance right is a right to be issued an ordinary share upon the satisfaction of certain performance conditions that are attached to the performance right, the conditions of which are determined by the Board. Performance rights are granted for no consideration and the term of the performance rights are determined by the Board in its absolute discretion, but will ordinarily have a three year term up to a maximum of five years. Performance rights are subject to lapsing if performance conditions are not met by the relevant measurement date or expiry date (if no other measurement date is specified) or if employment is terminated. There is no ability to re-test performance under the LTIP after the performance period. The fair value of performance rights has been calculated at the grant date and allocated to each reporting period evenly over the period from grant date to vesting date. The value disclosed is the portion of fair value of the rights allocated to this reporting period. The weighted average fair value of the performance rights outstanding at 30 June 2016 was 9.2 cents per performance right (2015: 11.7 cents).
A summary of performance rights in the Group and the Company is as follows:
30 June 2016:
Grant date Opening balance Granted Vested Lapsed/Forfeited
Closing balance
Share price at date of issue
($) 1 October 2014 3,388,357 - - (1,640,675) 1,747,682 0.13 17 November 2014 142,350 - - (142,350) - 0.11 25 June 2015 3,783,673 - - (1,378,826) 2,404,847 0.11 25 November 2015 - 1,664,707 - - 1,664,707 0.11 7,314,380 1,664,707 - (3,161,851) 5,817,236
30 June 2015:
Grant date Opening balance Granted Vested Lapsed/Forfeited
Closing balance
Share price at date of
issue ($) 5 June 2013 2,108,444 - - (2,108,444) - 0.16 6 June 2013 645,705 - - (645,705) - 0.17 1 October 2014 - 3,388,357 - - 3,388,357 0.13 17 November 2014 - 142,350 - - 142,350 0.11 25 June 2015 - 3,783,673 - - 3,783,673 0.11 2,754,149 7,314,380 - (2,754,149) 7,314,380 The fair value of performance rights granted during 2016 were determined using a binomial option pricing model which
takes into account the impact of vesting conditions and the fact that the rights may never vest. For
per
sona
l use
onl
y

59 CHALICE GOLD MINES | ANNUAL REPORT 2016
Notes to the Consolidated Financial StatementsFor the Year Ended 30 June 2016
Chalice Gold Mines Limited Notes to the Consolidated Financial Statements For the year ended 30 June 2016
59
The following table gives the assumptions made in determining the fair value of the performance rights granted during the year.
2016 2015 Share price at grant date $0.11 $0.12 Exercise price Nil Nil Expected volatility 47% 42.7% Performance period (years) 3 3 Vesting period (years) 3 3 Expected dividends - - Risk-free interest rate 2.11% 2.34% Share based payment transactions The expense recognised during the year is shown in the following table: 2016 2015 $ $ Share options granted in 2015 – equity settled - 4,593 Performance rights granted in 2015 - 58,915 Performance rights granted in 2016 47,312 - Total expenses recognised as personnel expenses 47,312 63,508 16. Other Liabilities Non-current Lease make good provision 46,591 43,132 46,591 43,132 17. Issued Capital There were 282,710,802 shares on issue at 30 June 2016 (2015: 282,710,802). (a) Movements in ordinary shares on issue 2016 2015 No. $ No. $ Balance at beginning of financial year 282,710,802 43,622,887 287,491,719 44,140,306 Share buy-back - - (3,000,000) (311,124) Minimum holding share buy-back - - (1,780,917) (206,295) Balance at end of financial year 282,710,802 43,622,887 282,710,802 43,622,887
Issuance of Ordinary Shares Holders of ordinary shares are entitled to receive dividends as declared from time to time and are entitled to one
vote per share at shareholders’ meetings. In the event of winding up of the Company, the ordinary shareholders rank after all other shareholders and creditors and are fully entitled to any proceeds on liquidation.
(b) Share options 2016 2015 No. No. On issue at 1 July 1,550,000 1,900,000 Options exercised during the year - - Options lapsed during the year (1,050,000) (850,000) Options issued during the year - 500,000 On issue at 30 June 500,000 1,550,000
At 30 June 2016 the Company had 500,000 unlisted options on issue under the following terms and conditions:
Number Expiry Date Exercise Price $
500,000 31 October 2017 0.25
For
per
sona
l use
onl
y

CHALICE GOLD MINES | ANNUAL REPORT 2016 60
Notes to the Consolidated Financial StatementsFor the Year Ended 30 June 2016
Chalice Gold Mines Limited Notes to the Consolidated Financial Statements For the year ended 30 June 2016
60
(c) Performance rights 2016 2015 No. No. On issue at 1 July 7,314,380 2,754,149 Issue of performance rights under the Employee Long Term Incentive Plan 1,664,707 7,314,380 Performance rights vested - - Performance rights lapsed (3,161,851) (2,754,149) On issue at 30 June 5,817,236 7,314,380 At 30 June 2016 the Company had 5,817,236 performance rights on issue under the following terms and conditions:
Number Terms Expiry Date Exercise Price $
1,747,682 The number of performance rights that will vest will be solely dependent on the Company’s share price as at the measurement date of 30 June 2016 as compared to the Share price hurdles outlined in the Remuneration Report.
30 June 2018 -
4,069,554 The number of performance rights that will vest will be solely dependent on the Company’s share price as at the measurement date of 30 June 2017 as compared to the Share price hurdles outlined in the Remuneration Report.
30 June 2019 -
18. Retained earnings and reserves
(a) Movements in retained earnings attributable to owners of the parent: 2016 2015
$ $ Balance at beginning of financial year 14,890,400 14,421,779 Profit for the year attributable to owners of the parent 7,432,499 355,449 Transfers between equity items 65,613 113,172 Balance at end of financial year 22,388,512 14,890,400
(b) Nature and purpose of reserves Other capital reserves (i) Share-based payments reserve The share-based payments reserve is used to recognise the value of equity-settled share-based payment transactions provided to employees, including key management personnel, as part of their remuneration. Refer to note 15 for further details of these plans. All other reserves as stated in the consolidated statement of changes in equity (ii) Foreign currency translation reserve The foreign currency reserve is used to record exchange differences arising from the translation of the financial statements of foreign subsidiaries. It is also used to record the effect of exchange variances resulting from net investments in foreign operations. (iii) Investment revaluation reserve The investment revaluation reserve comprises the cumulative net change in the fair value of available-for-sale financial assets and investments in associates until the investments are derecognised or impaired.
For
per
sona
l use
onl
y
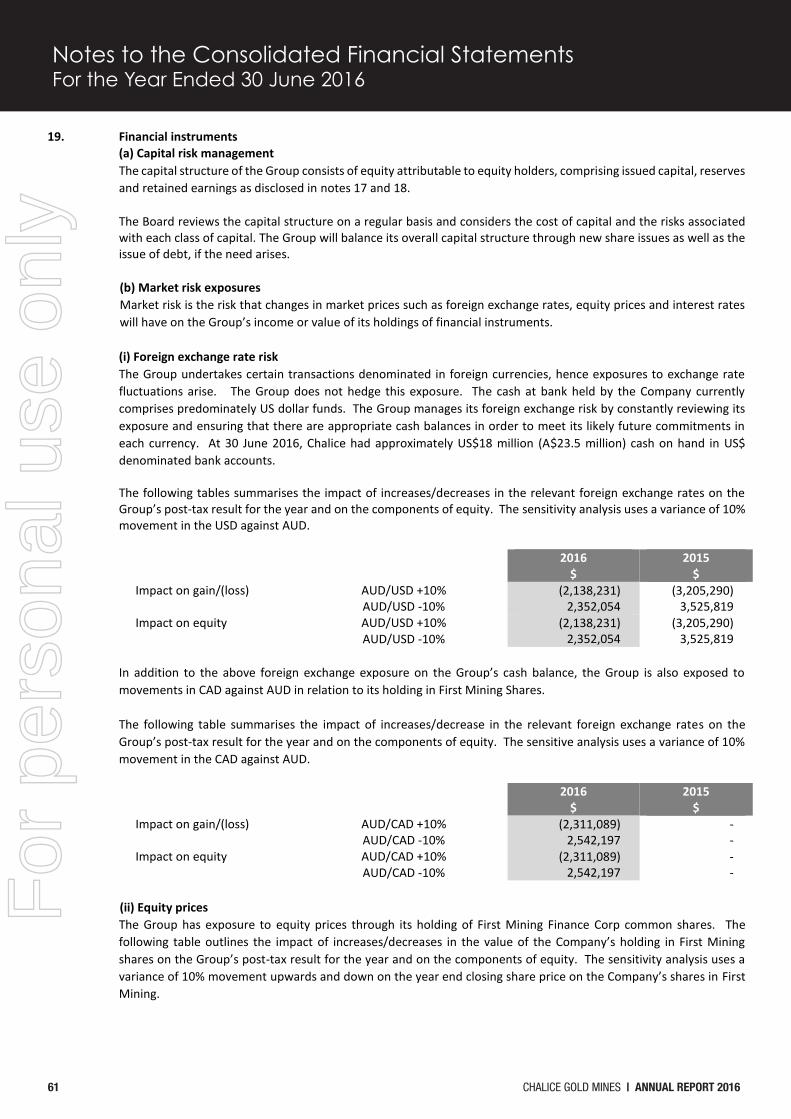
61 CHALICE GOLD MINES | ANNUAL REPORT 2016
Notes to the Consolidated Financial StatementsFor the Year Ended 30 June 2016
Chalice Gold Mines Limited Notes to the Consolidated Financial Statements For the year ended 30 June 2016
61
19. Financial instruments (a) Capital risk management The capital structure of the Group consists of equity attributable to equity holders, comprising issued capital, reserves
and retained earnings as disclosed in notes 17 and 18. The Board reviews the capital structure on a regular basis and considers the cost of capital and the risks associated with each class of capital. The Group will balance its overall capital structure through new share issues as well as the issue of debt, if the need arises.
(b) Market risk exposures Market risk is the risk that changes in market prices such as foreign exchange rates, equity prices and interest rates
will have on the Group’s income or value of its holdings of financial instruments.
(i) Foreign exchange rate risk The Group undertakes certain transactions denominated in foreign currencies, hence exposures to exchange rate
fluctuations arise. The Group does not hedge this exposure. The cash at bank held by the Company currently comprises predominately US dollar funds. The Group manages its foreign exchange risk by constantly reviewing its exposure and ensuring that there are appropriate cash balances in order to meet its likely future commitments in each currency. At 30 June 2016, Chalice had approximately US$18 million (A$23.5 million) cash on hand in US$ denominated bank accounts. The following tables summarises the impact of increases/decreases in the relevant foreign exchange rates on the Group’s post-tax result for the year and on the components of equity. The sensitivity analysis uses a variance of 10% movement in the USD against AUD.
2016 $
2015 $
Impact on gain/(loss) AUD/USD +10% AUD/USD -10%
(2,138,231) 2,352,054
(3,205,290) 3,525,819
Impact on equity AUD/USD +10% AUD/USD -10%
(2,138,231) 2,352,054
(3,205,290) 3,525,819
In addition to the above foreign exchange exposure on the Group’s cash balance, the Group is also exposed to
movements in CAD against AUD in relation to its holding in First Mining Shares. The following table summarises the impact of increases/decrease in the relevant foreign exchange rates on the Group’s post-tax result for the year and on the components of equity. The sensitive analysis uses a variance of 10% movement in the CAD against AUD.
2016
$ 2015
$ Impact on gain/(loss) AUD/CAD +10%
AUD/CAD -10% (2,311,089)
2,542,197 - -
Impact on equity AUD/CAD +10% AUD/CAD -10%
(2,311,089) 2,542,197
- -
(ii) Equity prices The Group has exposure to equity prices through its holding of First Mining Finance Corp common shares. The
following table outlines the impact of increases/decreases in the value of the Company’s holding in First Mining shares on the Group’s post-tax result for the year and on the components of equity. The sensitivity analysis uses a variance of 10% movement upwards and down on the year end closing share price on the Company’s shares in First Mining.
For
per
sona
l use
onl
y

CHALICE GOLD MINES | ANNUAL REPORT 2016 62
Notes to the Consolidated Financial StatementsFor the Year Ended 30 June 2016
Chalice Gold Mines Limited Notes to the Consolidated Financial Statements For the year ended 30 June 2016
62
2016 $
2015 $
Impact on gain/(loss) Share price +10% Share price -10%
2,542,198 (2,310,298)
- -
Impact on equity Share price +10% Share price -10%
2,542,198 (2,310,298)
- -
(iii) Interest rate risk
At reporting date the Group’s exposure to market risk for changes in interest rates relates primarily to the Group’s short term cash deposits. The Group is not exposed to cash flow volatility from interest rate changes on borrowings, as it does not have any short or long term borrowings. Chalice constantly analyses its exposures to interest rates, with consideration given to potential renewal of existing positions and the period to which deposits may be fixed. The Group considers preservation of capital as the primary objective as opposed to maximising interest rate yields by investing in higher risk investments. At reporting date, the following financial assets were exposed to fluctuations in interest rates:
2016
$ 2015
$ Cash and cash equivalents 35,733,786 39,864,989
The following sensitivity analysis is based on the interest rate risk exposures in existence at reporting date. The sensitivity is based on a change of 100 basis points in interest rates at reporting date. In the year ended 30 June 2016, if interest rates had moved by 100 basis points, with all other variables held constant, the post-tax result for the Group would have been affected as follows: 2016
$ 2015
$ Impact on gain/(loss) 100 bp increase
100 bp decrease 356,370
(356,370) 398,079
(398,079) Impact on equity 100 bp increase
100 bp decrease 356,370
(356,370) 398,079
(398,079)
(c) Credit risk exposure Credit risk is the risk of financial loss to the Group if a customer or counterparty to a financial instrument fails to meet
its contractual obligations. The maximum exposure to credit risk, excluding the value of any collateral or other security, at balance date to recognised financial assets is the carrying amount, net of any allowance for doubtful debts, as disclosed in the notes to the financial statements. It is not the Company’s policy to securitise its trade and other receivables, however, receivable balances are monitored on an ongoing basis. In addition, the Company currently diversifies its cash holdings across three of the main Australian financial institutions.
For
per
sona
l use
onl
y

63 CHALICE GOLD MINES | ANNUAL REPORT 2016
Notes to the Consolidated Financial StatementsFor the Year Ended 30 June 2016
Chalice Gold Mines Limited Notes to the Consolidated Financial Statements For the year ended 30 June 2016
63
(d) Liquidity risk exposure Liquidity risk is the risk that the Group will not be able to meet its financial obligations as they fall due. The Board of
Directors actively monitors the Group’s ability to pay its debts as and when they fall due by regularly reviewing the current and forecast cash position based on the expected future activities. The Group has non-derivative financial liabilities which include trade and other payables of $557,608 (2015: $625,138) all of which are due within 60 days. In light of the Group’s current financial assets and low expenditures relative to those assets, the Group could continue to operate as a going concern for a considerable period of time, subject to any changes to the Group structure or undertaking a material transaction.
(e) Fair value of financial instruments The Directors consider the carrying value of the financial assets and financial liabilities are recognised in the
consolidated financial statements approximate their fair values. In particular, available for sale investments which represents 32,260,836 shares in TSX-V listed First Mining Finance Corp (refer note 11) is measured at fair value using quoted market prices at the reporting date (Level 1 fair value measurement). The directors have assessed that the fair value of cash and short-term deposits, trade receivables, trade payables and other current liabilities approximate their carrying amounts largely due to the short-term maturities of these instruments.
20. Parent Entity 2016 2015
Financial position $ $ Assets Current assets 35,908,701 39,955,881 Non-current assets 28,278,498 23,365,507 Total assets 64,187,199 63,321,388 Liabilities Current liabilities 867,041 473,715 Non-current liabilities 29,674,415 28,284,446 Total liabilities 30,541,456 28,758,161 Net assets 33,645,743 34,563,227 Equity Issued capital 43,622,888 43,622,888 Accumulated losses (10,156,702) (9,257,521) Reserves 179,557 197,860
Total equity 33,645,743 34,563,227 2016 2015 $ $ Financial performance Loss for the year (965,227) (1,656,610) Total comprehensive loss (965,227) (1,656,610)
For
per
sona
l use
onl
y
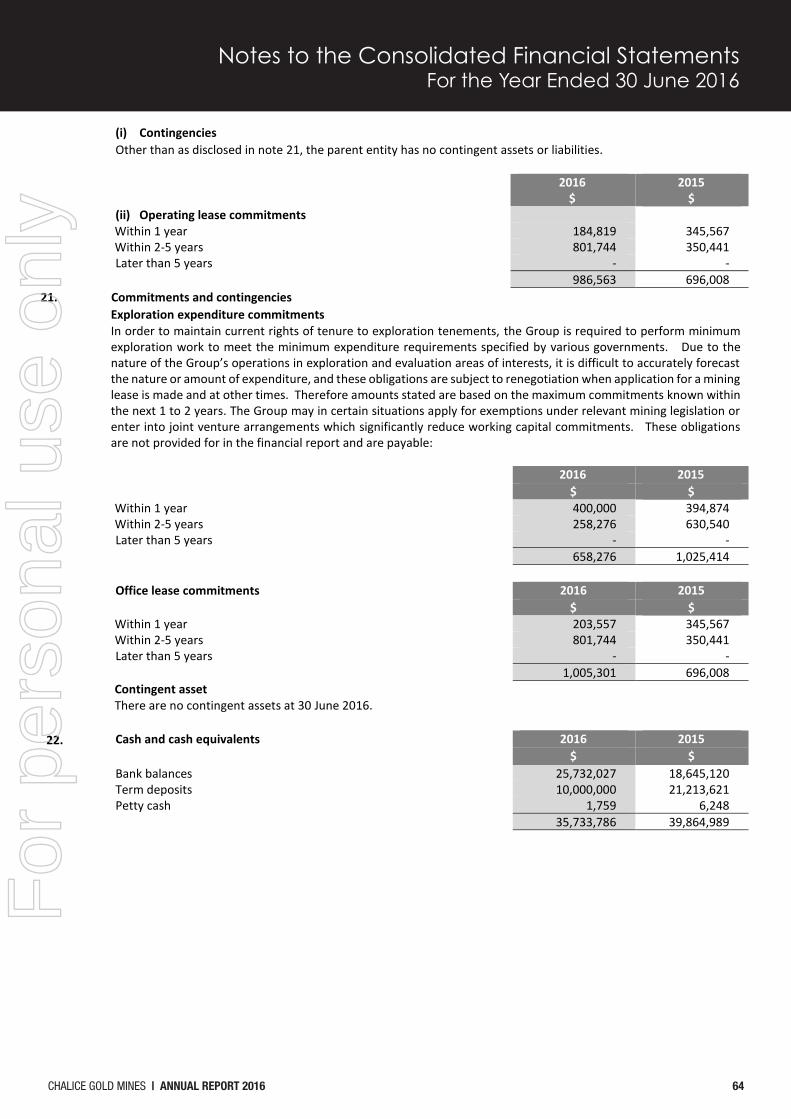
CHALICE GOLD MINES | ANNUAL REPORT 2016 64
Notes to the Consolidated Financial StatementsFor the Year Ended 30 June 2016
Chalice Gold Mines Limited Notes to the Consolidated Financial Statements For the year ended 30 June 2016
64
Commitments and contingencies (i) Contingencies Other than as disclosed in note 21, the parent entity has no contingent assets or liabilities. 2016 2015 $ $ (ii) Operating lease commitments Within 1 year 184,819 345,567 Within 2-5 years 801,744 350,441 Later than 5 years - - 986,563 696,008
21. Commitments and contingencies Exploration expenditure commitments In order to maintain current rights of tenure to exploration tenements, the Group is required to perform minimum
exploration work to meet the minimum expenditure requirements specified by various governments. Due to the nature of the Group’s operations in exploration and evaluation areas of interests, it is difficult to accurately forecast the nature or amount of expenditure, and these obligations are subject to renegotiation when application for a mining lease is made and at other times. Therefore amounts stated are based on the maximum commitments known within the next 1 to 2 years. The Group may in certain situations apply for exemptions under relevant mining legislation or enter into joint venture arrangements which significantly reduce working capital commitments. These obligations are not provided for in the financial report and are payable:
2016 2015 $ $ Within 1 year 400,000 394,874 Within 2-5 years 258,276 630,540 Later than 5 years - - 658,276 1,025,414 Office lease commitments 2016 2015 $ $ Within 1 year 203,557 345,567 Within 2-5 years 801,744 350,441 Later than 5 years - - 1,005,301 696,008 Contingent asset There are no contingent assets at 30 June 2016. 22. Cash and cash equivalents 2016 2015 $ $ Bank balances 25,732,027 18,645,120 Term deposits 10,000,000 21,213,621 Petty cash 1,759 6,248 35,733,786 39,864,989
For
per
sona
l use
onl
y

65 CHALICE GOLD MINES | ANNUAL REPORT 2016
Notes to the Consolidated Financial StatementsFor the Year Ended 30 June 2016
Chalice Gold Mines Limited Notes to the Consolidated Financial Statements For the year ended 30 June 2016
65
Reconciliation of cash flows from operating activities 2016 2015 $ $ (Loss)/Profit after tax from continuing operations (4,259,774) 344,491 Profit after tax from discontinuing operations 11,692,273 10,958 Profit after tax 7,432,499 355,449 Adjustments for: Depreciation and amortisation 64,197 92,694 Business development costs 1,413,600 1,796,800 Income tax (benefit)/expense (182,379) 259,951 Profit from discontinued operations (11,692,273) (10,958) Gain on sale of plant and equipment - (270,439) Foreign exchange gains (917,214) (4,925,210) Exploration and evaluation assets written off 2,201,005 1,207,782 Share of associate’s (net gain)/loss (48,998) 45,510 Impairment of investment in associate 790,050 - Equity-settled share-based payment expenses 47,312 63,508 Operating loss before changes in working capital and provisions (892,201) (1,373,955) (Increase)/decrease in trade and other receivables 10,751 122,383 (Increase)/decrease in financial assets (5,140) 47,456 (decrease)/Increase in trade creditors and other liabilities 13,839 (397,858) (decrease)/increase in provisions 12,378 (27,134) Net cash used in operating activities (860,373) (1,629,108)
23. Related parties
Key management personnel
The following were key management personnel of the Group at any time during the reporting period and unless otherwise indicated were Key Management Personnel (‘KMP’) for the entire period:
Executive Directors T R B Goyder (Managing Director)
Non-executive Directors
A W Kiernan (Chairman) S P Quin M S Ball (appointed 24 June 2016) Executives
R K Hacker (Chief Financial Officer) G Snow (Chief Operating Officer) (ceased employment 18 March 2016) K M Frost (General Manager – Exploration) (commenced 1 March 2016)
The KMP compensation is as follows:
2016 2015 $ $ Short-term employee benefits 1,224,950 1,317,084 Post-employment benefits 101,632 147,719 Termination benefits - 549,609 Long term benefits - 4,605 Share-based payment 121,274 98,504 1,447,856 2,117,521
For
per
sona
l use
onl
y

CHALICE GOLD MINES | ANNUAL REPORT 2016 66
Notes to the Consolidated Financial StatementsFor the Year Ended 30 June 2016
Chalice Gold Mines Limited Notes to the Consolidated Financial Statements For the year ended 30 June 2016
66
Individual director’s and executive’s compensation disclosures The Group has transferred the detailed remuneration disclosures to the Directors’ Report in accordance with
Corporations Amendment Regulations 2006 (No. 4). These remuneration disclosures are provided in the Remuneration Report section of the Directors’ Report under Key Management Personnel remuneration and are designated as audited.
Loans to key management personnel and their related parties
No loans were made to KMP or their related parties. Other key management personnel transactions with the Group A number of KMP, or their related parties, hold positions in other entities that result in them having control or
significant influence over the financial or operating policies of those entities.
A number of these entities transacted with the Group in the reporting period. The terms and conditions of the transactions with management persons or their related parties were no more favourable than those available, or which might reasonably be expected to be available, on similar transactions to non-director related entities on an arm’s length basis.
The aggregate expense/(income) recognised during the year relating to key management personnel or their related parties was as follows:
Key management personnel Transaction Note 2016
$ 2015
$ A W Kiernan Consulting services (i) 40,500 72,500 Liontown Resources Limited Corporate services (ii) (66,000) (66,000) Uranium Equities Limited Corporate services (ii) (66,000) (49,500) PhosEnergy Limited Corporate services (ii) (24,436) (10,000) (i) The Group used the consulting of Mr Kiernan during the course of the financial year. Amounts were billed
based on normal market rates for such services and were due and payable under normal payment terms. (ii) The Group supplied corporate services including accounting and company secretarial services under a
Corporate Services Agreement to Liontown Resources Limited (“LTR”), Uranium Equities Limited (“UEL”) and PhosEnergy Limited (“PEL”). Mr Goyder is a director of LTR, UEQ and PEL. Mr Kiernan is a director of PEL. Amounts were billed on a proportionate share of the cost to the Group of providing the services and are due and payable under normal payment terms.
Amounts outstanding (to)/from the above related parties at reporting date arising from these transactions were as
follows: 2016 2015 Assets and liabilities arising from the above transactions $ $
Current payables (15,000) (6,000) Trade debtors 12,800 19,050 (2,200) 13,050
For
per
sona
l use
onl
y

67 CHALICE GOLD MINES | ANNUAL REPORT 2016
Notes to the Consolidated Financial StatementsFor the Year Ended 30 June 2016
Chalice Gold Mines Limited Notes to the Consolidated Financial Statements For the year ended 30 June 2016
67
24. Related party disclosure Significant investments in subsidiaries
The consolidated financial statements include the financial statements of Chalice Gold Mines Limited and its subsidiaries listed in the following table:
Name Country of
Incorporation % Equity Interest
Investment $
2016 2015 2016 2015 Parent entity Chalice Gold Mines Limited Australia Subsidiaries Chalice Operations Pty Ltd (i) Australia 100 100 6,802,388 6,802,388 Chalice Gold Mines (Eritrea) Pty Ltd Australia 100 100 - - Western Rift Pty Ltd (ii) Australia 100 100 20,000 20,000 CGM Minerals Pty Ltd Australia 100 - 1 - CGM (Lithium) Pty Ltd Australia 100 - 1 - (i) Subsidiaries of Chalice Operations Pty Ltd Keren Mining Pty Ltd Australia 100 100 - - Universal Gold Pty Ltd Australia 100 100 1,358,223 1,358,223
Sub-Sahara Resources (Eritrea) Pty Ltd Australia 100 100 -
- (ii) Subsidiaries of Western Rift Pty Ltd Chalice Gold Mines (Ontario) Inc.(iii) Canada 100 100 5,551,687 5,551,687 Coventry Rainy Inc. Canada 100 100 1,402,414 1,402,414 Coventry Ontario Inc. Canada 100 100 415,313 415,313 (iii) Subsidiaries of Chalice Gold Mines (Ontario) Inc.
Cameron Gold Operations Ltd(1) Canada - 100 - 5,709,942 Chalice Gold Mines (Quebec) Inc. Canada 100 100 1.04 1.24 Chalice Gold Mines (Exploration) Inc. Canada 100 100 1.04 1.24
(1)On 10 June 2016, the Company sold its wholly owned subsidiary, Cameron Gold Operations Ltd, which held the
Cameron Gold Project, to First Mining Finance Corp (refer note 4(a) for further details).
25. Events subsequent to reporting date On 4 July 2016, the Company commenced acquiring shares via the Company’s on-market share buy-back facility. To
date the Company has acquired 12,430,000 shares on market for a total value of $2.3 million. At the date of this report, the Company’s total shares on issue was 270,280,802.
On 4 July 2016, the Company completed the sale of the Gnaweeda project and in consideration, the Company received 400,000 shares in Doray Mining Limited. In addition, the sale of the Ardeen Project completed and the Company received 2,050,000 shares in Kesselrun Resources Inc.
For
per
sona
l use
onl
y

CHALICE GOLD MINES | ANNUAL REPORT 2016 68
Directors’ Declaration
68
Chalice Gold Mines Limited Directors’ Declaration
1. In the opinion of the directors of Chalice Gold Mines Limited (the ‘Company’):
a. the financial statements, notes and the additional disclosures in the directors’ report designated as audited, of the Group are in accordance with the Corporations Act 2001 including:
i. giving a true and fair view of the Group’s financial position as at 30 June 2016 and of its performance
for the year ended on that date; and
ii. complying with Australian Accounting Standards (including the Australian Accounting Interpretations) and the Corporations Regulations 2001.
b. there are reasonable grounds to be that the Company will be able to pay its debts as and when they become
due and payable. c. The statements and notes thereto are in accordance with international Financial Reporting Standards issued
by the International Accounting Standards Board.
2. This declaration has been made after receiving the declarations required to be made to the directors in accordance with Section 295A of the Corporations Act 2001 for the financial year ended 30 June 2016.
This declaration is signed in accordance with a resolution of the Board of Directors. Dated at Perth the 13th day of September 2016 Signed in accordance with a resolution of the Directors:
Tim Goyder Managing Director
For
per
sona
l use
onl
y
69 CHALICE GOLD MINES | ANNUAL REPORT 2016
Independent Auditor’s Report
HLB Mann Judd (WA Partnership) ABN 22 193 232 714 Level 4, 130 Stirling Street Perth WA 6000. PO Box 8124 Perth BC 6849 Telephone +61 (08) 9227 7500. Fax +61 (08) 9227 7533. Email: [email protected]. Website: http://www.hlb.com.auLiability limited by a scheme approved under Professional Standards Legislation
HLB Mann Judd (WA Partnership) is a member of
International, a worldwide organisation of accounting firms and business advisers.
72
INDEPENDENT AUDITOR’S REPORT To the members of Chalice Gold Mines Limited
Report on the Financial Report
We have audited the accompanying financial report of Chalice Gold Mines Limited (“the company”), which comprises the consolidated statement of financial position as at 30 June 2016, the consolidated statement of comprehensive income, the consolidated statement of changes in equity and the consolidated statement of cash flows for the year then ended, notes comprising a summary of significant accounting policies and other explanatory information, and the directors’ declaration of the Group comprising the company and the entities it controlled at the year’s end or from time to time during the financial year.
Directors’ responsibility for the financial report
The directors of the company are responsible for the preparation of the financial report that gives a true and fair view in accordance with Australian Accounting Standards and the Corporations Act 2001 and for such internal control as the directors determine is necessary to enable the preparation of the financial report that gives a true and fair view and is free from material misstatement, whether due to fraud or error.
In Note 1(b), the directors also state, in accordance with Accounting Standard AASB 101: Presentation of Financial Statements, the consolidated financial statements comply with International Financial Reporting Standards.
Auditor’s responsibility
Our responsibility is to express an opinion on the financial report based on our audit. We conducted our audit in accordance with Australian Auditing Standards. Those standards require that we comply with relevant ethical requirements relating to audit engagements and plan and perform the audit to obtain reasonable assurance about whether the financial report is free from material misstatement.
An audit involves performing procedures to obtain audit evidence about the amounts and disclosures in the financial report. The procedures selected depend on the auditor’s judgement, including the assessment of the risks of material misstatement of the financial report, whether due to fraud or error. In making those risk assessments, the auditor considers internal control relevant to the Group’s preparation of the financial report that gives a true and fair view in order to design audit procedures that are appropriate in the circumstances, but not for the purpose of expressing an opinion on the effectiveness of internal control. An audit also includes evaluating the appropriateness of accounting policies used and the reasonableness of accounting estimates made by the directors, as well as evaluating the overall presentation of the financial report.
Our audit did not involve an analysis of the prudence of business decisions made by directors or management.
We believe that the audit evidence we have obtained is sufficient and appropriate to provide a basis for our audit opinion.
Independence
In conducting our audit, we have complied with the independence requirements of the Corporations Act 2001.
For
per
sona
l use
onl
y
CHALICE GOLD MINES | ANNUAL REPORT 2016 70
Independent Auditor’s Report
73
Auditor’s opinion
In our opinion:
(a) the financial report of Chalice Gold Mines Limited is in accordance with the Corporations Act 2001,including:
(i) giving a true and fair view of the Group’s financial position as at 30 June 2016 and its performance for the year ended on that date; and
(ii) complying with Australian Accounting Standards and the Corporations Regulations 2001; and
(b) the financial report also complies with International Financial Reporting Standards as disclosed in Note 1(b).
Report on the Remuneration Report
We have audited the Remuneration Report included in the directors’ report for the year ended 30 June 2016. The directors of the company are responsible for the preparation and presentation of the Remuneration Report in accordance with section 300A of the Corporations Act 2001. Our responsibility is to express an opinion on the Remuneration Report, based on our audit conducted in accordance with Australian Auditing Standards.
Auditor’s opinion
In our opinion, the Remuneration Report of Chalice Gold Mines Limited for the year ended 30 June 2016 complies with section 300A of the Corporations Act 2001.
HLB Mann Judd Chartered Accountants
L Di Giallonardo Partner
Perth, Western Australia 13 September 2016
For
per
sona
l use
onl
y
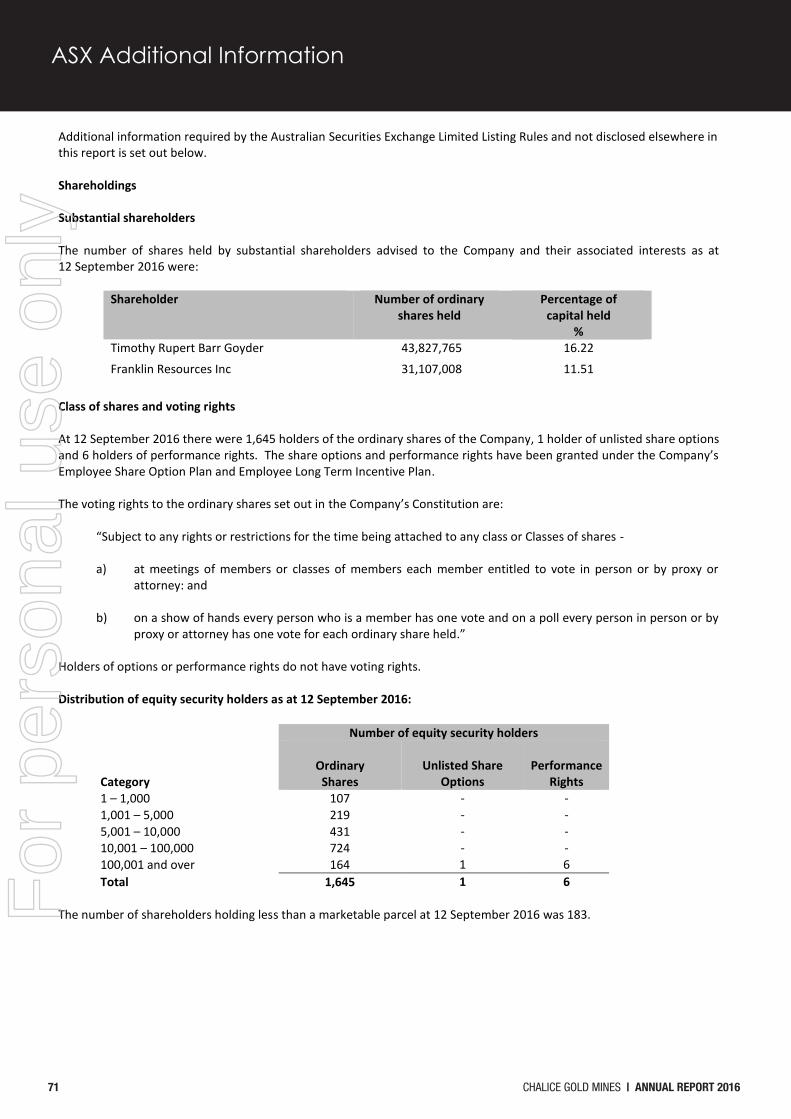
71 CHALICE GOLD MINES | ANNUAL REPORT 2016
ASX Additional Information
71
Chalice Gold Mines Limited ASX Additional Information
Additional information required by the Australian Securities Exchange Limited Listing Rules and not disclosed elsewhere in this report is set out below. Shareholdings Substantial shareholders The number of shares held by substantial shareholders advised to the Company and their associated interests as at 12 September 2016 were:
Shareholder Number of ordinary
shares held Percentage of
capital held %
Timothy Rupert Barr Goyder 43,827,765 16.22
Franklin Resources Inc 31,107,008 11.51
Class of shares and voting rights At 12 September 2016 there were 1,645 holders of the ordinary shares of the Company, 1 holder of unlisted share options and 6 holders of performance rights. The share options and performance rights have been granted under the Company’s Employee Share Option Plan and Employee Long Term Incentive Plan. The voting rights to the ordinary shares set out in the Company’s Constitution are: “Subject to any rights or restrictions for the time being attached to any class or Classes of shares -
a) at meetings of members or classes of members each member entitled to vote in person or by proxy or
attorney: and
b) on a show of hands every person who is a member has one vote and on a poll every person in person or by proxy or attorney has one vote for each ordinary share held.”
Holders of options or performance rights do not have voting rights.
Distribution of equity security holders as at 12 September 2016:
Number of equity security holders Category
Ordinary
Shares
Unlisted Share
Options
Performance
Rights 1 – 1,000 107 - - 1,001 – 5,000 219 - - 5,001 – 10,000 431 - - 10,001 – 100,000 724 - - 100,001 and over 164 1 6 Total 1,645 1 6
The number of shareholders holding less than a marketable parcel at 12 September 2016 was 183. F
or p
erso
nal u
se o
nly

CHALICE GOLD MINES | ANNUAL REPORT 2016 72
ASX Additional InformationChalice Gold Mines Limited ASX Additional Information
72
Twenty largest Ordinary Fully Paid Shareholders as at 12 September 2016
Name
Number of ordinary shares held
Percentage of
capital held %
Timothy R B Goyder 43,827,765 16.22 National Nominees Limited 40,976,058 15.16 J P Morgan Nominees Australia Limited 21,309,688 7.88 Citicorp Nominees Pty Limited 16,835,091 6.23 ABN Amro Clearing Sydney Nominees Pty Ltd <Custodian A/C> 11,741,725 4.34 Canadian Registry Control 10,696,238 3.96 Mr Mark Savage <Mark Savage Revocable A/C> 7,948,724 2.94 Brispot Nominees Pty Ltd <House Head Nomiee No 1 A/C> 7,806,283 2.89 UBS Nominees Pty Ltd 6,547,516 2.42 Jetosea Pty Ltd 4,178,340 1.55 HSBC Custody Nominees (Australia) Limited 4,070,289 1.51 Buttonwood Nominees Pty Ltd 4,025,438 1.49 Claw Pty Ltd <Corp Super Fund A/C> 4,000,000 1.48 Calm Holdings Pty Ltd <Clifton Super Fund A/C> 3,750,000 1.39 Piat Corp Pty Ltd 2,400,000 0.89 Clement Pty Ltd <D&M Goyder Family S/Fund A/C> 1,810,681 0.67 Anthony Kiernan 1,622,041 0.60 Super Seed Pty Ltd <The Seed Family A/C> 1,500,000 0.55 Teragoal Pty Ltd <Gray Family A/C> 1,400,000 0.52 Mr Philip Scott Button + Ms Philippa Ann Nicol 1,348,261 0.50 Total 197,794,138 73.18
For
per
sona
l use
onl
y

ANNUAL FINANCIAL
REPORT30 JUNE 2016
CH
ALIC
E GO
LD M
INES LIM
ITED |
AN
NU
AL REPO
RT 20
16
CHALICE GOLD MINES LIMITEDABN 47 116 648 956
Chalice Gold Mines LimitedLevel 2, 1292 Hay Street
West Perth, Western Australia 6005
T (+618) 9322 3960
F (+618) 9322 5800
W chalicegold.com
For
per
sona
l use
onl
y