for lease retail - loopnetimages4.loopnet.com/d2/bvdktuko16tbpz_t6ayxbedihyc2-lnb6_da… · •...
TRANSCRIPT
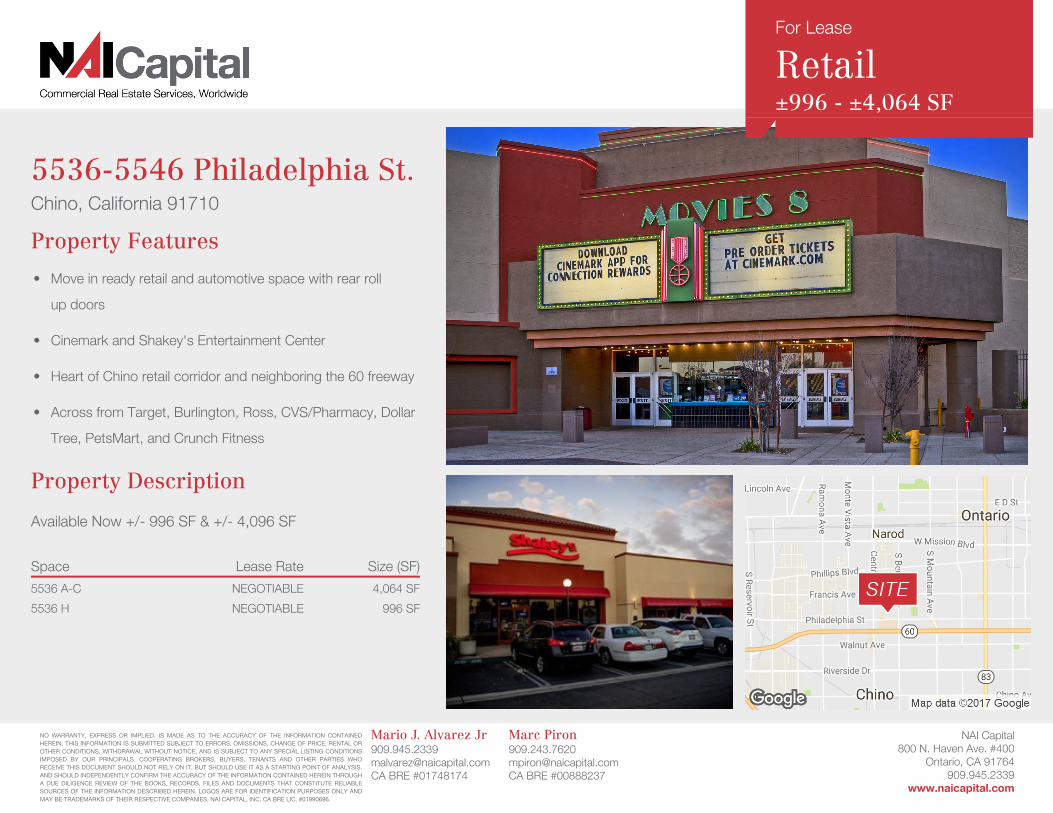
Chino, California 91710
Property Features
• Move in ready retail and automotive space with rear roll
up doors
• Cinemark and Shakey's Entertainment Center
• Heart of Chino retail corridor and neighboring the 60 freeway
• Across from Target, Burlington, Ross, CVS/Pharmacy, Dollar
Tree, PetsMart, and Crunch Fitness
Property Description
Available Now +/- 996 SF & +/- 4,096 SF
Space Lease Rate Size (SF)
5536 A-C NEGOTIABLE 4,064 SF
5536 H NEGOTIABLE 996 SF
5536-5546 Philadelphia St.
Mario J. Alvarez [email protected] BRE #01748174
Marc [email protected] BRE #00888237
NO WARRANTY, EXPRESS OR IMPLIED, IS MADE AS TO THE ACCURACY OF THE INFORMATION CONTAINEDHEREIN. THIS INFORMATION IS SUBMITTED SUBJECT TO ERRORS, OMISSIONS, CHANGE OF PRICE, RENTAL OROTHER CONDITIONS, WITHDRAWAL WITHOUT NOTICE, AND IS SUBJECT TO ANY SPECIAL LISTING CONDITIONSIMPOSED BY OUR PRINCIPALS. COOPERATING BROKERS, BUYERS, TENANTS AND OTHER PARTIES WHORECEIVE THIS DOCUMENT SHOULD NOT RELY ON IT, BUT SHOULD USE IT AS A STARTING POINT OF ANALYSIS,AND SHOULD INDEPENDENTLY CONFIRM THE ACCURACY OF THE INFORMATION CONTAINED HEREIN THROUGHA DUE DILIGENCE REVIEW OF THE BOOKS, RECORDS, FILES AND DOCUMENTS THAT CONSTITUTE RELIABLESOURCES OF THE INFORMATION DESCRIBED HEREIN. LOGOS ARE FOR IDENTIFICATION PURPOSES ONLY ANDMAY BE TRADEMARKS OF THEIR RESPECTIVE COMPANIES. NAI CAPITAL, INC. CA BRE LIC. #01990696.
NAI Capital800 N. Haven Ave. #400
Ontario, CA 91764909.945.2339
www.naicapital.com
For Lease
Retail±996 - ±4,064 SF

Site Plan
NOT A PART
Not to Scale
PHILADELPHIA STREET
A-C4,096 SF
H - 996 SF
F-G
D-E
Legend
SUITE TENANT
F-G James Twaddle Music School
D-E Epoh Sushi
No warranty, express or implied, is made as to the accuracy of the information contained herein. this information is submitted subject to errors, omissions, change of price, rental or other conditions, withdrawal without notice, and is subject to any special listing conditions imposed by our principals. cooperating brokers, buyers, tenants and other parties who receive this document should not rely on it, but should use it as a starting point of analysis, and should independently confirm the accuracy of the information contained herein through a due diligence review of the books, records, files and documents that constitute reliable sources of the information described herein. NAI Capital CA BRE #01990696
Mario H. Alvarez Jr. [email protected] BRE #01748174
Marc [email protected] BRE #00888237

60
232 Homes Proposed by Dr
Horton
SITE
3 Story Office/Medical Under Construction
Retail Map
No warranty, express or implied, is made as to the accuracy of the information contained herein. this information is submitted subject to errors, omissions, change of price, rental or other conditions, withdrawal without notice, and is subject to any special listing conditions imposed by our principals. cooperating brokers, buyers, tenants and other parties who receive this document should not rely on it, but should use it as a starting point of analysis, and should independently confirm the accuracy of the information contained herein through a due diligence review of the books, records, files and documents that constitute reliable sources of the information described herein. NAI Capital CA BRE #01990696
Mario H. Alvarez Jr. [email protected] BRE #01748174
Marc [email protected] BRE #00888237

1 Mile Radius 3 Mile Radius 5 Mile Radius
Po
pul
atio
n
2017 Estimated Population 18,484 183,148 439,828
2022 Projected Population 19,113 188,824 453,754
2010 Census Population 17,863 175,538 417,392
2000 Census Population 17,062 166,018 401,891
Projected Annual Growth 2017 to 2022 0.7% 0.6% 0.6%
Historical Annual Growth 2000 to 2017 0.5% 0.6% 0.6%
Ho
useh
old
s
2017 Estimated Households 6,075 49,960 122,176
2022 Projected Households 6,299 51,742 126,855
2010 Census Households 5,732 46,993 113,600
2000 Census Households 5,621 44,635 108,745
Projected Annual Growth 2017 to 2022 0.7% 0.7% 0.8%
Historical Annual Growth 2000 to 2017 0.5% 0.7% 0.7%
Inco
me
2017 Est. HH Income $200,000 or More 4.5% 3.4% 4.0%
2017 Est. HH Income $150,000 to $199,999 5.7% 5.6% 5.8%
2017 Est. HH Income $100,000 to $149,999 13.6% 14.7% 14.4%
2017 Est. HH Income $75,000 to $99,999 17.2% 14.8% 13.8%
2017 Est. HH Income $50,000 to $74,999 20.0% 21.6% 20.2%
2017 Est. HH Income $35,000 to $49,999 12.5% 12.8% 13.4%
2017 Est. HH Income $25,000 to $34,999 8.8% 9.1% 9.5%
2017 Est. HH Income $15,000 to $24,999 8.9% 9.2% 9.1%
2017 Est. HH Income Under $15,000 8.9% 8.8% 9.7%
2017 Est. Average Household Income $76,052 $73,161 $73,364
2017 Est. Median Household Income $64,058 $63,413 $63,199
2017 Est. Per Capita Income $25,066 $20,162 $20,664
Ho
usin
g
2017 Est. Total Housing Units 6,182 50,930 124,901
2017 Est. Owner-Occupied 52.7% 58.4% 54.7%
2017 Est. Renter-Occupied 45.6% 39.6% 43.1%
2017 Est. Vacant Housing 1.7% 1.9% 2.2%
2010 Median Home Value $340,177 $321,604 $352,761
2010 Median Rent $1,153 $1,122 $1,135This report was produced using data from private and government sources to be reliable. The information herein is provided without representation or warranty.
Demographics
No warranty, express or implied, is made as to the accuracy of the information contained herein. this information is submitted subject to errors, omissions, change of price, rental or other conditions, withdrawal without notice, and is subject to any special listing conditions imposed by our principals. cooperating brokers, buyers, tenants and other parties who receive this document should not rely on it, but should use it as a starting point of analysis, and should independently confirm the accuracy of the information contained herein through a due diligence review of the books, records, files and documents that constitute reliable sources of the information described herein. NAI Capital CA BRE #01990696
Mario H. Alvarez Jr. [email protected] BRE #01748174
Marc [email protected] BRE #00888237