foord chair in investments - ru
TRANSCRIPT

FOORD CHAIR IN INVESTMENTS
Professor AP (Pierre) Faure ___________________________________________________________________
_________________________________________________________________________________
apfaure[AT]gmail[DOT]com +27(0)82 200 3559 Box 94 Grahamstown 6140 South Africa
OPEN LETTER TO MEMBERS OF PARLIAMENT AND OTHER INFLUENTIAL
PERSONS IN SOUTH AFRICA 12 November 2015 Dear Honourable Members, Ladies, Gentlemen It is possible for South Africa to exhibit sustainable high economic growth. This opportunity has been sorely neglected for decades (under the Nationalist and ANC governments), and unemployment, everyone’s central concern, remains one of the highest in the world. This letter is an appeal (1) for careful consideration of the reasons for this state of affairs, and (2) for you to use your influence to bring about urgent corrective action. There are many examples of countries which have turned a desperate situation into a success story within 20 years: Japan, South Korea, China, Singapore, etc. There is no famine of advice on how to turn the South African economic story into a good one, and they are ad idem on the only solution (not the path to it): High and sustainable economic growth. Many of you will know the reasons for the absence of the solution, but perhaps not within the context of the many sources / drivers of economic growth. The document which follows this letter presents (1) a synopsis of the sources of economic growth, (2) comments on the South African situation within this context, and (3) inferred recommendations. South Africa hosts a highly frustrated population, made up of people that are ready to work their fingers to the bone to transform South Africa into a winning nation. All that is required is political will, and time. It is our responsibility to influence the former, which will lessen the latter. Yours faithfully
AP Faure

2
SOURCES / DRIVERS OF ECONOMIC GROWTH
AP Faure1 ABSTRACT
In a nutshell, sustainable high economic growth is the outcome of the efficient amalgamation of the factors of production (natural resources, physical capital, and educated human capital), by entrepreneurs (the creative element of human capital) operating in a propitious business milieu (productive, competitive, international), which is shaped largely by a
business-empathetic democratic government. The accompanying chart shows South Africa’s record: Annual real GDP growth for 1946-2014. In order to solve the critical problem of unemployment, and create wealth for all its people, South Africa needs the economy to grow at 5-6% pa. The chart shows that the economy expanded by 5% pa in the period 1948-1974 and by 5.2% in the mid-2000s. South Africa has vast potential. With a propitious mix of the essential ingredients it is able to become a high-income country, with unemployment lowered to the high-income country structural level (approximately 5%). The essential ingredients for high and sustainable economic growth are not in place, and serious efforts are required to bring this about. South Africa is the only country that simultaneously has the highest and lowest ratings in certain areas of the World Economic Forum’s and other agencies’ country economics ratings. This text outlines the sources / drivers of economic growth, and indicates the areas where serious and urgent attention is required if the country is to have a bright future. INTRODUCTION Economic growth (aka Output and its counterpart Income) is the rate of increase in gross domestic product (GDP) over a period: Annualised quarterly or annually. Nominal GDP growth (ΔGDPN) (which may also be negative) is the growth rate in the market value of the final goods and services produced in a country in a year. Real GDP growth (ΔGDPR) is ΔGDPN adjusted for the inflation rate (ΔP). In other words, ΔGDPN disaggregates into ΔGDPR and ΔP:
1 Foord Chair in Investments: Rhodes University, South Africa.
South Africa 1946-2014: Real GDP growth. Source: South African Reserve Bank.
3
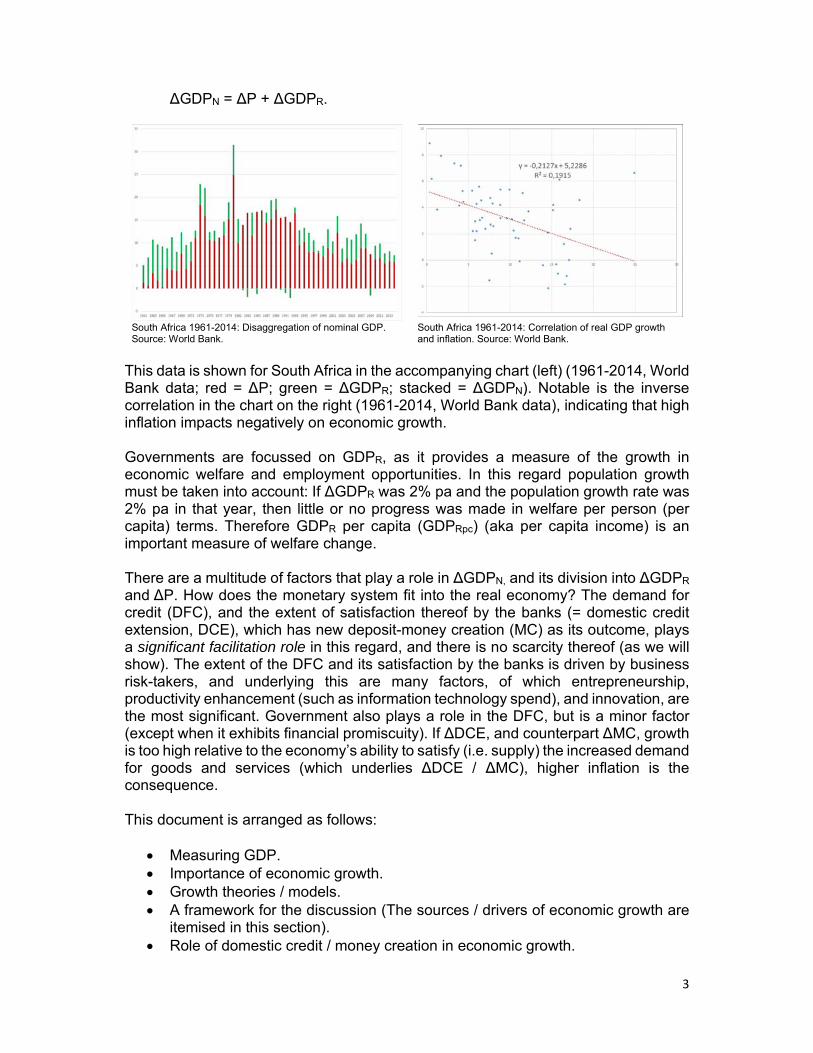
ΔGDPN = ΔP + ΔGDPR.
This data is shown for South Africa in the accompanying chart (left) (1961-2014, World Bank data; red = ΔP; green = ΔGDPR; stacked = ΔGDPN). Notable is the inverse correlation in the chart on the right (1961-2014, World Bank data), indicating that high inflation impacts negatively on economic growth. Governments are focussed on GDPR, as it provides a measure of the growth in economic welfare and employment opportunities. In this regard population growth must be taken into account: If ΔGDPR was 2% pa and the population growth rate was 2% pa in that year, then little or no progress was made in welfare per person (per capita) terms. Therefore GDPR per capita (GDPRpc) (aka per capita income) is an important measure of welfare change. There are a multitude of factors that play a role in ΔGDPN, and its division into ΔGDPR and ΔP. How does the monetary system fit into the real economy? The demand for credit (DFC), and the extent of satisfaction thereof by the banks (= domestic credit extension, DCE), which has new deposit-money creation (MC) as its outcome, plays a significant facilitation role in this regard, and there is no scarcity thereof (as we will show). The extent of the DFC and its satisfaction by the banks is driven by business risk-takers, and underlying this are many factors, of which entrepreneurship, productivity enhancement (such as information technology spend), and innovation, are the most significant. Government also plays a role in the DFC, but is a minor factor (except when it exhibits financial promiscuity). If ΔDCE, and counterpart ΔMC, growth is too high relative to the economy’s ability to satisfy (i.e. supply) the increased demand for goods and services (which underlies ΔDCE / ΔMC), higher inflation is the consequence. This document is arranged as follows:
Measuring GDP. Importance of economic growth. Growth theories / models. A framework for the discussion (The sources / drivers of economic growth are
itemised in this section). Role of domestic credit / money creation in economic growth.
South Africa 1961-2014: Disaggregation of nominal GDP. Source: World Bank.
South Africa 1961-2014: Correlation of real GDP growth and inflation. Source: World Bank.

4
Appendix 1: Internal rate of return and project viability. Appendix 2: Literature review and bibliography.
MEASURING GDP GDP is measured in terms of the United Nations System of National Accounts (SNA), which is “… the internationally agreed standard set of recommendations on how to compile measures of economic activity. The SNA describes a coherent, consistent and integrated set of macroeconomic accounts in the context of a set of internationally agreed concepts, definitions, classifications and accounting rule.” 2 The many components of the SNA are used by the central bank, government, private sector analysts, business and even the general public, as measures of how the economy and its sectors are performing over time. Of the components of the SNA, GDP is the most significant macro‐economic aggregate or summary indicator used for the purposes of economic analysis and comparisons over time. It is not calculated, but estimated in 3 ways:
(1) Production approach. The production estimate is based on the value of final output in the economy less the inputs used up in the production process.
(2) Income approach. The income estimate measures the incomes earned by individuals (for example, wages) and corporations (for example, profits) directly from the production of outputs (goods and services).
(3) Expenditure approach. The most well-known approach is the expenditure estimate, which is based on the value of total expenditure on goods and services, excluding intermediate goods and services, produced in the domestic economy during a given period.3
The expenditure on GDP estimate is presented as consumption spending (we include by government) (C) + investment spending (I) (which make up gross domestic expenditure, GDE) + exports (X) – imports (M). GDE represents domestic demand, while X – M represents net external demand: GDEN = C + I
GDPN = GDEN + (X – M) GDPN = domestic demand + net external demand.
Net external demand (NED) is aka net exports (NE) and the trade account balance (TAB, which is a major part of the wider balance of payments). As we saw above, ΔGDPR is ΔGDPN adjusted for ΔP (put simply). The inflation rate used is usually the consumer price index (CPI), which is based on a fixed basket of goods and services. Another measure of inflation used in analysis is the GDP deflator (aka the implicit price deflator), calculated as:
GDP deflator = (GDPN / GDPR) x 100.
2 http://unstats.un.org/unsd/nationalaccount/sna.asp (Accessed 06.05.2015). 3 Almost verbatim from: http://www.ons.gov.uk/ons/rel/elmr/explaining-economic-statistics/understanding-gdp-and-how-it-is-measured/sty-understanding-gdp.html.
5
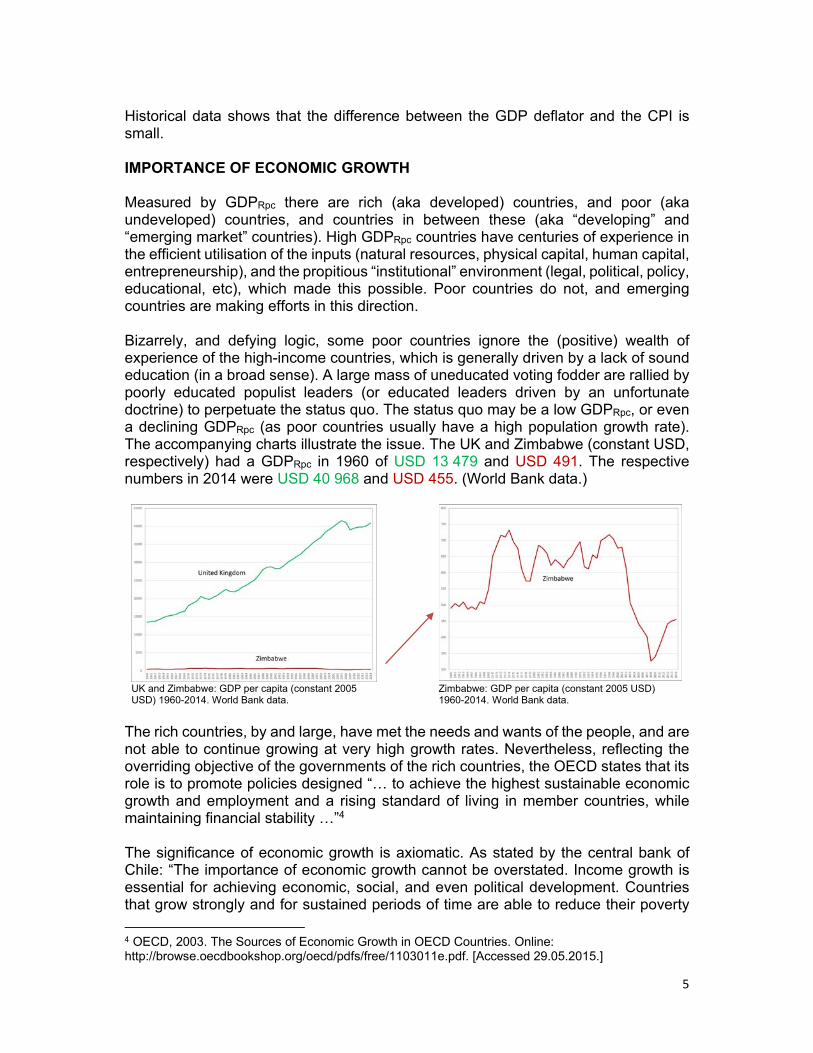
Historical data shows that the difference between the GDP deflator and the CPI is small. IMPORTANCE OF ECONOMIC GROWTH Measured by GDPRpc there are rich (aka developed) countries, and poor (aka undeveloped) countries, and countries in between these (aka “developing” and “emerging market” countries). High GDPRpc countries have centuries of experience in the efficient utilisation of the inputs (natural resources, physical capital, human capital, entrepreneurship), and the propitious “institutional” environment (legal, political, policy, educational, etc), which made this possible. Poor countries do not, and emerging countries are making efforts in this direction. Bizarrely, and defying logic, some poor countries ignore the (positive) wealth of experience of the high-income countries, which is generally driven by a lack of sound education (in a broad sense). A large mass of uneducated voting fodder are rallied by poorly educated populist leaders (or educated leaders driven by an unfortunate doctrine) to perpetuate the status quo. The status quo may be a low GDPRpc, or even a declining GDPRpc (as poor countries usually have a high population growth rate). The accompanying charts illustrate the issue. The UK and Zimbabwe (constant USD, respectively) had a GDPRpc in 1960 of USD 13 479 and USD 491. The respective numbers in 2014 were USD 40 968 and USD 455. (World Bank data.)
UK and Zimbabwe: GDP per capita (constant 2005 USD) 1960-2014. World Bank data. Zimbabwe: GDP per capita (constant 2005 USD)
1960-2014. World Bank data.
The rich countries, by and large, have met the needs and wants of the people, and are not able to continue growing at very high growth rates. Nevertheless, reflecting the overriding objective of the governments of the rich countries, the OECD states that its role is to promote policies designed “… to achieve the highest sustainable economic growth and employment and a rising standard of living in member countries, while maintaining financial stability …”4 The significance of economic growth is axiomatic. As stated by the central bank of Chile: “The importance of economic growth cannot be overstated. Income growth is essential for achieving economic, social, and even political development. Countries that grow strongly and for sustained periods of time are able to reduce their poverty
4 OECD, 2003. The Sources of Economic Growth in OECD Countries. Online: http://browse.oecdbookshop.org/oecd/pdfs/free/1103011e.pdf. [Accessed 29.05.2015.]
6
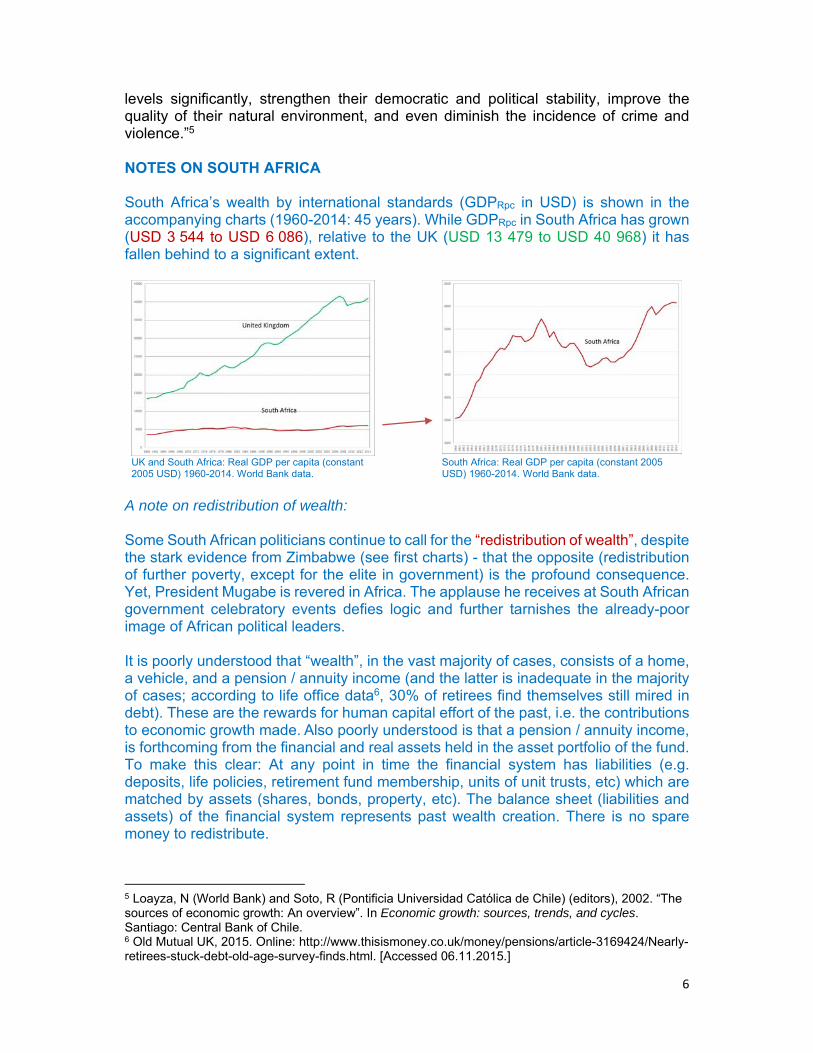
levels significantly, strengthen their democratic and political stability, improve the quality of their natural environment, and even diminish the incidence of crime and violence.”5 NOTES ON SOUTH AFRICA South Africa’s wealth by international standards (GDPRpc in USD) is shown in the accompanying charts (1960-2014: 45 years). While GDPRpc in South Africa has grown (USD 3 544 to USD 6 086), relative to the UK (USD 13 479 to USD 40 968) it has fallen behind to a significant extent.
UK and South Africa: Real GDP per capita (constant 2005 USD) 1960-2014. World Bank data. South Africa: Real GDP per capita (constant 2005
USD) 1960-2014. World Bank data. A note on redistribution of wealth: Some South African politicians continue to call for the “redistribution of wealth”, despite the stark evidence from Zimbabwe (see first charts) - that the opposite (redistribution of further poverty, except for the elite in government) is the profound consequence. Yet, President Mugabe is revered in Africa. The applause he receives at South African government celebratory events defies logic and further tarnishes the already-poor image of African political leaders. It is poorly understood that “wealth”, in the vast majority of cases, consists of a home, a vehicle, and a pension / annuity income (and the latter is inadequate in the majority of cases; according to life office data6, 30% of retirees find themselves still mired in debt). These are the rewards for human capital effort of the past, i.e. the contributions to economic growth made. Also poorly understood is that a pension / annuity income, is forthcoming from the financial and real assets held in the asset portfolio of the fund. To make this clear: At any point in time the financial system has liabilities (e.g. deposits, life policies, retirement fund membership, units of unit trusts, etc) which are matched by assets (shares, bonds, property, etc). The balance sheet (liabilities and assets) of the financial system represents past wealth creation. There is no spare money to redistribute.
5 Loayza, N (World Bank) and Soto, R (Pontificia Universidad Católica de Chile) (editors), 2002. “The sources of economic growth: An overview”. In Economic growth: sources, trends, and cycles. Santiago: Central Bank of Chile. 6 Old Mutual UK, 2015. Online: http://www.thisismoney.co.uk/money/pensions/article-3169424/Nearly-retirees-stuck-debt-old-age-survey-finds.html. [Accessed 06.11.2015.]
7
There is only one way to create wealth: Grow the economy. High-income countries regard economic growth as their priority goal. African countries should take heed. In South Africa we have the National Development Plan (NDP), a fine economic plan waiting to be implemented fully, and the nation will unite behind it. By not prioritising the NDP, the perception that the governing party is not serious about enhancing economic growth and reducing unemployment will be re-enforced. In this regard, the IMF reported in 2015: “It is important for [structural] reforms to take a long and comprehensive view … The government already has a blueprint in the National Development Plan. But implementation needs to be stepped up in a consistent way, while reducing uncertainty about government policies.”7 GROWTH THEORIES / MODELS Over a period longer than the past century, economic growth theories / models have been developed. We merely mention them here for the sake of completeness. Below, we extract the main factors that drive economic growth, and add the significant role of the monetary system. The theories include: Classical growth theory, neoclassical growth model (including the Solow-Swan model), real business cycle theory, endogenous growth theory, unified growth theory, Schumpeterian growth theory, growth theories that emphasize the role of institutions and human capital, the dynamic stochastic general equilibrium (DSGE) theory (a model of endogenous growth), and so on. A FRAMEWORK FOR THE DISCUSSION Everything affects economic growth, positively or negatively. In this text we attempt to cover the principal sources of economic growth. The literature on economic growth is vast and varied and major strides have made to a point where there is, largely, consensus on the principal drivers. We make no claim on originality, but hope we have made a contribution in respect of the framework for the discussion, as well as the addition of the role of bank domestic credit extension (DCE) and its outcome, deposit-money creation (MC), without which economic growth would be severely limited. The Organisation for Economic Co-Operation and Development (OECD8) provides a succinct view of the principal drivers: “One of the most important lessons … is that policies that ensure stable macroeconomic conditions are important for growth, as high and variable inflation depresses investment and excessive tax burdens distort proper resource allocation. Also, the importance of capital – in the broadest sense – is reaffirmed; there are high returns not only to physical capital accumulation but also to investment in education and R&D. In addition, institutional structures and policy settings that favour competition and flexibility in capital and labour markets, the development of new technologies and the diffusion of innovations and technological change also make a key difference to growth prospects. In particular, many of our countries need more competitive product markets; labour markets that adjust better and more rapidly to shocks, both demographic and technological; and, financial
7 International Monetary Fund, 2015. Reflections on South Africa’s challenges and opportunities for reform. Remarks by David Lipton, First Deputy Managing Director, International Monetary Fund at the University of Cape Town, Cape Town, 5 March. 8 OECD, 2003. The Sources of Economic Growth in OECD Countries. Online: http://browse.oecdbookshop.org/oecd/pdfs/free/1103011e.pdf. [Accessed 29.05.2015.]
8
systems that are able to direct capital flows, for given risks, towards projects with the highest returns.” We would amend the latter point to take account of the significant role of new deposit-money creation, the outcome of bank DCE (which is largely based on entrepreneurial activity, and should be carefully managed to be sustainable). In a nutshell, the financial system not only directs existing capital flows, but creates new deposit money when new bank credit is extended for new projects which have the promise of high returns. The money created then circulates, further stimulating economic growth. Interest rates are critical in this respect, because they influence the Internal Rate of Return (IRR) of new projects and hence their viability. Interest rates are the turf of central bank monetary policy, and central banks are able to control short-term rates to the extent of 100% (as we will show). Monetary policy is therefore critical in the creation of economic growth, which ultimately is the aim of policy (and is not always successfully achieved, as evidenced by the existence of the business cycle). We saw above that there are 3 approaches to estimating GDP and GDP growth: (1) the production approach, (2) the expenditure approach, and (3) the income approach. The production approach tells us that goods and services are produced (the value of final output in the economy less the inputs). Production is made possible by factories, machinery, equipment, land (aforementioned = physical capital), and individuals (human capital – directly and via companies and government). The income approach tells us that from the production of outputs (goods and services) individuals earn income (salaries and wages) and companies earn profits (income less expenditure and taxes). The expenditure approach tells us that: GDEN = C + I
GDPN = GDEN + (X – M) GDPN = domestic demand + net external demand.
Individuals, companies and government consume (goods and services) and invest (here we mean in physical capital) domestically (domestic demand). Local companies export to the rest of the world and the rest of the world imports from the domestic economy. Net external demand represents an important driver: International trade openness. The efficiency of production (productivity) is critical because the prices of goods and services will be lower than they otherwise would have been, enabling individuals (etc) to consume more (= higher GDP per capita), and exporters to be competitive internationally and therefore export more, leading again to higher income levels domestically. Entrepreneurship and innovation lead to the production of new goods / efficiency of production / new processes. All these activities take place in an environment: Physical, political, institutional, economic policy, and so on. The above discussion presents us with a framework for an analysis of the principal role-players in economic growth:
Factor of production 1: Natural resources. Factor of production 2: Physical capital.

9
Factor of production 3: Human capital: o Population size. o Demographic change. o Education. o Societal habituation factors. o Health and economic growth.
Factor of production 4: Entrepreneurship. Efficiency of production: Productivity. International trade (openness of the economy). Demand factors. Financial market development. General business environment:
o Government: Theory of bureaucracy and size. o Government: Governance. o Government: Regulatory burden. o Government: Economic policies:
Fiscal policy. Monetary policy. Industrial policy. Labour market policy.
o Government: Attitude towards business. o Corporate sector: Governance. o Economic psyche of the nation.
Geophysical factors. Role of domestic credit / deposit-money creation in economic growth.
These are the principal sources / drivers of economic growth and they are interrelated. The economy is a system, and the main principle of Systems Theory applies to a degree: Developments in one area have an influence, to a greater of lesser degree, on the rest. We begin with the 4 factors of production:
Natural resources. Physical capital. Human capital. Entrepreneurship.
In Economics the income that the owners of natural resources earn in return for their use is called rent. In the case of physical capital it is called interest. In the case of human capital it is called wages. In the case of entrepreneurs it is called profit. FACTOR OF PRODUCTION 1: NATURAL RESOURCES Some scholars regard natural resources as part of physical capital. We believe it deserves the respect of a fully-fledged factor. It is sometimes called the primary factor of production, as without it an economy does not exist, and, ultimately, all products have their genesis in natural resources. Few services have their origins in natural resources, and most emanate from human capital factor of production [and use physical capital (for example offices, desks) to provide them]. Natural resources include:

10
Land, including naturally-occurring flora. Sea and fresh water, including naturally-occurring sea and fresh water
resources. Metals, minerals, crude oil, etc, which lie below the land surface, including the
sea and fresh water beds. In the SNA these are referred to as subsoil assets. Sunlight. Air (a mixture of gases).
It may be useful to present examples of the contribution of natural resources to production:
Land provides naturally-occurring fauna and flora, and is used to cultivate crops, forests, etc, and to raise livestock.
Naturally-occurring and planted forests grow on land and provide the opportunity for felling and use as inputs in numerous products.
Infrastructure is built on land. Land provides the opportunity to exploit wind-generated energy, geo-thermal
energy, etc. Water resources offer naturally-occurring fish, crustaceans, mollusks, etc,
which can be exploited. The mammals of the sea and fresh water were exploited in the past (but this has largely ceased).
Water resources present the opportunity for aquaculture. Water resources enable the production of energy (hydro energy, tidal and wave
energy, etc). Metals, minerals, crude oil, natural gas, etc, which lie below the surface,
including the sea and fresh water beds, enable their discovery, mining, and refining, which are used (when refined) as inputs in value-added products, electricity generation, etc.
Sunlight enables the production of electricity and other energy (from solar PV cells, concentrated solar power plants, solar geysers, etc).
Air enables aviation and communication. Products made from air include oxygen, nitrogen (from which, for example, refrigerants and ammonia are made), compressed air, etc.
It is important to differentiate renewable and non-renewable resources. The former can be used in production continuously, whereas the latter (e.g. fossil fuels) cannot. Misuse or overuse of renewable resources (soil erosion, depletion of fish stocks) poses a risk of continuity of production. The quality of renewable resources can also be improved by, for example, the use of fertilisers and irrigation. Such action, of course, constitutes physical capital accumulation. It should be evident that the transformation / use of natural resources is generally undertaken directly by entrepreneurs (and indirectly by entrepreneurial investors), and that they take on risk in these endeavours. For example, the exploration for potential mining assets involves much research and capital outlays (i.e. physical capital accumulation), with little certainty of outcomes.

11
There is a body of research that views the abundance of non-renewable resources, such as metals, minerals and fuels, as constituting an economic curse, called the Natural Resource Curse. Such countries tend to exhibit lower rates of economic growth than countries with fewer natural resources. This view has many sceptics. The NBER in this regard informs: “It is striking how often countries with oil or other natural resource wealth have failed to grow more rapidly than those without … the Natural Resource Curse. The principle has been borne out in some econometric tests of the determinants of economic performance across a comprehensive sample of countries. … Sceptics have questioned the Natural Resource Curse, pointing to examples of commodity-exporting countries that have done well and arguing that resource endowments and booms are not exogenous.”9 A final point: Countries not well-endowed with natural resources are not necessarily constrained in terms of economic growth. There are many examples to substantiate this contention, such as Liechtenstein (highest GDPRpc in the world), Luxembourg (second highest GDPRpc in the world), Japan and Israel. International trade allows for the provision of services; access to raw and refined natural resources, etc. A high quality of human capital and entrepreneurship enable the transformation of resources into desired products, which are also exportable. The production of goods and services requires not only natural resources (and value-added products derived therefrom), but human capital and physical capital. The latter is discussed next. NOTES ON SOUTH AFRICA South Africa is endowed with abundant natural resources. The economic opportunities are vast and have been neglected for decades (under the Nationalist and ANC governments). This is reflected in the GDPRpc numbers shown earlier. A note on the redistribution of land: The redistribution of land is a political football, and one can appreciate the sensitivities surrounding the issue. The ruling party would do well to accept that a farm is a primary factor of production, and that taking it from an entrepreneur and placing it in the hands (in many cases) of a non-entrepreneur is foolish economics. Farmers do not need to own land; they want to produce. An alternative model should be considered - of government-ownership of farmland with a long-term leasing, coupled with a tax-break, arrangement. It will circumvent the need for the large farm-owner compensation payments, and release government funds for other priorities. It will also remove one facet of policy uncertainty (a major deterrent to growth, discussed later). FACTOR OF PRODUCTION 2: PHYSICAL CAPITAL Many economic texts refer to the second factor of production as “capital”. This is confusing, as “capital” could denote a monetary asset. It is clearer to refer to it as “physical capital”. It should be thought of as manufactured capital resources, including
9 Frankel, JA, 2010. The natural resource curse: A survey. NBER Working Paper. Number 15836. March.

12
machines (tractors, trucks, forklifts), tools (lathes, spanners), buildings (factories, office buildings, residences), equipment (computers, printers, ploughs), improvements to land (dams, irrigation channels), infrastructure (roads, electricity grid), etc, that are used in the production of other goods and services. Examples may be useful: A university teacher (human capital), for the production of an education service (GDP), uses a lecture room, tables, chairs, a laptop computer, a projector, a white board, white board pens, textbooks, etc (physical capital). Another example is a farmer [human capital, entrepreneur (see later)] who uses a tractor (physical capital) to ready the land (natural resource improved = physical capital) for planting of GM maize seeds (physical capital) by labourers (human capital), and the labourers make irrigation channels (physical capital) for the watering of the crop. The maize is gathered in by a combine harvester and placed in a silo (both physical capital), before being transported by rail (physical capital, infrastructure) to a maize miller (human capital, entrepreneur). The miller uses a milling machine to refine the maize, packages the refined maize and transports the packages by road (all physical capital) to a distributor (human capital, entrepreneur) … and so on. Investment in physical capital is measured. We know from earlier that (the SNA) expenditure estimate of GDP is made up of:
GDEN = C + I GDPN = GDEN + (X – M) GDPN = domestic demand + net external demand.
In the expenditure estimate of GDP, physical capital (I) is measured as “gross capital formation” (by government and the private sector), and it is made up of the components:
Gross fixed capital formation (GFCF) + change in inventories. The broad categories of GFCF, by type of asset, according to one central bank10, are: Residential buildings.
Non-residential buildings. Construction works. Transport and equipment. Information, computer and telecommunications equipment. Machinery and other equipment. Research and development. Computer software. Mineral exploration and evaluation. Cultivated biological resources. Transfer costs (private sector).
Numerous studies on the significance of accumulation of physical capital (GFCF) in economic growth have been undertaken over many decades. We present the findings of a few papers in Appendix 2: Literature review and bibliography. It is evident that
10 South African Reserve Bank.

13
investment in physical capital plays a major macroeconomic role, which may be summarised as follows:
There is bi-directional causality: Increases in economic growth precede rises in rates of capital formation than that increases in capital formation precede increases in growth.
High rates of fixed capital formation accompany rapid growth in per capita income.
There is no evidence that fixed investment is the only or main source of ignition for economic growth.
A permanent increase in the share of GDP devoted to physical capital investment predicts not just a higher level of output per worker, but also a faster growth rate in the long run.
It adds to the production capacity of the country. New investments in physical capital introduce new technologies, which improve
the production processes (higher productivity), lowering the cost of production. It potentially reduces the amount of labour required per unit of output, thus releasing labour for other economic activities.
The lower cost of production enhances participation in international trade. In developing countries, investment in infrastructure (raises productivity),
agriculture, and education (raises the quality of human capital) are particularly important.
Capital accumulation is influenced by many indirect factors, which are conferred on in this text.
Investment in physical capital by entrepreneurs must be supported by investment in public infrastructure and education (government responsibilities).
The activity of creating physical capital increases the demand for manufactured capital goods, and income. Income is partly spent on consumption goods and services, which then stimulates further investment and consumption, and so on.
The latter point need elaboration – with reference to the investment multiplier (attributed to JM Keynes). It holds that an initial increase in physical capital investment (I) increases final income (GDP) by many times. The investment multiplier (IM, a ratio) expresses this relationship:
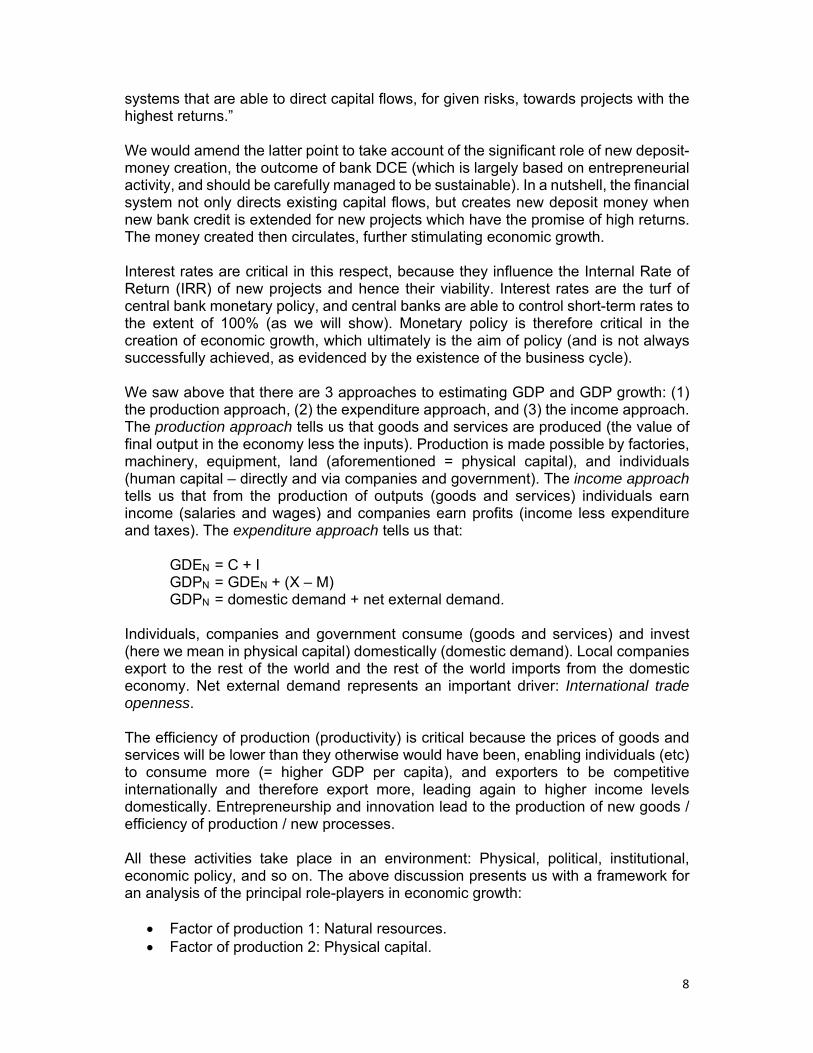
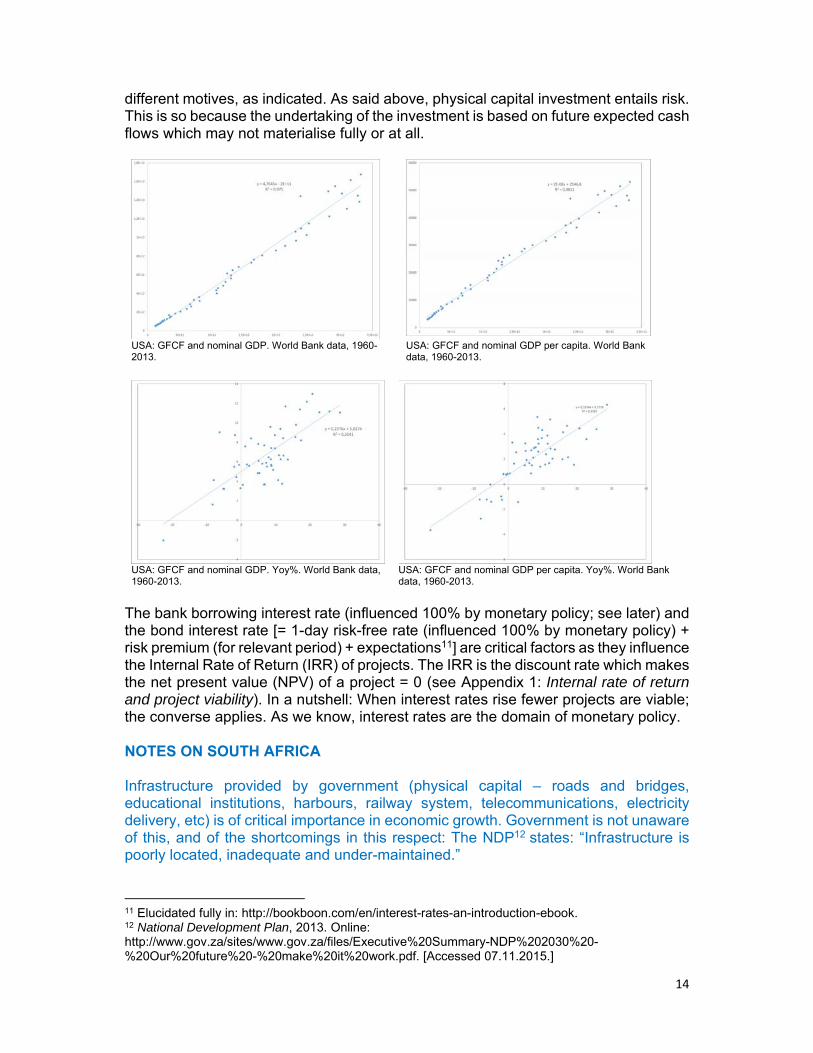
IM = ΔGDP / ΔI. The accompanying charts show the relationships between (1) GFCF and GDPN, and GFCF and GDPNpc for the USA for the period 1960-2013 (raw World Bank data) (in both cases the R2 is 0.98; perfect correlation is 1.0); (2) the year-on-year % changes (in both cases the R2 is 0.6). The main causation path is clear, but it is partly bi-directional:
Physical capital accumulation (ΔI) → Income growth (ΔGDP) → Consumption growth (ΔC) → ΔI → ΔGDP → and so on.
Physical capital expenditure is undertaken by the household sector (residential capital expenditure; entrepreneurial investors), the corporate sector (entrepreneurs; business infrastructure) and the government sector (mainly infrastructure), and each has
14
different motives, as indicated. As said above, physical capital investment entails risk. This is so because the undertaking of the investment is based on future expected cash flows which may not materialise fully or at all.
USA: GFCF and nominal GDP. World Bank data, 1960-2013.
USA: GFCF and nominal GDP per capita. World Bank data, 1960-2013.
USA: GFCF and nominal GDP. Yoy%. World Bank data, 1960-2013.
USA: GFCF and nominal GDP per capita. Yoy%. World Bank data, 1960-2013.
The bank borrowing interest rate (influenced 100% by monetary policy; see later) and the bond interest rate [= 1-day risk-free rate (influenced 100% by monetary policy) + risk premium (for relevant period) + expectations11] are critical factors as they influence the Internal Rate of Return (IRR) of projects. The IRR is the discount rate which makes the net present value (NPV) of a project = 0 (see Appendix 1: Internal rate of return and project viability). In a nutshell: When interest rates rise fewer projects are viable; the converse applies. As we know, interest rates are the domain of monetary policy. NOTES ON SOUTH AFRICA Infrastructure provided by government (physical capital – roads and bridges, educational institutions, harbours, railway system, telecommunications, electricity delivery, etc) is of critical importance in economic growth. Government is not unaware of this, and of the shortcomings in this respect: The NDP12 states: “Infrastructure is poorly located, inadequate and under-maintained.”
11 Elucidated fully in: http://bookboon.com/en/interest-rates-an-introduction-ebook. 12 National Development Plan, 2013. Online: http://www.gov.za/sites/www.gov.za/files/Executive%20Summary-NDP%202030%20-%20Our%20future%20-%20make%20it%20work.pdf. [Accessed 07.11.2015.]

15
According to the World Economic Forum’s Global Competitiveness Report 2015-1613 [WEF/GCR 2015-16 (Pillar 2: “Infrastructure”], South Africa’s ratings range from good to exceptionally poor (140 countries):
Quality of overall infrastructure: 59/140. Quality of roads: 34/140. Quality of railroad infrastructure: 42/140.
Quality of port infrastructure: 36/140. Quality of air transport infrastructure: 14/140.
Available airline seats, km/week (millions): 28/140. Quality of electricity supply: 116/140. Mobile telephone subscriptions (/100 population): 22/140. It is important that government implements the NDP (which emphasises infrastructure-spend) as soon as possible. It is a fine economic blueprint, and the nation stands ready to unite behind it: The NDP itself states: “The plan will provide a common focus for action across all sectors and sections of South African society.”14
South Africa: 1960-2014. Manufacturing as % of GDP. Source: World Bank data.
South Africa: 1960-2014. Manufacturing & GDP. R2: 0.97. Source: World Bank data. (Note: Bi-directional causality.)
Manufacturing (physical capital investment) plays a key role in economic growth (see accompanying charts). The NDP15: “Transforming this economy is a … long term project. In summary, we propose to enhance human capital, productive capacity and infrastructure to raise exports, which will increase resources for investment and reduce reliance on capital inflows. Higher investment, supported by better public infrastructure and skills, will enable the economy to grow faster and become more productive. Rising employment and productivity will lead to rising incomes and living standards and less inequality. Shifting the economy towards more investment and lower consumption is necessary for long-term economic prosperity.” FACTOR OF PRODUCTION 3: HUMAN CAPITAL
13 World Economic Forum, 2015. Global Competitiveness Report 2015-16. Online: http://www3.weforum.org/docs/gcr/2015-2016/ZAF.pdf. [Accessed 21.10.2015.] 14 National Development Plan, 2013. Online: http://www.gov.za/sites/www.gov.za/files/Executive%20Summary-NDP%202030%20-%20Our%20future%20-%20make%20it%20work.pdf. [Accessed 07.11.2015.] 15 National Development Plan, 2013. Online: http://www.gov.za/sites/www.gov.za/files/Executive%20Summary-NDP%202030%20-%20Our%20future%20-%20make%20it%20work.pdf. [Accessed 07.11.2015.]

16
Introduction Human capital essentially embodies:
(1) A stock of physical human beings (population size, demographic distribution). (2) A stock of knowledge (education, skills). (3) Societal habituation factors (customs, culture, work ethic, degree of creativity,
standards, values, religion, etc), that are brought to bear as human effort (mentally and / or physically) in the production of goods and services.
Whereas natural resources is a passive factor of production, human capital is an active factor. Natural resources and human capital are regarded as primary factors of production. We discuss these issues under the following headings:
Population size. Demographic distribution and economic growth. Education and economic growth. Societal habituation factors. Health and economic growth.
Population size The issue of population size and growth has been debated for decades with little outcome. Generally, there are 3 schools of thought in this regard: Population growth has (1) a negative impact, (2) a positive impact, (3) a neutral impact, on economic development.16 Demographic distribution and economic growth More recently, demographical analysis has shifted to the age structure of the population, i.e. the distribution of age groups over time, because economic behaviour in different age groups differs. Generally, in low-income countries, more than 33% of the population is young, while in high-income countries the number is less than 20%.17 The results of analyses are also mixed18:
Countries with a high proportion of children (i.e. not working) are likely to devote a high proportion of resources to their care, which tends to depress the pace of economic growth.
By contrast, if most of a nation's population falls within the working ages, the added consumption expenditure and productivity of this group can produce a “demographic dividend” of economic growth (assuming that policies to take advantage of this are in place).
16 See text in Appendix 2: Literature review and bibliography: Bloom, DE, Canning, D, Sevilla, J (2001); Furuoka, F (2009). 17 World Bank. Online: http://www.worldbank.org/depweb/english/modules/social/pgr/index.html. [Accessed 15.09.2015.] 18 This draws heavily on: Bloom, DE, Canning, D, Sevilla, J, 2001. Economic growth and the demographic transition. NBER Working Paper. Number 8685, December.

17
In the case where a large proportion of a country's population are elderly, the effect economic growth can be negative, as a large share of resources (pension, health care, and social security systems) is required by a less productive part of the population.
However, this negative factor, which applies in certain EU countries with aging populations, is largely neutralised by labour mobility - from other countries with young populations. Selective immigration policies also help.
Notes on South Africa According to World Bank data 19 , South Africa’s working age population (15-64) comprised 65% of the population in 2015. This is potentially a “demographic dividend”, but it is hampered by the high rate of unemployment: “… this expansion presents the country with a ‘demographic window of opportunity’ for increased economic growth and better living standards. This advantage is hindered by high unemployment and low job creation rates. About one-third of the labor force is either out of work or not looking.” It is obvious that this opportunity is dependent upon implementation of sound policies (as outlined in this text) and rising employment creation. Quality education is key, which is discussed next. Education and economic growth There is a vast body of literature on the quality and level of education, and all are ad idem on the importance of education in the quality of human capital, and the high correlation between quality of education and economic growth. We present a summary (see Appendix 2: Literature review and bibliography for texts and references):
For education to contribute significantly to development, it must be of high quality.
It is a key factor in enhancing labour productivity, and adding to the production capacity of a country
Education is not only forthcoming from school and tertiary attendance, but also from on-the-job training and work experience.
The quality of human capital is a key determinant in the rate of technological innovations in countries that produce technology, and in the facilitation of technological absorption in other countries.
Sustainable economic development is highly dependent on continuous upgrading of human resources.
Cognitive skill development is especially important for economic growth. There is a close link between investment in human capital and investment in
physical capital, i.e. there is complementarity. It is the most important determinant in attracting physical capital (FDI).
19 World Bank, 2015. South Africa’s changing demographic could lift growth to 5.4% by 2030. Press release 17.08.2015. Online: http://www.worldbank.org/en/news/press-release/2015/08/17/south-africa-demographic-lift-growth. [Accessed 21.10.2015.]

18
Primary and secondary education enrolment rates are not significantly related to physical capital, while higher education enrolment is positively and significantly related to physical capital.
Early childhood development is a critical factor in education. It is largely influenced by societal habituation factors and the availability of government-provided pre-school education.
Just as estate agents embrace the mantra, “location, location, location”, economists’ mantra is “education, education, education”. It is a well-researched-and-concluded fact that higher education leads to higher income and a lower fertility rate; and as the quality of human capital rises (not so much the size), so does economic growth.
With positive economic growth comes positive changes in the societal habituation situation, better healthcare services, better early child development, lower crime, the development of democratic institutions, and so on.
Notes on South Africa Education expenditure According to the CIA World Factbook, education expenditure in South Africa as a % of GDP is (173 countries)20: South Africa (2010: 6.0%): 42/173. (Similar to some high-income countries.21) Despite the relatively high level of education expenditure, South Africa’s school education record is extremely poor, reflecting the poor efficiency of the expenditure. Quality of school education It is widely recognised that South Africa has an inexcusably poor record in the provision of school education. The harsh realities hereof are presented by the WEF/GCR 2015-16 (Pillar 4: “Health and Primary Education”, and Pillar 5: “Higher Education and Training”) ratings (140 countries):
Primary education: 117/140. Quality of primary education: 127/140.
Primary education enrolment (net %): 102/140. Higher education and training: 83/140.
Secondary education enrolment (gross %): 12/140. Quality of the education system: 138/140.
Quality of math and science education: 140/140. Internet access in schools: 119/140.
20 There are different surveys. For example the World Bank: South Africa: 2012: 5.5%. We have used the CIA World Factbook. Online: https://www.cia.gov/library/publications/the-world-factbook/rankorder/2206rank.html. [Accessed 27.10.2015.] 21 This is similar to or higher than some high-income countries, for example, Austria (2010: 5.9%, Netherlands (2011: 5.9%), France (2010: 5.9%), USA (2009: 5.4%), Switzerland (2010: 5.2%). The highest and lowest ratings are: Lesotho (2008: 13.0%): 1/173; Cuba (2010: 12.8%): 2/173; Burma (2011: 0.8%): 172/173; Equatorial Guinea (2002: 0.6%): 173/173.
19
Despite the poor ratings, strides have been made: The matric pass rate increased from 53.4% in 1995 to 75.8% in 2014. However, an important number in this respect is the pass rate of the number of Grade 12 pupils 12 years’ earlier (i.e. in 2003): 42%: This means that the drop-out rate is high. (Note: There is much debate about the accuracy of these numbers.22) An issue in respect of the above is the role of SADTU. This is accorded attention later. Corruption in schools Later (in the section Government: Governance) we provide the ratings on corruption in South Africa. Corruption extends to governance in schools. According to the Corruption Watch report, “Loss of Principle”23, between January 2012 and July 2015 (for detail see Appendix 2: Literature review and bibliography):
Corruption Watch received over 1 100 cases of corruption. 54% implicated principals as the primary culprits in corrupt activities. The corrupt activities include: Gross financial mismanagement, including
misappropriation of school funds, procurement irregularities and failures to prepare for and implement school budgets.
There is a pattern of collusion between, among others, members of school governing bodies, teachers, family members and other outside parties involved in contractual arrangements with schools.
On-the-job-training In the WEF/GCR 2015-16 (Pillar 5: “Higher Education and Training: On-the-job-training”) ratings, South Africa’s does fair to well (140 countries):
Local availability of specialised training services: 41/140. Extent of staff training: 19/140.
Quality of tertiary education In the WEF/GCR 2015-16 (Pillar 5: “Higher Education and Training: Quality of Education”) ratings, South Africa’s does well in respect of management schools (140 countries):
Quality of management schools: 24/140. The quality of (some) general university education in South Africa is of a high standard, according to:
22 Online: http://www.southafrica.info/about/education/matric-pass-rate-2014-050114.htm#.Vi9cW7crJ1t. [Accessed 27.10.2015.] 23 Corruption Watch, 2015. Online: http://www.corruptionwatch.org.za/loss-of-principle-new-schools-report/. [Accessed 26.10.2015.]
20
Times Higher Education World University Rankings 2015-201624: South Africa: 1 university in top 200; 2 in top 250; 3 in top 350; 4 in top
500; 5 in top 600; 6 in top 800. QS World University Rankings 2015/1625:
South Africa: 1 university in top 200; 3 in top 400; 5 in top 550; 6 in top 600; 7 in top 650; 9 in top 800.
Africa: South Africa occupies the top 3 positions and has 7 in the top 10. Academic Ranking of World Universities 2015 (aka Shanghai Rankings)26:
South Africa: 2 universities in top 300; 3 in top 400; 4 in top 500. Thomson Reuters / US News & World Report27: Africa: South Africa occupies the top 4 positions and has 6 in the top 10. Center for World University Rankings28:
South Africa: 1 university in top 200; 2 in top 300; 3 in top 400; 4 in top 500; 5 in top 700.
Graduation rates at higher education institutions (universities) However, the graduation rates at South African universities are mostly poor [Department of Higher Education and Training (2013) data29]:
Undergraduate certificates and diplomas: 18%. Undergraduate degrees: 15%. Postgraduate below master’s level: 41%. Master's degrees: 21%. Doctoral degrees: 13%.
For comparison: OECD-country average graduation rate (2011)30: 39%. The reasons are many, including: “… financial constraints – where students enrol for courses but don’t have funding to see them through –, lack of academic preparedness and students not getting enough support from their universities.”31 The benchmark set
24 Times Higher Education World University Rankings 2015-2016, 2015. Online: https://www.timeshighereducation.com/world-university-rankings/2016/world-ranking. [Accessed 27.10.2015.] 25 QS World University Rankings 2015/16, 2015. Online: http://www.topuniversities.com/university-rankings/world-university-rankings/2015#sorting=rank+region=6+country=+faculty=+stars=false+search=. [Accessed 27.10.2015.] 26 Academic Ranking of World Universities 2015, 2015. Online: http://www.shanghairanking.com/ARWU-Statistics-2015.html#2. [Accessed 27.10.2015.] 27 Thomson Reuters / US News & World Report, 2015. Online: http://www.usnews.com/education/best-global-universities/africa?int=9b5208. [Accessed 27.10.2015.] 28 Center for World University Rankings, 2015. Online: http://cwur.org/. [Accessed 27.10.2015.] 29 Department of Higher Education and Training, 2015. Statistics on Post-School Education and Training in South Africa: 2013. Onlinehttp://www.dhet.gov.za/DHET%20Statistics%20Publication/. [Accessed 04.11.2015.] 30 OECD, 2010. How many young people graduate from tertiary education? Online: http://www.oecd-ilibrary.org/. [Accessed 04.11.2015.] 31 View of Nicolene Murdoch, Executive Director for Teaching, Learning and Quality, Monash South Africa. Online: http://www.iol.co.za/lifestyle/family/kids/only-15-of-sa-university-students-graduate-1.1531809#.VjmwobcrJ1s [.Accessed 04.11.2015.]
21
out in the National Plan for Higher Education: At least 75%32 of students entering a programme should complete their degrees or diplomas. Adult basic education and training (ABET) South Africa has made great strides in ABET.33 National Treasury34 reported in 2015 that it stands at 84%. Literacy Despite poor schooling, South Africa has a high adult literacy rate (persons 15 years and over who are able to read and write) (Note: Definitions and standards differ35):
World Bank (2012)36: 94%.37 The African Economist (2013)38: 3/5239: 86%.
In the case of the youth literacy rate (persons 15-24 who are able to read and write):
World Bank (2012)40: 99%.41
NDP Vision 2030 “The single most important investment any country can make is in its people. Education has intrinsic and instrumental value in creating societies that are better able to respond to the challenges of the 21st century. Lifelong learning, continuous professional development and knowledge production alongside innovation are central to building the capabilities of individuals and society as a whole.”42 Societal habituation factors Societal habituation factors (which render some societies languid and others vigorous) are influenced by many factors (family history, quality of the home environment, nutrition, neighbourhoods, peers, climate, etc). Such traits are difficult to change, but
32 Department of Higher Education and Training, 2015. Statistics on Post-School Education and Training in South Africa: 2013. Onlinehttp://www.dhet.gov.za/DHET%20Statistics%20Publication/. [Accessed 04.11.2015.] 33 Google: “Adult Basic Education and Training, South Africa”. 34 National Treasury, 2015. 2015 Medium term budget policy statement speech. Online: http://www.treasury.gov.za/documents/mtbps/2015/mtbps/speech.pdf. [Accessed 28.10.2015.] 35 Online: http://theafricaneconomist.com/ranking-of-african-countries-by-literacy-rate-zimbabwe-no-1/#.Vi3jd7crJ1s. [Accessed 26.10.2015.] 36 Online: http://data.worldbank.org/indicator/SE.ADT.LITR.ZS. [Accessed 26.10.2015.] 37 Previous data: 1976: 76%, 1996: 82%, 2007: 88%. 38 Online: http://theafricaneconomist.com/ranking-of-african-countries-by-literacy-rate-zimbabwe-no-1/#.Vi3jd7crJ1s. [Accessed 26.10.2015.] 39 Preceded by Zimbabwe (1/52: 91%) and Equatorial Guinea (2/52: 87%). 40 Online: http://data.worldbank.org/indicator/SE.ADT.LITR.ZS. [Accessed 26.10.2015.] 41 Previous data: 1980: 85%, 1996: 94%, 2007: 98%. 42 Online: http://www.poa.gov.za/news/Documents/NPC%20National%20Development%20Plan%20Vision%202030%20-lo-res.pdf. [Accessed 08.11.2015.]

22
the stock of knowledge can – through education. With high quality education, negative societal habituation factors change over time. Health and economic growth Generally, the many studies on the relationship between health and economic growth conclude (for the detail see Appendix 2: Literature review and bibliography):
Good health has a positive, sizable, and statistically significant effect on aggregate output.
Good health is linked to economic growth through higher labour productivity, demographic changes and higher educational attainment. Equally, poor health undermines economic growth.
The relationships of health to poverty reduction and to long-term economic growth are powerful.
The encumbrance of disease, principally HIV/AIDS and TB, in some low-income countries is an obstacle to economic growth.
The WHO Commission on Macroeconomics and Health concluded that health is a creator and pre-requisite of development.
Notes on South Africa The World Health Organization (WHO) published a country ranking for the health systems of 191 countries / regions in 2000 (discontinued as a result of the intense controversy it engendered). South Africa was rated: 175/191. There have been some major improvements since, as indicated in the accompanying table.
WORLD HEALTH ORGANIZATION: HEALTH INDICATORS
South Africa Africa Global High-income countries
1990 2013 2013 2013 2013
Life expectancy at birth (years) 62 60 58 71 79 Infant mortality rate (per 1000 live births)1 47.0 32.8 59.9 33.6 5.3 HIV/AIDS prevalence (per 100 0003) 9 8677 11 888 2 669 500 … HIV/AIDS mortality rate (per 100 0003) 4687 370 122 22 … TB prevalence (per 100 0003) 5906 715 TB mortality rate (per 100 0002,3) 557 48 42 16 2.1 Immunization coverage (1-year-olds): Measles
79% 66% 74% 84% 94%
% population using improved drinking-water sources
81% 95%5 66%5 89%5 99%5
Population using improved sanitation 58% 74%5 33%5 64%5 96%5 Physicians (per 10 000 population) … 7.84 2.7 13.9 28.7 Nurses (per 10 000 population) … 51.14 12.4 28.6 88.2 Hospitals (per 100 000 population) … 0.74 0.8 … … Total health expenditure (% GDP) 8.3%6 8.9%5 5.6%5 8.6%5 11.6%5 Govt health expenditure (% total govt expenditure)
13.3%6 14.0%6 11.4%6 14.1%6 16.8%6
1 Probability of dying by age 1. 2 Of HIV-negative population. 3 Population. 4 2007-2013. 5 2012. 6 2000. 7 2001.
Source: World Health Organization, 2015. World Health Statistics 2015. Online: http://apps.who.int/iris/bitstream/10665/170250/1/9789240694439_eng.pdf?ua=1&ua=1. [Accessed 03.11.2015.]

23
Notes on table data:
Myriad data are available in the WHO report. Life expectancy at birth (years): Exhibited a strong decline after 1990 (62 years)
to 2004 (52 years43), and then improved to 60 years in 2013 and 61 years44 in 2014.
As is generally known, South Africa has a pandemic with HIV/AIDS (prevalence: 4th-worst45; mortality: 3rd-worst46) and TB (prevalence: 6th-worst47; mortality: 10th-worst48). However, the mortality-count is improving.
WEF/GCR 2015-16 (Pillar 4: “Health and Primary Education”) rates South Africa particularly poorly in terms of the indicator “Health” (140 countries): Health: 128/140. WEF/GCR 2015-16 (Pillar 4: “Health and Primary Education”) indicators for South Africa in respect of HIV/AIDS and TB (140 countries):
HIV prevalence (% adult population): 137/140. Business impact of HIV/AIDS: 133/140. TB incidence cases (per 100 000 population): 138/140. Business impact of TB: 133/140.
Another indicator of health is mental health. South Africa has a particularly low suicide rate, according to the World Health Organization (2012):
Number of suicides (per 100 000 people per year): 3.0. Ranking (higher = lower suicide rate): 148/171.49
FACTOR OF PRODUCTION 4: ENTREPRENEURSHIP Some scholars regard entrepreneurship as a subset of the production factor human capital, while others regard it as so significant that it requires separate consideration. We subscribe to the latter, and particularly so because it links closely with the allied production facilitation factor, credit / money creation. We elucidate this significant issue later. What is an entrepreneur? An entrepreneur, on the individual level, is a unique strain of human capital who amalgamates the factors of production and shoulders the uncertainties (part of risk) involved in production. S/he buys or hires the other factors 43 National Treasury (see later). 44 National Treasury (see later). 45 HIV/AIDS prevalence (2013): Botswana: 15 817; Lesotho: 17 564; Swaziland: 16 332. (Source: WHO.) 46 HIV/AIDS mortality rate (2013): Lesotho 778; Zimbabwe: 451. (Source: WHO.) 47 TB prevalence (2013): Tuvalu: 623; Swaziland: 945; Timor-Leste: 802; Djibouti: 906; Kiribati: 748. (Source: WHO.) 48 TB mortality rate (2013): Cambodia: 66; DRC 68; Mozambique: 69; Myanmar: 49; Namibia: 57; Nigeria: 94; Somalia 74; Swaziland 91; Timor-Leste: 87. (Source: WHO.) 49 Lowest suicide rate: Saudi Arabia and Syria; highest: Guyana.
24
of production, brings them together, organises and coordinates them so as to earn a profit. An entrepreneur acts as the COO of the new business. S/he decides in what in what proportion the other factors should be combined, what and where s/he will produce and by what method. S/he is loosely identified with the owner, speculator, innovator, planner, and organiser, of the new business (and inventor in some cases).50 Entrepreneurs, on the corporate level, are the corporate entities that are obliged, in an age of intense competition (if not, there should be – see section on government governance), to continually innovate and expand into new markets in order to survive. Corporations are closely monitored by their shareholders who demand a fair return on capital provided, implying innovation and expansion. It is axiomatic that the aforementioned factors of production (natural resources, physical capital, and human capital) have been in existence for aeons. Yet economic growth at high levels, leading to a high GDPRpc growth rate, is a relatively recent phenomenon (2+ hundred years). Why is this so? The answer is the existence of the entrepreneur, and a business environment that is propitious for entrepreneurship. As noted, entrepreneurs’ skills lie in combining the aforementioned factors of production, and creating processes of production, in ways that (1) reduce the cost of production, (2) raise employment, and (3) raise income levels, enabling the purchase of the lower-cost goods. This is called innovation, and innovation breeds further innovation (for example, the innovation of the computer led to the innovation of the products of Microsoft, Adobe, Google; Facebook, the Internet, etc). The generally accepted definition of innovation is: “An innovation is the implementation of a new or significantly improved product (good or service), or process, a new marketing method, or a new organisational method in business practices, workplace organisation or external relations.”51 There is no academic debate on the importance of entrepreneurship / innovation in economic growth. A few examples of opinions are presented in Appendix 2: Literature review and bibliography. Here we present a summary of some views:
In the latter half of the twentieth century a production function approach to economic growth led to the conclusion that increases in output could best be produced by increasing the inputs (labour and capital) into the production process.
Research over the past few has shown that the key element in economic growth is the creation of entrepreneurial opportunities. When such opportunities are available, individuals have the incentive to invest in human and physical capital without government intervention.
The straightforward prescription for economic growth is to create an institutional environment that encourages markets and rewards productive activity.
An entrepreneur is a person who combines the other factors of production - land, labour, and capital - to earn a profit. The most successful entrepreneurs
50 This paragraph benefitted much from: http://www.economicsdiscussion.net/production/factors-of-production-land-labour-capital-and-entrepreneur-national-income/541. [Accessed 22.08.2015.] 51 OECD, 2005. Oslo Manual. Third edition. Cited by Hall, BH, 2011. Innovation and productivity. NBER Working Paper Series. Massachusetts: National Bureau Of Economic Research.
25
are innovators who find new ways produce goods and services or who develop new goods and services to bring to market.
Without the entrepreneur combining land, labour, and capital in new ways, many of the innovations the world has would not exist.
There is no debate about the importance of research and development (R&D) in the creation of new products and cheaper existing products (for example computers, smart phones), and in improving the production process. However R&D expenditure is not the whole story, because once the research is done, the results need to be applied to make production less costly, or, even more importantly, to produce goods and services that have never been produced before. This is the role of entrepreneurship.
Entrepreneurs are educated persons who are observant in the fields in which they work, and actively endeavour to detect previously unobserved profit opportunities. Typically, they then develop their ideas in a low cost environment (own time expended, usually in the garage), until the point where production is required. At this stage they put at stake their entire wealth (take the ultimate financial risk), and endeavour to access external funding.
Entrepreneurship / innovation creates an environment that encourages further entrepreneurship / innovation.
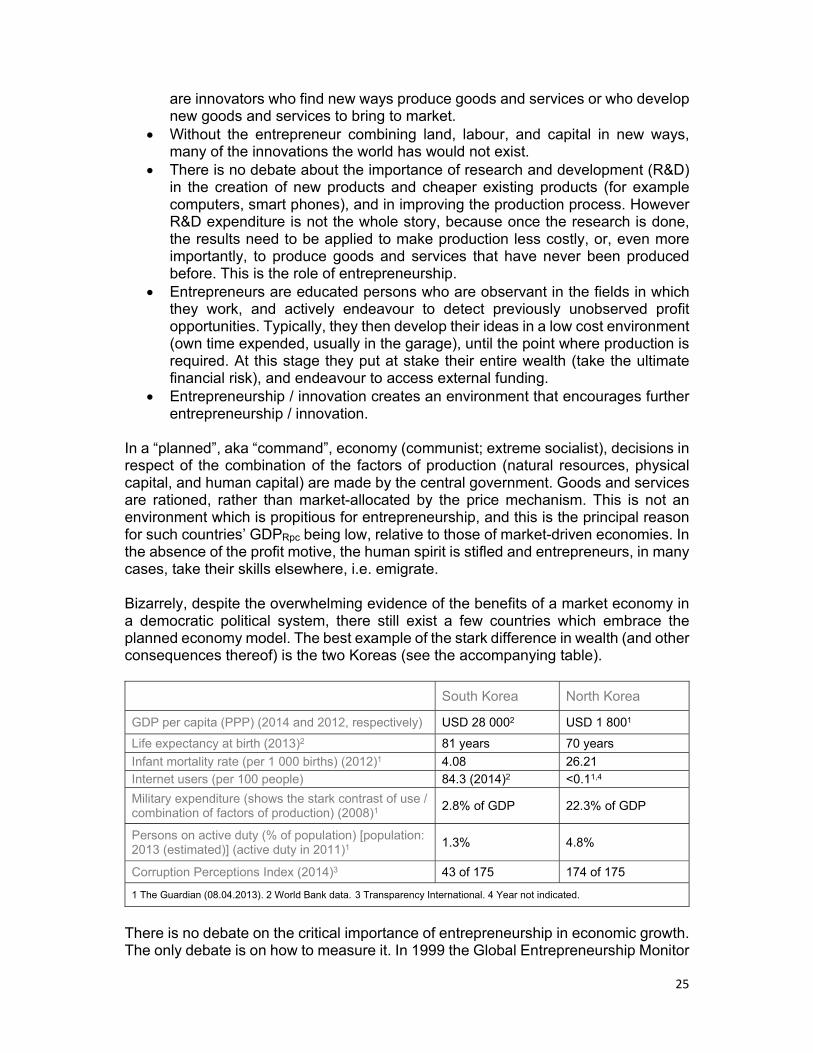
In a “planned”, aka “command”, economy (communist; extreme socialist), decisions in respect of the combination of the factors of production (natural resources, physical capital, and human capital) are made by the central government. Goods and services are rationed, rather than market-allocated by the price mechanism. This is not an environment which is propitious for entrepreneurship, and this is the principal reason for such countries’ GDPRpc being low, relative to those of market-driven economies. In the absence of the profit motive, the human spirit is stifled and entrepreneurs, in many cases, take their skills elsewhere, i.e. emigrate. Bizarrely, despite the overwhelming evidence of the benefits of a market economy in a democratic political system, there still exist a few countries which embrace the planned economy model. The best example of the stark difference in wealth (and other consequences thereof) is the two Koreas (see the accompanying table). South Korea North Korea
GDP per capita (PPP) (2014 and 2012, respectively) USD 28 0002 USD 1 8001
Life expectancy at birth (2013)2 81 years 70 years
Infant mortality rate (per 1 000 births) (2012)1 4.08 26.21
Internet users (per 100 people) 84.3 (2014)2 <0.11,4
Military expenditure (shows the stark contrast of use / combination of factors of production) (2008)1 2.8% of GDP 22.3% of GDP
Persons on active duty (% of population) [population: 2013 (estimated)] (active duty in 2011)1 1.3% 4.8%
Corruption Perceptions Index (2014)3 43 of 175 174 of 175
1 The Guardian (08.04.2013). 2 World Bank data. 3 Transparency International. 4 Year not indicated.
There is no debate on the critical importance of entrepreneurship in economic growth. The only debate is on how to measure it. In 1999 the Global Entrepreneurship Monitor

26
(GEM) consortium [a joint project between Babson College (USA) and London Business School (UK)] was initiated, with the aims of answering the questions: How does entrepreneurship contribute to economic development? What should governments do to make their economies more entrepreneurial? Why are some countries more entrepreneurial than others? What drives entrepreneurship in different contexts? Its fine work is ongoing.52,53
However, a good indicator of entrepreneurship / innovation does exist: Data on patent registration, compiled by the World Intellectual Property Organization (WIPO, a self-funding agency of the UN). It is not surprising to find the data as shown in the accompanying table. The message? Entrepreneurship / Innovation begets entrepreneurship / Innovation.
Patent applications by income group (2013) Source: World Intellectual Property Organization
High income Upper middle-income Lower middle-income Lower income 60.3% 36.4% 2.9% 0.4%
Patent applications by region (2013) Source: World Intellectual Property Organization
Asia North America Europe Latin America & the Caribbean Oceania Africa 58.4% 23.6% 13.5% 2.5% 1.4% 0.6% Online: http://www.wipo.int/edocs/pubdocs/en/wipo_pub_941_2014.pdf. [Accessed 16.10.2015.]
Later on we will provide attention-grabbing WIPO data on the migration of entrepreneurs to the high-income nations, indicating the mobility of highly skilled human capital. Entrepreneurs take their innovations to countries where they are welcomed and have less risk. This is a serious issue for countries with dysfunctional governments. NOTES ON SOUTH AFRICA WEF/GCR 2015-16 (Pillar 12: “Innovation”) rankings (140 countries):
Innovation: 38/140 Capacity for innovation: 32/140. Quality of scientific research institutions: 33/140. Company spending on R&D: 32/140. University-industry collaboration in R&D: 31/140. Gov’t procurement of advanced tech products: 119/140. Availability of scientists and engineers: 106/140. PCT patents, applications (per million population): 46/140.
There is anecdotal evidence that South Africa loses many entrepreneurs (and skills) to the high-income countries. This is backed up by WEF/GCR 2015-16 (Pillar 7: “Labour Market Efficiency”) rankings (for a summary of all rankings see the section: Economic psyche of the nation) (140 countries):
52 Levie, J, Autio, E, Acs, Z, Hart, M, 2014. “Global entrepreneurship and institutions: An introduction.” Small Business Economics. 42 (3). Glasgow: University of Strathclyde. 53 Online: http://www.gemconsortium.org/. [Accessed 23.08.2015.]

27
Country capacity to retain talent: 61/140. Country capacity to attract talent: 46/140.
The South African government, and other organisations, have taken a number of steps to encourage SMME-entrepreneurship, including (some of the older institutions such as the Land Bank and IDC have refocussed to include SMME finance):
1992: The Small Enterprise Foundation.54 1996: Promulgation of the National Small Business Act (DTI).55 1996: The South African Institute for Entrepreneurship.56 1998: Business Partners Limited (formerly SBDC).57 1998: Technology for Women in Business (DTI).58 1999: South African Women in Construction.59 2000: Community Entrepreneurship and Business Initiative.60 2000: The Tourism Enterprise Programme (Tourism Action Plan).61 2001: The Hope Factory (part of the Nation Building division of SAICA).62 2001: Umsobomvu Youth Fund.63 2001: The South African Women's Entrepreneur Network.64 2002: Women in Oil and Energy in South Africa.65 2004: Small Enterprise Development Agency (DTI) 66 [Incorporates: Ntsika Enterprise Promotion Agency, the National Manufacturing Advice Centre Trust (NAMAC), the Community Public Private Partnership Programme, Small Enterprise Human Development Programme, Khula Enterprise Finance]. 2004: National Youth Development Agency.67 2005: The Branson Centre of Entrepreneurship in South Africa.68 2010: Human Resource Development Council Provincial.69 2014: Startup Nations South Africa: A 35-nation global initiative70.
NDP Vision 2030:
54 For details see: http://www.sef.co.za/background. 55 For details see: http://www.southafrica.info/business/trends/newbusiness/smallbusiness.htm#.VjcucbcrJ1s. 56 For details see: http://www.entrepreneurship.co.za/. [Accessed 02.11.2015.] 57 For details see: http://www.businesspartners.co.za/. 58 For details see: http://www.southafrica.info/about/science/twib.htm#.Vjc9H7crJ1s. [Accessed 02.11.2015.] 59 For details see: http://www.specifile.co.za/company/109683-sawic-south-african-women-in-construction-association/. [Accessed 02.11.2015.] 60 For details see: http://acdivoca.org/our-programs/project-profiles/south-africa-community-entrepreneurship-business-initiative-cebi. [Accessed 02.11.2015.] 61 For details see: http://www.tep.co.za/About_CompanyOverview.aspx. [Accessed 02.11.2015.] 62 For details see: http://www.thehopefactory.co.za/about-hope-factory/. [Accessed 02.11.2015.] 63 For details see: http://www.youthportal.org.za. [Accessed 02.11.2015.] 64 For details see: http://www.sawen.org.za/. [Accessed 02.11.2015.] 65 For details see: www.woesa.com. [Accessed 02.11.2015.] 66 For details see: http://www.seda.org.za. [Accessed 02.11.2015.] 67 For details see: http://www.nyda.gov.za/Pages/default.aspx. [Accessed 02.11.2015.] 68 For details see: http://bransoncentre.co.za/south-africa/about-us/. [Accessed 02.11.2015.] 69 For details see: http://www.hrdcsa.org.za/content/about-hrdcsa. [Accessed 02.11.2015.] 70 Online: http://www.smesouthafrica.co.za/Global-initiative-to-energise-SAs-startup-ecosystem/. [Accessed 02.11.2015.]

28
“Innovation is critical for introducing new products into the market and producing goods and services more efficiently. Research and development should be significantly expanded. Collaboration across the South African education system and with internationally accredited institutions should lead to higher levels of innovation.”71 A note on the entrepreneur under “utopian” communism / socialism: Despite overwhelming evidence of the low GDPRpc numbers of (and poverty engendered under) “utopian” communism / socialism (the main tenet of which is central control of amalgamation of the factors of production), there are some politicians who continue to offer (theoretically appealing) Marxism-Leninism as a panacea for the economic problems of South Africa, and the ANC continues to nurture its alliance with the SA Communist Party. This is not helpful in the modern world, which looks upon such countries with disappointment-signalling raised eyebrows and caution. These politicians refuse to accept that “Capitalism” did not self-destruct; rather “A spectre is haunting Europe – the spectre of Communism”72 did, and it did so because the ideology is flawed. It is flawed because (1) it ignores the innate human trait: That people are inherently competitive, and wish to improve their economic circumstances; (2) it does not embrace and encourage the entrepreneur, the risk-taker, the innovator; in fact it abhors the entrepreneur. In high-income countries, entrepreneurs, wealthy from the rewards of entrepreneurship (profit), are revered, and they are respected by employees for the risks taken by them, and for the job-creation outcomes of their endeavours. They are not regarded as exploiters of labour, but as creators of labour opportunities. To even have this conversation in the modern age is a reflection of a lack of economics-worldliness. Evidence of the economic rewards (high GDPRpc) of the efficacious “ideology”, Free-Market Capitalism, is vast and clear. In this economic system the price mechanism allocates the means of production and the products flowing from their amalgamation, whereas in the “utopian” economic system the central government owns and allocates them – in most cases inefficiently. A note on nationalisation: The populists calling for nationalisation exhibit extreme ignorance: A simple calculation for just 1 bank [number of shares in issue x market price = market capitalisation = price to pay (= R228.9 billion in the case of Standard Bank at 5pm on 10.11.201573)] will reveal that the bank / company is totally unaffordable by government [which has scarce revenue and is under pressure to keep tax rates low – to enhance C + I (remember C + I = GDE; GDE + X – M = GDP)]. Nationalisation rhetoric further 71 Online: http://www.poa.gov.za/news/Documents/NPC%20National%20Development%20Plan%20Vision%202030%20-lo-res.pdf. [Accessed 08.11.2015.] 72 Marx, K, Engels, F, 1848. The Communist Manifesto. Originally: Manifesto of the Communist Party. First published as a political pamphlet. Online: https://www.google.com/search?q=Marx%2C+K%2C+The+Communist+Manifesto&rls=com.microsoft:en-US:%7Breferrer:source?%7D&ie=UTF-8&oe=UTF-8&sourceid=ie7&rlz=1I7GGLL_en&gws_rd=ssl. [Accessed 16.10.2015.] 73 Source: JSE Limited.
29
damages the already poor image of South Africa. The extreme inefficiency of some SOEs should be enough evidence that governments should not be involved in business. The corporate and household sectors pay for government to provide collective public services. EFFICIENCY OF PRODUCTION: PRODUCTIVITY Productivity is a measure of the efficiency of production, i.e. how efficiently an economy uses the factors of production (inputs) to produce the outputs, goods and services. It is expressed as the ratio of output to inputs, i.e. output per unit of input. Thus, an increase in productivity means that more goods and services are produced with the same amount of labour and capital. Productivity is a key source of economic growth and international and domestic competitiveness. According to the celebrated 1950s Solow-Swan model (an extension of the 1940s Harrod-Domar model), economic growth in the long term is attributed to growth / accumulation in the 2 factors of production, physical capital and human capital, and productivity. (Note that natural resources is not included; this is because natural resources are a primary input, i.e. are converted into consumption and capital goods by physical capital and human capital.) The model offers:
GDPt (Ct, It, Nt) = Pt x Xt (Ct, Lt) where aggregate output, GDP in a period, consists of consumption goods Ct, investment goods It, and net exports Nt. These outputs are produced from aggregate input Xt, consisting of capital services Ct and labour services Lt. Productivity is represented as a “Hicks-neutral” augmentation Pt of aggregate input. In essence, it measures productivity as the residual [sometimes called the Solow residual, but generally as total factor productivity (TFP)] of the contributions of the inputs in the production (of GDP) function, physical capital and human capital.74 Expressed as a ratio, productivity is:
Pt = GDPt / Xt. GDP is measured, but can Xt and its components be measured? Certain countries (for example New Zealand and Australia 75 ) do provide estimates of TFP and its components (from their Productivity Accounts) but the estimates are plagued by methodological issues. Research on Productivity Accounts continues, including calls
74 Baldwin, JR, Harchaoui, TM, 2005. The integration of the Canadian productivity accounts within the system of national accounts: Current status and challenges ahead. NBER Working Paper Series. Number 11107. Cambridge, MA: NBER. 75 See Statistics New Zealand, 2015. Productivity Statistics: 1978–2014. Online: file:///C:/Users/AlexanderPierre/Downloads/ProductivityStatistics78-14HOTP.pdf. [Accessed 25.08.2015.]

30
for the integration of Productivity Accounts into the SNA, the most prominent being by the OECD.76,77 One measure of productivity is widely available: Labour productivity. It is measured by many countries as the ratio between measure of output (usually GDP) and a measure of input use (usually total number of hours worked).78 It will immediately be evident that GDP is the outcome of the inputs of all factors of production, of which labour is one. Therefore, this measure of labour productivity is flawed. The principal contributors to productivity growth are (and are interlinked and overlap) (see Appendix 2: Literature review and bibliography):
Investment in physical capital. Physical capital enables human capital to produce a higher level, and a better quality, of output. However, physical capital goods suffer from diminishing returns. A change in capital available per hour of paid labour is called capital deepening or shallowing.
Technological advances: New information technology, new machinery, new production methods, new products, etc.
Investment in research and development (R&D), i.e. new knowledge, aimed at improving the production process (affects capital productivity).
Efficiency improvements at the firm level, spurred by competition. Success in an industry leads to the exit of the weak firms, and to larger remaining firms which are able to take advantage of economies of scale.
Public infrastructure investment, enabling transport to markets, energy efficiency, efficient communications, etc.
A sound financial system. International trade influences the size of the market for individual firms and
introduces economies of scale. Trade also transfers technological improvements (sometimes called technological spillovers).
Investment in education and health (facilities and services), leading to positive changes in the quality of human capital.
The general business environment, particularly government institutions and policies. This factor applies not only to productivity but to all drivers of economic growth.
The World Economic Forum annually publishes The Global Information Technology Report (WEF/GITR). It provides a comprehensive assessment of networked readiness, or how prepared an economy is to apply the benefits of information and communications technologies (ICTs) to promote economic growth and well-being. The report ranks the progress of 148 economies in leveraging ICTs to increase
76 OECD, 2011. Measuring productivity: Measurement of aggregate and industry-level productivity growth. OECD Manual. Online: http://www.oecd.org/std/productivity-stats/2352458.pdf. [Accessed 25.08.2015.] 77 Baldwin, JR, Harchaoui, TM, 2005. The integration of the Canadian productivity accounts within the system of national accounts: Current status and challenges ahead. NBER Working Paper Series. Number 11107. Cambridge, MA: NBER. 78 OECD. Online: http://www.oecd.org/std/labour-stats/41354425.pdf. [Accessed 25.08.2015.]

31
productivity, economic growth and the number of quality jobs.79 The highest-rated 5 countries are: Finland (1/148), Singapore, Sweden, Netherlands, Norway (5/148); and the 5 lowest-rated are: Chad (148/148), Burundi, Myanmar, Guinea, Angola (144/148). NOTES ON SOUTH AFRICA WEF/GCR 2015-16 (Pillar 7: “Labour Market Efficiency”) provides 1 productivity indicator. South Africa’s rating is particularly poor (140 countries):
Relationship between pay and productivity: 127/140. WEF/GCR 2015-16 (Pillar 7: “Technological Readiness”): South Africa’s ratings are fair to poor (140 countries): Technological adoption: 39/140.
ICT use: 57/140. WEF/GITR (2014): South Africa’s rating is poor (148 countries):
How prepared an economy is to apply the benefits of ICTs: 70/148.
Although the labour productivity measure is flawed (it does not account for the contributions to GDP of physical capital and entrepreneurship), we present it for South Africa in the accompanying chart (1971 Q1-2015 Q1).
The private sector itself has some way to go to improve productivity. WEF/GCR 2015-16 (Pillar 7: “Business Sophistication”) ratings (140 countries):
Local supplier quantity: 51/140. Local supplier quality: 38/140. State of cluster development: 33/140. Nature of competitive advantage: 70/140. Value chain breadth: 56/140. Control of international distribution: 31/140. Production process sophistication: 39/140. Extent of marketing: 24/140. Willingness to delegate authority: 26/140.
79 Almost verbatim from: World Economic Forum, 2015. The Global Information Technology Report. Online: 2014http://www.weforum.org/reports/global-information-technology-report-2014. [Accessed 27.10.2015.]
South Africa: Labour productivity in the non-agricultural sectors (yoy %). Source: South African Reserve Bank.

32
The government is aware of the importance of productivity. The NDP 80 states: “Science and technology continue to revolutionise the way goods and services are produced and traded. As a middle-income country, South Africa needs to use its knowledge and innovative products to compete. On its own, a more competitive cost of production will not be sufficient to expand the global presence of South African industry. This applies to both new industries and traditional sectors, such as mining. Innovation is necessary for a middle-income country to develop.” INTERNATIONAL TRADE (OPENNESS OF THE ECONOMY) We know from the expenditure approach to GDP-estimating that: GDEN = C + I
GDPN = GDEN + (X - M) GDPN = domestic demand + net external demand.
X - M is net external demand (NED), aka net exports (NE). Underlying NE is what the literature terms international trade openness (ITO). Generally, the literature uses the volume of trade [(X + M) / GDP] as an indicator of ITO. There is much evidence in the literature (see Appendix 2: Literature review and bibliography) to indicate that the relationship between economic growth and ITO is positive, and that it creates a virtuous circle effect: The greater the degree of ITO, the higher growth is; higher growth generates a higher level of trade, and so on. The literature81 on economic growth and ITO offers 5 channels through which trade affects economic growth:
1. Trade leads to higher specialisation and thus to gains in TFP, by allowing countries to exploit their areas of comparative advantage.
2. Trade expands potential markets, which allows domestic firms to take advantage of economies of scale, thus increasing their TFP.
3. Trade diffuses both technological innovations and improved managerial practices through stronger interactions with foreign firms and markets.
4. Free trade tends to lessen anti-competitive practices of domestic firms. 5. Trade liberalisation reduces the incentives for firms to conduct rent-seeking
activities that are mostly unproductive. NOTES ON SOUTH AFRICA The International Chamber of Commerce annually publishes the Open Markets Index (openness to international trade) for countries. South Africa’s ranking:
Out of 75 countries ranked: 50/75 (Category: Average openness). Group of 20 (19 countries + EU): 11/19.
80 National Development Plan, 2013. Online: http://www.gov.za/sites/www.gov.za/files/Executive%20Summary-NDP%202030%20-%20Our%20future%20-%20make%20it%20work.pdf. [Accessed 07.11.2015.] 81 Almost verbatim from: Ibid.

33
WEF/GCR 2015-16 (Pillar 6: “Goods Market Efficiency”) provides rankings for South Africa for the following indicators in this respect (140 countries):
Foreign competition: 71/140. Prevalence of non-tariff barriers: 33/140.
Trade tariffs (% duty): 78/140. Prevalence of foreign ownership: 47/140.
Business impact of rules on FDI: 99/140. Burden of customs procedures: 71/140.
Imports as a % of GDP: 88/140.
South Africa: 1960-2014. International trade to GDP. Source: World Bank.
DEMAND FACTORS Generally, the literature discusses economic growth from the production side of the economy (see Appendix 2: Literature review and bibliography). It is axiomatic that production creates income for the household, corporate and government sectors, enabling the purchase of the goods and services produced, indicating the causation path as:
Production (supply) → consumption (demand). Simply put, this says that production creates its own demand. This is so, but it is only part of the story. We know that:
GDEN = C + I GDPN = GDEN + (X – M) GDPN = domestic demand + net external demand.
We also know that, in recessionary periods, C declines sharply. With C-demand falling, I (in production capacity) is negatively affected, making C + I = GDE (demand) exhibit negative growth. In boom times, C-demand is high, leading to an increase in I (in production capacity), making C + I = GDE exhibit positive growth. The increased production leads to higher income. Much of the increased C + I = GDE is financed by resorting to bank credit [by both consumers and companies (with higher income levels)]. Bank credit extension enables this to take place, leading at times to demand > supply. Provided that this imbalanced

34
condition is not severe, and production capacity can adjust rapidly (the case of China - which has a high elasticity of supply - is relevant here), the increased demand can be met without a major effect on inflation (which is an indicator of demand > supply). We will show later that there is a close correlation between GDPN and DCE / MC growth. It will be evident that increased demand funded by increased bank DCE is only sustainable if borrowers’ debt service costs are covered by increased income (generated mainly from I-expenditure and increased production). The other demand factor is net external demand. An increased international demand for local exports will lead to higher corporate income and higher corporate investment (in the production capacity of the export product), i.e. a higher GDP, and ultimately higher dividend income - which accrues to the household sector (directly or via retirement funds, collective investment schemes, etc). We can conclude that, while the principal driver is production, demand does play a major role at times, leading to bi-directional causation (with the emphasis on production):
Production (aggregate supply) ↔ C + I + (X – M) (aggregate demand). FINANCIAL MARKET DEVELOPMENT Financial market development is a crucial matter for economic growth, and there is much evidence in the literature (see Appendix 2: Literature review and bibliography) of its importance in this regard. The banking system (essentially the deposit and loan markets) is at the very centre of financial market development. Their primary function is to mobilise funds (and, as said, create new credit / money) for investments in physical capital (and advance consumption spending to a degree), and to reduce risk for deposit clients by diversification and the monitoring of loan clients (alleviating the principal-agent problem, and the associated problems of moral-hazard and adverse-selection). A not-so-obvious aspect of financial market development is the role played by the bank margin, i.e. the differential between bank deposit rates and lending rates. When margins are wide, a function of weak financial market development, the cost of loan finance is high, rendering many capital projects unviable (IRR < bank loan rate), thus stifling economic development. As the margin narrows, a function of financial market development progress, physical capital projects become increasingly viable, stimulating economic growth.82 It should be evident that diminishing returns apply here. A country with a wide bank margin will enjoy major benefits in terms of economic growth as the margin narrows, but the benefit will diminish over time until zero (as in the case of countries with developed financial markets). The other critical part of financial market development is the development of the other financial markets: The equity, money (other part), bond, derivatives, and foreign 82 Greenwood, J; Sánchez, JM; Wang, C, 2010. Quantifying the impact of financial development on economic development. Federal Reserve Bank of St Louis Working Paper Series. Number 2010-023C.

35
exchange markets. The latter market does not comprise borrowing and lending, but facilitates international trade and monetary investment. The equity and bond markets allocate permanent funding (ordinary shares), and non-permanent funding (bonds and preference shares) to the most viable businesses and to new business projects, stimulating economic growth. The derivatives market enables hedging and speculation. The equity, bond and derivatives markets are exchange-driven markets. Where these markets have a high degree of liquidity, are well regulated and therefore offer strong investor protection, investment in physical capital (via the markets, locally and from abroad) is encouraged, which is a positive factor in economic growth. Another important aspect of financial market development, which is closely related to entrepreneurship, is the existence and supply of venture capital. There is much research in this area (see Appendix 2: Literature review and bibliography). NOTES ON SOUTH AFRICA WEF/GCR 2015-16 (Pillar 8: “Financial Market Development”) ratings (140 countries):
Efficiency: 16/140. Availability of financial services: 6/140. Affordability of financial services: 21/140. Financing through local equity market: 1/140. Ease of access to loans: 32/140. Venture capital availability: 47/140. Trustworthy and confidence: 11/140. Soundness of banks: 8/140. Regulation of securities exchanges: 2/140.
GENERAL BUSINESS ENVIRONMENT Introduction The factors of production are amalgamated by entrepreneurs who operate in a general business environment. Thus, it is fitting to identify the factors that play a role in influencing the general business environment. There are myriad influences, principally emanating from government intervention:
Government: Theory of bureaucracy and size. Government: Governance. Government: Regulatory burden. Government: Economic policies:
o Fiscal policy. o Monetary policy. o Industrial policy. o Labour market policy.
Government: Attitude towards business. Corporate sector: Governance. Economic psyche of the nation.

36
Government: Theory of bureaucracy and size It is obvious that government plays a crucial role in economic growth, apart from providing collective public services: It is largely responsible for the environment in which business and entrepreneurs operate to create growth and employment, and it can be a positive or a negative influence. Governments should be viewed through the prism of the theory of bureaucracy. There are both positive and negative approaches. The positive approach states that a government bureaucracy is necessary as there are certain functions (collective services, such as affordable education, social services, military, etc) which cannot be carried out by the private sector; that the private sector requires regulation (such as financial institution regulation); that a government bureaucracy embodies accumulated experience and lends a constancy to government administration regardless of which political party is in power, etc. There are prerequisites for an efficient government bureaucracy, such as it should be comprised of technocrats, it should be as small as possible, it should have checks and balances, and appointments should not be of a political nature. In many countries these preconditions are not met, leading to vociferous condemnation of any form of bureaucracy. In dysfunctional countries bureaucrats are focussed on defending their own interests (ensuring their jobs, favouritism, nepotism, cronyism, etc), enrichment from corruption, and ensuring for themselves the highest remunerating possible. Related to this factor is the problem of dismantling bureaucracy once it is entrenched. As regards the size of government, there is much research (see Appendix 2: Literature review and bibliography). Generally, there is a strong negative relationship between the size of government and economic growth. 83 However, there are exceptions: A large government (measured by high taxes and expenditure) is not necessarily associated with low growth. Large and efficient government sectors in some rich countries, which provide excellent social services and market-friendly policies can be associated with above-average economic growth84, while the opposite applies where large governments are incompetent. When a government is dysfunctional the well-known idiom, “burden of government”, applies, which is manifested in, for example, high tax rates, revenue-use to maintain ineffectual public programmes, a swollen bureaucracy, distortion of the markets’ incentives, interfering in the economy by assuming roles appropriate for the private sector, etc.85 Particularly in poorer countries, driven by their and their sycophants’ employment, dysfunctional governments, by means foul, ensure that they remain in power (sometimes for decades, holding back development). Means foul includes election- 83 Afonso, A, Furceri, D, 2008. Government size, composition, volatility and economic growth. European Central Bank Working Paper Series. Number 849. January. 84 Bergh, A, Henrekson, A, 2011. Government size and growth: A survey and interpretation of the evidence. IFN Working Paper. Number 858. Stockholm: Research Institute of Industrial Economics. January. Online: http://journalistsresource.org/wp-content/uploads/2011/08/Govt-Size-and-Growth.pdf. [Accessed 26.08.2015.] 85 Loayza, N (World Bank) and Soto, R (Pontificia Universidad Católica de Chile) (editors), 2002. The sources of economic growth: An overview. In Economic growth: sources, trends, and cycles. Santiago: Central Bank of Chile.

37
outcome manipulation; decreeing of a one-party state; control of the state broadcaster (which is the only media available to the large poor segment of the population, often referred to as voting fodder); manipulation of private media (through ownership, law, government advertising); punishment of disloyalty or dissent, and so on. NOTES ON SOUTH AFRICA
As discussed above, large governments are not necessarily bad governments. The accompanying chart (left) provides a measure of the size of government (1960-2014: 9.7% to 20.3%). It is clear that the size of government increased markedly from 1960 until the early 1990s (Nationalist government; a poor sign), and then levelled off on balance (ANC government). The latter is a good sign, but it does not mean that the government is an efficient one (just as the Nationalist government was not). Employment in the government sector has increased markedly over the past few years, as indicated in the accompanying chart (right). However, it is more or less in line with private sector employment increases. The increase in government sector employment has not increased the public sector wage bill (as a % of total expenditure): 2003/04: 34.4%; 2006/07: 32.5%; 2010/11: 33.6%; 2014/15: 32.1%.86 Government: Governance Government governance covers a wide range of themes, including (seen from a positive perspective):
Respect for the rule of law (which means rule according to the law). Clear separation of the executive and the judiciary. Clearly defined laws and legal procedures. The quality of government in providing collective services, such as education,
health services, and social services. The quality of government in managing state-owned enterprises (SOEs), such
as the energy delivery SOE (in the case of a government monopoly), development financial institutions, the Post Office, rail transport services, etc.
86 Online: http://www.treasury.gov.za/. [.Accessed 05.11.2015]
South Africa: Government consumption expenditure as % of GDP (1960-2014). Source: World Bank.
South Africa: Labour employment in non-agricultural sectors (1960-2014) (Index: 2010 = 100). Source: SA Reserve Bank.
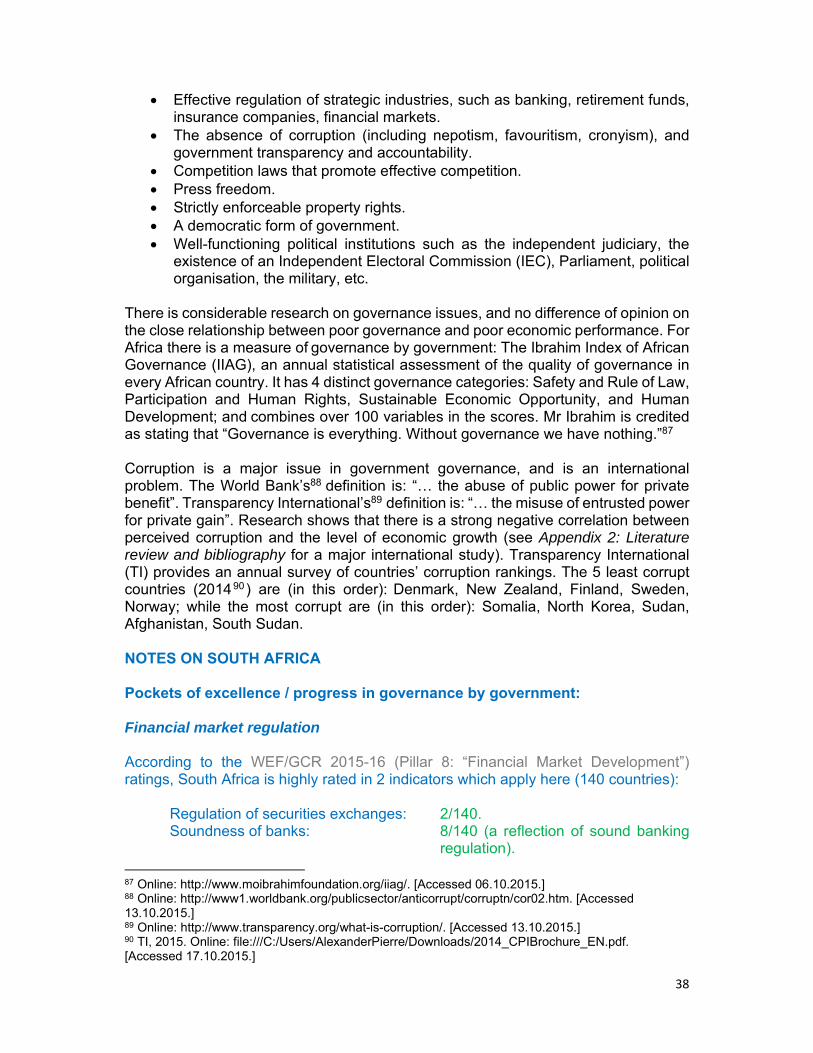
38
Effective regulation of strategic industries, such as banking, retirement funds, insurance companies, financial markets.
The absence of corruption (including nepotism, favouritism, cronyism), and government transparency and accountability.
Competition laws that promote effective competition. Press freedom. Strictly enforceable property rights. A democratic form of government. Well-functioning political institutions such as the independent judiciary, the
existence of an Independent Electoral Commission (IEC), Parliament, political organisation, the military, etc.
There is considerable research on governance issues, and no difference of opinion on the close relationship between poor governance and poor economic performance. For Africa there is a measure of governance by government: The Ibrahim Index of African Governance (IIAG), an annual statistical assessment of the quality of governance in every African country. It has 4 distinct governance categories: Safety and Rule of Law, Participation and Human Rights, Sustainable Economic Opportunity, and Human Development; and combines over 100 variables in the scores. Mr Ibrahim is credited as stating that “Governance is everything. Without governance we have nothing.”87 Corruption is a major issue in government governance, and is an international problem. The World Bank’s88 definition is: “… the abuse of public power for private benefit”. Transparency International’s89 definition is: “… the misuse of entrusted power for private gain”. Research shows that there is a strong negative correlation between perceived corruption and the level of economic growth (see Appendix 2: Literature review and bibliography for a major international study). Transparency International (TI) provides an annual survey of countries’ corruption rankings. The 5 least corrupt countries (201490) are (in this order): Denmark, New Zealand, Finland, Sweden, Norway; while the most corrupt are (in this order): Somalia, North Korea, Sudan, Afghanistan, South Sudan. NOTES ON SOUTH AFRICA Pockets of excellence / progress in governance by government: Financial market regulation According to the WEF/GCR 2015-16 (Pillar 8: “Financial Market Development”) ratings, South Africa is highly rated in 2 indicators which apply here (140 countries):
Regulation of securities exchanges: 2/140. Soundness of banks: 8/140 (a reflection of sound banking
regulation). 87 Online: http://www.moibrahimfoundation.org/iiag/. [Accessed 06.10.2015.] 88 Online: http://www1.worldbank.org/publicsector/anticorrupt/corruptn/cor02.htm. [Accessed 13.10.2015.] 89 Online: http://www.transparency.org/what-is-corruption/. [Accessed 13.10.2015.] 90 TI, 2015. Online: file:///C:/Users/AlexanderPierre/Downloads/2014_CPIBrochure_EN.pdf. [Accessed 17.10.2015.]

39
Sound competition law execution According to the WEF/GCR ratings 2015-16 (Pillar 8: “Goods Market Efficiency”), South Africa is highly rated in the indicator (which applies here) (140 countries):
Effectiveness of anti-monopoly policy: 13/140. Property rights Solid property rights is one of the quoins of economic progress, as property is the principal collateral accepted for bank credit advances. While there is uncertainty in respect of farm expropriation, land purchase by foreigners, etc, the WEF/GCR 2015-16 (Pillar 1: “Institutions”) ratings for South Africa are sound (140 countries):
Property rights: 24/140. Intellectual property protection: 24/140.
Democratic institutions South Africa has (arguably) sound democratic institutions (Parliament, universal suffrage, contested voting at regular general elections, majority rule, judicial system, IEC, etc) in place. The WEF/GCR 2015-16 (Pillar 1: “Institutions”) offers 3 ratings in this respect (140 countries) and they are sound:
Efficiency of legal framework in settling disputes: 14/140. Efficiency of legal framework in challenging regulations: 17/140.
Judicial independence: 24/140. According to the Freedom House “Freedom in the World 2015”91 rankings92 (195 countries and 15 territories; 1 = most free; 7 = least free) South Africa ranks (2015; same ranking applies since 2010): Freedom: 2/7 Freedom status: Free93. (1978: 5.5/7).
Political rights: 2/7 (1978: 5/7). Civil liberties: 2/7 (1978: 6/7).
The Economist Intelligence Unit ranks 167 countries / regions in terms of the state of democracy. It designates 4 categories:
Full democracies (rankings 1-24).
91 “Freedom House works to defend human rights and promote democratic change, with a focus on political rights and civil liberties. We act as a catalyst for freedom through a combination of analysis, advocacy, and action.” Online: https://freedomhouse.org/our-work. [Accessed 30.10.2015.] 92 According to the ranking, democracy consists of six dimensions (one political, five non-political), with different weights for the overall quality of democracy. Their weights are distributed accordingly: Politics (or the political system) 50%; gender (gender equality in socioeconomic and educational terms) 10%; economy (or the economic system) 10%; knowledge (knowledge society, research and education) 10%; health (or the health system and health status) 10%; and environment (environmental sustainability) 10%. 93 Freedom status either free, partly free, or not free.

40
Flawed democracies (rankings 25-76) (South Africa: 30/167). Hybrid regimes (rankings 77-115). Authoritarian regimes (rankings 116-167).
Separation of the state and the judiciary The media is replete with rhetorical examples of a poor situation in South Africa in this respect. This is not supported by WEF/GCR 2015-16 (Pillar 1: “Institutions”) ratings (140 countries):
Judicial independence: 24/140. Irregular payments and bribes: Obtaining favourable judicial decisions: 30/140.
Much still to be accomplished in government governance, including: Democratic institutions Although some aspects are acceptable as outline above, public trust of politicians is lacking. According to the WEF/GCR 2015-16 (Pillar 1: “Institutions”), South Africa’s rating is (140 countries):
Public trust in politicians: 98/140. This poor rating is a consequence of corruption by some MPs in the past, scandals (all evidence of mud sticking for a long time), ideological inclinations of some politicians, poorly-conceived government interventions (such as the 2015 visa-rule debacle – since softened), the perceived lack of worldliness of some MPs, maladministration in many facets of government, etc. Social services Although protests about service delivery occur from time to time (mainly a local government issue), government has made progress in the delivery of certain social services (with many positive outcomes), including94:
2002-2014: Households in formal dwellings: 8 million to 12.4 million. Share of households with access to electricity: 77% to 86%. 1990-2013: Access to improved: Water sources: 81% to 95%; Sanitation: 58%
to 74%.95 Social grants: Made a meaningful contribution to reducing extreme poverty and
severe malnutrition among children. Basic education: Universal access. Enrolments in early childhood development (5-year-olds now 87%) and post-
school education continue to expand. 2004-2014: Life expectancy: 52 years to 61 years. 2002-2014: Infant mortality: 58 to 34 deaths per 1000 live births.
94 National Treasury, 2015. 2015 Medium term budget policy statement speech. Online: http://www.treasury.gov.za/documents/mtbps/2015/mtbps/speech.pdf. [Accessed 28.10.2015.] 95 WHO data (referenced earlier).
41
Healthcare data were presented in the section: Factor of Production 3: Human capital: Health and economic growth: Notes on South Africa. There are positive human development changes in South Africa, but there is a long way to go. The United Nations Development Programme (UNDP) publishes the Human Development Index (HDI) rankings and its components (life expectancy at birth, mean years of schooling, expected years of schooling, and GNI per capita)96. There are four categories of rankings (187 countries) (HD = human development) (2013):
Very high HD (HDI rankings 1-49). High HD (HDI rankings 50-102). Medium HD (HDI rankings 103-144) [South Africa: 118/187 (2012: 119/187)]. Low HD (HDI rankings 145-187).
Corruption South Africa is signatory to many anti-corruption protocols, and has in place a number of laws and public institutions that are aimed at rooting out corruption.97,98 The list is impressive, but corruption persists in South Africa (and has increased in intensity in some cases). Corruption rankings: WEF/GCR 2015-16 (Pillar 1: “Institutions”) ratings (140 countries):
Diversion of public funds: 94/140. Irregular payments and bribes (IP&B): 50/140. IP&B: Imports and exports: 60/140. IP&B: Public utilities: 92/140. IP&B: Awarding of contracts and licenses: 96/140. IP&B: Obtaining favourable judicial decisions: 30/140.
Transparency International: “Corruption Perceptions Index” ranking (174 countries):
South Africa (2014): 67/174.99
96 UNDP, 2015. Human Development Reports. Online: http://hdr.undp.org/en/content/table-1-human-development-index-and-its-components. [Accessed 29.10.2015 97 SADC Protocol against Corruption (signed 2003); AU Convention on Preventing and Combating Corruption (signed 2004); UN Convention against Corruption (signed 2004); Public Service Ant-Corruption Strategy (Cabinet-approved 2002); Southern Africa Network on Corporate Governance of SOEs (a member); OECD Convention on Combating Bribery of Foreign Public Officials in International Business Transactions; Statutes in place: Prevention and Combating of Corrupt Activities Act, Financial Intelligence Centre Act, Protected Disclosures Act, Prevention of Organised Crimes Act, Public Finance Management Act, Municipal Finance Management Act, Criminal Procedure Act; Institutions in place: Anti-Corruption Task Team (an interdepartmental body, established in 2010), Directorate of Priority Crime Investigation, National Prosecuting Authority (NPA) (and its unit: Specialised Commercial Crimes Unit), The Public Protector (independent of government). 98 This section relies heavily on: OECD: Crane-Charef, M, 2015. Stocktaking of anticorruption and business integrity measures for southern African SOEs. OECD Corporate Governance Working Papers, Number 18. 99 South Africa’s peer group includes Kuwait, Brazil, Turkey, and Bulgaria.
42
Mo Ibrahim: “Index of African Governance” ranking100 (54 African countries):
South Africa (2014): 4/54.101 World Bank Worldwide Governance Indicators (WB/WGI) “Control of Corruption” ranking (215 countries) (percentile; 100 = highest control)102:
South Africa (2014): 54/100 (1996: 79/100) (a marked deterioration). NDP Vision 2030: “Our vision for 2030 is a South Africa that has zero tolerance for corruption. In 2030, South Africa will be a society in which citizens do not offer bribes and have the confidence and knowledge to hold public and private officials to account, and in which leaders have integrity and high ethical standards. Anticorruption agencies should have the resources, independence from political influence, and powers to investigate corruption, and their investigations should be acted upon.” Crime and police services There is no need to elaborate. South Africans are aware of the crime statistics and the problems in the police services. The WEF/GCR 2015-2016 (Pillar 1: “Institutions”) rates South Africa particularly poorly (140 countries):
Business costs of crime and violence: 131/140. Organized crime: 99/140.
Reliability of police services: 102/140. According to the WB/WGI indicator “Political Stability and Absence of Violence”103, South Africa ranks (215 countries) (percentile; 100 = highest rank): South Africa (2014): 43.20/100 (1996: 31.73/100). Rule of law
100 IIAG, 2015. Online: http://www.moibrahimfoundation.org/iiag/data-portal/. [Accessed 17.10.2015.] 101 Highest rankings: Mauritius: 1/54, Cabo Verde: 2/54, Botswana 3/54). Lowest ranking: Somalia: 54/54. 102 The World Bank annually publishes Worldwide Governance Indicators (WB/WGI), covering Voice and Accountability, Political Stability and Absence of Violence, Government Effectiveness, Regulatory Quality, Rule of Law, and Control of Corruption. The WB/WGI indicator “Control of Corruption”: “Reflects perceptions of the extent to which public power is exercised for private gain, including both petty and grand forms of corruption, as well as ‘capture’ of the state by elites and private interests”. 215 countries are ranked; the rankings are percentile ranks: Range from 0 (lowest) to 100 (highest) rank. World Bank Group, 2015. The Worldwide Governance Indicators. Online: http://info.worldbank.org/governance/wgi/index.aspx#home. Associated institutions: Natural Resource Governance Institute, the Brookings Institution. [Accessed 29.10.2015.] 103 Defined as “Political Stability and Absence of Violence / Terrorism measures perceptions of the likelihood of political instability and/or politically-motivated violence, including terrorism”.
43
According to the WB/WGI indicator “Rule of Law”104 South Africa ranks (215 countries / territories) (percentile; 100 = highest rank): South Africa (2014): 63.64/100 (1996: 50.24 /100). Education: See section on Factor of production: Human capital. Press freedom / general freedom According to the Reporters Without Borders World Press Freedom Index105, South Africa ranks (180 countries) (2015):
Press Freedom: 39/180 (2014:42/180).106 Freedom status: Satisfactory107. According to the WB/WGI indicator “Voice and Accountability”108 South Africa ranks (215 countries) (percentile; 100 = highest rank) (2014): South Africa: 68.47/100 (1996: 73.56/100). Freedom House “Freedom of the Press” rankings (199 countries / territories) (2015):
South Africa (percentile; 100 = lowest freedom): 37. South Africa: Rank (199 countries / territories): 71/199109. South Africa: Freedom status: Partly free110.
Freedom House “Freedom on the [Inter] Net” rankings (65 countries; 88% of world’s internet users) (2015): South Africa (percentile; 100 = lowest freedom): 27.
South Africa: Rank (65 countries): 15/65. South Africa: Freedom status: Free111.
104 Defined as: “Reflects perceptions of the extent to which agents have confidence in and abide by the rules of society, and in particular the quality of contract enforcement, property rights, the police, and the courts, as well as the likelihood of crime and violence.” 105 “The Reporters Without Borders World Press Freedom Index ranks the performance of 180 countries according to a range of criteria that include media pluralism and independence, respect for the safety and freedom of journalists, and the legislative, institutional and infrastructural environment in which the media operate.” Online: http://en.rsf.org/world-press-freedom-index-2015-12-02-2015,47573.html. [Accessed 19.10.2015.] 106 The top-ranked 5: Norway (1/180), Denmark, Netherlands, Sweden, ?? (5/180). The lowest ranked 5: Eritrea (180/180), North Korea, Turkmenistan, Syria, China (176/180). 107 Freedom status either good situation, satisfactory situation, noticeable problems, difficult situation, or very serious situation. 108 “Reflects perceptions of the extent to which a country's citizens are able to participate in selecting their government, as well as freedom of expression, freedom of association, and a free media”. 109 Top ranked are Norway and Sweden (10; 1/199), and worst ranked is North Korea (97; 199/199. 110 South Africa gets a “partly free” rating (out of “free”, “partly free”, or “not free”). 111 Top ranked are Iceland (6; 1/65) and Estonia (7; 2/65), and worst ranked is China (88; 65/65. South Africa gets a “free” rating (out of “free”, “partly free”, “not free”).
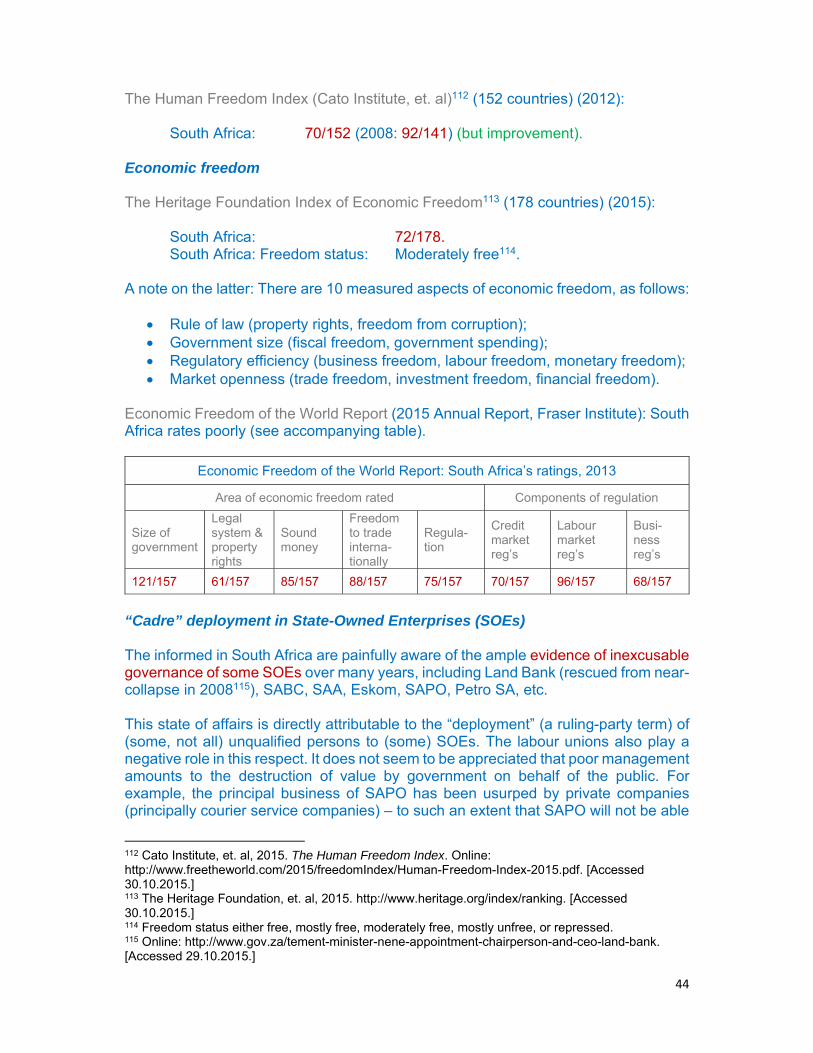
44
The Human Freedom Index (Cato Institute, et. al)112 (152 countries) (2012):
South Africa: 70/152 (2008: 92/141) (but improvement). Economic freedom The Heritage Foundation Index of Economic Freedom113 (178 countries) (2015):
South Africa: 72/178. South Africa: Freedom status: Moderately free114.
A note on the latter: There are 10 measured aspects of economic freedom, as follows:
Rule of law (property rights, freedom from corruption); Government size (fiscal freedom, government spending); Regulatory efficiency (business freedom, labour freedom, monetary freedom); Market openness (trade freedom, investment freedom, financial freedom).
Economic Freedom of the World Report (2015 Annual Report, Fraser Institute): South Africa rates poorly (see accompanying table).
Economic Freedom of the World Report: South Africa’s ratings, 2013
Area of economic freedom rated Components of regulation
Size of government
Legal system & property rights
Sound money
Freedom to trade interna-tionally
Regula-tion
Credit market reg’s
Labour market reg’s
Busi- ness reg’s
121/157 61/157 85/157 88/157 75/157 70/157 96/157 68/157
“Cadre” deployment in State-Owned Enterprises (SOEs) The informed in South Africa are painfully aware of the ample evidence of inexcusable governance of some SOEs over many years, including Land Bank (rescued from near-collapse in 2008115), SABC, SAA, Eskom, SAPO, Petro SA, etc. This state of affairs is directly attributable to the “deployment” (a ruling-party term) of (some, not all) unqualified persons to (some) SOEs. The labour unions also play a negative role in this respect. It does not seem to be appreciated that poor management amounts to the destruction of value by government on behalf of the public. For example, the principal business of SAPO has been usurped by private companies (principally courier service companies) – to such an extent that SAPO will not be able
112 Cato Institute, et. al, 2015. The Human Freedom Index. Online: http://www.freetheworld.com/2015/freedomIndex/Human-Freedom-Index-2015.pdf. [Accessed 30.10.2015.] 113 The Heritage Foundation, et. al, 2015. http://www.heritage.org/index/ranking. [Accessed 30.10.2015.] 114 Freedom status either free, mostly free, moderately free, mostly unfree, or repressed. 115 Online: http://www.gov.za/tement-minister-nene-appointment-chairperson-and-ceo-land-bank. [Accessed 29.10.2015.]
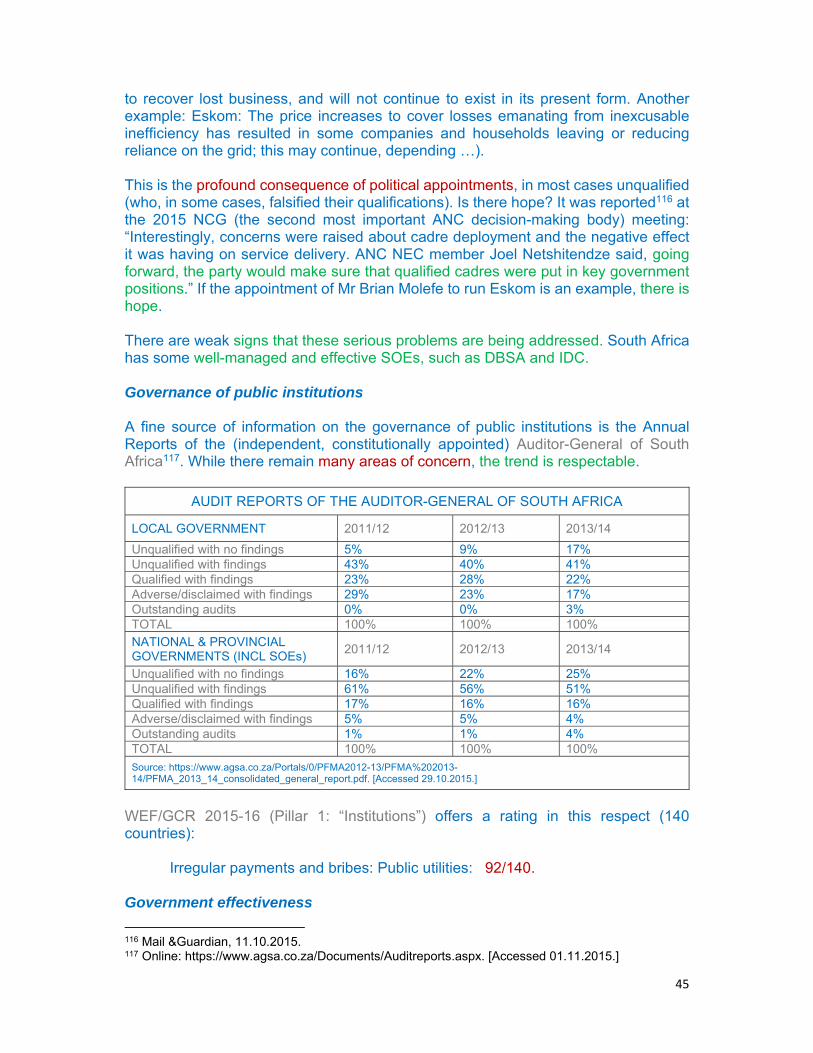
45
to recover lost business, and will not continue to exist in its present form. Another example: Eskom: The price increases to cover losses emanating from inexcusable inefficiency has resulted in some companies and households leaving or reducing reliance on the grid; this may continue, depending …). This is the profound consequence of political appointments, in most cases unqualified (who, in some cases, falsified their qualifications). Is there hope? It was reported116 at the 2015 NCG (the second most important ANC decision-making body) meeting: “Interestingly, concerns were raised about cadre deployment and the negative effect it was having on service delivery. ANC NEC member Joel Netshitendze said, going forward, the party would make sure that qualified cadres were put in key government positions.” If the appointment of Mr Brian Molefe to run Eskom is an example, there is hope. There are weak signs that these serious problems are being addressed. South Africa has some well-managed and effective SOEs, such as DBSA and IDC. Governance of public institutions A fine source of information on the governance of public institutions is the Annual Reports of the (independent, constitutionally appointed) Auditor-General of South Africa117. While there remain many areas of concern, the trend is respectable.
AUDIT REPORTS OF THE AUDITOR-GENERAL OF SOUTH AFRICA
LOCAL GOVERNMENT 2011/12 2012/13 2013/14
Unqualified with no findings 5% 9% 17% Unqualified with findings 43% 40% 41% Qualified with findings 23% 28% 22% Adverse/disclaimed with findings 29% 23% 17% Outstanding audits 0% 0% 3% TOTAL 100% 100% 100%
NATIONAL & PROVINCIAL GOVERNMENTS (INCL SOEs)
2011/12 2012/13 2013/14
Unqualified with no findings 16% 22% 25% Unqualified with findings 61% 56% 51% Qualified with findings 17% 16% 16% Adverse/disclaimed with findings 5% 5% 4% Outstanding audits 1% 1% 4% TOTAL 100% 100% 100%
Source: https://www.agsa.co.za/Portals/0/PFMA2012-13/PFMA%202013-14/PFMA_2013_14_consolidated_general_report.pdf. [Accessed 29.10.2015.]
WEF/GCR 2015-16 (Pillar 1: “Institutions”) offers a rating in this respect (140 countries):
Irregular payments and bribes: Public utilities: 92/140. Government effectiveness
116 Mail &Guardian, 11.10.2015. 117 Online: https://www.agsa.co.za/Documents/Auditreports.aspx. [Accessed 01.11.2015.]
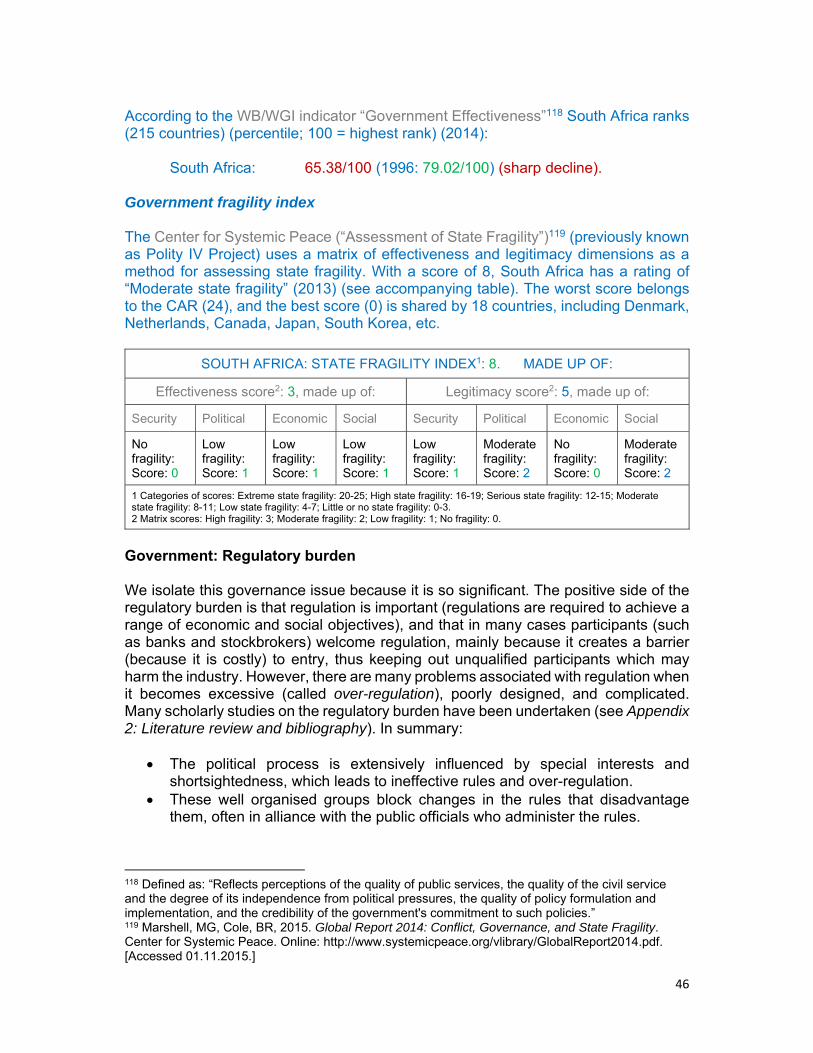
46
According to the WB/WGI indicator “Government Effectiveness”118 South Africa ranks (215 countries) (percentile; 100 = highest rank) (2014): South Africa: 65.38/100 (1996: 79.02/100) (sharp decline). Government fragility index The Center for Systemic Peace (“Assessment of State Fragility”)119 (previously known as Polity IV Project) uses a matrix of effectiveness and legitimacy dimensions as a method for assessing state fragility. With a score of 8, South Africa has a rating of “Moderate state fragility” (2013) (see accompanying table). The worst score belongs to the CAR (24), and the best score (0) is shared by 18 countries, including Denmark, Netherlands, Canada, Japan, South Korea, etc.
SOUTH AFRICA: STATE FRAGILITY INDEX1: 8. MADE UP OF:
Effectiveness score2: 3, made up of: Legitimacy score2: 5, made up of:
Security Political Economic Social Security Political Economic Social
No fragility: Score: 0
Low fragility: Score: 1
Low fragility: Score: 1
Low fragility: Score: 1
Low fragility: Score: 1
Moderate fragility: Score: 2
No fragility: Score: 0
Moderate fragility: Score: 2
1 Categories of scores: Extreme state fragility: 20-25; High state fragility: 16-19; Serious state fragility: 12-15; Moderate state fragility: 8-11; Low state fragility: 4-7; Little or no state fragility: 0-3. 2 Matrix scores: High fragility: 3; Moderate fragility: 2; Low fragility: 1; No fragility: 0.
Government: Regulatory burden We isolate this governance issue because it is so significant. The positive side of the regulatory burden is that regulation is important (regulations are required to achieve a range of economic and social objectives), and that in many cases participants (such as banks and stockbrokers) welcome regulation, mainly because it creates a barrier (because it is costly) to entry, thus keeping out unqualified participants which may harm the industry. However, there are many problems associated with regulation when it becomes excessive (called over-regulation), poorly designed, and complicated. Many scholarly studies on the regulatory burden have been undertaken (see Appendix 2: Literature review and bibliography). In summary:
The political process is extensively influenced by special interests and shortsightedness, which leads to ineffective rules and over-regulation.
These well organised groups block changes in the rules that disadvantage them, often in alliance with the public officials who administer the rules.
118 Defined as: “Reflects perceptions of the quality of public services, the quality of the civil service and the degree of its independence from political pressures, the quality of policy formulation and implementation, and the credibility of the government's commitment to such policies.” 119 Marshell, MG, Cole, BR, 2015. Global Report 2014: Conflict, Governance, and State Fragility. Center for Systemic Peace. Online: http://www.systemicpeace.org/vlibrary/GlobalReport2014.pdf. [Accessed 01.11.2015.]

47
While starting off as well-intended and motivated, government intervention in the markets creates distortions, which in turn motivates new interventions.
According to an OECD study (quoted by the below reference) there are four different kinds of costs associated with regulatory failures: Regulations that (1) protect companies from competition; (2) prevent companies from growing and exploiting new markets; (3) generate excessively high compliance costs for both companies and governmental actors; (4) contribute to companies becoming less capable of adapting to technological change or consumers’ needs. (1), (2), and (4) give rise to indirect dynamic effects that negatively affect companies’ entrance, investments and production dynamics, which is associated with poorer economic growth. 120 In respect of competition regulations: It will be obvious that when competition regulations are weak, or good but not enforced, companies’ continued existence is not threatened by unproductive practices. Under the pressure of competition, there is a risk of losing market share, which encourages the embracing of cost-efficient practices, including technological advances. Pro-competitive regulations contribute to economic growth because they promote innovation. NOTES ON SOUTH AFRICA According to the WEF/GCR ratings 2015-16 (Pillar 1: “Institutions”), South Africa is poorly rated in this regard (140 countries):
Burden of government regulation: 117/140. However, as seen above, this does not apply to anti-monopoly regulation (Pillar 8: “Goods Market Efficiency”) (140 countries):
Effectiveness of anti-monopoly policy: 13/140. According to WB/WGI indicator “Regulatory Quality”121 (185 countries) (percentile; 100 = highest rank) (2014): South Africa: 63.94/100 (1996: 62.75/100). Government: Economic policies Economic policies refers to government interventions in the wider macro-economy in the form of:
Fiscal policy Monetary policy.
120 All of the above in this section benefitted much from: Swedish Agency for Growth Policy Analysis, 2011. The economic effects of the regulatory burden – a theoretical and empirical analysis. Report 2010:14. Online: http://www.tillvaxtanalys.se/download/18.6288e13b13a4f43c5882b04/1352190193495/Report_2010_14.pdf. [Accessed 26.08.2015.] 121 “Reflects perceptions of the ability of the government to formulate and implement sound policies and regulations that permit and promote private sector development”.

48
Industrial policy. Labour market policy.
Fiscal policy The national budget is the principal instrument through which a government exercises its fiscal policy, and it has an allocative function, a distributive function, and a stabilisation function. In essence, the elements of fiscal policy are:
Revenue (R), raised from different forms of taxation: Personal income tax, general sales tax, value added tax, capital gains tax, corporate tax, customs and excise tax, inheritance tax, stamp duty, property transfer duty, etc. Each form of tax has a different economic outcome.
Expenditure (E) on: Law and order, infrastructure, education, welfare, military, subsidies, healthcare, pensions, interest on debt, unemployment benefits, public utilities, etc. The proportions of expenditure on each have different economic outcomes.
Budget deficit or surplus. A deficit is financed by the issue of government bonds and Treasury bills, and a surplus is used to reduce existing debt.
The main instruments of fiscal policy are changes in the:
Level and composition of taxation, Level of expenditure and proportions of expenditure in the various sectors, Size of the budget deficit or surplus, and Level and composition of government debt.
As said above, these changes have an allocative function, a distributive function, and a stabilisation function. The changes affect the distribution of income, the levels of savings and investments, aggregate demand, and therefore the level of economic activity. There are 3 fiscal policy stances (with variations because revenue is influenced by the state of the economy):
Neutral fiscal policy: E = R, and there is no budget deficit. Contractionary fiscal policy: E < R, and there is a budget surplus, used to
reduce government debt. Expansionary fiscal policy: E > R, leading to a budget deficit and an increase in
the level of government debt. This reflects the stabilisation function, engineered to increase aggregate demand during recessions.
The latter policy, ascribed to Keynesian economics, is a controversial one. Keynesians claim it increases aggregate demand during recessions, and its negative outcomes (higher debt and debt servicing) are reversed during upswing periods when revenue is higher. Detractors hold that a higher debt increases long-term rates, making interest payments higher in subsequent budgets, thereby negating the stimulus.

49
Detractors also hold that the additional debt incurred by government during recessions is generally not repaid during upswings. This view was vindicated after the 2007-2009 recession, when debt levels in some countries were not lowered, but increased further, leading eventually to unsustainable levels of well over 100% of GDP). “Unsustainable” means the country is approaching a debt trap, a condition where further debt is incurred to pay interest on debt, leading to higher debt, leading to higher interest payments, and so on, leading to slower growth and falling government revenue, and so on. The outcome is defaulting on debt, and the seeking of international assistance. There are volumes of literature on government debt, and scholars differ on whether incurring debt is a good stabilisation policy when the economy is in recession, or whether zero debt is virtuous irrespective of the state of the economy. Notes on South Africa National Treasury The National Treasury is one of the few government departments that enjoys the respect of economists and the informed general public. It is highly rated internationally in terms of the transparency of public finances. According to the Open Budget Index Survey of the International Budget Partnership122, South Africa was ranked in 2015 as follows (102 countries)123: Overall survey rating: 3/102. Ratings of sub-categories:
Budget transparency: Top 5/102. Public participation in the budget process: 6/102. Budget oversight:
By Legislature: Top 5/102. By Auditor: Top 5/102.
South Africa’s overall ratings in the past: 2006: 4/59; 2008: 2/85; 2010: 1/92; 2012: 2/98. In 2015 the countries with better ratings were New Zealand (1/102) and Sweden (2/102). Deficit and debt to GDP The accompanying charts speak for themselves. The ruling party after 1994 exhibited great fiscal rectitude. However, since the appointment of President Zuma, fiscal promiscuity has crept in; a potentially worse fiscal condition is held back only the country’s international credit rating being on the brink of “junk” status, an extremely serious situation. This status would not have prevailed had the growing deficits and debt levels (as a % of GDP) been associated with higher economic growth.
122 International Budget Partnership, 2015. Survey. Online: http://internationalbudget.org/opening-budgets/open-budget-initiative/open-budget-survey/. [Accessed 22.10.2015.] 123 Also consulted: National Treasury, 2015. MTBPS Speech. 21.10.2015. Online: http://www.treasury.gov.za/documents/mtbps/2015/. [Accessed 22.10.2015.]
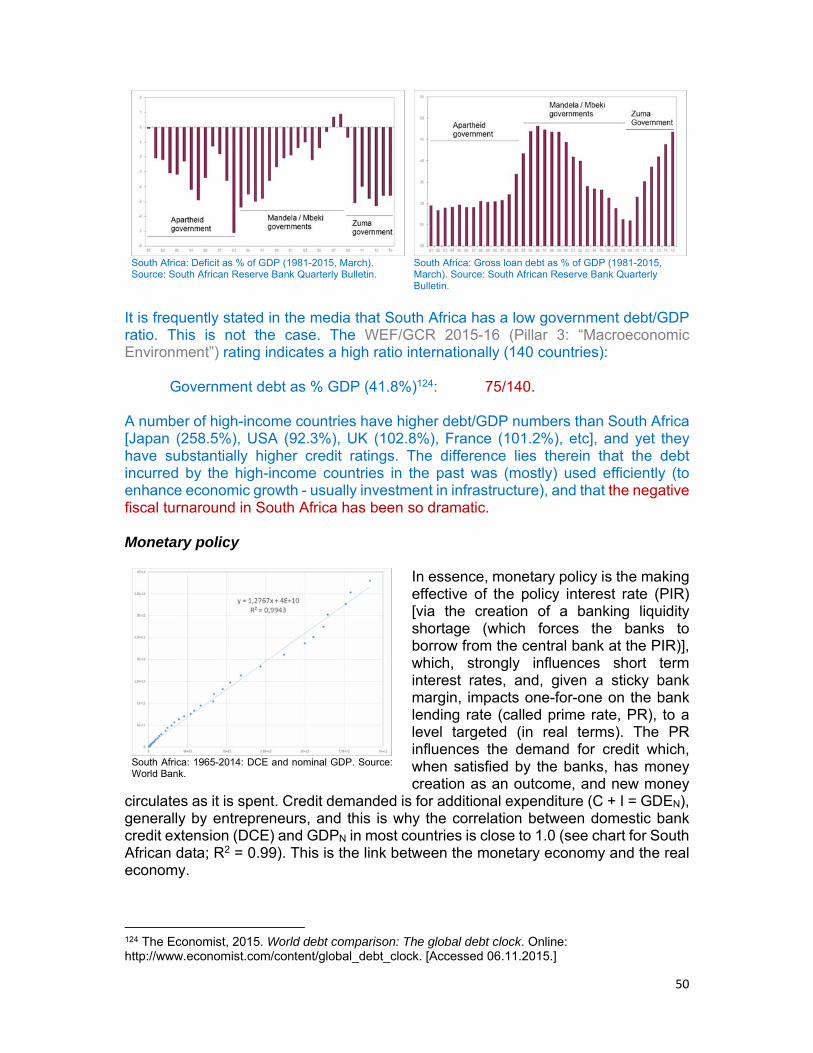
50
South Africa: Deficit as % of GDP (1981-2015, March). Source: South African Reserve Bank Quarterly Bulletin.
South Africa: Gross loan debt as % of GDP (1981-2015, March). Source: South African Reserve Bank Quarterly Bulletin.
It is frequently stated in the media that South Africa has a low government debt/GDP ratio. This is not the case. The WEF/GCR 2015-16 (Pillar 3: “Macroeconomic Environment”) rating indicates a high ratio internationally (140 countries):
Government debt as % GDP (41.8%)124: 75/140. A number of high-income countries have higher debt/GDP numbers than South Africa [Japan (258.5%), USA (92.3%), UK (102.8%), France (101.2%), etc], and yet they have substantially higher credit ratings. The difference lies therein that the debt incurred by the high-income countries in the past was (mostly) used efficiently (to enhance economic growth - usually investment in infrastructure), and that the negative fiscal turnaround in South Africa has been so dramatic. Monetary policy
In essence, monetary policy is the making effective of the policy interest rate (PIR) [via the creation of a banking liquidity shortage (which forces the banks to borrow from the central bank at the PIR)], which, strongly influences short term interest rates, and, given a sticky bank margin, impacts one-for-one on the bank lending rate (called prime rate, PR), to a level targeted (in real terms). The PR influences the demand for credit which, when satisfied by the banks, has money creation as an outcome, and new money
circulates as it is spent. Credit demanded is for additional expenditure (C + I = GDEN), generally by entrepreneurs, and this is why the correlation between domestic bank credit extension (DCE) and GDPN in most countries is close to 1.0 (see chart for South African data; R2 = 0.99). This is the link between the monetary economy and the real economy.
124 The Economist, 2015. World debt comparison: The global debt clock. Online: http://www.economist.com/content/global_debt_clock. [Accessed 06.11.2015.]
South Africa: 1965-2014: DCE and nominal GDP. Source: World Bank.

51
Monetary policy therefore is aimed at influencing additional demand to a level which is sustainable, i.e. at a growth rate level which has the least price effect (inflation). Thus, monetary policy is a critically important factor in economic growth. The existence of business cycles is evidence that monetary policy is not always conducted proficiently. In most of the developed world, the central bank, while a SOE (in most countries), is independent of the government, and monetary policy can then be used to neutralise fiscal policy excesses (in theory; in practice developed countries do not brook fiscal excesses). Where central bank independence is not in place, these countries are viewed with caution by foreign and local businesses and entrepreneurs, which impacts heavily on economic growth prospects. Notes on South Africa
South Africa has a record of appointment of fine central bankers, some of whom have won awards for their work. The 3-6% inflation target set by government has largely been successfully achieved. However, this is not good enough in a world where South Africa’s trading partners have inflation targets of 2%, and inflation outcomes of close to 0%. South Africa should be bold and play in the big league. It is a well-established economic fact that,
in the long-term, a country’s exchange rate is the outcome of its inflation differential with its trading partners. The accompanying chart is a proxy125 but, with a R2 of 0.86, is strong evidence. The expectation of a declining exchange rate has major economic implications. Industrial policy Industrial policy is the central government’s implementation of measures to positively influence the development of, and growth in, the manufacturing sector. The measures of industrial policy include import tariffs, incentives, subsidisation, creation (in developing countries) of infrastructural-type industries such as rail transport, telecommunications, energy-delivery, etc. Industrial policy often overlaps with other government interventions, such as fiscal policy, competition policy, and trade policy. It plays a role in economic growth, predominantly positively but sometimes negatively. Notes on South Africa
125 Cumulative inflation differential between South Africa and the USA, and the USD/ZAR exchange rate.
South Africa: Correlation: Inflation differential & exchange rate. Source: World Bank.
52
The Department of Trade and Industry 126 has been pro-active in endeavours to expand industrial capacity and employment. It offers 2 groups of incentives: Trade, Export and Investment Financial Assistance (Incentives), including:
Automotive Investment Scheme. 12I Tax Allowance Incentive. Capital Projects Feasibility Programme. Critical Infrastructure Programme. Export Marketing and Investment Assistance. Film Incentives. Manufacturing Investment Programme.
Industrial Development Financial Assistance (Incentives), including:
Aquaculture Development and Enhancement Programme. Business Process Services. Capital Projects Feasibility Programme. Clothing and Textile Competitiveness Improvement Programme. Cluster Development Programme. Sector Specific Assistance Scheme. Support Programme for Industrial Innovation. Manufacturing Competitiveness Enhancement Programme.
Labour market policy There are many issues embodied in employment and labour market policy. The principal ones are:
Employment: Contract of employment, job security, keeping of records, probationary period, termination of employment, retrenchment, temporary contract employment, casual workers, use of labour brokers’ services, employment of persons under 18, compensation for length of service, transfers (as in the case of bank managers).
Remuneration: Salaries, wages, remuneration incentives, minimum wage, vacation pay, overtime payment, deductions, payment intervals, compensation / insurance for accident victims.
Benefits: Retirement fund, health insurance, unemployment insurance. Work hours: Hours per workday, overtime, meal breaks. Leave: Annual vacation, public holidays, weekly day/s of rest, sick leave,
maternity / paternity leave, reservists’ leave. Working conditions: Safety and health issues, uniforms, special clothing. Labour industrial action: Dispute resolving, strikes. Discrimination, affirmative action, sexual harassment. Voluntary work.
126 Department of Trade and Industry, 2015. Online: https://www.thedti.gov.za/default.jsp. [Accessed 07.11.2015.]
53
These are also the principal issues covered by labour market legislation, which is a reflection of labour market policy (LMP). Ideally, LMP is aimed at engendering fairness in the labour market, for employee and for employer, and minimising labour industrial action, in the interests of economic growth and employment. However, this is not always the case. A central issue in LMP is labour market rigidity (seen negatively) or labour market flexibility (seen positively). The demand for labour is a function of the state of the economy, and labour market flexibility can be seen as the capacity of the labour market to respond to changes in economic conditions. The OECD 127 distinguishes four broad aspects of labour market flexibility:
Real labour cost flexibility at the economy-wide level. Adaptability of relative labour costs across occupations and enterprises. Labour mobility. Flexibility of working time and work schedules.
There is voluminous research on LMP. Some views (see detail in Appendix 2: Literature review and bibliography):
LMP should not be based on protection of labour from market-driven forces, but on protection within the market-oriented environment.
Economic growth is not greatly influenced by minimum wages and mandatory benefits.
The relative size of organised labour (in government and the private sector) is a crucial negative factor.
The initiatives of entrepreneurs should be encouraged by LMP. Innovation implies an elastic labour force. This is possible with less statutory job protection.
LMP should promote job creation and employment and smooth the transition of workers between jobs.
Tight regulations on dismissing employees, and high taxes on employment to finance generous social security benefits, deter companies from employing new people.
Notes on South Africa According to the WEF/GCR 2015-16 (Pillar 7: “Labour Market Efficiency”), South Africa has the lowest possible / close-to-lowest ratings (140 countries):
Cooperation in labour-employer relations: 140/140. Flexibility of wage determination: 137/140. Hiring and firing practices: 138/140. The International Monetary Fund reported in 2015: “Besides infrastructure, increasing competition in many sectors, improving industrial relations, reducing labor market rigidities, and addressing skill mismatches remain key to reduce unemployments [sic].
127 OECD (Friedrich Klau and Axe Mittelstadt), no date. Labour market flexibility. Growth Studies Division of the OECD Economics and Statistics Department. Online: http://www.oecd.org/eco/growth/35558438.pdf [Accessed 09.09.2015.]
54
This can make a difference for the outsiders in this economy: The unemployed and small firms.”128 However, in respect of the following, the ratings are fair:
Redundancy costs, weeks of salary: 29/140. Effect of taxation on incentives to work: 30/140. A note on the Tripartite Alliance: The Tripartite Alliance of the ANC, labour (COSATU) and the SACP is iniquitous. The ruling party’s pandering to the labour unions has resulted in the above-shown abysmal ratings. The ruling party’s pandering to the SACP results in unfortunate utterances [which impacts negatively on the Economic psyche of the nation (see later)]. It is unfathomable that the ruling party accommodates the demands of labour unions so readily. Given the sorry state of schooling, the strength of some labour unions in education is particularly concerning. The South African Democratic Teachers Union (SADTU) has interfered with teacher evaluation, teacher appointments, and teacher promotion. The extent of interference is reflected in the extremely poor education ratings referred to above. Government: Attitude towards business Governments may or may not actively encourage business (and entrepreneurial activity). It is a significant issue, and there is much research on its importance. A general view is that “… business-friendly economic policies … are the key determinant of the level of income per capita. We find that a country’s [World Bank] Doing Business rank … to be a key explanatory variable for economic growth.”129 According to the World Bank: “The Doing Business project provides objective measures of business regulations and their enforcement across 189 economies and selected cities at the subnational and regional level … [it] looks at domestic small and medium-size companies and measures the regulations applying to them through their life cycle.”130 The World Bank provides country (189 countries / territories) rankings according to 10 “topics”, each consisting of several indicators: Starting a business, dealing with construction permits, getting electricity, registering property, getting credit, protecting minority investors, paying taxes, trading across borders, enforcing contracts, and resolving insolvency. The top 5 ranked countries in 2014 were: Singapore (1/189), New Zealand (2/189), Hong Kong (Special Administration Region, China) (3/189) (mainland China was ranked 90/189), Denmark (4/189), South Korea (5/189); while the worst rated were African countries: Chad (185/189), South Sudan (186/189), CAR
(187/189), Libya (188/189), Eritrea (189/189).131
128 International Monetary Fund, 2015. Reflections on South Africa’s challenges and opportunities for reform. Remarks by David Lipton, First Deputy Managing Director, International Monetary Fund at the University of Cape Town, Cape Town, 5 March. 129 Gillanders, R, Whelan, K, 2010. Open for business? Institutions, business environment and economic development. Working paper. University College Dublin. December. Online: http://www.karlwhelan.com/Papers/gillanderswhelan.pdf. [Accessed 26.08.2015.] 130 Online: http://www.doingbusiness.org/about-us. [Accessed 27.08.2015.] 131 World Bank, 2015. Doing Business 2015. Online: http://www.doingbusiness.org/~/media/GIAWB/Doing%20Business/Documents/Annual-Reports/English/DB15-Chapters/DB15-Report-Overview.pdf. [Accessed 01.11.2015.]

55
In addition, the WEF/GCR provides rankings in respect of certain indicators of government attitude towards business (see below). In addition to the indicators, the WEF undertakes a separate survey on The Most Problematic Factors for Doing Business for each of the 140 countries. Notes on South Africa World Bank: “Doing Business” 2014132 ranking for South Africa: 43/189. WEF/GCR 2015-16 (Pillar 6: “Goods Market Efficiency”)133 rankings for South Africa in respect of (140 countries):
Number of procedures to start a business: 38/140. Number of days to start a business: 94/140. Agricultural policy costs: 73/140.
Business impact of rules on FDI: 99/140. Burden of customs procedures: 71/140.
WEF/GCR 20015-16: “The Most Problematic Factors for Doing Business” factors and scores134 for South Africa are shown in the accompanying chart.
Many of the above-shown rankings and scores are poor, which, once again, points to the burden to business which the South African government represents. Encouragement of business, supported by efficacious government infrastructure, is
132 World Bank Group, 2015. Doing Business: Measuring Business Regulations. Online: http://www.doingbusiness.org/rankings. [Accessed 21.10.2015.] 133 World Economic Forum, 2015. Global Competitiveness Report 2015-16. Online: http://www3.weforum.org/docs/gcr/2015-2016/ZAF.pdf. [Accessed 21.10.2015.] 134 WEF: “From the list of factors, respondents were asked to select the five most problematic for doing business in their country and to rank them between 1 (most problematic) and 5. The score corresponds to the responses weighted according to their rankings.”
0 2 4 6 8 10 12 14 16 18 20
Government instability/coups
Poor public health
Inflation
Complexity of tax regulations
Foreign currency regulations
Tax rates
Insufficient capacity to innovate
Access to financing
Poor work ethic in labour force
Corruption
Crime and theft
Inadequately educated workforce
Policy instability
Inadequate supply of infrastructure
Inefficient government bureaucracy
Restrictive labour regulations

56
the norm in high-income countries. Is there a silver lining? Yes, a sliver at this stage. With political will, substantial improvements are possible – from a low base. Corporate sector: Corporate governance The foregoing in this main section on the general business environment covered government governance and policy issues. We now shift attention to the corporate sector (private companies, partnerships, small unincorporated businesses, one-wo/man enterprises, etc). It is axiomatic that the corporate sector generates economic growth and employment, and provides the revenue income for government (directly and via employees) to provide collective services. The corporate sector (and to a lesser extent the household sector) is also the principal player in the bank credit extension / money creation (which is related to entrepreneurial activity and economic growth) story. The government sector is (or should be) a small participant in this regard. There is plentiful scholarly output on the relationship between corporate governance and economic growth, especially over the past decade. Corporate governance (at company level) can be defined as rules guiding the135:
Actual behaviour of the company, in terms of performance (financial situation), efficiency, growth, financial structure, disclosure, transparency, etc.
Effectiveness of the board of directors in terms of the above, the monitoring of management, and its accountability to stakeholders.
Role of executive compensation in determining company performance. Relationship with employees via labour policies. Relationship with other stakeholders (shareholders, bondholders, etc).
Stakeholder protection (by the board) is a significant issue, as it encourages investment and the development of the financial markets, and, ultimately, economic growth.136
The corporate sector of many countries regard corporate governance as being so significant that they have a Code of Corporate Governance, to which companies subscribe voluntarily. South Africa (highly rated in terms of corporate governance by the WEF/GCR – see below), for example, has King Code III, which covers:
Ethical leadership and corporate citizenship. Boards and directors. Audit committees. The governance of risk. The governance of information technology. Compliance with laws, rules, codes and standards. Internal audit. Governing stakeholder relationships.
135 This section benefitted much from Claessens, S, 2003. Corporate governance and development. Washington: International Bank for Reconstruction and Development. 136 See Paredes, TA, 2005. Corporate governance and economic development. Online: http://object.cato.org/sites/cato.org/files/serials/files/regulation/2012/8/v28n1-6.pdf. [Accessed 10.09.2015.]

57
Integrated reporting and disclosure. Corporate governance does not take place in a vacuum; it takes place in the broader environment of government governance. If the latter is not empathetic with business, corporate governance is of limited effectiveness. An IBRD137 study informs in this regard: “There is … evidence that when a country’s overall … governance and property rights system are weak, voluntary and market corporate governance mechanisms have limited effectiveness.” A number of channels through which sound corporate governance influences economic growth and employment have been identified138:
Increased access to external financing by a company, which could lead to greater physical capital investment.
Higher valuation of the company, leading to the lowering of the cost of capital. Improved operational performance through the more efficient allocation of
resources. Companies with good corporate governance are better able to withstand the
risks that are inherent in recessions and financial crises. Good corporate governance is associated with healthier relationships with
stakeholders, especially human capital resources, leading to higher productivity and less industrial action.
Notes on South Africa Corporate governance in South Africa is sound. The WEF/GCR 2015-16 (Pillar 1: “Institutions”) corporate governance-related rankings (140 countries):
Strength of auditing and reporting standards: 1/140. Efficacy of corporate boards: 3/140. Protection of minority shareholders’ interests: 3/140. Strength of investor protection: 14/140.
To be first in the world in terms of strength of auditing and reporting standards, and up with the best in the other categories, are major achievements. These rankings contrast markedly with the government’s particularly poor governance rankings outlined earlier. Does this mean there is no corruption in the private sector? No, there is, but it is not pervasive. The WEF/GCR 2015-16 (Pillar 1: “Institutions”) ranking in this respect is (140 countries):
Ethical behaviour of firms: 38/140. Irregular payments and bribes: Annual tax payments: 39/140.
137 Claessens, S, 2003. Corporate governance and development. Washington: International Bank for Reconstruction and Development. 138 This section benefitted much from Claessens, S, 2003. Corporate governance and development. Washington: International Bank for Reconstruction and Development.
58
A final word: It should be kept in mind that government has the tools to govern the private sector (laws, regulations, etc), and that South Africa has a relatively free media that is ever-vigilant in this respect. However, the private sector cannot control corruption in the government sector (except to the extent that the private sector offers financial encouragement). Economic psyche of the nation All of the above (plus other stimuli, such as serious conflict and violent crime) coalesce into what can be called the economic psyche of the nation. At its centre is uncertainty about the future. Uncertainty is a component of risk, and the level of perceived risk impacts on investment in physical capital (entrepreneurial activity), the level of consumption, and exports and imports (i.e. the components of GDP), and therefore GDPRpc. The finest gauge of the economic psyche of the nation is the WEF/GCR index rankings. The WEF’s report “… assesses the competitiveness landscape of 140 economies, providing insight into the drivers of their productivity and prosperity.”139 It is based on 12 pillars:
A. Basic requirements: 1. Institutions. 2. Infrastructure. 3. Macroeconomic environment. 4. Health and primary education.
B. Efficiency enhancers: 5. Higher education and training. 6. Goods market efficiency. 7. Labour market efficiency. 8. Financial market development. 9. Technological readiness. 10. Market size.
C. Sophistication factors: 11. Business sophistication. 12. Innovation.
The top-ranked 5 countries are Switzerland (1/140), Singapore, United States, Germany, Netherlands (5/140); and the bottom 5 are: Guinea (140/140), Chad, Mauritania, Sierra Leone, Burundi (136/140). There are other indicators that partly reflect the economic psyche of the nation, such as the business confidence index, the purchasing managers’ index, the consumer confidence index, the capacity utilisation index, the leading economic indicator, changes in the cash holdings of companies, etc. Some countries publish an Economic Policy Uncertainty Index.140
139 World Economic Forum, 2015. The Global Competitiveness Report 2015-2016. Online: http://reports.weforum.org/global-competitiveness-report-2015-2016/. [Accessed 20.10.2015.] 140 Federal Reserve Bank of St Louis. Online: https://www.stlouisfed.org/Publications/Regional-Economist/April-2013/Uncertainty-and-the-Economy. [Accessed 08.10.2015.]

59
There is another little-known indicator which arises from patent (an indicator of innovation activity) research, in particular relating to innovator migration. The accompanying table shows the shares of immigrant and emigrant inventors by income group and region for the period 2006-2010.
Shares (%) of immigrant and emigrant inventors by income group (2006-2010) Source: World Intellectual Property Organization
High income Upper middle-income
Lower middle-income
Lower income
Total
Immigrant inventors 97.2% 2.4% 0.3% 0.1% 100% Emigrant inventors 57.7% 26.8% 14.9% 0.6% 100%
Shares (%) of immigrant and emigrant inventors by region (2006-2010) Source: World Intellectual Property Organization
Asia North America
Europe Latin America & the Caribbean
Oceania Africa Total
Immigrant inventors 7.5% 59.1% 31.4% 0.3% 1.5% 0.1% 100%Emigrant inventors 41.9% 9.7% 41.9% 2.7% 2.1% 1.7% 100%Online: http://www.wipo.int/edocs/pubdocs/en/intproperty/941/wipo_pub_941_2013.pdf. [Accessed 16.10.2015.]
The data points to unsurprising inferences141:
North America and Europe accounted for the highest concentration of immigrant inventors in high-income economies: 90.5% (59.1% + 31.4%). [The largest proportion of out-migration of inventors also occurred in high-income countries. This could reflect inter-high-income-country movements (for example, from Europe to North America and vice versa.)]
The principal source of the entrepreneurs / inventors is non-high-income countries.
What is the significance of this? It is simply that entrepreneurs / innovators are mobile and take their skills / inventions to high-income countries. Economic growth in the receiving countries is further advanced, while the sending countries are denied the benefits. The economic psyche of countries, which is the territory largely influenced by governments, is the principal factor in this respect. Notes on South Africa Despite South Africa’s many problems, principally brought about by the past and present governments, it does not rank too poorly (considering that the world hosts 196 countries). According to the WEF/GCR 2015-2016, South Africa’s overall ranking is (140 countries):
South Africa: 49/140142 (2014: 56/144) (Improvement notable). In terms of the 12 pillars, South Africa’s rankings are:
141 WIPO, 2015. Online: http://www.wipo.int/edocs/pubdocs/en/intproperty/941/wipo_pub_941_2013.pdf. [Accessed 16.10.2015.] 142 South Africa’s immediate peers: Mauritius (46/140), Philippines (47/140), Malta (48/140), Panama (50/140), Turkey (51/140), Costa Rica (52/140).

60
A. Basic requirements:
1. Institutions: 38/140. 2. Infrastructure: 68/140. 3. Macroeconomic environment: 85/140. 4. Health and primary education: 126/140.
B. Efficiency enhancers: 5. Higher education and training: 83/140. 6. Goods market efficiency: 38/140. 7. Labour market efficiency: 107/140. 8. Financial market development: 12/140. 9. Technological readiness: 50/140. 10. Market size: 29/140.
C. Sophistication factors: 11. Business sophistication: 33/140. 12. Innovation: 38/140.
However, if one focusses on the indicators for which government is responsible (i.e. excludes the indicators for which the private sector are responsible) then South Africa’s ratings are poor by international standards, as indicated earlier in the text. As regards that last point mentioned in the text, innovator migration: The loss of entrepreneurs / innovators to South Africa has been ongoing for decades, under the Nationalist and ANC governments, and there are many examples. Other factors contribute, principally the unacceptable levels of crime and violence. A final word. The economic psyche of the nation is influenced also by the utterances of government, and there are many examples of astoundingly unfortunate ones (a Google search will substantiate this statement). One of the most unfortunate is the utterance of the President at the ANC’s October 2015 Progressive Business Forum dinner: “I always say to business people that if you invest in the ANC, you are wise. If you don’t invest in the ANC, your business is in danger.”143 GEOPHYSICAL FACTORS It may seem odd to include this factor, which comprises climate, rainfall, quantity of fresh water resources, soil quality, and so on. However, it plays a major role in developing countries with agricultural-based economies. Generally, developed countries have moved on from climate-sensitive agriculture into climate-insensitive manufacturing and services. ROLE OF DOMESTIC CREDIT / DEPOSIT-MONEY CREATION IN ECONOMIC GROWTH In a nutshell (for a detailed analysis see: http://bookboon.com/en/money-creation-an-introduction-ebook) we offer that: (1) there is no such things as exogenous money, money “supply”, and money “demand”; (2) banks extend credit, when they satisfy a demand for it (it is actually “a request with cap in hand and much data”, but is called “demand for credit” in Economics), and its outcome is the creation new bank deposits
143 Mail & Guardian, 09.10.2015.
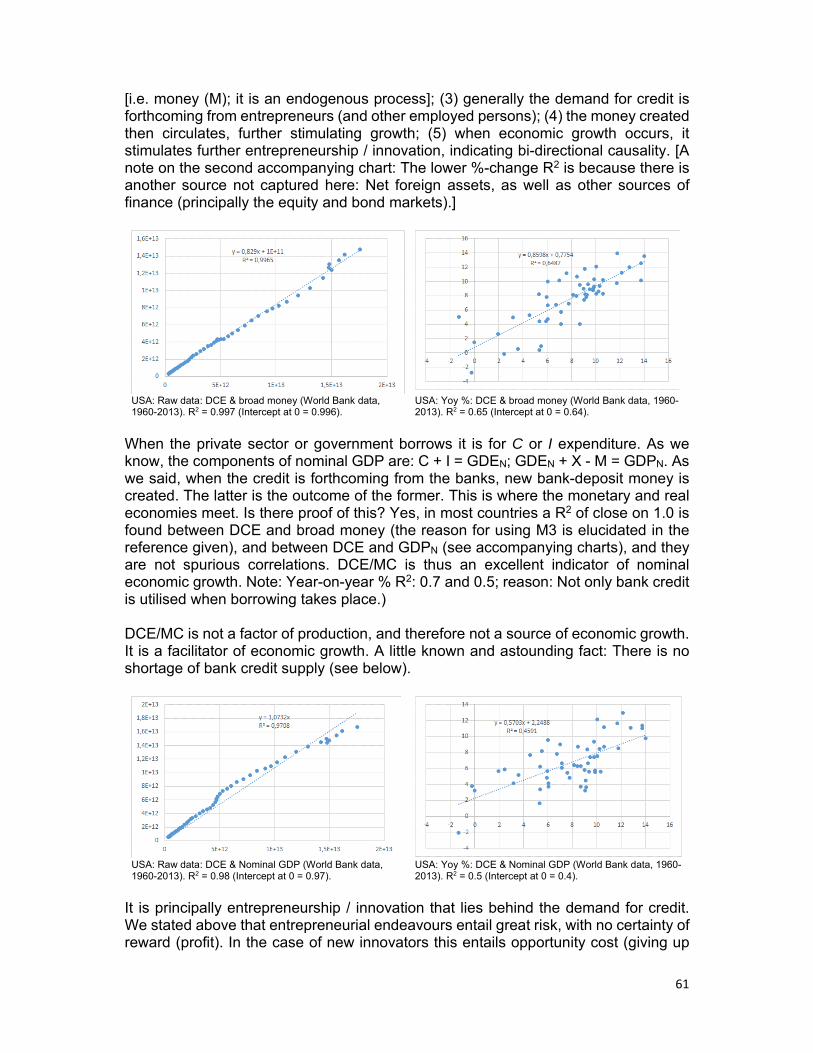
61
[i.e. money (M); it is an endogenous process]; (3) generally the demand for credit is forthcoming from entrepreneurs (and other employed persons); (4) the money created then circulates, further stimulating growth; (5) when economic growth occurs, it stimulates further entrepreneurship / innovation, indicating bi-directional causality. [A note on the second accompanying chart: The lower %-change R2 is because there is another source not captured here: Net foreign assets, as well as other sources of finance (principally the equity and bond markets).]
When the private sector or government borrows it is for C or I expenditure. As we know, the components of nominal GDP are: C + I = GDEN; GDEN + X - M = GDPN. As we said, when the credit is forthcoming from the banks, new bank-deposit money is created. The latter is the outcome of the former. This is where the monetary and real economies meet. Is there proof of this? Yes, in most countries a R2 of close on 1.0 is found between DCE and broad money (the reason for using M3 is elucidated in the reference given), and between DCE and GDPN (see accompanying charts), and they are not spurious correlations. DCE/MC is thus an excellent indicator of nominal economic growth. Note: Year-on-year % R2: 0.7 and 0.5; reason: Not only bank credit is utilised when borrowing takes place.) DCE/MC is not a factor of production, and therefore not a source of economic growth. It is a facilitator of economic growth. A little known and astounding fact: There is no shortage of bank credit supply (see below).
It is principally entrepreneurship / innovation that lies behind the demand for credit. We stated above that entrepreneurial endeavours entail great risk, with no certainty of reward (profit). In the case of new innovators this entails opportunity cost (giving up
USA: Raw data: DCE & broad money (World Bank data, 1960-2013). R2 = 0.997 (Intercept at 0 = 0.996).
USA: Yoy %: DCE & broad money (World Bank data, 1960-2013). R2 = 0.65 (Intercept at 0 = 0.64).
USA: Raw data: DCE & Nominal GDP (World Bank data, 1960-2013). R2 = 0.98 (Intercept at 0 = 0.97).
USA: Yoy %: DCE & Nominal GDP (World Bank data, 1960-2013). R2 = 0.5 (Intercept at 0 = 0.4).
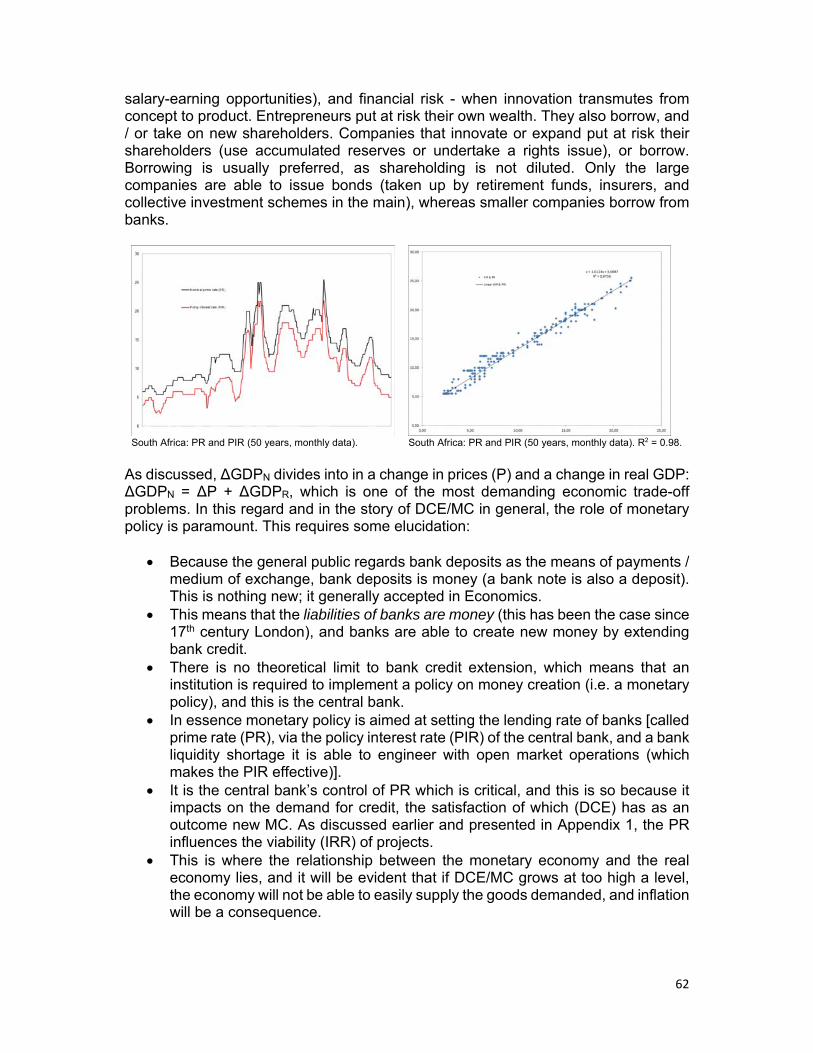
62
salary-earning opportunities), and financial risk - when innovation transmutes from concept to product. Entrepreneurs put at risk their own wealth. They also borrow, and / or take on new shareholders. Companies that innovate or expand put at risk their shareholders (use accumulated reserves or undertake a rights issue), or borrow. Borrowing is usually preferred, as shareholding is not diluted. Only the large companies are able to issue bonds (taken up by retirement funds, insurers, and collective investment schemes in the main), whereas smaller companies borrow from banks.
South Africa: PR and PIR (50 years, monthly data). South Africa: PR and PIR (50 years, monthly data). R2 = 0.98.
As discussed, ΔGDPN divides into in a change in prices (P) and a change in real GDP: ΔGDPN = ΔP + ΔGDPR, which is one of the most demanding economic trade-off problems. In this regard and in the story of DCE/MC in general, the role of monetary policy is paramount. This requires some elucidation:
Because the general public regards bank deposits as the means of payments / medium of exchange, bank deposits is money (a bank note is also a deposit). This is nothing new; it generally accepted in Economics.
This means that the liabilities of banks are money (this has been the case since 17th century London), and banks are able to create new money by extending bank credit.
There is no theoretical limit to bank credit extension, which means that an institution is required to implement a policy on money creation (i.e. a monetary policy), and this is the central bank.
In essence monetary policy is aimed at setting the lending rate of banks [called prime rate (PR), via the policy interest rate (PIR) of the central bank, and a bank liquidity shortage it is able to engineer with open market operations (which makes the PIR effective)].
It is the central bank’s control of PR which is critical, and this is so because it impacts on the demand for credit, the satisfaction of which (DCE) has as an outcome new MC. As discussed earlier and presented in Appendix 1, the PR influences the viability (IRR) of projects.
This is where the relationship between the monetary economy and the real economy lies, and it will be evident that if DCE/MC grows at too high a level, the economy will not be able to easily supply the goods demanded, and inflation will be a consequence.
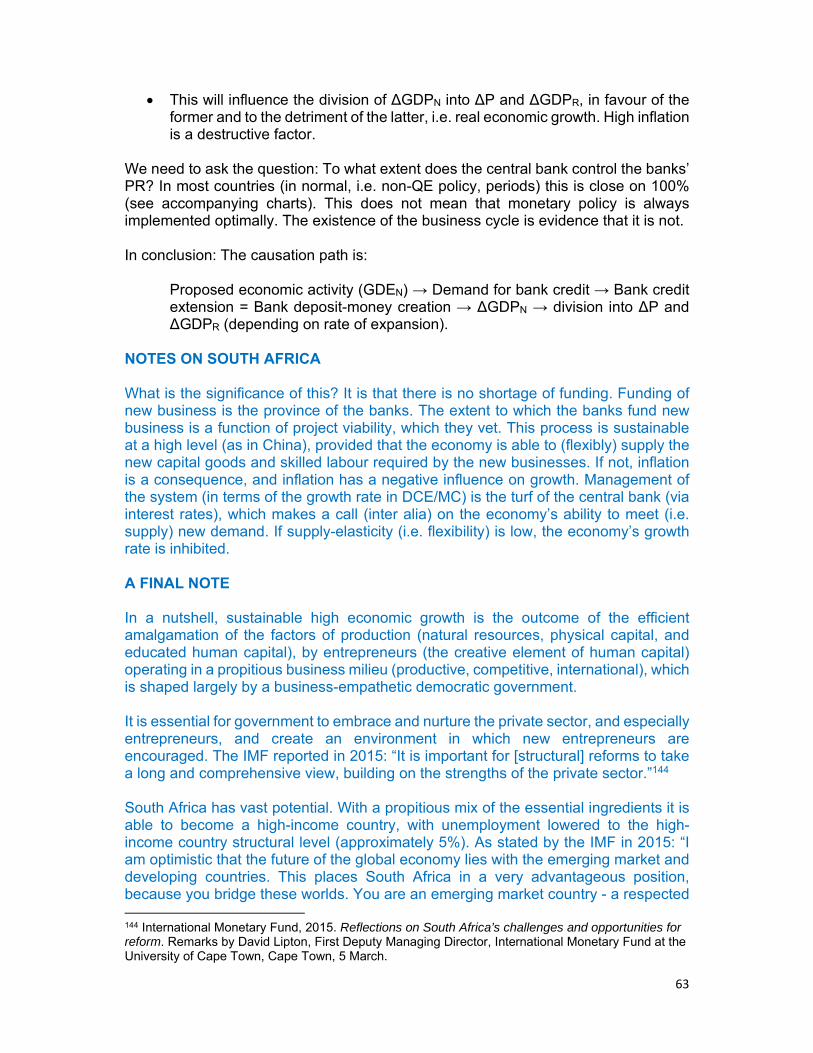
63
This will influence the division of ΔGDPN into ΔP and ΔGDPR, in favour of the former and to the detriment of the latter, i.e. real economic growth. High inflation is a destructive factor.
We need to ask the question: To what extent does the central bank control the banks’ PR? In most countries (in normal, i.e. non-QE policy, periods) this is close on 100% (see accompanying charts). This does not mean that monetary policy is always implemented optimally. The existence of the business cycle is evidence that it is not. In conclusion: The causation path is:
Proposed economic activity (GDEN) → Demand for bank credit → Bank credit extension = Bank deposit-money creation → ΔGDPN → division into ΔP and ΔGDPR (depending on rate of expansion).
NOTES ON SOUTH AFRICA What is the significance of this? It is that there is no shortage of funding. Funding of new business is the province of the banks. The extent to which the banks fund new business is a function of project viability, which they vet. This process is sustainable at a high level (as in China), provided that the economy is able to (flexibly) supply the new capital goods and skilled labour required by the new businesses. If not, inflation is a consequence, and inflation has a negative influence on growth. Management of the system (in terms of the growth rate in DCE/MC) is the turf of the central bank (via interest rates), which makes a call (inter alia) on the economy’s ability to meet (i.e. supply) new demand. If supply-elasticity (i.e. flexibility) is low, the economy’s growth rate is inhibited. A FINAL NOTE In a nutshell, sustainable high economic growth is the outcome of the efficient amalgamation of the factors of production (natural resources, physical capital, and educated human capital), by entrepreneurs (the creative element of human capital) operating in a propitious business milieu (productive, competitive, international), which is shaped largely by a business-empathetic democratic government. It is essential for government to embrace and nurture the private sector, and especially entrepreneurs, and create an environment in which new entrepreneurs are encouraged. The IMF reported in 2015: “It is important for [structural] reforms to take a long and comprehensive view, building on the strengths of the private sector.”144 South Africa has vast potential. With a propitious mix of the essential ingredients it is able to become a high-income country, with unemployment lowered to the high-income country structural level (approximately 5%). As stated by the IMF in 2015: “I am optimistic that the future of the global economy lies with the emerging market and developing countries. This places South Africa in a very advantageous position, because you bridge these worlds. You are an emerging market country - a respected 144 International Monetary Fund, 2015. Reflections on South Africa’s challenges and opportunities for reform. Remarks by David Lipton, First Deputy Managing Director, International Monetary Fund at the University of Cape Town, Cape Town, 5 March.

64
member of the G-20. But so much more needs to be done to emerge on the world stage as a source of growth and prosperity in a time of great hope for Africa. The challenge for South Africa is to position itself to take advantage of this bright future.”145 APPENDIX 1: INTERNAL RATE OF RETURN AND PROJECT VIABILITY The bank borrowing interest rate (influenced 100% by monetary policy; see earlier) and the bond interest rate [= 1-day risk-free rate (influenced 100% by monetary policy) + risk premium (for relevant period) + expectations146] are critical factors as they influence the Internal Rate of Return (IRR) of projects. The IRR is the discount rate which makes the net present value (NPV) of a project = 0 (this will become clear as we proceed with an example): If a company decides to fund a new project which has a lifespan of 5 years by the issue of 5-year bonds (projects have a lifespan of 10-30 years, but we use this term for illustration purposes), the NPV and IRR concepts are employed to determine the project’s financial viability. A planned project has an estimated outlay cost (OC = the cost of a factory and required equipment) and estimated future cash inflows (which are future values, FVs). The present value (PV = price) of given (or in this case estimated) FVs is given by:
PV = FV / (1 + ir / not)y.not. where ir = borrowing rate; not = number of times interest is payable per annum; y = number of years. The NPV is the same, except for the OC: it is the PV of future cash flows minus the OC [CF1, CF2, etc = annual future cash flows (which are FVs)]:
NPV = - OC + [CF1 / (1 + ir)1] + [CF2 / (1 + ir)2] + [CF3 / (1 + ir)3] + [CF4 / (1 + ir)4] + [CF5 / (1 + ir)5].
The bond interest rate to be paid by the company is equal to the risk-free rate (rfr = government bond rate for the period) + a risk premium (rp):
ir = 5-year rfr + rp. If we assume:
the 5-year rfr = 4.0% pa, and the market demands a rp of 2.0% pa (ir = 6.0% pa);
the forecast cash flows are (pa, LCC147 millions): 20, 25, 30, 35, and 40; OC = LCC 120 million;
the NPV of the project is:
145 International Monetary Fund, 2015. Reflections on South Africa’s challenges and opportunities for reform. Remarks by David Lipton, First Deputy Managing Director, International Monetary Fund at the University of Cape Town, Cape Town, 5 March. 146 Elucidated fully in: http://bookboon.com/en/interest-rates-an-introduction-ebook. 147 LCC (Local Country Corona), is a fictitious currency (monetary unit: corona) code for fictitious country, Local Country. It may be compared with GBP (Great Britain Pound) or USD (United States Dollar).

65
NPV = - OC + [CF1 / (1 + ir)1] + [CF2 / (1 + ir)2] + [CF3 / (1 + ir)3] + [CF4 / (1
+ ir)4] + [CF5 / (1 + ir)5]. = - 120 + (20 / 1.061) + (25 / 1.062) + (30 / 1.063) + (35 / 1.064) + (40 /
1.065) = - 120 + (20 / 1.06) + (25 / 1.12360) + (30 / 1.19102) + (35 / 1.26248) +
(40 / 1.33823) = - 120 + 18.868 + 22.250 + 25.188 + 27.723 + 29.890 = +3.919 = +LCC 3 919 000.
The project is viable at this corporate bond funding rate. At 8.0% it is not:
NPV = - 120 + (20 / 1.081) + (25 / 1.082) + (30 / 1.083) + (35 / 1.084) + (40 / 1.085)
= - 120 + (20 / 1.08) + (25 / 1.16640) + (30 / 1.25971) + (35 / 1.36049) + (40 / 1.46932)
= - 120 + 18.519 + 21.433 + 23.815 + 25.726 + 27.223 = -3.284
= -LCC 3 284 000. The IRR is the discount rate which makes the NPV = 0, that is, the PVs of the cash flows (FVs) of the project are equal to its OC. The IRR of the project is higher than 6.0% pa and lower than 8.0% pa. It will be clear that, in a tight monetary policy environment when interest rates are increased by the central bank, more and more new projects become non-viable and are put on ice (remember the ir is the denominator). We discuss the significance of monetary policy in economic growth later. APPENDIX 2: LITERATURE REVIEW AND BIBLIOGRAPHY Factor of production: natural resources Royal Economic Society, 2015. Online: http://www.res.org.uk/details/mediabrief /1452899/How-Developing-Countries-Rich-In-Natural-Resources-Should-Harness-The-Revenues-F.html. [Accessed 09.10.2015.] “Many countries have made a mess of managing their natural resource revenues. The 'resource curse' is the term usually used to express the fact that countries that are well endowed with natural resources – particularly oil – have on average had worse economic performance than resource-poor countries. There are many reasons for the resource curse: some countries have failed to capture resource revenues; others have dissipated them in rent-seeking, corruption or conflict; many have suffered the adverse effects of price and revenue volatility; and many have saved and invested too little of the revenue.” Factor of production: Physical capital
66
NBER, 1993. Is fixed investment the key to economic growth? NBER Working Paper. Number 4436. August. “This paper examines shares of fixed capital formation in GDP and rates of economic growth for more than 100 countries over successive 5-year periods between 1965 and 1985 to determine the direction of causality between them. Simple regressions and multiple regressions including several standard determinants of growth, as well as a simple causality test, provide more evidence that increases in growth precede rises in rates of capital formation than that increases in capital formation precede increases in growth. High rates of fixed capital formation accompany rapid growth in per capita income, but we find no evidence that fixed investment is the only or main source of ignition for economic growth.” Bond, S, Leblebicioglu, A, Schiantarelli, F, 2004. Capital accumulation and growth: A new look at the empirical evidence. Working Paper. Online: http://www.nuffield.ox.ac.uk/economics/papers/2004/w8/Tempblsgrowth17march.pdf. [Accessed 11.06.2015]. “A permanent increase in the share of GDP devoted to [physical capital] investment predicts not just a higher level of output per worker, but also a faster growth rate in the long run. These findings are consistent with the main implication of certain endogenous growth models, such as the AK model. However it should be stressed that they do not rule out a very important role for many other factors in the growth process, such as the quality of economic, political and legal institutions, and the quality of macroeconomic and microeconomic government policies, including those related to education and research. Such factors may play a key role in determining capital accumulation, or the impact of investment on growth, in addition to affecting growth directly, at a given level of investment.” Factor of production: Human capital Asian Development Bank, 2015. A survey on the relationship between education and growth with implications for developing Asia. Online: http://www.adb.org/publications/survey-relationship-between-education-and-growth-implications-developing-asia. [Accessed 20.10.2015.] “To avoid the poverty trap and for efficient adoption of technologies, accumulation of human capital - specifically general human capital and width of human capital - are crucial. To avoid the technology-skill mismatch, the speed of technology upgrading should be appropriate to take full advantage of learning-by-doing and the earning potential of the current stock of specific human capital. Finally, depending on the stage of development, countries should properly balance investments between general and specific human capital, width and depth of human capital, basic and development research, and primary and secondary and tertiary education.” Federal Reserve Bank of St Louis: Online: https://www.stlouisfed.org/education/economic-lowdown-podcast-series/episode-2-factors-of-production. [Accessed 18.08.2015.]
67
“Labor is the effort that people contribute to the production of goods and services. Labor resources include the work done by the waiter who brings your food at a local restaurant as well as the engineer who designed the bus that transports you to school. It includes an artist's creation of a painting as well as the work of the pilot flying the airplane overhead. If you have ever been paid for a job, you have contributed labor resources to the production of goods or services. The income earned by labor resources is called wages and is the largest source of income for most people.” Bloom, DE, Canning, D, Sevilla, J, 2001. Economic growth and the demographic transition. NBER Working Paper. Number 8685, December. “Three alternative positions define this debate: that population growth restricts, promotes, or is independent of economic growth. Proponents of each explanation can find evidence to support their cases.” Furuoka, F, 2009. Population growth and economic development: new empirical evidence from Thailand. Economics Bulletin. Volume 29, Issue 1. “Population growth has a substantial impact on economic development. There are two schools of thought regarding this issue. Some researchers maintain that population has a negative impact on economic development while others are convinced that the effect is positive.” Aluko, YA, Aluko, O, 2012. Human capital development: Nigeria’s greatest challenge. Journal of Management Policy and Practice. Volume 13(1). “For education to contribute significantly to development, it must be of high quality to meet the skill-demand needs of the economy. Education is highly instrumental and even necessary to improve the production capacity of any nation …” Chakravorty, SK, 2012. Quality of human capital and economic development. Productivity. Volume 52, Number 4, January-March. “Quality of human capital determines the level of economic development in any country … This article analyzes the various facets of human capital and its contribution to India’s economic development [and concludes that] it is imperative that human resources need to be continuously upgraded through training and skill upgradation for sustaining economic development.” Gennaioli, N, La Porta, R, Lopez-de-Silanes, F, Shleifer,A, 2011. Human capital and regional development. NBER Working Paper. Number 17158, June. “We investigate the determinants of regional development using a newly constructed database of 1569 sub-national regions from 110 countries covering 74 percent of the world's surface and 96 percent of its GDP. We combine the cross-regional analysis of geographic, institutional, cultural, and human capital determinants of regional development with an examination of productivity in several thousand establishments located in these regions … The evidence points to the paramount importance of [the quality of] human capital in accounting for regional differences in development …”

68
Hanushek, E, 2013. Economic growth in developing countries: The role of human capital. Working Paper. Stanford University. “The focus on human capital as a driver of economic growth for developing countries has led to undue attention on school attainment. Developing countries have made considerable progress in closing the gap with developed countries in terms of school attainment, but recent research has underscored the importance of cognitive skills for economic growth. This result shifts attention to issues of school quality, and there developing countries have been much less successful in closing the gaps with developed countries. Without improving school quality, developing countries will find it difficult to improve their long run economic performance.” World of Work Report, 2014. Volume 2014, Issue 1, December. “Beyond investment in physical capital, it is instructive to examine the pattern of investment in human capital: that is, the contribution that education and training of the labour force make to growth. While the quantum of physical capital does play a role in explaining differences in GDP per capita, the relative investment in human capital adds more explanatory power, not least because physical and human capital may be complements. More broadly, human capital is a key factor in enhancing labour productivity and job quality, and hence GDP growth.” Loayza, N (World Bank) and Soto, R (Pontificia Universidad Católica de Chile) (editors), 2002. The sources of economic growth: An overview. In Economic growth: sources, trends, and cycles. Santiago: Central Bank of Chile. “Apart from its direct role as a factor of production education and human capital can serve as a complement to other factors such as physical capital and natural resources, determine the rate of technological innovations in countries that produce technology, and facilitate technological absorption in countries that imitate it.” Mujahid, N, Amin, A, Khattak, SW, 2014. Human capital investment and physical capital nexus (a path to economic growth of the country): A case study of Pakistan 1980-2010. PUTAJ - Humanities and Social Sciences. Volume 21, Number 2, December. “Investment in human capital is the most important determinant for attracting physical capital for any country. Evidently many nations have accomplished their present state of development by profoundly investing in their human capital. Nevertheless the study analysed the impact of human capital investment on accumulation of physical capital and its impact on economic growth of the country. Analysis of the impact of human capital investment proxy variables shows that primary and secondary education enrolment rates are not significantly related to physical capital while higher education enrolment are positively and significantly related to physical capital …” Lutz, W, and Samir, KC, 2011. Global human capital: Integrating education and population” Science. Volume 333. 29 July. “Almost universally, women with higher levels of education have fewer children. Better education is associated with lower mortality, better health, and different migration patterns. Hence, the global population outlook depends greatly on further progress in
69
education, particularly of young women. By 2050, the highest and lowest education scenarios - assuming identical education-specific fertility rates - result in world population sizes of 8.9 and 10.0 billion, respectively. Better education also matters for human development, including health, economic growth, and democracy. Existing methods of multi-state demography can quantitatively integrate education into standard demographic analysis, thus adding the ‘quality’ dimension.” Lutz, W, and Samir, KC, 2011. Global human capital: Integrating education and population. Science. Volume 333. 29 July. “Almost universally, women with higher levels of education have fewer children. Better education is associated with lower mortality, better health, and different migration patterns. Hence, the global population outlook depends greatly on further progress in education, particularly of young women. By 2050, the highest and lowest education scenarios - assuming identical education-specific fertility rates - result in world population sizes of 8.9 and 10.0 billion, respectively. Better education also matters for human development, including health, economic growth, and democracy. Existing methods of multi-state demography can quantitatively integrate education into standard demographic analysis, thus adding the “quality” dimension.” Bloom, DE, Canning, D, Sevilla, J, 2001. The effect of health on economic growth: Theory and evidence. NBER Working Paper Number 8587. November. “Our main result is that good health has a positive, sizable, and statistically significant effect on aggregate output.” World Health Organization, 2015. Trade, foreign policy, diplomacy and health. Online: http://www.who.int/trade/glossary/story019/en/. [Accessed 02.11.2015.] “The relationship between economic growth and health has been the focus of the Commission on Macroeconomics and Health. The Commission argues that infectious diseases such as malaria and HIV/AIDS act as a massive societal brake, slowing both economic growth and human development. Good health is linked to economic growth through higher labour productivity, demographic changes and higher educational attainment. In the same way, poor health undermines economic growth. For example, it is estimated that Africa's per capita growth rate of 0.4% in 1990-1997 was three times lower than it would have been had HIV/AIDS not existed.” World Health Organization, 2015. Commission on Macroeconomics and Health. Online: http://www.who.int/trade/glossary/story008/en/. [Accessed 02.11.2015.] “The … CMH … was established by WHO in January 2000 to assess the contribution of health to global economic development. The Commission's report, presented to WHO in December 2001, concluded that health is a creator and pre-requisite of development. The Commission stressed that extending the coverage of health services and a small number of critical interventions to the world's poor could save millions of lives, reduce poverty, spur economic development, and promote global security.” Factor of production: Entrepreneurship

70
Holcombe, RG, 1998. Entrepreneurship and economic growth. The Quarterly Journal of Austrian Economics. Volume 2. Number 2. “In the latter half of the twentieth century a production function approach to economic growth has led both growth theory and growth policy to conclude that increases in output could best be produced by increasing the inputs into the production process. Policies were aimed at increasing both the quantity and quality of inputs through investment, incorporation of modern technology, and education. In many less-developed economies, the results have been disappointing. In contrast, this Austrian framework for viewing economic growth shows that the key element in economic growth is the production of entrepreneurial opportunities. When such opportunities are available, individuals have the incentive to invest in human and physical capital without government intervention. Mainstream growth theory has seen the problems with the mechanistic application of the production function approach to economic growth, but has responded by incorporating increasing returns and knowledge externalities into formal models in a way that obscures the way in which these factors might actually manifest themselves in the real world. The answer is the type of entrepreneurship that Kirzner described, and the straightforward prescription for economic growth is to create an institutional environment that encourages markets and rewards productive activity.” Online: https://www.stlouisfed.org/education/economic-lowdown-podcast-series/episode-2-factors-of-production. [Accessed 18.08.2015.] “An entrepreneur is a person who combines the other factors of production - land, labor, and capital - to earn a profit. The most successful entrepreneurs are innovators who find new ways produce goods and services or who develop new goods and services to bring to market. Without the entrepreneur combining land, labor, and capital in new ways, many of the innovations we see around us would not exist. Think of the entrepreneurship of Henry Ford or Bill Gates. Entrepreneurs are a vital engine of economic growth helping to build some of the largest firms in the world as well as some of the small businesses in your neighborhood. Entrepreneurs thrive in economies where they have the freedom to start businesses and buy resources freely. The payment to entrepreneurship is profit.” Holcombe, RG, 1998. Entrepreneurship and economic growth. The Quarterly Journal of Austrian Economics. Volume 2. Number 2. “The most basic facts of economic growth weigh against focusing on the inputs into the production process, and point toward an examination of the process itself. Within the neoclassical framework, changes in the production function have had a bigger impact on economic growth than changes in the inputs into the production function. The quantity and quality of both human and physical capital are important, beyond a doubt, but they are a product of an economy and not factors given exogenously to it. Both existed in abundance in ancient [times] … economic growth at [high] rates cannot have been taking place for more than a few centuries. Land, labor, and capital long predate the transformation to economic growth. It is the process by which they are combined that has created sustained economic growth.”

71
Holcombe, RG, 1998. Entrepreneurship and economic growth. The Quarterly Journal of Austrian Economics. Volume 2. Number 2. “R&D … expenditures cannot be the whole story, because once the research is done, the results need to be applied to make production less costly, or even more mysteriously, to produce goods and services that have never been produced before. This is the role of entrepreneurship.” OECD, 2006. Understanding entrepreneurship: Developing indicators for international comparisons and assessments. Report on the OECD's Entrepreneurship Indicators Project and Action Plan. “Entrepreneurship is viewed as a critical activity to regenerate and sustain economic growth in strong economies and also as a means of boosting employment and productivity in depressed regions or in developing countries. The dynamic process of new firm creation introduces and disperses innovative products, processes and organisational structures throughout the economy. As firms enter and exit the market, theory suggests that the new arrivals will be more efficient than those they displace. Furthermore, existing firms that are not driven out are forced to innovate and become more productive to compete. Empirical support for this process of creative destruction, first described by Schumpeter, has been provided by numerous studies by the OECD and others. Entrepreneurship is a major force in economic dynamism.” Holcombe, RG, 1998. Entrepreneurship and economic growth. The Quarterly Journal of Austrian Economics. Volume 2. Number 2. “Many of [the entrepreneurial opportunities] come from the actions of other entrepreneurs. Henry Ford could not have succeeded in mass-producing automobiles until there was a substantial market, including infrastructure such as roads, gasoline stations, and repair facilities. Bill Gates could not have made his fortune had not Steve Jobs seen the opportunity to build and sell personal computers, and Steve Jobs could not have built a personal computer had not Gordon Moore invented the microprocessor. When entrepreneurs take advantage of profit opportunities, they create new entrepreneurial opportunities that others can act upon. Entrepreneurship creates an environment that makes more entrepreneurship possible.” World Intellectual Property Organization, 2013. Indicators World Intellectual Property Indicators. Online: http://www.wipo.int/edocs/pubdocs/en/intproperty/941/wipo_pub_941_2013.pdf. [Accessed 16.10.2015.] “… inventors arguably have special economic importance, as they create knowledge that is at the genesis of technological and industrial transformation.” World Bank, 2015. South Africa’s changing demographic could lift growth to 5.4% by 2030. Press release 17.08.2015. Online: http://www.worldbank.org/en/news/press-release/2015/08/17/south-africa-demographic-lift-growth. [Accessed 21.10.2015.] “It also contends that South Africa will need to take policy action along several fronts to realize this potential [of high economic growth]. Getting basic education and post-

72
school vocation training right is paramount if the existing unemployed and millions of new young entrants to the labor market in the coming decade are to find work. But the jobs challenge also requires complementing existing efforts to promote manufacturing and exports by policies to support the development of small and medium sized firms and informal enterprises by cutting red tape, promoting access to finance and ensuring greater flexibility in the regulations that apply to these smaller firms.” Efficiency of production: Productivity OECD. Online: http://www.oecd.org/std/productivity-stats/40526851.pdf. [Accessed 24.08.2014.] “Productivity is commonly defined as a ratio between the output volume and the volume of inputs. In other words, it measures how efficiently production inputs … are being used in an economy to produce a given level of output. Productivity is … a key source of economic growth and competitiveness.” Czernich, N; Falck, O; Kretschmer, T; Woessmann, L, 2009. Broadband infrastructure and economic growth. CESifo Working Paper. No. 2861. “High-speed internet access via broadband infrastructure has developed rapidly worldwide since the late 1990s. Broadband infrastructure allows the generation and distribution of decentralized information and ideas in markets increasingly relying on information as an input. In light of modern theories of endogenous growth (e.g., Romer 1990), this should accelerate economic growth by facilitating the development and adoption of innovation processes. In this way, broadband infrastructure may differ not only from other types of public infrastructure such as roads and bridges, but also from more traditional telecommunications infrastructure. While the latter’s impact on economic growth has been analyzed before (Röller and Waverman 2001), the new growth theories suggest that the growth effects of modern communication networks that have emerged since may have a different quality. Voice-telephony infrastructure has a coordination function and reduces transaction costs for existing businesses. On top of that, high-speed internet via broadband infrastructure may accelerate the distribution of ideas and information and foster competition for and development of new products, processes, and business models, thereby further facilitating macroeconomic growth. In this paper, we analyzed the effects of broadband infrastructure on economic growth. Based on annual data for a panel of OECD countries and using an instrumental-variable approach, we find that the introduction and diffusion of broadband had an important impact on growth in GDP per capita. After a country has introduced broadband, GDP per capita is 2.7 to 3.9 percent higher on average than before its introduction, controlling for country and year fixed effects. In terms of subsequent diffusion, an increase in the broadband penetration rate by 10 percentage points raises annual growth in per-capita GDP by 0.9 to 1.5 percentage points.” International trade (openness of the economy) Loayza, N (World Bank) and Soto, R (Pontificia Universidad Católica de Chile) (editors), 2002. The sources of economic growth: An overview. In Economic growth: sources, trends, and cycles. Santiago: Central Bank of Chile.

73
“The bulk of the empirical evidence indicates that the relationship between economic growth and international openness is indeed positive, and that it reflects a virtuous cycle by which higher openness leads to growth improvement, which, in turn, generates larger trade.” Demand factors DFID (UK), 2011. Sources of economic growth. Trade and Investment Analytical Papers. Topic 6 of 18. “Economic growth is the continuous improvement in the capacity to satisfy the demand for goods and services, resulting from increased production scale, and improved productivity (innovations in products and processes)”. Financial market development Greenwood, J; Sánchez, JM; Wang, C, 2010. Quantifying the impact of financial development on economic development. Federal Reserve Bank of St Louis Working Paper Series. Number 2010-023C. “Again, how important is financial development for economic development? To address this question, a costly state verification model is applied to both U.S. and cross-country data. The model has two unique features: First, financial intermediaries choose how much labor to devote to monitoring their loan activity. The odds of detecting malfeasance are a function of this choice. They also depend on the technology used in the financial sector. Second, each firm faces a distribution of returns. Furthermore, there is an economy-wide distribution across firms over these firm-specific distributions. These two features lead to a financial theory of firm size. This occurs because there are diminishing returns to scale in the monitoring activity. The framework is calibrated to fit the U.S. firm-size distributions for 1974 and 2004, as well as the observed intermediation spreads on loans. The analysis suggests that financial intermediation is important for economic development. In particular, about 29 percent of U.S. growth can be attributed to technological improvement in financial intermediation. Since there was little change in the U.S. interest rate spread, it appears that technological progress in the financial sector was in balance with technological advance in the rest of the economy. Roughly 45 percent of Taiwanese growth could be attributed to financial innovation. Given the dramatic decline in the Taiwanese interest-rate spread, technological progress in the financial sector may have outpaced that elsewhere. The model’s predictions for the efficiency of financial intermediation in a cross-section of 45 countries match up well with independent measures. It performs reasonably well in mimicking cross-country capital-output ratios. The average measured distortion in the world between the expected marginal product of capital and its user cost is 14.7 percentage points. The average coefficient of variation in the distortion within a country is 62 percent. World output could increase by 53 percent if all countries adopted the best financial practice in the world. Adopting this leading-edge practice leads to funds being redirected away from inefficient firms toward more productive ones. This reallocation effect is reflected by a rise in world TFP by 13.5 percent. Still, this accounts only for 31 percent of the gap between actual and potential world output because the bulk of the differences in cross-country per-capita GDP are
74
explained by the huge differences in the productivity of the non-financial sector. The results are robust to changes in the matching strategy for backing out the cross-country productivities in the financial and non-financial sectors.” Haidar, JI, 2009. Investor protections and economic growth. Economics Letters. 103. “Using objective measures of investor protections in 170 countries, I establish that the level of investor protection matters for cross-country differences in GDP growth: countries with stronger protections tend to grow faster than those with poor investor protections.” Samila, S, Sorenson, O, 2009. Venture capital, entrepreneurship and economic growth.Working Paper. “… we find that an increase in the local supply of venture capital (VC) positively affects (i) the number of firm starts, (ii) employment, and (iii) aggregate income. Our results remain robust to specifications that address potential endogeneity in the supply of venture capital by using endowment returns as an instrumental variable. The magnitudes of the effects moreover imply that venture capital stimulates the creation of more firms than it directly funds. That result appears consistent with either of two mechanisms: One, would-be entrepreneurs that anticipate a future need for financing more likely start firms when the supply of capital expands. Two, VC-funded companies may transfer tacit knowledge to their own employees enabling spinoffs, and may encourage both their employees and others to become entrepreneurs through demonstration effects.” General business environment Government: Theory of bureaucracy and size Loayza, N (World Bank) and Soto, R (Pontificia Universidad Católica de Chile) (editors), 2002. The sources of economic growth: An overview. In Economic growth: sources, trends, and cycles. Santiago: Central Bank of Chile. “… government burden [is] the drain that government may represent for private activity. Although government can play a beneficial role for the economy … it can be a heavy burden if it imposes high taxes, uses this revenue to maintain ineffective public programs and a bloated bureaucracy, distorts markets’ incentives, and interferes negatively in the economy by assuming roles most appropriate for the private sector.” ECB, 2008. Government size, composition, volatility and economic growth. ECB Working Paper Series. Number 849, January. “This paper analyses the effects in terms of size and volatility of government revenue and spending on growth in OECD and EU countries. The results of the paper suggest that both variables are detrimental to growth. In particular, looking more closely at the effect of each component of government revenue and spending, the results point out that i) indirect taxes (size and volatility); ii) social contributions (size and volatility); iii) government consumption (size and volatility); iv) subsidies (size); and v) government

75
investment (volatility) have a sizeable, negative and statistically significant effect on growth.” Alesina, A, 0zler, S, Roubini, N, Swagel, P, 1992. Political instability and economic growth. NBER Working Paper Series. Number 4173. Online: http://dash.harvard.edu/bitstream/handle/1/4553024/alesina_instabilitygrowth.pdf?sequence=2. [Accessed 26.08.2015.] “[This paper] … investigates the relationship between political instability and per capita GDP growth in a sample of 113 countries for the period 1950-1982 … The main result of this paper is that in countries and time periods with a high propensity of government collapse, growth is significantly lower than otherwise.” Aisena, A, Veiga, FJ, 2013. How does political instability affect economic growth? European Journal of Political Economy. Volume 29, March. “The purpose of this paper is to empirically determine the effects of political instability on economic growth. By using the system-GMM estimator for linear dynamic panel data models on a sample covering up to 169 countries, and 5-year periods from 1960 to 2004, we find that higher degrees of political instability are associated with lower growth rates of GDP per capita. Regarding the channels of transmission, we find that political instability adversely affects growth by lowering the rates of productivity growth and, to a smaller degree, physical and human capital accumulation.” Government: Governance OECD, no date (but 2013 or later). Issues paper on corruption and economic growth. Online: http://www.oecd.org/g20/topics/anti-corruption/Issue-Paper-Corruption-and-Economic-Growth.pdf. [Accessed 13.10.2-15.] “The strong negative correlation between perceived corruption and the level of [economic] output provides prima facie evidence of the negative impact corruption has on value creation. While the causality underlying this relationship is likely to run both ways, the majority of analysts agree that it is primarily running from corruption to output rather than in the opposite direction.” OECD, no date (but 2013 or later). Issues paper on corruption and economic growth. Online: http://www.oecd.org/g20/topics/anti-corruption/Issue-Paper-Corruption-and-Economic-Growth.pdf. [Accessed 13.10.2-15.] “The true social cost of corruption cannot be measured by the amount of bribes paid or even the amount of state property stolen. Rather, it is the loss of output due to the misallocation of resources, distortions of incentives and other inefficiencies caused by corruption that represent its real cost to society. And in addition to these output losses, corruption can inflict additional welfare costs in terms of adverse effects on the distribution of income and disregard for environmental protection. Most importantly, corruption undermines public trust in the government, thereby diminishing its ability to fulfil its core task of providing adequate public services and a conducive environment for private sector development. In extreme cases, it may entail the delegitimization of the state, leading to severe political and economic instability. The resulting general

76
uncertainty is detrimental to private business’ willingness and ability to commit to a long-term development strategy, lack of which makes sustainable development hard to achieve.” World Bank, 2010. Online: http://www.worldbank.org/en/news/feature/2010/12/06/ corruption-hunters-rally-for-action-against-fraud. [Accessed 13.10.2015.] “Corruption is among the greatest obstacles to economic and social development; an estimated $20-$40 billion is stolen each year from low-income countries.” Haidar, JI, 2012. The impact of business regulatory reforms on economic growth. Journal of The Japanese and International Economies. 26, pp. 285-307. The impact on economic growth of institutions is long-known. For example, Hall and Jones (1999), Acemoglu et al. (2001), Djankov et al. (2002, 2003, 2004, 2006), among others, show that institutions are a major determinant of wealth and long-term growth. Countries that had better political and economic institutions in the past are richer today. Haidar adds “… to the literature on institutions and growth by studying a new measure of institutional reforms. The analysis focuses on a particular type of institutional reforms: business regulations. [He uses] a new country-level data set to establish the impact of business regulatory reforms on economic growth.” World Economic Forum, 2015. The Global Competitiveness Report 2015-2016. Online: http://www.weforum.org/reports/global-competitiveness-report-2015-2016. [Accessed 20.10.2015.] “… efficiency in the public sector, which has two aspects: efficient administrative services and a stable policy environment. Administrative efficiency implies a lack of unnecessary red tape in business processes such as the collection of taxes, compliance with regulations, obtaining permits, and the judicial system; there is empirical evidence that burdensome bureaucracy decreases investments and firms’ efficiency. Policy stability may affect productivity by reducing uncertainty about the future and consequently expanding the time horizon of society’s preferences; this may lead to better resource allocation, including more R&D investments and hence faster technological progress.” Corruption Watch, 2015. Online: http://www.corruptionwatch.org.za/loss-of-principle-new-schools-report/. [Accessed 26.10.2015.] “To date [July 2015] Corruption Watch has received over 1 100 cases of corruption since the organisation started its schools campaign [January 2012]. Of these reports, 54% implicate principals as the primary culprits in corrupt activities. ‘Principals and school governing bodies have been shown to manipulate basic financial rules and regulations in order to directly enrich themselves,” said Leanne Govindsamy, the head of Corruption Watch’s legal and investigations department. ‘Our investigations have revealed gross financial mismanagement, including misappropriation of school funds, procurement irregularities and failures to prepare for and implement school budgets,’ Govindsamy explained. She said the reports follow a pattern of collusion between, among others, members of school governing bodies (SGBs), teachers, family members and other outside parties involved in contractual arrangements with schools.

77
OECD: Crane-Charef, M, 2015. Stocktaking of anticorruption and business integrity measures for southern African SOEs. OECD Corporate Governance Working Papers. Number 18. “… a list of “corruption costs”, which include:
Retarding social, political, and economic development; Crippling Government’s ability to deliver social services as public funds are
illegally diverted to private use; Undermining democratic values of good governance, political stability, and the
rule of law; Discouraging foreign and domestic investment; Breeding criminal behaviour, and hence endangers public security; and Violating the rights of the people who experience corruption.
Government: Regulatory burden Fallon, M (Right Honourable, MP, UK Business Minister), 2013. Deregulation and economic growth: priorities for government reform. Department for Business, Innovation & Skills. Online: https://www.gov.uk/government/speeches/deregulation-and-economic-growth-priorities-for-government-reform. [Accessed 07.10.2015.] “By cutting needless red tape we can free Britain’s entrepreneurs to concentrate on what they do best: growing their business, innovating, opening markets and creating jobs, driving our economic recovery. In tackling red tape our strategy has been to:
stem the flow of new regulation through the introduction of ‘One-In, One-Out’ and now the more punishing ‘One-In, Two-Out’ rule
tackle the existing stock through the Red Tape Challenge [commitment to scrap or improve at least 3 000 regulations that affect business]
establish an EU taskforce to identify and tackle European rules that inhibit growth
improve how regulation is enforced.” “… we also found that whatever the sector examined and whichever regulator was responsible for it, a group of the same issues kept coming up. In addition to sectoral issues, we found cross cutting or systemic problems common across the piece. We found:
regulators failing to see businesses as stakeholders regulators lacking knowledge of the businesses they regulate inconsistent, disproportionate enforcement decisions a lack of clear, consistent advice regulators failing to consider the impact of their decisions in terms of growth a lack of effective appeals processes perverse incentives created by regulator fees and charges regimes.”
Swedish Agency for Growth Policy Analysis, 2010. The economic effects of the regulatory burden. Report 2010:14. Online:
78
http://www.enap.gr/attachments/article/7181/Report_2010_14.pdf. [Accessed 07.10.2015.] “This study mainly covers the indirect economic effects of the regulatory burden on companies and analyses how regulations can create barriers to entry and market rigidities, which lead to reduced competition pressure, reduced entrepreneurship and reduced production dynamic. One of the main results from the report is that the indirect economic costs ensuing from a heavy regulatory burden borne by the business enterprises in a country are considerable and are much larger than the immediate, direct costs.” Haidar, JI, 2012. The impact of business regulatory reforms on economic growth. Journal of The Japanese and International Economies. 26, pp. 285-307. “A fundamental premise of business regulations is that economic activity requires good rules, rules that establish and clarify property rights and reduce the cost of resolving disputes; rules that increase the predictability of economic interactions and provide contractual partners with certainty and protection against abuse The objective is regulations designed to be efficient, accessible to all and simple in their implementation. It has been established in cross country regressions that burdensome business regulatory procedures are negatively correlated with GDP growth.” Economic policies Rama, M, Forteza, A, 2001. Labor market rigidity and the success of economic reforms across more than 100 countries. World Bank eLibrary. Online: http://elibrary.worldbank.org/doi/abs/10.1596/1813-9450-2521. [Accessed 07.10.2015.] “Labor market policies and institutions affect the success of economic reform but probably more for political than for economic reasons. Growth appears not to be hurt by minimum wages and mandatory benefits. But the relative size of organized labor (in government and elsewhere) is crucial. Forteza and Rama show that labor market policies and institutions affect the effectiveness of economic reform programs. They compare annual growth rates across 119 countries, using data from 449 World Bank adjustment credits and loans between 1980 and 1996. The results indicate that countries with relatively rigid labor markets experienced deeper recessions before adjustment and slower recoveries afterward. The authors also disentangle the mechanisms through which labor market rigidity operates. They find that minimum wages and mandatory benefits do not hurt growth. But the relative size of organized labor (in government and elsewhere) appears to matter. Labor market rigidity seems to be relevant more for political reasons than for economic reasons.” IMF, 2000. Objectives, principles, and directions of reform of the labor legislation in Russia. Online: https://www.imf.org/external/pubs/ft/seminar/2000/invest/pdf/dmietriev3.pdf. [Accessed 09.09.2015.] The IMF, in a 2000 Report on Russia, provides an example of a LMP that supports labour market rigidity: “The labor law, as inherited from the Communist past, has a

79
negative impact on the labor market and the development of labor relations in three main areas: (1) It is overburdened with a huge volume of guarantees and allowances to the employee, the main burden of which is laid on the employer. (2) It is highly inflexible on issues of employment and dismissal. (3) Labor laws, the Labor Code included, are not the open act laws and the role of sub-legal normative acts is extremely high.” Baily, MN, Farrell, D, 2006. Breaking Down Barriers to Growth. Finance & Development. Volume 43, Number 1, March. “Labor regulations in developed economies should promote job creation and employment and smooth the transition of workers between jobs. But tight restrictions on laying people off, plus high taxes on employment to finance generous social security benefits, will deter companies from hiring new people. French retailers, for instance, employ 50 percent fewer workers as a percentage of the population than their U.S. counterparts because of strict regulations on hiring and firing workers and a minimum wage twice that of the United States. Generous unemployment benefits may also deter people from working … Procedures are a problem, too. For example, hotels in France need a small army of lawyers to deal with complex labor regulations. Not surprisingly, these laws curtail employment and do little to improve customer service. Giving companies the freedom to hire and fire and negotiate salaries will actually boost job creation in developed economies.” OECD, 2003. The Sources of Economic Growth in OECD Countries. Online: http://browse.oecdbookshop.org/oecd/pdfs/free/1103011e.pdf. [Accessed 29.05.2015.] “… institutional structures and policy settings that favour competition and flexibility in capital and labour markets … make a key difference to growth prospects.” Draghi, M, 2014. Unemployment in the euro area. Speech by Mario Draghi, President of the ECB, Annual Central Bank Symposium in Jackson Hole, 22 August 2014. Online: https://www.ecb.europa.eu/home/html/index.en.html. [Accessed 15.10.2015.] [In respect of LMP (against the backdrop of low growth and a higher level of unemployment in the EU.] “This reform agenda spans labour markets, product markets and actions to improve the business environment. I will however focus here on labour markets, where there are two cross-cutting themes that I see as a priority. The first is policies that allow workers to redeploy quickly to new job opportunities and hence lower unemployment duration. Such policies include enabling firm-level agreements that allow wages to better reflect local labour market conditions and productivity developments; allowing for greater wage differentiation across workers and between sectors; reductions in employment adjustment rigidities and especially labour market dualities; and product market reforms which help to speed up the reallocation of resources and employment to more productive sectors. The second theme is raising the skill intensity of the workforce. We have already seen the disproportionate effect of the crisis on low skilled workers [and the youth], which implies a period of re-skilling will be necessary …”

80
OECD, 2003. The sources of economic growth in OECD countries. Online: http://browse.oecdbookshop.org/oecd/pdfs/free/1103011e.pdf. Accessed 29.05.2015. [OECD: Organisation for Economic Co-Operation and Development.] “Labour market regulations are also found to influence innovation but the impact appears to be conditional on other institutional aspects of the labour market. For example, innovation-driven changes in the job skill mix often imply hiring and of firing workers, which is easier with less statutory job protection.” Corporate governance World Economic Forum, 2015. The Global Competitiveness Report 2015-2016. Online: http://www.weforum.org/reports/global-competitiveness-report-2015-2016. [Accessed 20.10.2015.] “In addition to the quality of public institutions, corporate ethics and governance standards determine incentives for companies, investors, and society to engage in economic activities. Strong corporate governance standards contribute to productivity in two ways. First, they enable shareholders to exert control over firms, and shareholder value in turn is maximized by raising the firm’s productivity. Second, by aligning incentives of firms’ managers and owners, they limit risks to investors, incentivizing higher levels of investment and reducing costs of capital for the firm. Key to corporate governance is the transparent access of shareholders to timely and accurate information, accountability of management to strong and independent corporate boards, and auditor independence. In addition to formal standards, informal behavioral norms also play a crucial role in the way businesses are run. High ethical standards among business leaders can contribute to building trust, thereby reducing the cost of capital and compliance.”