foodservice best practices · foodservice best practices for identifying and measuring food waste...
TRANSCRIPT

Foodservice Best Practices for identifying and measuring food waste
©2017 Rochester Institute of Technology http://bit.ly/NYSP2IFoodStudy Pg. 1 of 20
Foodservice Best Practices (Restaurants, Schools, Universities, Event Venues, Stadiums, Correctional Facilities)
for identifying and measuring food waste
1 Introduction After conducting multiple food waste studies at medium to large NY food waste generators (hospitals, grocers, universities, and catering event venues), New York State Pollution Prevention Institute (NYSP2I) developed a 12-step Food Waste Self-Assessment How-to Guide (How-to Guide). To address the unique needs of foodservice operations in restaurants, schools, universities, event venues, stadiums, and correctional facilities, NYSP2I developed three (3) additional resources; a printable Foodservice Log Sheet to use during the assessment, this Foodservice Best Practices document, and a Microsoft Excel Foodservice Results (Foodservice Results) file.
This Foodservice Best Practices document expands upon the How-to Guide by providing:
• Guidance for successfully using the Foodservice Log Sheet, including examples. • Food waste study best practices for restaurants, cafeterias, and event venues. • Instruction and examples how the Foodservice Results file may be successfully used.
2 Why conduct a food waste self-assessment? • Knowing the source, loss reason, and amount of food waste helps identify opportunities to reduce
the waste and purchasing / disposal costs. • Food waste that cannot be reduced could otherwise be diverted from landfill. Surplus
(overproduction) food may be donated, bringing possible tax benefits and increasing community relations. Food scraps may be recycled by composting or anaerobic digestion, turning the waste into useful products such as fertilizer or electricity. Resources and information are available on the Divert page of the NYSP2I Food Systems Sustainability Clearinghouse (http://bit.ly/NYSP2IFood), about how, what, and where to donate surplus food or recycle food scraps.
• Sustainable business practices provide an opportunity to attract and retain environmentally conscious customers.
Foodservice Best Practices for identifying and measuring food waste
©2017 Rochester Institute of Technology http://bit.ly/NYSP2IFoodStudy Pg. 2 of 20
3 Foodservice Log Sheets – Guidance and Examples Studying Foodservice food waste requires different approaches for pre- and post-consumer waste. Pre-consumer waste is both generated and handled by staff (e.g. serving or plating lines, prep kitchen). Post-consumer waste is generated by restaurant, cafeteria and catering customers, and is handled by staff in the dining area or tray/dish room. In addition, post-consumer waste is often mixed with non-food waste (e.g. packaging, napkins). NYSP2I developed two separate log sheets after pilot studies at three restaurants and event venues. This section details how to successfully use the separate pre-consumer and post-consumer Foodservice Log Sheets in a study. The file with both pre- and post-consumer waste logs is available for download at http://bit.ly/NYSP2IFoodStudy.
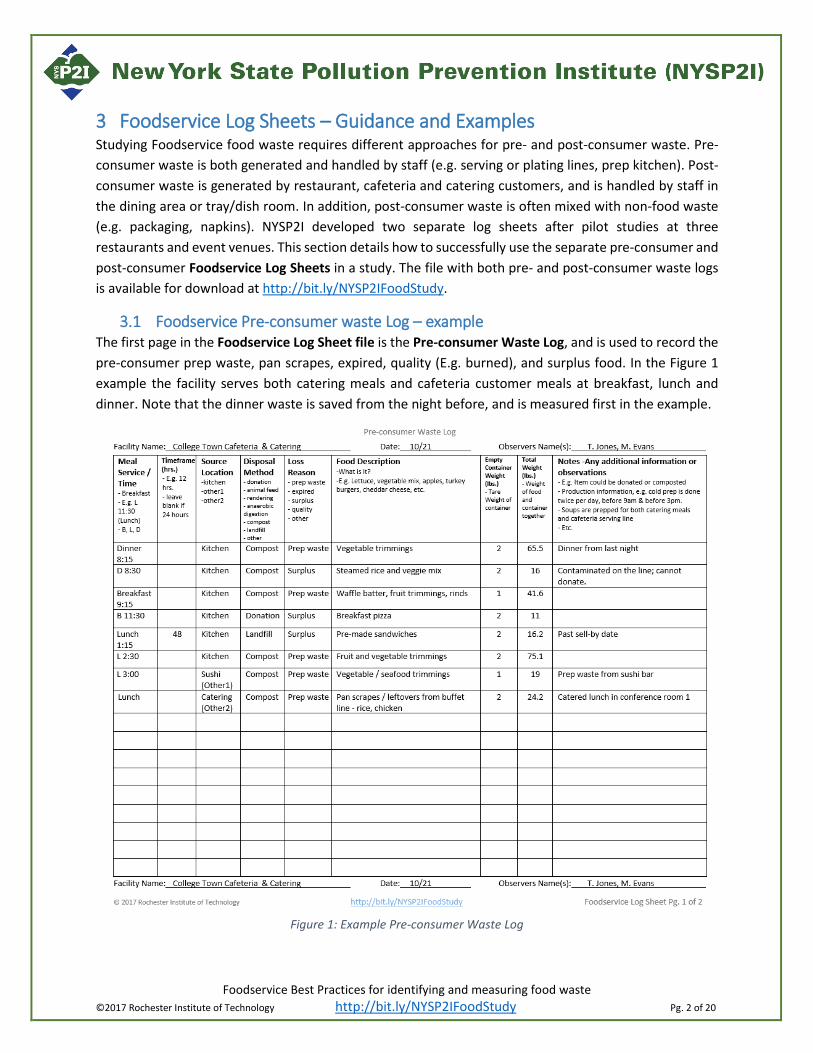
3.1 Foodservice Pre-consumer waste Log – example The first page in the Foodservice Log Sheet file is the Pre-consumer Waste Log, and is used to record the pre-consumer prep waste, pan scrapes, expired, quality (E.g. burned), and surplus food. In the Figure 1 example the facility serves both catering meals and cafeteria customer meals at breakfast, lunch and dinner. Note that the dinner waste is saved from the night before, and is measured first in the example.
Figure 1: Example Pre-consumer Waste Log
Foodservice Best Practices for identifying and measuring food waste
©2017 Rochester Institute of Technology http://bit.ly/NYSP2IFoodStudy Pg. 3 of 20
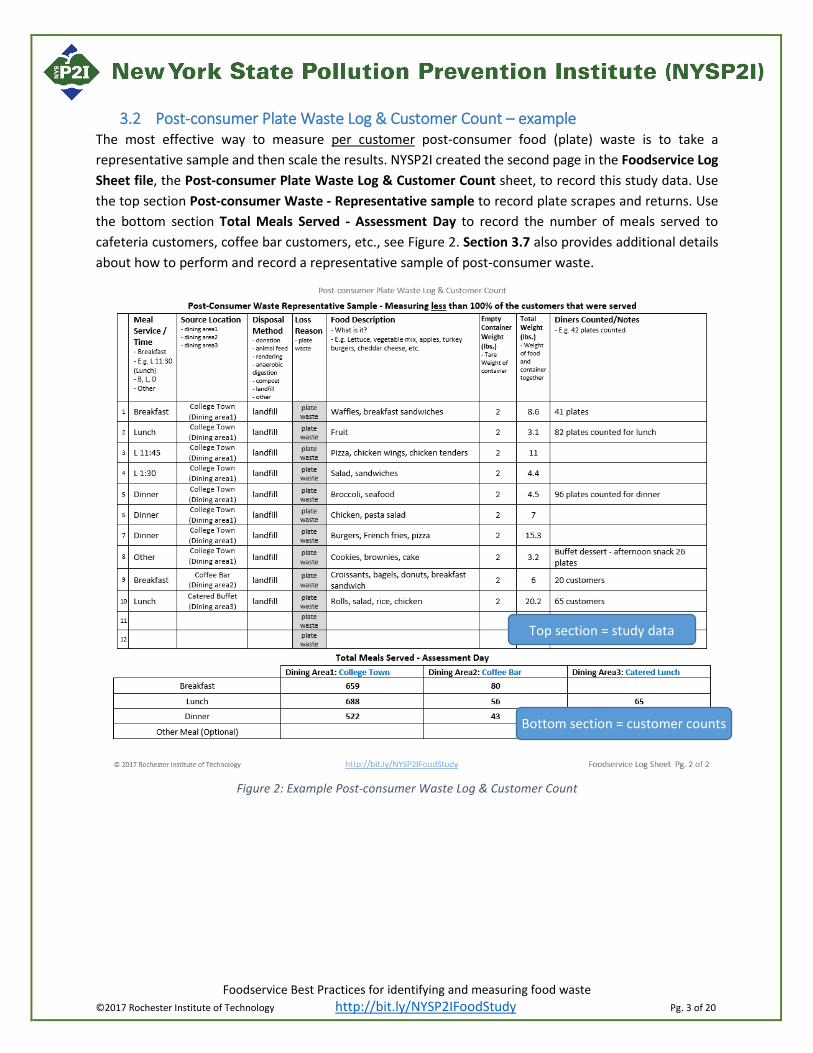
3.2 Post-consumer Plate Waste Log & Customer Count – example The most effective way to measure per customer post-consumer food (plate) waste is to take a representative sample and then scale the results. NYSP2I created the second page in the Foodservice Log Sheet file, the Post-consumer Plate Waste Log & Customer Count sheet, to record this study data. Use the top section Post-consumer Waste - Representative sample to record plate scrapes and returns. Use the bottom section Total Meals Served - Assessment Day to record the number of meals served to cafeteria customers, coffee bar customers, etc., see Figure 2. Section 3.7 also provides additional details about how to perform and record a representative sample of post-consumer waste.
Figure 2: Example Post-consumer Waste Log & Customer Count
Top section = study data
Bottom section = customer counts
Foodservice Best Practices for identifying and measuring food waste
©2017 Rochester Institute of Technology http://bit.ly/NYSP2IFoodStudy Pg. 4 of 20
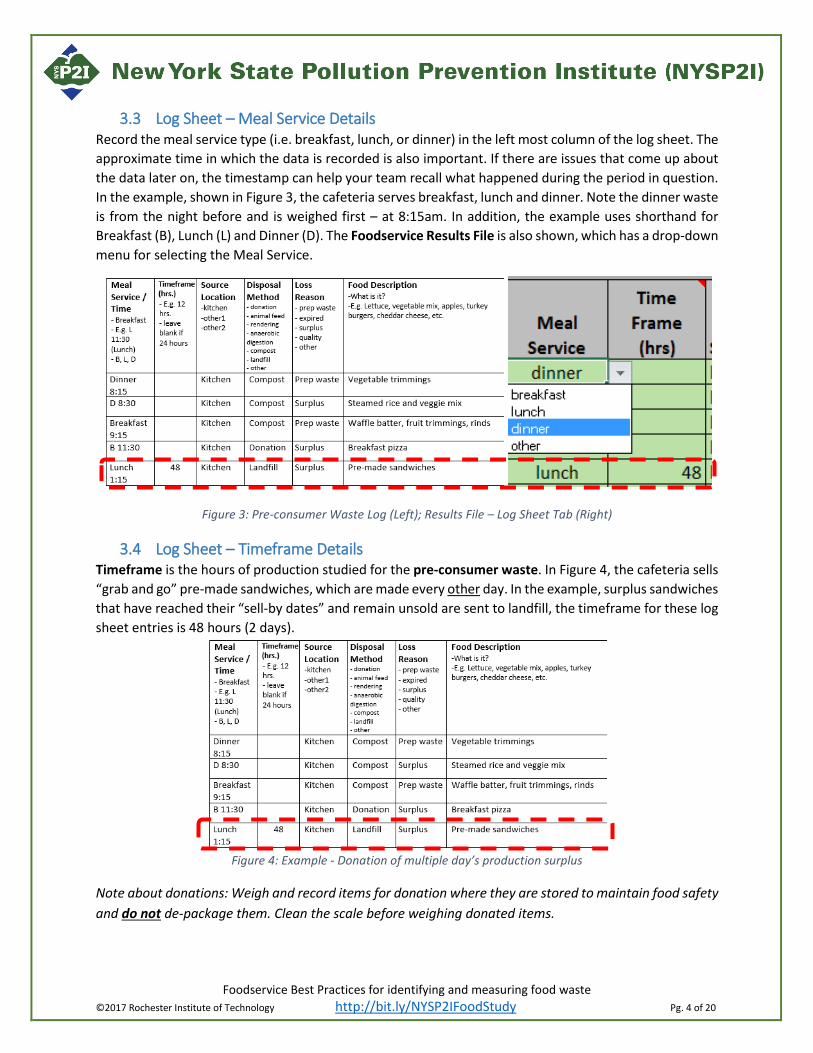
3.3 Log Sheet – Meal Service Details Record the meal service type (i.e. breakfast, lunch, or dinner) in the left most column of the log sheet. The approximate time in which the data is recorded is also important. If there are issues that come up about the data later on, the timestamp can help your team recall what happened during the period in question. In the example, shown in Figure 3, the cafeteria serves breakfast, lunch and dinner. Note the dinner waste is from the night before and is weighed first – at 8:15am. In addition, the example uses shorthand for Breakfast (B), Lunch (L) and Dinner (D). The Foodservice Results File is also shown, which has a drop-down menu for selecting the Meal Service.
Figure 3: Pre-consumer Waste Log (Left); Results File – Log Sheet Tab (Right)
3.4 Log Sheet – Timeframe Details Timeframe is the hours of production studied for the pre-consumer waste. In Figure 4, the cafeteria sells “grab and go” pre-made sandwiches, which are made every other day. In the example, surplus sandwiches that have reached their “sell-by dates” and remain unsold are sent to landfill, the timeframe for these log sheet entries is 48 hours (2 days).
Figure 4: Example - Donation of multiple day’s production surplus
Note about donations: Weigh and record items for donation where they are stored to maintain food safety and do not de-package them. Clean the scale before weighing donated items.
Foodservice Best Practices for identifying and measuring food waste
©2017 Rochester Institute of Technology http://bit.ly/NYSP2IFoodStudy Pg. 5 of 20
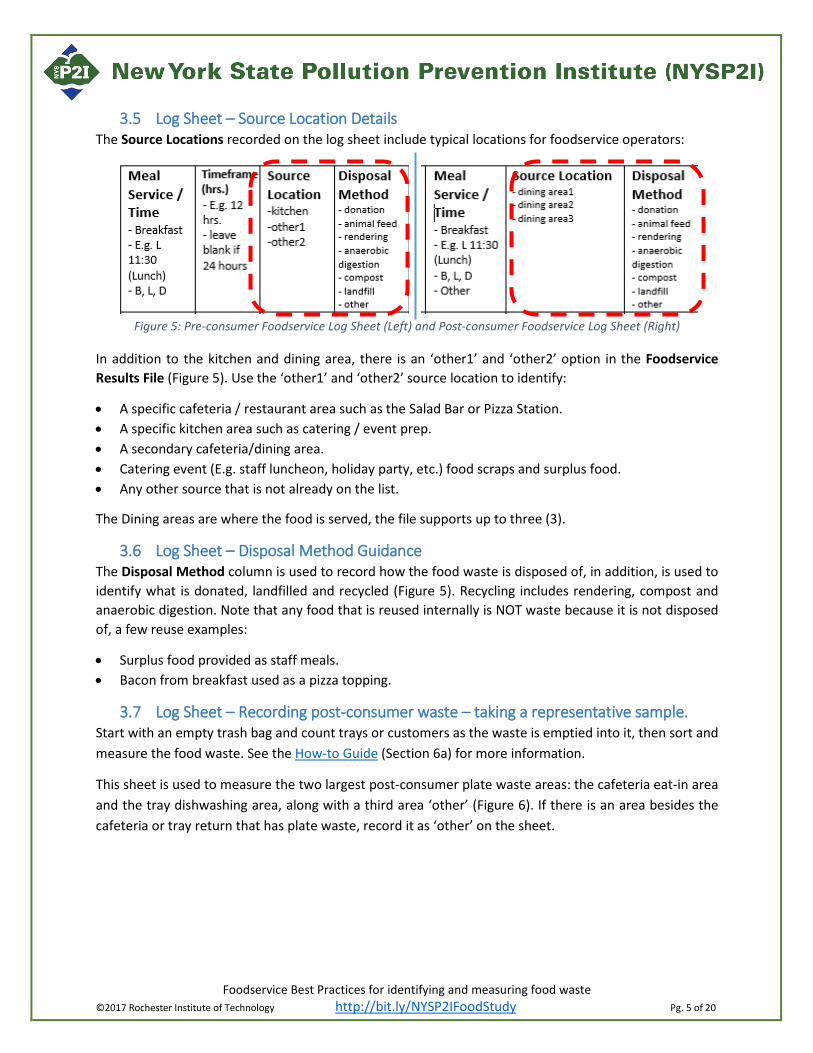
3.5 Log Sheet – Source Location Details The Source Locations recorded on the log sheet include typical locations for foodservice operators:
Figure 5: Pre-consumer Foodservice Log Sheet (Left) and Post-consumer Foodservice Log Sheet (Right)
In addition to the kitchen and dining area, there is an ‘other1’ and ‘other2’ option in the Foodservice Results File (Figure 5). Use the ‘other1’ and ‘other2’ source location to identify:
• A specific cafeteria / restaurant area such as the Salad Bar or Pizza Station. • A specific kitchen area such as catering / event prep. • A secondary cafeteria/dining area. • Catering event (E.g. staff luncheon, holiday party, etc.) food scraps and surplus food. • Any other source that is not already on the list.
The Dining areas are where the food is served, the file supports up to three (3).
3.6 Log Sheet – Disposal Method Guidance The Disposal Method column is used to record how the food waste is disposed of, in addition, is used to identify what is donated, landfilled and recycled (Figure 5). Recycling includes rendering, compost and anaerobic digestion. Note that any food that is reused internally is NOT waste because it is not disposed of, a few reuse examples:
• Surplus food provided as staff meals. • Bacon from breakfast used as a pizza topping.
3.7 Log Sheet – Recording post-consumer waste – taking a representative sample. Start with an empty trash bag and count trays or customers as the waste is emptied into it, then sort and measure the food waste. See the How-to Guide (Section 6a) for more information.
This sheet is used to measure the two largest post-consumer plate waste areas: the cafeteria eat-in area and the tray dishwashing area, along with a third area ‘other’ (Figure 6). If there is an area besides the cafeteria or tray return that has plate waste, record it as ‘other’ on the sheet.
Foodservice Best Practices for identifying and measuring food waste
©2017 Rochester Institute of Technology http://bit.ly/NYSP2IFoodStudy Pg. 6 of 20
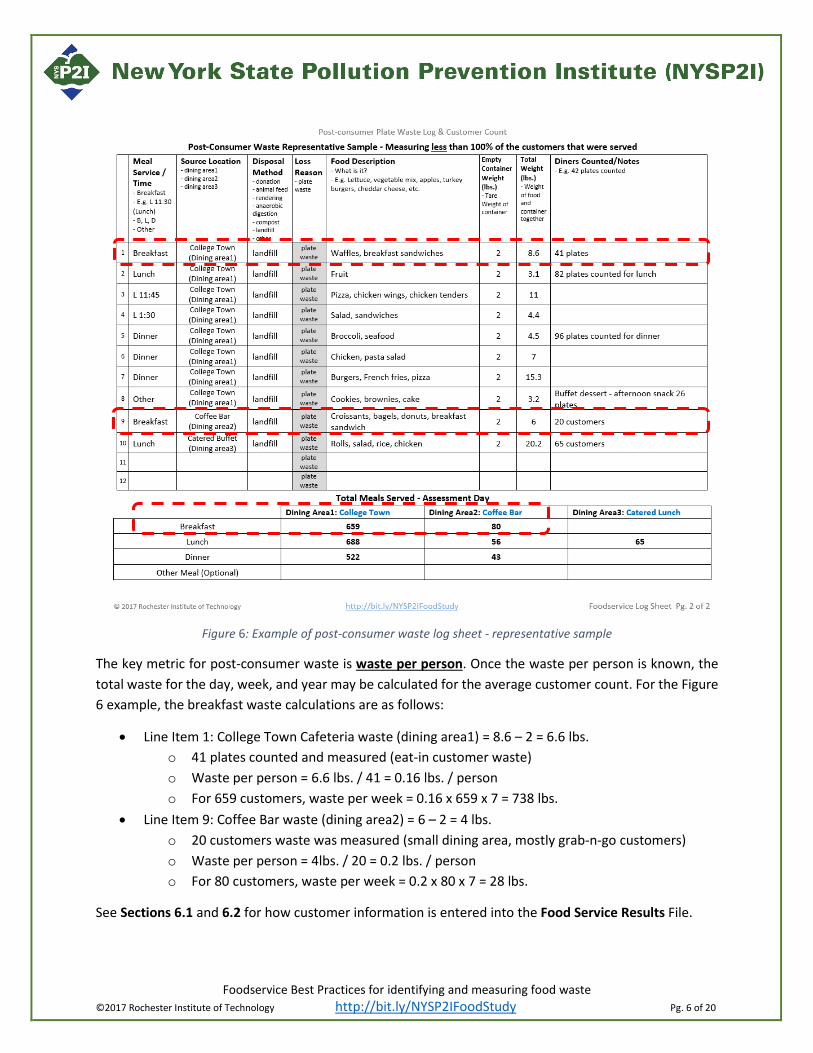
Figure 6: Example of post-consumer waste log sheet - representative sample
The key metric for post-consumer waste is waste per person. Once the waste per person is known, the total waste for the day, week, and year may be calculated for the average customer count. For the Figure 6 example, the breakfast waste calculations are as follows:
• Line Item 1: College Town Cafeteria waste (dining area1) = 8.6 – 2 = 6.6 lbs. o 41 plates counted and measured (eat-in customer waste) o Waste per person = 6.6 lbs. / 41 = 0.16 lbs. / person o For 659 customers, waste per week = 0.16 x 659 x 7 = 738 lbs.
• Line Item 9: Coffee Bar waste (dining area2) = 6 – 2 = 4 lbs. o 20 customers waste was measured (small dining area, mostly grab-n-go customers) o Waste per person = 4lbs. / 20 = 0.2 lbs. / person o For 80 customers, waste per week = 0.2 x 80 x 7 = 28 lbs.
See Sections 6.1 and 6.2 for how customer information is entered into the Food Service Results File.
Foodservice Best Practices for identifying and measuring food waste
©2017 Rochester Institute of Technology http://bit.ly/NYSP2IFoodStudy Pg. 7 of 20
4 Foodservice Food Waste studies – best practices The following sections describe the best practices for assessment logistics. These guidelines directly relate to Step 2: Define Assessment Logistics within the How-to Guide. The titles of each section provide reference to the corresponding step number within the guide, e.g. Section 4.1 Logistics – Assessment Length is related to Step 2a in the How-to Guide.
4.1 Logistics – Assessment length (2a) Typical assessments will take 3-8 hours to capture 24 hours of waste. Not all of this is active time; staff may work on other activities in between measurements. A best practice is to hold the previous day’s evening waste, sorting and measuring it during the assessment day.
4.2 Logistics – Collection plan (2b) Note all pre-consumer waste locations that will need to be assessed. Assigning responsibility of certain trash bins to workers and using brightly colored tags and signs to alert staff are best practices to have a successful food waste assessment. To collect post-consumer waste (plate waste) as a sample, staff will have to be present to count trays as they are emptied into the sample collection bag and to bring the bag to the assessment location determined in (2c).
4.3 Logistics - Locating space for the assessment (2c) The assessment location should ideally be set-up near the compactor or another trash collection area. This is convenient as well as reduces the chance that food waste is disposed of before measurement. It may be more convenient to find space to perform the assessment outside in a shaded area near the trash collection area, weather permitting.
4.4 Logistics – Schedule (2d) Coordinate with staff to identify drop-off or pick up times for the waste by source. There will be pre and post-consumer food waste for each meal service. Kitchen prep waste and plate waste are typically the largest sources of food waste due to large volumes of prepared food and customers not finishing their food.
4.5 Logistics - Determining number of people (2e) Generally, 2-3 people are required to sort, record, and weigh waste. More details are available in the How-to Guide.

Foodservice Best Practices for identifying and measuring food waste http://bit.ly/NYSP2IFoodStudy
© 2017 Rochester Institute of Technology Pg. 8 of 20
5 Foodservice Results File The Foodservice Results File is available for download at http://bit.ly/NYSP2IFoodStudy. The file is used to calculate food waste averages and to identify trends and focus areas for improvement efforts. To obtain results, enter customer and assessment information and the file will do the rest.
The file is broken up into several Tabs that are shown in the following sections.
5.1 Instructions tab The Instructions tab provides step-by-step instructions on using the file (Figure 7).
Figure 7: Foodservice Results File Instructions Tab

Foodservice Best Practices for identifying and measuring food waste http://bit.ly/NYSP2IFoodStudy
© 2017 Rochester Institute of Technology Pg. 9 of 20
6 Foodservice Results – Entering the assessment information The Excel Foodservice Results has two tabs for data entry and the remainder to summarize the results. The two tabs to enter information onto are the Customer Info and Log Sheet tabs.
6.1 Customer Info tab Facility and customer volume information is required to calculate the results, and is entered onto the Customer Info tab. Required entries are colored green as seen in Figure 8. The information contained within the remaining tables and figures, starting with Figure 8, were generated from the content in the Log Sheet Example from Figure 1 and Figure 2 from Section 3.
Figure 8: Customer Info Tab
Foodservice Best Practices for identifying and measuring food waste http://bit.ly/NYSP2IFoodStudy
© 2017 Rochester Institute of Technology Pg. 10 of 20
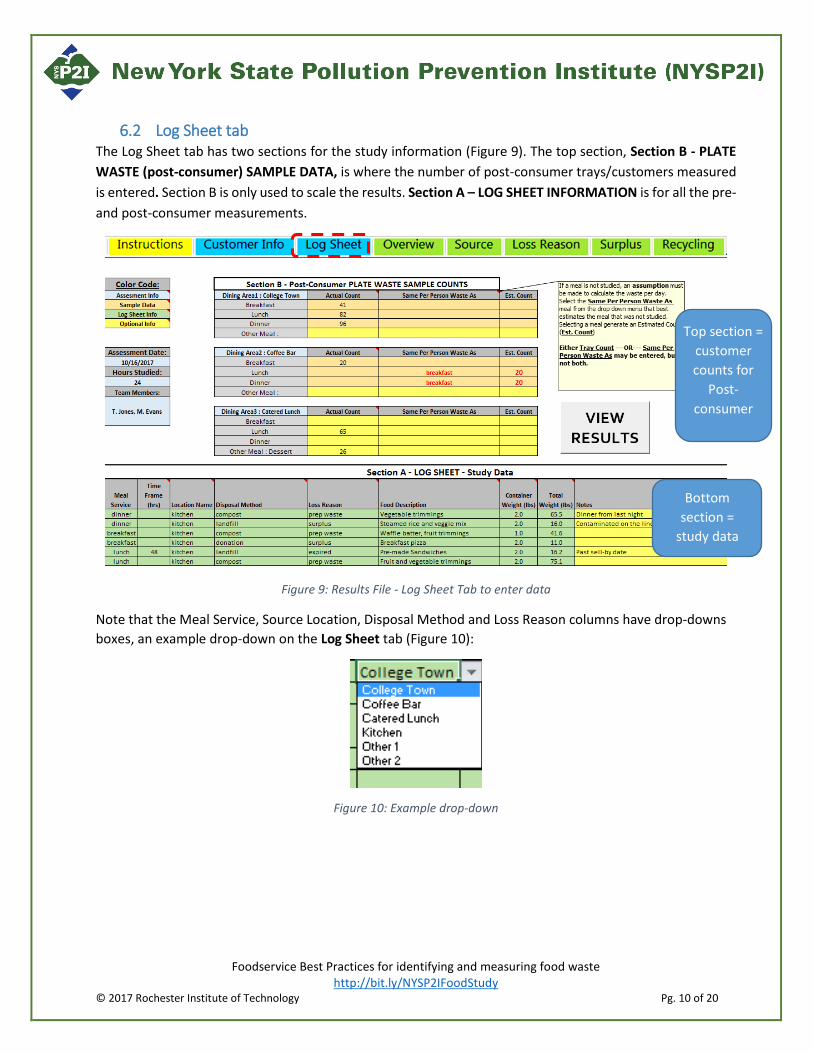
6.2 Log Sheet tab The Log Sheet tab has two sections for the study information (Figure 9). The top section, Section B - PLATE WASTE (post-consumer) SAMPLE DATA, is where the number of post-consumer trays/customers measured is entered. Section B is only used to scale the results. Section A – LOG SHEET INFORMATION is for all the pre- and post-consumer measurements.
Figure 9: Results File - Log Sheet Tab to enter data
Note that the Meal Service, Source Location, Disposal Method and Loss Reason columns have drop-downs boxes, an example drop-down on the Log Sheet tab (Figure 10):
Figure 10: Example drop-down
Bottom section =
study data
Top section = customer counts for
Post-consumer
Foodservice Best Practices for identifying and measuring food waste http://bit.ly/NYSP2IFoodStudy
© 2017 Rochester Institute of Technology Pg. 11 of 20
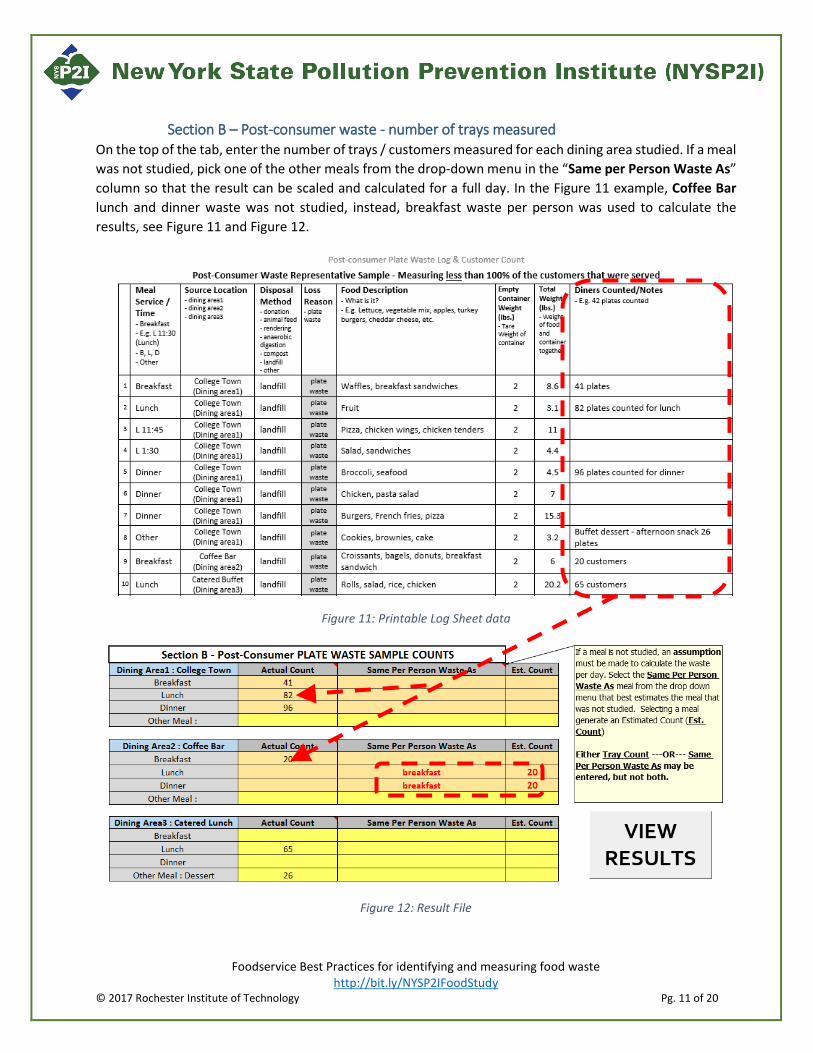
Section B – Post-consumer waste - number of trays measured On the top of the tab, enter the number of trays / customers measured for each dining area studied. If a meal was not studied, pick one of the other meals from the drop-down menu in the “Same per Person Waste As” column so that the result can be scaled and calculated for a full day. In the Figure 11 example, Coffee Bar lunch and dinner waste was not studied, instead, breakfast waste per person was used to calculate the results, see Figure 11 and Figure 12.
Figure 11: Printable Log Sheet data
Figure 12: Result File
Foodservice Best Practices for identifying and measuring food waste http://bit.ly/NYSP2IFoodStudy
© 2017 Rochester Institute of Technology Pg. 12 of 20
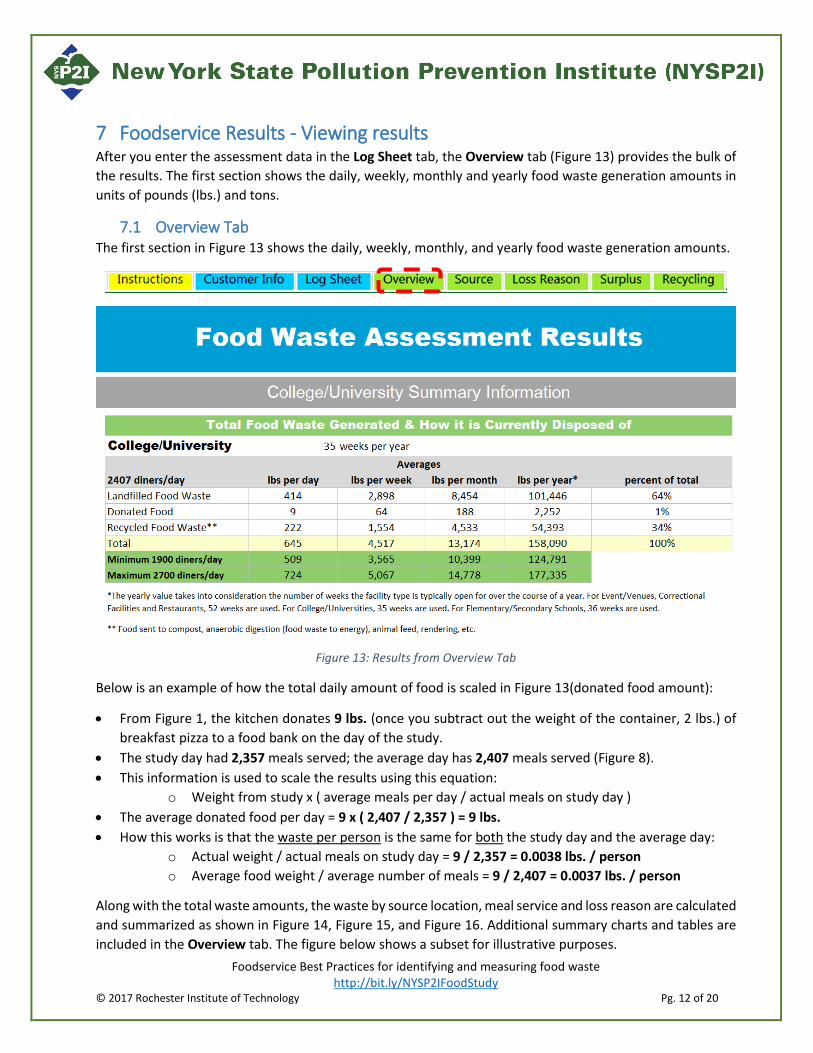
7 Foodservice Results - Viewing results After you enter the assessment data in the Log Sheet tab, the Overview tab (Figure 13) provides the bulk of the results. The first section shows the daily, weekly, monthly and yearly food waste generation amounts in units of pounds (lbs.) and tons.
7.1 Overview Tab The first section in Figure 13 shows the daily, weekly, monthly, and yearly food waste generation amounts.
Figure 13: Results from Overview Tab
Below is an example of how the total daily amount of food is scaled in Figure 13(donated food amount):
• From Figure 1, the kitchen donates 9 lbs. (once you subtract out the weight of the container, 2 lbs.) of breakfast pizza to a food bank on the day of the study.
• The study day had 2,357 meals served; the average day has 2,407 meals served (Figure 8). • This information is used to scale the results using this equation:
o Weight from study x ( average meals per day / actual meals on study day ) • The average donated food per day = 9 x ( 2,407 / 2,357 ) = 9 lbs. • How this works is that the waste per person is the same for both the study day and the average day:
o Actual weight / actual meals on study day = 9 / 2,357 = 0.0038 lbs. / person o Average food weight / average number of meals = 9 / 2,407 = 0.0037 lbs. / person
Along with the total waste amounts, the waste by source location, meal service and loss reason are calculated and summarized as shown in Figure 14, Figure 15, and Figure 16. Additional summary charts and tables are included in the Overview tab. The figure below shows a subset for illustrative purposes.

Foodservice Best Practices for identifying and measuring food waste http://bit.ly/NYSP2IFoodStudy
© 2017 Rochester Institute of Technology Pg. 13 of 20
Figure 14: Waste by source location
Figure 15: Waste by loss reason
Foodservice Best Practices for identifying and measuring food waste http://bit.ly/NYSP2IFoodStudy
© 2017 Rochester Institute of Technology Pg. 14 of 20
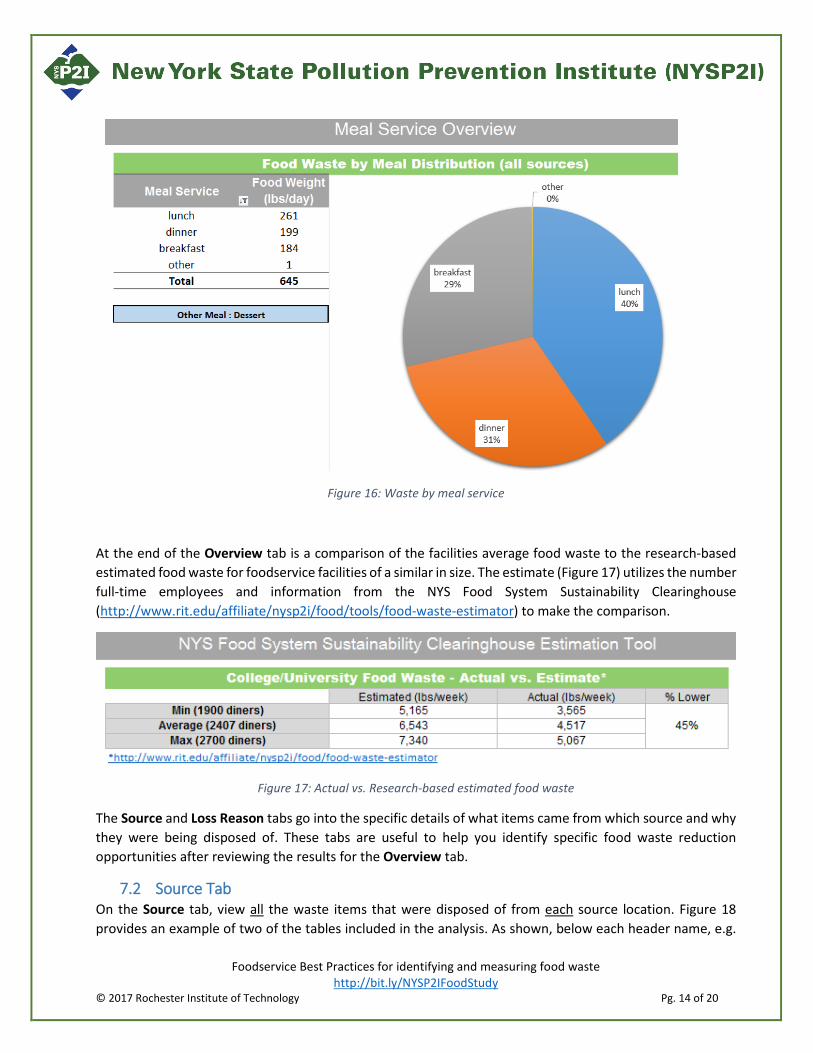
Figure 16: Waste by meal service
At the end of the Overview tab is a comparison of the facilities average food waste to the research-based estimated food waste for foodservice facilities of a similar in size. The estimate (Figure 17) utilizes the number full-time employees and information from the NYS Food System Sustainability Clearinghouse (http://www.rit.edu/affiliate/nysp2i/food/tools/food-waste-estimator) to make the comparison.
Figure 17: Actual vs. Research-based estimated food waste
The Source and Loss Reason tabs go into the specific details of what items came from which source and why they were being disposed of. These tabs are useful to help you identify specific food waste reduction opportunities after reviewing the results for the Overview tab.
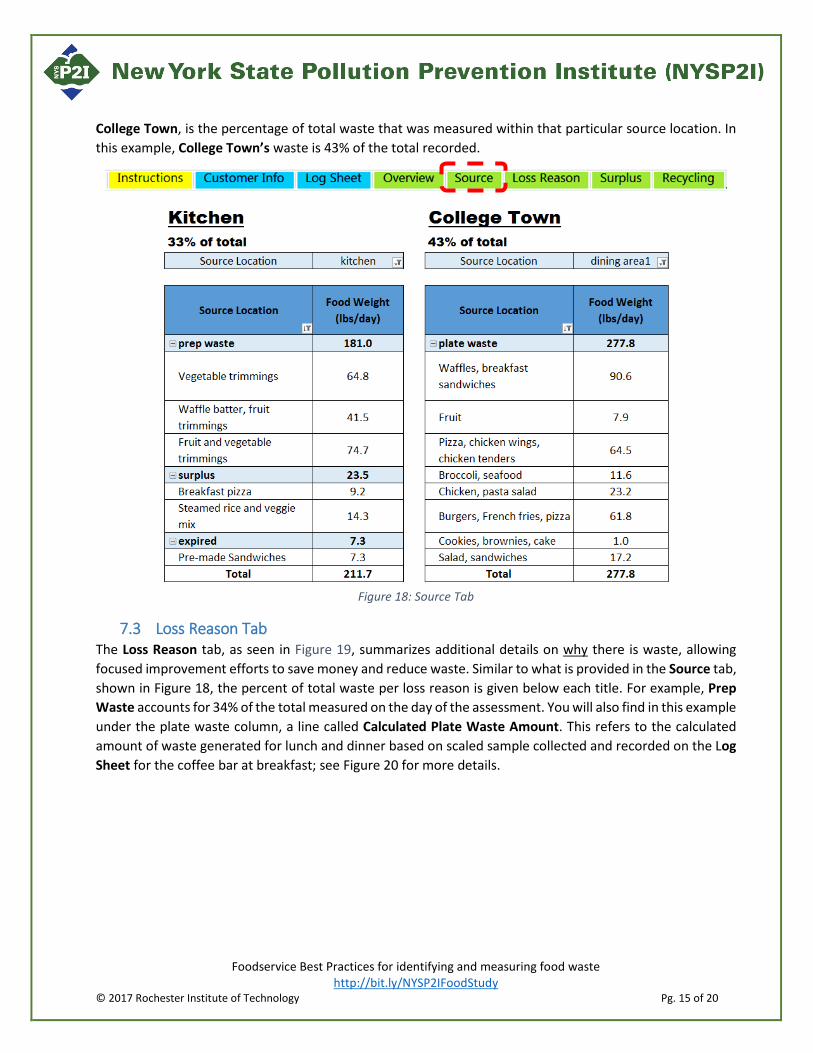
7.2 Source Tab On the Source tab, view all the waste items that were disposed of from each source location. Figure 18 provides an example of two of the tables included in the analysis. As shown, below each header name, e.g.
Foodservice Best Practices for identifying and measuring food waste http://bit.ly/NYSP2IFoodStudy
© 2017 Rochester Institute of Technology Pg. 15 of 20
College Town, is the percentage of total waste that was measured within that particular source location. In this example, College Town’s waste is 43% of the total recorded.
Figure 18: Source Tab
7.3 Loss Reason Tab The Loss Reason tab, as seen in Figure 19, summarizes additional details on why there is waste, allowing focused improvement efforts to save money and reduce waste. Similar to what is provided in the Source tab, shown in Figure 18, the percent of total waste per loss reason is given below each title. For example, Prep Waste accounts for 34% of the total measured on the day of the assessment. You will also find in this example under the plate waste column, a line called Calculated Plate Waste Amount. This refers to the calculated amount of waste generated for lunch and dinner based on scaled sample collected and recorded on the Log Sheet for the coffee bar at breakfast; see Figure 20 for more details.

Foodservice Best Practices for identifying and measuring food waste http://bit.ly/NYSP2IFoodStudy
© 2017 Rochester Institute of Technology Pg. 16 of 20
Figure 19: Loss Reason Tab
Figure 20: Calculated plate waste amount source information
Foodservice Best Practices for identifying and measuring food waste http://bit.ly/NYSP2IFoodStudy
© 2017 Rochester Institute of Technology Pg. 17 of 20
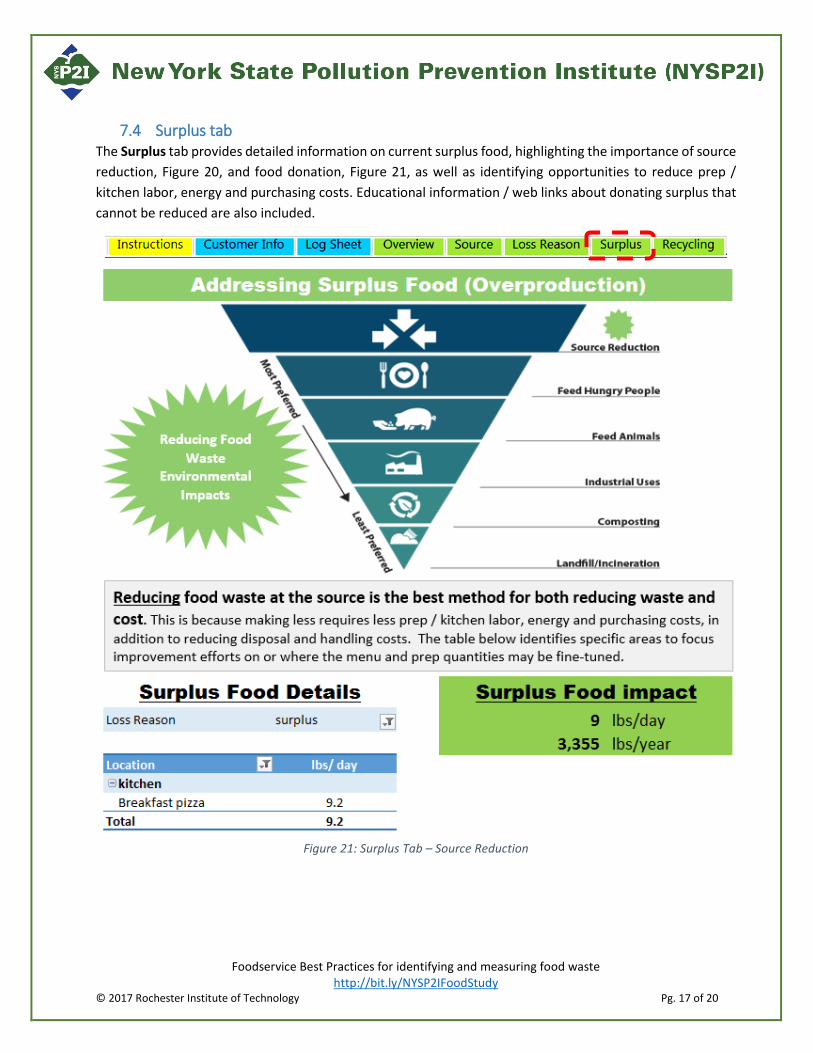
7.4 Surplus tab The Surplus tab provides detailed information on current surplus food, highlighting the importance of source reduction, Figure 20, and food donation, Figure 21, as well as identifying opportunities to reduce prep / kitchen labor, energy and purchasing costs. Educational information / web links about donating surplus that cannot be reduced are also included.
Figure 21: Surplus Tab – Source Reduction

Foodservice Best Practices for identifying and measuring food waste http://bit.ly/NYSP2IFoodStudy
© 2017 Rochester Institute of Technology Pg. 18 of 20
Figure 22: Surplus Tab - Donation
Foodservice Best Practices for identifying and measuring food waste http://bit.ly/NYSP2IFoodStudy
© 2017 Rochester Institute of Technology Pg. 19 of 20
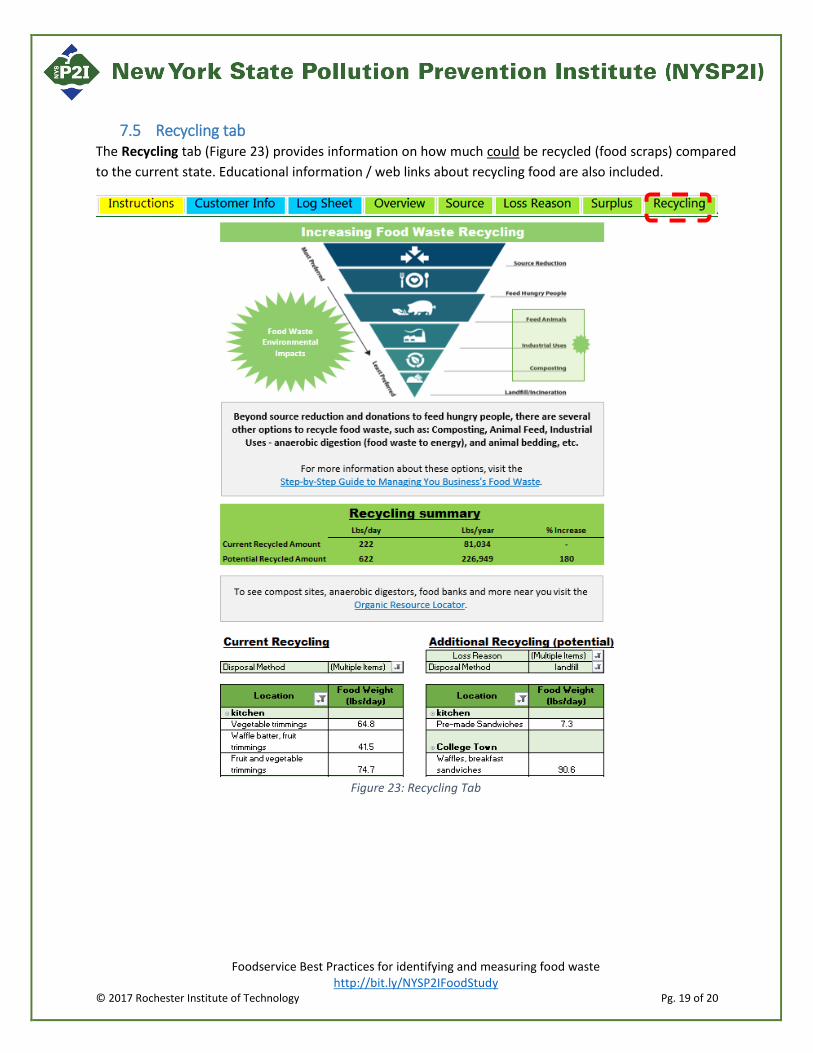
7.5 Recycling tab The Recycling tab (Figure 23) provides information on how much could be recycled (food scraps) compared to the current state. Educational information / web links about recycling food are also included.
Figure 23: Recycling Tab
Foodservice Best Practices for identifying and measuring food waste http://bit.ly/NYSP2IFoodStudy
© 2017 Rochester Institute of Technology Pg. 20 of 20
8 Conclusions and Next Steps This document provided you the best practices for conducting a food waste self-assessment at your business. An example, carried throughout, walked you through how to perform the assessment and the synergy between the systematic How-to Guide, the assessment day Log Sheet, and the Results file. All of files included in the Toolbox were put together based on hands on food waste assessment experience in your sector. NYSP2I is available to review the assessment results and identify potential areas in which to provide assistance.
Additional resources sited throughout included:
• Food System Sustainability Clearinghouse (http://bit.ly/NYSP2IFood): Hub of information and resources put together by NYSP2I to help you reduce and divert your food waste
• Self-Assessment Toolbox (http://bit.ly/NYSP2IFoodStudy): Section within the Clearinghouse where all self-assessment tools are stored, including the How-to Guide and all sector-specific (Grocers, Healthcare, and Foodservice) supporting documentation (Log Sheets, Best Practices, and Results files)
• Food Waste Estimator Tool (http://www.rit.edu/affiliate/nysp2i/food/tools/food-waste-estimator): Section of the Clearinghouse where you can estimate how much food waste in your facility based on the appropriate scaling factor.
NYSP2I assists supporting food related businesses with all pollution prevention activities (i.e. waste reduction/recovery, water conservation, etc.) in three focus areas: Outreach and Assistance, Applied Research, and continuously expanding food waste toolbox. To learn more about NYSP2I’s involvement in reducing food waste, see our Sustainable Food Program page (https://www.rit.edu/affiliate/nysp2i/food-program).
9 Funding and Acknowledgement Funding is provided by the Environmental Protection Fund as administered by the New York State Department of Environmental Conservation. Any opinions, findings, conclusions or recommendations expressed are those of Rochester Institute of Technology and its New York State Pollution Prevention Institute and do not necessarily reflect the views of the Department of Environmental Conservation.
Prepared by:
New York State Pollution Prevention Institute (NYSP2I) Rochester Institute of Technology 111 Lomb Memorial Drive Rochester, New York 14623-5608 Phone: (585) 475-4146 Fax: (585) 475-5250 Web: http://www.nysp2i.rit.edu E-mail: [email protected]