food works the programme
TRANSCRIPT

COMPIJTER VISION, GRAPHICS, AND IMAGE PROCESSING 40, 169-187 (1987)
Line Connectivity Algorithms for an Asynchronous Pyramid Computer
SHIMON EDELMAN
Department of Applied Mathematics, The Weizmann Institute of Science, Rehovot 76100, Israel
Received September 12, 1985; revised November 7, 1986
Line tracing, which has been conjectured to play an important role in the visual perception of connectivity relations, is examined in this paper from the computational point of view. The problem is formulated in terms of pixel connectivity, with thin black lines on a white background serving as input. The complexity of line tracing is discussed relative to several computation models. Two algorithms for a MIMD pyramid with running time better than linear in the line length are presented and analyzed. Their performance is discussed in view of the available psychophysical results, and compared to that of several previously published algorithms. �9 1987 Academic Press, Inc.
1. INTRODUCTION
Perception of image connectivity relations by the human visual system is both fast and accurate for most cases of everyday life. On the other hand, when given convoluted or dense line drawings, the connectivity perception mechanism performs poorly. This paper suggests a computational model of human performance in line connectivity related problems, by formulating and analyzing two distributed line tracing algorithms. The new algorithms run on a MIMD pyramid. For thin line connectivity computations they are faster than the previously published pyra- mid algorithms. More important, their performance agrees with the intuitive proper- ties of human perception, as well as with the available psychophysical data.
Consider a binary image containing a number of curves, one of which is distinguished (e.g., one of its points is marked). The task is to mark all the points (pixels) of the distinguished curve. One way to do it is by "coloring" the curve: start from the given pixel and spread the paint recursively to all the neighboring pixels that are not yet colored. When this process terminates, all the pixels connected to the start point will have been colored.
Line tracing can be applied to various real-fife tasks. For example, in character recognition making explicit the connectivity information by coloring may help the higher level recognition process to discern between adjacent letters and to extract the salient features of the individual letters (e.g., the presence of self-crossings and their position along the contour). Another example is the visual inspection of printed circuit (PC) boards or integrated circuits (ICs). A violation of minimum fine spacing rules in an IC layout may be judged insignificant if both offending lines are found to be connected to the same bonding pad.
Coloring (activation spread in a neural network) may be one of the methods employed by biological visual systems in the perception process. Ullman [1] includes line tracing by coloring in the proposed small set of visual routines involved in the perception of spatial relations such as connectivity. These routines operate on the base representation of the visual input. The base representations, corresponding to Marr 's primal sketch [2], are computed in a fast, highly parallel, bottom-up fashion.
169 0734-189X/87 $3.00
Copyright �9 1987 by Academic Press, Inc. All rights of reproduction in any form reserved.

170 SHIMON EDELMAN
The visual routines are then applied in order to extract the necessary task-specific information.
Recent psychophysical experiments by Jolicoeur et al. [3] seem to confirm the relevance of line coloring to connectivity perception. The subjects in these experi- ments were presented with a series of images, each containing several curves and two marks. Their task was to tell whether the marks lay on the same connected curve. These were the main features that characterized the measured human performance:
�9 The response time grew monotonically with the length of the line between the marks. The relevant distance involved was the length of the curve and not the angular separation between the marks in the visual field, which has been kept constant. This suggests that some kind of line tracing mechanism is responsible for the line connectivity perception.
�9 The relatively small absolute values of the response time rule out the possibility that the problem is solved by an activation spread in a single retinotopic layer of neurons [4].
The acceptability of line tracing as a candidate visual routine strongly depends on its computational properties. The objective of this paper is to show that it can be done (i) rapidly (in number of steps smaller than the number of pixels along the line) and (ii) assuming a hardware model that parallels to a reasonable extent what one may find in the human brain. The next section formulates the line connectivity problem and reviews its known computational properties. Sections 3 and 4 then present the new algorithms and the simulation results, respectively. Finally, Section 5 summarizes the work and proposes directions for future research.
2. THE LINE CONNECTIVITY PROBLEM
The following assumptions hold for the rest of the paper:
1. The input to all algorithms is represented as a square array of N • N pixels, which implies a rectangular tessellation of the input image.
2. A pixel may be white, black, colored_white and coloredblack. The white and coloredwhite pixels constitute the background.
3. The figures in the image are 4-connected (i.e., each black pixel has 4 immediate neighbors, in the directions S, N, E, and W). The pixels which are situated on the array borders consider their missing neighbors to be white.
4. The input is restricted to single-pixel-wide fines, i.e., at no place in the image there are four black or coloredblack pixels with a common corner.
The line connectivity problem is now stated and analyzed in terms of the curve tracing approach described above.
PROBLEM. Given an image consisting of one or more lines and a mark on one of them, color the marked line.
Sequential Complexity
The first hardware model considered is the yon Neumann machine. Provided that there is enough room in memory for the entire input image, the complexity of a sequential algorithm may be defined as the number of memory accesses it requires.

FIG. 1.
LINE CONNECTIVITY
:.,....:,:.......:.::,:,':: ::::
I pixel =' [ ]
An example of a line whose length is comparable to the total number of image pixe]s.
171
Consider the pattern of Fig. 1, for which the line length is comparable to the total number of pixels in the flame. Suppose there exists a correct algorithm Z that solves the problem for such an image and choose any point X inside the array. Algorithm Z cannot consistently (i.e., for all inputs) ignore the color of X and terminate without accessing it, because the "snake" that is being colored may include X as an intermediate point (i.e., the inspection of X is crucial for a correct answer to be given). For example, A and B in Fig. 1 are connected if and only if the point X is black. Since this argument applies to O(L) points of the array, it follows that any correct algorithm must examine O(L) points, where L - N 2. Sequential algorithms will therefore have running time which is linear in the line length.
Parallel Complexity
A good representative parallel (shared memory) architecture is the PRAM [5], in which a number of processors work synchronously and communicate via a common random access memory. The fastest parallel connectivity algorithm in the literature (due to Shiloach and Vishkin [6]) uses a version of PRAM in which simultaneous reading from the same location is allowed, as well as simultaneous writing. In case of a write conflict only one of the processors actually completes its write operation. The algorithm of Shiloach and Vishkin solves the connectivity problem for an undirected graph G = (V, E) in O(log n) time (here and below all logarithms are to the base 2), using 2m + n processors, where n = IV[ and m = [El. The line connectivity problem belongs therefore to the parallel complexity class NC [7]: its complexity is poly-log (a polynomial in the logarithm of the problem size), for a feasible (i.e., polynomial) number of processors.
Distributed Complexity
Within the distributed paradigm, the computation is performed by multiple concurrent processes, which may carry out private internal operations or communi- cate with other processes via message transfer (using communication channels) [4]. The number of the message-passing steps is used as the time complexity measure.
The properties of the distributed computation model seem plausible when com- pared to these of the biological visual system [22]. For a coloring-like visual task a processor may be put into a rough equivalence with a patch of a cellular membrane, or with a single neuron, or with a group of neurons acting in a correlated manner. In all these cases a useful insight into the manner by which the computation may be implemented emerges from the analogy. The computation results depend on the interprocess communications and topology no less than on the local intraprocess events.

172 SHIMON EDELMAN
Since the processor network topology determines to a large extent the perfor- mance of a distributed algorithm, it must be carefully matched to the problem at hand. To color a line in less than linear time, the network should be more compact than the rectangular planar array which represents the input image, whose diameter is 2f~-p, where Np = N 2 is the number of image pixels.
Various architectures whose diameter is logarithmic in Np have been investigated lately, with the pyramid being the most widely used in image processing [8, 9, 18, 19, 21]. The configuration adopted here is the quad T-pyramid of Tanimoto [21], with a processor at each p-node and 5 communication channels per processor. The base layer of the pyramid corresponds to the entire image and has one processor per input pixel. A base processor has communication links to each of its four immediate neighbors and to its father in the second layer. In this manner, a pyramid based on a N X N array has log N layers and a total number of -4(N2 - 1) + 1 processors. 3
The pyramidal network structure permits coloring an M x M square region of the input in O(log M) time. Previously published algorithms used this feature to achieve fast solutions for certain connectivity-related problems [19, 23]. Algorithm Pyramid-Color (designed for a SIMD pyramid) by Tanimoto "can color a relatively convex blob in O(log D) steps.. , where D is the diameter of the blob in pixels" [19]. For thin lines Pyramid-Color takes time proportional to the line length, since the size of the chunk colored at any step is determined by an AND rule (it is permitted to color a p-node only if all of its descendants are l's).
The solutions to the line connectivity problem offered by the existing algorithms fall short of the main objective of this paper, namely, the achievement of anthropo- morphic performance through the use of a biologically plausible architecture. Such an architecture is available in the form of a MIMD pyramid. New algorithms, however, must be designed to make the most of it. The key to a better utilization of the pyramid architecture for solving the line connectivity problem lies in improving the coloring decision rule of Tanimoto's algorithms. This is the approach taken by the coloring algorithms of the next section.
3. THE NEW COLORING ALGORITHMS
In order to decide whether coloring a given region would affect the original image connectivity, a special "safety" test is incorporated into the algorithm. The safety test uses a simple, local, connectivity-related image characteristic--its Euler number. The Euler number of a two-dimensional figure with C connected components and H holes (white regions contained within black ones) is defined as
N = C - H. (1)
For a discrete binary image, it is possible to compute the Euler number N using information local to each pixel--the number of its black neighbors [10]. If the binary image consists of single-pixel-wide lines, it may be considered the pictorial representation of a planar graph. Its Euler number is then easily computed, given the number of edges meeting at each vertex of the graph.
The coloring safety test checks that in the given region the Euler number N is equal to 1. If in addition to that the number of holes (closed loops) H in the region is 0, then the number of connected components is, according to (1), also equal to 1,

LINE CONNECTIVITY 173
and the region may be safely colored as a whole. The properties of the safety test are as follows:
�9 It is local in nature, staying conceptually close to the distributed model of computation, where any action at a distance is compiled into a series of local operations.
�9 It makes good use of the pyramid network architecture by exploiting the log-diameter feature of the pyramid to acquire the necessary information about the region being tested.
�9 It may be performed on the (i.e., no downward information flow
�9 The test is based on simple preattentive, thus paralleling human
entire image in a parallel, bottom-up fashion in the pyramid is required).
image features whose perception is easy and performance [2, 13].
The following lemma is used in the Euler number computation.
LEMMA. Let P denote the set of vertices for some forest, and let val(p) be the valency of a point p ~ P. Define the set of junctions Js and the set of endpoints Es as follows:
Js = ( p ~ P{val(p) > 2},
Es = ( p ~ elval(p) = 1).
Let IEs{ = E. Then the number of trees in the forest is:
E - Y'~ ( v a l ( p ) - 2 ) N = pEJs
2 (2)
Various proofs of (2) may be found in [4, 11, 12]. The coloring safety test uses the following
COROLLARY. If the right-hand side of (2) in a region that does not contain closed loops yields N = 1, then this region may be safely colored as a whole (without descending to the single-pixel level).
The only limitation to the use of this corollary for region checking in real images is posed by the demand that the figure should be acyclic (a forest). This causes a test for loops to be added to the coloring safety criteria.
The first coloring algorithm to be presented is MAC-1 (for maximum square coloring). The algorithm has two phases which may partially overlap in time. In the first phase each intermediate node in the pyramid is assigned status as a result of a bottom-up computation. The status is OK on two conditions: first, all four of the node's sons must be OK; second, the basis of the subpyramid that has the node as its apex must contain at most one connected component. If the conditions (which constitute the coloring safety check) are not fulfilled, the status is bad. The status of any black processor in the bottom layer is always OK.
The test for one connected component (OK-check) is carried out by counting the number of terminators, junctions and Ll-points (defined as the intersections be-

174 SHIMON EDELMAN
tween the figure lines and the two straight segments connecting the midpoints of the region's opposite sides, see Fig. 3). Counting the LI-points serves to detect cycles in the figure. Effectively, it permits using the Euler number as the basis for the OK-check.
As soon as a processor has computed its status, it is ready to participate in the second phase of MAC-1. In this phase the marked pixel at the bottom initiates the activation by sending a message upwards. The message continues to ascend while the status of the nodes it encounters is OK. At the first bad one it turns back down and descends one level, returning to the last (highest) node that is OK. All the pixels in the base of that node's subpyramid are then colored. On the borders of the colored region new black pixels are activated by their neighbors and the activation spreads concurrently from each of them.
The detailed description of Algorithm MAC-1 uses the following naming conven- tions: a processor is called a node if it is in the bottom layer of the pyralnid and a pnode otherwise. The pyramid's apex is linked to a special processor, the root. The algorithm uses three kinds of messages (compute status, white, pt) for the OK-check, and two more kinds (request_to_color, color) for the activation. In addition, special message-passing is done for termination detection. Some of the messages (e.g., pt) serve as "envelopes" for several parameters, which are values passed together with the message name (see [4, Appendix B] for the full Concurrent Prolog program).
The clauses of Algorithm MAC-1 in the following description are grouped by the logical order of the activation process, rather than by process name (which would probably look more formal, at the expense of presentation clarity).
ALGORITHM MAC-1.
1. The root of the pyramid commands the bottom nodes to start the status computation by sending down a compute_status message. This message is replicat- ed at each pnode and relayed down, until a copy of it reaches every node.
2. Once a black node gets compute_status, it computes the number of its black neighbors (by performing a neighbor poll) and sends up a p t message, carrying that number and the node's coordinates. White nodes respond to com- pute s ta tu s by sending up a white message.
3. The pnodes wait until responses are available on all four "down" links, then compute their status, using the following three criteria. A pnode is OK iff
(a) All its children are OK. (b) The Euler number N = (E - S ) / 2 of the image in the base of the
subpyramid whose root is the pnode in question is equal to 0 or 1. (c) The number of LI-points in the subpyramid base is less than or equal
to 1.
4. As soon as the marked node replies to computestatus (this event signifies the end of its role in the first phase), it starts the activation by sending up a request_ to_color. The color spreads therefore concurrently with the status compu- tation, lagging behind it by at least one step; this guarantees that the two phases are spatially disjoint and that any pnode that receives the request_tocolor, will have completed by then its status computation.
LINE CONNECTIVITY 175
5. The reques t to_color ascends until it arrives at a bad pnode. There it is returned one level down, finding thus the highest pnode on its path that is OK. That pnode then responds by telling all its subordinate nodes to color themselves (by sending down the color message, which is replicated and relayed down at each level, until it reaches the base).
6. The root keeps track of the activation progress in order to detect its termination (the algorithm for termination detection will be described separately below). When it decides to terminate the run, the root broadcasts down a message to that effect.
7. When a node receives a color message, it colors itself and informs its neighbors. Each one of the neighbors that has not been colored yet initiates a new activation as if it is the first marked node, by sending up a reques t to_color (refer to step 5 above to follow the progress of the new request_to_color).
8. Any pnode or node that receives the termination command relayed from the root goes to sleep. If another image is to be processed, then the termination command should clear the pnodes ' status and make each node input a new pixel.
MA C-1 - - Correctness
Claim. Given an instance of the line connectivity problem, MAC-1 will have, upon termination, colored (i) all the pixels connected to the marked one and (it) none of the others.
Part (it) of the correctness claim stems from the validity of the coloring safety test (region OK-ness) incorporated in the algorithm. Consider this part first. Let Q be a square region of the image, which is a result of a quadtree-like recursive subdivision [16], and pnode(Q)--the process at the apex of the subpyramid whose base is Q. Let Q1 through Q4 be the four quadrants of Q. It is shown first that if Q is OK then it contains at most one connected set of pixels.
If Q is wholly white, the claim is trivial. Otherwise, suppose, in contradiction to the claim, that Q is OK and the number of connected components in it is more than one. Then, since by requirement (b) of the safety test the Euler number of Q is equal to 1, there must be a closed loop present somewhere in Q.
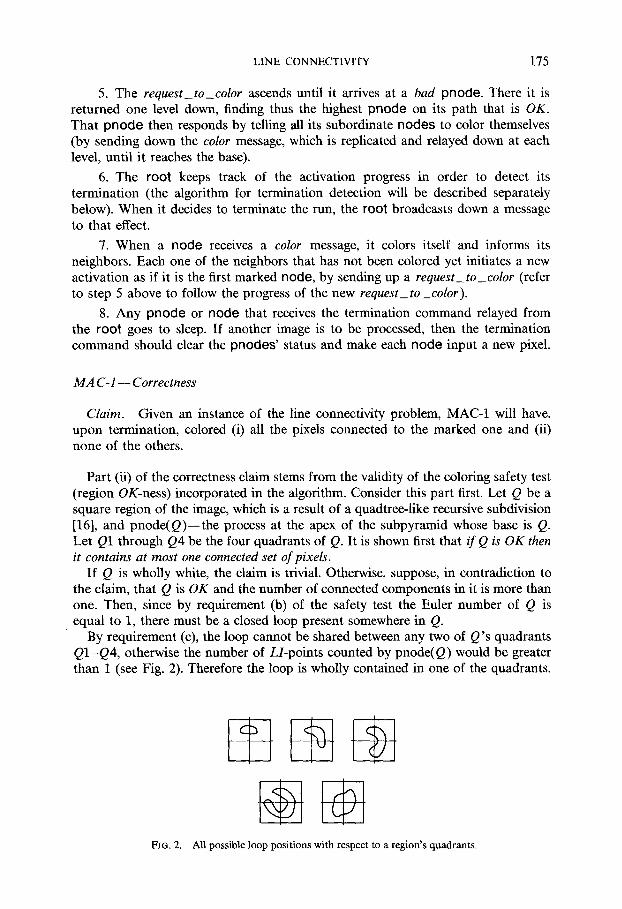
By requirement (c), the loop cannot be shared between any two of Q's quadrants Q1-Q4, otherwise the number of LI-points counted by pnode(Q) would be greater than 1 (see Fig. 2). Therefore the loop is wholly contained in one of the quadrants.
c2 c a v <y
L-J
FIG. 2. All possible loop positions with respect to a region's quadrants.

176 SHIMON EDELMAN
(,) I
FIO. 3. A region with one connected component which is rejected by the loop check of Algorithm MAC-1.
Now, divide that quadrant recursively into four, stopping when the number of LI-points for the subdivision exceeds 1. This is bound to happen, since the finest possible division is dictated by the pixel size, and any loop's dimensions are at least 3 x 3 pixels. The region for which L I > 1 is, by requirement (c), bad, and so must be the original Q, by the recursive requirement (a), a contradiction. The validity of the OK-check is therefore established.
Note that the other direction of the validity claim, saying that pnode(Q) is OK if Q contains at most one connected component, is false. The reason for this is that requirement (c) rules out declaring regions like in Fig. 3 as OK, despite there being only one connected component in these regions. This is the price of correctness of the OK-check. As will be shown below, this is also the part of the check that may be sacrificed in order to trade a nonzero error probability for speed.
Now that it is established that no region with two disconnected components will ever be OK (and therefore that only the pixels connected to the marked one will become colored), part (i) of the correctness claim remains to be shown (i.e., that all of the marked figure will be colored upon termination). This may fail to happen only if a black pixel which has a colored (or for that purpose, marked) neighbor does not get colored itself. But this situation is excluded by step 7 of the algorithm. This completes the correctness argument for Algorithm MAC-1.
A Psychological Aside
It is interesting to consider the psychophysical aspect of the use of Euler number to characterize image connectivity. It is computed by counting perceptually "con- spicuous" points of the image, like line terminators and junctions. Choosing these points to represent the image in a connectivity-related sense looks particularly good in light of Julesz' empirical results on the role of terminators in preattentive perception of line textures [13]. Experiments by Julesz have shown that textures with different number of terminators in the micropattern are easily discriminable. On the other hand, textures with identical number of terminators and different number of connected components are indistinguishable (in spite of their different power spectra). This result suggests that a simple terminator counting (and not a connect- ed-components algorithm) is applied in this case by the human visual system, in parallel over a large area. Consequently, a simpler version of Algorithm MAC-1 may be devised, which does not incorporate the loop check.
ALGORITHM MAC-2. If one is prepared to take the risk that the algorithm will err once in a while, a faster algorithm, MAC-2, may be obtained to solve the line

LINE CONNECTIVITY 177
connectivity problem, simply by modifying the OK-check to skip counting the LI-points. The new algorithm differs from MAC-1 in its Step 3 (pnode status computation):
3. A pnodo is OK iff (a) All four of its children are OK; (b) Either the Euler number of the image in the base of the subpyramid,
N = (E - S ) /2 , is equal to 1, or the base is wholly white and N = 0.
Note that condition (b) above differs from the corresponding one in Algorithm MAC-l, where N = 0 is acceptable without any reservations. The purpose of this change is to reduce the number of input configurations which cause MAC-2 to err, by compromising between the strict OK-check of MAC-1 and the "liberal" ap- proach of just giving up the LI-count. MAC-2 achieves a considerably improved average running time by changing the pattern of maximal OK-regions, with the general tendency of increasing these regions' average size.
MA C-1 and MA C-2-- Complexity
It is difficult to characterize a universe of inputs to the coloring algorithms that is well justified statistically, therefore only the most general formulas are derived below. The level of the analysis is such that there is no need to distinguish between Algorithms MAC-1 and MAC-2 (that distinction is meaningful when the statistics of the input are known and one may compute the size of the average OK-region for the two algorithms). This section estimates the running time of the algorithms and identifies the parameters influencing it.
The time is divided into two overlapping periods, the first being the strictly bottom-up OK-check and the second--the activation itself. The first period, Tok, cannot last longer than log N units, where N is the side length of the pyramid base. The second period is a sum of one or more intervals, in each of which a sub-pyramid is found OK by the advancing activation, and is colored. Each such interval lasts the time it takes a message to ascend from the bottom to the highest pnode that is OK and to come back down. If the entire pyramid is OK, there is only one activation interval, and the activation time Tac t is 2 log N. The total time is in this case max{ Tok, Tac t }, which is 2 log N. This is the best possible performance, dictated by the pyramid diameter.
Generally, Tok will always be smaller than Tac t and the latter will be equal (for nonbranching segments) to
Zact(Pa ) = ~ (21ogM/+ 1), (3) i=1
where { 54i } is the bag (multiset) of the sizes of maximal square regions that have been found OK and colored. The constant contribution of 1 time unit in (3) is due to the communication between a newly colored node and its neighbors to find potential continuation nodes (step 7 in the algorithm).
Several definitions are due before a similar formula is derived for branching curves. Define a A-path as a path which starts from a bottom node, strictly ascends, then strictly descends to another bottom node. The highest point of a A-path is

178 SHIMON EDELMAN
called its apex. The length of the concatenation of two A-paths is defined as the sum of the path lengths plus one. Let OK-path designate a concatenation of A-paths that pass through OK-pnodes only (at most once through any given pnode), and whose apices are always on the highest OK-pnodes in the sense of Algorithm MAC-1. Finally, define the function splok(Pi, pj) as the length of the shortest OK-path between the nodes Pi andpj, splok: P • P -0 N, where P is the set of image pixels, and IN is the set of natural numbers. For a pyramid with base size N • N whose root is OK, Vi, j .splok(pi, py ) = 21ogN. Generally, the running time of the algorithms is
Va~t(pg ) = max splok(Pi, pj). (4) Pj~P-{Pi}
Note that while in the best case the performance of the algorithms is logarithmic in the line length, the worst case is linear. This happens when the maximal OK-square size is smaller than 4 everywhere in the image (as in Fig. 1, for example).
MA C-1 and MA C-2-- Termination
This section describes the algorithm used by MAC-1 and MAC-2 to detect termination of the coloring process. The technique is similar to that of [14] (other possible termination detection methods, more suitable for a biological network, are also discussed below). According to this technique, the pyramid root keeps count of the continuation points that arise after each new square is colored. Having decided that no new continuation points will ever report for the current image, the root sends down a message informing all the pnodes and nodes that the computation may be started for the next image frame. The termination detection algorithm has the following properties:
1. For any input image, the root will decide eventually to terminate the computation (deadlock freedom);
2. no activation will ever be terminated while there is still at least one black node which has a colored neighbor (safety).
Here is a more detailed description of the termination detection algorithm:
ALGORITI-IM TD.
1. root's program: (a) At the beginning of a new image coloring, root holds the number 2 in a
register named " P o i n t s t o g o . " (b) Each time a notify_root(v) message is received, the (possibly negative)
parameter value v is added to Points_to_go. (c) As soon as the contents of this register become equal to 0, termination is
declared and an appropriate message, end, is sent down. 2. pnode 's program:
(a) Each pnode receives and stores the number of potential continuation points, cp, associated with its subpyramid's base, as a by-product of the OK-check computation (see [4, Appendix B] for details).
(b) If a pnode Q turns out to be thehighest OK one in an activation process, it sends up a message notify_root(cp(Q) - 2).

LINE CONNECTIVITY 179
(c) If that number is 0, there is no need to send any notification at all. (d) If two activation fronts meet at a p n o d e (quenching), that p n o d e sends up
the message noti fyroot(-1), to inform the root that one endpoint less should be counted.
3. node ' s program: (a) If a n o d e turns out to be the highest OK one in an activation, it behaves
exactly like a pnode in such situation.
The termination proof uses the common method of showing that each basic program step causes a strict descent of a chosen variable in a well-founded domain. In addition, it relies on the input image property described by (2). Proof details may be found in [4].
A termination detection method that involves precise arithmetic (like the one described above) does not fit well in the context of biological networks. Other methods are available, if one is willing to pay the price in hardware complexity. Consider, for example, a pyramid augmented with a direct link from each node to the root. A n o d e sends a message on its root-link each time it performs any action. The root listens on all the links, and declares termination if no message has been received on any of them for a given period of time At. Such a scheme demands a maximum root valency of 106 for a 1000 x 1000 image. This number is too high at least by an order of magnitude even for a neuron. Introducing a layer of intermediate processors between the root and the bottom n o d e s makes the termination detection network more plausible. Each of these processors is connected to a thousand n o d e s below, and to the root above. As a trade-off, the wait period At becomes longer.
4. SIMULATION RESULTS
This section contains an overview of the statistical performance data of three coloring algorithms, MAC-l, MAC-2, and PC. The last one is a naive pixel-by-pixel coloring algorithm which runs on a planar array of processors instead of a pyramid (algorithm Flat-Color of [19]). The source of the data is a simulation program written in Lisp for a Symbolics Lisp Machine (see [4, Appendix C]).
Six different tests have been made in order to clarify the dependence of running times of MAC-1 and MAC-2 on the relevant image parameters. In each test except the last a single parameter was varied while all the rest were kept constant. In the last test the program was run on a series of uppercase letters from the Latin alphabet (see Fig. 4).
The test figures were produced by a line-drawing algorithm which accepted as its input the values of several relevant shape parameters. The lines consisted of a number of straight segments, and the drawing proceeded by deciding at the end of each segment in which direction to advance and whether to branch; in case of a branch, the algorithm was applied recursively with a smaller maximum length value. Input image size was 128 X 128 pixels.
The drawing algorithm permitted the top-level program to create a variety of test patterns to the specifications of the main parameters. Here are the most important performance features (the details are in [4, Chap. 5]):
1. The speedup per given line length of the MAC algorithms relative to PC increases with line spacing, and decreases with growing turn /branch probabilities.

180 SHIMON EDELMAN
FIG. 4.
I 2 5
[ ~ FAH
OL I
4 5 6
The six test patterns for which the performance statistics were computed.
For lines which are about 120 pixels long and not too convoluted a speedup factor of = 10 is common.
2. Algorithm MAC-2 is always faster than MAC-l, sometimes by as much as a factor of 10.
3. The performance of MAC-2 is roughly invariant under image scaling (see Fig. 5).
This last property of MAC-2 may be derived theoretically as follows. Consider a rectangular spiral pattern P1, on a certain scale. Denote by M x the average OK-square size of P1, and by L1 its length in pixels. Then the running time T 1 of MAC-2 for P1 is on the order of (L1/M1)log M 1. For a second spiral P2, related to P1 by a factor of similarity k, the numbers for MAC-2 are M 2 = kM1, L 2 = k L x ,
and T 2 = (L2/M2)log M 2 = (L1/M1)log k M v Note that it is incorrect to assume for MAC-/ a simple scaling of M under a similarity transformation, because of the LI-check. The running time ratio of MAC-2 for two similar spirals is therefore
T 2 log k M 1 log k - - - 1 + - - . (5)
T t log M 1 log M 1
For example, if M 1 = 32 and k = 2 then T2/T 1 = 1.2. The growth of the running time of MAC-2 with the scale factor, as exhibited in Eq. (5), is logarithmic, which is indeed slow compared to the linear dependency of the running time of Algorithm PC on scale.
5O0
500 E_ F- 200
iO0
,
50 I00 Spiral Side Length (pixels)
Running Times O-MACI, o-MAC2, o-PC
O3
2
0 o 50 IO0
Spiral Side Length (pixels) Speedup vs. PC
o-MAC1, o- MAC2
FIG. 5. Running time vs scale for a spiral figure.

LINE CONNECTIVITY
TABLE 1 Running Times of the Coloring Algorithms for a Selection of Character Shapes
181
Letter MAC-2 MAC-1 PC
F 14.0 94.4 170.2 A 52.0 159.8 287.7 H 14.0 92.8 170.2 O 52.0 203.9 397.2 L 14.0 74.2 167.2 I 14.0 14.0 120.0
l i T I-IF
(a) (b)
FIG. 6. Two similar letter configurations, one of which, (a), causes Algorithm MAC-2 to fail.
In the letter-coloring test, several Latin characters, drawn as combinations of straight line segments (because of the 4-neighborhood convention of the imple- mented algorithms), were subjected to coloring by MAC-l , MAC-2, and PC. The motivat ion for this test pattern came from the possible application of the curve tracing process to character recognition.
The results appear in Table 1. Note that MAC-2 achieved the fastest possible running time (21og128 - 14) in most cases. The letters "A" and "O , " b o t h w i t h Euler number equal to 0, were the exceptions which had to be colored in four chunks, as expected from the OK-check of MAC-2.
The figures whose Euler number is 0 sometimes cause Algorithms MAC-2 to fail. Consider the letters "AI ," juxtaposed like in Fig. 6a. Clearly, the entire frame is OK since its Euler number is 1. MAC-2 would therefore color the two letters together, as if they were connected. On the other hand, were the letters situated like in Fig. 6b, they would be discerned correctly. This example shows the sensitivity of the error probabil i ty of MAC-2 to figure position within the image frame.
5. DISCUSSION AND SUMMARY
Extension to Thick Line Coloring
The techniques developed so far in this paper can be applied to the more general case of thick lines. The problem with the straightforward application of Euler number based algorithms to images where the maximum line thickness is some W > 1 lies in finding a method for identifying efficiently the endpoints and
junctions. Two complementary approaches to making the line width uniform suggest
themselves. The first is to perform some kind of parallel thinning of the image, as a

182 SHIMON EDELMAN
preprocessing step. Although connectivity-preserving parallel thinning algorithms exist [15], they are mostly good in applications where the main consideration is the number of connected components, rather than their spatial relationships. This is because the (desired) result of thinning a complex blob is often a single point. The second approach (thickening) counts the number of black pixels in neighborhoods of fixed size and replaces each region having a black majority by a wholly black one. This method is inappropriate, since it will almost surely cause changes in image connectivity.
To facilitate endpoint and junction detection in a thick-line image, its quadtree representation [16] may be constructed as a preprocessing step. The idea is to build a quadtree over the image and to consider the graph G whose vertices are the black leaves, and whose edges are defined by the leaf neighborhood relation within the image plane as the input to the coloring algorithms. Although MAC-1 would be too slow given such an input, MAC-2 may be used without any modification. The advantages of building G on top of a quadtree are:
1. Neither the set of black pixels comprising the image, nor its white background are altered. The connectivity of the image, as well as its natural endpoints and junctions, may be preserved by careful consideration of all black leaf neighbor configurations possible in a quadtree.
2. Distributed quadtree building on a pyramid machine is easy. It may be done by a bottom-up preprocessing in logarithmic time.
3. The subsequent algorithms may deal with "pixels" of different sizes in a uniform way. The atomic image pixels which are incorporated into the quadtree (because they are the maximal uniform-color squares in their neighborhood) continue to be represented by bottom-layer nodes. Square black regions of larger size, on the other hand, are assigned to intermediate pnodes.
A distributed algorithm that finds pairs of neighboring black leaves in a quadtree appears in [14]. Once the black neighbor pairs are computed, the problem remains to find a convention that will disambiguate situations such as Fig. 7, where there are several small leaves adjacent to a bigger one. Small cycles introduced into G by such adjacencies tend to slow down the subsequent coloring and to distort the natural
(a) (b ~ . ~ ~ ~de le te
{c) (d)
FIG. 7. (a, b) Possible adjacent black leaf configurations in a quadtree. (c,d) Action of Algorithm Quad on the black leaves.
LINE CONNECTIVITY 183
placing of terminators and junctions of the image. It is important therefore that these cycles are eliminated. A possible solution is:
1. For case of Fig. 7a, where the sizes of the small blocks decrease strictly with the traversal of the big block's side--the largest and the smallest blocks are assigned one neighbor each, while the intermediate sequence blocks are thought of as having two neighbors each (all these in addition to whatever out-of-the-sequence neighbors the blocks may possess).
2. For case of Fig. 7b, where the smallest sequence members are adjacent to each other--the count is as above, except that the smallest blocks' mutual adjacency is ignored.
The emerging preprocessing algorithm is outlined below:
ALGORITHM QUAD.
1. Build the quadtree.
2. For each quadtree node: (a) Link to the smallest neighbor greater than itself. (b) Link to all equals to the South and East.
3. Remove the northernmost side of each triangular or quadrilateral cycle of unit size (i.e., a cycle whose vertices are immediate neighbors in the image plane). This decreases the number of cycles, while preserving the original graph vertices and connectivity.
4. Optionally, unit length "dead ends" may be discarded to reduce branching.
The time overhead introduced by Algorithm Quad is shown in [4] to be O(log N). Algorithm Quad succeeds in substituting a sparse graph for the original image in
a fast connectivity-preserving fashion; its quadtree-building stage, however, is complicated. The same preprocessing objective may be achieved in a simpler manner. Consider the thick line image, overlaid with a grid whose cell size is equivalent to a pixel. Define a grid skeleton to be the graph whose vertices are the black pixel "centers," and which has an edge between any two vertices that are 4-neighbors.
Clearly, the grid skeleton G of any binary blob is its connectivity-preserving representation. In order to color a grid skeleton efficiently, one must first get rid of all the pixel-sized "local" cycles (see Fig. 8). This may be done by removing the northern edge from every unit cycle ("collapsing" southwards), to obtain the grid skeleton's comb tree set C. To see that collapsing preserves connectivity, consider the set E of G's southernmost edges (i.e., the edges that are not the northern component of any unit cycle). Since the set E, as well as the vertex set of the grid skeleton, is invariant under collapsing, it is clear that if there existed a path between v 1 and v 2 for any vl, v 2 ~ G, there still would be a path between v I and v 2 in C.
Collapsing may be performed in an asynchronous distributed way, provided that a horizontal edge is removed iff both its endpoints have southward edges (see Fig. 8). Because of this possibility, the overhead introduced as the result of comb tree-growing is constant (independent of the image parameters).
Algorithm MAC-2 may now be applied to the resulting comb tree C, with a slight modification Of the OK-check, to prevent rejecting regions because of the dense

184 SHIMON EDELMAN
FIG. 8.
Ca)
It, (b}
A grid skeleton and its spanmng comb tree.
parallel lines present in C. This may be done conveniently by starting the check on a sufficiently large scale (= W), since on the small scale the Euler number would reflect the fine structure of the line, instead of the local connectivity of the figure. Alternatively, on the southern border of any square under consideration, the number of runs of E-points should be counted instead of the number of individual E-points. The runs must be separated by at least twice the pixel size, and every run of size R should be counted as an (R - 2)-ply J-point (junction).
Comparing M A C-1 with M A C-2
The difference between the two candidate coloring algorithms lies in the check for loops in the image, which is performed by MAC-1 but not by MAC-2. Algorithm MAC-2 can make occasional mistakes, but it is difficult to estimate the percentage of images for which the errors occur. Instead, the heuristic arguments in favor of MAC-2 are recapitulated below.
1. Processing the image with respect to several partially overlapping grids concurrently and marking a region O K only if in all the checks the Euler number satisfies N = ( E - S ) / 2 ~ {0, 1} may reduce the error probability of MAC-2.
2. The slowdown of MAC-1 at almost any bend in the boundary being activated runs contrary to the intuition that in human vision the line spacing that affects activation speed should be measured in the direction locally normal to the line itself.
3. The LI-check that distinguishes the two algorithms is different in its nature from the rest of OK-hess criteria. It involves more than a simple terminator counting, and, although being easy to perform on a general-purpose processor, the LI-check seems less appropriate in human perception.
Speed
The speedup of the MAC algorithms in comparison with the naive Algorithm PC achieves the goal of a better-than-linear performance for thin lines. With the letter coloring test (Table 1) as an example, it may be seen that even the slower MAC-1 is about twice as fast as PC. The speedup of MAC-2 ranges between -- 5 and = 30. This is the order-of-magnitude speedup that is needed if one wishes to approach (in a qualitative way) the human performance.

LINE CONNECTIVITY 185
Computation Model Aspects
The coloring algorithms rely on a distributed MIMD pyramid machine architec- ture. This architecture should be much more appealing for vision than both the sequential and the parallel (shared memory) ones.
Any intraprocessor operation in the MAC algorithms (arithmetics and basic- list-processing) may be performed by a handful of hard-wired logic gates. The interprocessor messages need a small number of bits that encode the message name and the point count, and in addition to that an O(log N)-bit number that encodes the coordinates of the points communicated by the message. This relatively high message bandwidth may be accounted for, if one permits here a trade-off between the bit complexity of the messages and the huge number ( - 105) of afferent signals possible for a neuron.
An important property by which a distributed algorithm may be judged is the extent of its dependence on processor identity. All the parallel connectivity al- gorithms and many distributed ones demand that every processor in the system should have a unique identity, coming from a totally ordered set. An example of relying on processor identity in a distributed connectivity algorithm may be found in [17], where messages are sent to distant addresses, specified by their coordinates.
The MAC algorithms use message-passing between the immediate neighbors only. Of all the processors in the pyramid, only the nodes in its basis have numerical I IDs, and the sole purpose of these is to facilitate computing the neighbor relations at the higher levels. Alternate neighbor-detection schemes may be thought of. For example, the nodes may generate and exchange random tokens before the bottom-up computation is started, to be used by the pnodes in neighbor detection. This scheme would result in an algorithm which is probabilistic in the sense that an arbitrarily small error probability may be achieved by increasing the number of bits in the random tokens.
A conceptually different alternative [20] becomes possible if the trade-off between processor identification needs and its number of connections is realized. A pnode may be directly connected to all its base-level descendants (nodes), in addition to the four immediate sons. The direct connections to the base enable the pnodes to compute their OK-status by summing the endpoint and junction node contributions over all the relevant base area. The node neighborhood relation computation becomes therefore unnecessary. The number of connections for a pnode with a Q x Q base area is proportional to Q2. This number is too big for the upper-level pnodes, but then intermediate connection stages may be introduced in a manner similar to the alternative termination detection network suggested in Section 3.
CONCLUSIONS
The main motive behind the search for fast feasible boundary activation al- gorithms has been the attempt to parallel in some sense the human performance at solving the line connectivity problem. The resulting algorithms are indeed faster than linear in line length, thus conforming to the known psychophysics of the problem. Several new psychophysical questions, suggesting further experimentation directions, are raised by the MAC algorithms. These are listed at the end of this section.

186 SHIMON EDELMAN
The method of connectivity test by terminator counting employed by the MAC algorithms seems to be relevant to areas in vision other than line coloring. Work by Julesz on fast texture discrimination [13] supports this claim. While analyzing the results of his experiments, Julesz suggested the existence of a link between the connectivity of a texture micropattern and its number of terminators. The relevance of terminator counting to connectivity, as it appears from this paper and related work, is therefore summarized as follows:
HYPOTHESIS. The computational basis of human perception of connectivity in thin figures is some kind of terminator counting.
SUMMARY
Two algorithms have been put forward whose performance varies considerably for different image types. In contrast with the previously available distributed connectivity algorithms [8, 18, 19, 23], their important features conform with what is known about the psychophysics of the problem (e.g., the average performance is better than linear in line length). Other features of the algorithms suggest further psychophysical experimentation. These are some of the possible experiments:
�9 Test the dependence of human response time on various image parameters (length of a single straight line, spacing, convolutedness, branching).
�9 Check whether the activation process spreads concurrently into all the branches of a line junction (it does in the MAC algorithms).
�9 Find out how the response time depends on the scale factor (it is effectively scale-independent in case of MAC-2).
ACKNOWLEDGMENT
The advice of Shimon Ullman during the research described in this paper, as well as his comments on its earlier draft, are gratefully acknowledged.
REFERENCES
1. S. Ullman, Visual routines, Cognition 18, 1984, 97-159. 2. D. Marr, Vision, Freeman, San Francisco, 1982. 3. P. Jolicceur, S. Ullman, and M. Mackay, Curve tracing: A possible basic operation in the perception
of spatial relations, Memory & Cognition 14 (2), 1986, 129-140. 4. S. Edelman, Fast Distributed Boundary Activation, M.Sc. thesis, Weizmann Institute of Science, June
1985. 5. J. C. WyUie, The Complexity of Parallel Computations, Ph.D. thesis, Cornell University, TR 79-387,
1979. 6. Y. Shiloach and U. Vishkin, An O(log n) parallel connectivity algorithm, J. Algorithms 3 (1), 1982,
57-67. 7. S. Cook, The classification of problems which have fast parallel algorithms, in Proceedings, FCT-83,
Lecture Notes in Computer Science Vol. 158, Springer-Verlag, New York/Berlin, pp. 78-93, 1983.
8. A. Aggarwal, A comparison of X-trees, pyramids, and related machines, in Proceedings, 25th IEEE Syrup. FOCS, Fla., Dec. 1984, pp. 89-99.
9. A. Rosenfeld, Ed., Multiresolution Image Processing and Analysis, Springer-Verlag, Berlin, 1984. 10. M. Minsky and S. Papert, Perceptions, MIT Press, Cambridge, MA, 1969. 11. W. T. Tutte, Mathematical Expositions Vol. 15, Univ. of Toronto Press, Toronto, 1966. 12. M. Henle, A Combinatorial Introduction to Topology, Freeman, San Francisco, 1979. 13. B. Julesz, The role of terminators in visual texture discrimination, in Recognition of Pattern and Form
(D. G. Albrecht, Ed.), Lecture Notes in Biomathematics Vol. 44, Springer-Verlag, Berlin, 1979.

LINE CONNECTIVITY 187
14. S. Edelman and E. Y. Shapiro, Quadtrees in concurrent prolog, in Proceedings, 1985 IEEE Conference on Parallel Processing, Chicago, Ill., Aug. 1985, pp. 544-551.
15. C. V. Kameswara Rao, P. E. Danielsson, and B. Kruse, Checking connectivity preservation properties of some types of picture processing operations, Comput. Vision, Graphics Image Process. 8, 1978, 299-309.
16. H. Samet, The quadtree and related hierarchical data structures, Comput. Surveys 16 (2), 1984, 187-260.
17. D. Nassimi and S. Sahni, Finding connected components and connected ones on a mesh-connected parallel computer, SIAM J. Comput. 9, 1980, 744-757.
18. N. Ahuja and S. Swami, Multiprocessor pyramid architectures for bottom-up image analysis, IEEE Trans. Pattern Anal. Mach. lntell. PAMI-6 (4), 1984, 463-475.
19. S. L. Tanimoto, Programming techniques for hierarchical parallel image processors, in Multicom- puters and Image Processing (K. Preston and L. Uhr, Eds.), pp. 421-427, Academic Press, New York, 1982.
20. J. A. Feldman, D. H. Ballard, C. M. Brown, and S. L. Small, Rochester Connectionist Papers: 1979-1984, Univ. of Rochester TR-124 (revised), June 1984.
21. S. L. Tanimoto, Image data structures, in Structured Computer Vision (S. Tanimoto and A. Klinger, Eds.), pp. 31-56, Academic Press, New York, 1980.
22. L. Uhr, Psychological motivation and underlying concepts, in Structured Computer Vision (S. Tanimoto and A. Klinger, Eds.), pp. 1-30, Academic Press, New York, 1980.
23. S. L. Tanimoto, Image processing with hierarchical cellular logic, in Computer Architectures for Spatially Distributed Data, Nato ASI Series F Vol. 18, pp. 279-294, Springer-Vedag, New York, 1985.