food traceability in the domestic horticulture sector in ......horticulture sector in kenya, with...
TRANSCRIPT

i
Food traceability in the domestic horticulture
sector in Kenya: An overview
Philip Chemeltorit, Yeray Saavedra, Joyce Gema
3R Research Report 003

ii
Food traceability in the domestic horticulture
sector in Kenya: An overview
June 2018
Philip Chemeltorit1, Yeray Saavedra2, Joyce Gema1,3
1 Tradecare Africa 2 Wageningen Centre for Development Innovation 3 Corresponding author: [email protected]
3R Research Report 003

iii
Philip Chemeltorit1, Yeray Saavedra2, Joyce Gema1. 2018. Food traceability in the domestic
horticulture sector in Kenya: An overview. 3R Research Report 003. 3R Kenya Project.
1 Tradecare Africa, 2 Wageningen Centre for Development Innovation
This report can be downloaded for free at http://www.3r-kenya.org/research-reports/.
All rights reserved. No part of this publication may be reproduced and/or made public, whether
by print, photocopy, microfilm or any other means, without the prior permission of the publisher
or author.

iv
Acknowledgements
The authors would like to thank the companies who have supplied information about their respective traceability systems.

v
Table of Contents Acknowledgements ............................................................................................................................... iv
List of tables ............................................................................................................................................ vi
List of figures .......................................................................................................................................... vi
Acronyms and Abbreviations ........................................................................................................... vii
Executive Summary ........................................................................................................................... viii
1 Introduction .......................................................................................................................................... 1
2 Purpose of study ................................................................................................................................... 3
3 Traceability Systems.............................................................................................................................. 3
3.1 Systems available in Kenya ........................................................................................................... 3
3.1.1 eProd ..................................................................................................................................... 3
3.1.2 Farmforce .............................................................................................................................. 5
3.1.3 National Horticulture Traceability System ............................................................................ 7
3.1.4 Manual/ paper-based system ............................................................................................... 8
3.2 Other systems not presently in use in Kenya ................................................................................ 8
3.2.1 AgriPlace ............................................................................................................................... 8
3.2.2 SourceTrace ESE™ Agri .......................................................................................................... 9
3.2.3 Farmsoft ................................................................................................................................ 9
3.2.4 IBM Blockchain .................................................................................................................... 10
4 Comparison of traceability systems .................................................................................................... 11
4.1 Cost of Implementation .............................................................................................................. 11
4.2 Comparative advantages and disadvantages ............................................................................. 11
4.3 The need for Traceability Systems in the domestic segment for Fresh Fruits and Vegetables .. 12
5 Conclusion and Recommendation ...................................................................................................... 13
References .................................................................................................................................................. 14
Annex Traceability Systems in Practice ....................................................................................................... 16
eProd ....................................................................................................................................................... 16
Horticulture Traceability System ............................................................................................................ 18

vi
List of tables Table 1: Adapted from “A guide to traceability: a practical approach to advance sustainability in Global
Value chains” (UN Global Impact, 2014) ....................................................................................................... 2
Table 2: Comparison of cost (in Euros) of implementation of systems for 5000 farmers ......................... 11
Table 3: Comparative advantages and disadvantages of eProd, FarmForce and HCD-HTS systems ......... 12
List of figures Figure 1 the appearance of eProd modules when installed in a mobile phone and computer (left), and
eProd in action (right) while integrated with Bluetooth printer (courtesy: http://www.eprod-
solutions.com) ............................................................................................................................................... 4
Figure 2 the wireless scale (left) and bluetooth printer (right) which are key in managing accurate
traceability. (Courtesy: Farmforce) ............................................................................................................... 6
Figure 3 screenshots of mobile farm journal of the android app (left) and the regulator’s web module
(right) which is to monitor all processes and retrieve reports ..................................................................... 7
Figure 4 System manager screenshot of laptop display ............................................................................. 16
Figure 5 Mobile app home display> field registration> inspection of field/farmer ................................... 16
Figure 6 Collection of produce >selection of group> farmer> produce> detail/ status of produce .......... 17
Figure 7 Barcode scanner which is integrated in the mobile app & Weather forecast SMS sent to farmers’
phones......................................................................................................................................................... 17

vii
Acronyms and Abbreviations

viii
Executive Summary Food scandals and other food safety-related incidents have accentuated the need for consumer protection.
Food quality and safety incidences can, apart from being a public health hazard, potentially cause national
and international crises in economic and marketing relations. Traceability systems play a key role in facilitating
an integrated supply chain management to ensure accountability of food safety and quality at any given point.
Traceability systems have three characteristics: identification of units/batches of all ingredients and products;
registration of information on when and where units/batches are moved or transformed, and; a system linking
these data and transferring all relevant traceability information with the product to the next stage or
processing step. Establishing and implementing a traceability system alone is not sufficient to fulfil food safety
and quality requirements in the supply chain, but it should rather be seen as a complementary tool to guide
the activities towards achieving quality and safety.
Traceability systems are currently being implemented in the Kenyan horticulture sector, even though most of
the smallholder producers do not realize that they exist or even understand the importance of traceability
implementation.
This report compares the available commercial traceability systems in Kenya (on the basis of their availability,
affordability, accessibility, adaptability) and provides options towards actors operating in the domestic
horticulture sector in Kenya, with the aim to of using traceability as a tool to stimulate investments in food
safety and quality assurance.
i. Available Commercial Traceability Systems in Kenya
Three traceability systems were found to be commercially available in Kenya including ePROD, Farm Force
and the national horticulture Traceability System.
a) ePROD
The ePROD system was launched commercially in the market in 2015 from its roots as a private system by a
chilli pepper consolidator into a commercial enterprise so far managing over 240,000 farmers across the
eastern Africa region through 64 active licenses in diverse agricultural sectors both in domestic and global
markets. The system is available to any actor in the supply chain and is installed on a PC as a license with the
option of creating cloud-based back-ups. Licensees pay an annual fee of €2,500 for up to 5,000 farmers and
€4,000 for unlimited number of farmers. ePROD allows tracking and tracing of lots from seed to the market
through creation of comprehensive farmer profiles, registration and monitoring of internal farm operations
and productivity, management of credit systems for inputs and finances as well as compliance and impact
measurement. The data which are registered in the system are owned and managed by the licensee who also
controls the kind of reports that can be extracted from the system and their accessibility.
ePROD allows for enhanced business management and employee administration to ensure reliability of data
and a farmer feedback system. The system allows for flexible configuration as well as data interoperability by
allowing other type of data like weather data, financial data to be pulled into the system. The system enables
effective communication with farmers by integrating email and SMS capabilities.
b) Farmforce
Farm force was initially developed by Syngenta Foundation in 2013 and later sold to Farmforce AS of Norway.
Farm Force software is mainly cloud based and is linked to a mobile app that allows for offline data collection.
The system is mainly tailored for horticulture. It is not clear how many licenses Farm Force has issued although
it was reported to be active within the horticultural sector in Kenya. The cost of implementing farm force is
dependent on the number of users with a one-off set up cost being €1,650 with an additional fee of €460 per
user per year.
Farmforce allows tracking of produce from farm to market through registration of individual farmers and
groups of farmers, records of internal production practices, management of harvest and tracking of produce
from farm to markets. Data stored on Farmforce are accessible anytime anywhere as the system is cloud
based. Farmforce also allows for management of most compliance standards by integrating checklists for
purposes of internal audits. Data in the system is the property of the licensee who has express access to the

ix
data and reports. The system can be used for risk management as it has the capability for notifications if
parameters that are set and recognised by the system are exceeded or approached.
c) The National Horticulture Traceability System
The National Horticulture Traceability System (HTS) was established through a project of the Horticultural
Crops Directorate of AFA (AFA-HCD) with support from USAID Kenya Agricultural Value Chain Enterprises
(KAVES) programme and is intended for improving information utilization relating to the production and
handling of fresh produce in Kenya. The HTS has not yet been commercialized as it still is in piloting phase.
For this reason, related costs have not been set yet and no insights have been drawn from the piloting.
Awareness of the HTS is only among the horticulture exporting companies. The HTS has been fitted with a
module that enables the horticultural crops directorate (HCD) to monitor and regulate the supply chain players
(farmers, consolidators, markets etc.).
Comparative costs
The full one off set up costs and first year cost of implementation of the selected traceability systems in Kenya
was found to be €37,000 for the National Horticulture Traceability System, € 39,750 for ePROD, and €49,650
for Farmforce. These costs take into account the required hardware, training and personnel supporting up to
5,000 farmers.
Other systems studied include the paper-based systems as well as those not currently available in Kenya e.g.
AgriPlace, SourceTrace, Farmsoft, and IBM Blockchain. The IBM Blockchain has recently entered the Kenyan
market through a business-to-business logistics company who works with more than 2,500 vendors of fresh
fruits and vegetables (bananas, onions, tomatoes, and potatoes). With the technology, the company is able
to efficiently offer microlending services to the vendors to boost their working capital. There is a potential for
the technology to be expanded to become a traceability system.
ii. Key Findings a) Availability
The export platform has already adapted traceability systems (manual and electronic) that provide a learning
platform for the domestic market. The most common form of traceability systems even for the export segment
are manual. These require knowledge on how to organanise documentation and record keeping at all levels of
the chain. Among the e-traceability stems, ePROD is already being used by dairy processors in the Kenya
domestic market as well as sesame consolidators in Ethiopia to manage their supply chains. The domestic
market segment for horticulture could learn from the segment that has already taken up traceability systems
how the same can be tailored for use towards the domestic market. Farm force is tailored for horticulture and
is tailored with features that enable confidence in data’s and information recorded.
b) Affordability
Manual paper abased traceability systems remain the most affordable system with regard to set up costs and
cost of maintaining the system. However, e-traceability systems enable multiple functionalities and increased
utility value of the data’s that are recorded for purposes of traceability enabling payback for the upfront and
annual investments through data interoperability and sharing capabilities. The HTS remains the most
affordable as users can access a free license and training during the pilot phase of the system and only pay
for the same once it is commercialised. The risk in this is that since it is not yet clear how the platform will
operate, producers are still in a wait and see mode. Farmforce is the most affordable system for small groups
of farmers, however, the cost quickly escalates as the number of users grow. ePROD is the most affordable
system for larger groups of farmers producing multiple crops as well as dairy. The system however requires
centralised administration to justify the upfront investment cost as well as annual licenses.
c) Accessibility
The manual paper-based traceability system remains the most accessible as capacity to implement traceability
has been built in the export market segment over time. However, its limitation is in the ability to organise
multiple actors to keep reliable data and to share the same if an issue is noted that requires traceability.

x
Within the domestic segment, paper-based traceability systems will be most unreliable when it comes to
tracking back lots that may require reliable information on origins due to the fragmentation and information
asymmetry in the supply chain. ePROD is accessible for multiple products and supply chains, allowing crowding
in by multiple traders. Farm Force is accessible for horticultural traders, as well as market actors. Both ePROD
and Farmforce operate local offices with capacity for ongoing support. Users however have to travel to Nairobi
or pay logistical costs for the implementers in the event that they are based out of Nairobi.
d) Adaptability
Manual paper-based systems are difficult to adapt especially as data are hardly aggregated and organised to
provide information for management. However, ePROD and Farmforce are both flexible allowing for data
interoperability and multiple functionality including managing credit, access to inputs and finance, standards
compliance as well as product risk management. The systems can be adapted to interlink with financial and
analytical software’s in the market.
iii. Recommendations
We make the following recommendations regarding the currently available automated systems:
eProd system is best suited for a large producer group or a firm in the value chain that intends to
improve the efficiency of the operations and would like to offer safer and higher-quality products; Farmforce, on the other hand is suitable for a smaller producer group, or even individual farmer who
wishes to simplify the management of the business and have access to more formal markets; The HTS system has not been tested sufficiently and is yet to be implemented by value chain actors
supplying the domestic market, it is very promising for uptake by the domestic sector as long as the
cost of acquisition are kept low and implementation be voluntary and driven by the supply chain.
This brief is a product from the 3R Kenya project. The 3R Kenya (Resilient, Robust, Reliable. — From Aid
to Trade) project is a learning initiative supported under the Agriculture and Food and Nutrition Security
(FNS) program of the Embassy of the Kingdom of the Netherlands. 3R Kenya seeks to assess evidence
and lessons from FNS and other related programmes that support competitive, market-led models in
spurring agricultural development. It focuses on the aquaculture, dairy and horticulture sectors. 3R Kenya
is executed at a time when Dutch government’s bilateral relations in Kenya are transitioning from a focus
on Aid to Trade to enhance the development of agri-food sectors. Through evidence generation and
stakeholder dialogue, 3R seeks to contribute to an understanding of effective conditions for sustainable
inclusive trade for transforming resilient, robust and reliable agrifood sectors.

1
1 Introduction
The need for food traceability systems dates back almost a century (UN Global Impact, 2014). In the decade
of the 1920s, the concept expanded the horizon of many European countries, which until then faced hardship
to streamline high-value food products in the market. Adding a layer of information around the origin of the
product would build consumers’ trust and would lead to an increase in trade. The concept caught on and the
sales of products such as French Champagne took off.
Over the last two decades, traceability systems have however changed their focus. Gradually, schemes moved
from guaranteeing the origin of those high-value products to ensuring product safety towards supermarkets
and more empowered consumers. Food scandals and other food safety-related incidents accentuated the need
for consumer protection. According to Bosona & Gebresenbet (2013), food quality and safety incidences can
potentially cause national and international crises in economic and marketing relations; and Kenya’s
horticultural exports have been affected on several incidences because of phytosanitary-related interceptions
with a total of 51 interceptions in 20171, 31 being on fruits and vegetables.
The evolution of global food safety standards as well as local realities have played a key role in the Kenyan
horticulture sector through collective action by producers and policymakers to influence the competitiveness
of the sector in the global economy of qualities (Ouma, 2010). A perfect example of such interventions that
are geared towards a competitive horticulture sector is the launch2 of the national horticulture traceability
system (HTS) through a public-private sector partnership.
Traceability systems are currently being implemented in the Kenyan horticulture sector, even though most of
the smallholder producers do not realize that they exist or even understand the importance of traceability
implementation. Opara (2003) defined traceability as the use of supply chain information to not only provide
assurance or guarantee to the stakeholders (especially the consumer) on the origin, location and life history
of a product but also to assist in the management of arising issues such as breach of food safety and product
quality. In essence, a traceability system is therefore a setup that facilitates an integrated supply chain
management to ensure accountability of food safety and quality at any given point.
According to Gichure et al. (2016), the success of implementing traceability is mainly attributed to good
organization and personnel perception; and so, does food safety management. These are facilitated by proper
documentation (record keeping), compliance to quality management standards, capacity building on food
quality & safety and traceability management, as well as proper monitoring of the quality management system.
In the recent years, blockchain technology has become very popular especially as a tool for assuring
traceability and transparency (Jeppsson & Olsson, 2017). Even though blockchain technology was initially
developed for the financial sector, the technology has found an application in the food supply chain as a
traceability system. Tian (2016) describes a traceability system based on RFID (Radio Frequency
Identification) and the blockchain technology to address the food safety concerns in China, while other reports
have shown how traceability using blockchain has strengthened tuna fishing by curbing illegal fishing (Visser
& Hanich, 2017). With the Kenyan government setting up a taskforce3 to investigate the blockchain technology
and its applicability in Kenya, the horticulture sector should brace itself to the reality of this technology as tool
for origins and food safety assurance.
1 https://ec.europa.eu/food/sites/food/files/plant/docs/ph_biosec_europhyt-interceptions-2017_summary.pdf 2 https://www.agricultureauthority.go.ke/kenya-government-launches-system-to-track-horticultural-products/ 3 http://www.president.go.ke/2018/02/27/technology-will-be-major-driver-for-big-four-plan-president-kenyatta-says/;
https://www.businessdailyafrica.com/markets/marketnews/hurdles-benefits-of-bitcoins-set-for-rollout-/3815534-4322268-uflil9z/index.html
Traceability is defined as the ability to discern, identify and follow the movement of a food or substance intended to be or expected to be incorporated into a food, through all stages of production, processing
and distribution (FAO, 2017 – Food Traceability Guidance)

2
The role of Traceability in Food Safety and Quality Assurance
Traceability improves the ability to trace a contaminated food product back to source. It involves the ability
to locate, so-called tracking, a product through the stages and operations involved in the manufacture,
processing, distribution and handling of feed and food, from primary production to consumption.
In this context traceability identifies and documents each food business operator, its immediate supplier(s),
and its immediate customer(s), except when the customers are final consumers.
According to FSA (2002), the basic characteristics of traceability systems are:
- identification of units/batches of all ingredients and products;
- registration of information on when and where units/batches are moved or transformed;
- a system linking these data and transferring all relevant traceability information with the product to
the next stage or processing step.
This ‘one-step-back-one-step-forward’ principle does not only help to ensure food quality & safety, but also
can be seen as an evidence of good business practice or a tool to ensure the sustainability of raw materials;
just to name a few “values” – see Table 1.
Table 1: Adapted from “A guide to traceability: a practical approach to advance sustainability in Global Value chains” (UN Global Impact, 2014)
Values and Efficiencies 1. Risk reduction
2. Efficiency of operations and consistency of processes
3. Securing supply (and value) chains
4. Selection of suppliers and maintenance of relationship with them
5. Benefits of good reputation
Stakeholder Pressure 6. Fulfilling stakeholder’s demands for more product information
7. Ensuring that sustainability claims are true
Regulation 8. Meeting legal requirements
Global Alignment 9. Expectations, processes and systems are standardized
10. Natural resources are secured and sustained
As emerges from Table 1, the implementation of traceability systems cuts across various value chain levels
and the public/private divide.
Establishing and implementing a traceability system alone is not sufficient to fulfil food safety and quality
requirements in the supply chain, but it should be seen as a complementary tool to guide the activities towards
achieving quality and safety (Bosona & Gebresenbet, 2013).
Traceability in practice: planning for food quality & safety in low & middle-income countries
Traceability poses many challenges, however. If the main aim is protecting consumers against hazardous
products, the question then arises on how to:
- Trace each and every step in the journey of a given product;
- Coordinate with different supply chain actors;
- Collect data in a way that best adapts to the different actors;
- Ensure that small-scale food producers implement costly, yet valuable traceability systems;
- Monitor the value chain for food quality & safety issues.
Reconciling the opportunities that traceability systems offer with their challenges in a given context is of
utmost importance. In the industrialised countries, traceability systems are for the most part integrated into
general business thinking and respond to the existing regulatory and non-regulatory environment. In the so-
called low-income countries, contextual challenges are at the forefront. Food traceability systems have been

3
inherently linked to export commodities and designed to better cater for the needs of the actors placed largely
at the end of the chain. Traceability systems in domestic value chains are however rare.
The value and importance of traceability systems dilute as the food systems become more fragmented and
populated by resource-poor actors. In Kenya, food products destined to export markets often count with some
systematic system of tracking and tracing the product back to its source. The trend reverses when food items
are meant to reach the domestic market. Whether it is local fresh produce destined to the open market or to
higher-end market segments, traceability systems are not a common (business) practice, nor is there currently
a demand by consumers nor supermarkets or be a legal requirement.
As a tool for food safety and quality assurance, traceability has its own limitations. Bosona & Gebresenbet
(2013) noted that developing and implementing a traceability system for a local (short) food supply chain is
not easy, citing an example of barcoding a fruit being sold in the street market and even the resistance by
some actors in the supply chain. Lack of information about traceability systems and insufficient knowledge or
skills (Jeppsson & Olsson, 2017) to implement them is a huge limitation in Kenya. Even with the little available
information or data, there is lack of adequate standardized data and means of data and information exchange
(Bosona & Gebresenbet, 2013) between the various actors in the supply chain as well as between the various
traceability systems. For a traceability system to effectively provide food safety and quality assurance, it is
paramount that; all player commits and participate actively, information and data is shared freely, and there
should be value for money so that there is a return on the investment.
2 Purpose of study
The general objective of this study was to carry out a desk review of the available traceability systems, and
to identify the best options for the domestic horticulture supply chain in Kenya with the aim to provide food
safety and quality assurance.
3 Traceability Systems
The common denominator of the models (systems) available is the functionality to meet the needs of a variety
of actors that operate in complex environments; small-scale producers, value chain actors, food safety-minded
consumers, governments, NGOs, and other interested stakeholders. Of the various needs, food safety is the
most critical as far as this study is concerned.
3.1 Systems available in Kenya
3.1.1 eProd Website: http://www.eprod-solutions.com
In a demonstration of demand-driven innovation and necessity being the mother of invention, eProd was born
in Kenya by a chili pepper consolidator who was frustrated by the complexity of manually managing thousands
of smallholder farmers and complying with the high standard requirements of the export market. Because of
its initial success, eProd began expanding successfully to address the needs of various sectors and business
models leading to its commercialization in 2015. eProd has since issued 64 active licenses to traders
consolidating agriproducts from more than 240,000 farmers of 18 value chains in more than 5 countries,
including Kenya. eProd’s Managing Director, Almut van Casteren4 praised the system as a transparent solution
to work even with middlemen/brokers and empower them, because the system provides transparency of all
the actors in the supply chain. Food safety assurance can be enhanced by this empowerment because even
middlemen are recognized as key players in the supply chain.
The eProd license is purchased and renewed on an annual basis depending on the number of farmers in the
portfolio of the trader/consolidator, who is the licensee. The license fees cover installation, data backup, and
training for 2 months. There are two types of licenses;
4 Interview with Philip Chemeltorit (Tradecare Africa) on 23/11/2017

4
a) Up to 5,000 farmers (suppliers): € 2,500 per year
b) Unlimited number of farmers: € 4,000 per year
Figure 1 the appearance of eProd modules when installed in a mobile phone and computer (left), and eProd in action (right) while
integrated with Bluetooth printer (courtesy: http://www.eprod-solutions.com)
Once the license is purchased, the licensee gets a program installed on a computer, as well as an unlimited
number of android apps installed on smartphones of the field/extension staff. The system admin (using the
computer-based program) is able to set field staff user functions, assign farmers to field staff, transfer farmers
between field staff and/or groups, monitor field staff/groups/farmers, generate various reports etc. The data
collected by the system is stored in the cloud (virtual servers) and backed up in physical servers as well as on
the administrator’s computer.
Product traceability in eProd entails assigning of traceability codes (such as seed lots) which can be managed
throughout the value and supply chains. This can be integrated with certification systems (e.g. GlobalGAP,
ISO9000, ISO22000 etc.) and support compliance with these standards, thus providing further food safety
assurance.
Some of the notable functional features of eProd are;
a) Creation of comprehensive farmer profiles
Including GPS location and photos for easy referencing
Ability to manage contracts with individual farmers and groups for multiple products & grades
Integrated farmer field information
Capacity to evaluate and assess credit worthiness of farmers
View training profiles of farmers, thus identify gaps and further actions to be taken
b) Improving the productivity of farmers through;
Monitoring of field activities to enable better planning
Managing input distribution and product aggregation
Managing and tracking trainings to support certifications
Design of collection routes to optimize efficiency
Enabling traceability and quality-based payments
Provision of production advice through SMS messaging
c) Management of finances and farmer transactions
Quickly adjust pricing in response to market volatility
Use individual and group incentives to promote quality and cooperation
Provide flexibility in payment methods, including mobile payments
Automate repayments for inputs and advances

5
d) eProd supports monitoring & evaluation (M&E) activities because it;
Enables measurement of impact
Promotes trust and transparency
Ensures that reporting data is accurate and accessible
e) Enhanced business management and employees administration because eProd; -
Ensures reliability and accessibility of data
Improves decision-making and planning
Monitors the efficiency of field/extension staff
Promotes trust and transparency to farmers, customers, and other stakeholders
Reinforces the professionalism of your business and reporting
Gathers feedback through farmer surveys
f) Flexible System Configurations
Ability to collect field data through the mobile app both off- and online
API (application programming interface) integrations for flawless communication and connection
with other software (e.g. financial software, weather data) and hardware (e.g. lactoscan, moisture
meter, digital weighing equipment, etc.)
g) Effective communication
Communicate easily and effectively with farmers and employees using integrated email and SMS
Create reports to share with farmers and other interested parties. The reports are exportable to
editable and readable formats such as .XLS, .CSV etc.
3.1.2 Farmforce Website: http://www.farmforce.com
Farmforce was initially developed by the Syngenta Foundation in 2013 but was later sold to the current owner,
Farmforce AS based in Oslo - Norway, who commercialized the system. Farmforce was developed as an
innovative solution to the myriad of challenges facing aggregators and farmers of crop produce. The system
is available in many developing countries of Africa, South America, and Asia where smallholder farming is
prevalent. To enhance usability, Farmforce is available in 11 languages; English, French, Spanish, Portuguese,
Indonesian, Indian, Vietnamese, Thai, Turkish, Chinese, and Swahili.
In their own words at http://www.farmforce.com/en, “Farmforce is a Software-as-a-Service solution that
simplifies the management of small-holder farmers, increases traceability and enables access to formal
markets. It is used to efficiently manage out grower schemes and contract farming programs”. From this
description, Farmforce stands out as an integrated system for not only managing product traceability but also
the field/extension officers and farmers. According to Faith Kamenchu5, Farmforce’s project manager, the
system is mainly designed for crop value chains and has been seen to manage crop production (yield focus),
ensuring traceability and food quality & safety, as well as linking farmers to markets.
The Farmforce platform is mainly cloud-based meaning that all information is stored in virtual servers. The
main user (admin or data manager) uses a browser-based web interface to manage all collected data, generate
reports, set and manage users and functions. Other users (field officers or extension agents) use an android
app which is compatible with all android devices (low-end to high-end mobile phones as well as tablets) to
collect all manner of data on the producers/farmers, farm inputs, and the operations carried out from land
preparation to postharvest handling.
The mobile app works both online and offline and thus can collect data in an offline mode so that whenever
an internet connection is available, the data is uploaded and synchronized with the cloud server. The data
collected is sharable with authorized users and thus provide the much-needed information for gaps to be
closed and improvement points.
The Farmforce mobile application is integrated with a wireless (Bluetooth) weight scale to enable easy, error-
free recording of harvested yields as well as a Bluetooth printer.
5 Interview with Philip Chemeltorit (Tradecare Africa) on 29/11/2017

6
Figure 2 the wireless scale (left) and bluetooth printer (right) which are key in managing accurate traceability. (Courtesy:
Farmforce)
The cost of acquiring and using Farmforce is as follows:
a) A one-off setup fee; €1600 – includes setting up the systems, training and technical support for 3
months.
b) Subscription fee (annual); €442 per user per year. Mainly counting the field officers (mobile apps),
free data manager/admin (payable if more than one).
c) Additional cost for travel & accommodation of the Farmforce staff where applicable.
In summary, the functional uses of Farmforce are;
a) Efficiently manage a group of many smallholder farms and farmers
Record the physical location, shape & size of fields
Log and track farming activities, products, staff and equipment
Organize many farmers into a growing campaign for a certain quantity by a specific date
Predefine growing protocols that farmers need to follow
Automatically inform staff of the recommended dosage of seeds, fertilizer and chemicals to be
used
b) Improve transparency and reduce the risk of fraud
Enable “anytime/anywhere” access to the most recent information such as crop cycles, growing
activities, input usage, yields forecast etc.
Add photos and GPS to provide additional certainty
c) Enable field-to-market traceability
Scan and integrate open-standard GS1 barcodes on harvest collections with external reader in
addition to camera phone
Assign batch tracking numbers to harvests; merge (group), split (sort), track movements, trace
which farmers/fields contributed to a harvest
Generate traceability reports comprising data on farmers, fields, inputs related to a harvest
collection
Manage and track buyers by recording details of who purchases harvest collections
Integrate a wireless weight scale so that the weight of harvests can be automatically recorded
d) Ensure compliance with global food safety and sustainability standards (e.g. GlobalGAP)
Access predefined compliance and standards checklists
Benefit from updates to checklists which automatically integrate new or modified rules
Receive an immediate compliance score via built-in-self-assessments
Share assessment results with certification bodies, clients and other interested parties
Set up real-time alerts to inform field staff if a farmer performs an action that would threaten
compliance – for example if a farmer is applying too much of a chemical or harvesting before it
is safe to do so.

7
3.1.3 National Horticulture Traceability System Website: https://traceability.agricultureauthority.go.ke
The National Horticulture Traceability System (HTS) was established through a project of the Horticultural
Crops Directorate of AFA (AFA-HCD) with support from USAID Kenya Agricultural Value Chain Enterprises
(KAVES) programme whose aim was improving information (utilization) relating to the production and handling
of fresh produce in Kenya (TraceSoft Limited, 2016). The project output was a national electronic traceability
system capable of linking data in the fresh produce supply chain from production, logistics, processing, and
distribution to local and international markets.
Figure 3 screenshots of mobile farm journal of the android app (left) and the regulator’s web module (right) which is to monitor
all processes and retrieve reports
HTS includes an android mobile application (available on Play Store) which has an inbuilt printing software
and a barcode scanner as well as a web portal to perform administrator functions such as managing users,
monitoring data/information, and accessing reports. The web portal also has a regulator’s module, to enable
HCD to monitor and regulate the operator and farmers registered under them.
The HTS system is still under piloting and thus not yet commercialized. The plan for commercialization entails
interested parties procuring the software and signing a service level agreement with a service provider for
HTS software components and support. The service level agreement will stipulate the annual fees to be paid
by each export firm for the software based on number of farms and number of users. The annual cost to the
exporter will be inclusive of server hosting infrastructure and software upgrades.
In order to attain traceability, the system has the following functional components;
a) Produce source registration & identification

8
All commercial locations (farms, collection hubs, pack houses) that grow,
aggregate and process horticulture products are registered in a single
master register. This prevents the assignment of more than one identifier
to a given location
Officially allocating and identifying locations with a unique
Location/Premises Identification Number (LIN)
b) Produce tracing
Products are uniquely identified and their movements/events traced from
farm through distribution channels to destination.
Tracking is done in private and national Horticulture Tracking Database
(HTD) using standard data fields and data transfer.
c) Produce labelling
All information recorded about the origin of the product is printed out and
placed on packaging materials and can be accessed by trading partners or
consumers.
The labels have QR code which contains the information of the product
thus facilitating instant retrieval of origin data.
3.1.4 Manual/ paper-based system Most of the horticultural exporters, consolidators, and a small part of the domestic market players in Kenya
are still using the paper-based systems to manage their traceability and certification compliance (where
applicable). These are mainly guided by the quality management systems (QMS) or internal control systems
(ICS), which define the forms and procedures to be used for each process and situation.
Although manual traceability systems are relatively cheap (consultant fees & design costs) and without annual
subscription, the amount of time, manpower, and resources required to implement them is rather tedious,
efficiency and effectiveness are also not guaranteed.
With all traceability systems being limited by inadequate standardized data and data exchange (Bosona &
Gebresenbet, 2013), the case is worse for paper-based systems because data management and retrieval in
this case is very tedious. The data recorded or collected on paper have no other use and the system does not
allow for payback through other data utility value such as interoperability, and neither can such data be
analysed unless the same are digitized and coded, which is far much more tedious.
3.2 Other systems not presently in use in Kenya
3.2.1 AgriPlace Website: https://www.agriplace.com
AgriPlace is a centralized platform owned by AgriPlace which is based in Amsterdam, Netherlands. The platform
links certification players (farmers, auditors, standard owners, and food companies) to make compliance easy.
AgriPlace utilizes smart data management from field to fork, re-using and reducing efforts for multiple
certificates and makes the auditing process more efficient by minimizing repetition.
Although AgriPlace is not in essence a traceability system, the platform collects data which can be utilized to
provide traceability, especially in a paper-based system. This is because AgriPlace relies on evidences of
compliance to standards such as AH protocol, BRC, EU BIO, Field to Fork, GlobalGAP and thus is a digital
checklist. Some benefits of the platform are;
a) Management of certifications in one place
All documentation is easily stored on the platform, with a safe cloud copy that can be accessed
from any device anywhere
A clear overview of all certificates and their status.
Structured certification (inspections) thus saving time and resources.
b) Easy data collection and sharing
Documents and pictures are easily uploaded for compliance criteria to provide evidence and
auto answer most of the questionnaires.

9
Assessments are guided by help texts, easy formats and automated decision trees and the
assessment and evidence can be shared directly with interested parties.
AgriPlace has just been introduced in Kenya, and because a local partner is yet to be identified, the system
has so far not been launched. The platform is offered at € 17 per month (no additional charges), and one can
obtain a 30-day free trial (demo).
3.2.2 SourceTrace ESE™ Agri Website: http://www.sourcetrace.com/farm-traceability/
SourceTrace is a farm traceability software (FTS) designed for any agribusiness value chain and is owned by
SourceTrace Systems whose corporate headquarters is in Massachusetts (USA) with other offices in Costa
Rica, India, and Bangladesh. The company specializes in agriculture software mobile applications designed for
developing economies with a primary focus on sustainable agriculture and empowerment of smallholder
farmers.
SourceTrace has two main components, viz; -
a) Mobile application for field/extension agents
Able to record transaction on field
Works both online and offline
Can generate on spot print for each transaction
QR code enabled application for eTraceability of inputs and produce
Records each activity which is then sent directly to the web server application
b) Desktop web access for management and central operations
Compiles data from all the field mobiles as collected and submitted by the field agents
Retrieval of real time reports & charts as well as advanced analytical reports
Very useful for decision making
Effectively able to undertake corrective action plan
Provides a view of the entire business operation at a glance
The traceability system has several functions, among them;
Farmer enrolment to capture information directly from smallholder farmers and other providers on
the field hence a unified and up-to-date farmer database. This includes the profile of the smallholder
farmer, family group, farms and crops and uses GPS technology and photos to trace the source of
goods.
Geo plotting of crop area and crop monitoring module is the perfect way to record field visits allowing
to capture photos and notes on each visit.
An input distribution module which enables the efficient distribution of inputs such as Fertilizers,
Seeds, Pesticides and other inputs.
The system has an inbuilt certification module with ready-to-use templates which facilitates the
digitization of Internal Control System (ICS) to support internal inspections, farmers training, and
certification process.
3.2.3 Farmsoft Website: https://www.farmsoft.com/4/farm-software.html
Farmsoft is developed and supported by Tenacious Systems Limited based in New York (USA). The company
specializes in technological solutions to farm management and fresh produce business management including
food processing & traceability, food manufacturing, cool store management, quality control, inventory and
more.
With Farmsoft Farm Software, a grower/farmer can perform recalls very quickly, with full confidence of
accuracy and reliability. It is possible to trace product both up and down the supply chain, over multiple
companies (instead of the usual one up and one down traceability). Product traceability can be done back to
a grower, area of land, crop batch/patch and all input materials and their related suppliers & batch/lot details.
Farmsoft can be integrated with other related software such as postharvest software, and also with several
10
hardware. Furthermore, the software makes compliance to standards cheaper and easier because of the
automated records, generation of reports, and assured traceability.
We have been informed that Farmsoft has an agent in Kenya, but we couldn’t get any reliable information to
be included in this paper.
3.2.4 IBM Blockchain Website: https://www.ibm.com/blockchain/supply-chain/
Blockchain, owned by IBM, is a technological innovation of digitally documenting data and verifying
transactions, agreements and contracts. It works through a decentralized approach, which links supply chain
stakeholders e.g. in a contract farming scheme to facilitate traceability and authenticity of produce; from the
farmer, the off-taker/aggregator, wholesaler, the financial service provider, to the supermarket.
The following benefits can be reaped when a horticulture supply chain is managed using blockchain;
Reduction or even elimination of possible food fraud and errors hence safer FFV
Improved inventory and supply chain management
Reduced costs that are common with tedious paper-based systems and courier services
Increased efficiency without delays that arise from paperwork
Issues are identified/diagnosed faster and thus solved effectively
Increased consumer and partner trust
(See also http://spore.cta.int/en/article/blockchains-disruptive-potential-in-acp-value-chains.html)
Just recently (April 2018), Twiga Foods (http://www.twigafoods.com) acquired the blockchain technology by
partnering with IBM to introduce a blockchain-based microlending (financing) for Kenyan food vendors6. The
business-to-business logistics company had previously linked farmers of fresh fruits and vegetables (bananas,
onions, tomatoes, and potatoes) to more than 2,500 vendors (retailers) across the Country where they
realized that the vendors’ main challenge was working capital, which limited their distribution. Although the
primary objective of this investment is to facilitate a transparent and automated lending process, the
technology may lead to transparency (and potentially traceability) of the produce distributed by the vendors
if implemented as a traceability system.
6 https://www.ibm.com/blogs/research/2018/04/ibm-twiga-foods/

11
4 Comparison of traceability systems
The 3 traceability systems already introduced in Kenya, eProd, Farmforce and HTS, are compared with regards
to costs and their relative (dis)advantages. It is expected that the other systems described will eventually
enter the Kenyan market, however currently they are no option yet for the domestic horticulture market.
4.1 Cost of Implementation An analysis of the procurement and implementation for the three-traceability system for 5,000 farmers per
year are presented in Table 2. It is our assumption that 1 technical assistant serves 200 farmers, with one
overall system (back-end) manager. We have also assumed that the implementation involves 4 training and
support sessions which are paid by the implementing organization.
Table 2: Comparison of cost (in Euros) of implementation of systems for 5000 farmers
ePROD Farmforce HTS
Category
Unit
Description
No.
of
Units
Unit
Cost
Total
Cost
(€)
No. of
Units
Unit
Cost
Total
Cost
(€)
No.
of
Units
Unit
Cost
Total
Cost
(€)
Software
Purchase &
License fees
1 2,500 2,500 1 1,600 1,600 1 0 -
Mobile app user
fees
25 10 250 25 442 11,050 25 0 -
Hardware
Laptop 1 400 400 1 400 400 1 400 400
Mobile phone 25 80 2,000 25 80 2,000 25 80 2,000
Electronic scale 25 400 10,000 25 400 10,000 25 400 10,000
Bluetooth
printer
25 160 4,000 25 160 4,000 25 160 4,000
Barcode reader 25 0 - 25 0 - 25 0 -
Set up
Costs
a) Cost of the company to come and set up
Personnel
Training
1 400 400 1 400 400 1 400 400
Travel and
Accommodation
1 400 400 1 400 400 1 400 400
b) Cost of the implementing organisation during set up
100% time for
systems
manager
12 400 4,800 12 400 4,800 12 400 4,800
25% time for 25
Technical
Assistants
@200€/month
12 1,250 15,000 12 1,250 15,000 12 1,250 15,000
Total 39,750 Total 49,650 Total 37,000
4.2 Comparative advantages and disadvantages The table below is a comparative analysis that summarizes the existing traceability systems and how suitable
they are for the Kenyan context.

12
Table 3: Comparative advantages and disadvantages of eProd, FarmForce and HCD-HTS systems
Criteria eProd Farmforce HTS
Availability Commercially Available Commercially available Not commercialized yet
(still in piloting)
Affordability Not affordable for small
groups, cost becomes
cheaper for larger groups
Cost is determined by
number of users. Affordable
for smaller groups
Cost not set yet
Acceptability Acceptable with 64
licenses issued so far
Fairly acceptable – issued
licenses undisclosed
Insights from piloting not
yet drawn
Awareness Marketing and outreach
being done with presence
in most field days and
stakeholder forums
Awareness still limited as
they do targeted marketing
Awareness only among
the exporting companies
Applicability Applicable to all value
chains
Only for horticulture value
chains
Designed for horticulture
value chains
Ability
(functionalities)
Ability to manage
contracts with individual
farmers and groups for
multiple products & grades
Application programming
interface integrations with
other software and
hardware, including (bulk)
SMS communication
Ability to automatically
inform staff of the
recommended dosage of
seeds, fertilizer and
chemicals to be used
Real-time alerts to inform
field staff if a farmer
performs an action that
would threaten compliance
Ability for HCD to monitor
and regulate the supply
chain players (farmers,
consolidators, markets
etc)
4.3 The need for Traceability Systems in the domestic segment for Fresh Fruits and
Vegetables Food safety and quality assurance is increasingly becoming popular in Kenya. The domestic horticulture supply
chain in Kenya is dominated (90%) by the wet (open-air) markets, according to our recent survey
(unpublished). 10% of trade goes through more formalised segments including supermarkets and direct
suppliers. Onyango and Kunyanga (2013), noted that among samples of sukumawiki (kales), tomatoes,
mangoes, and amaranth, collected from retail wet markets and supermarkets in Nairobi, Nakuru, and
Machakos to contain pesticide residues that were above the acceptable level set by the World Health
organization. This was attributed to the excessive and wrong use of pesticides in vegetable production and
the non-adherence to the specific pre-harvest intervals. Contamination with biotic agents was also noted and
attributed to use of unprocessed manure (slurry), sprinkling harvested produce (to keep them fresh) with
contaminated water, transportation of fresh produce in open trucks (sometimes with other non-food products).
More contamination was perceived to happen in the markets because of their open-air and wet nature or even
by people as they pass by the produce and touch them. In another study, Kibitok & Nduko (2017) sampled
prepared fruit and vegetables salads (kachumbari) from food vendors in Nakuru found 80% of the samples
tested positive for E. coli, while 70% tested positive for Salmonella. Hygienic handling, proper packaging of
the fresh produce, and selling them in marketplaces that are more organized and hygienic were recommended
measures of reducing risks of microbial contamination.
With 85% of the fresh fruits and vegetables being marketed in Nairobi County (Matui et al. 2016), the
respective county government has been struggling to enforce better governance and have recently began to
implement tighter scrutiny on the contamination of fresh produce entering its markets7. The effects of
7 https://www.standardmedia.co.ke/article/2001267198/nairobi-county-tightens-scrutiny-on-chemically-contaminated-food

13
contaminated fruits and vegetables especially by pesticide residues has been publicised by a variety of mass
media outlets including linking the same to low fertility levels in women8. The need for investment in product
governance including internal traceability of production and handling practices has been recommended as a
management and control measure.
The recent quick scan of the horticulture sector by Matui et al. (2016) reported noted possible interventions
to address food safety to include: efforts towards improving supply chain governance; promotion of social
dialogue and innovation platforms to discuss food safety; and provision of support to supply chain actors
especially on the implementation of food safety regulations. Some governance interventions are already
evident in Kenya, with the operationalization of Code of Conduct for fresh fruits and vegetables (KS 1758-
2:2016) as well as the efforts towards the launch of the national horticulture traceability system (HTS). The
continued fragmentation of the sector coupled by a lack of leading firms limit the potential of such interventions
to bear quick fruits. The quick scan however found demand for traceability, quality and safety of fresh fruits
and vegetables is being fuelled by increasing consumer awareness and public interest.
Kenya is already implementing traceability in the export segment with the dairy sector being the first domestic
segment to adopt traceability as a measure for managing milk quality (ePROD 2017). The use of traceability
in the export segment is however anchored by medium to large processors the domestic segment however is
still characterised by small to medium processors a majority of whom still operate business relations that are
short term and based on trading. While traceability is recommended as a tool of dealing with food safety and
quality concerns in the domestic segment for fresh fruits and vegetables, reliable aggregators and market
actors within the market segment that is sensitive to origins and food safety are needed to make sense of
investments.
5 Conclusion and Recommendation
The importance of food safety and quality in the Kenyan domestic sector cannot be overemphasized. The
conversation is happening at all levels. The consumers are become more aware of the same, and supply chain
actors are starting to realize the need for them to deliver on the issue because food safety and traceability is
not only consumer-driven, but investment worthy too. Increasingly, the food industry is tailoring goods and
services to the tastes and preferences of various groups of consumers in Kenya. Traceability systems help
deliver these new attributes to the consumers and are an evidence of value, especially in terms of quality
and safety of the product.
Actors in the fresh fruits and vegetables supply chains, especially businesses handling these products can
benefit greatly from having traceability systems in place. Global value chains for fruit and vegetable sourcing
from Kenya including primary producers, have developed an enormous capacity to track the flow of food along
the supply chain, which has resulted in benefits associated to lowering-costs of distribution systems or increase
of sales, to name a few. Apart from the economic incentives, traceability systems also help to ensure food
safety and product quality and can be used for recall as well as finding possible sources of non-compliance.
Unfortunately, in the domestic markets, the current food labelling and packing system cannot guarantee that
the food is safe and has a minimum standard of quality. Traceability is often a first step towards achieving
supply chain governance by ensuring that every actor plays an active role in maintaining acceptable standards
that assure the safety and quality of the produce. Traceability can thus contribute to the development of the
domestic horticulture sector into a competitive venture opening up investment opportunities for larger firms
to grow.
In this study, we have provided an overview of the traceability systems that are available in Kenya, and their
comparative advantages and disadvantages. Choosing and weighing the pros and cons of each system remains
difficult and is largely dependent on the type of chain and commodity the businesses operate in. There are a
number of systems that could potentially be deployed in Kenya with success; however, those that are available
still remain unaffordable (in our view) to many businesses.
8 https://www.standardmedia.co.ke/health/article/2001258970/chemicals-in-vegetables-fruits-linked-to-low-fertility-in-women

14
Whereas the paper-based traceability system is the cheapest option, it entails a very tedious process that
requires a lot of time, manpower (labour), and consumes a lot of paper which has environmental implications.
Also, the data recorded on paper are difficult to manage and it had no other uses. Once recorded, retrieving
any information from the data is difficult because you have to flip page by page, and the data cannot be
analysed in the available format. These reasons make paper traceability less attractive for supply chain actors
that are keen on true food safety and quality assurance and are willing to invest in systems that are more
transparent, fool-proof, and have added value in terms of data utilization and interoperability.
With regards to the currently available automated traceability systems, we make the following comments and
recommendations:
eProd is best suited for a large producer group or a firm in the value chain that intends to improve
the efficiency of the operations and would like to offer safer and higher-quality products. eProd’s
comparative advantages include;
1. Ability to manage contracts with individual farmers and groups for multiple products & grades
2. Application programming interface integrations with other software and hardware, including
(bulk) SMS communication
Farmforce, on the other hand, would work well for a smaller producer group, or even an individual
farmer that wishes to simplify the management of the business and have access to more formal
markets. Farmforce has the following capabilities;
1. Ability to automatically inform staff of the recommended dosage of seeds, fertilizer and
chemicals to be used
2. Real-time alerts to inform field staff if a farmer performs an action that would threaten
compliance
The HTS system has not been tested sufficiently yet to be implemented by value chain actors
supplying the domestic market. With the HTS system, the horticulture sector regulator (HCD) is able
to monitor and regulate the supply chain players (farmers, consolidators, markets etc). The system
is very promising for uptake by the domestic sector as long as the cost of acquisition are kept low,
and the implementation be driven by the supply chain rather than being imposed by the regulator.
In due time other systems are also expected to become available in Kenya and the business that need them
will have a wider range of choices based on the cost of implementation and the functionality of a system as
suited to their needs and operations.
References
Bosona, T. & Gebresenbet, G. (2013) Food traceability as an integral part of logistics management in food
and agricultural supply chain. Food control, 33(1), 32-48.
FAO (2017) Food Traceability Guidance. Downloaded on 18 Dec 2017 from: http://www.fao.org/3/a-
i7665e.pdf
FSA (2002) Traceability in the food chain a preliminary study. UK: Food Standard Agency. Downloaded on 20
Dec 2017 from http://www.adiveter.com/ftp_public/articulo361.pdf
Gichure, J. N., Wahome, R. G., Njage, P. M. K., Karuri, E. G., Nzuma, J. M. & Karantininis, K. (2016) Factors
influencing extent of traceability along organic fresh produce value chains: case of kale in Nairobi,
Kenya. Organic Agriculture, 1-10.
Jeppsson, A. & Olsson, O. (2017) Blockchains as a solution for traceability and transparency. Downloaded on
07 May 2018 from: https://lup.lub.lu.se/student-papers/search/publication/8919957 Kibitok, S. K., &
Nduko, J. M. (2017). Evaluation of microbial contamination of consumed fruits and vegetables salad
(Kachumbari) around Egerton University, Kenya. Journal of Food Safety and Hygiene, 2(1/2), 26-29.
Matui, M.S., Saavedra Gonzalez, Y., Gema, J. & Koomen, I. (2016) From aid to sustainable trade: driving
competitive horticulture sector development; A quick scan of the horticulture sector. Wageningen
Centre for Development Innovation, Wageningen University & Research. Report 3RKenya-16-03/CDI-
16-045. Wageningen.

15
Onyango C.M. & Kunyanga C. (2013) Evaluation of the safety of selected fruits and vegetables sold in the
domestic markets in Kenya. Consultancy report - United Nations (UN).
Opara, L. U. (2003) Traceability in agriculture and food supply chain: a review of basic concepts, technological
implications, and future prospects. Journal of Food Agriculture and Environment, 1, 101-106.
Ouma, S. (2010) Global standards, local realities: private agrifood governance and the restructuring of the
Kenyan horticulture industry. Economic Geography, 86(2), 197-222.
Tian, Feng. (2016) An agri-food supply chain traceability system for China based on RFID & blockchain
technology. Service Systems and Service Management (ICSSSM), 2016 13th International Conference
on. IEEE, 2016. Downloaded on 07 May 2018 from:
https://pdfs.semanticscholar.org/24cd/eb7d7421012c2fdd362b8e2816c105b7071f.pdf
TraceSoft Limited (2016) Business Plan for a National Horticulture Traceability System in Kenya. USAID KAVES
- Horticulture Traceability Project - Deliverable 10A
UN Global Impact (2014) A guide to Traceability - A Practical Approach to Advance Sustainability in Global
Supply Chains. Downloaded on 17 Nov 2017 from: https://www.unglobalcompact.org/library/791
Visser, C. & Hanich, Q. A. (2017) How blockchain is strengthening tuna traceability to combat illegal fishing.
Downloaded on 07 May 2018 from:
http://ro.uow.edu.au/cgi/viewcontent.cgi?article=4374&context=lhapapers

16
Annex Traceability Systems in Practice
This section presents screenshots and/or architectural designs of the available traceability systems to
demonstrate how they work in practice.
eProd
Figure 4 System manager screenshot of laptop display
Figure 5 Mobile app home display> field registration> inspection of field/farmer
17
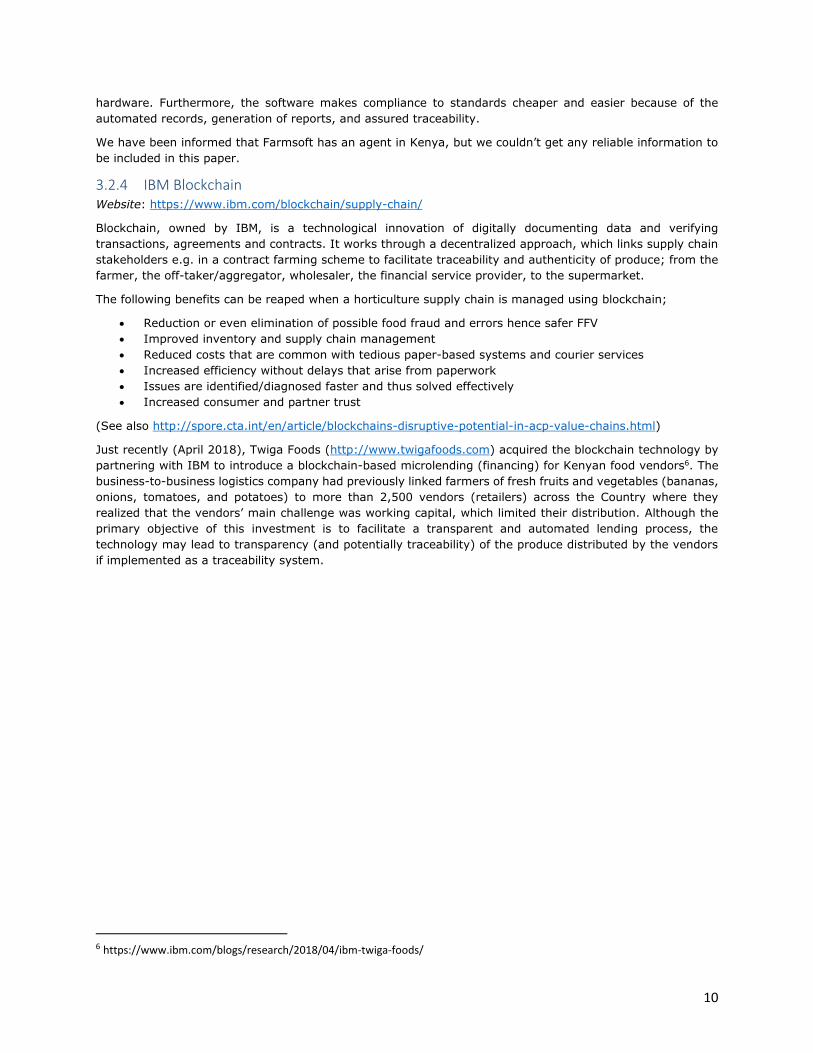
Figure 6 Collection of produce >selection of group> farmer> produce> detail/ status of produce
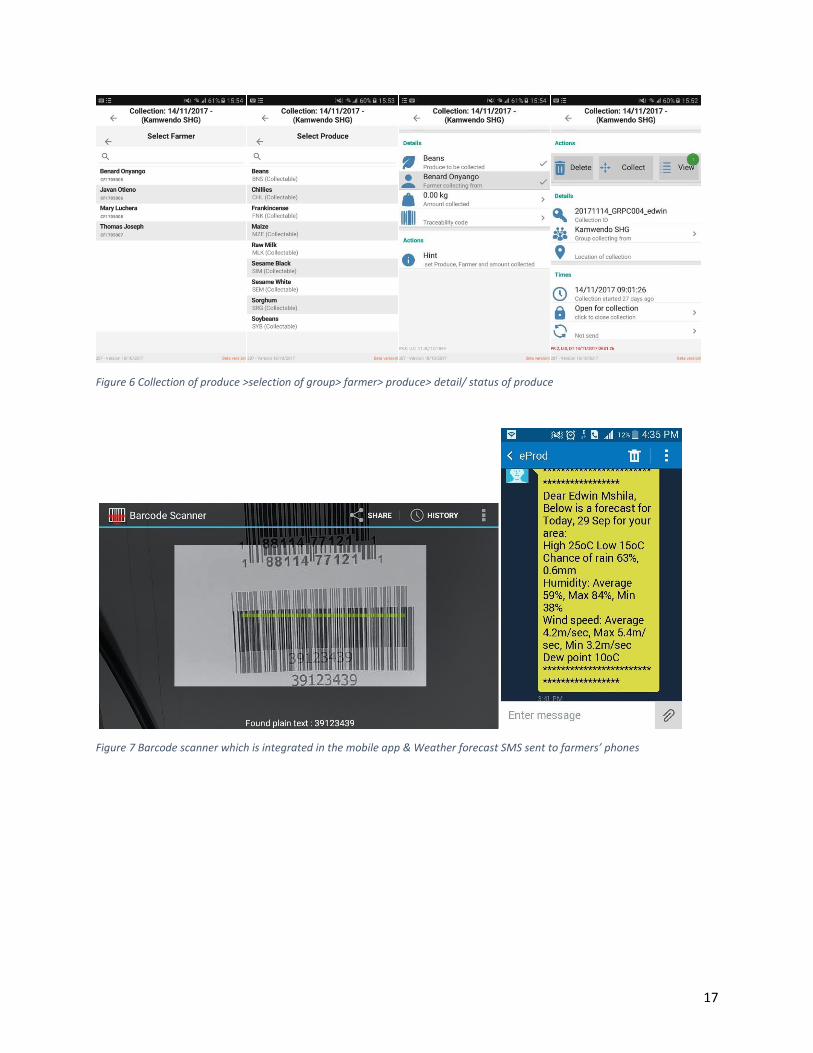
Figure 7 Barcode scanner which is integrated in the mobile app & Weather forecast SMS sent to farmers’ phones

18
Horticulture Traceability System
Data recorded (using mobile app) during
production
When data is recorded along the supply
chain
Input Lot/Input Supplier
Farmer Name
Farmer ID/Farm ID
Pack house Name/ID
Harvest Date
Best Before Date
Lot number
Crate ID/Qty/Weight
Package Serial number/SGTIN
Package Weight/Qty
Where To /Where From
Waste/Rejects
Planting/Spraying
Receipt of Produce at Collection Hubs
Dispatch of Produce at Collection Hub
Receipt of Produce at Pack house
Dispatch of Produce at Pack house
Farms
Traceability
Engine
Collecting Packing
Farms
Plants
Fertilizers
Pesticides
Harvesting
Brands
Products
Certificates
Pack Houses
Collection Centres
Farm Journal
Farm Product Brand
Traceability graph Farm
Njukat Export Mao Import
DFG Store Tesco
Product journey map How to preserve your flowers Contact
Exporting
Importing Store Distribution
Certificates
Products
Brands Users
Master eRegister
Capture Events
Analytics/Dashboard
Capture Events