food security through energy management: solution for poverty reduction and employment generation
TRANSCRIPT
BIOFUEL, AGRICULTURE CROPS, CDM AND FOOD SECURITY: AN EMPIRICAL CASE STUDY IN HARYANA
Vagish Sharma

Copyright: Vagish Sharma
Energy and Human Civilization
Dev
elo
pm
ent,
Eq
uit
y, S
ust
ain
abil
ity

Copyright: Vagish Sharma
Perspective of Biofuel in India
National Biodiesel Mission: Target to meet 20% of
country’s diesel demand by 2011-12
Govt. policy is directed to non-edible oil crops [Priority: Jatropha. sp.]
4,00000 ha of land under pilot project
Establishment of 80,000 ton/year capacity transeterification plant
Projected production rate: 3.75 tons oilseed/Ha 1.2 ton biodiesel/ha/Year 38 Mha of wasteland
required for 20% blending by 2030 with yield of 5 tons/ha
Copyright: Vagish Sharma
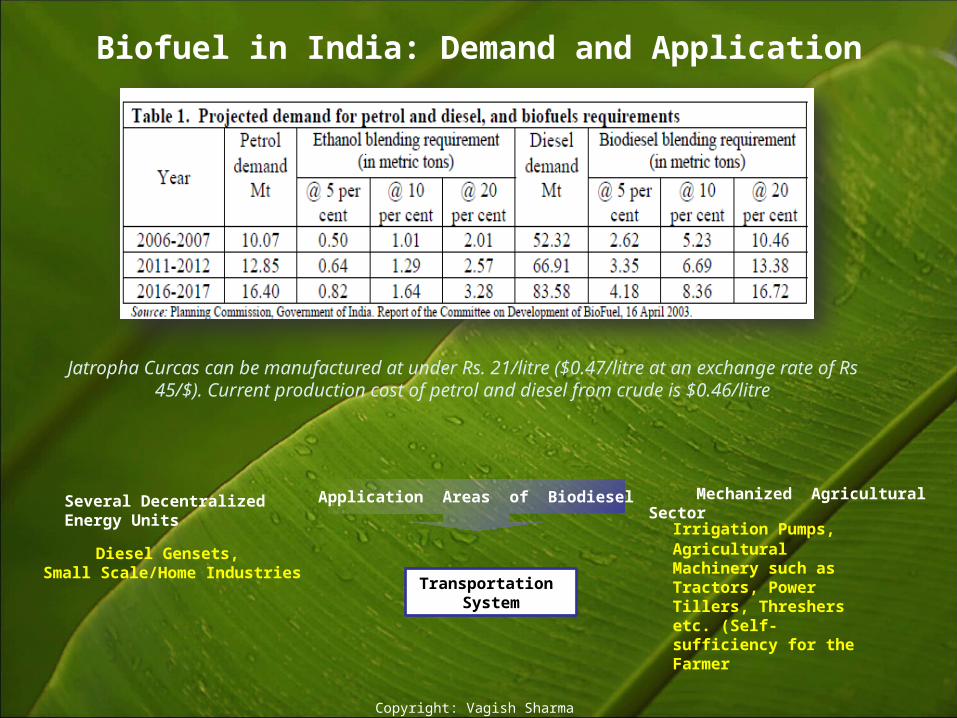
Biofuel in India: Demand and Application
Application Areas of BiodieselSeveral Decentralized Energy Units
Diesel Gensets, Small Scale/Home Industries
Transportation System
Mechanized Agricultural Sector
Irrigation Pumps, Agricultural Machinery such as Tractors, Power Tillers, Threshers etc. (Self-sufficiency for the Farmer
Jatropha Curcas can be manufactured at under Rs. 21/litre ($0.47/litre at an exchange rate of Rs 45/$). Current production cost of petrol and diesel from crude is $0.46/litre
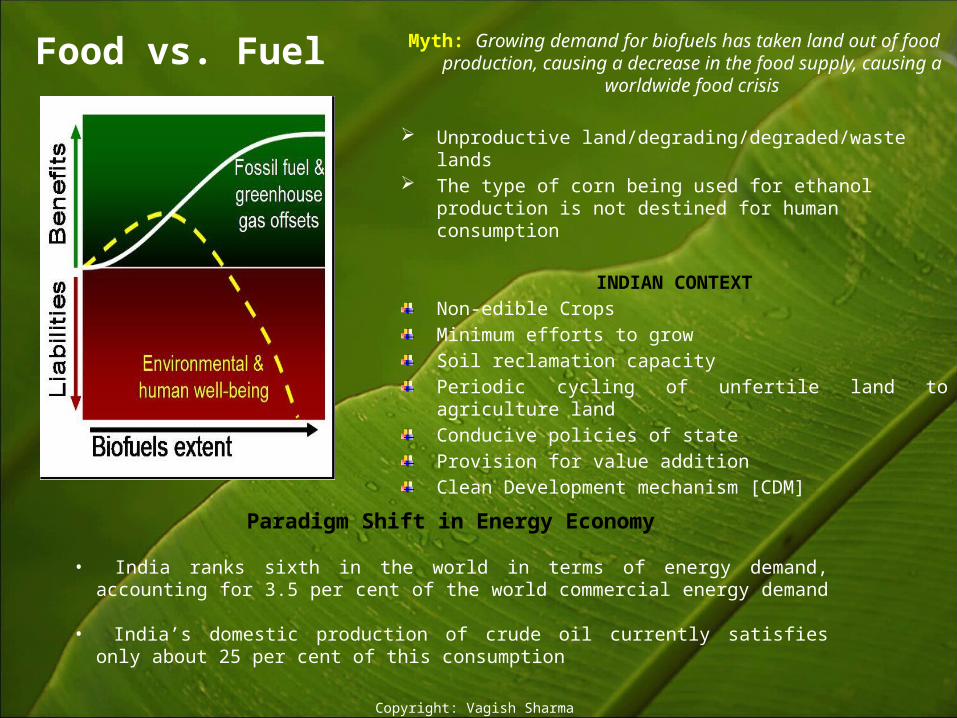
Food vs. Fuel Myth: Growing demand for biofuels has taken land out of food production, causing a decrease in the food
supply, causing a worldwide food crisis
Unproductive land/degrading/degraded/waste lands The type of corn being used for ethanol production is
not destined for human consumption
INDIAN CONTEXTNon-edible CropsMinimum efforts to growSoil reclamation capacityPeriodic cycling of unfertile land to agriculture landConducive policies of state Provision for value addition Clean Development mechanism [CDM]
Paradigm Shift in Energy Economy
• India ranks sixth in the world in terms of energy demand, accounting for 3.5 per cent of the world commercial energy demand
• India’s domestic production of crude oil currently satisfies only about 25 per cent of this consumption
Copyright: Vagish Sharma

CDM and Biofuel in Haryana
• Biofuel crop plantation [Afforestation/Reforestation]• Biofuel Production [Oil extraction/production]-ACM0017.EB.50
c
c
c
c
c
cc
1 tree = 1 year’s vehicle emissions
Trees are a Carbon sink
Copyright: Vagish Sharma
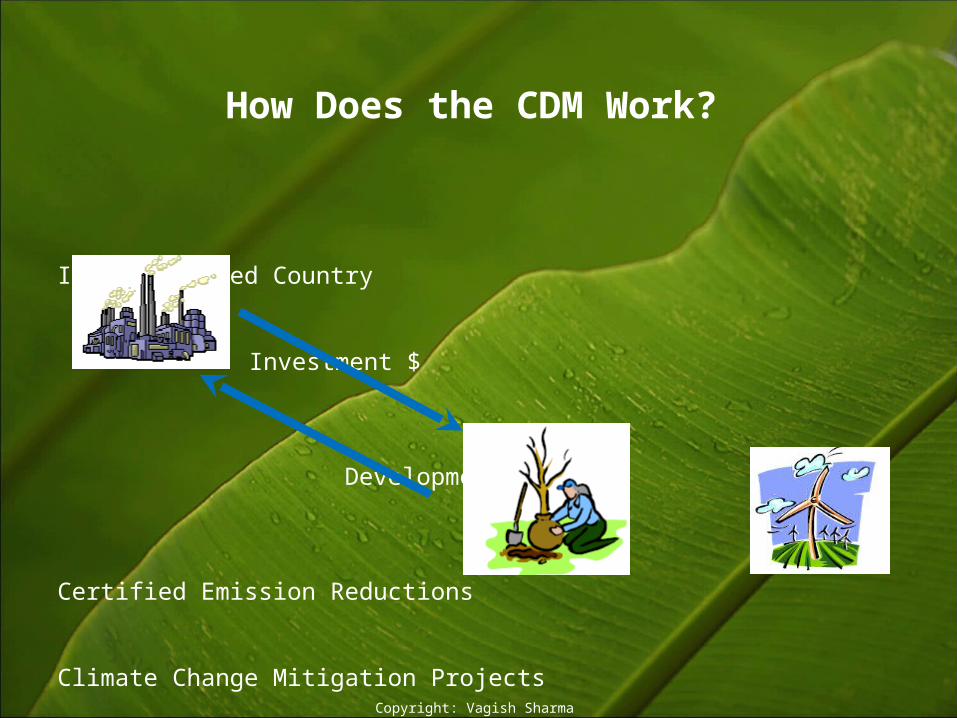
How Does the CDM Work?
Industrialised Country
Investment $
Development Country
Certified Emission Reductions Climate Change Mitigation Projects
Copyright: Vagish Sharma
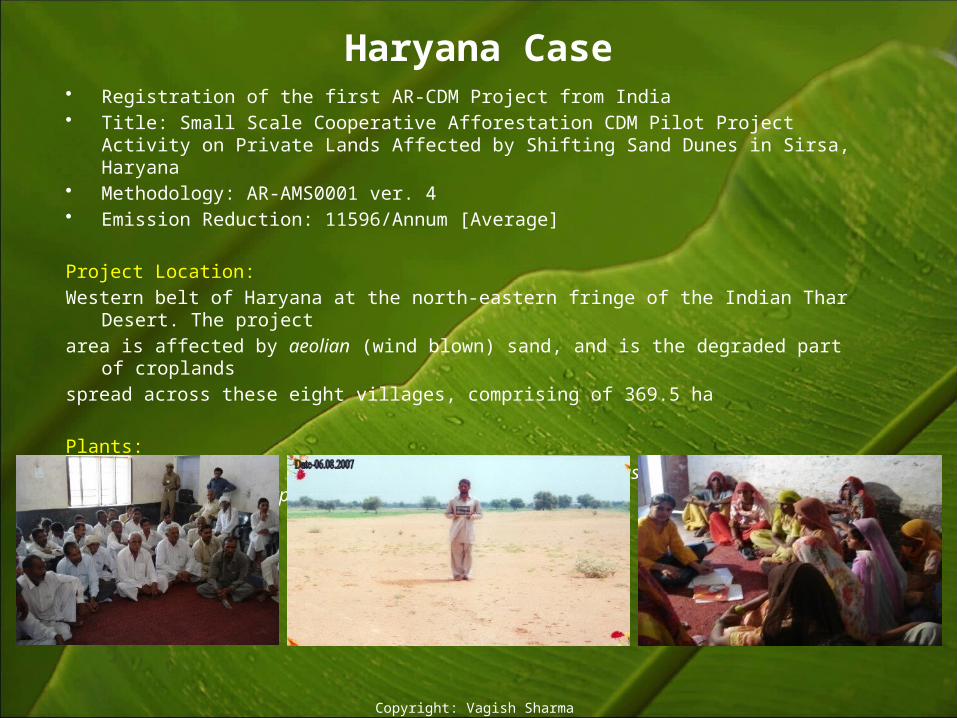
Haryana Case• Registration of the first AR-CDM Project from India• Title: Small Scale Cooperative Afforestation CDM Pilot Project Activity on Private
Lands Affected by Shifting Sand Dunes in Sirsa, Haryana• Methodology: AR-AMS0001 ver. 4• Emission Reduction: 11596/Annum [Average]
Project Location: Western belt of Haryana at the north-eastern fringe of the Indian Thar Desert. The
project area is affected by aeolian (wind blown) sand, and is the degraded part of croplands spread across these eight villages, comprising of 369.5 ha
Plants:Jatropha curcas and Pongomia Sp. along with Eucalyptus hybrid, Acacia nilotica,
Dalbergia sissoo, Zizyphus mauritiana, Prosopis cineraria
Copyright: Vagish Sharma
Expected Outcome
• Soil fertility enhancement : • Jatropha and Pongomia are suitable for preventing soil erosion.• Due to mycorrhizal value in Jatropha roots it helps in getting phosphate from soil
boon for acid soil and improves the soil fertility throughout their life cycle.• The soil sample collected after and before commencing the project activity depicted
a positive correlation and could be inferred that the project activity has been improving the soil fertility as well as increasing the water holding capacity in comparison to the pre-project activity.
• Poverty Alleviation:• The average monthly per capita income of very poor households increased from Rs.
572 to Rs. 864. This proportionate increase was 51%. While average monthly per capita income of poor households increased from Rs. 1221 to Rs. 1628 and the increase was 33%.
• The overall impact on per capita income was also positive. It increased from Rs. 1221 to Rs. 1628 and overall percentage increase was 33%. The results revealed highly significant impact of project on per capita income.
• Regression analysis of change in consumption against change in income showed that consumption is a function of income. Change in income will lead to change in consumption. Co-efficient of change in income is positive and reveals that one rupee increase in income will increase consumption by 0.14 rupees.
Copyright: Vagish Sharma

Correlation Analysis Value Type
Correlation 0.859 Strongly positive
Change in income vs change in expenditure
0.7024 Positive
Regression analysis of change in consumption against Income
Regression analysis of change in income against Project Activity
Copyright: Vagish Sharma
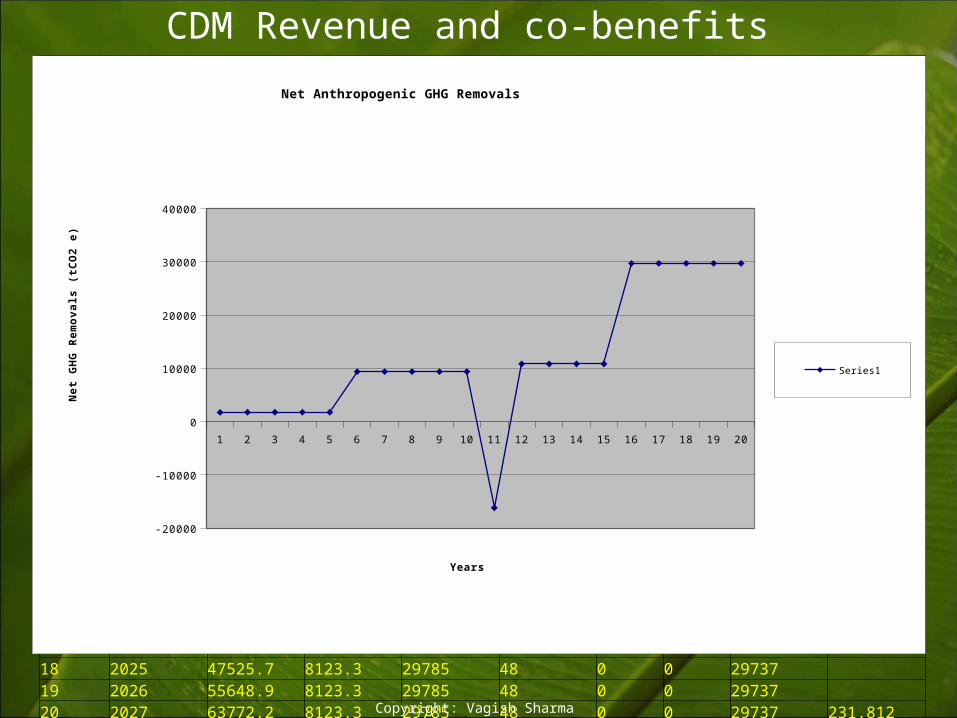
CDM Revenue and co-benefits
Net Anthrpogenic GHG removals
Ti yearTotal project Carbon (tC)
total carbon change (tC/yr)
Actual CO2 (t/yr)
baseline net GHG removal (tCO2 e/yr)
Emissions (t CO2 e/yr)
leakage (t CO2/yr)
net anthropogenic GHG removals (t CO2 /yr)
total number of tCERs
0 2007 286.4 0.0 0 0 0 0 0 1 2008 779.0 492.6 1806 48 0 0 1758 2 2009 1277.1 498.2 1827 48 0 0 1778 3 2010 1775.3 498.2 1827 48 0 0 1778 4 2011 2273.5 498.2 1827 48 0 0 1778 5 2012 2771.6 498.2 1827 48 0 0 1778 8,8706 2013 5350.1 2578.4 9454 48 0 0 9406 7 2014 7928.5 2578.4 9454 48 0 0 9406 8 2015 10507.0 2578.4 9454 48 0 0 9406 9 2016 13085.4 2578.4 9454 48 0 0 9406 10 2017 15663.9 2578.4 9454 48 0 0 9406 55,89911 2018 11270.2 -4393.7 -16110 48 0 0 -16159 12 2019 14241.6 2971.4 10895 48 0 0 10847 13 2020 17213.0 2971.4 10895 48 0 0 10847 14 2021 20184.4 2971.4 10895 48 0 0 10847 15 2022 23155.8 2971.4 10895 48 0 0 10847 83,12816 2023 31279.1 8123.3 29785 48 0 0 29737 17 2024 39402.4 8123.3 29785 48 0 0 29737 18 2025 47525.7 8123.3 29785 48 0 0 29737 19 2026 55648.9 8123.3 29785 48 0 0 29737 20 2027 63772.2 8123.3 29785 48 0 0 29737 231,812 total 232781 231812 379,709
1 2 3 4 5 6 7 8 9 10 11 12 13 14 15 16 17 18 19 20
-20000
-10000
0
10000
20000
30000
40000
Net Anthropogenic GHG Removals
Series1
Years
Ne
t G
HG
Re
mo
va
ls (
tCO
2 e
)
Copyright: Vagish Sharma
Summary
• Reduced emission of pollutants• Increased employment• Improved social well-being• Energy security and decreased dependence on oil
imports• Increased nutrients to the soil and decreased soil
erosion
Copyright: Vagish Sharma
Conclusion
There is no conflict between biofuel crops, agriculture and food
security.
Dev
elo
pm
ent,
Eq
uit
y, S
ust
ain
abil
ity
Copyright: Vagish Sharma

It doesn't matter who you are, where you come from. The ability to triumph begins with you. Always.
- Oprah WinfreyThank you.