food security in asia and the pacific
TRANSCRIPT

Food Security in Asia and the Pacific

Food Security in Asia and the Pacific

Printed on recycled paper
© 2013 Asian Development Bank
All rights reserved. Published 2013.Printed in the Philippines.
ISBN 978-92-9254-224-5 (Print), 978-92-9254-225-2 (PDF)Publication Stock No. RPT135848-2
Cataloging-in-Publication Data
Asian Development Bank. Food security in Asia and the Pacific.Mandaluyong City, Philippines: Asian Development Bank, 2013.
1. Food security. 2. Poverty. 3. Sustainable development. 4. Asia and the Pacific. I. Asian Development Bank.
The views expressed in this publication are those of the authors and do not necessarily reflect the views and policies of the Asian Development Bank (ADB), its Board of Governors, or the governments they represent.
ADB does not guarantee the accuracy of the data included in this publication and accepts no responsibility for any consequence of their use.
By making any designation of or reference to a particular territory or geographic area, or by using the term “country” in this document, ADB does not intend to make any judgments as to the legal or other status of any territory or area.
ADB encourages printing or copying information exclusively for personal and noncommercial use with proper acknowledgment of ADB. Users are restricted from reselling, redistributing, or creating derivative works for commercial purposes without the express, written consent of ADB.
Note:In this publication, “$” refers to US dollars; “calorie” refers to large calorie and is used interchangeably with “kilocalorie”; and “ton” refers to “metric ton.”
Asian Development Bank6 ADB Avenue, Mandaluyong City1550 Metro Manila, PhilippinesTel +63 2 632 4444Fax +63 2 636 2444www.adb.org
For orders, please contact:Department of External RelationsFax +63 2 636 [email protected]

iii
Contents
List of Tables, Figures, Boxes, Box Tables, and Box Figures iv
Foreword vii
Acknowledgments ix
List of Abbreviations xi
List of Weights and Measures xiii
Executive Summary xv
I. Introduction 1
II. Food Security: What It Means for Asia and the Pacifi c 8
III. Access to Food: Poverty, Nutrition, and the Impact of Food Crises 14
IV. Availability of Food: Competing Demands for Resources, Productivity, and Agricultural Research 40
V. Transportation, Logistics, and International Trade 53
VI. Climate Change and Food Security 61
VII. Policy Framework for Food Security 70
VIII. Summary and Conclusion 89
AppendixesA Regional Groupings 91B Economy Codes 94
References 97
List of Participants: Symposium on Food Security in Asia and the Pacifi c 105

iv
Tables, Figures, Boxes, Box Tables, and Box Figures
TablesA Summary of Food Security Policies xix2 Rice Consumption, Caloric Intake, and Percentage of Calories from Rice,
1990–1992 and 2007–2009 133.1 Undernourishment and Depth of Food Defi cit 213.2 Change in the Percentage of Poor Based on the $1.25-a-Day (2005 PPP)
Poverty Line 323.3 Change in Poor Population 347 Food Security Policy Matrix 72
Figures1.1 Composite Monthly Real Food Price Index, 1990–2013 11.2 Real Prices of Major Cereals, 1900–2011 21.3 Share in Global Consumption by Region, 1990–2009 31.4 Consumption per Capita by Region, 1990–2009 41.5 Share in Global Production by Region, 1990–2009 51.6 Production per Capita by Region, 1990–2009 62.1 Estimated Change in Population between 2010 and 2050 92.2 Changing Dietary Composition in Asia and the Pacifi c, 1961–2009 102.3 Average Protein Supply per Capita and Consumption per Capita of the PRC
Relative to the US, 1990–2009 113.1 The World’s Poor, 2010 Estimates 143.2 The World’s Undernourished 153.3 Growth and Change in Poverty in Low- and Middle-Income Economies,
1990–2010 163.4a Prevalence of Undernourishment and Income, 2010–2012 183.4b Depth of Food Defi cit and Income, 2010–2012 193.4c Prevalence of Food Inadequacy and Income, 2010–2012 203.5 Change in Poverty and Change in Prevalence of Undernourishment
in Low- and Middle-Income Economies, 1990–2012 223.6 Diversifi cation in Sources of Caloric Intake, 1961 and 2009 233.7a Share of Cereals in Total Caloric Intake and GDP per Capita, 1991–2009 243.7b Share of Animal-Sourced Food in Total Caloric Intake and GDP per Capita,
1991–2009 253.8a Protein Supply and GDP per Capita, 2007–2009 263.8b Share of Animal-Sourced Protein in Total Protein Supply and GDP
per Capita, 2007–2009 27

v
Tables, Figures, Boxes, Box Tables, and Box Figures
3.9 Percentage of Children Under 5 Who Are Stunted, 2005–2007 283.10 Food Price Indexes in Subregions of Asia and the Pacifi c, 1991–2012 303.11 Food Price Volatility in Subregions of Asia and the Pacifi c, 1995–2012 313.12 Change in Poverty Due to Food Price, Nonfood Price, and Income Effects 333.13 Impact of Higher Food Price Infl ation on Health Indicators 374.1 Arable Land, 1961–2011 414.2 Renewable Water Resources, 2010 424.3 Water Consumption in Asia and the Pacifi c 434.4 Yield and Area Growth Trends for Cereals in Asia and the Pacifi c, 1962–2011 454.5 Total Factor Productivity in Major Cereals, 1981–2010 464.6 Food Losses Within the Food Supply System in Cereals, by Region 504.7 Food Losses Within the Food Supply System in South and Southeast Asia,
by Commodity Group 514.8 Public Agricultural Research and Development Intensity, by Region
and Income Group 514.9 Share of Asia and the Pacifi c in Global Public Agricultural Research
and Development Spending, 1981–2008 526.1 Population at Risk of Hunger Under Different Climate Change Scenarios 646.2 Projected Real Price of Rice and Wheat, 2010–2050 656.3 Projected Levels of Caloric Consumption 666.4 Projected Levels of Child Malnutrition 66
Boxes3.1 The Cost of Food and Poverty—The Case of Thailand and Indonesia 353.2 Social Safety Nets and Food Programs in Selected Developing
Asian Countries 384.1 Agricultural Productivity Growth in Thailand 444.2 The Rice Value Chain Transformation in Bangladesh and India 485 Food Trade Maps 566 Food Security and Climate Change—The Special Case of the Pacifi c 677.1 The Role of Social Protection and Safety Nets in Reducing Hunger
and Malnutrition 737.2 Features of a Comprehensive Food Security Risk Assessment
and Information System 807.3 The ASEAN Plus Three Emergency Rice Reserve 84
Box TablesB3.1 Thailand and Indonesia—Simulated Effects of Food Price Shocks
on Poverty Incidence 35B4.1 Agricultural Productivity Growth and Poverty Incidence in Thailand 44B6.1 Projected Impact of Climate Change on Crop Yields 67B6.2 Population at Risk of Hunger 68B6.3 Population of Malnourished Children Under Age 5 68B7.1.1 Features of Transfers 73B7.1.2 Features of Subsidies 73

vi
Tables, Figures, Boxes, Box Tables, and Box Figures
Box FiguresB5.1 Rice Trade Map 57B5.2 Wheat Trade Map 58B5.3 Caloric Trade Map 59B6.1 Projected Levels of Caloric Consumption in Pacifi c Island Countries 67

vii
Foreword
Food security is complex. It is primarily built on three pillars: (i) food availability—suffi cient quantities on a consistent basis; (ii) food access—the ability to obtain adequate and nutritious food; and (iii) food utilization—satisfying dietary needs and
cultural preferences.
In Asia and the Pacifi c, food security is being fundamentally altered, as patterns of food consumption and production change alongside global trends—like climate change—in sustaining agricultural output. Providing enough safe and nutritious food remains a serious challenge for the region. The dynamics of food security are changing fast. However, after 2 decades of stunning economic growth, rapid reduction in absolute poverty, expanding urbanization, industrialization, and a rising middle class, the region is still home to more than 60% of the world’s hungry.
After years of relatively stable real food prices, the 2007–2008 global price hikes in food staples brought the issue of food security higher up the global agenda. Aside from having direct effects on poverty incidence and nutrition, the dramatic increase in food prices and volatility had a negative impact on the overall economy. Food price infl ation can trigger demands for wage increases, igniting a vicious infl ationary cycle that could discourage private investment and slow economic activity. Given the importance of food in household budgets, insecurity reduces investment in education and health, and can damage a country’s human capital and long-run growth prospects.
With the aim of identifying viable policy options, the Asian Development Bank, in collaboration with Foreign Affairs, Trade and Development Canada (formerly, the Canadian International Development Agency); the Asia-Pacifi c Economic Cooperation; and the Liu Institute for Global Issues at the University of British Columbia, initiated a research project in 2012 to deepen the understanding of food security in Asia and the Pacifi c. Fourteen background papers were commissioned as part of this project to investigate food security issues particularly pertinent for Asia and the Pacifi c.
This synthesis report collates the key fi ndings from these papers. The report highlights the need to reduce poverty and ensure the sustainability of global food systems. It analyzes the relationship between poverty, nutrition, and access to food. It examines competing demands for available resources, and ways to boost productivity amid changing demand and supply. It looks at trade, logistics, and possible effects of climate change. It also explores some practical policy options to deal with the food security challenges in Asia and the Pacifi c. Perhaps most usefully, however, the report aims to stimulate discussion

viii
Foreword
on the various approaches to achieving food security—without sacrifi cing the resources needed for the next generation. Just as food security is central to our development efforts, sustainable development is the only path for our children’s future.
Changyong RheeChief EconomistAsian Development Bank

ix
Acknowledgments
This synthesis report is the result of close, collaborative research initiated by the Asian Development Bank (ADB) in partnership with Foreign Affairs, Trade and Development Canada (DFATD); the Asia-Pacifi c Economic Cooperation (APEC); and the Liu
Institute for Global Issues at the University of British Columbia (UBC). The collaboration was designed to further understand, synthesize, and articulate key policy challenges and opportunities related to food security in the Asia and Pacifi c region, as well as to contextualize the role and importance of the region on the global stage. It explores the web of issues linking food security to food access and availability, and its impact on nutrition and poverty. It also examines the effects of the evolving socioeconomic environment surrounding rapid structural changes and urbanization in the region, competing demand for natural resources, and climate change on food supply and demand. Appropriate policies and interventions could then be considered to help steer the region’s development toward a more sustainable path.
The research was coordinated by the ADB Economics and Research Department under the overall guidance of Assistant Chief Economist Cyn-Young Park, in consultation with Paul Samson, Partnerships with Canadians Branch of DFATD, and the Liu Institute for Global Issues at UBC. The synthesis report was written by Cyn-Young Park, Utsav Kumar, and Emmanuel San Andres with invaluable contributions from Peter Warr, ADB consultant for the project. Marianne Joy Vital provided excellent research assistance.
The report synthesizes and collates 14 research papers written in preparation for the Symposium on Food Security in Asia and the Pacifi c: Key Policy Issues and Options, held on 17–18 September 2012 at the Liu Institute for Global Issues, UBC. These background papers investigated food security issues particularly pertinent for Asia and the Pacifi c, ranging from changing demand and increasingly constrained agricultural resources and supply potential, to evolving food value chains.
The authors of the background papers are Lourdes S. Adriano, Pramod Aggarwal, Douglas Brooks, Bruce Campbell, Kevin Chen, Jalal Chowdhury, Ramon Clarete, Merle Faminow, Benno Ferrarini, Eugenia Go, Himanshu, Hyeon-Seung Huh, Pramod Joshi, Shikha Jha, Milind Kandiklar, Ashok Kotwal, Patti Kristjanson, Kensuke Kubo, Hyun-Hoon Lee, Dennis Mapa, Bart Minten, Jennifer Mohamed-Katerere, Lynette Neufeld, Cyn-Young Park, Sharon Faye Piza, Navin Ramankutty, Bharat Ramaswami, Thomas Reardon, Emmanuel San Andres, Mark Smith, Mercedita Sombilla, Hyun H. Son, Sonja Vermeulen, and Annie Wesley.
The synthesis report greatly benefi ted from the comments and suggestions of ADB Chief Economist Changyong Rhee and Regional Sustainable Development Department Director General Seethapathy Chander. Lourdes S. Adriano, Bart W. Edes, Sri Wening Handayani,

x
Acknowledgments
Patricia Moser, and Paul Vandenberg from ADB; Marc Blanchette, Jeanette McHugh, and Paul Samson from DFATD; and the symposium participants (see page 104) provided thorough reviews and valuable comments. A team from the ADB Department of External Relations extended publication support. Guy Sacerdoti and Isabel L. Templo provided excellent editing; typesetting was done by Prince Nicdao.

xi
Abbreviations
4Ps Pantawid Pamilyang Pilipino (Filipino Family Assistance) ProgramADB Asian Development BankAFSIS ASEAN Food Security Information SystemAFTA ASEAN Free Trade AreaAIFS ASEAN Integrated Food SecurityAPEC Asia-Pacifi c Economic CooperationAPTERR ASEAN Plus Three Emergency Rice Reserve AR4 The Fourth Assessment Report of the IPCCASEAN Association of Southeast Asian NationsASTI Agricultural Science and Technology IndicatorsBIPI bilateral import penetration indexBLT Bantuan Langsung Tunai (Direct Cash Assistance)cc climate changeCEES and CIS Common European Economic Space and the Commonwealth
of Independent StatesCFA Comprehensive Framework for ActionCFS Committee on World Food SecurityCO2 carbon dioxideCPI consumer price indexDFATD Foreign Affairs, Trade and Development CanadaFAO Food and Agriculture Organization of the United NationsFAOSTAT FAO statistical databaseFDI foreign direct investmentG8 Group of EightG20 Group of TwentyGDP gross domestic productGHG greenhouse gasGIS geographic information systemHHI Herfi ndahl–Hirschman IndexICT information and communication technologyIFPRI International Food Policy Research InstituteIPCC Intergovernmental Panel on Climate ChangeIRRI International Rice Research InstituteISPAM IFPRI Spatial Allocation ModelLAC Latin America and the CaribbeanLao PDR Lao People’s Democratic RepublicMacau SAR Macau Special Administrative Region of the People’s Republic of ChinaMDGs Millennium Development GoalsMENA Middle East and North AfricaMUV Manufactures Unit ValueNFA National Food Authority

xii
Abbreviations
OECD Organisation for Economic Co-operation and DevelopmentPDS Public Distribution SystemPNG Papua New GuineaPPP purchasing power parityPRC People’s Republic of ChinaR&D research and developmentSPA-FS Strategic Plan of Action on Food Security in the ASEAN RegionSSA Sub-Saharan AfricaTFP total factor productivityTIPI total import penetration indexUBC University of British ColumbiaUN United NationsUN Comtrade UN Commodity Trade Statistics DatabaseUNESCAP UN Economic and Social Commission for Asia and the Pacifi cUNESCO UN Educational, Scientifi c and Cultural OrganizationUS United StatesWDI World Development IndicatorsWFP World Food ProgrammeWHO World Health OrganizationWTO World Trade Organization

xiii
Weights and Measures
°C degree Celsiuscm centimetercm/decade centimeter per decadegr gramgr/capita/day gram per capita per dayGtCO2e gigatons (billion tons) of carbon dioxide equivalentha hectareha/capita hectare per capitakCal kilocaloriekCal/capita/day kilocalorie per capita per daykg kilogramkg/ha kilogram per hectarekg/year kilogram per yearm3 cubic meterm3/capita/year cubic meter per capita per yearmm/year millimeter per yearton/capita ton per capitaton/year ton per year


xv
Executive Summary
“In a world of plenty, no one, not a single person, should go hungry.”
– Ban Ki-moon, United Nations Secretary-General
Complexity of Food Security Challenges in the Asia and Pacific Region
Food security is achieved when “all people at all times have physical and economic access to suffi cient, safe, and nutritious food” (World Food Summit 1996). Food security is a multidimensional issue. It has become increasingly complex and challenging with the impact of economic growth, changing demographics, consumption patterns, international trade, and environmental change all interconnected globally. In addition, public policy responses to these challenges can sometimes exacerbate problems. Aside from its worldwide impact, however, food security also holds immediate household and personal importance. Particularly for the poor, it defi nes how daily budgets are allocated. Economic growth and food security have been mutually reinforcing throughout the history of development. But that experience also illustrates that vulnerability to food insecurity cannot be fully removed by economic success alone. Strong growth has been key to the sharp decline in poverty and undernourishment, but hunger remains stubbornly high in many countries and regions. One in every eight people goes to bed hungry at night; yet there is suffi cient food to feed the world. This underscores the fact that food security is much more than raising food production. It is also about reducing distortions in global food markets and ensuring equitable distribution, particularly to food-defi cit countries and people.
The “two faces of Asia” make achieving food security for both Asia and the world far more complex. The economies of developing Asia and the Pacifi c grew an average 7.6% a year between 1990 and 2010, far exceeding the 3.4% global average. The rise in affl uence in conjunction with growing populations continues to drive greater demand for more protein-rich food and better nutrition. This has enormous implications for the intensity of production. Food consumption in Asia and the Pacifi c has grown steadily, from 2,379 kilocalories per capita per day in 1990 to 2,665 in 2009. But some 733 million people in the region still live in absolute poverty (defi ned as living on less than $1.25 a day, in 2005 purchasing power parity); and 537 million remain undernourished. These are the two faces of Asia—one of progress and prosperity; the other of continued poverty. Strong income and population growth, industrialization, and urbanization continue as driving forces behind the fundamental structural change in global food production and market systems. While Asia’s economic growth and ongoing structural transformation deepen the complexity in managing the limited natural resources required for food security, many pockets of Asia continue to struggle with high levels of poverty and poor nutrition.

xvi
Executive Summary
Asia’s rise adds to the pressures on land, water, and energy resources. Producing more food with fewer natural resources to meet ever-rising and evolving demand may be the ultimate challenge for the 21st century. Pressures on land, water, and energy resources are increasing. Competition over their use is intensifying. The world’s population is projected to exceed 9 billion by 2050, up from today’s 7 billion. Feeding 9 billion people is estimated to require about 70% more food by 2050—and almost double food production in developing countries, according to the Food and Agriculture Organization of the United Nations 2009 High-Level Expert Forum on How to Feed the World in 2050. Asia and the Pacifi c accounts for about 60% of the global population. By 2050, it will add about 853 million people and will command more than half of global gross domestic product (GDP). With growing incomes and more mouths to feed, the region will consume more and better food. Currently, the 60% of the global population living in the region accounts for just a little more than 50% of global food consumption—its per capita food consumption remains below the world average.
Economic growth alone does not guarantee food security. Despite spectacular economic growth, developing Asia is home to over 60% of the world’s poor and hungry. Tackling undernourishment remains a challenge throughout the region. Over half a billion—or about 14%—of Asia’s population are undernourished, more than all the undernourished in Africa. The severity of the food defi cit for those undernourished is also above the global average—exceeded only by Africa. Over 40% of children in several Asian and Pacifi c countries are stunted. Focusing on nutrition—rather than simple caloric intake—is essential if food security in the region is to be achieved.
Additional challenges include changing dietary patterns and nutrition transitions in fast-growing Asian countries. Together with accelerating growth in demand, more affl uent Asians demand more protein-rich and resource-demanding food—not just meat and dairy products, but also vegetables and fruits. While the growing diversity of diet is welcome, nutrition transitions also damage health; as such, obesity can now be found alongside stunting. Many countries in developing Asia and the Pacifi c face the double burden of fi ghting both under- and overnutrition.
Key Issues and Strategies for Achieving Food Security in Asia and the Pacific
This synthesis report collates the main fi ndings from project background studies to highlight key food security issues across the region. Three major themes resonated throughout the research:
(i) ensuring the sustainability of global food systems, to meet growing food demand without sacrifi cing the resources of future generations; improving the effi ciency of food production and delivery; and maximizing the benefi ts of international trade;
(ii) reducing poverty and vulnerability to food insecurity, to ensure the ability to purchase suffi cient and nutritious food; reducing the price impact on real incomes of poor households; and providing effective social safety nets for those bypassed by rapid economic growth and poverty reduction efforts; and

xvii
Executive Summary
(iii) establishing risk management systems and tools, to provide food-based safety nets that offer immediate relief to disadvantaged groups during crises; building adequate emergency food reserves and relief systems as a buffer to natural and human-made disasters; and introducing risk management systems and tools such as crop insurance and futures contracts to help mitigate the effects of price volatility and crises.
Trends in population, economic growth, industrialization, urbanization, and changing dietary patterns have largely encumbered already scarce natural resources. Total arable land per person in East and South Asia has been shrinking, falling from almost one-quarter hectare per person 50 years ago to an estimated one-tenth hectare by 2050. Water resources are also strained. Across Asia, between 60% and 90% of water is used for agriculture. However, share of household and industrial water consumption almost doubled during 1992–2002. The region would need an additional 2.4 billion cubic meters of water each day to provide each consumer with 1,800 calories per day by 2050. The growth in yields has been declining in Asia. And the projected impact of climate change will signifi cantly affect soil and water resources in many subregions.
Expanding cultivated lands is no longer an option for food production growth in nearly all countries in Asia and the Pacifi c. Although most arable land is accounted for, there remains considerable room to increase crop yields even with currently available resources and existing technologies—provided appropriate market incentives and public support mechanisms are in place. Agricultural output and productivity can be raised in two broad ways: (i) through improved productivity at the farm level, and (ii) through better postharvest productivity. In South and Southeast Asia, about one-third of food production is lost as it travels through the supply chain.
Achieving food security hinges signifi cantly on how inclusive growth is. Economic growth has proved effective in reducing absolute poverty. But unless its benefi ts are shared equitably, hunger and malnutrition will persist. Rapid growth has come with increased inequality. National and multilateral development strategies that increasingly emphasize inclusive growth must also target food security as a basic tenet.
Evidence shows that food price increases disproportionately affect the poor and negate efforts aimed at poverty reduction. The poor spend a larger proportion of their incomes—up to 70%—on food. Thus, any increase in food price slows the pace of poverty reduction. ADB (2012) estimates that, each year, from 2001 to 2010, an additional 112 million in Asia and the Pacifi c could have escaped poverty had food prices not increased. Volatility is another concern. In 2000–2010, food prices were not only higher than nonfood prices, they were also more volatile. A comprehensive assessment of the effects of food price infl ation and volatility on population health shows that a 1 percentage point increase in contemporaneous food price infl ation leads to a 0.2% increase in infant and child mortality and a 0.4% increase in prevalence of undernourishment.
With the majority of Asia’s poor living in rural areas, vibrant agriculture and rural sectors are critical to successful economic transformation. Approaches to food security have to be reoriented toward rural development and agriculture as a source and central component
xviii
Executive Summary
of ending hunger and poverty—and in promoting inclusive economic growth. As the vast majority of the poor and vulnerable in rural areas are concentrated in small-scale subsistence farming, priority must be given to improving smallholder production and productivity.
Rural development improves food security, not just through higher incomes, but also through increased productivity and thus food availability. The focus should be on more localized, smallholder, and sustainable agriculture. The production capacity of smallholders is often constrained by limited access to key inputs—such as quality seeds, fertilizer, agricultural infrastructure, and available modern technology. Enhancing small farm production and productivity requires assistance to strengthen smallholders’ access to critical inputs, building and rehabilitating rural and agricultural infrastructure, improving effi ciency of the food supply chain (particularly reducing postharvest losses), and expanding agricultural cooperatives.
Social safety nets play an important role in achieving food security. Social safety nets not only help provide immediate relief to disadvantaged groups during crises, but also help provide care for those bypassed by rapid economic growth and poverty reduction efforts. Food-based safety nets and related social protection programs play an essential role in building food security for the poor and vulnerable groups, given the prevailing structural weaknesses and market failures in food systems. Targeted food aid and cash transfer programs—together with other social assistance schemes—help reduce the vulnerability of poor households, help farmers manage risks, and improve community resilience.
Policy Options to Address Immediate Concerns and Improve Long-Term Resilience
Specifi c, urgent actions should be undertaken to address both short- and long-term issues. There is a pressing need to develop an overarching—if multilayered—policy framework covering the array of strategic directions to address immediate, short-term needs, and to prepare for medium- to long-term issues. Table A summarizes some priority actions and components to combat food insecurity and poverty, enhance the effi ciency of food market systems, promote sustainable agriculture, and improve risk management and community resilience. In the short run, policies that focus on mitigating the immediate impact of high food prices on vulnerable groups, and that facilitate access to adequate, quality food through emergency measures—such as food assistance and cash transfers—will be most effective. In the longer run, scaling up agricultural productivity and investment, promoting rural development, and continuing to tackle the root causes of poverty can promote economic resilience and help build sustainable food security. At the same time, policies should be crafted to promote sustainable agricultural production and environmental protection. It is important to recognize that only planning and action now will be able to infl uence long-term outcomes. Delayed or inadequate decisions today will further increase vulnerability to long-term food insecurity tomorrow. International food markets and governments must be prepared to respond to supply and demand shocks as well as the effects of climate change. These are already behind today’s higher food prices and volatility.

xix
Executive Summary
Table A: Summary of Food Security Policies
Actions National Regional/Global
Interventions to Meet Immediate Needs
Provide emergency food assistance and enhance social safety nets
Offer programmed cash transfers
Target interventions at nutrition
Provide timely and reliable data and information
Coordinate crisis policy responses
Facilitate fl ows of emergency assistance
Reduce agricultural trade restrictions and market distortions
Actions to Improve Medium- to Long-Term Resilience
Promote agriculture and rural development
Invest in human development
Improve nutrition awareness
Consider building an emergency fund for disaster relief
Introduce insurance and disaster mitigation measures
Establish national and regional food reserves and crisis management systems
Promote research and development, knowledge exchange, and capacity building
Improve monitoring and surveillance of food market conditions
Promote food trade liberalization
Consider mechanisms to promote price stability
Enhance collaboration on climate change and accelerate adaptation measures
Source: Authors.
Emergency food assistance and social safety nets are critical to assisting the poorest and most vulnerable, especially during temporary food crises. Suffi cient, nutritious food at reasonable cost, available to all, is the capstone of political stability. Stop-gap food-based safety nets can work well in building the resilience of vulnerable populations and improving long-term food security if well targeted. Cash transfer programs limited to the poor, for instance, conditional on household participation in education, health, or nutrition services, have shown larger degrees of success. While most Asian countries use safety nets of some kind to shield poor and vulnerable groups from severe deprivation, their social protection expenditures suggest more support is needed in size and effectiveness. As a percentage of GDP, social protection expenditures amount to less than 2% in 10 of 31 Asian countries. Moreover, the effectiveness of existing schemes in developing countries hinges on their ability to accurately target the poor when needed. Errors in both exclusion (omitting households that qualify for inclusion) and inclusion (providing assistance to households that do not qualify) are high—for example, 70% for India’s Public Distribution System.
Targeted nutritional interventions can signifi cantly augment health benefi ts. National food security strategies have often focused on agriculture and food supply, neglecting the importance of nutrition. However, evidence is clear that food supply alone does not provide nutrition security. Undernourishment and micronutrient defi ciency have a major impact on children’s cognitive development and overall health. This remains a serious concern in many developing countries. Investment in health and education, and in water and sanitation infrastructure is crucial. In particular, given the strong relationship between nutritional and health knowledge and nutrition outcomes, special attention needs to be paid to nutrition education and social marketing.

xx
Executive Summary
Investment in infrastructure boosts productivity and reduces food losses. To lower transport costs, facilitate marketing, and ease the introduction of available technology, adequate infrastructure is essential. Transferring modern farm technology to increase land effi ciency and help increase crop yields at the farm level is also an important part of the extension services.
Investing in agricultural research today is a prerequisite for tomorrow’s food security. Agricultural research offers a better chance of addressing food security challenges compounded by accelerating demand, constrained natural resources, and changing climate. The challenge for the research community—and agriculture-based corporations—is to develop resilient agricultural inputs and systems using rational, affordable strategies that not only increase production, but also achieve food security for households and individuals. While research to increase agricultural productivity is essential, it must be complemented by research focusing on reducing postharvest losses, which span the entire supply chain from farm to fork.
Domestic and international trade are important elements for improving food access and availability. Trade enables food-defi cit areas to secure stable long-term food supplies and helps rural communities raise productivity and income. Food value and supply chains extend beyond national borders. International trade promotes the effi cient use of the world’s limited resources, while trade competition induces better productivity and innovation. The revolution in food value and supply chains is a core element in the transformation required for better food security at national, regional, and global levels.
Agricultural risk management tools and policies are integral to the food security policy framework. A disaster relief emergency fund or food storage could be established as a buffer to be used in times of crisis. These can also be applied to manage crisis and disaster risk through insurance programs. Weather-based crop insurance and futures contracts add to farmers’ security. Unpredictable weather limits a farmer’s investment and production decisions. Crop insurance allows farmers to try more productive, if riskier, options—such as alternative crops or applying new technologies. Futures contracts, which ensure specifi ed prices, help mitigate the risks of price volatility.
Food security requires regional and global cooperation. Regionally, three broad policies can help ensure food security and reduce excessive price volatility: adequate food stocks and reserves, accurate market information, and trade liberalization.
Emergency reserves can have important implications for social protection. Holding reserves has a limited effect on reducing food price volatility. But reserves provide a critical buffer during times of crisis for extremely vulnerable communities. Several proposals are under discussion. While international reserves run the high risk of coordination failure—and can incur considerable costs—there are several regional initiatives, especially among members of the Association of Southeast Asian Nations, to improve food reserve management and price stability. Adequate, regionally coordinated reserves could be pivotal in mitigating the effects of short-term supply shocks by allowing members to tap into regional food stocks and to reduce the storage cost at the national level.

xxi
Executive Summary
Accurate and timely information on food markets and stocks must be accessible to all. Gathered at the national level, information on markets and inventories require accurate interpretation and easy access. Generating and correctly interpreting information on stocks available are critical to preventing market speculation from spiraling out of control. Through regular dialogue, policy makers in the region can better assess market trends and help coordinate policies in response. Establishing a vibrant regional futures trade in food can also help. Aside from reducing market risk, futures trade provides a convenient platform for amassing market data and information. Similar to fi nancial securities or other commodities, food futures would require the appropriate regulation to build and maintain market integrity.
Agricultural trade and general trade policies should promote food security through a fair and open world trading system. Historical experience shows that protectionist and unilateral measures that insulate national food stocks and prices from the world market can seriously disrupt global food market supply and price stability. Acknowledging the national political centrality of assuring adequate food, negotiating multilateral rules on reducing food export or import restrictions has proven extremely diffi cult. Strong regional cooperation and trust are essential for commitments to be made on banning unilateral export restrictions, reducing levels of self-suffi ciency, and building emergency food reserves and aid networks in case of food crises.


1
I. Introduction
Food security is fi rmly back on the global agenda. The immediate trigger was the 2007–2008 international food crisis. The price surge was phenomenal: the overall food price index rose by 54% in the 18-month period from January 2007 to June 2008
(Figure 1.1).1 Prices of major food crops also increased sharply—the real price of rice tripled during the period, while those of wheat and maize more than doubled (Figure 1.2). Prices again rose sharply in 2010, surpassing the 2008 peak before they moderated somewhat starting in the last quarter of 2011. Increased volatility is an added concern.
1 Importantly, the Food and Agriculture Organization of the United Nations (FAO) Food Price Index weights commodities
by international trade share rather than global consumption. This means that highly traded commodities, like sugar,
receive higher weights than thinly traded rice, even though rice is a much more important commodity in terms of
consumption. This is critical in interpreting price surges. For example, the sharp 2011 increase in the food price
index was the result of a surge in sugar prices—refl ecting their large index weight—even if staple food prices such
as those for rice were far more stable, which the index fails to show. However, the 2007–2008 spike was due to
sharp price hikes across food staples.
Figure 1.1: Composite Monthly Real Food Price Index, 1990–2013 (2002–2004 = 100)
60
80
100
120
140
160
180
1990
1991
1992
1993
1994
1995
1996
1997
1998
1999
2000
2001
2002
2003
2004
2005
2006
2007
2008
2009
2010
2011
2012
2013
Re
al
foo
d p
ric
e i
nd
ex
Year
Notes:
1. The Food and Agriculture Organization of the United Nations (FAO) Food Price Index is a measure of the
monthly change in international prices of a basket of food commodities. It consists of the average of fi ve
commodity group (meat, dairy, cereals, oils and fats, and sugar) price indices (representing 55 quotations),
weighted with the average export shares of each of the groups for 2002–2004.
2. The composite food price index is defl ated using the World Bank Manufactures Unit Value (MUV) index, a
price index of internationally traded manufactured goods. Both the food price index and MUV are based to
2002–2004 prices.
Source: FAO. Food Price Index. http://www.fao.org/worldfoodsituation/wfs-home/foodpricesindex/en/ (accessed
15 April 2013).

Food Security in Asia and the Pacifi c
2
A confl uence of factors contributed to the drastic rise in global food prices. Rapid income growth along with growing populations in developing countries has been a key driver behind increasing global demand. In addition, the rising middle class is varying its diet with higher protein intake from a wider array of sources, increasing pressure on livestock and feed industries. This growing demand highlights the reshuffl ed use of agricultural resources—such as land, water, and feedstock—not to mention the potential for increased damage to the environment.
On the supply side, the world must meet an escalating demand for food on less land with limited access to water. Increased costs for fertilizer and fuel for storage and transport add further pressure. Climate change and its impact on agriculture cannot be ignored. Increasingly integrated global food supply chains imply that any regional shock could easily ignite ripple effects globally.
The Asia and Pacifi c region has been the epicenter of these global changes. Asia is continuing to experience a massive structural economic and social transformation, inevitably leaving a deeper footprint on global agricultural and ecological systems. Behind
Figure 1.2: Real Prices of Major Cereals, 1900–2011 (2002–2004 = 100)
Rea
l p
rices
0
100
200
300
400
500
600
700
1900
1903
1906
1909
1912
1915
1918
1921
1924
1927
1930
1933
1936
1939
1942
1945
1948
1951
1954
1957
1960
1963
1966
1969
1972
1975
1978
1981
1984
1987
1990
1993
1996
1999
2002
2005
2008
2011
Year
Rice Wheat Maize
Notes: Prices of all three cereals are indexed to 2002–2004. Cereal prices are defl ated using the Manufactures
Unit Value (MUV) index.
Sources: For data up to 2010, estimates by Grilli, E., and M. Yang. 1988. Primary Commodity Prices, Manufactured
Goods Prices, and the Terms of Trade of Developing Countries: What the Long Run Shows. The World Bank
Economic Review. 2 (1). pp. 1–47; as updated by Pfaffenzeller, S., P. Newbold, and A. Rayner. 2007. A Short Note
on Updating the Grilli and Yang Commodity Price Index. The World Bank Economic Review. 21 (1). pp. 151–163.
ADB calculations for 2011 and 2012 based on the methodology of Grilli and Yang (1988) with data on commodity
prices from the World Bank Commodity Price Data (Pink Sheets) and MUV from the World Bank Development
Prospects Group, http://go.worldbank.org/4ROCCIEQ50 (accessed 15 May 2013).

Introduction
3
this curtain of prosperity and progress, however, remain more than 60% of the world’s poor, facing widening inequality. These “two faces of Asia” make achieving food security far more complex and challenging for both Asia and the world at large. While economic advancement and structural transformation create increasingly complex constraints on the agricultural resources needed for food security, huge areas continue to struggle against poverty and food insecurity.
Asia’s share in global food consumption, measured in calories consumed, is increasing—from a 52.9% average during 1990–1994 to a 54.3% average during 2005–2009 (Figure 1.3). Consumption per capita in Asia and the Pacifi c went up from 2,379 kilocalories per capita per day (kCal/capita/day) in 1990 to 2,665 kCal/capita/day in 2009—an average annual increase of 0.6% compared with a 0.4% growth in global per capita consumption over the same period. Despite this rapid increase, per capita consumption in the region remains below the global average (Figure 1.4).
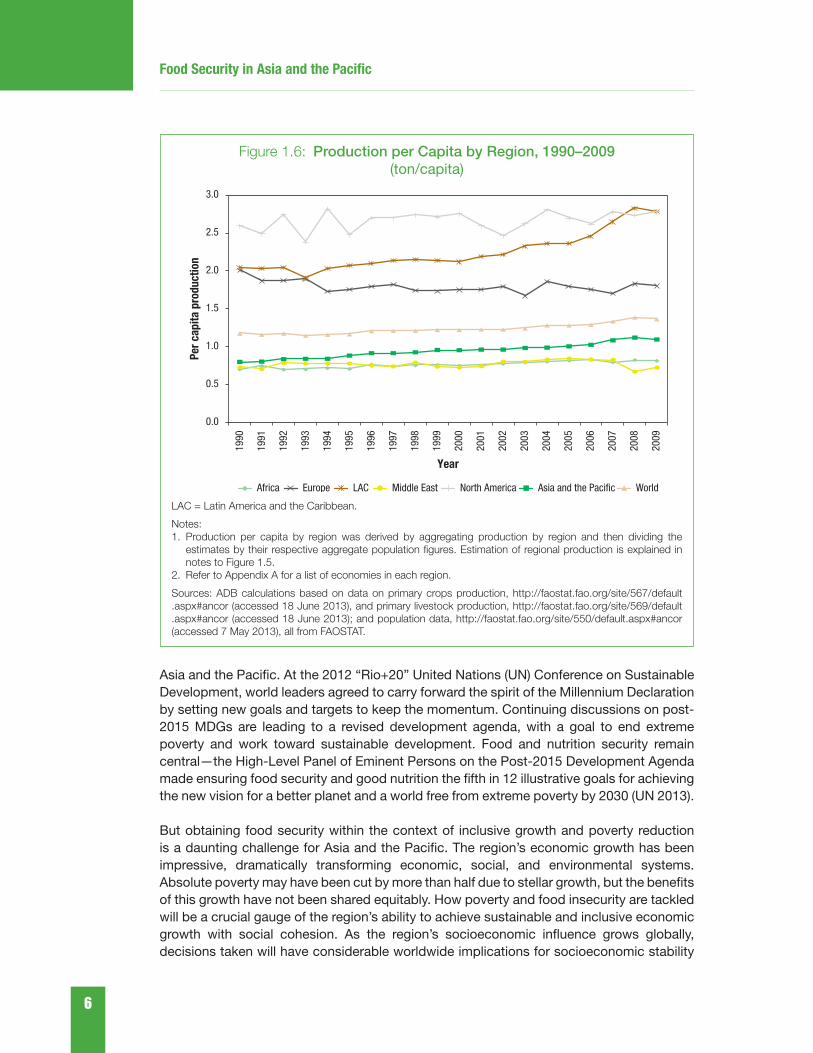
The region’s share in global food production (crops and livestock) also increased, from an average share of 40.9% in 1990–1995 to 46.3% in 2005–2009 (Figure 1.5). Food production in Asia and the Pacifi c increased from 0.8 tons per capita (ton/capita) in 1990 to 1.1 ton/capita in 2009. This annual 1.7% growth was the fastest among the world’s various regions—
Figure 1.3: Share in Global Consumption by Region, 1990–2009 (%)
0
10
20
30
40
50
60
70
80
90
100
Sh
are
in
glo
ba
l con
su
mp
tion
1990–1994 1995–1999 2000–2004 2005–2009
Years
Africa Europe LAC Middle East North America Asia and the Pacific
LAC = Latin America and the Caribbean.
Notes:
1. Total consumption by region was derived by multiplying each economy’s consumption per capita with its
population data for each year. Economy-level consumption was then aggregated up to the regional level for
each year. Share in global consumption is the average share for the periods shown.
2. Refer to Appendix A for a list of economies in each region.
Sources: ADB calculations based on consumption data from the Food Balance Sheets, http://faostat.fao.org/
site/368/default.aspx#ancor (accessed 10 April 2013), and population data, http://faostat.fao.org/site/550/
default.aspx#ancor (accessed 7 May 2013), both from the FAO statistical database FAOSTAT.

Food Security in Asia and the Pacifi c
4
more than double the world average growth of 0.8% during the same period. Nonetheless, production per capita in Asia and the Pacifi c remains below the global average (Figure 1.6).
Price surges and concern over global food security carry a sense of déjà vu. Global attention emerged during the mid-1970s global food price crisis. While the initial focus was on food supply, the meaning of “food security” has broadened over time to include adequate nutrition and suffi cient “food access” by the most vulnerable—to balance the demand side of the equation.
However, urgency lost its impetus as real food prices steadily declined from their mid-1970s peak until they hit an all-time low in the early 2000s (Figures 1.1, 1.2). Declining prices brought complacency and led to decades of neglect in agricultural and rural development, allowing demand pressures to catch up. The probable causes of the crisis of the latter part of the fi rst decade of the 2000s resemble those of the mid-1970s crisis. Both derived from high oil prices, low food stocks, dollar devaluation, demand shocks—the use of biofuels in the late 2000s against large United States (US) cereal exports to the former Soviet bloc in the
Figure 1.4: Consumption per Capita by Region, 1990–2009(kCal/capita/day)
Per
ca
pit
a c
on
su
mp
tion
2,000
2,200
2,400
2,600
2,800
3,000
3,200
3,400
3,600
3,800
4,000
1990
1991
1992
1993
1994
1995
1996
1997
1998
1999
2000
2001
2002
2003
2004
2005
2006
2007
2008
2009
Year
Africa Europe LAC Middle East North America Asia and the Pacific World
kCal = kilocalorie, LAC = Latin America and the Caribbean.
Notes:
1. Consumption per capita by region was derived by aggregating consumption in all economies in each region
and then dividing it by the region’s total population. Estimation of aggregate regional consumption is explained
in notes to Figure 1.3.
2. Refer to Appendix A for a list of economies in each region.
Sources: ADB calculations based on consumption data from the Food Balance Sheets, http://faostat.fao.org/
site/368/default.aspx#ancor (accessed 10 April 2013), and population data, http://faostat.fao.org/site/550/
default.aspx#ancor (accessed 7 May 2013), both from FAOSTAT.

Introduction
5
1970s—and weather-related supply shocks. These similarities underscore the unfi nished reform agenda, despite international efforts to tackle underlying structural problems in the global food system.
The issue of food security remains an integral part of the international development policy discourse. Poverty and food insecurity remain closely interrelated. Poor food and nutrition critically damage people’s health, retard human development, and lower labor productivity over the long term. About 868 million people worldwide are chronically undernourished, with nearly all (97.5%) in developing countries. Scientifi c research shows that poor nutrition weakens the immune system, increasing disease incidence and severity (for example, Chandra 1991, 1997; Tomkins and Watson 1989). Malnutrition and undernourishment also damage physical and cognitive development, especially among children—leading to chronic health problems later, and impeding work and productivity.
With the 2015 target for attaining the Millennium Development Goals (MDGs) fast approaching, those relating to hunger and nutrition have not been met in many parts of
Figure 1.5: Share in Global Production by Region, 1990–2009 (%)
0
10
20
30
40
50
60
70
80
90
100
1990–1994 1995–1999 2000–2004 2005–2009
Sh
are
in
glo
ba
l p
rod
ucti
on
Years
Africa Europe LAC Middle East North America Asia and the Pacific
LAC = Latin America and the Caribbean.
Notes:
1. Production by region was derived by aggregating production in all economies in each region for each year.
Economy-level food production data was computed by adding the total of primary crop production and
primary livestock production, with all commodity production data measured in tons. Share in global production
is the average share for the periods shown.
2. Refer to Appendix A for a list of economies in each region.
Sources: ADB calculations based on primary crop production data, http://faostat.fao.org/site/567/default.aspx
#ancor (accessed 18 June 2013), and primary livestock production data, http://faostat.fao.org/site/569/default
.aspx#ancor (accessed 18 June 2013); and population data, http://faostat.fao.org/site/550/default.aspx#ancor
(accessed 7 May 2013), all from FAOSTAT.
Food Security in Asia and the Pacifi c
6
Figure 1.6: Production per Capita by Region, 1990–2009(ton/capita)
0.0
0.5
1.0
1.5
2.0
2.5
3.0P
er
ca
pit
a p
rod
ucti
on
Africa Europe LAC Middle East North America Asia and the Pacific World
1990
1991
1992
1993
1994
1995
1996
1997
1998
1999
2000
2001
2002
2003
2004
2005
2006
2007
2008
2009
Year
LAC = Latin America and the Caribbean.
Notes:
1. Production per capita by region was derived by aggregating production by region and then dividing the
estimates by their respective aggregate population fi gures. Estimation of regional production is explained in
notes to Figure 1.5.
2. Refer to Appendix A for a list of economies in each region.
Sources: ADB calculations based on data on primary crops production, http://faostat.fao.org/site/567/default
.aspx#ancor (accessed 18 June 2013), and primary livestock production, http://faostat.fao.org/site/569/default
.aspx#ancor (accessed 18 June 2013); and population data, http://faostat.fao.org/site/550/default.aspx#ancor
(accessed 7 May 2013), all from FAOSTAT.
Asia and the Pacifi c. At the 2012 “Rio+20” United Nations (UN) Conference on Sustainable Development, world leaders agreed to carry forward the spirit of the Millennium Declaration by setting new goals and targets to keep the momentum. Continuing discussions on post-2015 MDGs are leading to a revised development agenda, with a goal to end extreme poverty and work toward sustainable development. Food and nutrition security remain central—the High-Level Panel of Eminent Persons on the Post-2015 Development Agenda made ensuring food security and good nutrition the fi fth in 12 illustrative goals for achieving the new vision for a better planet and a world free from extreme poverty by 2030 (UN 2013).
But obtaining food security within the context of inclusive growth and poverty reduction is a daunting challenge for Asia and the Pacifi c. The region’s economic growth has been impressive, dramatically transforming economic, social, and environmental systems. Absolute poverty may have been cut by more than half due to stellar growth, but the benefi ts of this growth have not been shared equitably. How poverty and food insecurity are tackled will be a crucial gauge of the region’s ability to achieve sustainable and inclusive economic growth with social cohesion. As the region’s socioeconomic infl uence grows globally, decisions taken will have considerable worldwide implications for socioeconomic stability

Introduction
7
and environmental sustainability—fundamental prerequisites for achieving food security. How the region enmeshes economic growth, structural transformation, and demographic transition will be a critical determinant for successfully building food security—not just for the region, but for the world.
In 2012, the Asian Development Bank (ADB), in collaboration with Foreign Affairs, Trade and Development Canada (DFATD); the Asia-Pacifi c Economic Cooperation (APEC); and the Liu Institute for Global Issues at the University of British Columbia (UBC), set out to further understand, synthesize, and articulate key policy challenges and opportunities related to food security in Asia and the Pacifi c. A multidisciplinary approach was used to conduct comprehensive research on the various economic, social, and environmental aspects of food security. While analyzing the dynamics of food markets globally, regionally, and nationally, the study focused on the issues particularly relevant to Asia and the Pacifi c. Given the region’s size and diversity, some issues were examined in aggregate, while others were studied at the subregional or national level.
This synthesis report, while collating the fi ndings of the various studies, highlights major themes that resonated throughout the research—demand and supply considerations, the effects of climate change, sustainable agriculture, and policy options for attaining food security. In sum, there are three main ways to enhance food security:
(i) ensuring the sustainability of global food systems, to meet growing food demand without sacrifi cing the resources of future generations; improving production and delivery effi ciency; and maximizing the benefi ts of international trade;
(ii) reducing poverty and people’s vulnerability to food insecurity, to ensure the ability to purchase suffi cient and nutritious food; reducing the price impact on real incomes of poor households; and providing effective social safety nets for those bypassed by rapid economic growth and poverty reduction efforts; and
(iii) establishing risk management systems and tools, to provide food-based safety nets that offer immediate relief to disadvantaged groups during crises; building adequate emergency food reserves and relief systems as a buffer to natural and human-made disasters; and introducing risk management systems and tools such as crop insurance and futures contracts to help mitigate the effects of price volatility and crises.
The remainder of the report is organized as follows. In the context of the region’s rapid structural transformation, Section II discusses the defi nition of food security and what it means for Asia and the Pacifi c. Section III reviews household access to food, focusing on the relationship between food security and poverty reduction, the importance of nutrition in changing dietary patterns, the impact of food crises on poverty and health, and the role of social safety nets. Section IV examines food availability, analyzing structural problems in food production systems rooted in constraints on agricultural resources, productivity, and research. Section V discusses the challenges of getting food “from farm to fork”—through effi cient transportation, logistics, and international trade. Section VI assesses the effects of climate change. Section VII offers a policy framework for enhancing food security in the region. A summary and conclusion follow in Section VIII.
8
II. Food Security: What It Means for Asia and the Pacific
Food is different from other usual commodities in that there is no substitute. All humans require adequate food for survival. Security over the next meal is essential. The 1996 World Food Summit defi ned food security as existing “when all people at all times
have access to suffi cient, safe, nutritious food to maintain a healthy and active life.”2 Food security, according to the World Health Organization (WHO), rests on three pillars:3
(i) Food availability covers the supply side. Is there enough to feed people? Food availability is determined by food production and technology, inventory, effi ciency of supply chains, and local and international trade.
(ii) Food access is the ability to obtain adequate quantities of food, the purchasing power needed, and adequate delivery mechanisms, including social safety nets; and
(iii) Food utilization refers to the need to meet dietary needs and cultural preferences.
Food security also means certainty about future meals. Not knowing where the next meal will come from alters economic behavior. Providing for future meals takes precedence over other expenditures, such as education, health, and shelter. Beyond household concerns, food price infl ation can trigger the demand for wage increases, igniting a vicious infl ationary cycle that could discourage private investment and slow economic activity in general. This reduces investment in human and physical capital, and can damage a country’s long-run growth prospects.
In Asia and the Pacifi c, food security is being fundamentally altered—as patterns of food consumption and production change with the drive for global food sustainability. These forces stem from the region’s huge population, changing demographics, and spectacular economic rise. The dramatic structural transformation economically, socially, and culturally holds important consequences for the global food system.
Asia’s Growing Population and Economic Size
Already home to 56% of the global population, Asia and the Pacifi c will account for one-third of the projected 2.6-billion increase in global population between 2010 and 2050 (Figure 2.1). Of this 853 million increase in Asia and the Pacifi c, 71% will be in South Asia. In economic terms, developing Asia and the Pacifi c4 is also the world’s fastest-growing
2 See http://www.fao.org/docrep/003/w3613e/w3613e00.HTM for the Rome Declaration on World Food Security. 3 See http://www.who.int/trade/glossary/story028/en/4 Developing Asia and the Pacifi c refers to economies listed in Appendix A excluding Australia, Japan,
New Zealand, and Singapore.

Food Security: What It Means for Asia and the Pacifi c
9
Figure 2.1: Estimated Change in Population between 2010 and 2050(millions)
Pop
ula
tion
Africa, 1,362.09
LAC, 185.37
North America, 99.70
Europe, –8.52
Middle East, 144.36
Asia and the Pacific, 853.27
Central and West Asia, 24.85
South Asia, 604.48
Southeast Asia, 189.43East Asia, 13.54 Pacific, 20.96
500
–500
0
1,000
1,500
2,000
2,500
3,000
World Asia and the Pacific
Regions
LAC = Latin America and the Caribbean.
Note: Refer to Appendix A for a list of economies in each region.
Source: ADB calculations based on economy-level estimates of the projected population (based on the
assumption of medium-fertility variant) from the United Nations (UN) Department of Economic and Social Affairs,
Population Division. 2013. World Population Prospects: The 2012 Revision. http://esa.un.org/wpp/Excel-Data/
population.htm (accessed 15 June 2013).
region—with real GDP expanding at an annual average of 7.6% during 1990–2010, far exceeding the 3.4% global average. Using a baseline scenario of continued growth trends, an ADB study (2011) suggests developing Asia will account for more than half of global GDP by 2050.5 More than 60% of cereal demand in the developing world will come from South and East Asia by 2030, with cereal demand expected to increase 1.6% annually in South Asia and 1.2% in East Asia from 1999 to 2030 (ADB 2009b).
The rise of Asia’s two giant economies—the People’s Republic of China (PRC) and India—could dramatically alter global and regional food systems. The PRC and India together account for 37% of the world’s population, but available arable land and water supplies are limited relative to the number of people. While food demand is fast increasing with rising incomes and population, ensuring suffi cient supply presents potentially huge challenges. Aside from evolving national systems, the scale and pace of change in socioeconomic development in the PRC and India will impact global and regional food systems as well.
5 According to one estimate (ADB 2011), average per capita income in the People’s Republic of China (PRC), India, Indonesia, Japan, the Republic of Korea, Malaysia, and Thailand is projected to top $45,800 (purchasing power parity [PPP]) by 2050.

Food Security in Asia and the Pacifi c
10
Urbanization and Dietary Change
Asia’s urban population share almost doubled from 24.6% in 1970 to 46.5% in 2010—and it is expected to reach 70% by 2050 (UN 2012).6 Urbanization infl uences dietary patterns through the sociocultural environment and lifestyle, while eroding agricultural and land resources used for cultivation. The net effect of this on the global food system is complex, with varying impacts on food demand and supply. These are important structural transformations and are affecting global food market dynamics and price movements.
Asia’s growing middle class has diversifi ed its diet away from staple cereals toward meat, dairy products, fruits, and vegetables (Figure 2.2). Rapid urbanization and the rise of megacities are fuelling this trend. This has led to a signifi cant decline in the share of cereals in total caloric intake. Higher-value items such as processed foods, meat and dairy products, and tropical beverages are increasingly popular. Projections show most of the increase in animal protein demand by 2030 and beyond will likely come from developing Asia. For example, between 2000 and 2030, the annual consumption of beef is expected to increase by 25.4 million tons, of which almost half (12.2 million tons) will be from Asia (FAO 2011). In the case of poultry, annual consumption in 2030 is expected to increase by 60.3 million tons relative to 2000 levels, more than half (34.0 million tons) of which will come from Asia.
6 This estimate is based on economies in Central and West Asia, East Asia, South Asia, and Southeast Asia as listed in Appendix A.
Figure 2.2: Changing Dietary Composition in Asia and the Pacifi c, 1961–2009 (%)
0
10
20
30
40
50
60
70
80
90
100
1992 2009 1961 1991 2009 1961 1991 2009 1961 1991 2009 1961 1991 2009
Central and West Asia
Southeast Asia East Asia South Asia Pacific
Sh
are
in
tota
l ca
lori
c in
tak
e
Year and subregion
CerealsFruits and vegetables
Starchy rootsSugar
PulsesOil and fats
Meat and fishOil crops
Dairy and eggsOthers
Note: Refer to Appendix A for a list of economies in each region.
Source: ADB estimates based on the Food Balance Sheets, FAOSTAT. http://faostat.fao.org/site/368/default
.aspx#ancor (accessed 10 April 2013).

Food Security: What It Means for Asia and the Pacifi c
11
Changing dietary patterns in the PRC are signifi cantly infl uencing global food markets and prices. Incomes and demographic trends have already led to an increase in meat, dairy, and fi sh consumption as well as boosted general caloric intake (Figure 2.3). While the PRC has achieved remarkable growth in agricultural production—as annual per capita agricultural output growth averaged over 3.8% from 1978 to 2011 (Organisation for Economic Co-operation and Development [OECD]-FAO 2013)—rapid demand growth has turned the PRC into one of the world’s leading importers of a wide range of agricultural products, particularly oilseeds; its market share was estimated at 54% of the global total for 2011–2012. The country’s appetite for meat, especially pork, is also potentially changing global meat and feed balances fundamentally. In the last 30 years, meat consumption has increased by more than 5 times in the PRC and now reaches more than 70 million tons per year (ton/year)—or a quarter of world supply (Larsen 2012). Higher meat consumption also implies higher demand for feed. Evidence shows the recent price surge in soybeans may derive from growing demand in the PRC, not solely for direct consumption (as in soybean products and vegetable oils), but for indirect consumption as well (feed for livestock). This increased demand for livestock and feedstock adds stress to food production systems and impacts the environment.
Figure 2.3: Average Protein Supply per Capita and Consumption per Capita of the PRC Relative to the US, 1990–2009
1990
1991
1992
1993
1994
1995
1996
1997
1998
1999
2000
2001
2002
2003
2004
2005
2006
2007
2008
2009
0.500
0.550
0.600
0.650
0.700
0.750
0.800
0.850
Ra
tio o
f th
e P
RC
to t
he U
S
Year
Average protein supply per capita Consumption per capita
PRC = People’s Republic of China, US = United States.
Notes:
1. Data on the average protein supply per capita are 3-year averages. Data for 1992 is the average for 1990–
1992 and so on.
2. Consumption per capita estimates are expressed in kilocalorie/capita/day (kCal/capita/day).
3. Ratios are computed by dividing the PRC fi gures by those for the US.
Source: ADB calculations based on estimates from Food Security Indicators, http://www.fao.org/economic/
ess/ess-fs/ess-fadata/en/ (accessed 23 April 2013), and data from Food Balance Sheets, http://faostat.fao.org/
site/368/default.aspx#ancor (accessed 10 April 2013), both from FAOSTAT.

Food Security in Asia and the Pacifi c
12
Structural Transformation and Sustainable Agriculture
Asia’s stellar economic growth brought with it a fundamental structural transformation, characterized by a drop in agricultural share of GDP and employment. This continuing structural transformation creates increasingly complex constraints on the availability and sustainability of natural resources needed to achieve food security. The only sensible solution is to enhance agricultural productivity through higher yields, using scarce natural resources better, and increasing the effi ciency of product use—for example, improving the effi ciency of product delivery and minimizing waste. Meeting future demand for food without compromising the needs and resources of future generations is paramount. The forces of rapid industrialization and urbanization, and the region’s structural transformation generally compound this challenge. Growing competition and the overexploitation of natural resources increasingly constrict the region’s ability to produce food.7 The increased use of petroleum products has secondary effects on food prices through increased costs of energy and fertilizers, while some agricultural production has been diverted toward biofuel production.
Climate Change
Climate change will impact the availability of agricultural resources and the sustainability of food security. Many countries in the region are vulnerable to climate change—as seen through severe fl oods and droughts in recent years. Rising temperatures could reduce crop productivity in tropical regions. One study (Piao et al. 2010) estimates that the yield potential in the PRC for major crops—rice, wheat, and maize—could fall from the 2000 baseline by 15% to 25% by 2050. Yields are expected to decline in tropical regions such as South and Southeast Asia through at least 2100. According to one estimate, relative to 1990, rice yields in Southeast Asia are projected to fall some 50% by 2100 (ADB 2009c). Climate change could impact food production in other ways, including changes in rainfall patterns and warming surface waters—oceans, rivers, and lakes—already pressuring fi sheries. Despite the uncertainty over its full impact on food productivity, it is clear climate change poses a serious risk to future food security.
Finally, when considering food security in Asia and the Pacifi c, the special role of rice cannot be understated. Rice is the staple food for much of Asia and the Pacifi c, providing a large portion of daily caloric intake (Table 2). Historically, rice price stability was crucial for urban wage earners during rapid economic growth and industrialization in many Asian economies (Timmer 2012b). Its economic and political importance is indisputable, refl ected largely in heavy government market intervention and proclaimed self-suffi ciency across Asia’s rice-consuming countries. But with the global rice market relatively thin compared with other crops, rice price volatility is far more pronounced than for most other staple foods. Although the share of rice in caloric intake is falling rapidly, rice remains a major food item for the poor, who spend disproportionately more of their household budgets on rice compared with the nonpoor (Timmer 2012b). This helps explain why Asian countries were so greatly alarmed by the huge price increases in rice during the 2007–2008 food crisis.
7 See Kandlikar and Ramankutty (2012) for a discussion on the implications of the competing demand for land use.

Food Security: What It Means for Asia and the Pacifi c
13
Table 2: Rice Consumption, Caloric Intake, and Percentage of Calories from Rice, 1990–1992 and 2007–2009
Region
1990–1992 2007–2009
Average Rice Consumption
(kCal/capita/day)
Average Total Food
Consumption (kCal/capita/day)
Average Share of Rice in Total Food
Consumption (%)
Average Rice Consumption
(kCal/capita/day)
Average Total Food
Consumption (kCal/capita/day)
Average Share of Rice in Total Food
Consumption (%)
Southeast Asia 1,176 2,177 54.0 1,255 2,626 47.8
South Asia 772 2,234 34.6 736 2,340 31.4
East Asia 797 2,568 31.0 775 2,955 26.2
World 532 2,613 20.4 537 2,816 19.1
LAC 255 2,656 9.6 262 2,913 9.0
Africa 170 2,299 7.4 209 2,556 8.2
Middle East 260 2,888 9.0 244 2,992 8.1
Pacifi c 97 3,043 3.2 142 3,143 4.5
North America 73 3,487 2.1 89 3,707 2.4
Central and West Asia 97 2,606 3.7 59 2,787 2.1
Europe 44 3,307 1.3 54 3,400 1.6
kCal = kilocalorie, LAC = Latin America and the Caribbean.
Notes:
1. Regions are arranged in the descending order of share of calories derived from rice averaged for 2007–2009.
2. Regional estimates of total consumption and rice consumption are weighted averages of economies in that region with weights
being population share of economies in that region.
3. Average shares are obtained by averaging annual shares for 1990–1992 and 2007–2009.
4. For Central and West Asia, estimates for 1990–1992 make use of data for 1992 only as data are not available prior to that.
5. Refer to Appendix A for a list of economies in each region.
Sources: ADB estimates based on consumption data from the Food Balance Sheets, http://faostat.fao.org/site/368/default
.aspx#ancor (accessed 10 April 2013); and population data, http://faostat.fao.org/site/550/default.aspx#ancor (accessed 7 May 2013),
both from FAOSTAT.
14
III. Access to Food: Poverty, Nutrition, and the Impact of Food Crises
For most people, access to food is a matter of purchasing power. The rich are never in want, except in extreme circumstances of war or natural disasters. And obviously, even then, the poor are affected far more severely. Thus, higher per capita income
resulting from economic growth brings with it food security.
Poverty and Undernourishment in Asia and the Pacific
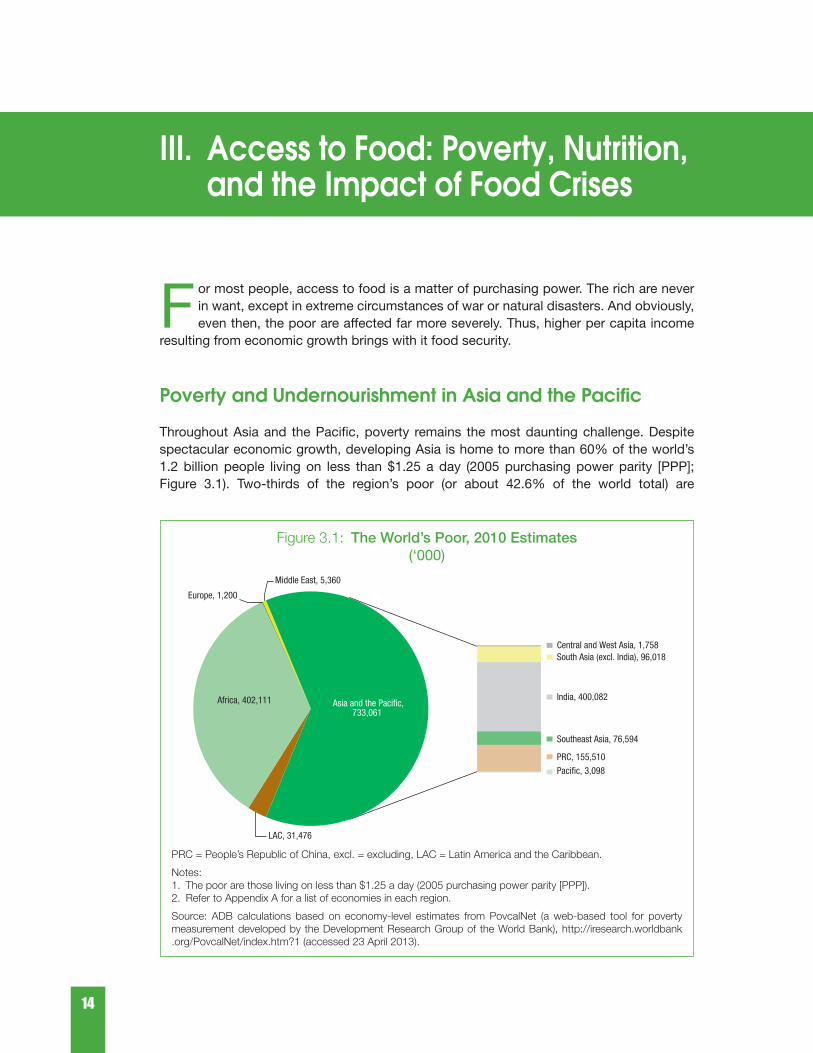
Throughout Asia and the Pacifi c, poverty remains the most daunting challenge. Despite spectacular economic growth, developing Asia is home to more than 60% of the world’s 1.2 billion people living on less than $1.25 a day (2005 purchasing power parity [PPP]; Figure 3.1). Two-thirds of the region’s poor (or about 42.6% of the world total) are
Figure 3.1: The World’s Poor, 2010 Estimates(‘000)
LAC, 31,476
Africa, 402,111
Europe, 1,200
Middle East, 5,360
Central and West Asia, 1,758 South Asia (excl. India), 96,018
India, 400,082
Southeast Asia, 76,594
PRC, 155,510
Pacific, 3,098
Asia and the Pacific,733,061
PRC = People’s Republic of China, excl. = excluding, LAC = Latin America and the Caribbean.
Notes:
1. The poor are those living on less than $1.25 a day (2005 purchasing power parity [PPP]).
2. Refer to Appendix A for a list of economies in each region.
Source: ADB calculations based on economy-level estimates from PovcalNet (a web-based tool for poverty
measurement developed by the Development Research Group of the World Bank), http://iresearch.worldbank
.org/PovcalNet/index.htm?1 (accessed 23 April 2013).

Access to Food: Poverty, Nutrition, and the Impact of Food Crises
15
concentrated in South Asia. The region has 537 million undernourished people, about 62% of the global total (Figures 3.2). Within Asia and the Pacifi c, regional disparities are large. Of Asia’s malnourished, 299 million are in South Asia alone, more than the 237 million in Africa. The number of malnourished children is particularly alarming. Childhood stunting exceeds
Figure 3.2: The World’s Undernourished(millions)
2010–2012
1990–1992
Africa, 173
Middle East, 11
Central and West Asia, 10
Southeast Asia,133
East Asia,261
South Asia,325
Pacific, 1
LAC, 65
Asia and the Pacific,730
Africa, 237
Middle East, 24
Central and West Asia, 5
Southeast Asia,65
East Asia,167
South Asia,299
Pacific, 1
LAC, 49
Asia and the Pacific,537
LAC = Latin America and the Caribbean.
Notes:
1. The undernourished are those with a caloric intake less than the minimum daily requirement. Averages for
1990–1992 and 2010–2012 are shown.
2. Refer to Appendix A for a list of economies in each region.
Source: ADB calculations based on economy-level estimates from the FAO Food Security Indicators,
http://www.fao.org/economic/ess/ess-fs/ess-fadata/en/ (accessed 23 April 2013).

Food Security in Asia and the Pacifi c
16
40% in several Asian and Pacifi c island economies. This proportion is comparable with Sub-Saharan Africa, but larger in absolute numbers.
Food insecurity and poverty go hand in hand. Higher per capita income growth brings more poverty reduction (Figure 3.3). Sustained poverty reduction increases household capacity to purchase essential commodities, including food. Thus, sustained poverty reduction enhances long-term food security. Economic growth also improves food security through greater spending on infrastructure, improving delivery. The higher government revenue that accompanies economic growth can also be used to provide social safety nets, including those targeting food defi cits.
Figure 3.3: Growth and Change in Poverty in Low- and Middle-Income Economies, 1990–2010
GDP = gross domestic product, N = sample size, R-sq = R-squared.
Notes:
1. GDP per capita is based on GDP measured in constant 2005 PPP$.
2. Poverty headcount ratio is the proportion of the population living on less than $1.25 a day (2005 PPP), and is
expressed in percent.
3. Percentage point change in poverty headcount ratio is computed as the difference of the values between
2010 and1990.
4. The line shown is obtained from the linear regression of the percentage point change in poverty headcount
ratio (y) during 1990–2010 on the average GDP per capita growth (x) during 1990–2010. The regression
results are embedded in the chart. The coeffi cient on average GDP per capita growth is statistically signifi cant
at the 5% level of signifi cance.
5. Economies in Asia and the Pacifi c are shown in brown.
6. Refer to Appendix B for a list of three-character economy codes.
Sources: ADB calculations based on GDP data from the World Bank World Development Indicators (WDI),
http://data.worldbank.org/data-catalog/world-development-indicators (accessed 22 April 2013); and poverty
estimates from PovcalNet, http://iresearch.worldbank.org/PovcalNet/index.htm?1 (accessed 23 April 2013).
ALBDZA AGO
BLRBLZBEN
BOL
BIH
BWABRA
BFA
BDI CMR
CPV
CAFTCD
CHL
COM
COD
COGCRI
CIV
DJI DOMECUEGY
SLV
ETH
GAB
GMB
GHAGTM
GIN
GNB
GUY
HTI
HND
IRNJORKEN
LVA
LSO
LBR
LTU
MDG
MWI
MLI
MRT
MEX
MDA
MAR
MOZNAMNIC
NER
NGA
PAN
PRY
PER
ROURWA
SEN
SRB
SLEZAF
LCA
SDN
SUR
SWZ
SYRTZATGO
TUNTUR
UGA
UKR URYVENPSE YEM
ZMB
ARM
BAN
BHU
CAM
PRC
FIJ
IND
INO
KAZKGZ
LAOMLD
NEPPAK
PNG
PHI SRI
TAJ
THA
TKM
VIE
Perc
en
tag
e p
oin
t ch
an
ge in
povert
y h
ea
dcou
nt
rati
o
−5 0 5 10 15
Average annual GDP per capita growth
(%)
y = −7.68 − 2.81xR−sq = 0.13, N = 102
40
20
0
–20
–40
–60

Access to Food: Poverty, Nutrition, and the Impact of Food Crises
17
One could argue a two-way relationship between long-term sustained growth and food security. Those well nourished are likely to be healthier and less prone to illness, and therefore contribute to higher productivity and economic growth. Food insecurity can impede household investment in education and health, disrupting human capital formation and undermining long-term growth prospects. Food insecurity itself can create instability in households, communities, and nations—further impeding growth and development.
Food insecurity and poverty incidence, however, differ in several important aspects. First, poverty incidence relates to the consumption of a wide range of goods, of which food is only one, though the most important. Poverty line studies (which determine the per capita expenditure level below which one is deemed poor) particularly focus on the expenditure level that coincides with an adequate diet.
A second, more basic difference is that poverty incidence refers to current circumstances, not expectations. At the time a household is surveyed, consumption levels of food and other goods either are or are not adequate. If they are not, the household is deemed poor. But food security refers more to expectations than today’s circumstances. Individuals or households may judge themselves food insecure even if their present food consumption is suffi cient. “Vulnerability to poverty” is conceptually closer to food insecurity than “poverty incidence.” And while vulnerability to poverty is statistical, based on circumstances observable in the present, food security inherently involves perceptions—expectations about the future.
Differences between the concepts of food insecurity and poverty incidence notwithstanding, food insecurity is closely related with income and poverty. Poor people are the most likely to be hungry, and a reduction in the prevalence and depth of poverty will likely improve food security indicators. Evidence shows an inverse relationship between various measures of food insecurity (prevalence of undernourishment, depth of food defi cit, and prevalence of food inadequacy) and per capita income (Figures 3.4a, 3.4b, 3.4c).
Various indicators of food security show impressive progress, but undernourishment remains a serious problem (Table 3.1). What is striking is the difference in the rate at which undernourishment has declined in different parts of the world. Between 1990–1992 and 2010–2012, the number of undernourished in Asia (Figure 3.2) was reduced by 26.5%—from 730 million in 1990–1992 to 537 million in 2010–2012—far exceeding the global decline of 13.2% (from 1 billion in 1990–1992 to 868 million in 2010–2012). In Africa, the number of undernourished increased 37% over the same period. Results also varied widely within Asia. In Southeast Asia, the absolute number of undernourished people declined by more than 50%, with East Asia not far behind at 36%. But in South Asia the decline—8%—was much lower. Differences in poverty reduction could be one of the reasons. Economies which show a greater reduction in poverty incidence also show a greater decline in prevalence of undernourishment (Figure 3.5). Improved economic access to food combined with rapid growth and poverty reduction was key to the decline in undernourishment.
While the share of undernourished in the population refl ects the prevalence of poverty, it does not say anything about the extent of undernourishment—which is defi ned as the difference between actual intake and minimum daily caloric requirement among those undernourished. This is referred to as the “depth” of the food defi cit and is measured

Food Security in Asia and the Pacifi c
18
Figure 3.4a: Prevalence of Undernourishment and Income, 2010–2012
LBR
ERIBDI
NER
CAF
MWI
MOZMDG
TGO
ETH
MLI
SLE
COM
GIN
HTI
GNB
RWABFA
UGATZATCD
ZMB
BEN
LSO
KEN
GHA
CIV
GMB
SEN
STP
CMR
NGA
YEM
MRT
GUY
IRQ
NIC
CPVHND
COG
MAR
GTM
BOL
SYR
PRYAGOSWZ
EGY
NAM
BLZ
SLV SUR
ECU
DZA
DOMCOLPER
GRD
ZAF
BRA
LCA
CRI
VEN
MUS
MEX
BWA
TUR
PAN
GABCHL
KNA
ATG
SAU
SYCTTO
BHS
AFG
NEP
TIM
BAN
TAJ
CAM
KIR
KGZ
LAO
PAK
SOL
UZB
VIE
INDPHI
VAN
MON
INO
GEOSRI
PRC
MLD
THA
MAL
Lo
g o
f a
vera
ge p
reva
len
ce o
f u
nd
ern
ou
rish
men
t
6 7 8 9 10 11
Log of average GDP per capita
y = 6.46 − 0.47xR−sq = 0.31, N = 1034
3
2
1
0
GDP = gross domestic product, N = sample size, R-sq = R-squared.
Notes:
1. GDP per capita is based on GDP measured in constant 2005 PPP$. Average GDP per capita for 2010–2012
is shown.
2. Prevalence of undernourishment is defi ned as the proportion of the population with a caloric intake less than
the minimum daily requirement and is expressed in percent. Average prevalence of undernourishment for
2010–2012 is shown.
3. The line shown is obtained from the linear regression of the log of prevalence of undernourishment (y)
averaged for 2010–2012 on the log of GDP per capita (x) averaged for 2010–2012. The regression results are
embedded in the chart. The coeffi cient on log of average GDP per capita is statistically signifi cant at the 1%
level of signifi cance.
4. Economies in Asia and the Pacifi c are shown in brown.
5. Refer to Appendix B for a list of three-character economy codes.
Sources: ADB estimates based on undernourishment data from the FAO Food Security Indicators, http://www
.fao.org/economic/ess/ess-fs/ess-fadata/en/ (accessed 23 April 2013); and GDP data from the World Bank WDI,
http://data.worldbank.org/data-catalog/world-development-indicators accessed (22 April 2013).
in kCal/capita/day. Along with the reduction in the prevalence of undernourishment, the depth of the food defi cit has also fallen over the last 20 years (Table 3.1). Not only is there a smaller share of undernourished people today, but they are also less so than in 1990–1992. Globally, the depth of the food defi cit declined 28%—from 130 kCal/capita/day in 1990–1992 to 94 kCal/capita/day in 2010–2012. In Asia, the depth of the food defi cit declined by as much as 37% over the period, while in Africa the decline was only 10%—making the depth of food defi cit there among the highest in the world. Among Asian economies, the variation is signifi cant. Southeast Asia shows a 64% reduction in food defi cit from 214 kCal/capita/day to 77 kCal/capita/day, while the food defi cit in South Asia declined by only 27% from 174 kCal/capita/day to 127 kCal/capita/day. South Asia’s food defi cit

Access to Food: Poverty, Nutrition, and the Impact of Food Crises
19
Figure 3.4b: Depth of Food Defi cit and Income, 2010–2012
LBR
ERIBDI
NER
CAFMWI
MOZMDG
TGO
ETH
MLI
SLE
COM
GIN
HTI
GNB
RWABFAUGA
TZATCDZMB
BEN
LSO
KEN
GHA
CIV
GMBSEN
STP
CMR
NGA
YEM
MRT
MDA
GUY
NIC
CPVHND
COG
MAR
GTMBOL
SYR
PRYAGO
JOR
SWZ
EGY
NAM
BLZ
SLV
UKR
SUR
ECU
BIHDZA
ALB
TUN
DOMCOLPER
MKDVCT
GRD
ZAF
SRBBRA
LCA
MNECRI
ROU
VENDMA
BGRMUS
MEX
BWA
LBN
BLR
URY
TUR
PAN
GABLVA
RUS
CHL
KNA
HRVLTU
ATG
HUN
EST
POL
SVK
SAU
POR
SYCTTO
MLT
GRC
CZESVN
CYP
ISR
SPA
ITA
BHS
FRA
FIN
DENUKG
BEL
ISL
GER
SWE
CAN
IREAUT
NET
SWI
USA
ARE
KWT
NOR
NEP
TIM
BAN
TAJ
CAM
KIRKGZ
LAOPAK
SOL
UZB
VIE
INDPHI
VAN
MON
SAM
INO
FIJ
GEOSRI
ARM
PRC
MLDTHA
TKM
AZE
KAZ
MALNZL
KOR
JPN
AUS
BRU
Lo
g o
f a
vera
ge d
ep
th o
f fo
od
defi
cit
6 7 8 9 10 11
Log of average GDP per capita
y = 12.20 − 0.98xR−sq = 0.56, N = 161
8
6
4
2
0
GDP = gross domestic product, N = sample size, R-sq = R-squared.
Notes:
1. GDP per capita is based on GDP measured in constant 2005 PPP$. Average GDP per capita for 2010–2012
is shown.
2. Depth of food defi cit is defi ned as the mean difference between actual caloric intake and minimum daily caloric
requirement among those whose caloric intake is below the minimum daily requirement. It is expressed in
kCal/capita/day. Average depth of food defi cit for 2010–2012 is shown.
3. The line shown is obtained from the linear regression of the log of depth of food defi cit (y) averaged for 2010–
2012 on the log of GDP per capita (x) averaged for 2010–2012. The regression results are embedded in the
chart. The coeffi cient on log of average GDP per capita is statistically signifi cant at the 1% level of signifi cance.
4. Economies in Asia and the Pacifi c are shown in brown.
5. Refer to Appendix B for a list of three-character economy codes.
Sources: ADB estimates based on depth of food defi cit data from the FAO Food Security Indicators, http://www
.fao.org/economic/ess/ess-fs/ess-fadata/en/ (accessed 23 April 2013); and GDP data from the World Bank WDI,
http://data.worldbank.org/data-catalog/world-development-indicators accessed (22 April 2013).
depth was below Southeast Asia’s in 1990–1992 but higher than that in Southeast Asia by 2010–2012.
Dietary Diversity and Nutrition: Better Income, Better Food
With affl uence and urbanization, Asians have developed an appetite for more nutritious and balanced meals. As income grows, so does dietary diversity—the relationship between the number of food groups consumed and total household per capita income is signifi cant and positive (Hoddinott and Yohannes 2002). Based on household surveys in developing economies (FAO 2012), the households in the highest per capita income quintile have a
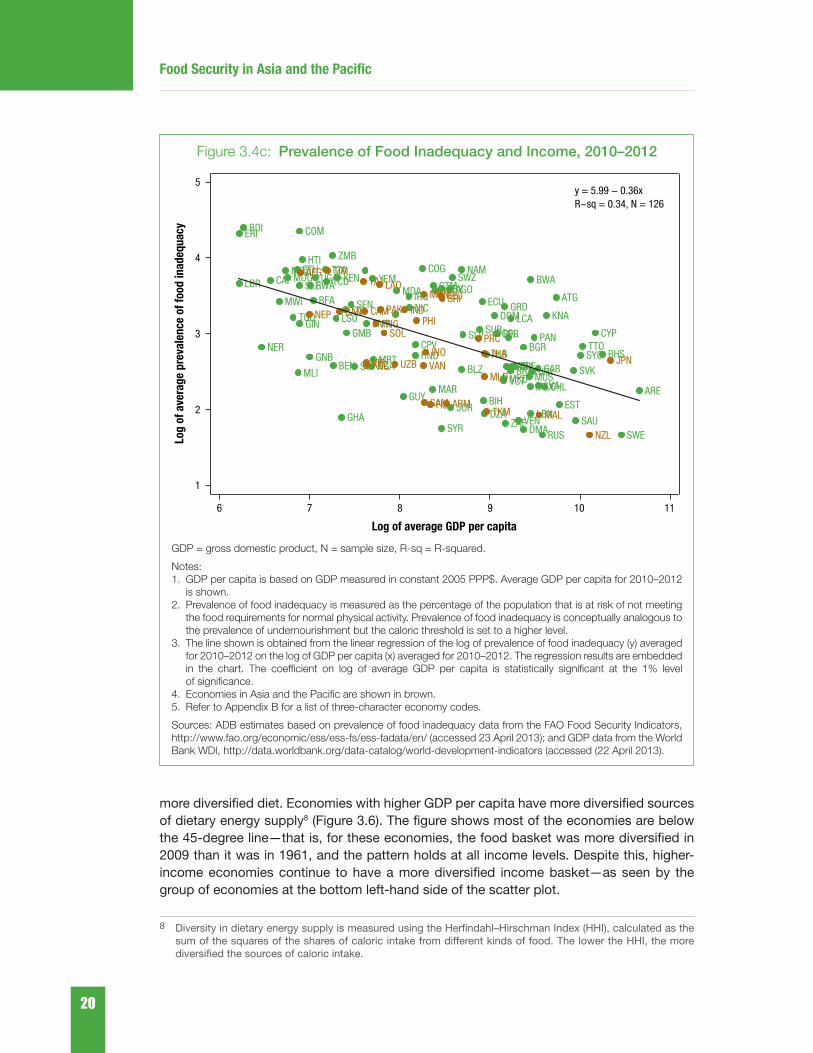
Food Security in Asia and the Pacifi c
20
Figure 3.4c: Prevalence of Food Inadequacy and Income, 2010–2012
LBR
ERIBDI
NER
CAF
MWI
MOZMDG
TGO
ETH
MLI
SLE
COM
GIN
HTI
GNB
RWABFA
UGATZATCD
ZMB
BEN
LSO
KEN
GHA
CIV
GMB
SEN
STP
CMR
NGA
YEM
MRT
MDA
GUY
IRQNIC
CPVHND
COG
MAR
GTMBOL
SYR
PRYAGO
JOR
SWZNAM
BLZ
SLV SUR
ECU
BIHDZA
ALB
DOM
COLPER
MKDVCT
GRD
ZAF
SRBBRA
LCA
MNECRI
VENDMA
BGR
MUSMEX
BWA
LBN
URY
PAN
GAB
LVA
RUS
CHL
KNA
ATG
EST
SVK
SAU
SYCTTO
CYP
BHS
SWE
ARE
AFG
NEP
TIM
BAN
TAJ
CAM
KIRKGZ
PNG
LAO
PAK
SOL
UZB
INDPHI
VAN
MON
SAM
INO
FIJ
GEOSRI
ARM
PRC
MLD
THA
TKM MAL
NZL
JPN
Lo
g o
f a
vera
ge p
reva
len
ce o
f fo
od
in
ad
eq
ua
cy
6 7 8 9 10 11
Log of average GDP per capita
y = 5.99 − 0.36xR−sq = 0.34, N = 126
5
4
3
2
1
GDP = gross domestic product, N = sample size, R-sq = R-squared.
Notes:
1. GDP per capita is based on GDP measured in constant 2005 PPP$. Average GDP per capita for 2010–2012
is shown.
2. Prevalence of food inadequacy is measured as the percentage of the population that is at risk of not meeting
the food requirements for normal physical activity. Prevalence of food inadequacy is conceptually analogous to
the prevalence of undernourishment but the caloric threshold is set to a higher level.
3. The line shown is obtained from the linear regression of the log of prevalence of food inadequacy (y) averaged
for 2010–2012 on the log of GDP per capita (x) averaged for 2010–2012. The regression results are embedded
in the chart. The coeffi cient on log of average GDP per capita is statistically signifi cant at the 1% level
of signifi cance.
4. Economies in Asia and the Pacifi c are shown in brown.
5. Refer to Appendix B for a list of three-character economy codes.
Sources: ADB estimates based on prevalence of food inadequacy data from the FAO Food Security Indicators,
http://www.fao.org/economic/ess/ess-fs/ess-fadata/en/ (accessed 23 April 2013); and GDP data from the World
Bank WDI, http://data.worldbank.org/data-catalog/world-development-indicators (accessed (22 April 2013).
more diversifi ed diet. Economies with higher GDP per capita have more diversifi ed sources of dietary energy supply8 (Figure 3.6). The fi gure shows most of the economies are below the 45-degree line—that is, for these economies, the food basket was more diversifi ed in 2009 than it was in 1961, and the pattern holds at all income levels. Despite this, higher-income economies continue to have a more diversifi ed income basket—as seen by the group of economies at the bottom left-hand side of the scatter plot.
8 Diversity in dietary energy supply is measured using the Herfi ndahl–Hirschman Index (HHI), calculated as the sum of the squares of the shares of caloric intake from different kinds of food. The lower the HHI, the more diversifi ed the sources of caloric intake.

Access to Food: Poverty, Nutrition, and the Impact of Food Crises
21
Table 3.1: Undernourishment and Depth of Food Defi cit
Region 1990–1992 2000–2002 2010–2012
World Prevalence 18.6 14.9 12.5
Depth 130 106 94
Asia and the Pacifi c Prevalence 23.7 17.6 13.9
Depth 165 125 104
Caucasus and Central Asia Prevalence 12.8 14.5 7.4
Depth … 98 51
East Asia Prevalence 20.8 14.3 11.5
Depth 151 98 77
South Asia Prevalence 26.8 21.3 17.6
Depth 175 150 127
Southeast Asia Prevalence 29.6 19.2 10.9
Depth 214 132 77
Pacifi c Prevalence 13.6 15.9 12.1
Depth 82 98 74
Africa Prevalence 27.3 25.1 22.9
Depth 195 185 175
Latin America and the Caribbean Prevalence 14.6 11.2 8.3
Depth 98 75 59
… = not available.
Notes:
1. Prevalence of undernourishment is defi ned as the proportion of the population with a caloric intake less than the
minimum daily requirement, and is expressed in percent.
2. Depth of food defi cit is defi ned as the mean difference between actual caloric intake and minimum daily caloric
requirement among those whose caloric intake is below the minimum daily requirement, and is expressed in
kCal/capita/day.
3. Regional groupings are as defi ned by the FAO, and are different from those in Appendix A: South Asia includes
Iran; Southeast Asia includes Timor-Leste; West Asia (called “Middle East” in Appendix A) includes Turkey, with
the West Asia subregion included in the aggregated estimates for Asia; and Pacifi c includes non-ADB members in
addition to the economies listed in Appendix A but excludes Australia and New Zealand.
Source: FAO Food Security Indicators. http://www.fao.org/economic/ess/ess-fs/ess-fadata/en/ (accessed
23 April 2013).
In addition, evidence shows that as per capita income increases, the contribution of grains to total caloric intake per capita decreases (Figure 3.7a). On the other hand, that of animal-sourced foods (including meat, fi sh, dairy products, and eggs) increases (Figure 3.7b), together with that of fruits and vegetables.
The share of cereals in total caloric intake has declined signifi cantly in Asia over the past 2 decades (Figure 2.2). East Asia shows a stark decline in its share of cereals in total caloric intake, showing instead an increase in the share of fruits and vegetables and animal-sourced calories. The changes are even more dramatic if viewed since 1961.
Evidence shows that economies with higher per capita incomes have greater supply of protein in their caloric intake (Figure 3.8a), and protein supply in Asia and the Pacifi c

Food Security in Asia and the Pacifi c
22
Figure 3.5: Change in Poverty and Change in Prevalence of Undernourishment in Low- and Middle-Income Economies, 1990–2012
N = sample size, R-sq = R-squared.
Notes:
1. Prevalence of undernourishment is defi ned as the proportion of the population with a caloric intake less than
the minimum daily requirement, and is expressed in percent.
2. Poverty headcount ratio is the proportion of the population living on less than $1.25 a day (2005 PPP), and is
expressed in percent.
3. Percentage point change is computed as the difference between the average values for 2010–2012 and
1990–1992 for prevalence of undernourishment, and between the values for 2010 and 1990 for poverty
headcount ratio.
4. The line shown is obtained from the linear regression of the percentage point change in prevalence of
undernourishment (y) during 1990–2012 on the percentage point change in poverty headcount ratio (x) during
1990–2010. The regression results are embedded in the chart. The coeffi cient on percentage point change in
poverty headcount ratio is statistically signifi cant at the 5% level of signifi cance.
5. Economies in Asia and the Pacifi c are shown in brown.
6. Refer to Appendix B for a list of three-character economy codes.
Sources: ADB estimates based on undernourishment data from the FAO Food Security Indicators, http://www
.fao.org/economic/ess/ess-fs/ess-fadata/en/ (accessed 23 April 2013); and poverty estimates from the
PovcalNet, http://iresearch.worldbank.org/PovcalNet/index.htm?1 (accessed 23 April 2013).
increased sharply with income growth. Moreover, as income increases, this protein is increasingly sourced from animals (Figure 3.8b). The most visible increases in share of animal-sourced protein to total protein supply have been in East and Southeast Asia. Most of the increase in demand for animal protein by 2030 and beyond is expected to come from developing Asian economies (FAO 2011).
DZA
AGO
BLZ
BENBOL
BWA
BRA
BFA
BDI
CMR
CPV
CAF
TCD
CHL
COM
COD
COG
CIV
DJI
DOM
ECU
EGYSLV
ETH
GABGMB
GHA
GTM
GIN
GNBGUYHTI
HND
IRN
IRQ
JAMKEN
LSO LBR
MDG
MWIMLI
MRT MEXMAR
MOZ
NAM
NIC
NER
NGAPAN
PRY
PERRWA
SEN
SLE
ZAF
LCA
SUR
SWZ
SYR
STP
TZA
TGO
UGA
VEN
PSE
YEM
ZMB
BANCAM
PRC INDINOKGZ
LAO
MLDNEPPAK PHI
SRI
TAJ
THA
TIM
VIE
Perc
en
tag
e p
oin
t ch
an
ge
in p
reva
len
ce o
f u
nd
ern
ou
rish
men
t
−60 −40 −20 0 20 40
Percentage point change in poverty headcount ratio
y = −4.18 + 0.23xR−sq = 0.08, N = 85
50
0
–50
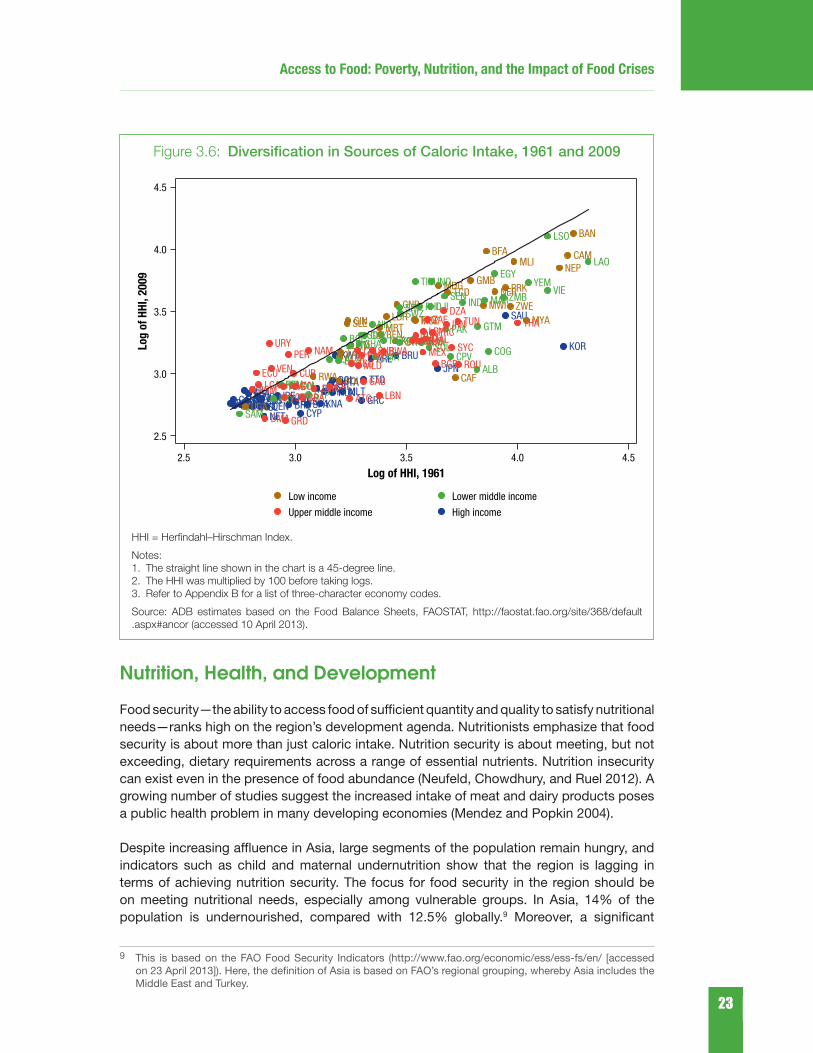
Access to Food: Poverty, Nutrition, and the Impact of Food Crises
23
Figure 3.6: Diversifi cation in Sources of Caloric Intake, 1961 and 2009
HHI = Herfi ndahl–Hirschman Index.
Notes:
1. The straight line shown in the chart is a 45-degree line.
2. The HHI was multiplied by 100 before taking logs.
3. Refer to Appendix B for a list of three-character economy codes.
Source: ADB estimates based on the Food Balance Sheets, FAOSTAT, http://faostat.fao.org/site/368/default
.aspx#ancor (accessed 10 April 2013).
Nutrition, Health, and Development
Food security—the ability to access food of suffi cient quantity and quality to satisfy nutritional needs—ranks high on the region’s development agenda. Nutritionists emphasize that food security is about more than just caloric intake. Nutrition security is about meeting, but not exceeding, dietary requirements across a range of essential nutrients. Nutrition insecurity can exist even in the presence of food abundance (Neufeld, Chowdhury, and Ruel 2012). A growing number of studies suggest the increased intake of meat and dairy products poses a public health problem in many developing economies (Mendez and Popkin 2004).
Despite increasing affl uence in Asia, large segments of the population remain hungry, and indicators such as child and maternal undernutrition show that the region is lagging in terms of achieving nutrition security. The focus for food security in the region should be on meeting nutritional needs, especially among vulnerable groups. In Asia, 14% of the population is undernourished, compared with 12.5% globally.9 Moreover, a signifi cant
9 This is based on the FAO Food Security Indicators (http://www.fao.org/economic/ess/ess-fs/en/ [accessed on 23 April 2013]). Here, the defi nition of Asia is based on FAO’s regional grouping, whereby Asia includes the Middle East and Turkey.
AUSAUT BHSBRBBMU
BRU
CANCYP
DENFINFRA PYF
GER GRCHUN
ISLIRE
ISRITAJPN
KWT
MLT
NET
NCLNZLNOR
POLPOR
KOR
KNA
SAU
SPASWESWI
TTO
ARE
UKGUSA
BAN
BEN
BFA
BDI
CAM
CAF
TCD
COM
PRKGMB
GIN
GNB
HTI KEN
LBR
MDG
MWI
MLI
MRTMOZ MYA
NEP
NER
RWA
SLE TGO
UGA
TZA
ZWE
ALBBLZ
BOL
CMR CPV COGCIV
DJI
EGY
SLV
FIJ
GHA
GTMGUY HND
IND
INO
KIR
LAO
LSO
FSM
MON
MAR
NIC
NGAPAK
PRY
PHI
SAM
STP
SEN
SOL
SRI
SDN
SWZ
SYR
TIM
VAN
VIEYEM
ZMBDZA
AGO
ATGARG
BWA
BRA
BGRCHL
PRC
COL CRICUB
DMA
DOM
ECUGAB
GRD
IRN
JAM
JOR
LBN
LBYMAL
MLD
MUSMEXNAM PANPER
ROU
LCAVCT
SYC
ZAF
SUR
THATUNTUR
URY
VEN
Log
of
HH
I, 2
009
2.5 3.0 3.5 4.0 4.5
Log of HHI, 1961
Low income Lower middle income
Upper middle income High income
4.5
4.0
3.5
3.0
2.5

Food Security in Asia and the Pacifi c
24
Figure 3.7a: Share of Cereals in Total Caloric Intake and GDP per Capita, 1991–2009
GDP = gross domestic product, N = sample size, R-sq = R-squared.
Notes:
1. GDP per capita is based on GDP measured in constant 2005 PPP$.
2. The line shown is obtained from the linear regression of the share of cereals in total caloric intake (y) averaged
for 1991–2009 on the log of average GDP per capita (x) for 1991–2009. The regression results are embedded
in the chart. The coeffi cient on log of GDP per capita is statistically signifi cant at the 1% level of signifi cance.
3. Economies in Asia and the Pacifi c are shown in brown.
4. Refer to Appendix B for a list of three-character economy codes.
Sources: ADB estimates based on consumption data from the Food Balance Sheets, FAOSTAT, http://faostat
.fao.org/site/368/default.aspx#ancor (accessed 10 April 2013); and GDP data from the World Bank WDI, http://
data.worldbank.org/data-catalog/world-development-indicators (accessed 22 April 2013).
decline in poverty incidence has not been matched by a corresponding decrease in the prevalence of undernourishment.
Adequate nutrition not only benefi ts individual health and survival, but also collective human capital and economic development. This is particularly true for children. Survey-based data show high levels of stunting—height-for-age more than two standard deviations below the WHO Child Growth Standards median—in children under 5 years of age in South and Central Asia, and parts of Southeast Asia (Neufeld, Chowdhury, and Ruel 2012). In South Asia, 40% of children are stunted—over 5% severely. High levels of anemia (low hemoglobin in blood due to iron defi ciency) and vitamin A defi ciency exist in Cambodia, India, Myanmar, Nepal, and Pakistan. Not far behind are Bangladesh, Indonesia, the Philippines, and Viet Nam.
AGO
ALB
ARE
ARG
ATG
AUT
BDI
BEL
BEN
BFA
BGR
BHS
BIH
BLR
BLZ
BOL
BRABRB
BWA
CAFCAN
CHL
CIV
CMR
COG
COL
COM
CPV
CRI
CYPCZE
DEN
DJI
DMA
DOM
DZA
ECU
EGY
ERI
EST
ETH
EUUFINFRA
GAB
GERGHA
GIN
GMB
GNB
GRC
GRD
GTM
GUY HND
HRV
HTI
HUN IRE
IRN
ISL
ISRITAJAM
JORKEN
KNA
KWT
LBN
LBR
LBY
LCA
LSO
LTU
LUX
LVA
MAR
MDA
MDG
MEX
MKD
MLI
MLT
MNE
MOZ
MRT
MUS
MWI
NAM
NER
NET
NGA
NIC
NOR
PAN
PER
POL
PORPRY
PSE
ROU
RUS
RWA
SAUSDN
SEN
SLE SLV
SPA
SRBSTP
SUR
SVKSVN
SWESWI
SWZ
SYCSYR
TCD
TGO
TTO
TUNTUR
TZA
UGAUKG
UKRURY
USA
VCTVEN
WLD
YEM
ZAF
ZMB
ARM
AUS
AZE
BAN
BRU
FIJ
FSM
GEO
IND
INO
JPN
KAZKGZ
CAM
KIR
KOR
LAO
MAL
MLD
MON
NEP
NZL
PAKPHIPRC
SAM
SOL
SRI
TAJ
THA
TIM TKMUZB
VAN
VIE
Avera
ge s
ha
re o
f cere
als
in
ca
lori
c in
tak
e
6 7 8 9 10 11
Log of average GDP per capita
y = 99.41 − 6.72xR−sq = 0.33, N = 171
80
60
40
20

Access to Food: Poverty, Nutrition, and the Impact of Food Crises
25
Figure 3.7b: Share of Animal-Sourced Food in Total Caloric Intake and GDP per Capita, 1991–2009
GDP = gross domestic product, N = sample size, R-sq = R-squared.
Notes:
1. GDP per capita is based on GDP measured in constant 2005 PPP$.
2. The line shown is obtained from the linear regression of the share of animal-sourced food in total caloric intake
(y) averaged for 1991–2009 on the log of average GDP per capita (x) for 1991–2009. The regression results
are embedded in the chart. The coeffi cient on log of GDP per capita is statistically signifi cant at the 1% level
of signifi cance.
3. Economies in Asia and the Pacifi c are shown in brown.
4. Refer to Appendix B for a list of three-character economy codes.
Sources: ADB estimates based on consumption data from the Food Balance Sheets, FAOSTAT, http://faostat
.fao.org/site/368/default.aspx#ancor (accessed 10 April 2013); and GDP data from the World Bank WDI, http://
data.worldbank.org/data-catalog/world-development-indicators (accessed 22 April 2013).
There is an inverse relationship between per capita income and the percentage of stunted children aged 0–5 (Figure 3.9). Within Asia, Nepal (49.3%), India (47.9%), the Lao People’s Democratic Republic (Lao PDR; 47.6%), and Bangladesh (46%) show the highest childhood stunting.
While nutritionists stress a proper mix of micronutrients, data on “average” nutrient intake does not accurately capture how important micronutrients are for child development. Aside from contributing to early death, childhood malnutrition plays a part in mental and physical impairment and a lifelong risk of chronic disease. These cannot always be remedied by improved diets later. In economic terms, childhood malnutrition impedes the formation of human capital through investment in education, with ramifi cations for economic growth.
AGO
ALB
ARE
ARG
ATG
AUT
BDI
BEL
BENBFA
BGR
BHS
BIH
BLR
BLZBOL
BRA
BRB
BWA
CAF
CANCHL
CIVCMR
COG
COL
COM
CPV CRI
CYP
CZE
DEN
DJI
DMA
DOM
DZA
ECU
EGYERI
EST
ETH
EUU
FIN
FRA
GAB
GER
GHAGIN
GMBGNB
GRCGRD
GTM
GUYHND
HRV
HTI
HUN
IRE
IRN
ISL
ISRITA
JAM
JORKEN
KNA
KWT
LBN
LBR
LBY
LCA
LSO
LTU
LUX
LVA
MAR
MDA
MDG
MEXMKD
MLI
MLT
MNE
MOZ
MRT
MUS
MWI
NAM
NER
NET
NGA
NIC
NOR
PAN
PER
POLPOR
PRY
PSE
ROURUS
RWA
SAU
SDN
SEN
SLE
SLV
SPA
SRB
STP
SUR
SVK
SVN
SWESWI
SWZ
SYC
SYR
TCD
TGO
TTO
TUNTUR
TZAUGA
UKG
UKR
URY
USA
VCT
VENWLD
YEM
ZAF
ZMB
ARM
AUS
AZE
BAN
BRU
FIJFSM
GEO
INDINO
JPN
KAZKGZ
CAM
KIR KOR
LAO
MAL
MLD
MON
NEP
NZL
PAKPHI
PRC
SAM
SOLSRI
TAJ
THATIM
TKM
UZB
VANVIE
Avera
ge s
ha
re o
f a
nim
al-
sou
rced
food
in
ca
lori
c in
tak
e
6 7 8 9 10 11
Log of average GDP per capita
y = −27.2 + 4.93xR−sq = 0.61, N = 171
40
30
20
10
0

Food Security in Asia and the Pacifi c
26
Figure 3.8a: Protein Supply and GDP per Capita, 2007–2009
GDP = gross domestic product, gr = gram, N = sample size, R-sq = R-squared.
Notes:
1. GDP per capita is based on GDP measured in constant 2005 PPP$.
2. The line shown is obtained from the linear regression of the total protein supply (y) averaged for 2007–2009 on
the log of average GDP per capita (x) for 2007–2009. The regression results are embedded in the chart. The
coeffi cient on log of GDP per capita is statistically signifi cant at the 1% level of signifi cance.
3. Economies in Asia and the Pacifi c are shown in brown.
4. Please refer to Appendix B for a list of three-character economy codes.
Sources: ADB estimates based on protein supply data from the FAO Food Security Indicators, http://www.fao
.org/economic/ess/ess-fs/ess-fadata/en/ (accessed 23 April 2013); and GDP data from the World Bank WDI,
http://data.worldbank.org/data-catalog/world-development-indicators (accessed 22 April 2013).
Undernourishment in childhood has been shown to be signifi cantly linked with lower school performance, lower salaries and income in adult life, and lower birth weight for the next generation (Victoria et al. 2008).
While many Asian economies continue to struggle with maternal and child undernutrition, they also face the double burden of malnutrition—the coexistence of stunted children and overweight adults within the same community. Across populous countries in Asia—including India, Indonesia, and the Philippines—the prevalence of undernutrition remains persistently high. But the problems of overnutrition are also surfacing, mainly in urban areas (FAO 2006). In the PRC, much progress has been made on undernutrition, but obesity is a growing concern. The Pacifi c islands show some of the highest obesity rates in the world—more than 50% of the population is overweight in at least 10 Pacifi c island countries (WHO 2010).
DZA
EGY
LBY
MAR
TUN
AGO
BENBWA
BFA
BDI
CMR
CPV
CAF
TCD
COMCOG
CIVDJI
ERI
ETH
GAB
GMBGHAGIN
GNB
KEN
LSO
LBR
MDG
MWI
MLI
MRT MUS
MOZ
NAM
NER
NGA
RWA
STPSEN
SYC
SLE
ZAF
SWZTGO
UGATZA
ZMB
SAS
IRN
JOR
KWT
LBN SAUSYR
TUR ARE
YEM
ATGBHS
BRBDMA
DOM
GRD
HTI
KNA
LCAVCT
TTOBLZ
BOL
BRACHL
COL
CRI
ECU
SLV
GTM
GUY
HND
MEX
NIC
PAN
PRYPER
SUR
URYVEN
ALB
AUT
BLR
BEL
BIH
BGR
CAN
HRVCYP
CZE
DEN
EST
FINFRA
GER
GRC
HUN
ISL
IRE
ISR
ITA
LVA
LTU
LUXMLT
MNE
NET NOR
POL
POR
MDA
ROU
RUS
SRB
SVK
SVN
SPASWE
SWI
MKD
UKR
UKG
USA
ARM AZE
GEO
KAZ
KGZ
TAJ
TKM
UZB
PRC
MON
KOR
BAN IND
MLD
NEP PAKSRI
BRU
CAMINO
LAO
MAL
PHI THA
TIM
VIEFIJ
KIRSAM
SOL
VAN
AUS
JPNNZL
Avera
ge t
ota
l p
rote
in s
up
ply
(gr/
ca
pit
a/d
ay)
6 7 8 9 10 11
Log of average GDP per capita
y = −38.53 + 13.39xR−sq = 0.66, N = 166
140
120
100
80
60
40

Access to Food: Poverty, Nutrition, and the Impact of Food Crises
27
Figure 3.8b: Share of Animal-Sourced Protein in Total Protein Supply and GDP per Capita, 2007–2009
GDP = gross domestic product, N = sample size, R-sq = R-squared.
Notes:
1. GDP per capita is based on GDP measured in constant 2005 PPP$.
2. The line shown is obtained from the linear regression of the share of average animal-sourced protein in total
protein supply averaged for 2007–2009 (y) on the log of average GDP per capita (x) for 2007–2009. The
regression results are embedded in the chart. The coeffi cient on log of GDP per capita is statistically signifi cant
at the 1% level of signifi cance.
3. Economies in Asia and the Pacifi c are in brown.
4. Please refer to Appendix B for a list of three-character economy codes.
Sources: ADB estimates based on protein supply data from the FAO Food Security Indicators, http://www
.fao.org/economic/ess/ess-fs/ess-fadata/en/ (accessed 23 April 2013); and GDP data from the World Bank WDI,
http://data.worldbank.org/data-catalog/world-development-indicators (accessed 22 April 2013).
Nutrition trends are worrisome in many developing countries. Obesity, diabetes, and other noncommunicable diet-related diseases have been rising due to changing dietary patterns and lifestyles. While dietary diversity during the nutrition transition is welcome, ongoing dietary shifts have largely corresponded to increased fat content sourced from animal fat and oil. Sharp increases in the consumption of sugar and other sweet products, as well as in that of certain processed foods are also contributing to growing rates of obesity and diabetes.
Malnutrition, whether under- or overnutrition, is a signifi cant threat to public health. Many developing countries must combat both simultaneously. Undernutrition and micronutrient defi ciencies—especially among children—are stubbornly high in some pockets of the
DZAEGY
LBY
MAR
TUNAGO
BEN
BWA
BFA
BDI
CMR
CPV
CAF
TCD
COM
COG
CIV
DJI
ERI
ETH
GAB
GMBGHA
GINGNB
KEN
LSOLBR
MDG
MWI
MLI
MRTMUS
MOZ
NAM
NER
NGA
RWA
STPSEN
SYC
SLE
ZAF
SWZ
TGO
UGA
TZAZMBSAS
IRN
JOR
KWT
LBN
SAU
SYRTUR
ARE
YEM
ATG
BHS
BRBDMA
DOM
GRD
HTI
KNALCA
VCT
TTO
BLZ
BOL
BRA CHLCOLCRI
ECU
SLV
GTM
GUYHND
MEX
NIC
PAN
PRY
PER
SUR
URY
VENALB
AUT
BLR
BEL
BIH
BGR
CANHRV
CYPCZE
DEN
EST
FINFRAGER
GRCHUN
ISL
IREISRITA
LVALTU
LUX
MLT
MNE
NET
NOR
POL
POR
MDA
ROU RUS
SRBSVK
SVN
SPASWE
SWI
MKD
UKR
UKG
USA
ARM
AZE
GEO
KAZ
KGZ
TAJ
TKM
UZB
PRC
MON
KOR
BANIND
MLD
NEP
PAK
SRI
BRU
CAMINO
LAO
MAL
PHITHA
TIM
VIEFIJ
KIR
SAM
SOL
VAN
AUS
JPN
NZL
Avera
ge s
ha
re
(%)
6 7 8 9 10 11
Log of average GDP per capita
y = −56.69 + 11.20xR−sq = 0.71, N = 166
80
60
40
20
0

Food Security in Asia and the Pacifi c
28
Figure 3.9: Percentage of Children Under 5 Who Are Stunted, 2005–2007
Notes:
1. Estimates are percentages of stunting (height-for-age more than two standard deviations below the World
Health Organization [WHO] Child Growth Standards median) among children aged 0–5 years. Average for
2005–2007 is shown to maximize economy coverage.
2. Economies are arranged in descending order (top to bottom) based on their gross domestic product (GDP)
per capita (constant 2005 PPP$) for 2005–2007.
3. Please refer to Appendix B for a list of three-character economy codes.
Sources: Data on stunting prevalence from the FAO Food Security Indicators, http://www.fao.org/economic/ess/
ess-fs/ess-fadata/en/ (accessed 23 April 2013); and GDP data from the World Bank WDI, http://data.worldbank
.org/data-catalog/world-development-indicators (accessed 22 April 2013).
0 10 20 30 40 50 60 70
CODLBRBDI
NERMWIETHTGOSLE
RWAMLINEPUGAGIN
GNBHTI
BFATZA
ZMBBANLSOGHABENTAJ
GMBCAM
CIVSENKGZLAONGADJI
PNGCMRMRTUZBSOLVIEIND
MDAPSEGUYIRQ
MONNICINO
COGHNDVANSRI
GEOAGOPRYSYRPRCARMEGYSWZNAMAZEBLZSURALBBIHPER
DOMTHAJAMTUNCOLMKDBRASRBMNEKAZBLRVENARGMALMEXCHLLBYHRVSAUGERKWT
Incidence of stunting
(%)
Econ
om
y

Access to Food: Poverty, Nutrition, and the Impact of Food Crises
29
region. Where problems are emerging, effective control is key. The challenge is to develop effective programs and policies that are specifi c to a country context. For example, reducing child and adult undernutrition and micronutrient defi ciencies should remain a top priority in India, Indonesia, and the Philippines. But more focused efforts should also be initiated to limit the emergence of obesity in urban areas. In the PRC, where obesity is rising and increasingly affecting children, efforts should be directed toward improving nutritional awareness, ensuring that healthy food options are affordable and accessible, and educating consumers about the long-term health impacts of obesity.
Food Crises and Their Impact on Poverty
A major determinant of consumers’ economic access to food is price. High and rising food prices have regressive distributional effects. For those near the poverty line, higher prices can push them back into poverty and also increase the depth of the food defi cit. In addition, volatility creates uncertainty about future affordable meals, adding to food insecurity. The food price index across various Asian subregions declined during the 1990s and early 2000s (Figure 3.10), mirroring the secular decline in global food prices. Price hikes followed in the latter half of the fi rst decade of the 2000s. Regional data on food price indexes also show increased price volatility in the latter half of that decade (Figure 3.11). It is interesting that, on average, food prices were both higher and more volatile in developing countries than developed countries.
Food price infl ation erodes household purchasing power—especially for those with low incomes—and can undermine gains in poverty reduction and human development. Many people who were poor prior to price increases may fall on the verge of hunger and malnutrition, while those barely above the poverty line may slip back into poverty. High food prices, even temporarily reducing disposable income, may force households to sell assets, reduce spending on health, or remove children from school to secure food. These temporary shocks can have permanent effects on a family’s ability to escape poverty. At the macroeconomic level, higher prices hurt countries that provide substantial food subsidies. Large subsidies crowd out public investment in other priority sectors, such as health, education, and infrastructure. Volatile food prices also exacerbate malfunctioning markets, which deter farmers from making productive agricultural investments. Thus, risk-averse farmers may opt for ineffi cient technologies with low returns rather than risk investing scarce resources in better technology with the promise of higher output.
For the average household in the developing world, food expenditures absorb more than half the total budget. For the poor, the share is even higher. Households in Asia and the Pacifi c below the poverty line allocate 60%–70% of their budget to food. The poor are thus hurt disproportionately more from food price infl ation.
Assuming price stability, poverty reduction depends on two factors: average income (or expenditure) and how it is distributed. An increase in average income without a change in distribution reduces poverty, while an increase in income inequality without a change in average income increases poverty. However, changes in food and nonfood prices also alter purchasing power, infl uencing the percentage of people living below the poverty line. Moreover, differences in shares of food and nonfood consumption across income groups—

Food Security in Asia and the Pacifi c
30
Figure 3.10: Food Price Indexes in Subregions of Asia and the Pacifi c, 1991–2012
1.00
1.20
1.40
1.60
1.80
2.00
2.20
1991
1992
1993
1994
1995
1996
1997
1998
1999
2000
2001
2002
2003
2004
2005
2006
2007
2008
2009
2010
2011
2012
Fo
od
pri
ce l
evel
ind
ex
Year
Developed countriesSoutheast Asia
AsiaPacificEast Asia
West AsiaSouth AsiaCaucasus and Central Asia
Notes:
1. The FAO calculates the domestic food price level index by dividing the food purchasing power parity (FPPP)
by the general PPP.
2. Regional groupings are as defi ned by the FAO, and are different from those in Appendix A: South Asia includes
Iran; Southeast Asia includes Timor-Leste; West Asia (called “Middle East” in Appendix A) includes Turkey, with
the West Asia subregion included in the aggregated estimates for Asia; and for the Pacifi c, only Fiji has data,
with Australia and New Zealand classifi ed under “Developed Countries”.
Source: FAO Food Security Indicators. http://www.fao.org/economic/ess/ess-fs/ess-fadata/en/ (accessed
23 April 2013).
again, the poor spend relatively more on food—mean that a larger change in food versus nonfood prices will also affect real income distribution. In this context, a change in poverty can be decomposed into three factors: (i) a pure income effect—measuring the impact of changes in nominal income on poverty, assuming food and nonfood price stability; and (ii) food and (iii) nonfood price effects—measuring the impact of price changes on poverty, assuming nominal incomes are stable.
This decomposition methodology was used to analyze how changes in income—and food and nonfood prices—affected the proportion of those living below the $1.25-a-day (2005 PPP) poverty line (ADB 2012). In all the 17 economies examined (Table 3.2), mean expenditure increased—mostly during the second half of the fi rst decade of the 2000s—resulting in lower poverty rates (Figure 3.12).
An increase in food and nonfood prices had an offsetting effect on poverty reduction, however. The income effect dominated the other two price effects, leading to a net reduction in poverty in nearly all the 17 economies. For example, the poverty rate fell by 6.19% per year during 2006–2009 in the Philippines. The reduction was due to three factors: (i) an increase in mean household expenditure helped reduce the poverty rate by 16.08%, but (ii) an increase in food prices increased poverty rate by 8.71%, and (iii) an increase in

Access to Food: Poverty, Nutrition, and the Impact of Food Crises
31
Figure 3.11: Food Price Volatility in Subregions of Asia and the Pacifi c, 1995–2012
0
10
20
30
40
50
60
70
80
9019
95
1996
1997
1998
1999
2000
2001
2002
2003
2004
2005
2006
2007
2008
2009
2010
2011
2012
Do
mesti
c f
oo
d p
rice l
evel
ind
ex v
ola
tili
ty
Year
Developed countriesSoutheast Asia
AsiaWest Asia
East AsiaPacific
South AsiaCaucasus and Central Asia
Notes:
1. Domestic food price volatility is a measure of variation of the domestic food price level index (Figure 3.10).
The FAO calculates domestic food price volatility as the standard deviation of the deviations from the trend in
domestic food price level index over the previous 5 years.
2. Regional groupings are as defi ned by the FAO, and are different from those in Appendix A: South Asia includes
Iran; Southeast Asia includes Timor-Leste; West Asia (called “Middle East” in Appendix A) includes Turkey, with
the West Asia subregion included in the aggregated estimates for Asia; and for the Pacifi c, only Fiji has data,
with Australia and New Zealand classifi ed under “Developed Countries”.
Source: FAO Food Security Indicators. http://www.fao.org/economic/ess/ess-fs/ess-fadata/en/ (accessed
23 April 2013).
nonfood prices boosted it by 1.18%. The net effect was an annual poverty rate reduction of 6.19% between 2006 and 2009, with the income effect being the main driver.
A similar decomposition methodology was used to examine the change in those living below the poverty threshold. For this exercise, the effect of population growth on the change in poverty headcount was added to the three factors. A change in the number of poor would now be explained by four factors: (i) income, (ii) food prices, (iii) nonfood prices, and (iv) change in population.
The estimates show that 30.4 million people escaped poverty in developing Asia annually during the fi rst decade of the 2000s (Table 3.3). Again, the income effect was most signifi cant; indeed, if price and population had not increased, the rise in mean household income during that decade would have led 244.1 million out of poverty annually. However, higher food prices in the second half of that period would have pushed 111.7 million into poverty annually had there been no income, nonfood price, or population effect. Likewise, the rise in nonfood prices would have added 95.46 million poor each year. Population growth during the second half of the fi rst decade of the 2000s also added 6.5 million

Food Security in Asia and the Pacifi c
32
Table 3.2: Change in the Percentage of Poor Based on the $1.25-a-Day (2005 PPP) Poverty Line
Country
Survey Period Percentage of Poor Annual Growth (%)Base Terminal Base Terminal
Armenia 2005 2008 3.98 1.28 –22.61
Azerbaijan 2001 2008 6.32 0.43 –13.31
Bangladesh 2005 2010 50.47 43.25 –2.86
Bhutan 2003 2007 26.23 10.22 –15.26
PRC–Rural 2005 2008 26.11 22.27 –4.9
PRC–Urban 2005 2008 1.71 0.89 –15.98
Fiji 2005 2008–09 29.16 5.88 –13.31
Georgia 2002–03 2008 15.98 15.27 –1.48
India–Rural 2005 2010 43.83 34.28 –3.96
India–Urban 2004–05 2010 36.16 28.93 –3.64
Indonesia–Rural 2005 2010 24.01 17.75 –5.21
Indonesia–Urban 2005 2010 18.67 18.33 –0.36
Kazakhstan 2006 2009 0.43 0.11 –24.81
Kyrgyz Republic 2006 2009 5.94 6.23 1.63
Lao PDR 2002 2008 43.96 33.88 –3.82
Nepal 2003 2010 53.13 24.82 –7.61
Pakistan 2004–05 2007–08 22.59 21.04 –2.29
Philippines 2006 2009 22.62 18.42 –6.19
Sri Lanka 2002 2006–07 13.95 7.04 –11.01
Thailand 2006 2009 1.01 0.37 –21.12
PRC = People’s Republic of China, Lao PDR = Lao People’s Democratic Republic, PPP = purchasing power parity.
Source: ADB. 2012. Food Security in Asia and the Pacifi c: Key Challenges and Policy Options. Manila: ADB.
people annually to the ranks of the poor. It was the strength of the income effect, however, that ultimately led to a net 30.4 million annual decrease in the number of people below the $1.25-a-day (2005 PPP) poverty line in developing Asia—offsetting the negative impact on poverty of price and population increases.
In sum, over 110 million more people in Asia could have left poverty behind had food prices not increased during the latter part of the fi rst decade of the 2000s. Although the increase in food prices in that period did not lead to a net increase in Asia’s poverty rates, it did slow poverty reduction. The net reduction in developing Asia’s overall poverty rates in the later part of that period can be largely attributed to the increase in mean incomes across the region. In this context, food and nonfood price infl ation effectively hampered the reduction in poverty rates.
Food price increases affect poverty incidence in two quite disparate ways. On one hand, they harm poor consumers—both urban and rural—who spend a large share of their budgets on food. On the other hand, price increases also raise the incomes of poor farmers

Access to Food: Poverty, Nutrition, and the Impact of Food Crises
33
Figure 3.12: Change in Poverty Due to Food Price, Nonfood Price, and Income Effects (%)
PRC = People’s Republic of China, Lao PDR = Lao People’s Democratic Republic.
Note: Poverty impact estimates were derived from the price elasticity of poverty, which indicates the percentage
increase in poverty when food prices increase by 1%. This elasticity is estimated for the poverty headcount ratio
for each of the 17 economies.
Source: ADB. 2012. Food Security in Asia and the Pacifi c: Key Challenges and Policy Options. Manila: ADB.
and nonfarmers by raising the returns to the factors of production they own. In developing countries, the majority of the poor reside in rural areas, and a high proportion of them directly depend on agriculture. It is not obvious, a priori, which of these opposing effects—negative expenditure effects or positive income effects—is larger. There will be both losers and gainers. Clearly, the way large external price shocks affect the structure of household welfare, and thus poverty, is inherently a general equilibrium problem. General equilibrium models for Thailand and Indonesia demonstrate how domestic policy infl uences the effect of food price spikes on poverty incidence (Box 3.1).
The general equilibrium analysis shows that food price hikes increased poverty incidence in both Thailand and Indonesia, but by surprisingly small amounts. Some of the poor (notably farmers) gained from price increases while others (net consumers) lost. By insulating domestic markets from international markets, it is possible to prevent international price changes from affecting local markets. But these insulating policies can themselves hurt the poor. Indonesia’s rice import policy illustrates this possibility.
Impact of High and Volatile Food Prices on Health Indicators
Rising food prices can have a signifi cant, adverse impact on people’s health in developing countries. As discussed earlier, inadequate food intake undermines health, retards human development, and lowers labor productivity for the economy in the long term. Food price
Arm
enia
Azer
baija
n
Bang
lade
sh
Bhut
an
PRC–
Rura
l
PRC–
Urba
n
Fiji
Geor
gia
Indi
a–Ru
ral
Indi
a–Ur
ban
Indo
nesi
a–Ru
ral
Indo
nesi
a–Ur
ban
Kaza
khst
an
Kyrg
yz R
epub
lic
Lao
PDR
Nepa
l
Paki
stan
Phili
ppin
es
Sri L
anka
Thai
land
–150
–100
–50
0
50
100
Income effect Nonfood price effect Food price effect
Perc
en
t
Country

Food Security in Asia and the Pacifi c
34
Table 3.3: Change in Poor Population(millions)
Country
Change in the Number of Poor People Due to
Net Effect on PovertyPopulation Food Price
Nonfood Price Income
Armenia 0.0000 0.03 0.03 –0.09 –0.03
Azerbaijan 0.0004 0.29 0.31 –0.67 –0.07
Bangladesh 0.7006 5.51 5.89 –13.43 –1.33
Bhutan 0.0018 0.01 0.01 –0.04 –0.02
PRC–Rural –1.7289 24.92 8.06 –42.93 –11.67
PRC–Urban 0.1312 2.72 0.76 –4.92 –1.31
Fiji 0.0002 0.01 0.01 –0.05 –0.03
Georgia 0.0010 0.09 0.10 –0.20 –0.01
India–Rural 3.3077 40.37 45.38 –99.69 –10.63
India–Urban 2.5543 13.22 13.42 –30.85 –1.65
Indonesia–Rural –0.2453 6.98 6.98 –14.03 –1.72
Indonesia–Urban 0.7141 4.65 3.72 –8.44 0.64
Kazakhstan 0.0002 0.03 0.05 –0.09 –0.02
Kyrgyz Republic 0.0027 0.10 0.17 –0.03 0.01
Lao PDR 0.0294 0.26 0.27 –0.62 –0.06
Nepal 0.1354 0.85 0.88 –2.80 –0.92
Pakistan 0.6024 9.40 8.78 –18.99 –0.20
Philippines 0.2812 1.72 1.38 –4.31 –0.94
Sri Lanka 0.0145 0.42 0.62 –1.33 –0.28
Thailand 0.0018 0.16 0.04 –0.34 –0.14
Total 6.5049 111.74 95.46 –244.10 –30.40
PRC = People’s Republic of China, Lao PDR = Lao People’s Democratic Republic.
Source: ADB. 2012. Food Security in Asia and the Pacifi c: Key Challenges and Policy Options. Manila: ADB.
shocks can also compromise maternal and child nutrition, mainly through a reduction in dietary quality and an increase in micronutrient defi ciencies—and concomitant increases in infectious disease morbidity and mortality (Darnton-Hill and Cogill 2010).
A comprehensive assessment of the effects that food price infl ation and volatility have on population health—measured by infant mortality rate, child mortality rate, and prevalence of undernourishment—was recently carried out (Lee et al., forthcoming). Using a panel dataset covering 63 developing countries from 2001 to 2010, the study found that a 1 percentage point increase in contemporaneous food price infl ation leads to a 0.2% increase in infant and child mortality and a 0.4% increase in prevalence of undernourishment (Figure 3.13).
The study investigated how quickly health measures are affected by food price infl ation. The adverse impact on the prevalence of undernourishment remained even after including one- and two-period lagged infl ation rates. In fact, one-period lagged infl ation had an additional

Access to Food: Poverty, Nutrition, and the Impact of Food Crises
35
Box 3.1: The Cost of Food and Poverty—The Case of Thailand and Indonesia
Thailand is one of the world’s largest food exporters; its products include the region’s dominant staple, rice. Indonesia is exactly the opposite. Most of its staple food—rice, maize,
cassava, soybeans, and sugar—are net imports, with most domestic production from small land holdings. Its agricultural exports have tended to be estate crops such as rubber, copra, and coffee. Other things being equal, the balance between net consumers and net producers of food in net importers, like Indonesia, is more heavily weighted in favor of consumers than in net food exporters, like Thailand. So the likelihood that food price hikes will raise poverty incidence would seem to be greater in Indonesia than Thailand.
Warr (2010a, 2010b) has estimated general equilibrium models designed to estimate the impact of price changes on poverty incidence.a The shocks applied to the two models are the percent changes in the international real prices of four commodities—rice, maize, soybeans, and sugar—from 2003 to 2008. During this period, real prices (the nominal price in dollars of the commodities defl ated by Manufactures Unit Value [MUV] indexb) increased by 212% for rice, 124% for maize, 117% for soybeans, and 62% for sugar (Table B3.1).
Even though the international price shocks were large, the results show that their simulated effects on poverty incidence were small. This is because the impact is the net effect on populations including groups that lose from price increases (net buyers) as well as those that gain (net sellers and others gaining from indirect income effects). Also, the net effects were either zero or positive, meaning that simulated poverty incidence either increased as a result of food price shocks or was unaffected at the degree of precision possible with these models.
It is helpful to focus on rice. In Thailand, the increase in the producer price of rice benefi ts sellers, while the consumer price increase harms net consumers. For those close to the poverty line, net consumers outnumber net sellers, even in rural areas. Net consumers are all rural people who do
Table B3.1: Thailand and Indonesia—Simulated Effects of Food Price Shocks on Poverty Incidence
Commodity Rice Maize Soybeans Sugar
Shock to International Price (%) 212 124 117 62
Headcount Measure of Poverty Incidence(% of population)
Before Price Shock
Simulated Changein Poverty Incidence from Price Shock
Thailand
Urban 3.22 0.202 0.000 0.000 0.00
Rural 17.99 0.443 0.014 0.015 0.00
National 13.71 0.371 0.003 0.013 0.00
Indonesia
Urban 13.60 0.008 0.016 0.044 0.049
Rural 20.20 0.001 0.179 0.047 0.066
National 17.19 0.004 0.105 0.045 0.058
Sources: See box source.
continued on next page
Food Security in Asia and the Pacifi c
36
Box 3.1 continued
not own cultivated rice land, including all landless laborers. It also includes many small farmers who produce some rice but supplement consumption with purchased rice, using income derived from the sale of other agricultural products or, increasingly, nonfarm sources of income.
But others are affected as well, even those who neither produce nor consume rice. This is because real wages and returns on capital and land are affected throughout the economy. Urban poverty incidence increased marginally, from 3.2% to 3.4% of the urban population, while rural poverty incidence increased from 18.0% to 18.4%. The negative effect on poor consumers of rice outweighs the positive effect of the increased returns to fi xed factors owned by poor rice producers and the small increase in unskilled wages.
In Indonesia, the estimated effects of the international rice price shock were very small. Its vulnerability to the price shock is determined by its policies on rice imports. Until the early 2000s, Indonesia was the world’s largest rice importer. With the political shift to a more democratic form of government, the lobbying power of pro-farmer political groups initially led to heavy tariffs on rice imports. Then, in 2004, rice imports were offi cially banned, although limited quantities of imports are occasionally permitted (Warr 2005, 2011). By 2006, this policy increased domestic rice prices relative to world prices by about 37% (Fane and Warr 2009). The leaky rice import ban may be more usefully understood as a binding import quota, restricting imports to about one-tenth their previous volume—although the magnitude of the import restriction is regularly reviewed.
The import quota on rice meant that world price increases for rice were barely transmitted to Indonesian domestic markets. For rice, the import quota shielded domestic markets from the effects of the 2007–2008 global price shock, thereby averting the temporary increase in poverty incidence that would have occurred if, for example, the protectionist policy had been a fi xed ad valorem tariff. But the import ban achieved this temporary benefi t only at the expense of increasing domestic rice prices—in advance of the 2007–2008 international price increases—thereby permanently increasing poverty incidence.
a A detailed description of the models can be found in the studies by Warr (2010a, 2010b). The model closure
assumptions underlying the simulations are outlined in Warr (2008).b The MUV index is an index of internationally traded manufactured goods prices.
Sources: Warr, P. 2010. Chapters on Indonesia and Thailand. In K. Anderson, J. Cockburn, and W. Marin, eds.
Agricultural Price Distortions, Inequality and Poverty. Washington DC: World Bank.; and Warr, P. 2011. Food
Security vs. Food Self-Suffi ciency: The Indonesian Case. The Indonesia Quarterly. 39 (1, First Quarter). pp. 56–71.
impact on undernourishment. On the other hand, infant and child mortality seemed to be affected by past infl ation, as the effect of contemporaneous infl ation disappeared when one-period lagged infl ation was included. Furthermore, the study showed that the impact of food prices is more severe in least developed countries, although the effect is moderated where agriculture has a greater share of GDP.
The effects of contemporaneous and lagged food price volatility on the three health indicators were also examined. Contemporaneous food price volatility was shown to increase infant and child mortality, but did not seem to affect the prevalence of undernourishment. However, the study found that when lagged food price volatility was included, infant and child mortality were mostly affected by the past terms of food price volatility, implying that it takes some time for food price volatility to affect mortality rates.

Access to Food: Poverty, Nutrition, and the Impact of Food Crises
37
Figure 3.13: Impact of Higher Food Price Infl ation on Health Indicators
Note: Figures show percentage change in health indicators for every 1 percentage point increase in the food price
infl ation rate.
Source: Lee et al. Forthcoming. Food Prices and Population Health in Developing Countries: An Investigation of
the Effect of the Food Crisis Using a Panel Analysis. ADB Economics Working Paper. Manila: ADB.
The Role of Social Safety Nets
Most Asian countries use social safety nets of some kind, intended to shield poor and vulnerable groups from severe deprivation. As a percentage of GDP, social protection expenditures vary across developing Asia (ADB 2008)—from 1.3% in the Lao PDR, to 1.9% in Indonesia, 2.2% in the Philippines, 4.0% in India, 5.3% in Bangladesh, and 9.8% in Mongolia, among others. The share is 2% or less in 10 of 31 Asian countries. On average, poorer countries allocate lower proportions of GDP for social protection. In the US, the share is 9%; in Japan, 16%; and in the European Union, it reaches 19%. Moreover, given the inability to accurately target the poor when needed, the effectiveness of existing schemes in developing countries is questionable.
One recent study (Jha, Kotwal, and Ramaswami, forthcoming) reviews existing social safety net schemes in four developing Asian countries—Bangladesh, India, Indonesia, and the Philippines (Box 3.2). Four major categories of safety net programs were examined: (i) consumer food price subsidies, (ii) food-for-work programs, (iii) feeding programs, and (iv) cash transfers. The study found that the subsidized food programs in all four countries had high rates of both exclusion error (omitting households who qualify for inclusion) and inclusion error (providing assistance to households outside the criteria for inclusion). The study also found regional and ethnic biases in allocation schemes. There are practical problems in identifying qualifying households, as well as simple corruption. The sale of subsidized grain is apparently widespread, but this is not necessarily a problem if the sellers are themselves poor recipients of the grain, who sell it to obtain other commodities
0
.05
.10
.15
.20
.25
.30
.35
.40
.45
Infant mortality rate Under-5 mortality rate Undernourishment rate
Perc
en
t
Health indicators
Current food price inflation rate Food price inflation rate 1 year ago
Food price inflation rate 2 years ago

Food Security in Asia and the Pacifi c
38
Box 3.2: Social Safety Nets and Food Programs in Selected Developing Asian Countries
BangladeshBangladesh’s food safety net program has moved from its colonial system, which involved obtaining supplies and distributing them to consumers in rationed quantities and at subsidized prices, to a more targeted approach that has been in use since the early 1990s. These include in-kind wages for manual labor in public works (Food-for-Work and Test Relief). Other major food transfer safety nets are the Vulnerable Group Development Program—targeting poor women—and feeding programs like the Vulnerable Group Feeding Program and a primary school feeding program. Bangladesh likewise has cash-based social programs such as the Primary Education Stipend Program and the Rural Maintenance Program, with the latter targeting women as well.
IndiaIn India, the central and state governments jointly run a marketing channel called the Public Distribution System (PDS) devoted solely to the distribution of subsidized food grain. This involves a network of private retailers called “Fair Price Shops” that distribute subsidized grains. These Fair Price Shops sell grain below market prices to consumers holding “ration cards,” each subject to a quota. Since 1997, subsidies are targeted depending on a household’s classifi cation as “above poverty line,” “below poverty line,” or “poorest of the poor” by the Antayodaya Anna Yojana Program. The program cost is shouldered by the central government, except in cases where state governments cover benefi ciaries in excess of central government estimates. Apart from the subsidy, India uses a cash transfer scheme—the National Rural Employment Guarantee Act—in which cash is distributed as wages from public works employment. Another cash transfer program targets those over 65 years old who are classifi ed as below the poverty line.
IndonesiaIndonesia’s major safety net programs are its Raskin rice subsidy program; a program providing free inpatient and outpatient care to households at primary health centers and hospitals; and a nonrecurrent cash transfer scheme, Bantuan Langsung Tunai (Direct Cash Assistance [BLT]), used in 2005 and 2008 to help households cope with fuel price increases due to fuel subsidy cuts. Other cash transfers exist in smaller social assistance programs targeting the poor, elderly, persons with disabilities, and youth. One is a conditional cash transfer scheme based on health and education-related conditionalities for household mothers and their school-aged children.
PhilippinesThe Philippines’ rice price subsidy, run by the National Food Authority (NFA), is the largest food program in the country. Almost 90% of the rice under this program is sourced from external markets. During the food, fuel, and fi nancial crises in 2008, when there were over 60 social programs in the country, the NFA subsidy accounted for 70% of the total social protection budget. While the rice price subsidy is largely untargeted—except in 2008, when only low-income households in Metro Manila could purchase subsidized rice—it is accompanied by smaller programs like the Tindahan Natin (Our Store) Program geared toward distributing food supplies to areas determined by a Food Insecurity and Vulnerability Information Mapping System. Among the many other social assistance programs are school feeding programs, where children attending accredited schools receive 1 kilogram (kg) of rice per day—and in selected schools, are provided breakfast. However, most work now is on the government’s newest and fast-expanding centerpiece program—a conditional cash transfer scheme (originally the Pantawid Pamilyang Pilipino (Filipino Family Assistance) Program [4Ps]). Begun in 2007 with a pilot group of 6,000 households, the program covered 2.3 million households by 2011, with a target of 3 million households by 2012. To qualify, households must: (i) be located in poor areas; (ii) be classifi ed as poor through a proxy means test; (iii) have either a pregnant mother or at least one child aged 0–14; and (iv) meet conditions relating to education and health, such as 85% school attendance, health clinic visits, and de-worming for children.
Source: Jha, S., A. Kotwal, and B. Ramaswami. Forthcoming. The Role of Social Safety Nets and Food Programs.
ADB Economics Working Paper. Manila: ADB.

Access to Food: Poverty, Nutrition, and the Impact of Food Crises
39
or higher quality food. It becomes a serious problem, however, if the sellers are public offi cials charged with distributing subsidized grain.
In India, the Public Distribution System (PDS) for subsidized access to grains is said to have exclusion and inclusion errors of 70%. Similar rates of inclusion error are reported for Indonesia’s Raskin (Rice for the Poor) program and the Philippines’ subsidized food program under its National Food Authority (NFA), though exclusion errors are somewhat lower—29% in Indonesia and 52% in the Philippines.
These data do not necessarily show that existing programs are counterproductive, because at least some of the benefi ts do reach the intended benefi ciaries. Nevertheless, the associated wastage and corruption are major issues, which raise the question of whether program objectives should be pursued in other ways. Throughout Asia, the fi scal stimulus and reduced government revenues that followed the 2008–2009 global fi nancial crisis increased the urgency of fi nding better ways of using public money.

40
IV. Availability of Food: Competing Demands for Resources, Productivity, and Agricultural Research
Boosting food production to meet ever-increasing demand often comes at the expense of dwindling natural resources. With these growing pressures, the only sensible way would be to enhance agricultural productivity—higher yields with
fewer resources—and to use food more effi ciently, which would include improving product delivery and minimizing waste.
Competing Demands for Land, Water, and Energy
The ongoing structural transformation increasingly constrains the complex nexus of the availability and sustainability of natural resources in providing food security. Trends in population, economic growth, industrialization, urbanization, and changing dietary patterns are already tightening the grip on scarce natural resources. Growth in food demand is expected to accelerate over the next few decades as population and economic growth expand in developing countries. The more affl uent will demand more protein-rich and resource-demanding products—not just meat and dairy products, but also vegetables and sugars. All these require far more water and energy per calorie produced than cereals. Increased competition for land, water, and energy is a threat to sustainable agriculture and global food systems.
Total arable land declined from 0.36 hectares per capita (ha/capita) in 1970 to 0.20 ha/capita in 2011 (Figure 4.1). According to one estimate (Alexandratos and Bruinsma 2012), arable land is projected to drop further to 0.18 ha/capita by 2050. Total arable land in East and South Asia went down from 0.24 ha/capita in 1961–1963 to 0.13 ha/capita in 2005–2007.10 It is expected to reach just 0.10 ha/capita by 2050. The decline is more evident in South Asia, where arable land per capita fell from 0.33 ha/capita in 1961–1963 to 0.14 ha/capita in 2005–2007—and is expected shrink further to less than 0.10 ha/capita by 2050. Estimates for East Asia show arable land per capita fell from 0.19 ha/capita in 1961–1963 to 0.12 ha/capita in 2005–2007—and is also expected to fall further to 0.11 ha/capita by 2030, remaining steady through 2050 mostly due to declining population.
10 The composition of East Asia and South Asia in this estimate is different from that used in Figure 4.1. Alexandratos and Bruinsma (2012) defi ne East Asia to include Cambodia; the PRC; Hong Kong, China; Indonesia; the Democratic People’s Republic of Korea; the Republic of Korea; the Lao PDR; Malaysia; Mongolia; Myanmar; the Philippines; Thailand; and Viet Nam. South Asia includes Bangladesh, India, Nepal, Pakistan, and Sri Lanka.

Availability of Food: Competing Demands for Resources, Productivity, and Agricultural Research
41
Water resources are increasingly strained worldwide, with agriculture consuming about 80% of the world’s “blue water” from bodies of water and aquifers (Rosegrant, Cai, and Cline 2002). Moreover, global water distribution is uneven relative to population, being relatively scarce in more populous regions in Asia and the Pacifi c (Figure 4.2). Water resource availability in Asia ranges from less than 2,500 cubic meters per capita per year (m3/capita/year) in densely populated Northeast, South, and Southwest Asia, to about 50,000 m3/capita/year in the Pacifi c. And this is also dropping gradually due to population growth. Across Asia, between 60% and 90% of water consumption is for agriculture (Figure 4.3). But the region’s growing population and rapid urbanization are intensifying competition for water resources. Water consumption in the region for households and industries increased from 13% to 22% between 1992 and 2002 (UN Economic and Social Commission for Asia and the Pacifi c [UNESCAP] 2011). Meanwhile, global agricultural water consumption (including both rainfed and irrigated) is projected to increase by about 19% by 2050 (UN Educational, Scientifi c and Cultural Organization [UNESCO] 2012). Asia and the Pacifi c would need an additional 2.4 billion cubic meters (m3) of water per day to provide each consumer with 1,800 calories per day by 2050 (UNESCO 2012).
Expanding cultivated lands is no longer an option for food production growth in nearly all of Asia and the Pacifi c. However, there is much room for farmers to produce more with currently available resources. For example, where irrigation is available in Southeast Asia, the average maximum rice yield is estimated at 8.5 tons per hectare. However, actual yields average only 60% of this (Godfray et al. 2010). Similar yield gaps exist for rainfed wheat in Central Asia. Increasingly constrained water resources for agriculture are aggravated
Figure 4.1: Arable Land, 1961–2011 (ha/capita)
ha = hectare.
Note: Refer to Appendix A for a list of economies in each region.
Sources: ADB estimates based on data on arable land, http://faostat.fao.org/site/377/default.aspx#ancor
(accessed 7 May 2013), and on population, http://faostat.fao.org/site/550/default.aspx#ancor (accessed 7 May
2013), both from FAOSTAT.
1961
1963
1965
1967
1969
1971
1973
1975
1977
1979
1981
1983
1985
1987
1989
1991
1993
1995
1997
1999
2001
2003
2005
2007
2009
2011
0
.05
.10
.15
.20
.25
.30
.35
.40
.45
Are
a
Year
East Asia Pacific South Asia Southeast Asia World

Food Security in Asia and the Pacifi c
42
Figure 4.2: Renewable Water Resources, 2010(m3/capita/year)
m3 = cubic meter.
Note: Aggregation is based on the UN Economic and Social Commission for Asia and the Pacifi c (UNESCAP)
regional groupings, which are different from those in Appendix A: East and Northeast Asia (called “East Asia” in
Appendix A) includes the Macau Special Administrative Region of the People’s Republic of China (Macau SAR);
Southeast Asia includes Timor-Leste; South and Southwest Asia (called “South Asia” in Appendix A) includes
Iran and Turkey; North and Central Asia (called “Central and West Asia” in Appendix A) includes the Russian
Federation; and Pacifi c includes American Samoa, French Polynesia, Guam, New Caledonia, Niue, the Northern
Mariana Islands, and Tuvalu in addition to the economies listed in Appendix A.
Source: UNESCAP. 2011. Statistical Yearbook for Asia and the Pacifi c 2011. http://www.unescap.org/stat/data/
syb2012/ (accessed 29 May 2013).
by energy prices, which have risen signifi cantly in recent years. High energy prices hurt food production through the use of fertilizers and fuels for tillage, planting, harvesting, and transportation. Costs of extracting water and providing irrigation also rise. More generally, high energy prices raise the costs of inputs, production, transportation, and marketing—all affecting agricultural output and food prices.
Agricultural Productivity
With the majority of Asia’s poor—and the world’s poor, generally—living in rural areas, agriculture can play a powerful role in reducing poverty. Not only does agricultural productivity growth increase the availability of food, it also increases the incomes of the rural poor—and thus enhances access to food and provides better food security. For example, studies (Suwannarat 2011; Warr 2005, 2008) show that agricultural productivity growth signifi cantly contributed to poverty reduction in selected Association of Southeast Asian Nations (ASEAN) economies (Box 4.1).
Better agricultural productivity can come in either or both of two ways: (i) through improved productivity at the farm level, reducing the cost of producing food and thus reducing its
0
10,000
20,000
30,000
40,000
50,000
60,000
Asia and thePacific
East andNortheast
Asia
SoutheastAsia
South andSouthwest
Asia
North andCentral Asia
Pacific World
Resou
rces p
er
ca
pit
a
Region

Availability of Food: Competing Demands for Resources, Productivity, and Agricultural Research
43
Figure 4.3: Water Consumption in Asia and the Pacifi c(billion m3)
m3 = cubic meter.
Note: Aggregation is based on the UNESCAP regional groupings, which are different from those in Appendix A:
East and Northeast Asia (called “East Asia” in Appendix A) includes the Macau SAR of the PRC; Southeast Asia
includes Timor-Leste; South and Southwest Asia (called “South Asia” in Appendix A) includes Iran and Turkey;
North and Central Asia (called “Central and West Asia” in Appendix A) includes the Russian Federation; and
Pacifi c includes American Samoa, French Polynesia, Guam, New Caledonia, Niue, the Northern Mariana Islands,
and Tuvalu in addition to the economies listed in Appendix A.
Source: UNESCAP. 2013. Building Resilience to Natural Disasters and Major Economic Crises. Bangkok:
UNESCAP. http://www.unescap.org/idd/Pubs/ThemeStudy2013/ThemeStudy2013-full.pdf
price to the wholesale market; and/or (ii) through enhanced postharvest productivity—more effi cient marketing between producers and retailers, and better refrigeration and public transport infrastructure, for example. Reducing losses for all those involved in the supply chain can improve farm and marketing profi tability, while simultaneously allowing for more food to be available for consumers at more affordable prices.
Productivity at the Farm Level
Annual cereal production in Asia and the Pacifi c has continued to grow—from about 350 million tons in the early 1960s to about 1.15 billion tons in the latter part of the fi rst decade of the 2000s. The region’s share in total cereal production worldwide went up from 37.0% to 47.5% over the same period. However, the pace of this production growth has been declining, slowing precipitously during the 1990s, and then picking up slightly in the 2000s (Figure 4.4). The decline in cereal production growth has been largely due to a decline in yield, as the gains from the Green Revolution waned by the 1990s. A similar pattern is also seen in the production, yield, and area planted for rice and wheat (Figure 4.4). The growth in area planted to rice and wheat has declined since the 1960s—from about 1.4% annually for both crops, to 0.6% for rice and 1% for wheat in 2002–2011. Yield growth also declined over the same period, from about 2.5% to 1.5% for rice, and 4.9% to 1.1% for
500
0
1,000
1,500
2,000
2,500
3,000
3,500
4,000
Con
su
mp
tion
Region
Industry Domestic Agriculture
Asia and the Pacific
East andNortheast
Asia
SoutheastAsia
South andSouthwest
Asia
North andCentral Asia
Pacific World

Food Security in Asia and the Pacifi c
44
Box 4.1: Agricultural Productivity Growth in Thailand
In Thailand, 86% of the population below the government’s poverty line lives in rural areas. Most derive their incomes from agriculture. Using data on rural and urban poverty incidence in each
of four regions—Central, South, North, and Northeast Thailand—from 1988 to 2010 at 2-year intervals, from the government’s biannual Socio-economic Survey, Warr (2013) estimated the impact of agricultural productivity growth on poverty incidence (Table B4.1). Data on agricultural productivity growth were estimated on an annual basis for each region covering 1986–2010, along with annual data on food prices relative to the consumer price index (CPI) over the same period.
The estimated results suggest that greater agricultural productivity reduced both rural and urban poverty incidence. While this seems obvious for the rural poor, for the urban poor it may indicate the close economic links between the urban poor and their rural families. Many urban poor work part-time on the family farm, returning to the cities when demand for agricultural work is lowest. The rural and urban poor are also linked through remittance fl ows.
Table B4.1: Agricultural Productivity Growth and Poverty Incidence in Thailand
Item Rural Urban
Annual change in TFP (–1) –16.549*** –10.840**
Annual change in food price/CPI 0.403*** 0.194
North 0.605 –0.822
Northeast –1.179 –0.974
South –0.550 –0.236
Dummy for 1996–1998 2.788** 1.351
Dummy for 1998–2000 7.858** 5.346***
Constant –3.340*** –2.055***
CPI = consumer price index, TFP = total factor productivity.
*** = signifi cant at the 1% level of signifi cance; ** = signifi cant at the 5% level of signifi cance; * = signifi cant at the 10%
level of signifi cance.
Note: Poverty incidence is the dependent variable.
Source: See box source.
wheat. The production growth of maize also declined by less than half in the 1990s, as yield growth declined sharply (Figure 4.4). However, growth in maize production has more than tripled in the last decade—as the result of an increase both in area planted and in yield. Increasing demand for maize as important livestock feed may have been a driver behind the recent production increase of maize in Asia and the Pacifi c.
The long-term rates and determinants of productivity growth in Asian agriculture have been examined (Sombilla, Mapa, and Piza, forthcoming), with some encouraging preliminary evidence of improvement in total factor productivity (TFP). TFP in rice production in the different subregions of Asia increased from the 1980s to the fi rst decade of the 2000s (Figure 4.5). TFP in rice production in the last decade was 2.2% in East Asia, 3.5% in South Asia, and 3.1% in Southeast Asia. Considering the declining yield growth, the productivity of factors of production other than land must have been increasing more rapidly than the
Source: Warr, P. 2013. Agricultural Productivity and Poverty Reduction in Thailand. Mimeo. Australian National University.

Availability of Food: Competing Demands for Resources, Productivity, and Agricultural Research
45
Figure 4.4: Yield and Area Growth Trends for Cereals in Asia and the Pacifi c, 1962–2011
(%)
–0.5
0.0
0.5
1.0
1.5
2.0
2.5
3.0
3.5
4.0
4.5
1962–1971 1972–1981 1982–1991 1992–2001 2002–2011
Avera
ge a
nn
ua
l g
row
th r
ate
Years
Yield Area
0.0
0.5
1.0
1.5
2.0
2.5
3.0
3.5
4.0
4.5
1962–1971 1972–1981 1982–1991 1992–2001 2002–2011
Avera
ge a
nn
ua
l g
row
th r
ate
Years
Yield Area
Notes:
1. All cereals include major cereals such as maize, rice, and wheat, as well as other cereals such as barley,
buckwheat, canary seed, fonio, millet, mixed grain, oats, quinoa, rye, sorghum, and triticale.
2. Refer to Appendix A for a list of economies in Asia and the Pacifi c.
Source: ADB estimates based on production and harvested area data from the FAOSTAT, http://faostat.fao.org/
site/567/default.aspx#ancor (accessed 7 May 2013).
0
1
2
3
4
5
6
7
1962–1971 1972–1981 1982–1991 1992–2001 2002–2011
Avera
ge a
nn
ua
l g
row
th r
ate
Years
Yield Area
All Cereals
Wheat
Rice
Maize
0
1
2
3
4
5
6
1962–1971 1972–1981 1982–1991 1992–2001 2002–2011
Avera
ge a
nn
ua
l g
row
th r
ate
Years
Yield Area
reported TFP—which is a cost-share weighted average of the growth rates of productivity of the individual factors. This must mean that labor productivity, in particular, increased through mechanization. In the case of wheat, the data indicate a moderate decline in TFP from the 1980s to the 2000s (Figure 4.5) in some subregions of Asia.11
There are three main threats to sustaining productivity growth: (i) waning gains from Green Revolution technology; (ii) maintaining soil health as multiple cropping expands; and (iii) battling new strains of pests and disease, some resistant to existing chemical controls. Soil erosion, salinization, water pollution, and excessive use from underground sources also threaten continued improvement in TFP. Small farms have diffi culty raising productivity through mechanization, despite the emergence of machine rentals in some markets.
11 Wheat production in Southeast Asia is small, done primarily in Myanmar and Thailand, and only since the 1980s. Production growth drastically slowed during 1981–1990, picking up in 2001–2010, which explains the relatively high TFP estimate for the most recent period.

Food Security in Asia and the Pacifi c
46
Figure 4.5: Total Factor Productivity in Major Cereals, 1981–2010 (%)
Tota
l fa
cto
r p
rod
ucti
vit
y
–2
–1
0
1
2
3
4
East Asia South Asia Southeast Asia
Region
1981–1990 1991–2000 2001–2010 1981–2010
Wheat
Rice
Notes:
1. For rice, East Asia includes the People’s Republic of China (PRC) and Mongolia; Southeast Asia includes
Cambodia, Indonesia, the Lao People’s Democratic Republic (Lao PDR), Malaysia, Myanmar, the Philippines,
Thailand, and Viet Nam; and South Asia includes Bangladesh, India, Nepal, Pakistan, and Sri Lanka.
2. For wheat, East Asia includes the PRC and Mongolia; Southeast Asia includes Myanmar and Thailand; and
South Asia includes Bangladesh, India, Nepal, Pakistan, and Sri Lanka.
Source: Sombilla, M., D. Mapa, and S. Piza. Forthcoming. Overcoming Critical Constraints to Sustaining
Agricultural Productivity Growth in Asia and Pacifi c. ADB Economics Working Paper. Manila: ADB.
–20
–15
–10
–5
0
5
10
East Asia South Asia Southeast Asia
Tota
l fa
cto
r p
rod
ucti
vit
y
Region
1981–1990 1991–2000 2001–2010 1981–2010

Availability of Food: Competing Demands for Resources, Productivity, and Agricultural Research
47
Tenure arrangements affect land rights and reduce incentives for farmers to invest in improving productivity. There have been reforms in providing legal rights to land, but these have not been rapid enough in many Asian countries to show productivity gains. Credit markets remain insuffi cient, partly as a result of poorly defi ned land rights, limiting potential collateral for loans.
Postharvest Productivity
Agricultural productivity is determined both on and off the farm. Estimates show roughly half of the fi nal consumer price of food in Asia emanates on the farm, while the other half is accounted for by postfarm costs. Of course, proportions vary considerably by locality and commodity. However, both farm and off-farm productivity are important for food security—together they determine the cost of food to the fi nal consumer. Despite off-farm productivity being roughly equal to farm level productivity, it has received far less attention.
All three segments of the overall food value chain—upstream (farming and input supply), midstream (processing and wholesale), and downstream (retail)—are undergoing signifi cant transformation. Overall, lowering off-farm costs benefi ts both farmers and consumers. The process is driven primarily by the private sector, but public policy has an important role to play. First, monopolies must be prevented by promoting competition. Reducing entry barriers to new fi rms effectively prevents exploitative monopolies from developing. Second, much private sector activity is dependent on public infrastructure. Aside from farm-to-market infrastructure, reliable power is needed for cold storage, for example. In larger, mostly urban markets, liberalizing foreign direct investment (FDI) allows more cost-effi cient food processing and retailing through supermarkets.
How food moves through the supply chain is changing rapidly—especially the way it is marketed. The food value and supply chain revolution taking shape in India is an example of this transformation (Box 4.2)—one that has already taken root in the PRC.
Minimizing food loss and waste also enhances food availability. The FAO estimates roughly one-third of food produced for human consumption globally is lost or wasted (Gustavsson et al. 2011). Food losses occur throughout the supply chain—from farm production to household consumption. Food losses and waste are generally much higher in advanced economies than in developing countries. For example, per capita food loss in Europe and North America is 280–300 kilograms per year (kg/year), while it is 120–170 kg/year in Sub-Saharan Africa, South Asia, and Southeast Asia. However, when compared against the smaller total per capita production in developing countries, the ratio of food loss to total food production in developing countries is no less than in advanced economies. For example, the total per capita food production in Sub-Saharan Africa and South and Southeast Asia is about 460 kg/year compared with about 900 kg/year in Europe and North America. In other words, approximately one-third of production is lost.
In medium- and high-income countries, much food is wasted at the consumption stage—that is, it is discarded even if it is still edible. Figure 4.6 shows loss and waste in the food supply system for cereals. In developing countries, food loss during postharvest and processing accounts for more than 40% of total losses. Although food waste by consumers is relatively limited, signifi cant food loss occurs during production and postharvest handling

Food Security in Asia and the Pacifi c
48
Box 4.2: The Rice Value Chain Transformation in Bangladesh and India
Rice value chains can be grouped into four types, varying in terms of geographical length or the physical distance from farm to retailer, and by intermediational length or the number
of steps from farm to retailer measured in the number of agents intermediating between them. These four types of value chains are as follows:
1. Traditional rice value chain. Contained in the rural areas, this chain is geographically and intermediationally short, and consists of the local supply chain of paddy grown by the farmer, which is dehusked in a local village mill and consumed by the farm household or sold to the local village market for local consumption.
2. Rural–urban traditional rice value chain. This chain is geographically long and intermediationally long, and features the sale of paddy to local brokers or village traders, who sell it as paddy or have it milled in village mills that sell it to rural wholesale markets, where wholesalers from the cities buy it to sell to semi-wholesalers or traditional retailers.
3. Transitional rice value chain. This chain is geographically long and intermediationally medium, and entails the rice farmer selling paddy directly to mills. The mills then sell the rice to city wholesale market traders—or they sell the paddy to rural or city wholesale market traders, who have it milled and then sell the rice in the city wholesale market. Traditional retailers buy the rice directly at the city wholesale market.
4. Modern rice value chain. This value chain is geographically long and intermediationally short, with the farmer selling paddy directly to mills that in turn sell the rice directly to urban wholesale markets or directly to supermarkets and traditional urban retailers.
Using a survey of thousands of farmers, millers, and retailers, a study (Reardon et al., forthcoming) was conducted by the International Food Policy Research Institute (IFPRI) in 2009–2010 to provide insight into South Asia’s rice value chains. The study—which covered the rice value chain from Noagoan to Dhaka in Bangladesh, and from Shahjahanpur to New Delhi in India—suggested that rice value chains are recasting their traditional image, with changes involving signifi cant modernization in retail markets. These changes signify a “quiet revolution” in traditional value chains in South Asia for two reasons. First, the arrival of foreign direct investment (FDI) in processing and changes in world food trading systems that are transforming traditional staples chains tend to take place in the midstream—among traders and in rice mills. These midstream changes mirror the more visible downstream modernization in that they involve consolidation, and technological and organizational changes in the segments. Second, the midstream changes are “quiet” because they are grassroots in nature and are as yet generally unrecognized, and their importance underappreciated, especially in policy circles.
Rice value chains in both countries appear to be shifting from the traditional to an intermediate stage, with a decline in the role of the traditional rural middleman or village trader, and the rise of direct sales from farmers to mills and wholesale markets. In Bangladesh, the rural–urban traditional value chain still dominates, but the transitional value chain is emerging quickly, with direct sales to mills. In India, on the other hand, the transitional value chain dominates the market, with the continued use of village traders and rural wholesale markets upstream, but with the direct sale from mills to urban traders downstream. The most traditional value chain no longer has a signifi cant presence in either of these countries. The study found that the role of the village trader had shrunk, controlling only 7% of farms and sales in Bangladesh, and 38% of farms and 18% of sales in India. Second, the role of the wholesaler—mainly at the wholesale market but also at the mill—was becoming far greater due to direct purchase from the farmer: in both Bangladesh and India, farmers sold about 63% of their paddy directly to wholesalers. Third, incipiently in Bangladesh but not yet in India, farmers were bypassing middlemen and selling directly to mills: of all paddy rice sold in Bangladesh, 30% was sold directly to mills; in India, that fi gure was 5%. The lower percentage in India is probably due to the Agricultural Produce Marketing Act that continues to be enforced in Uttar Pradesh, limiting market transformation.
continued on next page

Availability of Food: Competing Demands for Resources, Productivity, and Agricultural Research
49
and storage. This is true across different types of food in the developing countries of South and Southeast Asia (Figure 4.7). The quality of postharvest infrastructure will likely become far more important in developing countries as dietary composition in these countries shifts from cereals and grains to fruits and vegetables, which perish quickly and have limited shelf life—and to animal-sourced food such as meat, which requires special care to meet sanitary and phytosanitary requirements.
Agricultural Research
Agricultural research is critical to raising productivity. It also helps fi nd innovative ways to adapt to changes in agricultural environment due to climate change. Agricultural research conducted by individual developing countries differs in nature from fundamental research conducted by international institutions, including universities. While fundamental agricultural research takes long before it bears fruit, adaptive research needed most in developing countries pays off much more quickly. Its value is primarily
Box 4.2 continued
Likewise, there have been signifi cant structural and organizational changes in the mill segment. Rice milling is becoming more concentrated in the medium-sized and large mills, with a rapid decline in small village mills, especially in India. Milling technology in both countries has also been changing toward semi-automatic and automatic mills. Private milling and trading fi rms have made large investments in capacity expansion, new technology, logistics, and services to farmers. The survey showed evidence of disintermediation upstream, with the traditional role of the village trader diminishing as wholesale markets sourced paddy directly from farmers, while mills increased direct sourcing from farmers. Moreover, disintermediation was also evident downstream, with mills selling directly to wholesale markets in the big cities. Meanwhile, traditional rice retail has been evolving in ways that point toward greater quality differentiation, packaging, and brand development, more so in Bangladesh than in India. Given these incipient changes, it is likely that branding and the resulting traceability will be signifi cant factors in the development of rice markets in urban Asia, encouraging continued consolidation in the mill and trading sectors.
While much policy debate centers on direct government operations in food value chains, such operations in the rice value chain in the areas studied were in general quite small, except for the Government of India’s purchases from mills. The implication is that the great majority of the activity in rice value chains is based on private sector actions, whether traditional or modern. Thus, a great deal of emphasis should be placed on enabling the private sector’s involvement and providing it with the incentives to assist in attaining national food security objectives. That said, the indirect roles played by the government have been important in enabling change by providing incentives for transformation through investments in infrastructure and research, including extension services.
Government subsidies were shown to have important effects. Subsidies for rice seeds, fertilizer purchases, and mill upgrading appear to have encouraged the use of and investment in these items, which have played important roles in transforming the value chains. However, the survey also showed that the subsidies did not always go to the target benefi ciaries. A key policy implication is that if large subsidies are distributed, great care should be taken to ensure that they are properly targeted and delivered.
Source: Reardon, T., B. Minten, K. Chen, and L. Adriano. Forthcoming. The Transformation of Rice Value Chains
in Bangladesh and India: Implications for Food Security. ADB Economics Working Paper. Manila: ADB.

Food Security in Asia and the Pacifi c
50
Figure 4.6: Food Losses Within the Food Supply System in Cereals, by Region
(%)
0
10
20
30
40
Europe incl.the RussianFederation
North Americaand Oceania
IndustrializedAsia
Sub-SaharanAfrica
North Africa,West and
Central Asia
South andSoutheast Asia
Latin America
Food
loss
Region
Agricultural production Postharvest handling and storage Processing and packagingDistribution Consumption
incl. = including.
Notes:
1. “Food” waste or loss is measured only for products for human consumption, excluding inedible feed and
product parts. Therefore, food originally meant for human consumption that drops out of the human food chain
is considered food loss or waste, even if directed to nonfood uses such as feed or bioenergy (Gustavsson
et al. 2011).
2. Regional groupings are as defi ned by Gustavsson et al. (2011).
Source: Gustavsson, J., C. Cederberg, U. Sonesson, R. van Otterdijk, and A. Meybeck. 2011. Global Food
Losses and Food Waste: Extent Causes and Prevention. Study conducted for the International Congress SAVE
FOOD! at Interpack Düsseldorf, Germany. Rome: FAO. http://www.fao.org/docrep/014/mb060e/mb060e00.pdf
local as its fi ndings may not be applicable to other regions. For this reason, these two forms of agricultural research—fundamental and adaptive—are complements rather than substitutes.
Relative to the world as a whole, Asia’s commitment to agricultural research as measured by public agricultural research and development (R&D) intensity—the ratio of public agricultural R&D spending to agricultural GDP—has been low (Figure 4.8). However, the region’s spending on R&D has increased rapidly since the 1990s. This is refl ected in Asia and the Pacifi c’s growing share in global public agricultural R&D spending (Figure 4.9)—undoubtedly contributing to Asia’s agricultural productivity growth. It is essential that this commitment be maintained, especially in light of the growing pressure on resources and the transformation taking place across Asia and the Pacifi c.

Availability of Food: Competing Demands for Resources, Productivity, and Agricultural Research
51
Figure 4.7: Food Losses Within the Food Supply System in South and Southeast Asia, by Commodity Group
(%)
0
10
20
30
40
50
60
Cereals Rootsand Tubers
Oilseedsand Pulses
Fruit andVegetables
Meat Fish andSeafood
Milk
Fo
od
lo
ss
Commodity
Agricultural production Postharvest handling and storage Processing and packagingDistribution Consumption
Notes:
1. “Food” waste or loss is measured only for products for human consumption, excluding inedible feed and
product parts. Therefore, food originally meant for human consumption that drops out of the human food chain
is considered food loss or waste, even if directed to nonfood uses such as feed or bioenergy (Gustavsson
et al 2011).
2. Regional groupings are as defi ned by Gustavsson et al. (2011).
Source: Gustavsson, J., C. Cederberg, U. Sonesson, R. van Otterdijk, and A. Meybeck. 2011. Global Food
Losses and Food Waste: Extent Causes and Prevention. Study conducted for the International Congress SAVE
FOOD! at Interpack Düsseldorf, Germany. Rome: FAO. http://www.fao.org/docrep/014/mb060e/mb060e00.pdf
Figure 4.8: Public Agricultural Research and Development Intensity, by Region and Income Group
(%)
CEES and CIS = Common European Economic Space and Commonwealth of Independent States,
PRC = People’s Republic of China, GDP = gross domestic product, LAC = Latin America and the Caribbean,
MENA = Middle East and Northern Africa, R&D = research and development, SSA = Sub-Saharan Africa.
Note: Regional groupings are as defi ned by Beintema, N. M., G. J. Stads, K. Fuglie, and P. Heisey. 2012. ASTI
Global Assessment of Agricultural R&D Spending: Developing Countries Accelerate Investment. Washington,
DC and Rome: International Food Policy Research Institute (IFPRI) and Global Forum on Agricultural Research.
http://www.ifpri.org/sites/default/fi les/publications/astiglobalassessment.pdf
Source: Agricultural Science and Technology Indicators (ASTI) database as published in Beintema et al. 2012.
http://www.asti.cgiar.org/pdf/GlobalAssessmentDataTables.pdf (accessed 6 May 2013).
0.0
0.5
1.0
1.5
2.0
2.5
3.0
3.5
SSA PRC India Asia and the Pacific
Brazil LAC MENA CEES and CIS
Highincome
World
Region and income group
1981 1990 2000 2008
Ag
ricu
ltu
ral
R&
D s
pen
din
g
to a
gri
cu
ltu
ral
GD
P

Food Security in Asia and the Pacifi c
52
Figure 4.9: Share of Asia and the Pacifi c in Global Public Agricultural Research and Development Spending, 1981–2008
(%)S
ha
re in
glo
ba
l p
ub
lic a
gri
cu
ltu
ral
R&
D s
pen
din
g
02468
101214161820222426
1981 1990 2000 2008
Year
R&D = research and development.
Note: Regional groupings are as defi ned by Beintema, N.M., G. J. Stads, K. Fuglie, and P. Heisey. 2012. ASTI
Global Assessment of Agricultural R&D Spending: Developing Countries Accelerate Investment. Washington, DC
and Rome: IFPRI and Global Forum on Agricultural Research. http://www.ifpri.org/sites/default/fi les/publications/
astiglobalassessment.pdf
Source: ASTI database as published in Beintema et al. 2012. http://www.asti.cgiar.org/pdf/
GlobalAssessmentDataTables.pdf (accessed 6 May 2013).

53
V. Transportation, Logistics, and International Trade
Transport and Logistics
Transport and communication infrastructure networks not only move goods around a country, but also enhance cross-border trade. Assuming defi cit areas exist, infrastructure helps food reach them and prevents any surplus from depressing local prices. The low value-to-bulk ratio of most food products means delivered prices are highly sensitive to changes in logistics costs—important determinants of agricultural and other trade fl ows (Brooks and Hummels 2010).
Food in Asia and the Pacifi c is predominantly produced on farms. Farm produce is then transported for processing and packaging, and moved to the store or supermarket warehouse. The entire food supply chain utilizes transportation systems such as roads, railroads, and ports around a network of intermodal hubs. At multiple points during the transport stage, food products may pass through an intermodal hub where it is warehoused and loaded onto another transport mode. When food reaches the store or supermarket warehouse, it is transferred to the wholesale or retail outlet where it is purchased and consumed. The risks and vulnerabilities to food systems can be found along this food supply chain.
Although international trade is important in enhancing food security, domestic trade is far more critical. Rice is an extreme example. Only 4%–5% of the global production of rice is traded in international markets. Farmers’ access to markets must be facilitated by investment in rural road construction and maintenance. This will also help in reducing trade costs. Rural residents benefi t in three ways. First, transport costs to wholesale markets are often shouldered by smallholders. Thus, better roads raise the profi tability for farmers given the same price received from wholesalers. Second, it reduces the costs farmers pay for agricultural inputs and other communities purchased, including food bought outside their own farms. Finally, it improves the chances of resolving local food shortages—as refl ected in high prices. Good transport allows food to be moved quickly to defi cit areas where prices are higher, eliminating otherwise possible severe shortages.
Adequate agricultural infrastructure is essential for improving food security. Better rural roads, irrigation, electricity grids, marketing, rail transport, and information systems are all part of the infrastructure required. Public investment in infrastructure helps reduce agricultural production and transportation costs, improve marketing capacity, and enhance access to knowledge of new technologies. This simultaneously raises farm earnings.
Several studies have shown the signifi cant role rural infrastructure plays in improving agricultural productivity, especially in developing countries. Poor infrastructure or unreliable

Food Security in Asia and the Pacifi c
54
transport constrains productive capital investments and leads to a restriction or reduction of output (Llanto 2012). One study shows that defi ciencies in transportation, energy, telecommunications, and related infrastructure result in poorly functioning domestic markets that can undermine growth in agricultural output (Pinstrup-Andersen and Shimokawa 2007).
The lack of good infrastructure—particularly in transporting food—can increase the risk of chronic food insecurity among vulnerable groups. Inadequate infrastructure and the lack of intermodal transportation systems contribute to high transport costs, which are passed on to consumers. This is most severe on the rural poor or those living in remote areas. In addition, ineffi cient freight transport and bottlenecks delay delivery, increasing waste and reducing both the market and nutrition values of perishable food like fresh vegetables and dairy products.
Integrating different modes of transportation helps the effi ciency of national and regional transport networks for food distribution, contributing to food security. Work is being done on fi nding the least costly intermodal food transport systems to more sustainably link food producers with expanding megacities—for example, using rivers and small ports or quays, small refrigerated food vehicles, side railways that transport people during the day and refrigerated rail carriages at night, warehouses and warehouse receipt systems, franchises, and forward contracts, among others.
Regional infrastructure projects such as trans-ASEAN or other subregional Asian networks also help improve transport links. Specifi cally, regional initiatives should aim at stimulating investment to foster integrated transport networks covering all communities and employing all modes of transport.
International Trade
By allowing producers to sell internationally and consumers to buy from foreign markets, world trade plays an important role in alleviating food insecurity and in export development. Farmers from exporting countries can enjoy higher incomes—which translate to improved food access, a more nutritious diet, and better health. One study argues that trade can infl uence food security through several channels (Brooks, Ferrarini, and Go, forthcoming):
(i) International trade helps expand markets. It can help address short-term food insecurity in critical times of domestic droughts, fl oods, disease, or other disruptions to domestic production. In addition to income from export sales of surplus, farmers benefi t from access to a greater variety of—or lower-priced—inputs such as seed, fertilizer, pesticides, and machinery. Trade also expands the range of options for exchanging nonfood products for food, and commodities with different nutritional characteristics from each other.
(ii) Trade can enhance food security through price impact and market reaction. A price differential between markets that is greater than trade and transaction costs signals traders to move products from the lower price market to the higher price market. The extent to which trade can infl uence food security in this process is closely related to how well markets are integrated. Trade in food or agricultural commodities
Transportation, Logistics, and International Trade
55
can serve to reduce price volatility, increasing predictability for planning by both producers and consumers.
(iii) Positive productivity effects can follow from trade, raising agricultural output and food security. It can also encourage crop diversifi cation. Closed markets may discourage fi rms from adopting productivity-enhancing technology, because without an outlet for excess production, increased production would only depress prices in local markets (Barrett 2008). Price signals refl ecting full economic costs and benefi ts can also encourage diversifi cation. Farm price support—by making the production of staples artifi cially more profi table relative to other crops—has prevented farmers from diversifying into higher-value products, which in the longer run would sustain higher incomes.
(iv) Trade infl uences competition, which can increase food security by reducing rent-seeking opportunities and monopolistic practices, reinforcing the aims of competition policy (Brooks and Evenett 2005). As farmers integrate into higher-value agricultural processing chains, competition can help avert monopsonistic procurement practices by those higher up the chain, preserving higher value for poor farmers.
(v) Trade can indirectly infl uence food security through its impact on the effectiveness of macroeconomic tools. In developing countries, food typically accounts for a signifi cant share of the CPI, so food imports can lower infl ationary expectations, leaving more monetary space. Trade also aids government revenue through tariffs. And when free trade agreements are signed, the depth of integration between markets covered by the agreements can promote trade creation.
(vi) Food imports allow for lower, more sustainable production in environmentally fragile areas. Trade can thus help reduce irreversible environmental degradation in times of short-term stress—thereby promoting longer-term sustainable production.
However, the impact of trade on food security is not always unambiguous. For Asia and the Pacifi c, rice price volatility and its increase since 2007 are especially worrying. Using panel data for 2001 to 2011, one study offered evidence that international food price volatility is transmitted to Asia’s domestic markets, though with a lag (Lee and Park, forthcoming). Earlier studies (such as Headey and Fan 2008) used data prior to the international food price crises of 2007–2008, and concluded otherwise. The global transmission of food price volatility has apparently become stronger.
International markets can create instability in affordable access to food, provoking policy responses that can heighten international price volatility. For example, during the food price surge in 2007–2008, when global prices tripled, both exporting and importing countries attempted to shield domestic consumers from high global prices. Some exporters restricted shipments, while some importers reduced tariffs and increased government purchases. Although the aim in both cases was to stabilize domestic prices, the effects were at least partly offsetting (Martin and Anderson 2012). Both sets of policies reduced domestic prices relative to international prices, but they had reinforcing effects on the international price itself—raising it well above the level it would have reached otherwise.

Food Security in Asia and the Pacifi c
56
Thus, on one hand, food imports substitute or complement domestic production; on the other, they make a country more vulnerable to international trade disruptions and coordination failure. Moreover, if a commodity is thinly traded—such as rice, also a staple crop for most Asian countries—a small change in one country’s net export position can have a huge impact on international prices. The thinness of the international rice market means the tiny amount of international trade—4%–5% of global production during the 2000s—exacerbates price volatility and limits the ability of trade to buffer the effects of periodic supply disruptions (Gilbert 2011). Others argue that it is not thinness that causes global price volatility, but the opposite: price volatility inhibits rice trade (Clarete, Adriano, and Esteban, forthcoming).
A study of bilateral food trade (Brooks, Ferrarini, and Go, forthcoming) analyzed the vulnerability of food-importing countries to supply distortions by focusing on bilateral trading relationships (Box 5). It captured how much a country’s imports of a given commodity are dependent on supply from a particular country or region using a bilateral import penetration index (BIPI), an indicator of food security vulnerability arising from an undiversifi ed import base. The study also developed trade maps for four major staples, showing bilateral trade dependence—and revealing that several countries are central players in all of them. The trade maps show that supply disruptions in these key countries can trigger global food price hikes, and show which importing countries are most likely to be immediately affected. For example, the US is a central player in each of the four staples; thus, any event—such as the 2012 drought in the US—can have implications for food security in countries most dependent on US supply. Similarly, Kazakhstan and the Russian Federation are key suppliers for Central Asia and other former Soviet republics. A high degree of reliance on wheat imports from these two major suppliers leads to a high degree of vulnerability in the event of major supply shocks, such as the droughts in 2010 and 2012.
Box 5: Food Trade Maps
To analyze the main aspects of vulnerability to a country’s bilateral and multilateral dependence on international food imports, one study computed a bilateral import penetration index
(BIPI)a to gauge how much any one country depends on another for food imports (Brooks, Ferrarini, and Go, forthcoming).
Food trade maps based on the set of computed BIPI values across country pairs and years highlight the strength of bilateral trade ties and the food security vulnerability of individual importing countries to disruptions in those bilateral trade fl ows.
The fi rst is the network map for rice (Figure B5.1). The nodes (or circles) represent food-trading countries, whether net importers or exporters. The shade of the nodes represents the degree of the country’s dependence on food imports: the darker the shade, the more dependent the country. The size of the node represents market clout or centrality in commodity trade, while the location on the map represents the country’s connectedness (so major exporters become hubs). The arrows show the direction of trade from net exporters to net importers, while the thickness of the arrow represents how dependent an importing country is on a specifi c exporting country (the thicker the line, the more dependent).
As can be seen, major rice exporters such as the People’s Republic of China (PRC), India, Pakistan, Thailand, and Viet Nam are important hubs in Asia’s rice trade. On the other side,
continued on next page

Transportation, Logistics, and International Trade
57
continued on next page
Box 5 continued
Belgium, Mongolia, and Saudi Arabia are in black nodes, implying strong dependence on rice imports—which makes them vulnerable to potential disruptions to global supply. Different sets of countries cluster around the major rice exporters; for example, Egypt is a hub for Eastern Europe and the Middle East, while Italy services Europe. Also worth noting is the dependence of some importing countries to an exporter: a case in point is Mongolia, which is highly dependent on imports from the PRC, as represented by the thick arrow. This puts Mongolia at greater risk from potential supply disruptions emanating from the PRC. Vulnerabilities can also be passed on. The map’s depiction of the network surrounding South Africa is instructive. South Africa’s high dependence on India and Thailand for rice imports is passed on as vulnerabilities to Botswana, Namibia, and Swaziland. An interesting fi nding is that most Asian countries, with the exception of Brunei Darussalam and Mongolia, are only weakly dependent on imports for the bulk of their domestic consumption. Big rice importers in the region, such as Bangladesh, Indonesia,
Figure B5.1: Rice Trade Map
Note: Please refer to Appendix B for a list of three-character economy codes.
Source: See box source.

Food Security in Asia and the Pacifi c
58
Malaysia, and the Philippines, do not even show up on the map. This is because they are also large rice producers and import only a small fraction of their total domestic consumption. For the PRC, which is also a large rice importer, no incoming arrows are shown on the map because of its reliance on a large number of smaller suppliers.
The trade map for wheat (Figure B5.2) shows that global trade is centered on a few countries—Australia, Canada, France, Kazakhstan, the Russian Federation, and the United States (US). Australia, Canada, and the US are particularly important suppliers for a number of Asian countries, while Kazakhstan and the Russian Federation are key suppliers for Central Asia and other former Soviet republics. The wheat map shows that many Asian countries, such as Indonesia, Japan, the Republic of Korea, Malaysia, the Philippines, and Viet Nam, are highly dependent on imports for domestic consumption. However, the many lines connecting these countries to major suppliers indicate a relatively broad import base involving more suppliers, so risks to wheat supply shocks are relatively mitigated in Asia.
Soybeans form an important part of the diet in East Asia, and a signifi cant portion of domestic consumption is supplied through imports, particularly in Japan and the Republic of Korea. Although not shown here, the trade map illustrates how the PRC holds a central role in the
continued on next page
Figure B5.2: Wheat Trade Map
Note: Please refer to Appendix B for a list of three-character economy codes.
Source: See box source.

Transportation, Logistics, and International Trade
59
Box 5 continued
soybean network as an important supplier as well as importer. Argentina, Brazil, and the US are the main soybean suppliers in global markets.
From a nutritional perspective—abstracting away from food preferences, like that for rice in Southeast Asia—food security relates to the physical and economic availability of food to ensure a suffi cient caloric intake (it is, however, recognized that in the long run, a balanced diet delivering suffi cient amounts of macro- and micronutrients is essential for true food security). The global trade in nutrition can be calculated using data that aggregate calories from rice, wheat, maize, and soybeans, converting kilograms (kg) to calories based on the Food and Agriculture Organization of the United Nations (FAO) Food Balance Sheets (Figure B5.3). The US is a critical supplier of calories from staples for a large number of countries scattered across the globe, as shown by its centrality in the network map. The large number of countries highly dependent on the US—as represented by the size of its node—indicates its importance in world staple trade with signifi cant infl uence over the entire network. The map also shows that, in general, countries in Asia dependent on imports for their staples are not very vulnerable to supply disruptions from single country sources—as Asia is home to important global suppliers of calories, such as India, Pakistan, Thailand, and Viet Nam. There are two exceptions, however. One is Brunei Darussalam, which in the caloric network map seems vulnerable due to its high dependence on
continued on next page
Figure B5.3: Caloric Trade Map
Note: Please refer to Appendix B for a list of three-character economy codes.
Source: See box source.

Food Security in Asia and the Pacifi c
60
Box 5 continued
imports and its high bilateral dependence on Thailand for its caloric consumption. Malaysia also stands out as a black node highly dependent on three big food-exporting countries: Thailand for rice and maize; the US for wheat, maize, and soybeans; and Viet Nam for rice. Imports from these three countries account for over 30% of domestic caloric intake for staples in Malaysia. Despite this, Malaysia’s supply risks are mitigated as the other two big suppliers could step in should supply from the third country be disrupted.
a The analysis uses a matrix of world trade in rice, wheat, maize, and soybeans—the four major staples central to
food security. The data on quantities traded (in kilogram [kg]) are derived from the United Nations Commodity
Trade Statistics Database (UN Comtrade) database for 2006–2008. In relation to any particular food item f,
say rice, and period t, BIPI is the share of rice imports of country i from country j out of the total supply of rice
in country i (net of stock adjustments). The stronger country i’s reliance on imports from country j to meet its
domestic demand for rice—which is assumed equal to fi nal domestic supply—the higher the BIPI. Specifi cally,
BIPI is defi ned as:
where Mij refers to imports of country i from country j. Xij refers to exports of country i to country j, and Pi refers
to domestic production in country i (all variables are in quantities).
The expression after the second equal sign indicates that bilateral import penetration may be thought of as
the product of the share of country j in country i’s total imports and its overall reliance on imports to satisfy
domestic demand. The latter may be termed the total import penetration index (TIPI):
Source: Brooks, D., B. Ferrarini, and E. Go. Forthcoming. Bilateral Trade and Food Security in Asia. ADB
Economics Working Paper. Manila: ADB.
� � � ��
�
���
�
��
���
��� n
jiijij
n
jij
n
jij
ijn
jiijij
ijij
PMX
M
M
M
PMX
MBIPI
1
1
11
(1)
(2)� ��
�
�
�
��� n
jiijij
n
jij
ij
PMX
MTIPI
1
1
Developing Asia has undergone a dramatic structural transformation over the last 2 decades, leading to rising incomes, urbanization, and change in food habits. Diets are becoming more grain- and protein meal-intensive through greater demand for livestock. Clear trends emerge when looking at agricultural trade in the region. As incomes rise, countries report signifi cant increases in imports of meat as well as feed grains to meet the needs of the growing domestic livestock sector. The PRC has already switched from being a net exporter to a major importer of maize and soybeans (Brooks, Ferrarini, and Go, forthcoming). Because the PRC is the world’s largest food consumer, a small shift in its net export position could be enough to move global markets, impacting the global food system. The rise of the middle class in developing Asia and the changing dietary composition will require vast areas of farmland to produce grains necessary to raise cattle and other livestock (Jha, Roland-Holst, and Sriboonchitta 2010). This will require expanding agricultural capacity elsewhere, thus leading to greater net food imports for Asian countries.

61
VI. Climate Change and Food Security
With more than 60% of the population relying on agriculture and food production as a source of income, the Asia and Pacifi c region is particularly sensitive to the potential damage caused by climate change. Agriculture, fi sheries, and livestock
will all suffer direct impact, which can lower productivity and food output. Thus, the need to address the effects of climate change on food security is urgent—one requiring an immediate and appropriate response.
The Fourth Assessment Report (AR4) by the Intergovernmental Panel on Climate Change (IPCC) describes how intensifying greenhouse gas (GHG) emissions have affected all continents and most oceans. The evidence shows that many natural systems are being disrupted by regional climate change, particularly increases in temperature (IPCC 2007a).
Although the scientifi c community has agreed that global warming must be kept at less than 2 degrees Celsius (ºC) above preindustrial levels to avoid dangerous climate change effects, current and pledged commitments are not nearly enough. A World Bank report, Turn Down the Heat: Why a 4ºC Warmer World Must be Avoided, warns that a 4ºC warming of the global mean temperature could occur as early as the 2060s (World Bank 2012).
Evidence of climate change is seen in rising carbon dioxide (CO2) concentrations, rising global mean temperatures, changing precipitation patterns, and rising sea levels.
Rising CO2 Concentrations: CO2 emissions have long been on the rise, particularly since the 1950s. From an annual rate of less than 26 billion ton/year in 1990, they are projected to rise to 41 billion ton/year by 2020 (World Bank 2012). Total GHG emissions would reach 56 billion tons of CO2 equivalent (GtCO2e) in a “business as usual” scenario. If current pledges to reduce emissions are fully implemented, projected emissions in 2020 would range from 53 to 55 GtCO2e—still too high.
Rising Global Mean Temperature: Scientifi c research shows that humans are the “unequivocal” cause of rising global mean temperatures and climate system warming (World Bank 2012). Thus far, global mean temperatures have increased by roughly 0.8°C compared with preindustrial levels. Recent research shows that increases since the mid-20th century were caused by increased GHG concentrations stemming from anthropogenic activities (IPCC 2007b). One study, for instance, illustrated just how human activity infl uences short-term temperature variations by removing nonhuman factors such as solar variability, volcanic aerosol effects, and the El Niño–Southern oscillation events (Foster and Rahmstorf 2011).
Change in Precipitation Patterns: Current climate models project that precipitation in tropical precipitation maxima (such as monsoons) and high latitude regions will rise, especially over the tropical Pacifi c. However, precipitation will decrease in subtropical regions as a consequence of a generally intensifying global hydrological cycle. Global mean water vapor and evaporation are also expected to increase

Food Security in Asia and the Pacifi c
62
(IPCC 2007a). In the absence of additional aerosol particle effects (from volcanic eruptions, for example), GHG emissions are expected to heighten the water cycle, making dry areas drier and wet areas wetter (Chen et al. 2011). Based on results from the latest 13 climate models of the World Climate Research Programme’s Coupled Model Intercomparison Project Phase 5, total precipitation on wet days is projected to increase by about 10%. Extreme precipitation events are also expected to increase by 20% under the representative concentration pathway 8.5 (4+°C) emission scenario (Sillmann et al. 2013). This adds the substantial additional risk of fl ooding.
Sea-Level Rise: With more accurate methods of monitoring the rise in sea levels—such as tidal gauges and satellite observations—the IPCC has confi rmed that sea levels have risen more than 20 centimeters (cm) from preindustrial times to 2009 (Church and White 2011). The average rate during the 20th century was 1.7 millimeters per year (mm/year) (or 1.7 centimeters per decade [cm/decade]), accelerating 3.2 mm/year (3.2 cm/decade) since the 1990s (Meyssignac and Cazenave 2012). There remain uncertainties as to the share of contributing factors, as the sum of individually measured components is less than the total observed sea-level rise (IPCC 2007a). The rate of observed sea-level increases varies by region, due to causes such as each ocean’s distinctive heating, ocean dynamics such as winds and currents, sources and geographical location of changes to the cryosphere (snow cover and solid precipitation, sea ice, lake and river ice, glaciers, ice caps, ice sheets, permafrost and seasonally frozen ground), and subsidence or uplifting of continental margins (World Bank 2012).
The Impact of Climate Change on Food Security
Climate change will affect all three dimensions of food security—availability, accessibility, and utilization. The changing climate affects food production directly, through changes in agroecological conditions, and indirectly, by altering income growth and its distribution, thus shifting the demand for agricultural produce. There will likely be changes in land suitability, potential yields (for example, CO2 as fertilization), and production of current cultivars. Shifts in land suitability will likely lead to an increase in suitable cropland in higher latitudes and a decline of potential cropland in lower latitudes. Weather is expected to become more variable and volatile, with more frequent and severe extreme events. Fluctuating crop yields and local food supply will make achieving food security more diffi cult. Semi-arid and subhumid regions will be affected most, reducing crop yields, livestock, and productivity. As these areas are mostly in Sub-Saharan Africa and South Asia, the world’s poorest regions with the highest levels of chronic undernourishment will be exposed to the highest degree of instability.
Changes in global food production systems will impact food prices. Potential price increases and negative income effects associated with climate change may have implications for food accessibility. It could also start a vicious cycle where infectious diseases—including water-borne diseases—cause or compound hunger, leaving the affected population even more susceptible to the same or other diseases. This will reduce labor productivity and increase poverty, morbidity, and mortality.

Climate Change and Food Security
63
Recent studies offer estimates for the impact of climate change on hunger in different pathways of global development (World Food Programme [WFP] 2009). The risk of hunger can be measured based on the number of people whose incomes allow them to purchase suffi cient quantities of cereals (Parry et al. 2004). This naturally depends on the price of cereals and the number of people at given levels of income. Using different modeling approaches, various studies (Fischer, Shah, and Velthuizen 2002; Parry et al. 2004) estimate the potential impacts of climate change for various scenarios under the IPCC Special Report on Emissions Scenarios (SRES). The SRES set up different pathways of socioeconomic development in terms of population and income level, which would affect climate change and the agricultural response at the regional and global levels.12 The studies suggest that a pathway of continuing high population growth and regional disparities of income (A2 under the SRES scenarios) results in large numbers of people at risk of hunger (Figure 6.1). Assuming no CO2 effects, the number at risk of hunger would be very high in 2080 under the A2 scenario (as compared to the reference case scenario)—partly because of higher temperatures and reduced yields, but mainly because there are many more poor people under the A2 scenario, which assumes the global population reaches 15 billion (compared with 7 billion in A1). The number of people at risk is much lower in the B1 and B2 scenarios, with lower numbers of poor.
Regional Impact of Climate Change on Food Security
The effects of climate change are highly heterogeneous—with some regions gaining, even if the overall effect is negative. In South Asia, for example, climate change will likely bring a substantial reduction in aggregate crop production by the end of the century. The effect will be larger on wheat than on rice yields; although, on average, rice yields are also projected to decline. Upstream glacial runoff will increase, but mostly during monsoons rather than during the dry season, when water is needed most. Flood risk will also increase.
12 The IPCC (2000) developed four scenarios to explore the uncertainties behind potential trends in global developments and GHG emissions. The scenarios come from different states of the world in two different dimensions: global or regional development, and economic or environmental concerns. The four scenarios, also referred to as storylines, are as follows:
(i) The A1 storyline and scenario family describes a future world of very rapid economic growth, global population that peaks in mid-century and declines thereafter, and the rapid introduction of new and more effi cient technologies. Major underlying themes are convergence among regions, capacity building, and increased cultural and social interactions, with a substantial reduction in regional differences in per capita income.
(ii) The A2 storyline and scenario family describes a very heterogeneous world. The underlying theme is self-reliance and preservation of local identities. Fertility patterns across regions converge very slowly, which results in continuously increasing global population. Economic development is primarily regionally oriented, and per capita economic growth and technological changes are more fragmented and slower than in other storylines.
(iii) The B1 storyline and scenario family describes a convergent world with the same global population that peaks in mid-century and declines thereafter, as in the A1 storyline, but with rapid changes in economic structures toward a service and information economy, with reductions in material intensity, and the introduction of clean and resource-effi cient technologies. The emphasis is on global solutions to economic, social, and environmental sustainability, including improved equity, but without additional climate initiatives.
(iv) The B2 storyline and scenario family describes a world in which the emphasis is on local solutions to economic, social, and environmental sustainability. It is a world with continuously increasing global population at a rate lower than A2, intermediate levels of economic development, and less rapid and more diverse technological change than in the B1 and A1 storylines. While the scenario is also oriented toward environmental protection and social equity, it focuses on local and regional levels.

Food Security in Asia and the Pacifi c
64
Figure 6.1: Population at Risk of Hunger Under Different Climate Change Scenarios
(millions)
cc = climate change, CO2 = carbon dioxide.
Note: The fi gure shows the number of people at risk of hunger (in millions) in three scenarios: no climate change
(no cc), climate change with the benefi ts of carbon dioxide fertilization (cc, with CO2), and climate change without
the benefi ts of carbon dioxide fertilization (cc, no CO2). See footnote 12 for an explanation of scenarios A1, A2,
B1, and B2.
Source: Easterling, W. and P. Aggarwal. 2007. Food, Fibre and Forest Products. In M. L. Parry, O. F. Canzianai,
J. P. Palutikof, P. J. van der Linden, and C. E. Hanson, eds. Climate Change 2007: Impacts, Adaptation and
Vulnerability. Contribution of Working Group II to the Fourth Assessment Report of the Intergovernmental Panel
on Climate Change, pp. 273–313. Cambridge, UK: CUP. Cited in World Food Programme (WFP). 2009. Climate
Change and Hunger: Responding to the Challenge. Rome: WFP. http://documents.wfp.org/stellent/groups/
public/documents/newsroom/wfp212536.pdf
Pop
ula
tion
1,400
1,200
1,000
800
600
400
200
0A1 A2 B1 B2 A1 A2 B1 B2 A1 A2 B1 B2
2020 2050 2080
Scenarios
no cc (reference case) cc, with CO2 cc, no CO2
In general, the climate will likely become more volatile and less predictable. Superimposed on the increasing demand for land for nonagricultural purposes and the effects of land degradation, the effects of climate change are indeed worrying.
Biophysical crop modeling studies provide quantitative estimates of yield effects for the expected climate change by 2050, compared with a no-climate change scenario (Rosegrant 2013). Climate change could reduce yields for irrigated rice by 14%–20%; for irrigated wheat, 32%–44%; for irrigated maize, 2%–4%; and for irrigated soybeans, 9%–18%. The spread in expected yield effects is wider for rainfed crops, with the possibility of some positive effects, especially in more temperate zones. In Pacifi c island countries, signifi cant yield reductions are expected in traditional staple crops, including sweet potato, taro, and cassava.
Combining these results with economic modeling, food prices of cereals and soybeans are projected to rise from 20% to 70% by 2050 (Rosegrant 2013). Rice and wheat prices will also increase substantially (Figure 6.2). Even without climate change (the middle bar in Figure 6.2), prices of these staples will rise—by 35% for rice and 45% for wheat. The main cause is increased pressure on agricultural resources stemming from nonagricultural demand for land and labor. Climate change adds substantial stress—an additional 20% increase in the real price of rice and 23% for wheat.

Climate Change and Food Security
65
Compared with the no-climate change scenario, these price increases imply reduced caloric intake (Figure 6.3). In South Asia, caloric intake will drop 10% in the no-climate change scenario. In East Asia and the Pacifi c, it will drop 7%. Childhood malnutrition—directly linked to caloric intake—will also be affected. Without climate change, the number of malnourished children in South Asia would decline from 75.6 million in 2000 to 52.4 million in 2050. In East Asia and the Pacifi c, childhood malnutrition is projected to fall from 23.8 million to 12.0 million. But climate change will negate many of these gains. In fact, the projections show climate change will increase the number of malnourished children by 2.0 million in South Asia, and 2.8 million in East Asia and the Pacifi c relative to the no-climate change scenario (Figure 6.4).
Climate change is a problem particularly for Pacifi c island countries (Box 6). However, appropriate policies and adaptation measures can help mitigate adverse impacts on food security and protect vulnerable groups. For example, virtually all the climate change-related increase in childhood malnutrition in Pacifi c island countries could be eliminated through a policy package including (i) an increase in research and extension spending (reaching 2% of agricultural GDP), (ii) optimization of crop varieties to climate change, (iii) increasing the use of nitrogenous fertilizers from 30 to 50 kilograms per hectare (kg/ha), and (iv) applying public incentives to increase fi sh and livestock production (Rosegrant 2013).
Another big threat is the loss of cropland due to rising sea levels. Using detailed elevation data from the International Food Policy Research Institute (IFPRI) Spatial Allocation Model (ISPAM), the potential impact of rising sea levels on crop production in key Asia and the Pacifi c countries was estimated (ADB 2009a). An increase of 1 meter and 3 meters in sea levels was used for the calculations for countries with coastal areas included in the ISPAM.
Figure 6.2: Projected Real Price of Rice and Wheat, 2010–2050 (2010 = 100)
cc = climate change.
Source: Rosegrant, M. 2013. Climate Change and Agriculture in the Asia-Pacifi c Region: Impacts and Policy
Responses. Paper presented at the Australian Agricultural and Resource Economics Society Annual Conference
on Economics, Agriculture, and Natural Resources in the Asian Century. Sydney. 5–8 February.
100 100
135145
155168
0
20
40
60
80
100
120
140
160
180
Rice Wheat
Rea
l p
rice
Commodity
2010 2050 no cc 2050 cc

Food Security in Asia and the Pacifi c
66
Figure 6.3: Projected Levels of Caloric Consumption (kCal/capita/day)
cc = climate change, kCal = kilocalorie, LAC = Latin America and the Caribbean, MENA = Middle East and North
Africa, SSA = Sub-Saharan Africa.
Note: Regional groupings are as defi ned by Rosegrant (2013).
Source: Rosegrant, M. 2013. Climate Change and Agriculture in the Asia-Pacifi c Region: Impacts and Policy
Responses. Paper presented at the Australian Agricultural and Resource Economics Society Annual Conference
on Economics, Agriculture, and Natural Resources in the Asian Century. Sydney. 5–8 February.
2000 2050 no cc 2050 cc
2,38
1 2,87
0
2,87
9
2,84
6
2,28
2
2,46
4
2,97
9
2,86
2
3,11
2
2,57
0
2,34
0
2,85
9
2,85
0
2,90
5
2,27
7
0
500
1,000
1,500
2,000
2,500
3,000
3,500
South Asia East Asia and the Pacific
LAC MENA SSA
Region
Per
ca
pit
a c
on
su
mp
tion
Figure 6.4: Projected Levels of Child Malnutrition (millions)
cc = climate change, LAC = Latin America and the Caribbean, MENA = Middle East and North Africa,
SSA = Sub-Saharan Africa.
Note: Regional groupings are as defi ned by Rosegrant (2013).
Source: Rosegrant, M. 2013. Climate Change and Agriculture in the Asia-Pacifi c Region: Impacts and Policy
Responses. Paper presented at the Australian Agricultural and Resource Economics Society Annual Conference
on Economics, Agriculture, and Natural Resources in the Asian Century. Sydney. 5–8 February.
0
10
20
30
40
50
60
70
80
South Asia East Asia andthe Pacific
LAC MENA SSA
Region
Ch
ild
ma
lnu
trit
ion
2000 2050 no cc 2050 cc

Climate Change and Food Security
67
Box 6: Food Security and Climate Change—The Special Case of the Pacifi c
Projected yield reductions in major staple crops resulting from climate change in the Pacifi c are substantial (Table B6.1). In particular, the very large effects on cassava yields are serious,
considering that cassava is a staple of the poor.
These yield effects will, in turn, reduce caloric consumption within the Pacifi c island countries (Figure B6.1). The impact on Papua New Guinea and the Solomon Islands is especially large. And reductions in caloric intake increase the number of people at risk of hunger (Table B6.2) and the number of children at risk of malnutrition (Table B6.3), both of which are especially worrying for Papua New Guinea.
Table B6.1: Projected Impact of Climate Change on Crop Yields(% reduction by 2050)
Crop Fiji PNG Solomon Islands
Sugarcane 8 n.a. n.a.
Rice 4 8 15
Taro 15 13 16
Cassava 37 30 28
Sweet potato n.a. 11 15
n.a. = not applicable, PNG = Papua New Guinea.
Source: See box source.
continued on next page
cc = climate change, kCal = kilocalorie, PNG = Papua New Guinea.
Source: See box source.
Figure B6.1: Projected Levels of Caloric Consumption in Pacifi c Island Countries
(kCal/capita/day)
2000 2050 no cc 2050 cc
Country
0
500
1,000
1,500
2,000
2,500
3,000
3,500
4,000
Fiji
2,854
3,437 3,205
2,498
3,012
2,304 2,343
2,9432,558
PNG Solomon Islands
Ca
lori
c c
on
su
mp
tion
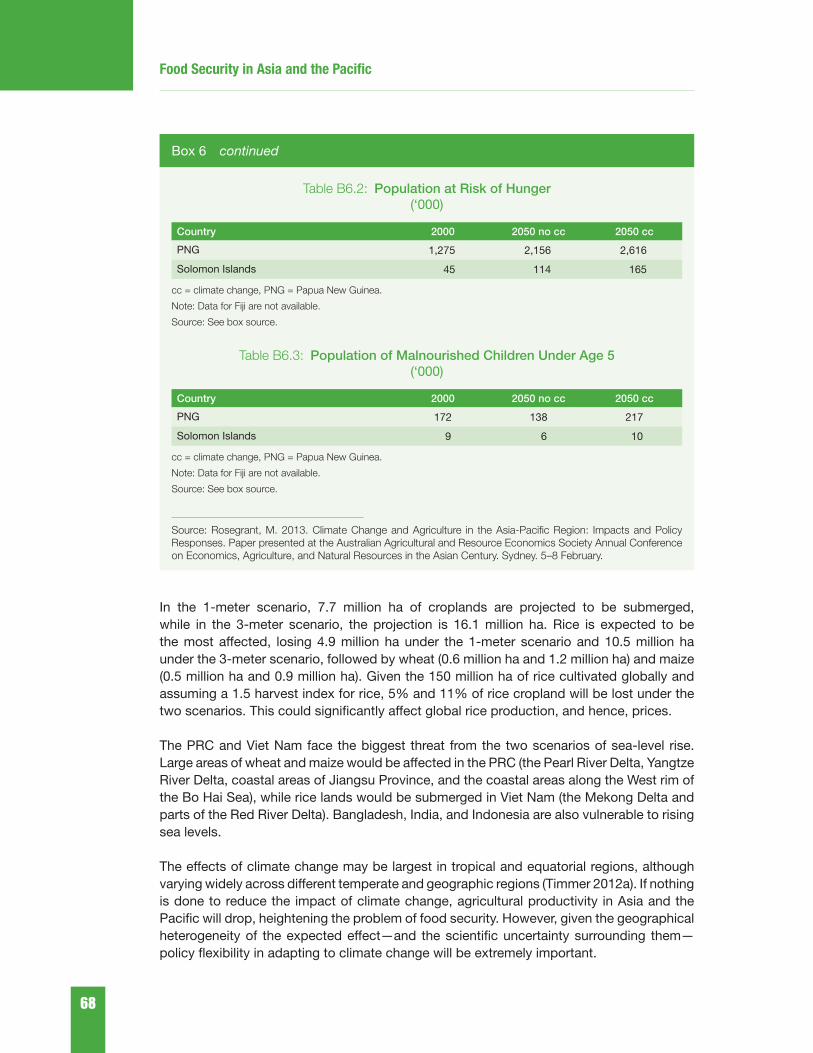
Food Security in Asia and the Pacifi c
68
In the 1-meter scenario, 7.7 million ha of croplands are projected to be submerged, while in the 3-meter scenario, the projection is 16.1 million ha. Rice is expected to be the most affected, losing 4.9 million ha under the 1-meter scenario and 10.5 million ha under the 3-meter scenario, followed by wheat (0.6 million ha and 1.2 million ha) and maize (0.5 million ha and 0.9 million ha). Given the 150 million ha of rice cultivated globally and assuming a 1.5 harvest index for rice, 5% and 11% of rice cropland will be lost under the two scenarios. This could signifi cantly affect global rice production, and hence, prices.
The PRC and Viet Nam face the biggest threat from the two scenarios of sea-level rise. Large areas of wheat and maize would be affected in the PRC (the Pearl River Delta, Yangtze River Delta, coastal areas of Jiangsu Province, and the coastal areas along the West rim of the Bo Hai Sea), while rice lands would be submerged in Viet Nam (the Mekong Delta and parts of the Red River Delta). Bangladesh, India, and Indonesia are also vulnerable to rising sea levels.
The effects of climate change may be largest in tropical and equatorial regions, although varying widely across different temperate and geographic regions (Timmer 2012a). If nothing is done to reduce the impact of climate change, agricultural productivity in Asia and the Pacifi c will drop, heightening the problem of food security. However, given the geographical heterogeneity of the expected effect—and the scientifi c uncertainty surrounding them—policy fl exibility in adapting to climate change will be extremely important.
Box 6 continued
Table B6.2: Population at Risk of Hunger(‘000)
Country 2000 2050 no cc 2050 cc
PNG 1,275 2,156 2,616
Solomon Islands 45 114 165
cc = climate change, PNG = Papua New Guinea.
Note: Data for Fiji are not available.
Source: See box source.
Table B6.3: Population of Malnourished Children Under Age 5(‘000)
Country 2000 2050 no cc 2050 cc
PNG 172 138 217
Solomon Islands 9 6 10
cc = climate change, PNG = Papua New Guinea.
Note: Data for Fiji are not available.
Source: See box source.
Source: Rosegrant, M. 2013. Climate Change and Agriculture in the Asia-Pacifi c Region: Impacts and Policy
Responses. Paper presented at the Australian Agricultural and Resource Economics Society Annual Conference
on Economics, Agriculture, and Natural Resources in the Asian Century. Sydney. 5–8 February.

Climate Change and Food Security
69
Proactive adaptation policies and investments may include developing more drought- and heat-resistant crop varieties, using moisture-conserving tillage methods, and improving irrigation effi ciency. Genetic variability could be a relatively easy way for adapting crop varieties to climate change (Iglesias, Erda, and Rosenzweig 1996). Agricultural management also needs to undergo an overhaul—for example, windbreaks to reduce evaporation are a small but effective investment. The most pragmatic adaptive management response will be to change planting dates. Estimates show that small changes—of up to 4 weeks—would be viable for most of Asia (Iglesias, Erda, and Rosenzweig 1996). However, countries such as the PRC and the Philippines may require untenably large shifts in seasonal agricultural activity. The simple truth is that no common or general adaptive measures can be taken without thoroughly assessing local conditions.
Increasing or adjusting irrigation requirements is another effective proactive adaptation measure. Changes in temperature and precipitation, and increased evapotranspiration may require a signifi cant increase in irrigation for most countries and regions. However, having suffi cient water resources is prerequisite, with water itself a central management issue for climate change. Investments and countermeasures to reduce soil and water pollution are limited in most developing countries. In the PRC, for example, the estimated maximum area for irrigated farmland has already been reached, meaning intensifying irrigation will likely be restricted in the future. Nonetheless, there remains much potential for improving the effi ciency of existing irrigation systems (Erda 1996).
Several adaptations could help cope with these daunting challenges (Aggarwal et al. 2012). Suggested ways to adapt to climate change include (i) better land and water resource management; (ii) improved risk assessment and management, refl ecting the increased risk from both fl oods and periodic drought; (iii) adaptations that provide benefi ts from reduced GHG emissions; and (iv) improved governance, including regional cooperation. These will require new technologies, reclamation of degraded agricultural land, and community management of soil and water resources. What is clear is that doing nothing is not an option. Investment in the knowledge base required for these location-specifi c adaptations must start now.

70
VII. Policy Framework for Food Security
Food security is a complex, multidimensional issue. It is clear that economic growth alone will be unable to resolve the issues of food insecurity in Asia and the Pacifi c. While rapid economic growth has helped reduce poverty, undernourishment and
hunger persist. The global food crisis of 2007–2008—which prevented millions from breaking out of poverty—also underscored how vulnerable national and international food systems are to food and nutrition insecurity.
Global food prices remain signifi cantly higher than pre-crisis levels and will continue to pose a serious global challenge. In response to the crisis, international institutions have taken several initiatives. The UN established a High-Level Task Force on the Global Food Security Crisis in April 2008 to better coordinate international actions to combat hunger and resolve the food crisis. At the FAO World Summit on Food Security in Rome in November 2009, world leaders agreed to urgently work toward eradicating hunger and increasing investment in agriculture. The Committee on World Food Security (CFS)—established in 1974 as a UN forum to review and follow up policies on world food security—is drawing up a Global Strategic Framework for Food Security and Nutrition to guide and recommend coherent actions for countries, regions, and the world. These stress that building food security requires the active participation and commitment of all governments, international agencies, and private stakeholders to forge fundamental and structural change in national and international food systems.
There remains an urgent need to develop an overarching yet multilayered policy framework covering an array of strategic actions to address immediate, short-term concerns as well as to prepare for medium- to long-term issues at all levels. The dramatic increase in global food prices grew out of a confl uence of long-term dynamics—including growing populations, rising incomes, and changing dietary patterns—especially driven by developing countries and more contemporary food supply and demand conditions, and aggravated at times by policy responses. Interventions often focus on providing immediate relief to households and improving agriculture-based food supply. However, the complex interactions of various factors in the global food system require a comprehensive and systemic policy framework that goes beyond emergency response.
Specifi c actions are needed now to address both short- and long-term issues. In the short run, policies should focus on mitigating the immediate impact of high food prices on vulnerable groups—ensuring access to adequate quality food through emergency food assistance and cash transfers, for example. In the long run, scaling up agricultural productivity and investment, promoting rural development, and continuing to tackle the root causes of poverty can promote economic resilience and help build sustainable food security. At the same time, policy makers need to key in on sustainable agricultural production and environmental protection. It is important to recognize the urgency of responding to long-term issues; delayed or inadequate actions today will increase vulnerability to long-term

Policy Framework for Food Security
71
food insecurity tomorrow. International food markets and governments must be prepared to respond to further supply and demand shocks as well as the effects of climate change, all of which are already behind today’s higher food prices and volatility.
Policy actions can be summarized in a food security policy matrix (Table 7). This refl ects a two-track approach—similar to the Comprehensive Framework for Action (CFA) adopted by the UN High-Level Task Force on the Global Food Security Crisis—which covers both short- and long-term issues. These policies must be coordinated and applied in a timely manner to successfully address food and nutrition insecurity and progressively improve the resilience of the global food system. Needless to say, these are not mutually exclusive and at times work in synergy—for example, regional cooperation on national agricultural research to develop new seeds or farming techniques. The policy framework also suggests the need for strengthening coordination among national policies and strategies by sharing timely and reliable data and information, and building global and regional monitoring or surveillance systems in response to a crisis.
Interventions to Meet Immediate Needs
Social Safety Nets
Safety nets and social protection programs can offer immediate relief to the poor during temporary bouts of food insecurity. However, the role of social protection for food security extends beyond providing essential assistance to mitigate the impact of short-term natural and economic shocks (Box 7.1). Properly designed and targeted, it can play a crucial role in breaking the vicious cycle of poverty and food insecurity, ensuring food security for all in the long run. A wide array of instruments can be employed to address the vulnerability of people’s livelihoods—from social insurance and social assistance, to labor market programs. Social protection programs can also help address market imperfections and failures. Market mechanisms promote competition and effi ciency that clearly boost economic productivity—but markets are impersonal and the results of competition can be harsh for those left behind. This may further aggravate social inequality and poverty, which can be passed on to succeeding generations through limited economic opportunities.
A holistic approach should be taken when designing social protection measures to address food insecurity—as part of broader human development and poverty reduction strategies. Access to food is a central focus. As seen during the 2007–2008 food crisis, governments often react to transitory food insecurity by providing blanket subsidies to keep food prices artifi cially low. However, these types of interventions drain budgets and cannot be viable if food price increases continue and are caused by supply and demand market fundamentals. One option is to build food-based safety nets and related social protection programs for vulnerable communities such as off-farm, landless workers and poor small-scale farm households. Better yet, these programs can be linked to productivity-enhancing measures that can sustainably improve farm incomes and nutrition as well as provide more jobs. Such measures include input trade fairs and farm-to-market road construction, while asset-creating measures include tenure rights and weather-based index insurance, for example.

Food Security in Asia and the Pacifi c
72
It is critically important to target these programs more effectively and exclusively at the poor—to maximize their impact given limited budgets. One study shows that nontargeted direct cash transfers and food aid have increased dependency and eroded local capacity to generate sustainable incomes (Gilligan et al. 2009).
Cash Transfers
The targeting failures of existing social protection systems raise the question of whether these programs could be replaced by something better. Cash transfer systems might replace in-kind programs altogether (Jha, Kotwal, and Ramaswami, forthcoming), although there may be initial political resistance as benefi ciaries from existing corruption and ineffi ciency can be expected to oppose change. Cash transfers can also encourage households to adopt benefi cial behavior—for example, they could be conditional on household participation in education, health, or nutrition services.
Table 7: Food Security Policy Matrix
Actions National Regional/Global
Interventions to Meet Immediate Needs
Provide emergency food assistance and enhance social safety nets
Offer programmed cash transfers
Target interventions at nutrition
Provide timely and reliable data and information
Coordinate crisis policy responses
Facilitate fl ows of emergency assistance
Reduce agricultural trade restrictions and market distortions
Actions to Improve Medium- to Long-Term Resilience
Promote agriculture and rural development
� Improve rural roads and infrastructure
� Improve farm access to inputs
� Enhance farm productivity through
– Agricultural research
– Extension services
– Postharvest measures
Invest in human development: education and health
Strengthen nutrition education and awareness
Consider building an emergency fund for disaster relief
Introduce insurance and disaster mitigation measures, such as crop insurance and futures contracts
Establish national and regional food reserves and crisis management systems
Promote research and development, knowledge exchange, and capacity building
Improve monitoring and surveillance of food market conditions
Promote food trade liberalization
Consider mechanisms to promote price stability, such as regional and international food reserves
Enhance collaboration on climate change and accelerate adaptation measures
Source: Authors.

Policy Framework for Food Security
73
Box 7.1: The Role of Social Protection and Safety Nets in Reducing Hunger and Malnutrition
Hunger and malnutrition are key issues that cut across poverty alleviation interventions. Economic access to food remains one of the most serious food security issues, whereas
food insecurity is often a source of instability in households, communities, and nations, impeding economic growth and development. As such, food insecurity and poverty are closely interrelated. However, economic growth alone is insuffi cient to ensure food security. This is why the key to reducing hunger and malnutrition is a “twin track” approach, one that provides both immediate and long-term solutions. In other words, social protection programs form an essential part of any overall development and poverty reduction strategy, encompassing a wide range of policies that fall under social safety nets, insurance, and even labor market support.
From the array of social protection programs, social safety nets may have the most direct effect on the poor. They are geared toward helping the poor cope with risks, especially during times of shocks, such as price increases or calamities, among others. Without requiring any fi nancial contribution from benefi ciaries, safety nets take the form of instruments such as transfers and subsidies (Tables B7.1.1, B7.1.2), and are more often than not, targeted at specifi c segments of the population—the poor, children, or mothers, for example. While social protection should be available to all, resource constraints necessitate targeting to ensure program effi ciency and cost-effectiveness. More importantly, targeting runs parallel to the overarching goals of poverty reduction, especially if the targeting mechanisms are clear and executed properly. Transfers to benefi ciary households may be based on the minimum food basket cost that provides the required calories and nutrition to household members. This will help guarantee that limited resources are well spent—and cash transfers used to ensure the minimum dietary intake.
Table B7.1.1: Features of Transfers
Can be preventive (insurance) or palliative (response or assistance)Can be cash or in-kind (e.g., food or inputs to agriculture); in some cases bothCan be unconditional (no commitment from benefi ciary) or conditional (dependent upon school attendance, clinic visits, and so on)Can be given as payment for employment in public works or construction
Table B7.1.2: Features of Subsidies
Usually implemented by subsidizing the commodity for a lower market sale valueSubsidized commodity can either be a universally consumed good or one preferred by specifi c groupsSale of good can be universal (all can avail of the subsidized good) or targeted (only specifi c groups are able to avail through a mechanism such as vouchers or show of proof)
Sources:
Food and Agriculture Organization of the United Nations (FAO). 2003. Anti-Hunger Programme. A Twin-Track
Approach to Hunger Reduction: Priorities for National and International Action. Rome: FAO. ftp://ftp.fao.org/
docrep/fao/006/j0563e/j0563e00.pdf ______. 2012. The State of Food Insecurity in the World. Rome: FAO. http://www.fao.org/docrep/016/
i3027e/i3027e.pdf

Food Security in Asia and the Pacifi c
74
New technological developments may offer several options for addressing practical problems associated with distribution and targeting. The simplest systems use existing banking and postal systems to distribute cash to targeted groups. A problem arises when these facilities are not readily accessible. In Africa, the wide use of mobile phone systems has provided a solution. Any retail outlet can then be used as a distribution center for cash. Conditionality relating to school attendance and health center participation is possible within cash transfer systems, which have been well developed in Latin America. New systems of biometric identifi cation and smart cards can be used to reduce fraud. Better ways to identify eligible households might be combined with these systems. In India, evidence from the differential coverage of PDS, the main channel for ensuring food safety, and differences in poverty reduction across states shows that states with coverage beyond the offi cially mandated poverty lines have seen a greater reduction in poverty compared with those that retained the framework of targeted PDS (Himanshu, forthcoming).
Indonesia has already used cash transfers to compensate for economic shocks. In 2008, it reintroduced BLT—the world’s largest unconditional cash transfer system—to shield households against the impact of reductions in fuel subsidies. With the assistance of the World Bank, Indonesia was able to develop a transparent system that worked. This well-documented program could be adapted elsewhere.
Overall, it appears that new information technology can implement social safety net programs more effi ciently and with less corruption. It may be possible to altogether dispense with the need to redistribute food in kind, replacing it entirely with cash-based systems. Reducing corruption associated with social safety nets is crucial, not only for its direct fi scal implications, but also in changing attitudes.
Interventions Targeted at Nutrition
Poverty and limited access to food are major causes of inadequate food and nutrient intake. Tending to be more vulnerable to food price hikes and other shocks, the poor have to adjust their dietary choices to low-quality food that might translate to lower nutrition. This damage is particularly severe among pregnant women and young children.
Urgent actions are required to improve food and nutrition security among the poor and vulnerable. These include improving incomes, providing targeted social assistance and safety nets, and promoting dietary education. Special attention has to be paid to the health of mothers and children, given the elevated risk of both groups to malnutrition and undernourishment. First, improving smallholder production and productivity can have tremendous impact on food and nutrition security, not only increasing food supply but also raising rural household incomes. Smallholder farmers are responsible for the majority of domestic food production in most developing countries. Efforts to enhance farm production can also be combined with efforts to improve crop and dietary diversity to maximize the impact on nutrition security. As many smallholders are subsistence farmers, the diversifi cation of small-scale production, cultivation of micronutrient-rich crops, and biofortifi cation of staple food crops directly reduce nutrition and micronutrient defi ciencies.
Second, social assistance programs should take into account the nutrition and dietary needs of benefi ciaries. Food assistance, nutritional interventions, and safety net programs
Policy Framework for Food Security
75
can be designed in tandem with programs that enhance economic opportunities and reduce poverty, such as school feeding and job creation schemes. Food assistance and related interventions can also better target benefi ciaries to improve program effi ciency. For example, by channeling food assistance through programs for women or for mothers and their children, the specifi c food and nutrition needs of these vulnerable groups can be met, and longer-term health consequences can be prevented.
Third, there has been an increasing emphasis on the role of health and education for nutrition security. National food security strategies often focus on agriculture and food supply, neglecting the importance of nutrition. However, evidence is clear that food supply alone may not guarantee that nutrition security will be achieved. In Mexico, for example, malnutrition and stunting persists despite relative food abundance (Neufeld, Chowdhury, and Ruel 2012). Nutrition education and social marketing are essential to improving food and nutrition security, given the strong relationship between nutritional and health knowledge, and nutrition outcomes. Studies show that education and a mother’s nutritional knowledge are particularly important for household food allocation and young children’s nutritional status (Behrman and Wolfe 1987; Thomas, Strauss, and Henriques 1991). A mother’s nutrition and health also directly infl uence her child’s nutrition and health. Moreover, there is often bias and discrimination against girls in household decisions over schooling, health care, and feeding. Pervasive gender bias is an important latent factor for malnutrition and the undernourishment of women and girls. Education is critical in empowering women and reducing gender inequality. Food distribution in households should incorporate nutrition interventions into broader food security and social protection programs.
Actions to Improve Medium- to Long-Term Resilience
Agriculture and Rural Development
Primarily, poverty in Asia remains rural. Thus, a rural-based growth strategy would seem to be an effective way to tackle both poverty and food insecurity. In the 1960s and 1970s, the Green Revolution was the proverbial stone that hit the two birds of poverty reduction and food security—by increasing rural incomes and lowering food prices. It showed rural development and growth can help reduce poverty effectively.
A new growth paradigm should focus on support for agriculture and on increasing rural income opportunities so they are at par with those for urban dwellers. Rural incomes should also be diversifi ed to improve stability, while urban–rural integration must deepen. Investment in rural roads and other infrastructure lowers transport costs, facilitates marketing, and encourages the fl ow of information. This can go a long way in advancing rural development.
Investing in rural roads and other infrastructure. Public investment in infrastructure, especially roads, is critical for rural development. Good infrastructure lowers the cost and time for trade, and increases reliability, thus boosting fl ows and benefi ting those who use infrastructure services more intensively. The costs of transit delays are especially high for time-sensitive goods like perishable agricultural products. Reduced transport costs simultaneously raise earnings from output sales and lower the cost of inputs. Investment

Food Security in Asia and the Pacifi c
76
in new drainage systems, or the rehabilitation of existing ones, must also be prioritized, as good drainage is central to resolving water logging and salinity problems. While profi table irrigation systems can be developed by the private sector, the construction and maintenance of drainage structures are often unprofi table, requiring additional public support.
Improving farm access to key inputs. The vast majority of the poor and vulnerable in rural areas work on small-scale subsistence farms. Therefore, improving smallholder production and productivity should be a priority in promoting food and nutrition security. The production capacity of smallholder farmers is often constrained by limited access to key inputs such as quality seeds, fertilizer, agricultural infrastructure, services (farm credits, for example), and available modern technology. Access to services and credit must be improved. New technologies require high capital inputs or mechanization, while small farmers may fi nd it diffi cult to adapt. Therefore, enhancing small farm production and productivity requires assistance to strengthen smallholders’ access to critical inputs, building and rehabilitating rural and agricultural infrastructure, improving the effi ciency of food supply chains, reducing postharvest losses, and expanding agricultural cooperatives.
Improving legal land rights can be an incentive to invest and help improve credit access, which might have been hampered by ill-defi ned land rights. With continued farm fragmentation, increasing land degradation, and stiff competition for land (agriculture versus nonagriculture, rural versus urban), there is need for more effi cient, inclusive, and sustainable land use policies. Tenure rights and migration policies must be reexamined. Aside from these policies, more innovative measures that can organize small-scale farmers and consolidate land holdings are urgently needed to pave the way for a leaner and smaller agriculture base that can produce more with less.
Increasing productivity in vast and fertile upland areas could result in improved livelihoods for the poor in these areas. The practical challenges of transportation and market access are central to increasing crop production in upland areas. But an important issue that must not be overlooked is insecure land rights and encroachment by industrial plantations or politically favored groups. Upland communities are often poor ethnic minorities—food insecure and politically marginalized. While these people can contribute to meeting the food security challenge, they cannot do so without security in the use of ancestral lands. So beyond productivity and logistics, institutional arrangements for these communities must also be examined.
Enhancing agricultural productivity. Improving agricultural productivity is essential for promoting long-term food security and poverty reduction. While better technology is available and can help increase food production, many farmers in Asia still use centuries-old farming techniques. There remains much room for increasing the yields of smaller and less effi cient farms, and reducing the amount of food wasted due to poor storage or ineffi cient processing. Modern farm technology can improve yields, but it often remains beyond the reach of poor farmers without the scale to make adaptation cost-effective, or the knowledge to apply this technology. Agricultural research, extension services, and postharvest measures are three specifi c areas through which public policy can help improve agricultural productivity.

Policy Framework for Food Security
77
Agricultural research
The world must produce more food to feed its growing population. But it must do so with fewer natural resources—limited land and water—and less energy, fertilizers, and pesticides while coping with rapid societal change. As with the Green Revolution of the 1970s, investing in agricultural R&D offers the most feasible long-term solution to this conundrum. Scientifi c research has been behind many innovations in agriculture, providing solutions to the problems of food security. It can again provide solutions in the future if people understand that investments need to be made now. The challenge for the research community is to develop resilient agricultural systems using rational, affordable strategies that not only increase production, but also achieve food security for households and individuals. Research also needs to be interdisciplinary and to address the diverse needs of smaller farms.
In Asia and the Pacifi c, it is important to increase food production by diversifying crops and fi nding alternatives to rice and wheat. A case in point is the potato, which has emerged as one of the more important food crops in the region. Potato crops have high yields and produce more edible energy and protein per unit area and time than many other crops. It also fi ts well into multiple-cropping systems prevalent in the region. However, most potato varieties selected for production in the region were developed for European or North American climates. Research can contribute to developing potato varieties more suited to tropical climates as well as to production technologies and postharvest processing.
Research is also needed in the area of climate change. Agriculture is extremely vulnerable to climate change and water availability; climate change impacts agriculture in many ways, particularly in countries vulnerable to natural disasters. Higher temperatures reduce crop yields while encouraging weed and pest proliferation. In addition, droughts, fl oods, and typhoons could occur more frequently and with greater ferocity. Over the long term, climate change can cause desertifi cation and saltwater intrusion, further damaging already scarce arable land. There is a need for research to build climate change resilience across agricultural systems as well as to ensure crop diversity. Research needs to focus on developing crops that can withstand extreme weather. For example, the International Rice Research Institute (IRRI) continues to develop rice varieties that can withstand fl ooding and above-average salt levels.
Given the Asia and Pacifi c region’s agroecological diversity, research could help bring more arable land into production. A recent study illustrates that investing in climate change adaptation in agriculture not only increases the chances of sustaining productivity (thus helping to stabilize food prices), but also reduces the pressure of bringing new lands into agriculture (Lobell, Baldos, and Hertel 2013). The study indicates that benefi ts can be best achieved in higher-yielding and more land-scarce areas such as South and East Asia.
To be sustainable, agricultural research must be demand driven, consider farmers’ concerns, and have results-based strategic action plans. Rural technological research cannot be done in a vacuum; rather, research on building cost-effective business

Food Security in Asia and the Pacifi c
78
models and fi nancing options for farmers using new technologies is essential. The research should be evidence-based and generate new data, so the information can feed into policy and project programming. Research that is oriented toward sustainability and profi tability will also attract private sector interest, which could drive substantial agricultural R&D as it innovates to compete.
Extension services
Research by itself does not increase farm productivity. New knowledge must be transmitted to farmers. Extension services are one bridge between the scientists who develop solutions and the farmers who need them. Research and best practices can translate to increased yields and improved food security only when they are communicated to and adopted by farmers. Wesley and Faminow (2012) argue that extension systems in much of Asia and the Pacifi c are outdated—top-down extension models with little attention to local conditions. Their study (2012) notes “farmer-oriented approaches to rural innovation that emphasize the importance of mutual learning between formal and informal knowledge systems.”
An earlier study supports and extends this bleak assessment, describing public extension services that are hierarchical and favor large farmers (Qamar 2006). These services are often linked to commercial input suppliers, detracting from objectivity and sometimes resulting in excessive chemical inputs. On the other hand, the study also notes that the links between extension services and research institutions are “notoriously weak.” As a result, extension staff are often poorly informed about farmers’ needs and are poorly motivated. Among the study’s recommendations are outsourcing extension services, where socially and economically feasible, to the private sector, combined with appropriate regulatory controls. The study emphasizes the potential for using new information technology as a tool to facilitate—but not replace—conventional extension services. Reforms are needed to bring about an extension system that is demand driven, responsive to farmers’ needs, and accountable to the farmer, rather than the supply-driven systems prevailing across much of the region.
Communication technology bridges the information gap for remote areas, giving them access to extension services. Innovative strategies for combining Internet, telecommunications, video, and print technologies at appropriate levels are bridging this gap and allowing farmers to make better production and marketing decisions (McLaren et al. 2009).
Postharvest measures
Efforts to increase agricultural productivity need to be complemented by efforts to reduce postharvest loss. For poor and food-insecure smallholders, a reduction in losses has an immediate and signifi cant impact on household livelihoods. Postharvest food losses span the entire supply chain from harvest to fi nal household consumption. In developing countries, more than 30% of food loss occurs after harvesting and during processing—and this is usually reused alternatively (as animal feed, for example).

Policy Framework for Food Security
79
In industrialized countries, losses occur mostly at the consumer end, as waste. Postharvest losses in developing countries are mainly due to fi nancial, managerial, and technical limitations in harvesting techniques, storage and cooling facilities, infrastructure, packaging, and marketing systems. Research and technology can help provide practical solutions to postharvest losses—ranging from careful harvesting and packaging to more advanced storage systems to prolong freshness and shelf life. Moreover, as dietary habits change in Asia and the Pacifi c, postharvest measures will become increasingly important in maintaining the quality of fresh produce and meat products. These food categories will require specialized infrastructure such as cold supply chains and storage, humidity control, and laboratory and testing facilities to ensure regulatory standards are met.
Extension services, which have traditionally focused on production, can play an additional role to include the integration of marketing and value chains into existing extension systems and to link farmers and other agencies (Sulaiman, Hall, and Raina 2006). For example, a private company in Thailand developed a new supply chain model for fresh produce, in which deliveries are made daily and directly from small farmers organized under the company’s contract farming model. Assigning collection points and exercising postharvest control minimize losses and improve product quality (Uathaveekul 2011). This is an example of the changing nature of agricultural extension, in which the private sector takes the initiative where there is potential for win-win solutions. Public extension services will need to be selective, focusing on clients and sectors where there is a need for public sector involvement, but stepping aside where the private sector can do a better job.
Human Capital Investment: Education and Health
Human capital investments in health and education—and investments in basic infrastructure like water and sanitation—are key to poverty reduction and food security. While economic growth is a necessary condition for poverty reduction and consequently food security, the link between economic growth and food security may be weakened if the poor have limited access to human capital formation and basic infrastructure. Prioritizing investment in basic schooling, health, and nutrition not only directly enhances individual welfare but also builds higher average incomes in the long run. Human capital development directly improves food security by ensuring a healthy agricultural workforce and providing farmers with the skills to adopt modern and more productive farming technologies.
Nutrition Education and Awareness
Food security policies need to ensure that people have not only suffi cient food, but also the right kind of food. In many developing countries, trends in dietary patterns complicate the nutrition situation. Rapid income growth and urbanization are causing a shift in dietary patterns away from traditional starches and cereals, and increasingly toward processed foods, animal products, sugars, fats, and edible oils. For many developing countries, this nutritional transition has been accompanied by an increasing overweight incidence and risk of obesity in urban areas, while high rates of food insecurity and undernutrition continue in rural areas. Dietary diversifi cation—including increased consumption of total energy and

Food Security in Asia and the Pacifi c
80
animal protein—is a boost for the poor, who have monotonous diets. However, nutrition education and awareness have to be strengthened during this transition, especially for low-income urban households, as highly processed food that is low in micronutrient content poses increased health risks. Overall, it is important to promote dietary diversifi cation through nutrition education and awareness programs, while public health and education must be fully integrated into national food security strategies and policies.
Crisis Prevention and Risk Management
Managing and mitigating the risks threatening food security require a three-pronged approach. The fi rst and arguably the most crucial step is risk assessment—understanding and prioritizing risks, gauging their potential impact, and identifying who will be affected. The second is to provide safety nets and other disaster relief measures to mitigate the immediate impact for vulnerable people and communities. Third, a risk management system should have longer-term prevention and adaptation measures to help people and communities adapt to the changing new environment and build resilience to risks.
Practically all food security strategies and policies laid out in this report are about better risk management, but it is worth highlighting the importance of food security risk analysis and monitoring systems (Box 7.2). Identifying who are food insecure and vulnerable to food insecurity, where they are, and why they are insecure or vulnerable should be the
Box 7.2: Features of a Comprehensive Food Security Risk Assessment and Information System
The important elements of a food security risk analysis are
(i) Risk identifi cation and the development of risk, hazard, and vulnerability maps;
(ii) Food security risk monitoring systems based on key indicators identifi ed in the risk, hazard, and vulnerability maps;
(iii) Needs assessments during emergencies;
(iv) Food security information management platforms; and
(v) Capacity building of national and regional institutions.
An effective food security risk management information system should cover
(i) Indicators that represent the risks to food availability, access, and utilization;
(ii) Identifi ed geographical areas and communities;
(iii) Information on the main causes of food insecurity and risks to livelihoods, and the probable impacts on households;
(iv) Information on risk management efforts that governments, communities, and households can implement;
(v) Tools for the early detection of risks; and
(vi) A comprehensive contingency plan.
Source: Haile, M. and L. Bydekerke. 2012. Improving Food Security Risk Management for Sustainable
Development. In C. Ghenai, ed. Sustainable Development – Education, Business and Management –
Architecture and Building Construction – Agriculture and Food Security. Shanghai, PRC: InTech.
Policy Framework for Food Security
81
fi rst step even before discussing what measures are needed to mitigate their vulnerability. The source of food security hazards—local, national, or international—and whether they are transitory or chronic in nature must be identifi ed as well. Moreover, risk analysis and monitoring need to gauge the likelihood of these threats, the historical distribution of hazards, and the probable impacts on vulnerable populations. Finally, all this information, once gathered and analyzed, must be fed into a monitoring and early warning system that can help policy makers, fi rms, and households adapt to foreseeable hazards and take mitigation measures.
Emergency Funds for Disaster Relief
Building an emergency fund for communities and nations could also be considered part of the risk management system to provide a buffer during food crises. The fund could be used to fi nance safety nets for those suffering transitory food insecurity. The private sector can be offered incentives—such as tax deductions—to contribute to the fund, which can be run by a government agency in partnership with the private sector. The fund can be linked to insurance against natural disasters and other calamities, and used in conjunction with risk management to help mitigate the effects of crises and disasters.
Crop Insurance and Futures Contracts
Weather is a key source of uncertainty over a farmer’s projected income, and thus impacts investment and production decisions. Weather-based crop insurance can help mitigate this insecurity, giving farmers a chance to try more productive, even riskier, activities such as alternative crop selection or the adoption of new technologies. On the other hand, futures contracts—which assure farmers of specifi ed prices for output—can also help mitigate risks caused by price volatility. Futures help guarantee that farmers receive a minimum income from their harvest, which can contribute toward poverty reduction. The impact of insurance and disaster mitigation measures can extend beyond simple fi duciary benefi ts, as such measures reduce uncertainty for farmers’ incomes and food security. One important aspect of food security concerns certainty over future meals. By smoothing shocks to household income, crop insurance and futures contracts allow households to invest in other important items, such as education. Reduced uncertainty over food security therefore allows more spending on human resource development, which can improve the chances of escaping poverty.
Coordinated Responses to Enhance Resilience
The 2007–2008 food crisis highlighted a number of weaknesses in international food markets. While fundamental and structural forces—including growing populations, rising incomes, and increasingly constrained resources due to climate change—have been behind recent surges in global food prices, reduced national grain stocks, export and import restrictions, and speculation in futures and commodity markets have aggravated market imbalances at times, amplifying price volatility. At the height of the food crisis, some governments adopted trade and subsidy policies to stabilize domestic food prices and complement food safety nets. While some of these measures aimed to help relieve immediate pressures on
Food Security in Asia and the Pacifi c
82
the poor, policies such as export restrictions, direct price controls, and general subsidies can further distort markets and eventually become ineffective and fi scally unsustainable. Therefore, it is important for countries to make more comprehensive assessments of the impact of new policies and to take action accordingly.
There is a clear need for countries to respond to global food crises in a coordinated manner to prevent policies or actions that may have undesirable consequences for other countries and international food markets. The international community needs to strengthen cross-border cooperation for emergency support and better management of international food markets.
First, emergency food reserves and funding facilities can allow the rapid delivery of humanitarian aid to the most vulnerable countries or populations in the wake of a food crisis. Governments can improve emergency access to food by linking village and national stocks to regional and global stocks, and by facilitating the release of grain stocks to other countries in crisis situations. National and international food stocks, if strategically managed, can also help reduce food price volatility.
Second, agricultural trade offers opportunities to effectively manage international food markets and price volatilities. The international community needs to show a strong commitment to removing undue trade restrictions and reviving stalled global trade talks—including agricultural negotiations under the World Trade Organization (WTO) Doha Round. Subsidy programs, especially in developed countries, should be removed to provide a level playing fi eld to already disadvantaged farmers in developing countries. It is also important to build consensus on national policies for biofuel and environmental management toward sustainable agriculture.
Third, coordinated actions require the comprehensive assessment and monitoring of international food markets, and better coordination and information sharing. To be better prepared and provide timely support for the most vulnerable, governments and the international community need to establish mechanisms to collect and share reliable and timely data and other information. One interesting recommendation for regional and global coordinated action is the “Resources 30” approach recommended by Resources Futures: A Chatham House Report (Lee et al. 2012). The proposal involves an informal network of key food producers and consumers that could develop and agree on rules and norms for the regional and global food system. An example is ASEAN’s pilot testing of a multi-stakeholder dialogue through its Rice Trade Forum. Finally, cooperation across Asia and the Pacifi c is essential if climate adaptation and GHG mitigation strategies are to be effective, in both nations and the region.
Emergency Food Reserves
Low food stocks make markets vulnerable to excessive price volatility, even against minimal supply or demand shocks. Private stock levels are determined by those who hold stocks for profi t (Williams and Wright 1991). At times, stock levels from market-driven processes are too low from a social perspective; as they increase the likelihood of price spikes, there is market failure in relation to the level of privately held stocks. Not only do poor people suffer
Policy Framework for Food Security
83
from food insecurity induced by price spikes, but government action can also magnify the problem.
The existence of market failures suggests that it may make sense for countries to maintain emergency stocks. Storage can be costly, of course. But if these are released in a transparent, preannounced manner and only when prices are unusually high, national grain stocks can stabilize prices and help domestic food security. Nevertheless, releasing food stocks has only a limited and temporary effect on domestic price stability, if free trade allows the international price to be transmitted domestically. For example, when prices surge, an importing country might release rice stocks domestically to force the local price below international levels. But unless exports are prohibited, private agents would buy rice at the low domestic price and sell it internationally for profi t.
Nonetheless, emergency reserves can be important in meeting the immediate food needs of a population hit by transitory food insecurity. Each ASEAN member, for example, maintains national rice reserves. But these reserves need to be expanded, particularly for large rice-importing and -exporting countries in Asia. ASEAN includes three of the largest rice-importing countries in the world—Indonesia, Malaysia, and the Philippines—and two of the largest rice exporters—Thailand and Viet Nam. Regionally coordinated reserves could be useful in mitigating the effects of short-term supply shocks by allowing countries to tap into the regional reserve pool and to reduce the storage cost nationally. One study fi nds that maintaining domestic stocks has been more effective than international trade in coping with short-term negative supply shocks (Jha, Kubo, and Ramaswami, forthcoming).
A proposal for an internationally coordinated grains reserve (von Braun and Torero 2008) requires a physical reserve of about 5% of current levels of food aid—or about 300,000 tons of food in wheat units—to be managed by the WFP. Under this proposal, the Group of Eight (G8) Plus 5 countries13 are to be tapped for contributions to the reserves and for fi nancing. International food reserves, however, run a high risk of coordination failure and incur high costs. For example, a proposal by Lin (2008) on international coordinated grains reserves could cost about $1.05 billion per year.
On the other hand, there have been noticeable initiatives at the regional level to improve food reserve management and price stability. After the 2007–2008 rice crisis, the ASEAN Integrated Food Security (AIFS) Framework and its implementing mechanism, the Strategic Plan of Action and Food Security in the ASEAN Region (SPA-FS), were established. They aim to prevent or mitigate problems caused by extreme rice price volatility through regional and national food reserves, the expansion of food trade, the strengthening of market information, and the increase of food productivity. Other initiatives within the region are the ASEAN Plus Three Emergency Rice Reserve (APTERR), the ASEAN Food Security Information System (AFSIS) project, and the pilot ASEAN Rice Trade Forum.
Designed to complement members’ existing national rice reserves, APTERR helps mitigate supply shock effects using forward contracts and streamlined release procedures, helping
13 The G8 consists of Canada, France, Germany, Italy, Japan, the Russian Federation, the United Kingdom (UK), and the US, while the Plus 5 countries refer to the emerging economies of Brazil, the PRC, India, Mexico, and South Africa.

Food Security in Asia and the Pacifi c
84
Box 7.3: The ASEAN Plus Three Emergency Rice Reserve
The Association of Southeast Asian Nations (ASEAN) Plus Three Emergency Rice Reserve (APTERR) was established in July 2011, in a ministerial agreement between the ASEAN+3
members—ASEAN (Brunei Darussalam, Cambodia, Indonesia, the Lao People’s Democratic Republic [Lao PDR], Malaysia, Myanmar, the Philippines, Singapore, Thailand, and Viet Nam), plus the People’s Republic of China (PRC), Japan, and the Republic of Korea.
APTERR is a buffer against immediate threats to food security caused by disasters and market volatility associated with calamities. Earmarked rice reserves total 787,000 tons. Voluntary donations in cash or rice comprise stockpiled reserves. APTERR stocks can be released to a member that is unable to cope with an emergency through its national reserves alone, and is unable to procure needed rice supplies through normal trade. Day-to-day management is handled by a secretariat hosted by Thailand under the supervision of the APTERR Council.
Sources:
Association of Southeast Asian Nations (ASEAN) Plus Three Emergency Rice Reserve (APTERR). 2012.
20 Frequently Asked Questions About APTERR. Primer published with the support of the Asian Development
Bank, with fi nancing from the Japan Fund for Poverty Reduction.
Clarete, R., L. Adriano, and A. Esteban. Forthcoming. Rice Trade and Price Volatility: Implications on ASEAN and
Global Food Security. ADB Economics Working Paper. Manila: ADB.
countries respond more quickly (Box 7.3). This multilateral effort to coordinate publicly held rice reserves—and the investment in developing rules, procedures, and the capability to anticipate rice shortages—is noteworthy. A suggestion is for APTERR to consider including Bangladesh, India, and Pakistan to expand the regional rice reserve system (Timmer 2010).
Trade Liberalization
Trade liberalization covering food can help stabilize food prices and ensure food security. But national policies often vie against liberalization when it comes to food. Rice trade in ASEAN is a prime example. It is constrained by the level of imports, not exports (Clarete, Adriano, and Esteban, forthcoming). ASEAN’s capacity to export rice expanded when Viet Nam became one of the world’s top fi ve rice exporters. After 2000, ASEAN’s rice imports hardly changed while its exports increased, particularly to external markets. This shows that exporting countries have the capacity to expand if there is added demand for rice in the world market. Like Viet Nam, Cambodia and Myanmar hold the potential to boost regional rice supplies, given adequate demand and investment in the supply chain. In Cambodia, investments to modernize road infrastructure, logistics, and rice mills could increase the country’s marketable surplus.
However, rice-importing ASEAN members seem reluctant to liberalize their own rice markets, as seen by the preferential rice tariff rates in the ASEAN Free Trade Area (AFTA). Although some countries agreed to reduce their respective preferential import tariffs—the Philippines to 30%, Indonesia to 25%, and Malaysia to 20%—these remain signifi cantly higher than the usual free trade area tariff rates. The region’s large exporting countries—Thailand and Viet Nam—have likewise contributed to reducing the rice trade. In 2008, Viet Nam restricted rice exports to avoid importing excessive price fl uctuations. And Thailand’s paddy-pledging program—which artifi cially raises the domestic price of rice—is virtually a rice-export limiting policy. While Thailand may be able to pass on some subsidy costs to

Policy Framework for Food Security
85
the global market, it is limited in doing so as other large rice exporters—India, Pakistan, and Viet Nam, for example—do not need to make world rice consumers pay more than rice production costs.
An important reason importing countries embrace protectionist food self-suffi ciency is the fear of losing access to food when others restrict exports. Thus, to promote international trade in food, rules banning export restrictions should be strengthened. Negotiating multilateral rules on export restrictions, or even a reduction in import restrictions on food, will likely be very diffi cult. Here, regional cooperation holds potential. Food-importing countries may be able to negotiate for the commitment of food-exporting countries to ban unilateral export restrictions by agreeing to reduced levels of self-suffi ciency in exchange. This could be further augmented by agreements for the establishment of emergency food stocks and fi nancial aid. These measures could help deepen regional trade in food and better enable the region to respond to food crises.
During past food crises, export and import restrictions were important contributors to food price volatility, together with low food stocks and speculative trading in futures and commodity markets. In the absence of mechanisms to prevent market failure, introducing export bans might be rational at times from an individual country’s perspective. This is exactly what happened during the 2007–2008 crisis, when the Russian Federation banned wheat exports, and India and Viet Nam did the same for rice. These bans stemmed from the desire to protect domestic consumers from high international prices. But the bans themselves exacerbated international price instability and, according to one estimate, they were responsible for almost half the international rice price increase (Headey 2011).
The response of some importing countries also contributed to the price increase. Fearful of being unable to obtain rice for domestic consumption, the Philippines—at the time, the world’s largest importer of rice—sharply increased its demand for imported rice, to replenish stock levels held by the government’s NFA. This further exacerbated the rise in international price.
While government responses are not necessarily irrational from a national point of view, their global effect magnifi es the volatility of the international food prices. There may be better responses to the global crisis from an international perspective. One option is an internationally agreed prohibition against export bans. Export bans are legal under existing WTO agreements. The proposal to prohibit export bans for food through the WTO was discussed by the Group of Twenty (G20)—and it is possible some progress can be made. While desirable, WTO action may not be fully effective. If spikes in international prices are transmitted to domestic markets, governments could risk social unrest. Past social unrest suggests it would be diffi cult for the governments of developing countries to enforce these rules amid international price spikes. Further, the proposal does nothing to prevent panic import buying. So efforts to boost stock levels—particularly internationally coordinated grains reserves—should continue to complement trade measures to improve how international food markets function and maintain food price stability.
At the regional level, there remains the need to review current levels of national reserves and consider more effi cient regional options. Since the 2007–2008 crisis, major rice importers,

Food Security in Asia and the Pacifi c
86
through self-suffi ciency programs, have increased the regional and global stocks-to-use ratio to very comfortable levels. This will likely lead to even thinner rice trade globally, and hence, higher price volatility. It may be useful to review the level of national reserves and complement these with more effi cient and higher regional reserves (for example, the APTERR) as well as investments in regional rice value chain logistics.
Market Information Systems and Networks
Accurate and timely information on food markets and stocks would be an essential element for effi ciently coordinating national policies and actions to maintain food price stability. Effi cient reserve utilization requires timely and accurate information on food markets and stocks. Generating and correctly interpreting market information can also prevent speculation from descending into a full-blown food crisis. Although trade imbalances played an important role in explaining the 2007–2008 rice crisis, market uncertainty and speculation appear to have aggravated the situation and amplifi ed price fl uctuations. Moreover, given the centrality of food, price volatility not only increases speculation but also induces hoarding—as households, fi rms, and governments stock up on essential supplies, expecting diffi culties ahead. Although evidence remains patchy, hoarding may have contributed to turning temporary market imbalances into a full-blown food crisis involving panic buying on a massive scale.
While it is important to invest in gathering information about the food market system, interpretation and utilization are just as critical. A regular regional forum of policy makers willing to share and interpret food market and stock information, and coordinate policies in response to developing events would help immensely. Having a vibrant regional futures trade in food would help as well. Aside from reducing market risk, futures trade provides a convenient platform for disseminating market information. Active trading and pricing information gives better signals about market conditions and helps form the best estimates for future prices. Speculation is a necessary evil. Like its counterpart in fi nancial securities or other commodities, rice futures trading would need to be well regulated to maintain its integrity.
A coordinated information system would enhance market transparency and rebuild confi dence in the international agricultural trading system. Regional information sharing mechanisms are also needed. The ASEAN Food Security Reserve Board is a good example. It can convene the ASEAN Rice Trade Forum to provide a platform for ASEAN members to share and analyze rice market information, and coordinate policy actions for mitigating the adverse effects of rice price volatility. Through the forum, members can discuss measures to make regional rice trade more open, develop incentives for increased private sector participation in the regional rice value chain, and fi nd ways to improve rice productivity.
Another initiative is the AFSIS project, which has been gathering and disseminating market information and developing an early warning mechanism. While it is necessary to provide AFSIS with reliable, up-to-date, and demand-driven information, it is also important to develop its capacity to accurately interpret market information and provide policy analysis.
There are novel ways of using information and communication technology (ICT) for market information sharing and dissemination, providing extension services and rural fi nance, and

Policy Framework for Food Security
87
developing geographic information system (GIS)-based early warning systems. ICT can be used to enhance the effi ciency of food distribution networks, by allowing the seamless transit of food along the food supply chain through various intermodal, rural–urban warehouse and transport points. Policies and institutional arrangements for private–public partnerships that harness ICT for market information systems and food distribution networks could facilitate access and more inclusive food distribution. These should be combined with consumer awareness communication strategies that address access to nutritious and safe food.
Collaboration on Climate Change
Building better climate resilience requires strengthening adaptive capacity nationally and regionally, and ensuring appropriate adaptation policies and investments are made and institutions strengthened. Adaptation measures should be an extension of development policy, designed to eradicate the structural causes of poverty and food insecurity (ADB 2009a). The links between poverty and food security should enable a streamlined approach to achieve both. These include the “top-down” options such as developing effi cient agricultural markets, reducing distortions and subsidies in agricultural policies, continuing trade liberalization policies, enhancing social protection and microfi nance, disaster preparedness, and in general, mainstreaming climate change in designing agricultural policy (ADB 2009a). Nevertheless, neither development policies nor autonomous adaptation measures alone will be enough to enable developing countries in Asia and the Pacifi c to adequately prepare for climate change.
Effective climate adaptation needs to take existing development policies beyond their current capacity through improvements and better coordination. Innovative policies include changing investment priorities and resource allocation for agriculture and across relevant sectors. Both “hardware” and “software” investments—such as human capacity building, education, and health—are needed. Climate change risk sharing and risk management are most critical to improve the overall adaptive capacity of developing countries. This is particularly true, for example, in pricing carbon to increase the value of practical sustainable farming practices. Integrated water management systems that use water resources effi ciently are a key proactive adaptive measure. The continual support of technological development and technology transfer is a global public good—as the huge initial investment requirements go far beyond the capacity of any individual developing country. Establishing or upgrading early warning systems and sharing information on the effects of and responses to climate change must be a worldwide collaborative effort.
Developing appropriate climate policy priorities should target the most vulnerable countries fi rst—usually, but not exclusively, those least developed. Specifi c climate action plans within each developing country should be integrated into national development plans to enmesh with poverty reduction strategies, through consultations with bilateral and multilateral donors, international and national civil society organizations, the scientifi c community, and policy advisory groups. Without country-specifi c integration, processes for policy coordination, a comprehensive climate adaptation plan, or strategies for dealing with agriculture and food security cannot happen.

Food Security in Asia and the Pacifi c
88
Lessons learned for one are lessons learned for all. Nationally, regionally, and globally, existing knowledge and experience must be shared. Concrete climate adaptation measures and practices used in developed countries should be shared with developing countries so they can be adapted to local conditions, if suitable. Funding the relevant research agenda on climate change impacts on food security, and assisting developing countries in coming up with fl exible arrangements for intellectual property rights may probably be the best way of generating a new, sustainable, greener revolution of technology and practices. Building new contract arrangements for trial testing, adoption, and dissemination may require support from multilateral development organizations.

89
VIII. Summary and Conclusion
For the countries of Asia and the Pacifi c, food security is a major concern. Good progress in reducing the prevalence of undernutrition has been made over the last 2 decades, especially in Southeast Asia and East Asia; in South Asia, that progress
has been only moderate. Despite this, undernourishment remains far too high. In South Asia alone, the malnourished population exceeds that of Africa. Child malnutrition is a continuing social problem, especially in South Asia and the Pacifi c island countries.
Over the coming decades, the diffi culties in improving food security will become more severe. As populations grow and diets shift from staple cereals toward livestock products, the structure of fi nal demand will change—with livestock feed and biofuel demand becoming more important. Nonetheless, the demand for staple foodstuffs will continue to increase. Nonagricultural demand for land and water will outbid agriculture, and the increase in agricultural output must be met with reduced resource inputs.
Sustained increases in agricultural productivity are required if supplies are to be enough to prevent signifi cant increases in food prices. But this must occur in an environment of great uncertainty. Climate change will require the adaptation of traditional agricultural systems—including, in some cases, the physical location of agricultural production. The need for infrastructure investment and R&D will increase dramatically.
Enhancing food security pivots on two main drivers: (i) reducing poverty incidence, primarily but not entirely driven by economic growth; and (ii) keeping the real price of food stable and affordable. Agricultural productivity growth contributes to both. Spikes in food prices—like those in 2007–2008 and 2010–2011—delay poverty reduction and compound food insecurity. Where markets fail, food and social safety nets need to provide protection against livelihood risks and allow an adequate level of food consumption for vulnerable groups.
National efforts are central to food security. Achieving food security requires measured and balanced policies that promote agricultural productivity and price stability, increase the availability of and access to food, and ensure adequate nutrition, especially for children. The majority of Asia’s poor live in rural areas, which makes promoting vibrant agricultural and rural sectors a priority. The focus should be on more localized, smallholder, and sustainable agriculture. The issues of smallholder farmers rest largely in access to inputs, technology, and markets. Addressing these would necessitate reinforcing strategic efforts to enhance agricultural research, invest in infrastructure, and promote trade. The proper mix of short-, medium-, and long-term policies must be crafted based on natural endowment, infrastructure, stage of development, the agro-processing industry, trade liberalization, and fi scal strength.
Food Security in Asia and the Pacifi c
90
National food security strategies have often focused on agriculture and food supply, neglecting the importance of nutrition. However, evidence is clear that food supply alone may not achieve nutrition security. Undernourishment and micronutrient defi ciency have a major impact on children’s cognitive development and remain a serious concern in many developing countries. Investment in health and education, and in water and sanitation infrastructure are critical. In particular, special attention has to be paid to nutrition education and social marketing for better food and nutrition security, given the strong relationship between nutritional and health knowledge, and nutrition outcomes.
Food security requires collaboration beyond national borders and internationally coordinated responses. There are three broad areas where global and regional cooperation can help ensure food security and reduce excessive price volatility: (i) establishing emergency food reserves and aid, (ii) sharing market information, and (iii) promoting trade. Food price instability often coincides with low stock levels. The level of food stocks can be suboptimal if left solely to private business decisions. Current levels appear too low to avert any temporary supply or demand shocks, and may require appropriate tax or price incentives to induce higher levels. Accurate and timely information on food markets and stocks is also critical to preventing market speculation from spiraling into a food crisis. Through regular dialogue, policy makers in the region can assess market trends and help coordinate policies in response.
Finally, agricultural protectionism remains part of the problem, not the solution. It accentuates international price volatility. When importers and exporters attempt to insulate domestic markets, the effects can be offsetting. Domestic prices within each group of countries are left unchanged, but higher international prices are forced onto others. International cooperation can prevent these counterproductive, beggar-thy-neighbor attitudes. Food security requires open international markets for food, research and innovation, increased productivity, and regional—if not international—cooperation.

91
Appendix A
Regional Groupings
ASIA AND THE PACIFICCENTRAL AND WEST ASIAArmenia the Kyrgyz Republic Azerbaijan Tajikistan Georgia Turkmenistan Kazakhstan Uzbekistan
EAST ASIAHong Kong, China Mongolia Japan the People’s Republic of Chinathe Republic of Korea the Democratic People’s Republic of Korea
PACIFICAustralia Papua New Guinea Fiji the Marshall Islands the Federated States of Micronesia SamoaKiribati Solomon Islands Nauru Timor-LesteNew Zealand Tonga Palau Vanuatu
SOUTH ASIAAfghanistan the Maldives Bangladesh Nepal Bhutan Pakistan India Sri Lanka
SOUTHEAST ASIABrunei Darussalam Myanmar Indonesia the Philippines Cambodia Singapore the Lao People’s Democratic Republic Thailand Malaysia Viet Nam

92
Appendix A
OTHER REGIONSAFRICAAngola Madagascar Burundi Mali Benin Mozambique Burkina Faso Mauritania Botswana Mauritius the Central African Republic Malawi Côte d’Ivoire Mayotte Cameroon Namibia the Democratic Republic of the Congo Niger Congo Nigeria Comoros Rwanda Cape Verde Sudan Djibouti Senegal Algeria Saint Helena Egypt Sierra Leone Eritrea Somalia Ethiopia São Tomé and Principe Gabon Swaziland Ghana Seychelles Guinea Chad Gambia Togo Guinea-Bissau Tunisia Equatorial Guinea Tanzania Kenya Uganda Liberia South Africa Libya Zambia Lesotho Zimbabwe Morocco
EUROPEAlbania France Andorra Germany Austria Greece Belgium Croatia Bulgaria Hungary Bosnia and Herzegovina Ireland Belarus Iceland Cyprus Italy the Czech Republic Lithuania Denmark Luxembourg Estonia Latvia Finland Moldova

93
Regional Groupings
EUROPE continued
Macedonia Spain Malta Serbia Montenegro Slovakia the Netherlands Slovenia Norway Sweden Poland Switzerland Portugal Turkey Romania the United Kingdom the Russian Federation Ukraine
LATIN AMERICA AND THE CARIBBEANAruba Guatemala Anguilla Guyana the Netherlands Antilles Honduras Argentina Haiti Antigua and Barbuda Jamaica the Bahamas Saint Kitts and Nevis Belize Saint Lucia Bolivia Mexico Brazil Nicaragua Barbados Panama Chile Peru Colombia Paraguay Costa Rica El Salvador Cuba Suriname Dominica Trinidad and Tobago the Dominican Republic Uruguay Ecuador Saint Vincent and the Grenadines Grenada Venezuela
MIDDLE EASTUnited Arab Emirates Lebanon Bahrain Oman Iran Occupied Palestinian TerritoriesIraq Qatar Israel Saudi Arabia Jordan SyriaKuwait Yemen
NORTH AMERICABermuda GreenlandCanada the United States
Source: Authors.

94
Appendix B
Economy Codes
ABW ArubaAFG AfghanistanAGO AngolaAIA AnguillaALB AlbaniaAND AndorraANT the Netherlands AntillesARE United Arab EmiratesARG ArgentinaARM ArmeniaASM American SamoaATA AntarcticaATG Antigua and BarbudaAUS AustraliaAUT AustriaAZE AzerbaijanBAN BangladeshBDI BurundiBEL BelgiumBEN BeninBFA Burkina FasoBGR BulgariaBHR BahrainBHS the BahamasBHU BhutanBIH Bosnia and HerzegovinaBLR BelarusBLZ BelizeBMU BermudaBOL BoliviaBRA BrazilBRB BarbadosBRU Brunei DarussalamBWA BotswanaCAF the Central African Republic
CAM CambodiaCAN CanadaCCK the Cocos Islands CHL ChileCIV Côte d’IvoireCMR CameroonCOD the Democratic Republic
of the CongoCOG CongoCOL ColombiaCOM ComorosCOO the Cook IslandsCPV Cape VerdeCRI Costa RicaCUB CubaCXR Christmas IslandCYM the Cayman Islands CYP CyprusCZE the Czech RepublicDEN DenmarkDJI DjiboutiDMA DominicaDOM the Dominican RepublicDZA Algeria ECU EcuadorEGY EgyptERI EritreaEST EstoniaETH EthiopiaFIJ FijiFIN FinlandFRA FranceFSM the Federated States
of MicronesiaGAB Gabon
Code Economy Code Economy

95
Economy Codes
GEO GeorgiaGER GermanyGHA GhanaGIB GibraltarGIN GuineaGMB GambiaGNB Guinea-BissauGNQ Equatorial GuineaGRC GreeceGRD GrenadaGRL GreenlandGTM GuatemalaGUM GuamGUY GuyanaHKG Hong Kong, China HND HondurasHRV CroatiaHTI HaitiHUN HungaryIND IndiaINO IndonesiaIRE IrelandIRN IranIRQ IraqISL IcelandISR IsraelITA ItalyJAM JamaicaJOR JordanJPN JapanKAZ KazakhstanKEN KenyaKGZ the Kyrgyz RepublicKIR KiribatiKNA Saint Kitts and NevisKOR the Republic of KoreaKWT KuwaitLAO the Lao People’s Democratic
RepublicLBN LebanonLBR LiberiaLBY LibyaLCA Saint Lucia
LIE LiechtensteinLSO LesothoLTU LithuaniaLUX LuxembourgLVA LatviaMAC Macau Special Administrative
Region of the People’s Republic of China
MAL MalaysiaMAR MoroccoMCO MonacoMDA MoldovaMDG MadagascarMEX MexicoMKD MacedoniaMLD the MaldivesMLI MaliMLT MaltaMNE MontenegroMNP the Northern Mariana IslandsMON MongoliaMOZ MozambiqueMRT MauritaniaMSR MontserratMUS MauritiusMWI MalawiMYA MyanmarMYT MayotteNAM NamibiaNAU NauruNCL New CaledoniaNEP NepalNER NigerNET the NetherlandsNFK Norfolk Island NGA NigeriaNIC NicaraguaNIU NiueNOR NorwayNZL New ZealandOMN OmanPAK PakistanPAL Palau
Code Economy Code Economy

96
Appendix B
PAN PanamaPER PeruPHI the PhilippinesPNG Papua New GuineaPOL PolandPOR PortugalPRC the People’s Republic of ChinaPRK the Democratic People’s
Republic of KoreaPRY ParaguayPSE Occupied Palestinian TerritoriesPYF French PolynesiaQAT QatarRMI the Marshall Islands ROU RomaniaRUS the Russian FederationRWA RwandaSAM SamoaSAU Saudi ArabiaSDN SudanSEN SenegalSHN Saint HelenaSIN SingaporeSLE Sierra LeoneSLV El SalvadorSOL Solomon IslandsSOM SomaliaSPA SpainSRB SerbiaSRI Sri LankaSTP São Tomé and PrincipeSUR Suriname
SVK SlovakiaSVN SloveniaSWE SwedenSWI SwitzerlandSWZ SwazilandSYC SeychellesSYR SyriaTAJ TajikistanTCD ChadTGO TogoTHA ThailandTIM Timor-LesteTKM TurkmenistanTON TongaTTO Trinidad and TobagoTUN TunisiaTUR TurkeyTZA TanzaniaUGA UgandaUKG the United KingdomUKR UkraineURY UruguayUSA the United StatesUZB UzbekistanVAN VanuatuVCT Saint Vincent and the GrenadinesVEN VenezuelaVIE Viet NamYEM YemenZAF South AfricaZMB ZambiaZWE Zimbabwe
Source: Auth ors.
Code Economy Code Economy

97
References
Aggarwal P., P. Joshi, B. Campbell, S. Vermeulen, and P. Kristjanson. 2012. Adapting South Asian Agriculture to Changing Climate and Declining Land Resources. Paper presented at the Symposium on Food Security in Asia and the Pacifi c: Key Policy Issues and Options. University of British Columbia, Vancouver. 17–18 September.
Alexandratos, N., and J. Bruinsma. 2012. World Agriculture towards 2030/2050: The 2012 Revision. ESA Working Paper No. 12-03. Rome: Food and Agriculture Organization of the United Nations (FAO).
Asian Development Bank (ADB). 2008. Social Protection Index for Committed Poverty Reduction. Vol. 2: Asia. Manila: ADB. http://www.adb.org/sites/default/fi les/spi-poverty-reduction-v2.pdf
______. 2009a. Building Climate Resilience in the Agriculture Sector of Asia and the Pacifi c. Manila: ADB. http://www.adb.org/sites/default/fi les/pub/2009/Building-Climate-Resilience-Agriculture-Sector.pdf
______. 2009b. Operational Plan for Sustainable Food Security in Asia and the Pacifi c. Manila: ADB. http://www.adb.org/sites/default/fi les/pub/2009/Sustainable-Food-Security.pdf
______. 2009c. The Economics of Climate Change in Southeast Asia: A Regional Review. Manila: ADB. http://www.adb.org/sites/default/fi les/economics-climate-change-se-asia.pdf
______. 2011. Asia 2050: Realizing the Asian Century. Manila: ADB. http://www.unido.org/fi leadmin/user_media/UNIDO_Worldwide/Asia_and_Pacifi c_Programme/Documents/AsianDevelopmentBankreport_asia-2050.pdf
______. 2012. Food Security in Asia and the Pacifi c: Key Challenges and Policy Options. Manila: ADB. http://www.adb.org/sites/default/fi les/pub/2012/food-security-poverty.pdf
Association of Southeast Asian Nations (ASEAN) Plus Three Emergency Rice Reserve (APTERR). 2012. 20 Frequently Asked Questions About APTERR. Primer published with the support of the Asian Development Bank, with fi nancing from the Japan Fund for Poverty Reduction.
Barrett, C. 2008. Spatial Market Integration. In L. Blume and S. Durlauf, eds. The New Palgrave Dictionary of Economics. 2nd ed. London: Palgrave Macmillan.
Behrman, J., and B. Wolfe. 1987. How Does Mother’s Schooling Affect Family Health, Nutrition, Medical Care Usage, and Household Sanitation? Journal of Econometrics. 36 (1–2). pp. 185–204.
Beintema, N. M., G. J. Stads, K. Fuglie, and P. Heisey. 2012. ASTI Global Assessment of Agricultural R&D Spending: Developing Countries Accelerate Investment.

References
98
Washington, DC and Rome: International Food Policy Research Institute (IFPRI) and Global Forum on Agricultural Research. http://www.ifpri.org/sites/default/fi les/publications/astiglobalassessment.pdf
Brooks, D., and S. Evenett. 2005. Competition Policy and Development in Asia. New York: Palgrave Macmillan.
Brooks, D., and D. Hummels. 2010. The Role of Infrastructure in Lowering Asia’s Trade Costs. Cheltenham, UK: Edward Elgar Publishing.
Brooks, D., B. Ferrarini, and E. Go. Forthcoming. Bilateral Trade and Food Security in Asia. ADB Economics Working Paper. Manila: ADB.
Chandra, R. K. 1991. Interactions between Early Nutrition and the Immune System. Ciba Foundation Symposium 156. pp. 77–89; and discussion: pp. 89–92.
______. 1997. Nutrition and the Immune System: An Introduction. American Journal of Clinical Nutrition. 66 (2). pp. 460S–463S.
Chen, G., Y. Ming, N. D. Singer, and J. Lu. 2011. Testing the Clausius–Clapeyron Constraint on the Aerosol-Induced Changes in Mean and Extreme Precipitation. Geophysical Research Letters. 38 (4). pp.1–6.
Church, J., and N. White. 2011. Sea-Level Rise from the Late 19th to the Early 21st Century. Surveys in Geophysics. 32 (4–5). pp. 585–602.
Clarete, R., L. Adriano, and A. Esteban. Forthcoming. Rice Trade and Price Volatility: Implications on ASEAN and Global Food Security. ADB Economics Working Paper.Manila: ADB.
Darnton-Hill, I., and B. Cogill. 2010. Maternal and Young Child Nutrition Adversely Affected by External Shocks such as Increasing Global Food Prices. The Journal of Nutrition. 140 (1). pp. 162S–169S.
Easterling, W., and P. Aggarwal. 2007. Food, Fibre and Forest Products. In M. L. Parry, O. F. Canzianai, J. P. Palutikof, P. J. van der Linden, and C. E. Hanson, eds. Climate Change 2007: Impacts, Adaptation and Vulnerability. Contribution of Working Group II to the Fourth Assessment Report of the Intergovernmental Panel on Climate Change, pp. 273–313. Cambridge, UK: CUP. Cited in World Food Programme 2009, pp. 69.
Erda, L., 1996. Agricultural Vulnerability and Adaptation to Global Warming in [the People’s Republic of] China. Water, Air, and Soil Pollution. 92 (1–2). pp. 63–73.
Fane, G., and P. Warr. 2009. Indonesia. In K. Anderson and W. Martin, eds. Distortions to Agricultural Incentives in Asia. Washington DC: World Bank. http://siteresources.worldbank.org/INTTRADERESEARCH/Resources/544824-1146153362267/Asia_e-book_0209.pdf
Fischer, G., M. Shah, and H. Velthuizen. 2002. Climate Change and Agricultural Vulnerability. Vienna: International Institute for Applied Systems Analysis.
Food and Agriculture Organization of the United Nations (FAO). 2003. Anti-Hunger Programme. A Twin-Track Approach to Hunger Reduction: Priorities for National and International Action. Rome: FAO. ftp://ftp.fao.org/docrep/fao/006/j0563e/j0563e00.pdf

References
99
______. 2006. The Double Burden of Malnutrition: Case Studies from Six Developing Countries. Rome: FAO. ftp://ftp.fao.org/docrep/fao/009/a0442e/a0442e00.pdf
______. 2011. Mapping Supply and Demand for Animal-source Foods to 2030, by T. P. Robinson and F. Pozzi. Animal Production and Health Working Paper. No. 2.Rome: FAO.
______. 2012. The State of Food Insecurity in the World. Rome: FAO. http://www.fao.org/docrep/016/i3027e/i3027e.pdf
______. FAO Food Price Index. World Food Situation. http://www.fao.org/worldfoodsituation/foodpricesindex/en/ (accessed 15 April 2013).
______. FAO statistical database (FAOSTAT), Arable land data. http://faostat.fao.org/site/377/default.aspx#ancor (accessed 7 May 2013).
______. FAOSTAT, Food Balance Sheets. http://faostat.fao.org/site/368/default.aspx#ancor (accessed 10 April 2013).
______. FAOSTAT, Food Security Indicators. http://www.fao.org/economic/ess/ess-fs/ess-fadata/en/ (accessed 23 April 2013).
______. FAOSTAT, Population data. http://faostat.fao.org/site/550/default.aspx#ancor(accessed 13 June 2013).
______. FAOSTAT, Primary crops production data. http://faostat.fao.org/site/567/default.aspx#ancor (accessed 18 June 2013).
______. FAOSTAT, Primary livestock production data. http://faostat.fao.org/site/569/default.aspx#ancor (accessed 18 June 2013).
Foster, G., and S. Rahmstorf. 2011. Global Temperature Evolution 1979–2010. Environmental Research Letters. 6 (4). 044022.
Gilbert, C. 2011. Food Reserves in Developing Countries: Trade Policy Options for Improved Food Security. Issue Paper No. 37. Geneva: International Center for Trade and Sustainable Development.
Gilligan, D., J. Hoddinott, N. Kumar, and A. Taffesse. 2009. Can Social Protection Work in Africa? Evidence on the Impact of Ethiopia’s Productive Safety Net Programme on Food Security, Assets and Incentives. http://papers.ssrn.com/sol3/papers.cfm?abstract_id=1457172
Godfray, H., J. Beddington, I. Crute, L. Haddad, D. Lawrence, J. Muir, J. Pretty, S. Robinson, S. Thomas, and C. Toulmin. 2010. Food Security: The Challenge of Feeding 9 Billion People. Science. 327 (5967). pp. 812–818.
Grilli E., and M. Yang. 1988. Primary Commodity Prices, Manufactured Goods Prices, and the Terms of Trade of Developing Countries: What the Long Run Shows. The World Bank Economic Review. 2 (1). pp. 1–47.
Gustavsson, J., C. Cederberg, U. Sonesson, R. van Otterdijk, and A. Meybeck. 2011. Global Food Losses and Food Waste: Extent Causes and Prevention. Study conducted for the International Congress SAVE FOOD! at Interpack Düsseldorf, Germany. Rome: FAO. http://www.fao.org/docrep/014/mb060e/mb060e00.pdf

References
100
Haile, M., and L. Bydekerke. 2012. Improving Food Security Risk Management for Sustainable Development. In C. Ghenai, ed. Sustainable Development – Education, Business and Management – Architecture and Building Construction – Agriculture and Food Security. Shanghai, PRC: InTech.
Headey, D. 2011. Rethinking the Global Food Crisis: The Role of Trade Shocks. Food Policy.36 (2). pp. 136–146.
Headey, D., and S. Fan. 2008. Anatomy of a Crisis: The Causes and Consequences of Surging Food Prices. Agricultural Economics. 39 supplement. pp. 375–391.
Himanshu. Forthcoming. Poverty and Food Security in India. ADB Economics Working Paper. Manila: ADB.
Hoddinott, J., and Y. Yohannes. 2002. Dietary Diversity as a Household Food Security Indicator. Washington, DC: Food and Nutrition Technical Assistance Project, Academy for Educational Development.
Iglesias. A., L. Erda, and C. Rosenzweig. 1996. Climate Change in Asia: A Review of the Vulnerability and Adaptation of Crop Production. Water, Air and Soil Pollution. 92 (1–2). pp. 13–27.
Intergovernmental Panel on Climate Change (IPCC). 2000. IPCC Special Report on Emissions Scenarios. Summary for Policymakers: Emissions Scenarios. http://www.ipcc.ch/pdf/special-reports/spm/sres-en.pdf
______. 2007a. Climate Change 2007: Synthesis Report. Contribution of Working Groups I, II and III to the Fourth Assessment Report of the Intergovernmental Panel on Climate Change [Core Writing Team, R. K. Pachauri, and A. Reisinger. (eds.)]. Geneva: IPCC. http://www.ipcc.ch/pdf/assessment-report/ar4/syr/ar4_syr.pdf
______. 2007b. Climate Change 2007: The Physical Science Basis. Contribution of Working Group I to the Fourth Assessment Report of the Intergovernmental Panel on Climate Change [S. Solomon, D. Qin, M. Manning, Z. Chen, M. Marquis, K.B. Averyt, M. Tignor and H.L. Miller (eds.)]. Cambridge and New York: Cambridge University Press. http://www.ipcc.ch/pdf/assessment-report/ar4/wg1/ar4_wg1_full_report.pdf
Jha, S., D. Roland-Holst, and S. Sriboonchitta. 2010. Regional Trade Opportunities for Asian Agriculture. ADB Economics Working Paper Series No. 191. Manila: ADB.
Jha, S., A. Kotwal, and B. Ramaswami. Forthcoming. The Role of Social Safety Nets and Food Programs. ADB Economics Working Paper. Manila: ADB.
Jha, S., K. Kubo, and B. Ramaswami. Forthcoming. Exogenous Shocks, Policy Responses and Stability: Some Evidence from the Global Rice Market. ADB Economics Working Paper. Manila: ADB.
Kandlikar, M., and N. Ramankutty. 2012. Food, Feed and Fuel: Assessing the Impact of Competing Demand on Food Production and the Environment. Paper presented at the Symposium on Food Security in Asia and the Pacifi c: Key Policy Issues and Options. University of British Columbia, Vancouver. 17–18 September.
Larsen, J. 2012. Meat Consumption in [the People’s Republic of] China Now Double That in the United States. Plan B Updates. Earth Policy Institute. 24 April. http://www.earth-policy.org/plan_b_updates/2012/update102

References
101
Lee, B., F. Preston, J. Kooroshy, R. Bailey, and G. Lahn. 2012. Resources Futures: A Chatham House Report. London: The Royal Institute of International Affairs. http://www.chathamhouse.org/sites/default/files/public/Research/Energy,%20Environment%20and%20Development/1212r_resourcesfutures.pdf?bcsi_scan_e41ddc73166bc1eb=0&bcsi_scan_fi lename=1212r_resourcesfutures.pdf
Lee, H., and C. Park. Forthcoming. International Transmission of Food Prices and Volatilities: A Panel Analysis. ADB Economics Working Paper. Manila: ADB.
Lee, S., J. Lim, H. Lee, and C. Park. Forthcoming. Food Prices and Population Health in Developing Countries: An Investigation of the Effect of the Food Crisis Using a Panel Analysis. ADB Economics Working Paper. Manila: ADB.
Lin, J. 2008. Prepared remarks presented at the Roundtable on Preparing for the Next Global Food Price Crisis. Center for Global Development, Washington, DC. 17 October. http://siteresources.worldbank.org/DEC/Resources/84797-1104785060319/598886-1104852366603/599473-1223731755312/Justin-Lin-CGD-Remarks.pdf
Llanto, G. 2012. The Impact of Infrastructure on Agricultural Productivity. Discussion Paper Series No. 2012-12. Manila: Philippine Institute for Development Studies.
Lobell, D., U. Baldos, and T. Hertel. 2013. Climate Adaptation as Mitigation: The Case of Agricultural Investments. Environmental Research Letters. 8 (1). pp. 1–12.
Martin, W., and K. Anderson. 2012. Export Restrictions and Price Insulation during Commodity Price Booms. American Journal of Agricultural Economics. 94 (2). pp. 422–427.
McLaren C., T. Metz, M. van den Berg, R. Bruskiewich, N. Magor, and D. Shires. 2009. Informatics in Agricultural Research for Development. In D. L. Sparks, ed. Advances in Agronomy. Vol. 102. pp. 135–157.
Mendez, M., and B. Popkin. 2004. Globalization, Urbanization and Nutritional Change in the Developing World. electronic Journal of Agricultural and Development Economics. 1 (2). pp. 220–241. http://ageconsearch.umn.edu/bitstream/12001/1/01020220.pdf
Meyssignac, B., and A. Cazenave. 2012. Sea Level: A Review of Present-day and Recent-past Changes and Variability. Journal of Geodynamics. 58 (July): pp. 96–109.
Neufeld, L., J. Chowdhury, and M. Ruel. 2012. Strengthening Nutrition within the Food Security Agenda. Paper presented at the Symposium on Food Security in Asia and the Pacifi c: Key Policy Issues and Options. University of British Columbia, Vancouver. 17–18 September.
Organisation for Economic Co-operation and Development (OECD)-FAO. 2013. OECD-FAO Agricultural Outlook, 2013-2022: Highlights. http://www.oecd.org/site/oecd-faoagriculturaloutlook/highlights-2013-EN.pdf
Parry, M., C. Rosenzweig, A. Iglesias, M. Livermore, and G. Fischer. 2004. Effects of Climate Change on Global Food Production under SRES Emissions and Socio-economic Scenarios. Global Environmental Change. 14. pp. 53–67.
Pfaffenzeller, S., P. Newbold, and A. Rayner. 2007. A Short Note on Updating the Grilli and Yang Commodity Price Index. The World Bank Economic Review. 21 (1). pp. 151–163.

References
102
Piao, S., P. Ciais, Y. Huang, Z. Shen, S. Peng, J. Li, L. Zhou, H. Liu, Y. Ma, Y. Ding, P. Friedlingstein, C. Liu, K. Tan, Y. Yu, T. Zhang, and J. Fang. 2010. The Impacts of Climate Change on Water Resources and Agriculture in [the People’s Republic of] China. Nature. 467 (7311). pp. 43–51.
Pinstrup-Andersen P., and S. Shimokawa. 2007. Rural Infrastructure and Agricultural Development. In F. Bourguignon and B. Pleskovic, eds. Annual World Bank Conference on Development Economics—Global 2007: Rethinking Infrastructure for Development. Washington, DC: World Bank.
Qamar, M. 2006. Agricultural Extension in Asia and the Pacifi c: Time to Revisit and Reform. In V. P. Sharma, ed. Enhancement of Extension Systems in Agriculture: Report of the APO Seminar on Enhancement of Extension Systems in Agriculture held in Pakistan, 15–20 December 2003. Tokyo: Asian Productivity Organization (APO). http://www.apo-tokyo.org/publications/fi les/agr-16-ees.pdf
Reardon, T., B. Minten, K. Chen, and L. Adriano. Forthcoming. The Transformation of Rice Value Chains in Bangladesh and India: Implications for Food Security. ADB Economics Working Paper. Manila: ADB.
Rosegrant, M. 2013. Climate Change and Agriculture in the Asia-Pacifi c Region: Impacts and Policy Responses. Paper presented at the Australian Agricultural and Resource Economics Society Annual Conference on Economics, Agriculture, and Natural Resources in the Asian Century. Sydney. 5–8 February.
Rosegrant, M., X. Cai, and S. Cline. 2002. World Water and Food to 2025: Dealing with Scarcity. Washington, DC: International Food Policy Research Institute. http://www.ifpri.org/sites/default/fi les/pubs/pubs/books/water2025/water2025.pdf
Sillmann, J., V. V. Kharin, F. W. Zwiers, X. Zhang, and D. Bronaugh. 2013. Climate Extremes Indices in the CMIP5 Multimodel Ensemble: Part 2. Future Climate Projections. Journal of Geophysical Research: Atmospheres. 118 (6). pp. 2473–2493.
Sombilla, M., D. Mapa, and S. Piza. Forthcoming. Overcoming Critical Constraints to Sustaining Agricultural Productivity Growth in Asia and Pacifi c. ADB Economics Working Paper. Manila: ADB.
Sulaiman V., A. Hall, and R. Raina. 2006. From Disseminating Technologies to Promoting Innovation: Implications for Agricultural Extension. Paper prepared for the SAIC Regional Workshop on Research-Extension Linkages for Effective Delivery of Agricultural Technologies in SAARC Countries. 20–22 November.
Suwannarat, P. 2011. Agricultural Productivity and Poverty Reduction in Thailand. http://www.bot.or.th/Thai/AboutBOT/project/Doclib_Settha_BE_2554/B_Doc_Solace2_2554.pdf
Thomas, D., J. Strauss, and M. Henriques. 1991. How Does Mother’s Education Affect Child Height? The Journal of Human Resources. 26 (2). pp. 183–211.
Timmer, C. P. 2010. Behavioral Dimensions of Food Security. Proceedings of the National Academy of Sciences (PNAS), Agricultural Development and Nutrition Security Special Feature. 109 (31). pp.12315–12320.

References
103
______. 2012a. Coping with Climate Change: A Food Policy Approach. Paper presented at the Australian Agricultural and Resource Economics Society Annual Conference on Economics, Agriculture, and Natural Resources in the Asian Century. Sydney. 5–8 February.
______. 2012b. The Dynamics of Food Security in Asia: Structural Transformation and the Changing Role of Rice. Background paper for a Workshop on Broad-based Strategies for Food Security and the Changing World Food Markets, organized by IFAD and the Department of Agriculture. Quezon City, the Philippines. 14 March.
Tomkins, A., and F. Watson. 1989. Malnutrition and Infection. ACC/SCN State-of-the-Art Series. Nutrition Policy Discussion Paper No. 5. Geneva: World Health Organization.
Uathaveekul P. 2011. Harnessing the Potential of Smallholder Farm Organizations: Thailand’s Swift Company. In Food for All: Investing in Food Security in Asia and the Pacifi c—Issues, Innovations, and Practices. Manila: ADB. http://www.adb.org/sites/default/fi les/food-for-all.pdf
United Nations (UN). 2012. World Urbanization Prospects: The 2011 Revision. New York: UN. http://esa.un.org/unup/CD-ROM/Urban-Rural-Population.htm
______. 2013. A New Global Partnership Report: Eradicate Poverty and Transform Economies through Sustainable Development. The Report of the High-Level Panel of Eminent Persons on the Post-2015 Development Agenda. New York: UN. http://www.post2015hlp.org/wp-content/uploads/2013/05/UN-Report.pdf
______. The 2012 Revision of World Population Prospects. New York: UN. http://esa.un.org/wpp/Excel-Data/population.htm (accessed 15 June 2013).
United Nations Economic and Social Commission for Asia and the Pacifi c (UNESCAP). 2011. Statistical Yearbook for Asia and the Pacifi c 2011. Bangkok: UNESCAP. http://www.unescap.org/stat/data/syb2011/ii-environment/water-availability-and-use.asp
______. 2012. Statistical Yearbook for Asia and the Pacifi c 2012. Bangkok: UNESCAP. http://www.unescap.org/stat/data/syb2012/
______. 2013. Building Resilience to Natural Disasters and Major Economic Crises.Bangkok: UNESCAP. http://www.unescap.org/idd/Pubs/ThemeStudy2013/ThemeStudy2013-full.pdf
United Nations Educational, Scientifi c and Cultural Organization (UNESCO). 2012. Managing Water Under Uncertainty and Risk. The 4th Edition of the UN World Water Development Report (WWDR4). Paris: UNESCO. http://unesdoc.unesco.org/images/0021/002156/215644e.pdf
Victoria, C., L. Adair, C. Fall, P. Hallal, R. Martorell, L. Richter, and H. S. Sachdev. 2008. Maternal and Child Undernutrition: Consequences for Adult Health and Human Capital. The Lancet. 371 (9609). pp. 340–357.
von Braun, J., and M. Torero. 2008. Physical and Virtual Global Food Reserves to Protect the Poor and Prevent Market Failure. IFPRI Policy Brief. 4. (June). Washington, DC: IFPRI. http://www.ifpri.org/pubs/bp/bp004.pdf
Warr, P. 2005. Food Policy and Poverty in Indonesia: A General Equilibrium Analysis. Australian Journal of Agricultural and Resource Economics. 49 (4). pp. 429–451.

References
104
______. 2008. World Food Prices and Poverty Incidence in a Food Exporting Country: A Multihousehold General Equilibrium Analysis for Thailand. Agricultural Economics. 39 (3). pp. 525–537.
______. 2010a. Indonesia. In K. Anderson, J. Cockburn, and W. Martin, eds. Agricultural Price Distortions, Inequality and Poverty. Washington, DC: World Bank. http://siteresources.worldbank.org/INTTRADERESEARCH/Resources/544824-1272467194981/Ag_Price_Distortions_Inequality_Poverty_0310.pdf
______. 2010b. Thailand. In K. Anderson, J. Cockburn, and W. Martin, eds. Agricultural Price Distortions, Inequality and Poverty. Washington, DC: World Bank. http://siteresources.worldbank.org/INTTRADERESEARCH/Resources/544824-1272467194981/Ag_Price_Distortions_Inequality_Poverty_0310.pdf
______. 2011. Food Security vs. Food Self-Suffi ciency: The Indonesian Case. The Indonesia Quarterly. 39 (1, First Quarter). pp. 56–71.
______. 2013. Agricultural Productivity and Poverty Reduction in Thailand. Mimeo. Australian National University.
Wesley, A., and M. Faminow. 2012. Research and Development and Extension Services. Paper presented at the Symposium on Food Security in Asia and the Pacifi c: Key Policy Issues and Options. University of British Columbia. Vancouver. 17–18 September.
Williams, J., and B. Wright. 1991. Storage and Commodity Markets. Cambridge, UK: Cambridge University Press.
World Bank. 2012. Turn Down the Heat: Why a 4°C Warmer World Must Be Avoided. Washington, DC: World Bank. http://documents.worldbank.org/curated/en/2012/11/17097815/turn-down-heat-4%C2%B0c-warmer-world-must-avoided
______. Development Prospects Group. http://go.worldbank.org/4ROCCIEQ50 (accessed 15 May 2013).
______. PovcalNet: an online poverty analysis tool. http://iresearch.worldbank.org/PovcalNet/index.htm?1 (accessed 23 April 2013).
______. World Development Indicators. http://data.worldbank.org/data-catalog/world-development-indicators (accessed 22 April 2013).
World Food Programme (WFP). 2009. Climate Change and Hunger: Responding to the Challenge. Rome: WFP. http://documents.wfp.org/stellent/groups/public/documents/newsroom/wfp212536.pdf
World Health Organization (WHO). 2010. Pacifi c Islanders Pay Heavy Price for Abandoning Traditional Diet. Bulletin of the World Health Organization. 88 (7). pp. 481–560. http://www.who.int/bulletin/volumes/88/7/10-010710/en/

105
List of Participants
Symposium on Food Security in Asia and the PacificLiu Institute for Global Issues, University of British Columbia
Vancouver, British Columbia, Canada17–18 September 2012
Name Affi liationPramod Aggarwal Consultative Group on International
Agricultural ResearchRoslina Ali Asia-Pacifi c Economic CooperationSiwan Anderson University of British ColumbiaWerner Antweiler University of British ColumbiaRick Barichello University of British ColumbiaAnjali Bohlken University of British ColumbiaMarc Blanchette Foreign Affairs, Trade and Development
CanadaEsteban Borromeo Asia-Pacifi c Economic CooperationGerard Brathwaite-Sturgeon Foreign Affairs, Trade and Development
CanadaDouglas Brooks Asian Development BankWittaya Chaisuwan Asia-Pacifi c Economic CooperationSeethapathy Chander Asian Development BankChris Charles University of British ColumbiaRamon Clarete University of the PhilippinesPeter Dauvergne University of British ColumbiaAdriaan de Jager University of British ColumbiaAnil Deolalikar University of California, RiversideSara Elder University of British ColumbiaMukesh Eswaran University of British ColumbiaPatrick Francois University of British ColumbiaPatty Gallivan University of British ColumbiaTim Green University of British ColumbiaSumeet Gulati University of British ColumbiaBarbara Hazzard US National Center for APECYingbin He Asia-Pacifi c Economic CooperationHimanshu Jawaharlal Nehru UniversityNgaio Hotte University of British Columbia

106
List of Participants
Name Affi liationDinh Thi Thanh Huyen Asia-Pacifi c Economic CooperationAlicia Ilaga Asia-Pacifi c Economic CooperationErizal Jamal Asia-Pacifi c Economic CooperationShikha Jha Asian Development BankMilind Kandlikar University of British ColumbiaSatish Karande Lokmangal College of AgricultureAshok Kotwal University of British ColumbiaHyun-Hoon Lee Kangwon National UniversityChuan-Chi Lin Asia-Pacifi c Economic CooperationNisha Malhotra University of British ColumbiaCarol McAusland University of British ColumbiaJeanette McHugh Foreign Affairs, Trade and Development
CanadaJudy McLean University of British ColumbiaRebecca Mellett Foreign Affairs, Trade and Development
CanadaJennifer Mohamed-Katerere International Union for the Conservation of
NatureSophia Murphy Institute for Agriculture and Trade PolicyMilind Murugkar Pragati AbhiyanPasinee Napombejra Asia-Pacifi c Economic CooperationLynnette Neufeld Micronutrient InitiativeYoshitaka Ota University of British ColumbiaCyn-Young Park Asian Development BankChris Parker Asia-Pacifi c Economic CooperationEsther Penunia Asian Farmers’ AssociationAlessandro Pio Asian Development BankBharat Ramaswami Indian Statistical InstituteThomas Reardon Michigan State UniversitySally Reay University of British ColumbiaScott Reynolds Asia-Pacifi c Economic CooperationPaul Samson Foreign Affairs, Trade and Development
CanadaTerre Satterfi eld University of British ColumbiaSusana Sirvas Cornejo Asia-Pacifi c Economic CooperationSean Smukler University of British ColumbiaMercedita Sombilla Southeast Asian Regional Center
for Graduate Study and Research in Agriculture
Rashid Sumaila University of British ColumbiaZaman Talukder Helen Keller International-CambodiaNan Shing Teo Asia-Pacifi c Economic Cooperation

107
List of Participants
Name Affi liationFrancisco Vial Asia-Pacifi c Economic CooperationJulie Wagemakers University of British ColumbiaPeter Warr Australian National UniversityAnnie Wesley International Development Research
CentreHannah Wittman University of British ColumbiaNalan Yuksel Foreign Affairs, Trade and Development
Canada

Food Security in Asia and the Pacific
This synthesis report is the result of close, collaborative research initiated by the Asian Development Bank in partnership with Foreign Affairs, Trade and Development Canada; the Asia-Pacific Economic Cooperation; and the Liu Institute for Global Issues at the University of British Columbia. Fourteen background papers were commissioned to investigate food security issues particularly pertinent for Asia and the Pacific. The report synthesizes and collates the primary findings from these papers to articulate key policy challenges and opportunities related to food security in the region.
About the Asian Development Bank
ADB’s vision is an Asia and Pacific region free of poverty. Its mission is to help its developing member countries reduce poverty and improve the quality of life of their people. Despite the region’s many successes, it remains home to two-thirds of the world’s poor: 1.7 billion people who live on less than $2 a day, with 828 million struggling on less than $1.25 a day. ADB is committed to reducing poverty through inclusive economic growth, environmentally sustainable growth, and regional integration.
Based in Manila, ADB is owned by 67 members, including 48 from the region. Its main instruments for helping its developing member countries are policy dialogue, loans, equity investments, guarantees, grants, and technical assistance.
Asian Development Bank 6 ADB Avenue, Mandaluyong City 1550 Metro Manila, Philippineswww.adb.org
Printed in the PhilippinesPrinted on recycled paper