food security for small farmers - actionaid
TRANSCRIPT

Food Security for Small Farmers
A study of public provisioning in Vietnam and India
Study Supported by

Food Security for Small FarmersA study of public provisioning in Vietnam and India
Study supported by
ActionAid Vietnam5th floor, VinaFor Building, 127 Lo Duc Street, Hanoi, VietnamActionAid IndiaR7 Hauz Khas Enclave, New Delhi 110017, India
ISBN 978-81-9269074-2First Published 2017
This work is licensed under a Creative Commons Attribution-NonCommercial-ShareAlike 4.0 International License. Provided they acknowledge the source, users of this content are allowed to remix, tweak, build upon and share for non-commercial purposes under the same original license terms.
Published by
Registered Office: 139, Richmond Road Bangalore - 560025 Executive Office: R7 Hauz Khas Enclave New Delhi 110017 Phone: +91-11-40640516 Telefax: +91-80-25586284 e-mail: [email protected]
Edited by: Punam Thakur Cover Design and Layout by: Mrityunjay Chatterjee Printed at

Research Team
Principal Researcher and Guide: Prof. Praveen Jha, Jawaharlal Nehru University, New Delhi
Research Associates: Mr Manish Kumar and Mr Amit Kumar, Ph.D. scholars, Jawaharlal Nehru University
Mr Nilachala Acharya Data Processing and Contribution to “Chapter 3: Assessment of Public Investment Priorities in Agriculture”
Coordination Team India: Mr P. Raghu and Mr Byomkesh Kumar Lall, Land and Livelihood Knowledge Activist Hub of ActionAid India. Mr G. Rajasekhar, Andhra Pradesh and Telengana Regional Office; Mr Aqeel Ahmad and Mr Rajan Singh, Uttar Pradesh and Uttarakhand Regional Office, Mr Saurabh Kumar, Bihar and Jharkhand Regional Office and Mr BN Durga, Odisha Regional Office, all of ActionAid India
Coordination Team Vietnam: Ms Nguyen Phuong Thuy and Ms Bui Ngoc Lien, ActionAid Vietnam
Field Data Collection and Coordination India:
Andhra Pradesh: Ms K Rajamma and Mr K. Gattappa, Nisarga Trust, Chittor Ms G. Rani and Mr P. Karunakar, Adoni Area Rural Development Initiatives Programme (AARDIP), Kurnool Ms S. Anseera and Mr G. Narayana, Human And Natural Resources Development Society (HANDS), Ananthpur
Uttar Pradesh: Mr Sidhgopal, Mr Rajeev Mishra, Mr Vinay Srivastava, Sai Jyoti Sansthan, Lalitpur
iv Research Team
Field Data Collection and Coordination India: Cont.
Jharkhand: Ms Premika Surin, Ms Indramani Kumari, Mr Mandip Singh, Mr Satyendra Kumar Singh, Mr Nanku Kumar Singh and Mr Arun Kandulna, Vikas Sahyog Kendra, Latehar
Odisha: Mr Fakira, Samuhik Marudi Pratikar Udyam, Padmapur (SMPUP), Bargarh
Mr Aditya Pratap Singhdeo, Nirman, Kandhamal Mr Jugal Kishore Ranjit, Dalit Adhikar Sangathana, Puri
Field Data Collection and Coordination Vietnam: Central Institute for Economic Management (CIEM), Vietnam

Foreword
ActionAid International is a global federation working in more than 40 countries with its headquarters in Johannesburg, South Africa. Action Aid India and Action Aid Vietnam are leading members of this global federation, which works with the vision to end poverty and hunger in the world. ActionAid aims to cre-ate a just social order with the participation of the most dispos-sessed, who are struggling to get the right to dignity and identity through democratic participation. In order to strengthen the grassroots work and to influence policies, ActionAid takes up research studies with the participation of civil society organisa-tions and community. Food Security for Small Farmers: A study of public provisioning in Vietnam and India is based on research that sought to understand the status of public provisioning in the agriculture sector and food security of smallholder farmers in India and Vietnam.
Inspite of the rate of increase in global food production being consistently higher than the rate of the growth of the glob-al population, there is a crisis of food security in a large number of developing countries. Out of nearly 800 million people who do not have enough food to lead a healthy life, the majority live in developing countries, and countries on the Asian continent account for two-thirds of these hungry people.
Eastern Asia and South Asia started with same number of undernourished people in 1990-92. The largest numbers of world’s undernourished people reside in South Asia (FAO, 2015). There are 194.6 million undernourished people in India, 15.2 per cent of the total population. East Asia is one of the most successful regions, which has reduced poverty and hunger significantly. However hunger is still prevalent in the region as 220 million people continue to be afflicted by hunger (IFPRI, 2014). The national poverty line in Vietnam has been reduced to 8.4 per cent by 2014, but Vietnam is still home to 11.5 million undernourished people, almost 14 per cent of the population (FAO, 2011).

vi Foreword
The main focus of this report is tracing the broad trends and patterns of public provisioning on agriculture sector in both the countries i.e. India and Vietnam, and comparing the same from the early 2000s, locating public provisioning for smallholder agricultures at the centre. The study tries to address issues within South and East Asia, and assess public policies pertaining to public investment in agriculture in India and Vietnam in particular.
It has been found that although the poverty has declined in the recent years, the incidence of food insecure people living in developing or least developed countries continues to be very high and majority of them reside in rural areas. Majority of these are dependent on agriculture and happen to be small and marginal farmers. Evidence suggest that the policies which favour increased public expenditure in agricultural sector will lead to equitable eco-nomic development and contribute significantly towards freedom from hunger and nutrition. So, the state has to expand its activi-ties to protect the interests of the smallholders and to make agri-culture more sustainable. Although, there are many policies and programmes for the agricultural sector, yet they are not adequate to address the problems of food security and hunger.
Findings from the field suggest that information on policies related to support price, subsidies, public procurement agency, credit support, extension services and government’s sup-port in case of natural calamity are not adequately available to smallholder farmers. The levels and trends related to public ex-penditure towards agricultural sector should be a matter of se-rious concern and due attention needs to be paid, particularly towards small and marginal holders who need a major policy thrust. Smallholders are more exposed to poverty and malnutri-tion. There are serious gaps both with the respect of backward and forward linkages in the overall public policy infrastructure that must be addressed.
All the households surveyed in Vietnam, except in Vinh Long province, are well below the international poverty line of US$ 1.25 per person per day. While in India, all surveyed house-holds in all states are well below the international poverty line of US$ 1.25 per person per day. It should also be noted that farm

Foreword vii
incomes are negative for two of the four provinces in Vietnam, and even non-farm income is meagre; similar findings are evi-dent in the case of India as well.
At the current juncture, when due to the ascendency of neo-liberal macroeconomic policy regime, smallholders are forced to compete in the global market and also facing the growing chal-lenges of climate change, the necessary protective mechanisms and policies have to be designed for their protection and sustenance of smallholders. ActionAid programmes of India and Vietnam commissioned this study and are publishing this book based on the findings to contribute towards a discussion in favour of public provisioning for the small holders and their food security.
We are thankful to the leadership and guidance of Professor Praveen Jha and to his research team, Mr Manish Kumar, Mr Amit Kumar, Ph.D. scholars from Jawaharlal Nehru University and Mr Nilachala Acharya, for their rigorous and meticulous work for the research.
Hoang Phuong Thao Country Director, ActionAid, Vietnam
Sandeep Chachra Executive Director, ActionAid India


Executive Summary
The world is facing a major crisis of food security in its most comprehensive sense. In fact, issues relating to hunger and food insecurity are chronic and different approaches have been adopt-ed to address them at different points in time. Food security, as defined by the World Food Summit (1996), is when all peo-ple at all times have access to sufficient, safe, nutritious food to maintain a healthy and active life. This has become a standard benchmark in any discussion on the subject. This definition ob-viously considers both physical and economic access to food to meet people’s dietary needs and preferences.
However, this definition is both conceptually and opera-tionally extremely complex. Relevant literature clearly demon-strates that despite the rate of increase in global food production being consistently higher than the rate of growth of the global population, there is a crisis of food security in many developing countries. In fact, increasing food production by raising produc-tivity with the use of new and advanced technologies could be one of the ways of addressing the problem of food insecurity. However, designing and implementing public policies to increase productivity alone cannot be effective in addressing this chronic issue if they neglect any one of the other dimensions of food security. So, there is a need for designing comprehensive public policies; this calls for effective implementation of such policies at all levels of governance with adequate public provisioning if the problem is to be addressed in a sustained manner.
The severity of the problem varies across different regions of the world and even within national boundaries. It is obvious that the crisis is acuter in the developing and least developed parts of the globe. Given the scale and intensity of food insecurity and hunger and their associated dimensions like malnutrition, economic loss and human well-being, various estimates are available in the public domain and in global policy discussions and dialogues which have been at the core of designing food security legislations. However, progress remains patchy when it comes to the most basic human needs, and the problem will continue to be serious in the future.

x Executive Summary
The least developed countries, particularly countries in the global South, have been worst affected with respect to most in-dicators of food insecurity, hunger and malnutrition. One of the reasons for this could be that these economies are largely domi-nated by agrarian classes with the overall population depending on the primary sector. Small and marginal holders largely make up agrarian communities in these countries with minimum public support being availed by them. Public support regarding public in-vestments/expenditure for backward and forward linkages is quite inadequate or even non-existent. Evidence suggests that budget-ary investments for agriculture and rural development crucially impact the overall growth of the economy, alongside ensuring agricultural development and reducing the incidence of absolute poverty. However, a preliminary analysis of available data across the countries shows that public support in terms of public expend-iture for agriculture and its allied activities is inadequate. Further, within overall public support for the agriculture sector, the priority of public expenditure towards small and marginal farmers seems to be quite inadequate. Hence, up-scaling public provisioning with a clear focus on smallholder agriculture is very important. Further, there is a need for reversing the macroeconomic policy regime that could help reduce hunger and malnutrition in a sustained manner. Targeted public investments in backward and forward linkages in the agriculture sector in these economies can greatly enhance the prospects of increasing productivity and food security; these will have to be aided by improvements in infrastructure and crop in-surance. Recent experience has shown that public provisioning in risk mitigation strategies was an important tool both in promoting economic growth and in ensuring that this growth contributed to a reduction in poverty and hunger.
Given this context, the present study focuses on tracing the broad trends and patterns of public provisioning in the agri-culture sectors in India and Vietnam. It also gives a comparison of the two since the early 2000s, locating public provisioning for smallholder agriculture at the centre. This includes a mapping of inter-temporal trends and patterns and relevant evidence of public investments in two regions (South and East Asia) on the Asian continent. The study assesses public policies pertaining

Executive Summary xi
to public investments in agriculture in India and Vietnam and develops a method of clubbing public investments and/or ex-penditure data for the agriculture sector specifically focusing on smallholder agriculture.
The study is based on interactions with 280 households in four different locations in India and with a similar number of households in four different locations in Vietnam. The sample households were selected based on their socioeconomic charac-teristics. The survey targeted only small and marginal landholder farmers. The study covers important aspects of public provision-ing for agriculture with a focus on smallholder farmers and its implications for food security.
From an analysis of existing literature and available data and also on the basis of our findings from the field survey it is evident that the state has to expand its activities to protect the interests of smallholders and to make agriculture more sustain-able. Although there are many policies and programmes for the agricultural sector, yet they are not adequate for addressing the problems of food security and hunger. For instance, it clearly emerges from our analysis that farm incomes were negative for two of the four provinces in Vietnam and even non-farm in-comes were meagre. We have similar findings in India as well. At the current juncture, when due to the ascendency of neo-liberal macroeconomic policy regimes, smallholders are forced to com-pete in global markets and they are also facing the growing chal-lenges of climate change, necessary protective mechanisms and policies have to be designed for their protection and sustenance.
It is clear from the findings of our field survey that infor-mation on policies related to support prices, subsidies, public procurement agencies, credit support, extension services and gov-ernment’s support in case of natural calamities are not adequately available to smallholder farmers. The levels and trends related to public expenditure towards the agricultural sector should be a matter of serious concern and due attention, particularly on small and marginal holders, needs a major policy thrust. Smallholders are more exposed to poverty and malnutrition. There are serious gaps with respect to both backward and forward linkages in the

xii Executive Summary
overall public policy infrastructure, which must be addressed.
All the households surveyed in Vietnam, except those in Vinh Long province, were well below the international poverty line of US$ 1.25 per person, per day. Thus, despite producing food, small and marginal farmers are not food secure. There should be public provisions to address the income poverty of smallholder farmers by strengthening the support price mecha-nism and taking other appropriate measures. Issues related to the use of firewood as cooking fuel is of serious concern in all provinces in Vietnam. Further, there is a need to invest in public transport so that the cost of transportation can be brought down. This will also be reflected in the cost of cultivation. Issues related to sanitation and drinking water facilities in Vietnam are also matters of serious concern and need to be addressed accordingly.
In India, all surveyed households in all four the states were well below the international poverty line of US$1.25 per person, per day. Most of the farmers sold their produce either in the local market or to middlemen, which obviously implies that the sys-tem of public price support is ineffective for them. To make the mechanism effective, there is an urgent need to strengthen public procurement agencies and improving their overall functioning. During the survey in India it was found that public irrigation sources were hardly available to smallholder farmers. There is a need to decrease farmers’ dependence on the monsoon. The government should invest in building required irrigation infra-structure. In areas where only groundwater irrigation is feasible, proper electrification and adequate electricity should be made available. Despite the government’s numerous financial inclusion provisions, formal sources of lending are not easily accessible for smallholder farmers. Further, it would be important to provide loans at concessional rates as recommended by several commis-sions. Good quality crop insurance systems for smallholder farm-ers is another significant area where due attention of the policy-makers is required. In India, smallholder farmers largely belong to socially deprived sections of society. Obviously, through better targeting of public policies at such farmers, the government can address their social, political and economic deprivations.
Executive Summary xiii
The use of firewood as cooking fuel is alarmingly high in Jharkhand, Odisha and Uttar Pradesh. The government should promote the use of efficient cooking fuel and make people aware of the health issues related to it. Many surveyed households in India used kerosene for lighting despite being electrified. There is a need to supply adequate electricity to villages that will reduce farmers’ dependence not only on kerosene for cooking but also for diesel pumps for irrigation.


Acknowledgements
This research report would not have been possible without the assistance and support of several individuals and civil society organisations. It merits mention at the outset that several con-sultations and workshops on the Agrarian Question in India that were organised in the recent past formed the basis for this piece of work. Thanks are also due to Books for Change for providing necessary support and guidance in the publication of this report.
Prof. Praveen Jha, Jawaharlal Nehru University, New Delhi coordinated the research study and we express immense gratitude to him for providing his unstinted support and guidance, right from designing the research framework to the finalisation of the research report. We are grateful to Manish Kumar and Amit Kumar, PhD scholars from Jawaharlal Nehru University who coordinated the study and Nilachala Acharya who supported the data processing and contributed to the chapter on investments in agriculture in India and Vietnam. All this could happen with the able assistance of Professor Praveen Jha throughout the study.
We are thankful to the various allied organisations and their staff members who helped us with data collection and field coordi-nation. These include Nisarga Trust, Chittor, Andhra Pradesh and staff members Ms K Rajamma and Mr K. Gattappa; Adoni Area Rural Development Initiatives Programme (AARDIP), Kurnool, Andhra Pradesh and their staff members Ms G. Rani and Mr P. Karunakar; Human And Natural Resources Development Society (HANDS), Ananthpur, Andhra Pradesh and their staff members Ms S. Anseera and Mr G. Narayana; Sai Jyoti Sansthan, Lalitpur, Uttar Pradesh and their staff members Mr Sidhgopal, Mr Rajeev Mishra and Mr Vinay Srivastava; Vikas Sahyog Kendra, Latehar, Jharkhand and their staff members Ms Premika Surin, Ms Indramani Kumari, Mr Mandip Singh, Mr Satyendra Kumar Singh, Mr Nanku Kumar Singh and Mr Arun Kandulna; Samuhik Marudi Pratikar Udyam, Padmapur (SMPUP), Bargarh, Odisha and Mr Fakira; Nirman of Kandhamal, Odisha and Mr Aditya Pratap Singhdeo; Dalit Adhikar Sangathana, Puri, Odisha

xvi Acknowledgements
and Mr Jugal Kishore Ranjit.
We are grateful to Central Institute for Economic Management (CIEM) Vietnam, who took the responsibility of data collection from the field in Vietnam.
From Land and Livelihood Knowledge and Activist Hub of ActionAid India, Mr P. Raghu and Mr Byomkesh Kumar Lall, and from ActionAid Vietnam, Ms Nguyen Phuong Thuy and Ms Bui Ngoc Lien coordinated with the field level researchers, con-cerned civil society organisations and the national research teams to complete the study. We are thankful to Mr Rajasekhar, Mr Aqeel, Mr Rajan Singh, Mr Saurabh and Mr Durga, programme persons of ActionAid India had coordinated the study with the project partners in four states of India -- Andhra Pradesh, Uttar Pradesh, Jharkhand and Odisha.
Ms Hoang Phuong Thao, Country Director, ActionAid Vietnam and Mr Sandeep Chachra, Executive Director, ActionAid India deserve special mention for their support and encouragement to the team.
Needless to add the study team is responsible for any re-maining gaps and shortcomings in this work.

Contents
Foreword v
Executive Summary ix
Acknowledgements xiv
1 Introduction, Scope, Objectives and Operational 1 Framework of the Study
1.1 Introduction 1
1.2 Extent of Hunger and Malnutrition in South 5 Asia and India
1.3 Extent of Hunger and Malnutrition in East 6 Asia and Vietnam
1.4 Purpose and Objectives of the Study 8
1.5 Research Questions 9
1.6 Scope, Operational Structure and 9 Methodology of the Study
1.7 Limitations of the Study 14
1.8 Structure of Book 15
2 Support for Small Holder Agriculture and its 17 Implication for Food Security
2.1 Food Security 17
2.2 Smallholders 19
2.3 Smallholders and Food Security 20
2.4 Public Investment in Agriculture in 21 Developing Countries
2.5 Smallholder Farming and Public Provisioning 24
2.6 East Asia 26
2.7 South Asia 57

xviii Contents
3 Assessment of Public Investment Priorities in 85 Agriculture
3.1 Introduction 85
3.2 Data Sources 91
3.3 Public Investments in Agriculture 92
3.4 Concluding Observations 117
4 Results from the Field Studies 119
4.1 Methodology 119
4.2 A Brief Profile of the Field 122
4.3 Survey Findings 129
5 Concluding Observations and Policy 157 Recommendation
5.1 Concluding Observation 157
5.2 Policy Challenges 161
Bibliography 165
List of Tables and Figures
List of Tables
Table 2.1: Agricultural land use pattern
Table 2.2: Food security status (1990 to 2016)
Table 2.3: Basic services (1990 to 2012)
Table 2.4: Food security status (1990 to 2016)
Table 2.5: GDP and basic services (1990 to 2013)
Table 2.6: Microcredit delivery in Vietnam (as of 2010)
Table 2.7: South Asian agricultural land
Table 2.8: Farming category in South Asia (according to size of holdings)
Table 2.9: Food security status (1990 to 2016)
Table 2.10: Basic public services (1990 to 2012)
Table 2.11: Food security status (1990 to 2016)
Table 2.12: GDP and basic services (1990 to 2013)
Table 3.1: Share of public spending on various sectors in total world GDP (1980-2012) (in per cent)
Table 3.2: Share of agricultural expenditure in agri-GDP, total ex-penditure and total GDP across regions of the world (1980-2012) (in per cent)
Table 3.3: Share of public spending on various sectors in South Asian countries in total GDP of the region (1980-2012) (in per cent)
Table 3.4: Share of agricultural expenditure in agri-GDP, total ex-penditure and total GDP across countries in South Asia (1990-2012) (in per cent)
Table 3.5: Share of public spending on various sectors in India’s total GDP (1980-2012) (in per cent)
Table 3.6: Share of various components in the agriculture sector (ratio to total expenditure) (in per cent)

xx List of Tables and Figures
Table 3.7: Combined budgetary transactions of the centre and the states-combined revenue and capital expenditure (exclud-ing loans) for the agriculture sector (in Rs 10 million)
Table 3.8: Share of various components within the agriculture and allied services and cooperation sector (in per cent)
Table 3.9: Share of agriculture expenditure in agri-GDP, total expenditure and total GDP across countries in East Asia and Pacific (1990-2012) (in per cent)
Table 3.10: Share of public spending on various sectors in Vietnam’s total GDP (1990-2012) (in per cent)
Table 4.1: Distribution of landholdings (in per cent)
Table 4.2: Distribution of plots of land and area
Table 4.3: Level of awareness and use of public provisioning (in per cent)
Table 4.4: Level of awareness and use of credit provisioning (in per cent)
Table 4.5: Average per capita income (per day in US$)
Table 4.6: Distribution of the households below per capita, per day income of US$ 1.25 (in per cent)
Table 4.7: Sources of energy
Table 4.8: Use of machines and implements by smallholders (in per cent)
Table 4.9: Social groups of surveyed households (in per cent)
Table 4.10: Smallholder farmers (in per cent)
Table 4.11: Land distribution as per social groups
Table 4.12: Operational or own land with surveyed households
Table 4.13: Area under different crop in different states (in hectares)
Table 4.14: Weekly per capita consumption of surveyed small-holders households (in kg)
Table 4.15: Weekly per capita consumption of average rural

List of Tables and Figures xxi
households as per NSS 2014 ( in kg)
Table 4.16: Surveyed smallholder households having con-sumption less than the NSS rural household consumption average (in per cent)
Table 4.17: Smallholder farmers aware of or used public provi-sions (in per cent)
Table 4.18: Awareness and used public provisioning
Table 4.19: Share of agricultural plots with different sources of irrigation (in per cent)
Table 4.20: Place of sale of food grains produced by small-holder farmers (in per cent)
Table 4.21: Average per capita, per day farm/non-farm income
Table 4.22: Share of households below an income of US$1.25 and Rs 27 per capita, per day (in per cent)
Table 4.23: Smallholder farmers’ sources of borrowing (in per cent)
Table 4.24: Smallholder farmers who used different techniques (in per cent)
Table 4.25: Smallholder households who used different energy sources (in per cent)
List of Figures
Figure 3.1: Share of public spending on various sectors in total world GDP (1980-2012) (in per cent)
Figure 3.2: Share of public spending on various sectors in South Asian countries in total GDP of the region (1980-2012) (in per cent)
Figure 3.3: Share of public expenditure towards the agriculture sector in India’s combined expenditure6 and GDP
Figure 3.4: Share of public spending on various sectors in East Asia and the Pacific countries in the region’s total GDP (1980-2012) (in per cent)


Introduction, Scope, Objectives and Operational Framework of the Study
1.1 Introduction
Widespread hunger and pervasive malnutrition have been persis-tent problems in a number of countries in the developing world and have attracted much attention in academic as well as policy discourses. There is no argument over the fact that the world is facing a prospective crisis with respect to food security in its comprehensive sense. In fact, issues relating to hunger and food insecurity are chronic and different approaches have been fol-lowed at different points of time to address them. According to the World Food Summit 1996 food security is when all peo-ple at all times have access to sufficient, safe, nutritious food to maintain a healthy and active life. This definition has become a standard benchmark in any discussion on the subject. This defi-nition obviously takes into account both physical and economic access to food in order to meet people’s dietary needs and their preferences. It is also clear from this definition that apart from the availability and affordability of adequate quantities of nutri-tious food, supplementary infrastructure for its absorption (for example, sanitation, water, medical care and relevant knowledge) should also be in place to ensure food security.
Typically in much of empirical and policy literature the adequate supply of average dietary energy supply is taken as the core indicator with regard to the availability, or otherwise, of food and by implication that of food (in) security. Going beyond this indicator, recent literature has also tried to examine a number of other relevant and measurable co-relates. For instance, The
Chapter 1

2 Food Security for Small Farmers
Food and Agriculture Organization’s (FAO) (2014) report on the ‘State of Food Insecurity’ (SoFI) in the world includes physi-cal access (road and rail density), economic access and indica-tors of vulnerability and shock (purchasing power of the masses at the lower end of the ladder and domestic food price indices, among others, the import dependency ratio, percentage of ir-rigated arable land, volatility of domestic food prices, per capita food production variability and the share of food expenditure of the poor). Sanitation facilities and access to safe drinking water are obvious indicators related to utilization and indicators such as depth of food deficit and the prevalence of food inadequacy (PoFI) are relevant in measuring the outcomes.
However, this definition is both conceptually and opera-tionally extremely complex. Relevant literature clearly demon-strates that in spite of the rate of increase in global food pro-duction being consistently higher than the rate of the growth of the global population, there is a food security crisis in a large number of developing countries. In fact, increasing food produc-tion by raising productivity with the use of new and advanced technologies could be one of the ways of addressing the prob-lem. However, designing and implementing public policies to increase productivity only cannot be effective in addressing this chronic issue if it neglects any one of other dimensions of food security. So there is a need for designing comprehensive public policies and calls for effective implementation of such policies, at all levels of governance, with adequate public provisioning could address the problem in a sustained manner.
Given the limited available resources, one of the most im-portant challenges before policymakers and development think-ers is how to feed the growing world population and bringing them under the food security net. As noted earlier, the issue of food security is complex and requires a careful analysis of the contemporary global food system, in particular the role of trade, finance capital and multinational corporations, responsibilities and functioning of national governments, agencies of communi-ties and class/caste/race/gender questions vis-à-vis farming, con-trol of agriculture and access to social protection measures.

Introduction, Scope, Objectives and Operational Framework of the Study 3
Further, the severity of the problem varies across different regions of the world and even within national boundaries and it is obvious that the crisis is more acute in developing and least de-veloped parts of the globe. A majority of the nearly 800 million people who do not have enough food to lead a healthy life1 live in developing countries. Countries in Asia continent account for two-third of these hungry people. Given the scale and intensity of food insecurity and hunger and its associated dimensions like malnutrition, economic losses and human well-being, various estimates are available in the public domain and global policy discussions and dialogues have been at the core of designing food security legislations. These estimates made by national govern-ments and various international institutions and agencies suggest that some progress has been made in recent years. However, with reference to the most basic human needs, the progress remains patchy and the problem will continue to be serious in the future.
Hunger and malnutrition have their own gender dimen-sions as 60 per cent of the world’s hungry are women. It is shock-ing that 50 per cent of expecting mothers in developing coun-tries lack accesses to adequate dietary care resulting in almost 0.24 million maternal deaths from childbirth annually.2 Due to inadequate food and nutrition for mothers, an estimated 146 million children, the most vulnerable ‘global citizens’ in develop-ing countries, face acute or chronic hunger and are under-weight (UNICEF, 2009). To put it starkly, hunger and its related disease lead to the loss of one child every 10 seconds.
The least developed countries, particularly countries in the global South, have been worst affected with respect to most in-dicators of food insecurity, hunger and malnutrition. One of the reasons for this could be that these economies are largely agrar-ian and the overall population depends on the primary sector for their livelihoods; the percentage of this, directly or indirectly, ranges between 60-80 per cent. Further, agrarian communities in these countries are largely dominated by small and marginal holders, with minimum public support being availed by them. Public support in terms of public investments/expenditure for
1 https://www.wfp.org/hunger/stats.2 http://www.thp.org/knowledge-center/know-your-world-facts-about-hunger-poverty/.

4 Food Security for Small Farmers
backward and forward linkages is quite inadequate or even non-existent. There is enough evidence to suggest that the growth in agriculture gross domestic product (GDP) has been at least twice as effective in poverty reduction as growth in other sectors.3 Evidence also suggests that budgetary investments in agriculture and rural development crucially impact the over-all growth of the economy, alongside ensuring agricultural development and reducing the incidence of absolute poverty. However, a preliminary analysis of available data across coun-tries shows that public support in terms of public expenditure for agriculture and its allied activities is inadequate. Further, within the overall public support to the agriculture sector, pri-ority of public expenditure towards small and marginal farm-ers seems to be quite inadequate. Hence, up-scaling of public provisioning with a clear focus on smallholder agriculture is very important. Further, there is a need to reverse the macro-economic policy regime, which could help in reducing hunger and malnutrition in a sustained manner. Targeted public in-vestments in backward and forward linkages in the agriculture sectors in these economies can greatly enhance the prospects of increasing productivity as well as food security aided by im-provements in infrastructure and crop insurance.
There is also a need for increased public investments to mitigate the most pressing risks facing smallholder families, including the effect of climate change, increasingly frequent weather based shocks and (in many areas) degradation and loss of natural resources, all of which make production even more difficult to control. The integrated world economies have added further shocks such as price volatility, which have made it dif-ficult for smallholders to know which crops they will be able to sell profitably or how much income they can reasonably expect to earn. Hence, smallholders urgently need a wide range of tools to help them deal with the various risks and uncertainties if they are to make investments that can enhance their livelihoods like adopting new technologies and switching to high value added activities. Recent experiences have shown that public provision-ing in risk mitigation strategies have been an important tool both
3 http://www.fao.org/investment-in-agriculture/en/.

Introduction, Scope, Objectives and Operational Framework of the Study 5
in promoting economic growth and in ensuring that this growth contributes to a reduction in poverty and hunger.
1.2 Extent of Hunger and Malnutrition in South Asia and India
Eastern Asia and South Asia started with the same number of undernourished people in 1990-92. The largest number of the world’s undernourished people resides in South Asia (FAO, 2015). Availability is the first step towards food security. South Asia has also recorded a small increase in the per capita food sup-ply in the last quarter century (FAO, 2015). This increase also in-cludes diversification in food consumption from traditional food to fisheries, livestock and vegetables (Joshi et al., 2004). Access is the second step towards food security. Access to food and in-come is correlated (although there are many other determinants of food access like social barriers). South Asia has higher rates of wasting among children than Eastern Asia. Children suffering from wasting are between 6 to 20 per cent in South Asia. The problem of food insecurity also depends on seasons. During the spring season, 24 per cent of the population suffers from poor diet and 33 per cent from calorie deficiencies (MoE Afghanistan, 2012). In Afghanistan, almost 80 per cent of the population lives in rural parts where food insecurity is higher than in urban areas. Poor dietary diversity affects 21 per cent of the rural popula-tion and 14 per cent of the urban population. Food insecurity is higher in the mountains and plateaus in Afghanistan.
Bangladesh also faces severe food insecurity despite having significant involvement in agriculture. Food insecurity is persis-tent in all types of households, whether they produce food or not because they are unable to afford minimum food items through their money incomes, own food production and other posses-sions necessary to acquire nutritious food (FAO, 2011).
Bhutan is very vulnerable in terms of food security. It im-ports a large portion of its food requirements from India. Maldives is completely import-dependent for food items. Food insecurity is also persistent in Nepal, not only in food deficit areas but also within marginalized section in areas with surplus food production.

6 Food Security for Small Farmers
Nepal is also a net food importer. In 2010, the national average of food deficit in the country was 14.3 per cent which varied between 79 per cent for hilly areas and 7 per cent in the plain region (FAO, 2010). Food insecurity is more in rural Pakistan than in the urban parts of the country. Food insecure people in rural as well as in urban parts mostly depend on the market for obtaining food. In 2010, all landless rural households (45 per cent of the total rural population) and 30 per cent of the landed households also relied on the market for food (Ahmad and Farooq, 2010).
There are 194.6 million undernourished people in India, that is, 15.2 per cent of the total population. The number of undernourished during 2000-02 was 185.5 million which in-creased to 189.9 million in a decade (FAO, 2015). Out of 119 countries in the world India is ranked 94 on the Global Hunger Index. According to the National Family Health Survey (NFHS) 2005–06, 56 per cent of the Indian women were anaemic, 30 per cent of the new born babies had low birth weight (LBW) and 47 per cent of the children were under-weight (MSSRF, 2008).
1.3 Extent of Hunger and Malnutrition in East Asia and Vietnam
The dependence of the East Asian economies on agriculture is very high and most of their populations reside in the rural areas. Only a few countries are developed while some are in transition. East Asia has grown the fastest in the world in recent decades. It is also one of the most successful regions which has reduced pov-erty and hunger significantly. As per an IFPRI report (2014) the Global Hunger Index (GHI) in the East Asian region reduced by 54 percentage points in its score. However, hunger is still preva-lent in the region as 220 million people continue to be afflicted by hunger (IFPRI, 2014).
In 2011, almost 13.5 per cent of Cambodia’s population lived below the national poverty line and almost 40 per cent of the children (under 5 years) were in the grip of chronic malnu-trition, 28 per cent were under-weight and also one out of five women was under-weight. There was a difference in the poverty rates prevailing in rural and urban areas.
Introduction, Scope, Objectives and Operational Framework of the Study 7
In Indonesia, only 8.6 per cent of the urban population is poor while this figure is almost 15 per cent in rural areas. In the Philippines, three out of every four people in the rural areas are poor. In Thailand 16 per cent of the population is undernour-ished (FAO, 2011) and 8 per cent of the population lives below the national poverty line.
Vietnam figures in the list of best performing nations on reducing poverty and it has achieved significant reductions in extreme poverty and hunger. It has achieved the Millennium Development Goal (MDG) before the deadline. Its national poverty line had reduced to 8.4 per cent by 2014.
During 1993 to 2008, expenditure based poverty fell from 58.1 per cent to 14.5 per cent, lifting millions of people out of poverty. In the following years, the poverty rate using national poverty line 2011-15, declined from 14.2 per cent in 2010 to 8.4 per cent in 2014. In spite of great achievements in poverty alleviation, Vietnam still faces many challenges. Poverty is still prevalent in large proportions in ethnic minority and rural areas. The average poverty rate for the non-Kinh minority ethnic group was 32.5 percentage points higher than that of the Kinh ethnic group and this gap reached 49.3 percentage points in 2012. Also the living standards of the ethnic minority poor were lower than that of majority ethnic (Kinh) groups between 1993 and 2012. The gap between the rural and urban poverty rate narrowed but it was still 16.7 per cent in 2012 (Socialist Republic of Vietnam, Country Report 2015).
Although Vietnam has transformed itself from being food deficient country to being the world’s second largest exporter of rice and huger has reduced considerably in the country the progress is not even across the different regions. Hunger is still prevalent in the north-central coast, in the north-west and in many provinces of the Central Highlands. As of 2013, around 15 per cent of the children (below 5 years) were malnourished and more than 25 per cent were stunted.

8 Food Security for Small Farmers
1.4 Purpose and Objectives of this Study
Given this context, the primary objective of the present study is tracing the broad trends and patterns of public provisioning in the agriculture sector in India and Vietnam and comparing the progress made since the early 2000s by locating public pro-visioning for smallholder agriculture at the centre. The study also includes a mapping of inter-temporal trends and patterns and relevant evidence of such public investments in two regions (South and East Asia) on the Asian continent. Since the study also addresses issues within South and East Asia, attempts are made to assess public policies pertaining to public investments in agriculture in India and Vietnam in particular. Given that the diversity and functioning of governments in both the countries are quite different and public expenditure data relating to pro-vincial/local governments in these two countries is not available in the public domain, the study tries to develop a method by clubbing public investments and/or expenditure data for the ag-riculture sector specifically focusing on smallholder agriculture.
The detailed objectives of the study are to:
• Analyse public policy priorities in general and policies relat-ing to public investments in the agriculture sector in select East and South Asian countries;
• Analyse public investment policies for smallholder agricul-ture and its outcomes for food security in general and for smallholder agriculture in particular;
• Map and analyse data on public investments in agriculture and for smallholder agricultural families;
• Define the effectiveness of policies and programmes towards support for small and marginal holders; and
• Develop an applicable method to collect data for public ex-penditure for the agriculture sector in both the countries.
Introduction, Scope, Objectives and Operational Framework of the Study 9
1.5 Research Questions
The research questions are:
1. What are the key features of public investments in agriculture in India and Vietnam vis-à-vis small and marginal farmers?
2. What are the characteristics, trends and patterns of pub-lic provisioning with particular emphasis on smallholder farmers?
3. Is farming by small and marginal farmers self-sufficient?
4. What is the food security status of small and marginal farm-ers in India and Vietnam?
1.6 Scope, Operational Structure and Methodology of the Study
1.6.1 Scope of the Study
With 60 per cent of the country’s labour force contributing 20 per cent to GDP in Vietnam, investments in agriculture are only over half the demand.4 Lack of a budget for agriculture results in backward facilities and technology, slows the expansion of pro-duction areas, limits the knowledge and skills of producers due to ineffective vocational training and there is less capital for produc-tion development. All these reasons lead to low quality and less competitive products in the international market.
Despite positive support from the government, some of the transnational agreements negatively affect the poor and the migrants when it comes to promoting a sustainable food system, natural resource management, resilient livelihoods and access to public healthcare and education services. A notable example is the Trans-Pacific Partnership (TPP), which currently involves negotiations among 12 countries, including Vietnam. According to agricultural experts, ‘TPP will have many impacts on agricul-tural products and farmers will be the most vulnerable. Vietnam has to open its market, remove all tariff lines (import duties)
4 http://www.panpacific.vn/can-tang-cuong-von-dau-tu-cho-nong-nghiep-nong-thon-vi11065.htm#.VbVvxvmt7Dc.

10 Food Security for Small Farmers
on agricultural products, while it does not have dis-advantageous position.’5 Market access to agricultural products is always a sensi-tive issue because it affects 70 per cent of the Vietnamese popu-lation who are farmers. Therefore, the ambition of reducing the tariff rate to ‘zero’ per cent under TPP will surely affect Vietnam’s agriculture and food security.6 Besides, notwithstanding ASEAN’s efforts under the Socio-Cultural Community there are emerging concerns that the pace of rural development and poverty reduction might be adversely affected once ASEAN economic integration is given more priority. Even for farmers who could benefit from en-hanced market access under economic integration, material risks persist as such benefits might not be long-lasting and/or the in-come gap between farmers and the rest of the economy (that is, industrial producers and service providers) may widen.
Indian farmers are facing extreme distress conditions be-cause of which some are also committing suicide. As per the National Crime Record Bureau (NCRB), more than 3 lakh farm-ers committed suicide between 1995 and 2014. Because of contin-uous losses, farmers are not interested in agriculture and many are leaving agriculture and migrating. Many fact finding reports have found that policy changes in relation to support prices, subsidies, opening markets for imports, credit support to farmers and exten-sion services have contributed to the crisis. Public investment in agriculture had declined from 4 per cent of GDP (Rs 70 billion in 1993-94 prices) in the early 1980s to 1.5 per cent (Rs 46 billion in 1993-94 prices) in early 2000 (Reddy and Reddy, 2007).
1.6.2 Operational Structure of the Study
The study includes desk as well as field research. The desk research begins with a theoretical background of the study based on sec-ondary literature. This part of the study also provides country specific literature surveys on South and East Asian countries; this is followed by a detailed discussion on India and Vietnam.
The study uses secondary data available through various sources including the World Bank and Food and Agricultural 5 http://vccinews.com/news_detail.asp?news_id=29977.6 http://english.vietnamnet.vn/fms/business/74950/would-tpp-be-good-or-bad-to-vietnam-s-agriculture-.html.

Introduction, Scope, Objectives and Operational Framework of the Study 11
Organization. Using these sources, the study presents a compre-hensive picture of South and East Asian countries with regard to their agricultural performance, land use for agriculture, food security indicators and public expenditure on agriculture. It also gives an in-depth analysis of India and Vietnam by using country-level data sources. For India, it uses data provided by the National Sample Survey Office (NSSO), Union Budget docu-ments and data from the Office of Comptroller and Auditor General of India, among others. Through this exercise, the study looks at the public support being provided to agriculture, par-ticularly to smallholder agriculture. Budgetary heads in both the countries are also looked at for a comparative analysis.
The field research is based on interactions with 280 house-holds in four different locations in India and with a similar num-ber of households in four different locations in Vietnam. The second part of the field research involved focus group discussions (FGDs). The survey was done on the basis of a detailed question-naire as well as a specific format for FGDs.
The field-based questionnaire focused on the nature of public provisioning and food security/insecurity.
1.6.3 Methodology Used
The study is based on interactions with 280 households in four different locations in India and a similar number of households in four different locations in Vietnam. In India, the survey was conducted in Uttar Pradesh, Odisha, Andhra Pradesh and Jharkhand. In Vietnam the survey was conducted in Thong Nong district in Cao Bang province, Quan Ba district in Ha Giang province, VungLiem district in Vinh Long province and Eakar district in Dak Lak province. Since agriculture related policies can be different for different states/provinces the survey covered different locations. Different locations captured the differences in their economic-physical attributes as well as differences in the nature of public provisioning. The survey had two parts: a house-hold survey and FGDs.
Since it was a sample survey households were selected on the basis of their socioeconomic characteristics. The survey

12 Food Security for Small Farmers
targeted only small landholder farmers. The surveyors prepared a list of the total number of households in the village with infor-mation about their social groups and landholdings. Local level government offices were helpful in collecting this data. After clubbing the social groups, the proportion of different social groups in the population was calculated for selecting the sample. The surveyors ensured that the same proportion in the sample and calculated the required number of households from different social groups in the sample to be surveyed. Finally, the surveyors picked only small/marginal holders (households with land size less than 2 hectares) from each social group.
The household survey was on the basis of a structured questionnaire. The survey covered the nature of public provision-ing and food security/insecurity which included the following broad aspects:
1. Nature and characteristics of public provisioning with par-ticular emphasis on smallholder farmers,
2. Support in terms of backward linkages such as credit, irriga-tion and other inputs, Support in terms of forward linkages such as marketing,
3. Operational holdings and land ownership of the households,
4. Financial conditions of the households, indebtedness etc. (public provisioning), and
5. Consumption patterns (food and non-food) of the households.
To cover these aspects, the questionnaire was divided into 13 blocks. Block 1 of the questionnaire focused on the religious, social and ethnic characteristics of the households. Block 2 fo-cused on household characteristics, which primarily enquired about ownership of the house and sources of energy for light-ing and cooking. Block 3 provided details such as age, gender, education levels and occupations of other household members. Block 4 is a set of descriptive questions which tried to assess in-formation from farmers regarding public provisioning. Block 5 is a second set of descriptive questions which tried to find out external support used by farmers during September 2014 and

Introduction, Scope, Objectives and Operational Framework of the Study 13
September 2015. Blocks 6 and 7 covered questions related to crop insurance and indebtedness of the households respectively. Block 8 concentrated on questions on land. It first listed all land connected with the households including own land, leased-in land, leased-out land, mortgaged-in land, mortgaged-out land and occupied land. The remaining parts of the block enquired in detail about all types of land. Block 9 looked at cropping pat-terns and agricultural production. It focused on sources of ir-rigation and ownership of sources of irrigation. It also assessed the net production of the households for the market. Marketing agency was also enquired into in this block. Block 10 looked at sources of income of the households other than agriculture. Block 11 tried to find out the food consumption of households and sources of obtaining these food items. Block 12 tried to find out major expenditures of the households. Block 13 assessed the level of technology used by the households for cultivation.
The survey covered small or marginal farmers which as per definition owned less than 2 hectares of land. The study also created a distinction between operational holding and ownership holding. If the cultivator of the land did not have registered own-ership of the land then such a holding was called operational. Apart from own land, operational holding includes all types of leased-in land, occupied land and mortgaged-in land. The study tries to capture the social dynamics of the big and small opera-tional holding families.
The second part of the village study was FGDs. There were two FGDs at each location, one with the elected head and officials or administrative staff members and the other with farm-ers (belonging to the same location). In the FGDs with farmers, the investigators tried to make the group as representative of the village as possible (keeping in mind the social groups as used in the household survey).
For discussions, the following themes were followed:
1. Social composition of the village (religious/ethnic/caste)
2. Topography and climatic conditions of the village (wheth-er coming under rain-fed/dry land/irrigated/ hilly/plain/

14 Food Security for Small Farmers
plateau/coastal/forest etc.)
3. Availability of basic facilities/services:
a. drinking water (sources available in the village),
b. hygiene and sanitation (assessment by the investigator),
c. electricity (how many houses were connected, average hours of electricity supply, use for agriculture),
d. healthcare centres (whether easily accessible, numbers of pri-mary health centres),
e. canals/wells,
f. level of literacy, and
g. transportation facilities and extension services.
4. Government support for these basic facilities
5. Did the government procure food grains from the farmers?
6. Where did the villagers sell their produce?
7. Distribution of food grains by the government to the needy during normal and adverse situations
8. Was it sufficient to meet their nutritional requirements?
9. What had been the government’s support (other than food grains) in case of a natural calamity (famine/flood)?
10. Formal/informal lending systems in the village
1.7 Limitation (s) of the Study
Though the study tries to capture the maximum possible infor-mation pertaining to smallholder farmers, their food security and public provisions, but it also has certain limitations. The proportion of different social or ethnic groups in the samples from different states or provinces does not necessarily reflect the general proportion of the social or ethnic groups in the state or province. This is because the survey focused only on smallholder households and then looked on the social group of the house-holds. The study concentrated only on small landholders in rural

Introduction, Scope, Objectives and Operational Framework of the Study 15
parts of both the countries. In India, considering the changes in agrarian issues with changes in the region, the selection of the villages was done in a way to capture the diversified nature of the countryside. Similarly, in Vietnam, the study covered some major provinces.
Despite having a small size of the sample, the study tries to incorporate issues pertaining to agriculture in general, and for smallholder farmers in particular. Although the main focus of the study is capturing public provisioning aspects in agriculture and food security of smallholder agricultural households, a survey of the village was also very useful in understanding the standard of living of the households.
The FGDs were also an attempt to address the shortcom-ings in the household survey. They also give a detailed view of public provisioning in rural economies which is not directly re-lated to agriculture but which certainly affects rural households.
1.8 Structure of the Book
The book is divided into five chapters. The first chapter sets the context with an introductory note. This chapter elaborates on the purpose, scope, objectives, methodology and limitations of the study. The second chapter provides an overview of the support for smallholder agriculture and its implications for food security. This chapter includes a brief discussion on food security and its evolu-tion as a terminology. Further, this chapter also discusses the exist-ing conditions of small and marginal farmers in East and South Asia, particularly focusing on public provisioning for small and marginal farmers. Chapter 2 also presents a detailed discussion and policy implications in Vietnam and India including on the existing food security situation, composition of the agrarian community and public expenditure in agriculture. The third chapter is based on secondary data and it maps the quantitative linkages between small/marginal farmers, public provisioning and food security. The fourth chapter discusses the methodology in detail and provides the findings from the field. The last chapter provides concluding remarks with policy recommendations for India and Vietnam.


Support for Smallholder Agriculture and its Implication for Food Security: An Overview
2.1 Food Security
The global debate on food security is almost a century old. Soon after World War I, in 1930 the League of Nations constituted a committee on nutrition and public health. The committee made a mention of the acute shortage of food in the poor countries in its report submitted in 1935. Later in 1945, the Food and Agriculture Organization (FAO) was established. After World War II, nations decided to strengthen their agricultural sectors in order to eliminate food insecurity. France started rationing basic food commodities while Canada introduced an agricultural support price system (Shaw, 2007).
FAO started the World Food Survey in 1946 which re-ported that by the end of 1945, one-third of the world’s popula-tion was under-nourished. In 1960, the United Nations (UN) established the World Food Programme (WFP) for transferring food from food surplus to food deficit people through the UN system. In 1972, due to climatic reasons there was a food cri-sis and many developed and developing countries became food importers.
Until 1981, food security was only considered from the ‘availability’ point of view. And in 1983, FAO adopted the resolution:
Chapter 2

18 Food Security for Small Farmers
...the ultimate objective of the world food security should be to ensure that all people at all times have both physical and economic access to basic food they need.
In 1996, FAO defined food security as:
Food security exists when all people, at all times, have physi-cal, and economic access to sufficient, safe and nutritious food which meets their dietary needs and food preferences for an active and healthy life.
In 2002, the term ‘social access’ was added in this definition (Simon, 2012).
Poverty, hunger and malnutrition are still among the seri-ous challenges that the world community is facing. Although a lot has been achieved in the recent past but there is still a long way to go. Out of the 129 countries monitored by FAO, a major-ity (72 countries) have achieved the Millennium Development Goal (MDG) of halving the incidence of under-nourishment by 2015. At the World Food Summit in 1996, countries commit-ted to halving the number of poor by 2015; this target has been achieved by 29 countries. Among developing countries poverty declined from 43 per cent in 1990 to 17 per cent in 2015 (The World Bank, 2015).
But this decline in poverty and under-nourishment has not been even across regions and countries. According to FAO (the State of Food and Agriculture) almost 795 million people in the world continued to suffer from hunger in 2015 and ap-proximately 1 billion people lived in extreme poverty according to the World Bank (2015). Most of these people lived in rural areas and engaged in agriculture for their incomes. Extreme pov-erty was more likely to be prevalent in rural households relying on agriculture than on other rural households. According to the World Bank (2015), by 2010 more than 78 per cent of the poor lived in rural areas.
Hunger and poverty have declined considerably in East Asia, the Pacific and South East Asia but the progress has been comparatively slow in South Asia and in sub-Saharan African countries. The share of population living in extreme poverty was almost 80 per cent in East Asia and the Pacific region in 1980

Support for Smallholder Agriculture and its Implication for Food Security 19
which reduced drastically to around 13 per cent in 2011; this fig-ure was above 50 per cent for South Asia in 1980 which declined to around 19 per cent in 2011.
However, despite this status of poverty and hunger, gov-ernment support in most of the countries has not been adequate. Almost 65 per cent of the world’s population did not receive any support from the government in terms of any social protection programmes/schemes (World Bank 2015e).
2.2 Smallholders
Within the agricultural sector, small-scale farmers have remained central to agricultural development and continue to play an im-portant role in promoting an ecologically rational and socially just food system. They produce both food and non-food products using limited available resources. Small-scale farmers and farming systems are extremely diverse as they are influenced by geographi-cal regions, national governance systems and management types.
The most common and widely accepted definition of a ‘smallholder’ is based on land size. In general, smallholder farm-ers are characterized by marginalization in terms of resources, ac-cessibility, information, technology, capital and assets, but there are great variations in the degree to which each of these applies (Murphy, 2012). FAO has adopted a 2 hectare threshold as a broad measure of a small farm.
Out of 575 million farms in the world, a majority (more than 80 per cent) are small farms. Almost 2.5 billion people are engaged in the agricultural production system, either as full time or part time famers, or as individuals in households who per-form farming activities. Out of these, 1.5 billion are smallholder households (IFPRI, 2014). Smallholder farmers produce most of the produce in developing countries and their contribution is growing in many cases. For instance, they produce almost 80 per cent of the food consumed in Asia and Africa. It should also be noted that approximately 75 per cent of the poor reside in rural areas and 60 per cent of them belong to smallholder households (IFAD, 2011; IFPRI, 2014).

20 Food Security for Small Farmers
2.3 Smallholders and Food Security
According to CFS (2013), most of the smallholders are food in-secure (in terms of quality diet and nutrition) because they do not have sufficient access and self-provision of food due to lack of income and deficient markets. A majority of them live in poverty which constraints the development of the economy as there is a demand constraint. Self-provision of food can play a vital role in providing a safety net to smallholders; it will also provide insur-ance against uncertainties in incomes.
Smallholders can specifically address a vital aspect of well-being very effectively: nutrition. Smallholder farming can also impact human nutrition by making available a variety of food in required quantities to enable all household members to eat a nutritionally adequate diet. Sustained and higher yields may increase households’ access to a larger food supply. Availability of nutritious food can be increased by introducing new crops and promoting home gardens at the household and community levels (Faber and Wenhold, 2007; FAO, 1997).
Smallholder farmers constitute a majority of the world’s under-nourished people despite their huge importance in global and regional food production. Most of the smallholders live in absolute poverty (IFAD, 2011). Not many studies on the link be-tween agriculture and poverty recognize the role of smallholder families, but the fact that they constitute a large proportion of the world’s poor is sufficient to show that their development will help in addressing hunger and poverty.
Most of the small farmers are confined to infertile soils and decreasing plot sizes, which forces many of them to migrate to cities. This is a serious threat to food security and food sov-ereignty as the labour created on large farms is not sufficient to compensate for the livelihoods of all the smallholder farmers. Also declining per capita land availability, particularly in densely populated areas is threatening the ability of the remaining land to provide sufficient livelihoods (IFAD and UNEP, 2013).
The globalization of food systems has forced smallhold-ers to bear the burden of unpredictable price fluctuations. The

Support for Smallholder Agriculture and its Implication for Food Security 21
impacts of such shocks vary depending on the type of crops grown, pattern of consumption, level of specialization, function-ing safety nets and national trade policies (Godfray et al., 2010; Swinnen, 2010).
Smallholders cannot wait for higher prices in the market to sell their produce; in need of immediate cash they have to sell their produce (and sometimes also their private assets) at lower prices. This situation pushes them into poverty and it becomes difficult for them to escape from it (Deaton, 1991). At the same time, they face challenges as producers with limited resources for enhancing productivity and taking advantage of higher prices (FAO, 2011) and they are not able to afford expensive imported food when their crops fail due to natural calamities (drought, pests and the like).
Damages after a harvest reduce incomes and affect the availability of food grains thus affecting food security and the po-tential of taking advantage of better prices for the produce. Rural infrastructure plays a crucial role in ensuring access to markets and controlling the prices of the produce. If the produce cannot reach the market in time then there is no point in increasing productivity for the market.
There is ample evidence to suggest that if smallholders are adequately supported by public policy and investments then they can play a major role in addressing issues of food security, food sovereignty, growth of the economy, employment generation, poverty reduction and sustainable use of biodiversity and natural resources while preserving cultural heritage (HLPE, 2013).
2.4 Public Investments in Agriculture in Developing Countries
Developing agriculture is essential for the growth of an economy, food security, poverty reduction and environmental sustain-ability in many parts of the world, especially in less developed countries tagged as agrarian economies. Agriculture as a sector still comprises a significant share of overall growth and house-hold incomes and provides essential food security in many of the poorest countries. Improved agricultural performance can lead

22 Food Security for Small Farmers
to dramatic improvements in the incomes of the poor, provide affordable food and also stimulate structural transformations.
Given that a majority of the world’s poor live in rural areas and depend on agriculture for their livelihood, decades of under-investment in this sector poses a threat to these communities with respect to sustainable occupations. It is well-recognized that in an era of finance capital, priority of public investments in the agriculture sector across the globe has seen a disappointing trend.
A study by Fan et al., (2008) concludes that agricultural spending as a percentage of agricultural GDP declined across all regions from 1980 to 2000 and was extremely low in developing countries as compared to developed countries. Developed coun-tries usually spent more than 20 per cent on agriculture whereas developing countries on average spent less than 10 per cent. The same study also highlights that agricultural expenditures in devel-oping countries increased in absolute terms. However, spending on agriculture did not keep up with the growth in the agricul-tural sector when measured with the growth in agricultural GDP.
Since the 1980s, public investments in and for agricul-ture have declined significantly. The fact that agriculture has been neglected at both national and international levels is now well- recognized. Since the mid-1980s most of the agricultural banks which were supported by governments have disappeared. There has also been a decline in the number of projects related to extension services and investments in infrastructure and applied research (CFS, 2013).
In 2005, the percentage of expenditure on agriculture was at the fourth position in terms of priority after education, social security and defence in Asia. During the same period, in sub-Saharan Africa agriculture stood fourth in allocation of public expenditure after education, health and defence. Agriculture’s percentage share in public expenditure in total spending in Latin America and the Caribbean countries was the second lowest after transportation and communication. It is also observed that spending on agriculture out of total spending in all these regions has shown a declining trend since the 1980s.

Support for Smallholder Agriculture and its Implication for Food Security 23
During the 1980s and early 1990s, Asia was spending more than twice as much as compared to sub-Saharan Africa on agricul-ture. However, in 2005 Asian countries spent as much on agricul-ture as sub-Saharan African countries (Brzeska and Fan, 2009).
There has been a global slowdown in the rate of accumu-lation of capital stocks in primary agriculture. Capital stock in agriculture grew annually at 1.1 per cent during 1975–90; this dropped to 0.5 per cent during 1991–2007. In a number of coun-tries like India and Thailand, investments in agriculture increased in absolute terms but declined as a share of total investments. In many developing countries public investment has been stagnating in rural areas and its share in total agricultural GDP and as a share of total government spending has fallen (Fan and Rao, 2003).
Given these indications and concerns about the role and effectiveness of public expenditure in stimulating sustained growth rates and poverty reduction, it is believed that developing the agri-culture sector requires a coordinated strategy that involves a sound policy environment and well-targeted major investments over time. It is worth highlighting that adequate public investments can result in increasing the growth rate of the agricultural sector and in making the latest technologies available to farmers. Apart from the productivity aspect, public investments in agricultural research and education can also be directed towards production technolo-gies that are environment friendly and sustainable. Hence, public investments in research and education can ensure high productiv-ity and better and cleaner technologies in agriculture.
Looking at public investments in agricultural research and education, especially the returns from such research and educa-tion which are especially important for low income developing countries to promote agricultural growth as well as growth of the overall economies it is found that low income countries have limited resources and need the highest yielding investments to boost their agricultural growth rates. In this context, studies by IFPRI suggest that for low income countries agricultural research continues to be the most productive investment for supporting the agricultural sector followed by education, infrastructure and input credits. It is also found that ‘disaggregating total

24 Food Security for Small Farmers
agricultural expenditures into research and non-research spend-ing reveal that research had a much larger impact on productivity than non-research spending’ (Fan and Rao, 2003). This clearly underlines the importance of investing in agricultural research and education. So, investments in this field can lead to better results in enhancing productivity. It is thus imperative that ad-equate investments are made in the agriculture sector in general and on research and education in particular to revive its growth path and for ensuring food and reducing hunger.
2.5 Smallholder Farming and Public Provisioning
Smallholders invest the most in smallholder farming (FAO, 2011). However, policies in developing countries prefer or fa-vour large-scale farming through measures such as subsidized credit, preferential access to land, tax exemptions, protection against subsidized, cheap imports and sufficient infrastructure provisions. Large farmers too reinforce the view that large farms are modern, technically advanced and efficient and they are well organized to be able to lobby for public support. In many cases, large farms are owned by national elites who have benefited from subsidies and other services provided by the state disproportion-ately (Wiggins, 2011).
On the other hand, smallholders often have less control over land and natural resources. Access to credit and their ability to invest in long-term sustainable practices can also be curtailed by weak tenure rights. Smallholders are seen as inadequate as they lack the capacity to invest and suffer from economies of scale and poor technical know-how (Collier, 2008).
Contrary to these beliefs there is ample literature which shows that smallholders demonstrate impressive productivity. For example, China has around 200 million small farms which are operating only on 10 per cent of the cultivable land that is globally available while they produce 20 per cent of the world food (HLPE, 2013). Many studies from around the world also show that small farms are more productive than large farms and the view that only large farms are good no longer holds (Wiggins, 2010).
Support for Smallholder Agriculture and its Implication for Food Security 25
While analysing the potential of small farms it has been found that they are more efficient as compared to large farms but are poor, suggesting diseconomies of scale (Schultz, 1964), that is why landowners are renting farms to smallholder opera-tors. Looking at the National Sample Survey of India (NSSO), small farms exhibit more productivity than large farms in the 21st century although they are in the widespread poverty (Chand et al., 2011). While addressing the board of governors in Nairobi the President of the World Bank, Robert S. McNamara, stated that the goal of eradicating absolute poverty and achieving sta-ble economic growth could not be achieved without investing in smallholder agriculture in developing countries.
There has been an increase in market protection for small-holders in industrialized countries since the 1980s but in devel-oping countries smallholders are still in a disadvantageous posi-tion because of international trade barriers and subsidies and this has made it difficult for them to compete in global markets. If their crops fail, they have to purchase food at very high interna-tional prices for their own consumption from the global market.
The disappointing rate at which agriculture has helped small farmers to move out of poverty is because of unbalanced growth strategies. Historically, development policies in develop-ing countries have been biased against the agriculture sector and within agriculture they have focused on large farms (Biodiversity, 2012). They have followed the strategies of developed countries without taking into consideration the different conditions and investment needs of smallholders. Structural adjustments in the 1980s led most of the developing countries to lower their sup-port to agriculture which has been increasing very slowly since then (IFAD and UNEP, 2013).
For developing smallholder farming there is a need to improve the efficiency of input use which is often limited. In some cases export oriented large enterprises have been favoured at the cost of smallholders who mainly produce for domestic markets. Major corporations and private sector companies too have been favoured when it comes to upgrading the standards and knowledge of the producers. This has not always benefited

26 Food Security for Small Farmers
small farmers. Only a miniscule section of smallholders has been able to participate in such schemes.
2.6 East Asia
Most of the East Asian economies are highly dependent on ag-riculture; here only a few countries are developed while a few others are in transition. The share of agriculture in total GDP has declined in recent years in all the countries as a result of an increase in the shares of manufacturing and the service sec-tor (ADB, 2006). However, the agriculture sector still remains crucial as it provides employment to the largest section of the population in East Asian countries. Agriculture’s share in GDP was 39 per cent in Cambodia, 17 per cent in Indonesia, 11.3 per cent in China, 18 per cent in Mongolia, 17 per cent in Thailand and 20 per cent in Vietnam (FAO, 2011).
The share of value added from agriculture was 10.8 per cent for East Asia and the Pacific while 54.4 per cent of the la-bour force was engaged in agriculture whereas for South Asia the share of value added from agriculture was 18.1 per cent with 50.5 per cent of the total labour force engaged in the sector (The World Bank, 2014).
Even after a decline in agriculture’s share in GDP, the over-all share of the agriculture sector in total employment is very high in the East Asian region. Out of the total employment in the economy, agriculture accounted for 64.22 per cent of the employment in Cambodia, 33.6 per cent in China, 38.9 per cent in Indonesia, 28.60 per cent in Mongolia, 11 per cent in Malaysia, 29 in Philippines, 32.20 per cent in Thailand and 48 in Vietnam.
The largest land area in East Asia is occupied by China with a land area of 9,596,960 sq. km followed by Mongolia (1,553,556 sq. km), Thailand (510,890 sq. km), Malaysia (328,657 sq. km), Vietnam (310,070 sq. km) and Philippines (298,170 sq. km). In China 54.7 per cent of the land is agricul-tural land which consists of 11.3 per cent arable land, 1.6 per cent land which is under permanent crops and the remaining is permanent pasture. In Mongolia, most of the 72 per cent of

Support for Smallholder Agriculture and its Implication for Food Security 27
agricultural land is permanent pasture. In Thailand out of the total agricultural land (41.2 per cent), 30.8 per cent is arable land, 8.8 per cent is under permanent crops and only 1.6 per cent is under permanent pasture. Forty-one per cent of the total land in Philippines is agricultural land, 20.6 per cent of this is arable land and 8.8 per cent is under permanent crops while the rest is permanent pasture. Vietnam has 34.8 per cent of its land as agricultural land out of which 20.6 per cent is arable land, 12.1 per cent is under permanent crops and 2.1 per cent is pas-ture land (Table 2.1).
Most of the population in East Asia lives in rural areas. According to FAO, in 2014 79 per cent of Cambodia’s popula-tion lived in rural areas while 45.03 per cent of China’s popula-tion, 47 per cent of Indonesia’s , 28.81 per cent of Mongolia’s, 25.25 of Malaysia’s, 50.45 per cent of Philippines’, 64.78 per cent of Thailand’s and 67.04 per cent of Vietnam’s population lived in rural areas (FAO, 2014).
East Asian countries were characterized by small peasantry with small and marginal farms accounting for more than 80 per cent of the total. For example, smallholders accounted for 98 per cent of the farms in China (ESAP, 2009) and Vietnam had 10 million small farms. In recent decades impressive growth in agricultural productivity has helped reduce poverty and hunger but despite improvements in food production, under-nutrition is still prevalent in East Asia.
A number of studies have established a positive relation-ship between agriculture and poverty reduction. For instance, a cross-country study estimated that for every 10 per cent increase in farm yields, there was a 7 per cent reduction in poverty in Africa and more than a 5 per cent reduction in Asia (Irz et al., 2001). Growth in manufacturing and services did not show a compara-ble impact on poverty reduction. Another cross-country study by Christiaensen et al., (2011) found that a 1 per cent increase in agricultural per capita GDP reduced the poverty gap five times more than a 1 per cent increase in GDP per capita in other sectors, especially among the poorest people. Agriculture’s potential to re-duce poverty far exceeds that of non-agricultural activities (Lipton, 2005), whether the comparison is within or between countries.

Table 2.1: Agricultural land use pattern
CountryTotal Land Area (sq. km)
Share of Agricultural Land (per cent)
China 9,596,960
11.3 Arable 1.6 Permanent Crop41.8 Permanent Pasture 54.7 Total
Cambodia 176,515
22.7 Arable 0.9 Permanent Crop8.5 Permanent Pasture 32.1 Total
North Korea 120,408
19.5 Arable 1.9 Permanent Crop0.4 Permanent Pasture 21.8 Total
South Korea 96,920
15.3 Arable 2.2 Permanent Crop0.6 Permanent Pasture 18.1 Total
Laos 230,800
6.2 Arable 0.7 Permanent Crop3.7 Permanent Pasture 10.6 Total
Cont.
A number of empirical works have also documented the vital importance of agriculture in the economic structures of many developing countries. They have also shown agriculture’s potential to play a transformative role in promoting broad-based growth and poverty reduction. Widely accepted and detailed analyses of the historical experience of agriculturally-dependent countries suggest that it will be very difficult to have any eco-nomic growth or diversification into industry in these countries without widespread fundamental improvements in agricultural
28 Food Security for Small Farmers
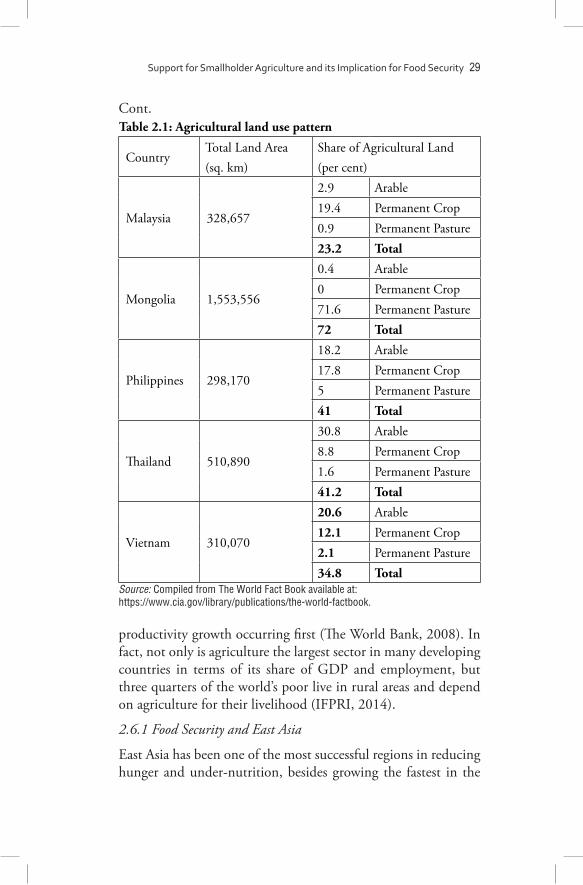
Support for Smallholder Agriculture and its Implication for Food Security 29
Table 2.1: Agricultural land use pattern
CountryTotal Land Area (sq. km)
Share of Agricultural Land (per cent)
Malaysia 328,657
2.9 Arable 19.4 Permanent Crop0.9 Permanent Pasture 23.2 Total
Mongolia 1,553,556
0.4 Arable 0 Permanent Crop71.6 Permanent Pasture 72 Total
Philippines 298,170
18.2 Arable 17.8 Permanent Crop5 Permanent Pasture 41 Total
Thailand 510,890
30.8 Arable 8.8 Permanent Crop1.6 Permanent Pasture 41.2 Total
Vietnam 310,070
20.6 Arable 12.1 Permanent Crop2.1 Permanent Pasture 34.8 Total
Source: Compiled from The World Fact Book available at: https://www.cia.gov/library/publications/the-world-factbook.
Cont.
productivity growth occurring first (The World Bank, 2008). In fact, not only is agriculture the largest sector in many developing countries in terms of its share of GDP and employment, but three quarters of the world’s poor live in rural areas and depend on agriculture for their livelihood (IFPRI, 2014).
2.6.1 Food Security and East Asia
East Asia has been one of the most successful regions in reducing hunger and under-nutrition, besides growing the fastest in the

30 Food Security for Small Farmers
world. Still the region faces a wide array of challenges and threats to its food security. Besides new emerging challenges like severe obesity rates, East Asia has not completely solved traditional food security issues such as hunger and under-nutrition, therefore there is need for these economies to formulate nutrition based food security strategies. According to the Global Hunger Index (GHI)1 2014, East Asia had successfully reduced 54 percentage points in its GHI score. However, more than 220 million (IFPRI, 2014) people in the region continued to be afflicted by hunger. It is increasingly difficult for East Asian countries to reach out to these remaining poor due to their complex and diversified food systems. Most of the East Asian economies are committed to im-plementing the ‘Zero Hunger Challenge’ at the national level (IFPRI, 2014) (Table 2.2).
In the last two decades there has been some progress with ref-erence to food security in the South East Asian region as the depth of food deficit, food inadequacy and prevalence of under-nourishment have declined continuously since the 1990s, while the percentage of arable land equipped with irrigation has in-creased, although at a slower pace from the 1990s till recent years. However, challenges remain and much has to be done to improve the food security situation in the region. Food deficit declined from 232 (kcal/capita/day) to 68 (kcal / capita / day) from 1990-92 to 2014-16 and food inadequacy declined from 40.1 per cent to 16.6 per cent during the same period. Under-nourishment was 30.6 per cent in 1990-92 which declined to 9.6 per cent in 2014-16. Arable land increased to 33 per cent in 2010-11 from 24 per cent in 1990-92.
In South Eastern Asia, the proportion of population hav-ing access to improved water sources increased from 71.2 per cent in 1990 to 89.1 per cent in 2012 while the share of the population having access to sanitation facilities increased con-siderably from 47.6 per cent in 1990 to 70.7 per cent in 2012.
In the last two decades there has been some progress with reference to food security in the South East Asian region
1 GHI is based on the proportion of under-weight children, proportion of under-nourished people and child mortality rates.
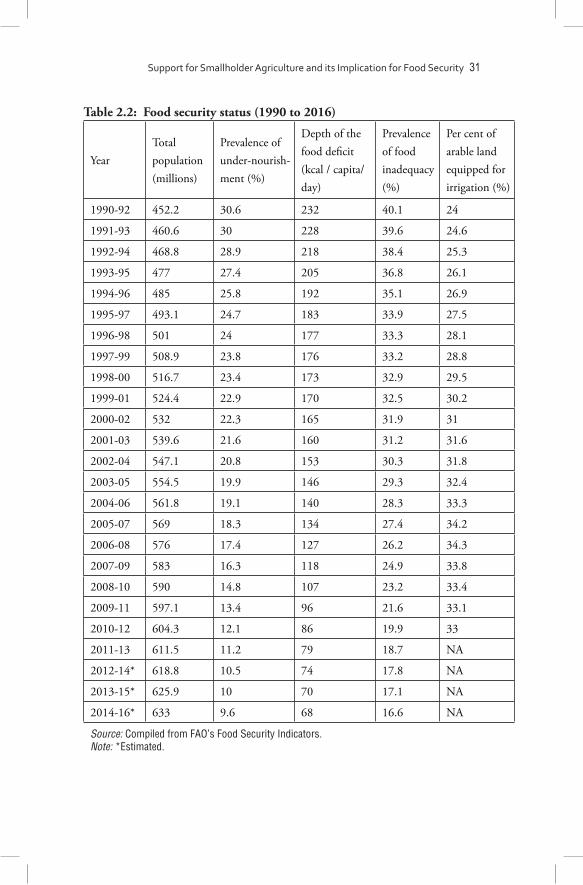
Table 2.2: Food security status (1990 to 2016)
YearTotal population (millions)
Prevalence of under-nourish-ment (%)
Depth of the food deficit (kcal / capita/day)
Prevalence of food inadequacy (%)
Per cent of arable land equipped for irrigation (%)
1990-92 452.2 30.6 232 40.1 24
1991-93 460.6 30 228 39.6 24.6
1992-94 468.8 28.9 218 38.4 25.3
1993-95 477 27.4 205 36.8 26.1
1994-96 485 25.8 192 35.1 26.9
1995-97 493.1 24.7 183 33.9 27.5
1996-98 501 24 177 33.3 28.1
1997-99 508.9 23.8 176 33.2 28.8
1998-00 516.7 23.4 173 32.9 29.5
1999-01 524.4 22.9 170 32.5 30.2
2000-02 532 22.3 165 31.9 31
2001-03 539.6 21.6 160 31.2 31.6
2002-04 547.1 20.8 153 30.3 31.8
2003-05 554.5 19.9 146 29.3 32.4
2004-06 561.8 19.1 140 28.3 33.3
2005-07 569 18.3 134 27.4 34.2
2006-08 576 17.4 127 26.2 34.3
2007-09 583 16.3 118 24.9 33.8
2008-10 590 14.8 107 23.2 33.4
2009-11 597.1 13.4 96 21.6 33.1
2010-12 604.3 12.1 86 19.9 33
2011-13 611.5 11.2 79 18.7 NA
2012-14* 618.8 10.5 74 17.8 NA
2013-15* 625.9 10 70 17.1 NA
2014-16* 633 9.6 68 16.6 NA
Source: Compiled from FAO’s Food Security Indicators. Note: *Estimated.
Support for Smallholder Agriculture and its Implication for Food Security 31

32 Food Security for Small Farmers
as the depth of food deficit, food inadequacy and prevalence of under-nourishment have declined continuously since the 1990s, while the percentage of arable land equipped with irrigation has increased, although at a slower pace from the 1990s till recent years. However, challenges remain and much has to be done to improve the food security situation in the region. Food deficit
YearPercentage of population with access to improved water sources
Percentage of population with access to sanitation facilities
1990 71.2 47.6
1991 71.9 49.1
1992 72.6 50.1
1993 73.4 51.2
1994 74 51.9
1995 74.9 52.9
1996 75.8 54.1
1997 76.8 55.3
1998 77.7 56.5
1999 78.6 57.7
2000 79.6 58.9
2001 80.5 60.1
2002 81.4 61.3
2003 82.3 62.3
2004 83.1 63.4
2005 84 64.3
2006 84.8 65.3
2007 85.6 66.2
2008 86.4 67.2
2009 87.1 68.1
2010 87.8 69.1
2011 88.5 69.9
2012 89.1 70.7
Table2.3: Basic services (1990 to 2012)
Source: compiled from FAO’s Food Security Indicators.
Support for Smallholder Agriculture and its Implication for Food Security 33
declined from 232 (kcal/capita/day) to 68 (kcal / capita / day) from 1990-92 to 2014-16 and food inadequacy declined from 40.1 per cent to 16.6 per cent during the same period. Under-nourishment was 30.6 per cent in 1990-92 which declined to 9.6 per cent in 2014-16. Arable land increased to 33 per cent in 2010-11 from 24 per cent in 1990-92.
In South Eastern Asia, the proportion of population having access to improved water sources increased from 71.2 per cent in 1990 to 89.1 per cent in 2012 while the share of the population having access to sanitation facilities increased considerably from 47.6 per cent in 1990 to 70.7 per cent in 2012 (see Table 2.3).
The situation regarding food security varies across coun-tries. For instance, as reported by the World Bank the poverty rate in Cambodia decreased from 53.2 per cent in 2004 to 20.5 per cent in 2011 and the country was ranked 138 out of 185 countries on HDI. However, a significant proportion of the population still remains very near the poverty line and a small shock of US$0.30 a day in income can increase poverty to 40 per cent. Production in Cambodia is sufficient to meet the require-ments of the population but access remains a serious challenge due to high incidence of poverty and limited social protection for the poor and vulnerable sections of the population. At the same time, as per the most recent Demographic Health Survey (CDHS, 2010) strong improvements have been reported over the years on most key health indicators. However, malnutrition rates in Cambodia remain stubbornly high; almost 40 per cent of the children (under 5) are chronically malnourished (stunted), over 28 per cent are under-weight and 10.9 per cent are acutely malnourished (wasted). One out of five women is under-weight.
Poverty rate in Cambodia has decreased from 53.2 per cent in 2004 to 20.5 per cent in 2011 as reported by the World Bank and it ranked 138 out of 185 countries in HDI. However a significant population still remains very near to poverty line and a small shock of US$0.30 a day in income can increase the pov-erty to 40 per cent. Production in Cambodia is sufficient to meet the requirements of its population but its access remains a serious challenge due to high incidence of poverty and limited social protection to the poor and vulnerable sections of the population.

34 Food Security for Small Farmers
Strong improvement has been reported over the years on most key health indicators, as per the most recent Demographic Health Survey (CDHS, 2010). However, malnutrition rates in Cambodia remain stubbornly high; almost 40 per cent of chil-dren (under 5) are chronically malnourished (stunted), over 28 per cent are underweight and 10.9 per cent are acutely malnour-ished (wasted). One out of five women is underweight.
Cambodia is highly vulnerable to natural disasters causing severe damage to livelihoods and rice crops across flood-affected provinces. Rising inequalities, landlessness and deterioration of common property resources have eroded the coping capacity of food-insecure people in recent years. Limited access to educa-tion and health services among the poor and low levels of in-vestments in public infrastructure perpetuate food insecurity and under-nutrition.
Poverty reduction efforts in Indonesia have shown mean-ingful progress, which has been in accordance with the MDGs. This is demonstrated by a reduction in the population below the national poverty line -- from 15.10 per cent in 1990 to 12.49 per cent in 2011 (FAO, 2011). However, the number of peo-ple living under the poverty line is approximately 30 million. Growth in the country’s GDP rate per worker strengthened from 3.52 per cent in 1990 to 5.04 per cent in 2011. Additionally, a reduction was also observed in the proportion of people suffer-ing hunger between 1989 and 2010 as the prevalence of under-5 children with low weight declined from 31 per cent to 17.9 per cent. However, poverty levels in rural areas continue to be higher as compared to urban areas. Changing this requires strengthened rural development. In 2012, the incidence of rural poverty was 14.7 per cent as compared to 8.60 per cent in urban areas.
Three out of every four people in the rural areas of the Philippines are poor. In Thailand 8 per cent of the population was poor and 16 per cent of the country’s population was under-nourished at the end of 2007 (FAO, 2011). Vietnam was home to 11.5 million under-nourished people or almost 14 per cent of its population (FAO, 2011).
Despite the green revolution and increase in per capita

Support for Smallholder Agriculture and its Implication for Food Security 35
incomes driven by globalization, most of these economies suffer from a serious problem of food insecurity. The main reasons for this include low or minimal coverage of social protection includ-ing education and healthcare for the poor, growing inequalities between the rich and the poor, high population growth rates, increasing world food prices and gender disparities.
Apart from this almost all the economies in East and South Asia are also facing a number of other concerns. For instance, land degradation has become a serious threat to agriculture and global estimates suggest that almost 57 per cent of the total dry-land area in China and India is degraded (UNEP, 2006)2. An increas-ing gap between demand and supply of water due to increased demand from agriculture, industrialization and urbanization has also emerged as a major concern. Agriculture is also suffering from multidimensional effects of globalization such as reduction in subsidies which makes agricultural products less competitive as compared to highly subsidized agriculture in developed countries.
Climate change has emerged as one of the most severe threats to agriculture in the East and South Asia and the Pacific. The Inter-Governmental Panel on Climate Change (IPCC) pro-jects that the frequency of natural hazards is going to increase globally. The increase in the frequency and magnitude of these hazards will have more impact on developing countries in gen-eral and on agricultural dependent countries in particular. These hazards may lead to food insecurity and worsening poverty, an increase in average temperatures, changes in precipitation pat-terns, an increase in sea levels and resulting inundation in coastal areas, increases in soil and water salinity and new and more favourable environments for pests and diseases; these will have ramifications for agricultural productivity and livelihoods. There are many technological and institutional options to help mitigate and adapt to climate change (ESAP, 2009).
2.6.2 Vietnam
Vietnam’s total land area is 330,951 sq. km, 2 per cent of which is mountains or hills while only 28 per cent is plain land. Vietnam’s territory spreads over a distance of 1,650 km; it also has a 3,444
2 http://www.unep.org/pdf/annualreport/UNEP_AR_2006_English.pdf.
36 Food Security for Small Farmers
km long coastline. The country is characterized by a subtropical climate in the north with four different seasons (spring, summer, autumn and winter) and in the south it is characterized by a tropical climate with two seasons (dry and wet). Vietnam is the 13th most populous country in the world with a population of 89.7 million and its population density is 270 persons/ sq. km. According to the World Bank’s classification Vietnam falls in the lower middle income category of countries which is a great im-provement for the country which was characterized as one of the poor nations in the mid-1980s (The World Bank, 2014).
As of 2011, Vietnam had 9,071 communes with 80,904 villages and hamlets. As compared to 2006 there was not much change in commune-level administrative units in these five years; 15.3 million households lived in the rural areas with 32 million people in the workforce. Vietnam and China saw significant rural transition by undertaking institutional reforms in the 1980s. There was a rapid reduction in poverty due to the initiation of institutional reforms in rural areas and in the agrarian sector in particular. The poverty rate in Vietnam fell from 57 per cent to 20 per cent over the period 1993 to 2004 (The World Bank, 2005). Growth in the rural economy was the reason for this re-duction in poverty. After Vietnam’s independence in 1954, land reforms and redistribution were the main agenda of Vietnamese leaders. North Vietnam initially had a ‘family farm economy’ where agricultural land was redistributed in a relatively more equitable manner across households. However, this did not last long. Several land reforms and redistribution programmes were introduced in South Vietnam in both the pre- and post-partition periods and at the time of a war against the United States.
Collectivized Farming
Communist leaders in North Vietnam initiated reforms in the late 1950s to collectivize agricultural production to trans-form the poor Vietnamese economy into a more socialist and modern one. Agricultural collectivization was in a cooperative form for agricultural production under state control. Vietnam followed the ‘Chinese model of collectivized farming’ where land was farmed by large brigades and run by cadres that assigned

Support for Smallholder Agriculture and its Implication for Food Security 37
the work, monitored progress and allocated shares of net output to people according to the amount of work done. Like China, Vietnam’s push for collectivization was a part of its political ide-ology. It was believed that collectivization would ensure a class-less society and it was the best possible way to finance industriali-zation as the centre would control the agricultural surplus.
Vietnam possessed both favourable political and economic factors to increase agricultural production under collectivization. The communist leaders believed that collective labour under col-lectivization would be allocated more rationally and it would generate economies of scale as compared to traditional house-hold based agriculture. Under collectivization, farmers were tied to cooperatives through residential registrations which linked cooperative membership with access to food and rural employ-ment and ensured a large, fixed supply of agricultural labour, even during periods of war.
Leaders of the Vietnamese Communist Party enacted the Land Reform Law in December 1953, where land from the rich peasants and landlords was redistributed among poor farmers who had insufficient land to support themselves. During the land reforms there was improvement in agricultural performance as annual per capita production of paddy increased by around 60 per cent from 1954 to 1958. Then the communist leaders launched Mutual Aid Teams (MATs) to consolidate farmers. Under the MAT system farmers had ownership and control over land but they were encouraged to assist each other by jointly working in each other’s fields during peak periods. Under MAT, farmers were compensated as a group for their pooled labour. However in mid-1965, the number of MATs peaked at over 150,000 but a year later they decreased to less than half because households started exchanging labour only during harvest.
After MAT’s failure, agricultural production cooperatives were created. Under the cooperatives farmers were obliged to provide collective labour and fulfil procurement quotas imposed by the central authority. However, several factors reduced farm-ers’ rewards for providing collective labour under cooperatives. Farmers were not rewarded on the basis of their skills or quality
38 Food Security for Small Farmers
of work but only on the time spent on collective labour because this was easy for cadres to administer. Therefore, the farmers had no incentive to perform better than the others. Moreover, dur-ing the 1960s, the purchase price of agricultural crops in North Vietnam was much less than their market prices; top bureaucrats were often corrupt and farmers were paid only after the coopera-tives had covered the cost of production and received state quo-tas. As a result, the per capita production of food grains declined steadily during the 1960s and 1970s.
In North Vietnam the state permitted households to pri-vately produce some crops on small plots of land, generally called ‘5 per cent’ plots. Soon the yields from these plots were two times higher than the yields from cooperative land. Farmers started avoiding collective labour and production on private land became an important source of income for them. During the war in South Vietnam, many male members of cooperatives in North Vietnam were shifted from agriculture cooperatives to the military. During this time women workers were dominant in running the coopera-tives. Moreover, funds which were earlier allocated for agricultural production were now shifted for military purpose.
Collectivized farming in Vietnam resulted in low yields of agricultural output which put a strain on food availability. From the late 1970s and in the 1980s food shortages were com-mon in Vietnam. During the same time, the government was also facing a multitude of other problems like a war with the US while its centrally planned industrial sector was also perform-ing poorly. The inefficiencies of the collective farming system constrained the resources available to the centre for its industri-alization plans and created food shortages in urban areas during a period rife with problems (Beresford, 1993; Kerkvliet, 1995). There was deterioration in Vietnam’s relations with China which resulted in Chinese food aid coming to an end in 1978. Further, Vietnam attacked Cambodia in January 1979 and then the west stopped its food aid. After a few months, there was a war between Vietnam and China. During this tumultuous period, evidence was found in party documents as early as in 1979 that it was time to rethink the agricultural policy again (Kerkvliet, 2006).

Support for Smallholder Agriculture and its Implication for Food Security 39
Collectivized agriculture had become very unpopular by the 1980s whether it was in the form of ‘cooperatives’ in the North or ‘collectives’ in the South. The main reason for this was the inefficiency of collectivized farming. Farmers preferred private production for own consumption or for a free market rather than providing collective labour under cooperatives. Collectivization in Vietnam had evolved in the early 1950s but the state was forced to abandon it by the end of the 1980s due to food shortages, low productivity and a continuous fall in agricul-tural production during the period. Vietnam transformed from controlled collective framing into a free market economy in farm output. Cooperatives had made some sense in the North as the country was at war and cooperatives provided assured food sup-plies to the army but they made less sense after the reunification of the country in 1975.
In 1974, the Vietnam Communist Party made an attempt to consolidate and enlarge the size of cooperatives in order to reorganize production rationally. Despite this, rice production in North Vietnam fell steadily. Despite the Vietnamese Communist Party’s efforts to improve agricultural performance from collec-tive production, lack of incentives for the farmers undermined collective efforts.
Doi-Moi Reforms and De-collectivization of Agriculture
The official shift from a socialist controlled economy to a market oriented one began in Vietnam with the Doi-Moi reforms of 1986. Vietnam allowed ‘limited contract farming’ where households were contracted to supply specific outputs to collectives. However, this approach was more an attempt at en-hancing the efficiency of the collectives rather than a return to the family farm model (Akram-Lodhi, 2004).
In the late 1980s, the Vietnamese government started giv-ing a push to private, family based production due to shortages in food grain supplies to the state and the growing threat of a famine. Along with this change, other economic reforms were also initiated during this period which were popularly known as ‘Doi-Moi’ or ‘Renovation’ in 1986. For the first time, the govern-ment allowed farmers to privately raise livestock without limits.
40 Food Security for Small Farmers
Real reforms came in 1988 when the government intro-duced the land law which mandated the break-up of agricultural collectives and the process of decollectivizing agriculture started. This was the first major step in agrarian reforms and it aimed to transfer decision making powers over farm inputs and out-puts to households and to free up input and output markets. Kerkvliet (2006) notes that in North Vietnam, farmers organized themselves and raised their voice for equitable outcomes. It is be-lieved that the main motivation for introducing decollectivized reforms was farmers’ resistance to collective agriculture, which had become common by the 1980s (Beresford 1985, 1993; Kerkvliet, 1995, 2006; Selden, 1993). Initially, cooperatives and local cadres set production quotas and allocated land across households for some fixed tenure. Households did not hold any right to transfer, sell or exchange their allocated land but they had some residual powers of selling their surplus output in excess of the production quota at market prices. This reform was simi-lar to China’s ‘Household Responsibility System’ introduced in the late 1970s. Vietnam abandoned production quotas in 1989, long before China did. From the late 1980s there was divergence in agrarian policies in China and Vietnam. Both China and Vietnam initially had a de-collectivization process followed by the introduction of a free market in land.
Since the de-collectivization of agriculture in Vietnam, agriculture productivity has increased steadily and food grain availability per capita has started increasing as a persistent trend after 1988 (Akram-Lodhi, 2004, 2005). Decentralizing the de-collectivization process and switching back to family farming put an end to Vietnam’s food crisis.
After the 1988 Land Law, the de-collectivization process was rapid and was largely complete by 1990 (Ngo, 1993). In 1993, the Vietnamese government moved to the second stage of reforms by introducing legal reforms to support the emergence of a land market. For the first time since the communal rule began in Vietnam, the land law introduced in 1993 permitted land transactions. Land remained the property of the state, but usage rights could be legally transferred, exchanged, mortgaged and inherited. The government’s main aim in introducing Land

Support for Smallholder Agriculture and its Implication for Food Security 41
Law 1993 was promoting greater efficiency in production by cre-ating a market in land use rights. Despite the government creat-ing a free market in land use rights, local authorities still retained a certain degree of power over land. This hindered the reform process in some parts of Vietnam. Further, after the reforms there were high transaction costs involved in buying and selling land through official means. According to a Childress Report (2004), both the average number of days to transfer a property and taxes levied on land transactions in Vietnam were generally higher as compared to other East Asian economies. A further resolution in 1998 removed restrictions on the size of landholdings and on the hiring of agricultural labour. From 1990 to 1994 a number of cooperatives declined rapidly both in North and South Vietnam. During the same period, the number of cadres employed in co-operatives reduced by over 50 per cent.
Economic Performance after the Doi-Moi Reforms
Doi-Moi transformed Vietnam from one of the poorest economies in the world into a lower middle-income economy and from a centrally planned country to a more modern and market oriented one. Since the initiation of political and eco-nomic reforms (Doi-Moi) in Vietnam until its WTO accession, growth rates increased steadily owing mainly to high investments and exports. Over the past few years, both production and trade of agricultural products have risen. Now Vietnam has become an important producer as well as exporter of several agricultural commodities such as rice, cashew nuts and coffee. Wide varie-ties of agriculture products have been produced in Vietnam with rice as the main crop, accounting for 36 per cent of the total value of agricultural production, followed by rubber and coffee. In recent years, production of all major agricultural commodities has increased rapidly and the growth has been particularly strong for cashew nuts and cassava. Average annual growth rate of both cashew nuts and cassava was over 15 per cent in 2000-11.
During the reform process, agriculture exports had an im-pressive performance due to significant agricultural price reforms and elimination of restrictions on farmers’ production decisions. Moreover, there was an expansion of traditional labour inten-sive manufacturing exports. Over time, Vietnam saw remarkable

42 Food Security for Small Farmers
diversification in its agricultural exports away from rice to other agricultural crops and then to processed foods.
Robust economic growth over the last two decades has been accompanied by an impressive fall in the incidence of pov-erty. Once Vietnam’s economy shifted towards being a market oriented one where farmers were free to engage in private pro-duction, agricultural productivity increased steadily. Vietnam’s rice production increased from less than 242 kg per person to 293 kg per person from 1987 to 1989. Despite huge crop losses due to floods, Vietnam’s rice exports more than doubled from 0.91 million tons to 1.95 million tons from 1988 to 1992. Since the late 1990s, Vietnam’s rice exports have often exceeded 3 mil-lion tons per year and the country has become the third leading exporter of rice in the world. During the same time due to the disintegration of cooperatives, the government’s involvement in agricultural production shrunk sharply. According to FAO, there was rapid growth in agricultural production after 1988 in Vietnam which was achieved through very little investments by the state in water control, agricultural research and extension, or rural market infrastructure.
After the reforms, agriculture and its exports were the bright spots of the economy. Between 1990 and 2000, Vietnam’s trade openness increased rapidly from 30 per cent to 79 per cent when measured by the ratio of imports and exports (traded goods) to that of GDP. Vietnam participated actively in the glo-balization process and its trade performance looks impressive. Doi-Moi transformed Vietnam from a country which had to import food to the second largest rice exporter in the world in 2012. It not only became competitive but also the world’s leading exporter of coffee, rice, natural rubber, cashew nuts, cassava and pepper. Since the 1990s, Vietnam’s economy has shown remark-able improvements with its GDP more than doubling between 1990 and 2000. Over the years, growth has been inclusive with the poverty rate reducing sharply. From 1990 to 2011, the GDP growth rate fluctuated around 8 per cent and the agricultural sector grew approximately at a rate of 4 per cent (GSO, 2011). In 2011, agriculture was the only sector which had a net export surplus of over US$ 9 billion (GSO, 2011).
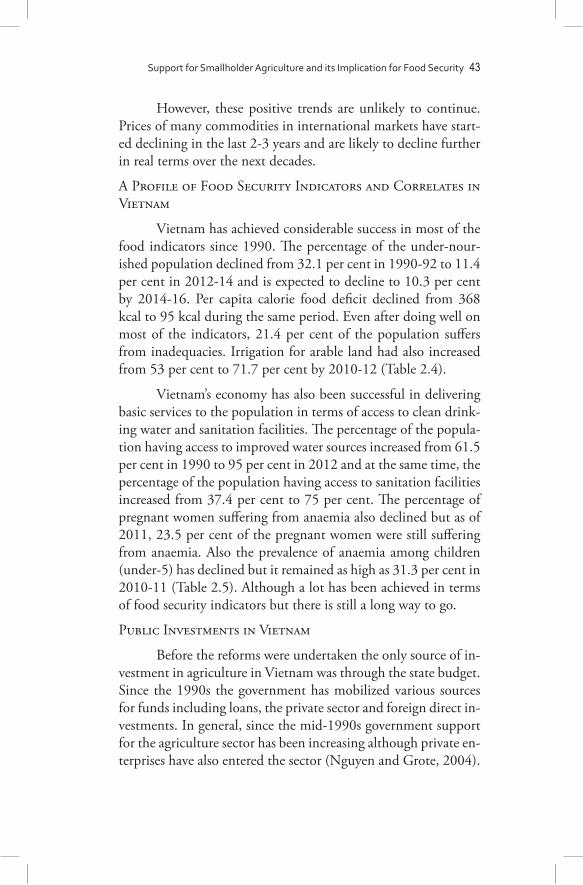
Support for Smallholder Agriculture and its Implication for Food Security 43
However, these positive trends are unlikely to continue. Prices of many commodities in international markets have start-ed declining in the last 2-3 years and are likely to decline further in real terms over the next decades.
A Profile of Food Security Indicators and Correlates in Vietnam
Vietnam has achieved considerable success in most of the food indicators since 1990. The percentage of the under-nour-ished population declined from 32.1 per cent in 1990-92 to 11.4 per cent in 2012-14 and is expected to decline to 10.3 per cent by 2014-16. Per capita calorie food deficit declined from 368 kcal to 95 kcal during the same period. Even after doing well on most of the indicators, 21.4 per cent of the population suffers from inadequacies. Irrigation for arable land had also increased from 53 per cent to 71.7 per cent by 2010-12 (Table 2.4).
Vietnam’s economy has also been successful in delivering basic services to the population in terms of access to clean drink-ing water and sanitation facilities. The percentage of the popula-tion having access to improved water sources increased from 61.5 per cent in 1990 to 95 per cent in 2012 and at the same time, the percentage of the population having access to sanitation facilities increased from 37.4 per cent to 75 per cent. The percentage of pregnant women suffering from anaemia also declined but as of 2011, 23.5 per cent of the pregnant women were still suffering from anaemia. Also the prevalence of anaemia among children (under-5) has declined but it remained as high as 31.3 per cent in 2010-11 (Table 2.5). Although a lot has been achieved in terms of food security indicators but there is still a long way to go.
Public Investments in Vietnam
Before the reforms were undertaken the only source of in-vestment in agriculture in Vietnam was through the state budget. Since the 1990s the government has mobilized various sources for funds including loans, the private sector and foreign direct in-vestments. In general, since the mid-1990s government support for the agriculture sector has been increasing although private en-terprises have also entered the sector (Nguyen and Grote, 2004).

Year
Tota
l pop
ulat
ion
(mill
ions
)Pe
rcen
tage
of p
opul
atio
n un
der-
nour
ished
Dep
th o
f the
food
defi
cit
(kca
l / c
apita
/ da
y)Pr
eval
ence
of f
ood
inad
equa
cy (%
)Pe
r cen
t of a
rabl
e la
nd
equi
pped
for i
rrig
atio
n
1990
-92
70.4
32.1
368
55.6
53.7
1991
-93
71.9
32.2
356
55.1
53.7
1992
-94
73.3
30.3
319
51.9
54
1993
-95
74.7
28.3
285
48.9
54.9
1994
-96
7626
.926
146
.855
.7
1995
-97
77.1
2725
447
56.2
1996
-98
78.2
27.4
254
47.5
57.1
1997
-99
79.1
26.9
247
46.6
57.7
1998
-00
8025
228
43.4
58.5
1999
-01
80.9
22.7
206
39.6
58.4
2000
-02
81.7
20.7
188
36.3
58.4
2001
-03
82.5
19.2
173
33.7
59
2002
-04
83.4
17.8
160
31.3
61.3
Tabl
e 2.
4: F
ood
secu
rity
stat
us (1
990
to 2
016)
44 Food Security for Small Farmers

2003
-05
84.2
16.7
150
29.3
65.9
2004
-06
84.9
16.1
144
28.1
69.8
2005
-07
85.7
15.9
141
27.5
72.5
2006
-08
86.6
15.4
137
26.6
72.9
2007
-09
87.4
14.7
129
25.4
73
2008
-10
88.2
13.7
119
23.8
72.6
2009
-11
89.1
12.9
110
22.4
72.1
2010
-12
89.9
12.2
103
21.4
71.7
2011
-13
90.8
11.8
9920
.6 N
A
2012
-14*
91.7
11.4
9519
.9 N
A
2013
-15*
92.5
10.9
8919
NA
2014
-16*
93.4
10.3
8317
.9 N
A
Sour
ce: c
ompi
led
from
FAO
’s F
ood
Secu
rity
Indi
cato
rs.
Note
: *Es
timat
ed.
Support for Smallholder Agriculture and its Implication for Food Security 45

Year
GD
P pe
r cap
ita (i
n pu
r-ch
asin
g po
wer
equ
iva-
lent
) (co
nsta
nt 2
011
inte
rnat
iona
l $)
Perc
enta
ge o
f pop
ulat
ion
with
acc
ess t
o im
prov
ed
wat
er so
urce
s
Perc
enta
ge o
f pop
ulat
ion
with
acc
ess t
o sa
nita
tion
faci
litie
s
Prev
alen
ce o
f ana
emia
am
ong
preg
nant
wom
en
(%)
Prev
alen
ce o
f ana
emia
am
ong
child
ren
unde
r 5
year
s of a
ge (%
)
1990
1,50
1.1
61.6
37.4
49.1
53.8
1991
1,56
1.6
63.2
39.1
48.1
52
1992
1,66
6.7
64.8
40.8
47.1
49.9
1993
1,77
0.4
66.5
42.5
4647
.9
1994
1,89
4.7
68.1
44.2
44.9
45.9
1995
2,04
1.8
69.6
45.9
43.7
44
1996
2,19
771
.247
.642
.442
.1
1997
2,33
9.3
72.8
49.2
4140
.2
1998
2,43
6.5
74.3
50.9
39.6
38.5
1999
2,51
4.8
75.9
52.6
38.1
37.1
2000
2,64
9.7
77.4
54.4
36.6
35.8
Tabl
e 2.
5: G
DP
and
bas
ic se
rvic
es (1
990
to 2
013)
46 Food Security for Small Farmers

Sour
ce: C
ompi
led
from
FAO
’s F
ood
Secu
rity
Indi
cato
rs.
2001
2,77
8.4
7956
.135
.234
.7
2002
2,91
9.9
80.5
57.8
33.9
33.7
2003
3,08
5.3
82.1
59.5
32.6
33
2004
3,27
8.4
83.6
61.3
31.4
32.3
2005
3,48
4.9
8563
30.2
32
2006
3,68
786
.564
.729
31.5
2007
3,90
7.3
8866
.427
.831
.3
2008
4,08
4.8
89.4
68.1
26.6
31.1
2009
4,26
090
.969
.925
.531
.1
2010
4,48
6.3
92.3
71.6
24.4
31.1
2011
4,71
793
.773
.323
.531
.3
2012
4,91
2.3
9575
NA
NA
2013
5,12
4.6
NA
NA
NA
NA
Support for Smallholder Agriculture and its Implication for Food Security 47

48 Food Security for Small Farmers
Public investments increased almost 10 times between 1995 and 2010 (from 30,447 billion VND in 1995 to 36,285 billion VND by 2012) (GSO, 2012). The share of the state budget remained almost 45 per cent during 1995 to 2010 but the share of loans increased from 20 per cent in 1995 to 37 per cent in 2010.
Total public investments reached 316,300 billion VND in 2010, which is more than three times that in 2000. Meanwhile public investments in agriculture grew at rate of about 17 per cent annually. About 40 per cent of the public investments were al-located to infrastructure building such as electricity, water, trans-portation and telecommunication. In 2000, public investments in agriculture accounted for 12.2 per cent of total public invest-ments; this figure had dropped to 5.9 per cent in 2010. However, these figures do not give the complete picture as a large part of public investments comes from government bonds which are not counted in the state budget (Anh and Thai, 2011). According to MARD (2012), total public investments in agriculture and rural development were 172,810 billion VND in 2006-10, account-ing for 20.9 per cent of total public investments (state budget and government bonds).
Total public investments in agriculture and rural develop-ment during 2006-10 amounted to 388,673 billion VND, of which 45 per cent was allocated for agriculture, forestry and fish-ery development. The rest went to rural development, focusing on development of socioeconomic infrastructure, eliminating hunger and reducing poverty in rural areas.
There was strong decentralization in managing invest-ments. In 1998, the budget expenditure at the central level ac-counted for 60 per cent of the total state budget. This figure went down to 21 per cent in 2002 (MARD, 2004). During 2006-12, MARD managed only about 10 per cent of the total public in-vestments in agriculture and rural development, down from 48 per cent in 1996 (MARD, 2004, 2012).
Irrigation was of special concern which accounted for more than three-fourth of the total public investments in ag-riculture and rural development during 1996-2010. The gov-ernment has made efforts at building multi-purpose irrigation

Support for Smallholder Agriculture and its Implication for Food Security 49
systems. Till 2010, 100 small and medium irrigation works had been constructed, including 1,967 reservoirs with capacity of more than 200,000 m3, 10,000 pumping stations, 1,000 km large channels, 5,000 irrigate and drainage sewers and 23,000 km of dikes.3 Infrastructure for fishery, cultivation and livestock development, forestry development, agricultural production and research and development are other major heads of agricultural investments. Investments in agricultural production accounted for 15 per cent of total agricultural investments. These mainly covered seeds, seedlings, breeding, plant protection chemicals, veterinary system, veterinary medicines, disease prevention and control, forestry, fishery, afforestation and resettlement. There is not much improvement in the spending on R&D as compared to spending on agriculture. This figure was 68 billion VND in 1995 and increased only to 248 billion VND by 2010 whereas total agricultural expenditure increased by more than 10 times.
Public spending on irrigation, roads and agricultural research contributed to both agricultural growth and poverty reduction during 1992-2003 but it has been found that the re-turns to irrigation investments were the lowest and the returns to investments on agricultural research were the highest. It was also found that irrigation investments had the smallest impact on reducing poverty (Fan et al., 2004). Another study by Barker et al., (2002) for the same period found that irrigation investments (accounting for 28 per cent of the growth) were the most impor-tant source of agricultural growth (27 per cent of the growth) followed by investments in agricultural research.
The government has supported farmers by providing cred-it up to 70 per cent of the investments and charging a fixed inter-est rate for the term of the loan. Farms, households, cooperatives and enterprises are entitled to subsidized credit for the purchase of agricultural inputs. Commercial farms can borrow up to 500 million VND without collateral.
National food security has always been at the forefront for the Vietnamese government. To achieve this, it has promoted
3 http://www.fao.org/fileadmin/templates/tci/pdf/CorporatePrivateSector/Vietnam_-_Private_Sector_Investments_in_Agriculture__Final_Report.pdf.

50 Food Security for Small Farmers
agriculture through various support avenues which are now discussed.
Input Subsidies
The fertilizer market in Vietnam is economically and po-litically large and important. A major part of the market is domi-nated by three or four producers although there are more than 500 fertilizer producers in the country. The Vietnam government’s policy has been to promote domestic producers through subsi-dized prices for electricity, coal and natural gas. These prices are determined by the government and made available to state owned large chemical companies and their subsidiaries. For example, subsidized price for natural gas was just 50 per cent of the market price in 2012 (Nguyen Hang, 2013). To protect domestic pro-ducers from cheap fertilizer imports from China, the Vietnamese government used tariff hikes so that the domestic producers re-mained competitive. For example, by the end of 2013 the govern-ment had increased import duty on selected nitrogen fertilizers from zero to 3 per cent. Since the industry is based on obsolete technology the Vietnamese government is aware of the fact that the high costs and lack of competitiveness may undermine its po-sition in the near future (Viet Nam News, 2014).
In 2008, the government implemented policies to support agricultural materials and their management (The Prime Minister signed Decision No. 142/2009/QĐTTg on 31 December 2009 and Decision No.49/2012/QЬTTg on 8 November 2012 amending Decision No. 142/2009/QĐTTg). According to these policies 80 per cent of the input costs in mountainous and central highlands regions and 70 per cent in other provinces are allocated in central budget accounts. Support is based on the damaged area which is planted, damaged livestock and the extent of damage.4
For cultivation, the Ministry of Agriculture and Rural Development issued a circular (No. 36/2010/TT¬BNNPTNT) in order to increase quality assurance of fertilizers for agricultural production on 24 June 2010, on rules for production, business and the use of fertilizers, certification, conformity announcement
4 http://ap.fftc.agnet.org/ap_db.php?id=195.

Support for Smallholder Agriculture and its Implication for Food Security 51
of the list of fertilizers and regulations on the production, pro-cessing, trading, import and use of fertilizers.
Apart from these, there are support measures for fertiliz-ers and plant protection chemicals to farmers in many specific cases. For example, there is Circular No. 205/2012/TT¬BTC (23 November 2012) of the Ministry of Finance which guides policies to protect paddy land from losses due to natural dis-asters. The state budget also supports plant protection and fertilizers.
Offshore fishermen are given support through support prices for fuel under which the amount varies from 18,000,000 to 60,000,000 VND depending on the capacity of the vessels.
State support is also provided for veterinary drugs for ani-mals in the livestock sector. There is state support for most of the locally prevailing diseases in animals. To have high yielding varie-ties in the livestock sector the state has advocated socialized units of breeds that can enter the research unit of the state.
Agricultural Price Policy
Price control is a tool to set maximum or minimum prices for specific products (Rockoff, 2008). Usually it is applied for essential commodities. Price interventions in Vietnam have been done for increasing agricultural production, stabilizing prices of agricultural produce, achieving national food security and pro-viding food and required raw materials for the other sectors of the economy. After the reforms, agricultural growth has been impressive and the government’s price policy has provided more equitable prices for consumers. This has also reduced the impact of the crises due to fluctuations in world production particularly for sensitive commodities.
State interventions in price policies have focused on subsi-dies for transportation of produce, tax exemptions and reductions for developing trade in mountainous regions and for bridging the gap between the prices in different regions. There have been floor prices for rice, export support, funds for price stabilization and support for farmers to sell their agricultural products (Policy Briefs, 2007). In 2013 the government announced that 23 new

52 Food Security for Small Farmers
commodities will receive export promotion credit.5
Support for Infrastructure Building
To encourage investments in agriculture and rural de-velopment, the government supports 20 per cent land tax and water rent for five years after construction which contributes to improvements in agricultural production infrastructure and en-courages more investors to invest in the sector.
In 2013, the government extended the limit for agricul-tural land use per household and for individuals from 20 to 50 years. As paddy is Vietnam’s staple crop the government’s policies support infrastructure investments and application of technol-ogy to increase rice yields. And if households or individuals con-vert paddy land to non-agricultural uses, then they have to pay some penalty to do so or have to increase the yield of the crop on some other land.
In R&D and technology, the government supports 70 per cent of the funds for research which creates new technology and 30 per cent funding is provided for applying new technology in production on a pilot basis. These efforts will encourage invest-ments in new technologies in the agriculture sector.
From 2012 onwards (based on decision No. 01/2012/QDTTg) the government has been supporting 100 per cent of the cost of topographical surveys, water samples, soil analyses and air samples. This policy has contributed considerably to an increase in agricultural production and accounts for 30 per cent of the value added in agriculture. For 2008-13 VND 3930.445 billion were allocated for research and technology.
Credit
As of 2008, 6 per cent of the poor borrowed money from moneylenders and 25 per cent borrowed from friends and rela-tives. The government expanded the Vietnam Bank for Social Policies’ (VBSP) activities and operations and created a People’s Credit Fund (PCF) system to provide alternatives to moneylend-ers in rural areas. This made commercial banks focus on urban areas while ignoring rural farmers. This development is in contrast
5 http://www.vietnam-briefing.com/news/vietnam-give-23-commodities-export-credit-guarantees-2011.html/.

Support for Smallholder Agriculture and its Implication for Food Security 53
to the economies of Indonesia and Philippines where private banks are an important source of microfinance in rural areas.
There exist both state and private institutions in the credit sector in Vietnam. Up to 70 per cent of the investments can be made through loans for which various policies (Decree No. 133/2013/NĐCP dated 30 August 2011; Decree No. 54/2013/NĐCP; Decree No. 75/2011/NЬCP; and Circular No. 52/2008/QĐBTC) have been implemented over time. However, the scope of these policies is still narrow and does not cover all the agriculture sub-sectors.
The government’s 2009 decision has provisions for loans up to 100 per cent of the value of the goods (but it should be less than VND 7 million per hectare) and an interest rate of 4 per cent. The government is also promoting exports by providing export credit; the maximum rate of the export credit is 85 per cent of the value of the export contract.
Microcredit
Vietnam has the world’s most extensive microcredit system. Unlike other countries like Bangladesh, India and Indonesia which have deep microfinance penetration, micro-credit in Vietnam is characterized by government control and subsidies. There exist both state and private institutions in the credit sector in Vietnam. However, growth in the microfinance sector is dominated by state owned institutions mainly because of the government’s intervention through VBSP. The most domi-nant players are VBSP and the Vietnam Bank for Agriculture and Rural Development which account for 87 per cent of the micro-borrowers and 88 per cent of the outstanding loans. By the end of 2010, VBSP had lent to 7.8 million households including 3.8 million poor households (Table 2.6).
Vietnam’s microcredit system primarily consists of state owned enterprises and institutions disbursing loans and mobiliz-ing savings with the support of the people. The institutions or organizations such as the Vietnam Women’s Union (VWU) and Vietnam Farmers’ Union (VFU) have huge coverage and con-trol most of the microfinance delivery system. These organizations

54 Food Security for Small Farmers
Institution Number (Million)
Percentage to total
Loans Outstanding (US$ M)
Percentage to total
VBSP 7.8 62 4398 49VBARD 3.2 25 3500 39PCFs 0.95 7 1006 11MFIs/NGOs
0.6 5 75 1
Table 2.6: Microcredit delivery in Vietnam (as of 2010)
Source: ‘Sector assessment: Microfinance’, available at: http://www.adb.org/sites/default/files/linked-documents/42235-013-vie-ssa.pdf.
mostly operate independently but are affiliated to the government. There are around 40 voluntary organizations involved in Vietnam’s microfinance system but they are facing difficulties in converting themselves into formal institutions as the government is not ready to loosen the restrictions on private lenders (APEC, 2011).6
The microfinance policy is driven by the fact that subsidies are necessary for social reasons as the poor are unable to afford non-subsidized financial services. Also the non-subsidized finan-cial services/schemes which are commercially self-sustained do not cater to the poor sections of society. Because of these reasons the disbursement of credit to the poor remains subsidized mainly through interest rate subsidies which cost the government almost $200 million a year.
Although the government wants to achieve social goals through the use of microcredit but the transition of the Vietnamese economy from a command to a market based one and diversifica-tion of microfinance institutions affects how credit is provided in the country. Today, microfinance in Vietnam has evolved into a market based system in which autonomous, specialized and NGO type microfinance institutions are emerging although they are still connected to state linked mass organizations. The government has indicated some plans of removing control on interest rates but has not yet done so. However, de-regulation of the interest rate will have a negative impact, especially on the rural economy. As agri-cultural production is risky, banks will tend to avoid lending to farmers. Banks in rural areas will transfer their capital to non-rural
6 http://www.adb.org/sites/default/files/linked-documents/42235-013-vie-ssa.pdf.

Support for Smallholder Agriculture and its Implication for Food Security 55
areas where they can have larger profits. So there is a need to care-fully monitor credit disbursement so that the requirements of the rural economy are met.
Reducing the budgetary burden seems to be the logic be-hind moving towards market based microfinance and the effec-tiveness of subsidies in targeting the beneficiaries is also brought into question7. Almost, 12 per cent of the total credit issued by the banking sector is at subsidized interest rates. This is mostly managed by VBSP and the Vietnamese Development Bank (VDB). It is estimated that rural Vietnam receives only 17 per cent of total bank credit and less than 20 per cent of the rural population has access to formal financial services.
There are four primary reasons for the supervision and regulation of microfinance in Vietnam: (1) for pursuing social objectives, (2) for protecting depositors, (3) for controlling illegal financial activities, and (4) for preventing fraud on the public in the name of social goals. To make sure that microfinance is focused on social purposes and poverty reduction and to pre-vent subversion, the government controls the activities of private microfinance companies (profit investors) and NGOs. Investors can invest up to 50 per cent after which they can engage in mi-crofinance, but few for-profit investors in financial enterprises have done so (ibid).
Reforms have been introduced in the regulation and su-pervision of microfinance because of the transition to a market based economy which will function with more private microfi-nance institutions. New laws have been enacted and a national microfinance policy has been implemented. The Vietnamese government is trying to create an enabling and regulatory envi-ronment for evolving microfinance institutions.
Irrigation
The irrigation system plays an important role in agricul-tural production as more than 80 per cent of the rainfall occurs in the wet season only. In Vietnam, irrigation services at the com-mune level are controlled by agricultural cooperatives through
7 http://www.adb.org/sites/default/files/linked-documents/42235-013-vie-ssa.pdf.
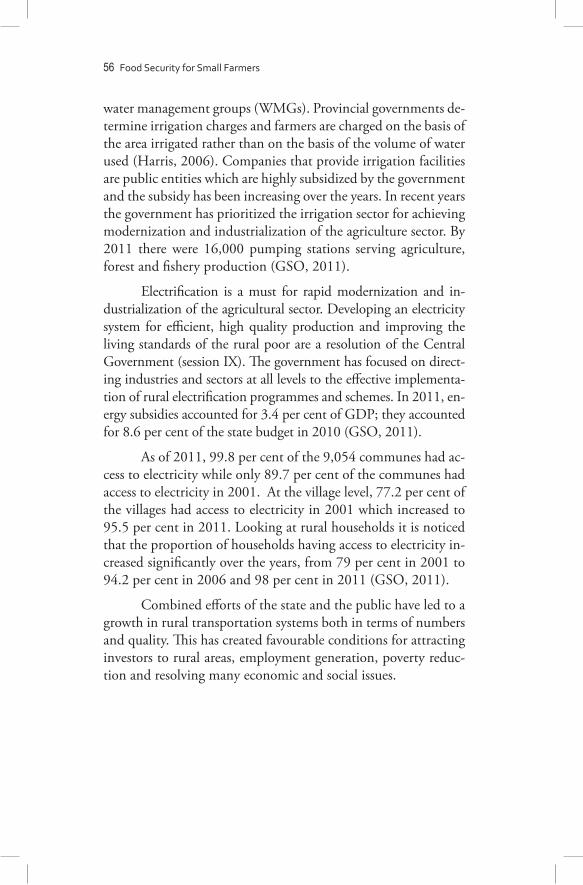
56 Food Security for Small Farmers
water management groups (WMGs). Provincial governments de-termine irrigation charges and farmers are charged on the basis of the area irrigated rather than on the basis of the volume of water used (Harris, 2006). Companies that provide irrigation facilities are public entities which are highly subsidized by the government and the subsidy has been increasing over the years. In recent years the government has prioritized the irrigation sector for achieving modernization and industrialization of the agriculture sector. By 2011 there were 16,000 pumping stations serving agriculture, forest and fishery production (GSO, 2011).
Electrification is a must for rapid modernization and in-dustrialization of the agricultural sector. Developing an electricity system for efficient, high quality production and improving the living standards of the rural poor are a resolution of the Central Government (session IX). The government has focused on direct-ing industries and sectors at all levels to the effective implementa-tion of rural electrification programmes and schemes. In 2011, en-ergy subsidies accounted for 3.4 per cent of GDP; they accounted for 8.6 per cent of the state budget in 2010 (GSO, 2011).
As of 2011, 99.8 per cent of the 9,054 communes had ac-cess to electricity while only 89.7 per cent of the communes had access to electricity in 2001. At the village level, 77.2 per cent of the villages had access to electricity in 2001 which increased to 95.5 per cent in 2011. Looking at rural households it is noticed that the proportion of households having access to electricity in-creased significantly over the years, from 79 per cent in 2001 to 94.2 per cent in 2006 and 98 per cent in 2011 (GSO, 2011).
Combined efforts of the state and the public have led to a growth in rural transportation systems both in terms of numbers and quality. This has created favourable conditions for attracting investors to rural areas, employment generation, poverty reduc-tion and resolving many economic and social issues.

Support for Smallholder Agriculture and its Implication for Food Security 57
2.7 SOUTH ASIA
South Asia consists of eight countries -- Afghanistan, Bangladesh, Bhutan, India, Nepal, Maldives, Pakistan and Sri Lanka. Agriculture has a very significant portion of the GDP of the region but at the same time the region has a larger number of under-nourished and poor as compared to other developing re-gions, and more than two-third of them live in rural areas (FAO, 2001). There are 1,707 million people in the South Asian region of which 67 per cent (1143 million) are rural inhabitants.8 More than two-third of the rural inhabitants depend on agriculture either directly or indirectly. South Asia’s land size is 514 million hectares. A large proportion of this land is uncongenial and that is why most of the population depends on less than half of this land area. Twenty per cent of the region’s land consists of hills and mountains, 19 per cent is humid or moist sub-humid low-land, 29 per cent is dry-sub-humid and 32 per cent is semi-arid and arid lowland (FAO, 2001).
All the countries in the region have mountains, but they are mostly found in Afghanistan, Bhutan, India, Nepal and Pakistan (FAO, 2001). Afghanistan’s climate varies between arid and semi-arid. Most of the land is covered by rocky moun-tains though its north and south-western parts are plain areas. Only 5.75 per cent of the total agricultural land in Afghanistan is irrigated. In Bangladesh, climate varies from a humid and warm rainy season to a mild winter. Topographically, the land in Bangladesh is a flat alluvial plain except for the hills in the south-east. Arable land is the biggest natural resource available in Bangladesh where 11 per cent of the land is covered with forests. More than half of the agricultural land (55 per cent) is irrigated, that is 50,500 sq. km of land. Bangladesh routinely faces natural hazards like droughts, floods and cyclones. Bhutan’s climate varies according to topography; it is cool in winter and hot in summer in the central valleys but the Himalayas are se-verely cold in winter and are cool in summer. Bhutan is mostly covered with mountains though there are some fertile valleys and savannah areas. Timber and hydropower are the main natural
8 Information collected from The World Fact Book for different countries in South Asia.
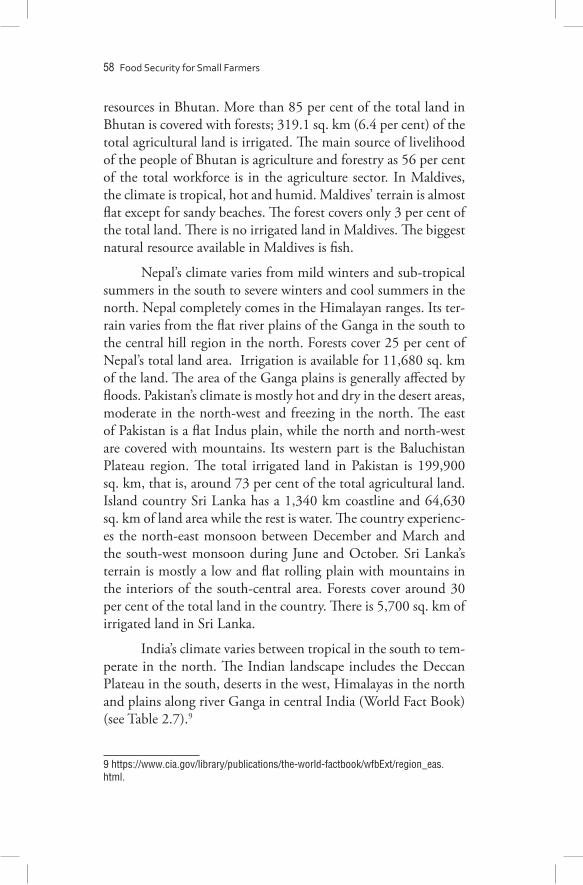
58 Food Security for Small Farmers
resources in Bhutan. More than 85 per cent of the total land in Bhutan is covered with forests; 319.1 sq. km (6.4 per cent) of the total agricultural land is irrigated. The main source of livelihood of the people of Bhutan is agriculture and forestry as 56 per cent of the total workforce is in the agriculture sector. In Maldives, the climate is tropical, hot and humid. Maldives’ terrain is almost flat except for sandy beaches. The forest covers only 3 per cent of the total land. There is no irrigated land in Maldives. The biggest natural resource available in Maldives is fish.
Nepal’s climate varies from mild winters and sub-tropical summers in the south to severe winters and cool summers in the north. Nepal completely comes in the Himalayan ranges. Its ter-rain varies from the flat river plains of the Ganga in the south to the central hill region in the north. Forests cover 25 per cent of Nepal’s total land area. Irrigation is available for 11,680 sq. km of the land. The area of the Ganga plains is generally affected by floods. Pakistan’s climate is mostly hot and dry in the desert areas, moderate in the north-west and freezing in the north. The east of Pakistan is a flat Indus plain, while the north and north-west are covered with mountains. Its western part is the Baluchistan Plateau region. The total irrigated land in Pakistan is 199,900 sq. km, that is, around 73 per cent of the total agricultural land. Island country Sri Lanka has a 1,340 km coastline and 64,630 sq. km of land area while the rest is water. The country experienc-es the north-east monsoon between December and March and the south-west monsoon during June and October. Sri Lanka’s terrain is mostly a low and flat rolling plain with mountains in the interiors of the south-central area. Forests cover around 30 per cent of the total land in the country. There is 5,700 sq. km of irrigated land in Sri Lanka.
India’s climate varies between tropical in the south to tem-perate in the north. The Indian landscape includes the Deccan Plateau in the south, deserts in the west, Himalayas in the north and plains along river Ganga in central India (World Fact Book) (see Table 2.7).9
9 https://www.cia.gov/library/publications/the-world-factbook/wfbExt/region_eas.html.
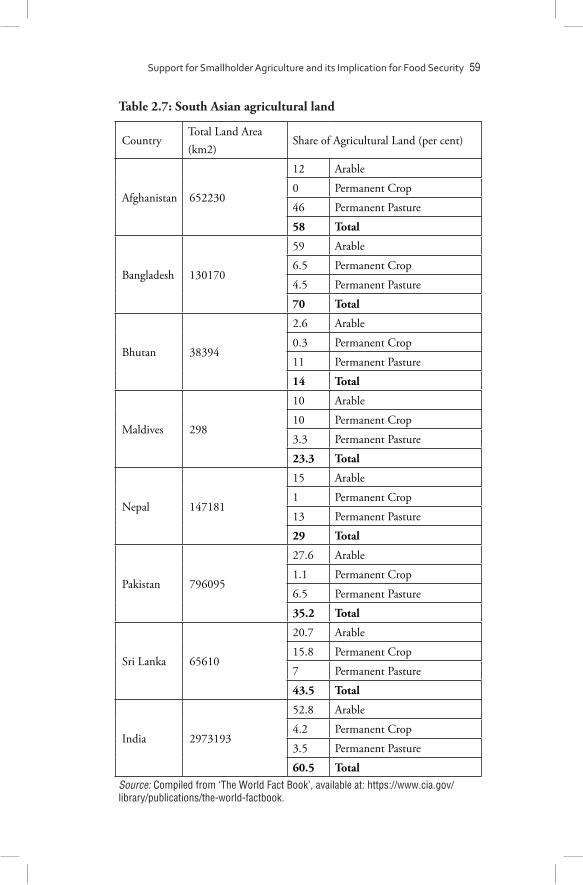
CountryTotal Land Area (km2)
Share of Agricultural Land (per cent)
Afghanistan 652230
12 Arable
0 Permanent Crop
46 Permanent Pasture
58 Total
Bangladesh 130170
59 Arable
6.5 Permanent Crop
4.5 Permanent Pasture
70 Total
Bhutan 38394
2.6 Arable
0.3 Permanent Crop
11 Permanent Pasture
14 Total
Maldives 298
10 Arable
10 Permanent Crop
3.3 Permanent Pasture
23.3 Total
Nepal 147181
15 Arable
1 Permanent Crop
13 Permanent Pasture
29 Total
Pakistan 796095
27.6 Arable
1.1 Permanent Crop
6.5 Permanent Pasture
35.2 Total
Sri Lanka 65610
20.7 Arable
15.8 Permanent Crop
7 Permanent Pasture
43.5 Total
India 2973193
52.8 Arable
4.2 Permanent Crop
3.5 Permanent Pasture
60.5 Total
Table 2.7: South Asian agricultural land
Source: Compiled from ‘The World Fact Book’, available at: https://www.cia.gov/library/publications/the-world-factbook.
Support for Smallholder Agriculture and its Implication for Food Security 59

60 Food Security for Small Farmers
Out of the 570 million farms of the world, two-third is in Asia and 40 per cent of the Asian farms are in South Asia. The total agricultural area of South Asia is 260793 thousand hectares, largest part of this is in India that is 179799 thousand hectares followed by Afghanistan and Pakistan with 37910 thousand hec-tares and 26550 thousand hectares respectively. Maldives has the lowest agricultural land in this region with 7 thousand hectares only (FAO, 2014).
Fifty-eight per cent of the total 652,230 sq. km of land in Afghanistan is agricultural (12 per cent is arable land and 46 per cent is permanent pasture). Almost 70 per cent of the total 130,170 sq. km land in Bangladesh is agricultural (59 per cent arable land, 6.5 per cent under permanent crops and 4.5 per cent permanent pasture). Agricultural land in Bhutan constitutes 14 per cent of the 38,394 sq. km of land which includes 2.6 per cent arable land, 0.3 per cent land under permanent crops and 11 per cent permanent pastures. In the Maldives, 23.3 per cent of the 298 sq. km of land is agricultural land which includes 10 per cent arable land, 10 per cent under permanent crops and 3.3 per cent permanent pastures. Around 29 per cent of the 147,181 sq. km land in Nepal is used for agricultural purposes. It consists of 15 per cent arable land, 1 per cent under permanent crops and 13 per cent permanent pastures. In Pakistan, 35.2 per cent of 796,095 sq. km of land is used for agriculture which consists of 27.6 per cent arable land, 1.1 per cent under permanent crops and 6.5 per cent permanent pastures. In Sri Lanka 43.5 per cent of the 65,610 sq. km of land is agricultural, which includes 20.7 per cent arable land, 15.8 per cent under permanent crops and 7 per cent permanent pastures. In India, out of 2,973,193 sq. km of land, 60.5 per cent is agricultural land which includes 52.8 per cent arable land, 4.2 per cent under permanent crops and 3.5 per cent permanent pastures.
There is a common landholding trend in South Asian countries as a large number of farmers hold small plots of land. In India, 63 per cent of the farms are less than one hectare; they form 19 per cent of the total agricultural land in the country; 31 per cent of the agricultural land is between 2 to 5 hectares (around 14 per cent of the farms). In Nepal, 75 per cent of the

Land
Size
----
><1
ha
1–2
ha2–
5 ha
5–10
ha
10–2
0 ha
20
–50
ha>5
0 ha
Sout
h As
iaPe
rcen
tage
Indi
aho
ldin
gs63
1914
31
0..
area
1920
3117
85
..
Nep
alho
ldin
gs75
177
10
....
area
3930
245
2..
..
Paki
stan
hold
ings
3622
289
41
0
area
610
2819
1612
10
Tabl
e 2.
8: F
arm
ing
cate
gory
in S
outh
Asi
a (a
ccor
ding
to si
ze o
f hol
ding
s)
Sour
ce: C
ompi
led
from
the
base
dat
a gi
ven
in F
AO (2
014)
.
Support for Smallholder Agriculture and its Implication for Food Security 61

62 Food Security for Small Farmers
farms are less than one hectare (39 per cent of agricultural land); 7 per cent of the farms are between 2 to 5 hectares. Land owner-ship in Pakistan is highly skewed. The unequal landownership in Pakistan is the main cause of poverty in the country because land is the chief asset in an agrarian economy. In 2004, around 67 per cent of the households did not own any land in Pakistan and 18.25 per cent had ownership of less than 5 acres of land each. At the same time, hardly 1 per cent of the households in the country owned more than 35 acres of land each (Talat et al., 2004). As per 2014 data, 36 per cent of the farms in Pakistan were less than one hectare (6 per cent of the total agricultural land in the country); 28 per cent of the farms were between 2 to 5 hectares (28 per cent of the total agricultural land). In Pakistan, almost 10 per cent of the agricultural land was more than 50 hectares which is less than 1 per cent of the total number of farms (Table 2.8).
On the one hand, a large number of farms in South Asia are small or marginal but on the other hand smallholders provide around 80 per cent of the food supply in Asian and sub- Saharan countries (FAO, 2014).
Agriculture is the basis of the South Asian economies. It not only supplies food but also employs a majority of the population. Rural development and agricultural growth are the main causative factors for the economic development of any de-veloping country and they also help in the faster growth of the industrial sector (Bashir and Ahmad, 2001). Some countries in South Asia like Bangladesh, Sri Lanka and India have achieved some sort of self-sufficiency in food production but Bhutan, Afghanistan, Nepal and Pakistan are still deficit in food grain production. These countries are making serious attempts to aug-ment their production (Joshi et al., 2004). Agriculture accounts for more than half of South Asia’s employment and contributes around 20 per cent to its GDP, although agriculture’s share in South Asia’s GDP has been waning gradually in recent decades. Poor harvests have unfavourable implications for rural employ-ment and incomes, inflation, food prices and overall growth (The World Bank, 2013). As per ILO’s estimates, 46.3 per cent of the total employment in the region was in agriculture.10 In 2014-10 http://www.ilo.org/global/industries-and-sectors/agriculture-plantations-other-
Support for Smallholder Agriculture and its Implication for Food Security 63
15, the share of agriculture in GDP was the highest in Nepal at 34 per cent followed by Pakistan and Afghanistan with 25 and 24 per cent respectively. In the same period, agriculture contrib-uted 17 per cent to India and Bhutan’s GDPs. Agriculture con-tributed 16 and 10 per cent respectively to Bangladesh and Sri Lanka’s GDPs. Agriculture’s contribution to GDP was the lowest in Maldives at 4 per cent only.11 Agriculture’s role in employ-ment generation is very important for South Asian countries. In Afghanistan, 60 per cent of the workforce was in agriculture (ILO, 2012)12. In Bangladesh, agriculture employed 47 per cent of the workforce (ILO, 2013)13. For Bhutan, India, Sri Lanka and Pakistan the share was 62, 47, 39 and 43 per cent respec-tively in 2012.14 Agriculture provided employment to 74 per cent of the total workforce in Nepal (ILO, 2011).15
In Afghanistan, which mostly depends on private and for-eign investors in the agriculture sector, agricultural infrastructure is declining. There was a decline of almost 43 per cent in total irrigated land between the 1970s and 2010s, which indicates a huge requirement of investments in the irrigation sector. Afghan farmers are also not able to adopt high efficiency irrigation sys-tems because of expensive imported tools. As per the Ministry of Agriculture, Irrigation, Livestock of the Islamic Republic of Afghanistan, the focus of the government is more towards large farmers and private investors. The Private Sector Development Directorate of the Ministry is focusing on these objectives. The Afghan government is also welcoming investments in rice mill processing, fresh fruit processing, farm machinery manufactur-ing, saffron processing and marketing, automated packing plants and livestock by-products (MoE Afghanistan, 2012).
In Bangladesh, fisheries and livestock are also significant sub-sectors contributing to agricultural GDP. Rice covers more
rural-sectors/lang--en/index.htm.11 http://data.worldbank.org/indicator/NV.AGR.TOTL.ZS/countries?display=default.12 http://www.refworld.org/pdfid/5124c39f2.pdf.13 http://www.ilo.org/wcmsp5/groups/public/@dgreports/@dcomm/documents/publication/wcms_229105.pdf.14 http://data.worldbank.org/indicator/SL.AGR.EMPL.ZS.15 http://www.ilo.org/wcmsp5/groups/public/---asia/---ro-bangkok/---ilo-kathmandu/documents/publication/wcms_151322.pdf.

64 Food Security for Small Farmers
than 80 per cent of the agricultural land in the country. In recent years, production as well as the area under pulses, oilseed and wheat has reduced significantly and production of vegetables and potatoes has increased noticeably (FAO, 2011); there are around 17 million small farms (less than 2 hectares). In Bangladesh, small farms account for 96 per cent of the operational holdings which cover 69 per cent of the cultivated area. The average farm size declined from 1.4 hectare in year 1977 to 0.6 hectare in 1996. In 2011, the average size of operational landholdings was 0.5 hectare (Thapa and Gaiha, 2011).
In Maldives, coconut and other tree crops dominate the agriculture sector. Apart from tree crops only 4,000 hectares cover other agriculture crops. Integration of food security in national planning is also very recent and was done in response to the current food and fuel crisis. As a very first attempt for a national plan for food security, Maldives removed tariffs on agri-cultural inputs, imported food items and fuel. The country is also trying to intensify and diversify agriculture and fisheries. Climate change is also a big challenge in the area of security in Maldives because it is adversely affecting crops and fish stocks. Land for cultivation is very less in Maldives and wherever it is available the soil is very poor and fresh water for irrigation is not avail-able. Given this scarcity of basic requirements for cultivation, development of agriculture is very limited. About 50 per cent of the agricultural land is actually ‘agriculture islands’, which are leased out to private entrepreneurs for agriculture development. Although agricultural growth is limited but agriculture-allied sectors like fishery are the backbone of Maldives’ economy; this is also the second most important sector after tourism. Fisheries and other marine activities employ about 30 per cent of the country’s workforce.
Nepal’s agricultural growth is among the lowest in South Asia. Low agricultural production is mainly because of a high proportion of rain-fed agriculture, limited agricultural inputs, inadequate technical assistance, traditional farming practices, poor extension services and limited availability of agricultural credit. Only 40 per cent of the rural households in Nepal pro-duce enough food to meet their year round needs; 3.4 million

Support for Smallholder Agriculture and its Implication for Food Security 65
landholding households barely produce enough food to meet six months of their food needs. Landlessness is huge among Dalits and Muslims. In the hilly areas of Nepal 44.6 per cent Dalits are marginal farmers with 0.18 to 0.40 hectare farm size; 44 per cent of the Terai Dalits are landless; and 40.4 per cent of the Muslims in Nepal are landless. Access to food is constrained due to limited possibilities of non-agricultural incomes and restricted access to productive resources. As per a 2008 World Food Programme study, 75 per cent of the surveyed households did not have suf-ficient access to food, and more than 95 per cent of the very poor households had insufficient access to food (FAO, 2010).
In Sri Lanka, non-agricultural daily manual work has the largest share in the total income generation in the country; 24 per cent of the total income is generated by non-agricultural labour. Farming is the second largest income source, which accounts for 20 per cent followed by salaried employment. Paddy is the most produced crop in the country. Some portion of the population is also involved in highland cultivation. Land-owning farmers are facing many problems including shortage of seeds and tools in the Northern province. Lesser land is available for leasing out and in case of tenancy, the rent is very high. Lack of irrigation facilities is also a hindrance to agricultural growth in the coun-try. Since households only undertake subsistence farming they do not sell their produce in the market. Even though it is an island, the Sri Lankan population is hardly involved in fishing. Only around 8 per cent of the total income comes from fishing. As per FAO (2011), lack of infrastructure related to fishing and low selling prices are major reasons for the lesser engagement of the population in this activity. As a result of all these factors, the country is import dependent for food crops including rice (FAO, 2011).
2.7.1 Food Security
Despite having the world’s highest number of farms and agricul-tural dependent populations, South Asia’s performance regard-ing food security is not remarkable. East and South Asia started with the same number of under-nourished people in 1990-92. At that time East Asia’s performance was well ahead of South

Tabl
e 2.
9: F
ood
secu
rity
stat
us (1
990
to 2
016)
Year
To
tal
popu
latio
n
(in m
illio
n)
Prev
alen
ce o
f und
er-
nour
ishm
ent (
%)
Dep
th o
f foo
d de
ficit
(k
cal /
cap
ita/ d
ay)
Prev
alen
ce o
f foo
d in
adeq
uacy
(%)
Per c
ent o
f ara
ble
land
equ
ippe
d fo
r irr
igat
ion
(%)
1990
-92
1,21
7.4
23.9
169
32.8
36.6
1991
-93
1,24
3.1
2316
231
.737
1992
-94
1,26
8.7
23.2
164
31.9
37.5
1993
-95
1,29
4.4
23.1
164
31.9
38.3
1994
-96
1,32
022
.716
131
.539
.3
1995
-97
1,34
5.7
21.8
154
30.6
40.2
1996
-98
1,37
1.4
20.7
146
29.4
41.1
1997
-99
1,39
7.1
19.6
138
28.2
42
1998
-00
1,42
2.5
18.7
131
27.3
43
1999
-01
1,44
7.8
18.2
128
26.7
43.9
2000
-02
1,47
2.8
18.5
130
27.2
44.7
2001
-03
1,49
7.5
19.3
137
28.3
45.2
2002
-04
1,52
1.8
20.3
145
29.7
45.9
2003
-05
1,54
5.8
20.8
149
30.5
46.5
66 Food Security for Small Farmers

Sour
ce: C
ompi
led
from
FAO
’s F
ood
Secu
rity
Indi
cato
rs.
Note
: *Es
timat
ed; N
A-No
t Ava
ilabl
e.
2004
-06
1,56
9.3
20.8
150
30.6
47.2
2005
-07
1,59
2.2
20.1
144
29.8
47.8
2006
-08
1,61
4.8
18.8
135
28.2
48.5
2007
-09
1,63
717
.512
526
.649
2008
-10
1,65
9.2
16.6
119
25.6
49.5
2009
-11
1,68
1.5
16.3
117
25.1
49.7
2010
-12
1,70
3.9
16.1
116
24.9
49.8
2011
-13
1,72
6.4
1611
524
.8 N
A
2012
-14*
1,74
916
116
24.8
NA
2013
-15*
1,77
1.4
15.9
115
24.7
NA
2014
-16*
1,79
3.5
15.7
114
24.5
NA
Support for Smallholder Agriculture and its Implication for Food Security 67

68 Food Security for Small Farmers
Source: Compiled from FAO’s Food Security Indicators.
Year Percentage of the population with access to improved water sources
Percentage of population with access to sanitation facilities
1990 72.5 23.1
1991 72.7 23.4
1992 73.5 24.3
1993 74.3 25.1
1994 75.2 26
1995 76.1 26.9
1996 77 27.8
1997 77.9 28.7
1998 78.8 29.6
1999 79.8 30.5
2000 80.7 31.4
2001 81.5 32.3
2002 82.5 33.2
2003 83.4 34.2
2004 84.3 35.1
2005 85.2 36
2006 86.1 36.8
2007 87 37.8
2008 87.9 38.7
2009 88.8 39.6
2010 89.7 40.4
2011 90.5 41.2
2012 91.4 42
Table 2.10: Basic public services (1990 to 2012)
Asia’s which could not meet either the MDG or the World Food Summit’s (WFS) hunger targets. The highest number of the world’s under-nourished people live in South Asia (FAO, 2015). South Asia’s poor performance is mainly because of conflict, wars and poor rural infrastructure in the region.
Support for Smallholder Agriculture and its Implication for Food Security 69
Availability is the first step towards food security. Over the past two decades, growth in food production has been more than the growth in population. Today the food in the world is more than enough to feed the entire population. South Asia also recorded a small increase in per capita food supply in the last quarter century (FAO, 2015) (Table 2.9). This increase includes diversification in food consumption from traditional food to fisheries, livestock, vegetables etc. (Joshi et al., 2004). Access is the second step towards food security. Food access and income are correlated (although there are many other determinants of food access like social barriers). In Asia, South Asia’s performance regarding per capita income is worse than the Eastern and South-eastern regions. Within South Asia also there are wide variations in terms of per capita GDP. As far as stability in food supply is concerned, numerous indicators show an enhanced condition in South Asia. The percentage arable area equipped with irrigation has increased by 36 per cent in Southern Asia. Cereal import dependency has decreased in the region by 58 per cent. Utility is the last ladder of food security. South Asia has higher rates of wasting among children than Eastern Asia. Children suffer-ing from wasting are between 6 to 20 per cent in South Asia. The problem of stunting in children exists in all countries in the region. There is high incidence of anaemia among pregnant women and children in South Asia.
South Asia as a whole has not been able to achieve much on food security indicators and its correlates in the last two and a half decades and the rate of improvement is very low. The proportion of the under-nourished population declined to 15.9 per cent in 2013-15 from 30 per cent in 1990-92 and is estimated to decline to 15.7 per cent by 2014-16. And if the same trend continues it will take a minimum of three to four decades to bring everyone out of under-nourishment. Depth of food deficit has declined only to 115 (kal/capita/day) from 169 (kal/capita/day) and still almost 25 per cent of the population suffers from food inadequacy. South Asia’s performance in terms of arable land which is irrigated is also not remarkable as it only increased to 49.8 per cent in 2010-12 from 36 per cent in 1990-92. So there is a need to focus more on irrigation infrastructure for developing agriculture.

70 Food Security for Small Farmers
The proportion of the population having access to im-proved water sources in South Asia increased from 72.4 per cent in 1990 to 91.4 per cent in 2012 while the proportion of the population having access to sanitation facilities was more re-markable as in 1990, 21.3 per cent of the population had access to sanitation services which increased to 42 per cent in 2012 (Table 2.10).
In Afghanistan around 54 per cent of the children below the age of 5 years are chronically malnourished and 34 per cent are under-weight. Around 72 per cent of the children under-5 years suffer from a deficiency of key micronutrients like iron and iodine. Further, 29 per cent of the Afghan population consumes less than 2,100 calories per day, which is the minimum calorie requirement. The problem of food insecurity also depends on seasons. During the spring season, 24 per cent of the population suffers from poor diet and 33 per cent from calorie deficiency (MoE Afghanistan, 2012). Almost 80 per cent of the population lives in rural areas where food insecurity is higher than it is in urban areas. In rural areas, 30 per cent of the population does not consume the minimum calorie requirements, whereas calorie deficiency affects 24 per cent of the population in urban areas. Diet-diversification is also very low in rural areas. Poor diversity in diet affects 21 per cent of the rural population and 14 per cent of the urban population. Food insecurity is higher in the moun-tain and plateau regions of Afghanistan. The people in these re-gions experience much higher protein and calorie deficiency as compared to those living in the lowlands. Topography too affects food security through various channels like access to markets and transportation costs (MoE Afghanistan, 2012).
Bangladesh also faces severe food insecurity despite hav-ing significant involvement in agriculture. Around 40 per cent of its total population is consuming less than 2,122 kcal per capita, per day, while 20 per cent of population consumes less than 1,805 kcal per capita, per day. At least 40 million people in Bangladesh were under-nourished by the end of 2004‐06 which was around 12 per cent of total under-nourished people in South Asia. According to another estimate (HIES, 2005) Bangladesh had 56 million under-nourished people. Within this, 27 million

Support for Smallholder Agriculture and its Implication for Food Security 71
people consumed less than 1,805 calories per day and 11 million consumed less than 1,600 calories per day. Availability of pulses, vegetables, fruits and oilseeds which are the main sources of pro-teins, vitamins and minerals were below requirements. Although there has been an increase in the production of meat, milk and eggs but these food items are not sufficient for a nutritionally bal-anced diet. Like Afghanistan, the rural population in Bangladesh is more under-nourished than its urban counterparts. Food consumed in rural areas is highly imbalanced resulting in a high occurrence of malnutrition. Food insecurity is persistent in all types of households, whether they produce food or not, because they are unable to afford the minimum food items through their money incomes, own food production and other possessions necessary to acquire nutritious food (FAO, 2011).
Bhutan is very vulnerable in terms of food security. The largest portion of its food requirements is imported from India. The impact of global food inflation has also been large for Bhutan. Like other nations in the region, in Bhutan too there is more food insecurity in rural parts. The Government of Bhutan in-troduced a Comprehensive National Food Security programme in 1994, which was based on the principles of pro-poor growth, employment generation, economic viability and environmental sustainability (FAO, 2011).
Food security in Maldives is different from any other country in South Asia as the country is completely import-de-pendent for food items. The main staple grains of the country, including rice are imported. Other than Malé, subsistence agri-culture and fishing are the main sources of food security. These are also the main sources of livelihood of the people of Maldives (FAO, 2011).
In Nepal poverty and food insecurity are the worst in dis-tant hills. Local food production is not sufficient for more than six months. According to the country’s Tenth Five Year Plan, the reasons for high poverty are regional, gender, ethnic and caste re-lated inequalities. Poor governance and failures in the delivery of social services also create problems. On the one hand the prices of food commodities are increasing and on the other hand, the

72 Food Security for Small Farmers
incomes of the deprived section are stagnant. Food insecurity is persistent in Nepal, not only in food deficit areas but also within marginalized sections in areas with surplus food production. The Government of Nepal has not paid adequate attention to food security at the national level. Nepal also has food insecurity because the country is a net food importer. The national food deficit average is 14.3 per cent which varies between 79 per cent for hilly areas and 7 per cent in the plains (FAO, 2010).
In Pakistan since there is a continuous increase in popula-tion, there is also an increase in food demand. In order to address its food insecurity problems, Pakistan focused on wheat produc-tion and it has doubled production in the last 30 years but over time there have also been changes in the composition of food intake. This has resulted in the share of wheat in total calorie consumption decreasing. In spite of improvements in aggregate food production, malnutrition is still prevalent in Pakistan. For instance, around 33 per cent of all pregnant women were mal-nourished in 2010 and in 2001-02 more than 30 per cent of all infant deaths were mainly because of malnutrition. As per a UNICEF study, in 2001-02 about 38 per cent of the children less than five years were moderate to severely under-weight. FAO (2008) reported that the overall under-nourishment was about 24 per cent in 2004, which was the worst in South Asia after Bangladesh. Therefore, a higher national level food production in Pakistan does not reflect an increase in calorie-rich food in-take. This could be because of inequalities in landholdings and worsening incomes. Food insecurity is more in rural Pakistan than in the urban parts of the country. Despite the fact that food is produced in rural areas, a majority of the poor have lesser ac-cess to food as compared to those in urban areas. Landholdings, education and employment are the main determinants of house-holds’ economic access to food. Food insecure people in rural as well as in urban parts mostly depend on the market for obtaining food. Reliance of the urban poor on the market for food is well acknowledged but landless poor, small and marginal farmers in rural part also depending on the market for food to a great extent is not. All landless rural households (45 per cent of the total rural population) and 30 per cent landed households also rely on the market for food (Ahmad and Farooq, 2010).

Support for Smallholder Agriculture and its Implication for Food Security 73
2.7.2 India
In the last quarter century, the Indian economy has experienced structural changes. During this period, agriculture’s share in GDP has declined and that of manufacturing and services has increased. In 1991, agriculture’s share in GDP was 29.4 per cent, after a decade it had decreased to 22.9 per cent, in 2011 it was 18.4 per cent and in 2015 it had gone down to 17 per cent. Although agriculture’s share is declining, it still employs around half of the total employed in India (World Bank data). On the one hand there is a jobless growth in the manufacturing and service sectors (Kannan and Raveendran, 2012) and on the other hand agriculture is getting lesser space in macroeconomic policy since the early 1990s (Jha and Negre, 2007). Given this situation, the agrarian question is not dead; instead it is more pertinent (Moyo et al., 2015). The neo-liberal economic regime since the early 1990s has affected the rural economy adversely (Jha, 2007). According to Patnaik (2012: 27):
…as the pursuit of an autonomous capitalist development has been compromised in the neoliberal period, the Indian peasantry has come under severe strain and, in many ways, this is reminiscent of the colonial rule when policies similar to neo-liberalism prevailed.
The current macroeconomic policy relating to agriculture is derived from WTO’s global competitiveness view which can only produce mass marginalization and pauperization (Amin, 2012). Due to the trade liberalization policy, developing coun-tries have experienced falling per head output of basic staples, se-verely undermining food security for their populations (Patnaik, 2012). In the post-independence period, the Indian agrarian economy could do better because of limited land reforms and public investments. Although there are some cyclical fluctua-tions but since the inception of neo-liberal reforms which led to globalization, privatization and de-regulation, the crises in the agrarian economy have started aggravating. The compound an-nual growth rate of agricultural output between 1985-85 and 1994-95 was 4.1 per cent which decreased to 0.6 per cent be-tween 1994-95 and 2004-05 (Athreya, 2013). Other than the stagnation in agricultural output the prices received by farmers
74 Food Security for Small Farmers
also declined in the same period. After 1987 the ratio of prices received by farmers and the prices paid by them fell sharply indi-cating rising prices of agricultural inputs (Jeromi, 2007). These trends raise questions about the profitability of agriculture in India. This might also be the reason behind farmers’ willing-ness to quit agriculture. As per NSSO (2005), 40 per cent of the farmers disliked agriculture, 27 per cent reported that it was not profitable, 8 per cent said it was risky and 5 per cent reported other reasons for their dislike (Nagraj, 2008). During the same period, India also experienced food inflation but that did not reach smallholder farmers (Chandrasekhar, 2013).
The Indian Agrarian Community
As per the National Sample Survey (NSS) (2013) rural India had 90.2 million agricultural households or about 57.8 per cent of the total rural households. Poorer states (in terms of per capita income) constituted a higher share of agricultural households than the national average. Madhya Pradesh, Uttar Pradesh, Rajasthan and Haryana had a larger share of agricultural households in total rural households. Socially deprived catego-ries in India constituted more than three-fourth of the agricul-tural households. Schedule Castes, Schedule Tribes and Other Backward Communities constituted around 16 per cent, 14 per cent and 45 per cent respectively of the total agricultural house-holds. The ownership of land had a socioeconomic pattern from where inequalities in the agrarian sector generated. In India, as per NSS (2003-04), more than 40 per cent of the households in the rural areas did not own any productive land. It was also found that between 1992 and 2003-04, inequalities in owner-ship of land increased (Raval, 2008).
The concentration of land in a few hands and dependence of a large portion of the population on agriculture reflects a tenant-rentier relationship to a great degree. There is also a trend of the marginalization of the Indian peasantry as the number of small and marginal farmers is increasing. It was found that in 2012-13, the percentage share of ST agricultural households increased from the lowest size class of land possessed and reached its maximum in the size class of 1.01 to 2.00 hectares and then gradually decreased

Support for Smallholder Agriculture and its Implication for Food Security 75
to its lowest level at the highest size class. The percentage share of SC agricultural households decreased gradually from 28 per cent in the lowest size class to about 3 per cent in the highest size class of land possessed. OBC agricultural households had an almost uni-form distribution over different size classes of land possessed ex-cept for the lowest and highest size classes where they had slightly higher shares than the share of the ‘all sizes’ class.
It was also reported in NSS (70th Round) that even after being involved in agriculture, the primary source of income for 22 per cent of the agricultural households was wage labour. Out of the total agricultural households, less than 64 per cent house-holds reported agriculture as their primary source of income. Agricultural activities were the main source of income for a bulk of the households in all the major states, except Kerala where about 61 per cent of the agricultural households reported earning maximum incomes from sources other than agricultural activi-ties. More than 80 per cent of agricultural households in Assam, Chhattisgarh and Telangana reported agricultural activity as their principal source of income.
In terms of landholding patterns there is a significant in-crease in the number of marginal farmers and such farmers have to rely primarily on wage work to earn their livelihoods. Further, chronic indebtedness in rural India is enormous. As per the situ-ation assessment survey (2013), only 42.9 per cent of the agricul-tural households could access the formal banking system for loans. Most of the households had to rely on informal moneylenders who charged very high interest rates. There is also a negative correlation between smaller land ownership and access to the formal money lending system. The formal banking system is not equally acces-sible to all sorts of farmers. Marginal farmers have lesser access to institutional credit (NSSO, 2014). The same survey reveals that the outstanding loan per agricultural household was Rs 47,000. Financial liberalization has aggravated the situation as it has pre-vented government interventions in the allocation of credit, en-couraging the private banking system and lowering capital control by the banking system (Chandrasekhar and Ghosh, 2002).

76 Food Security for Small Farmers
Agricultural Production
Making food available is the first step towards eradicating hunger. Food insecurity in many part of the globe is primar-ily because of unavailability of food grains either because of a fall in food production (Kannan, 2000) or because of the export orientation of the country (Patnaik, 1997). Continued growth in agricultural production in India began during the 1950s and later the green revolution contributed to increasing agricultural production through technological changes but this increase in production had its own spatial pattern (Deokaret, 2013; Kurosaki and Wada, 2015; Mathur et al., 2006). In the last two and a half decades, total food grain production in India has in-creased from 176 million tonnes to 252.68 million tonnes (RBI, 2015). However, the growth in productivity is not the same across states. Even within a state, there are regional disparities (Mohanty, 2009). In the post- liberalization period the country is diversifying its agriculture in favour of high value commodities like vegetables and fruits. This diversification is influenced by price policy and market infrastructure (Joshi et al., 2004). It is also noticed that more land is being brought under cash crop cul-tivation (Gomathy, 1993). Post-liberalization the export oriented macroeconomic policies have adversely affected the food security of the country (Patnaik, 1997).
A Profile of Food Security Indicators and Correlates: India
India is home to the largest number of hungry people in the world. Out of 119 countries India’s position is 94th in the Global Hunger Index. According to NFHS (2005–06), 30 per cent of the new born babies were of low birth weight (LBW) and 47 per cent of the children were under-weight (MSSRF, 2008). As per the same report the share of under-weight children in urban areas was 36 per cent and that in rural areas was 49 per cent. There has been no improvement in the rural-urban divide. Levels of wasting and stunting are higher in rural areas. Apart from rural-urban differ-ences, there are also interstate disparities (Kumar, 2007).
Table 2.11 provides an overview of food security indica-tors in India. The proportion of under-nourished population

YearTotal population (millions)
Prevalence of under-nourishment (%)
Depth of the food deficit (kcal / capita / day)
Prevalence of food inadequacy (%)
Per cent of arable land equipped for irrigation (%)
1990-92 886.3 45.6 165 33.1 30.5
1991-93 903.7 44.8 154 31.4 30.61992-94 921.1 41.3 156 31.6 31.1
1993-95 938.5 37.9 154 31.4 31.8
1994-96 955.8 35.4 151 30.9 32.81995-97 973.1 35 142 29.7 33.81996-98 990.5 35 133 28.2 34.7
1997-99 1,007.7 34.1 125 26.9 35.6
1998-00 1,025 31.3 120 26.1 36.6
1999-01 1,042.3 28.1 118 25.7 37.6
2000-02 1,059.5 25.4 122 26.5 38.4
2001-03 1,076.7 23.3 131 28 39.12002-04 1,093.7 21.4 141 29.8 39.6
2003-05 1,110.5 19.9 149 31.2 40.1
2004-06 1,127 19 152 31.7 40.6
2005-07 1,143.2 18.5 146 30.8 41.1
2006-08 1,159 17.8 134 28.8 41.6
2007-09 1,174.6 16.8 122 26.8 41.9
2008-10 1,190.1 15.6 115 25.4 42.2
2009-11 1,205.6 14.5 112 24.9 42.4
2010-12 1,221.2 13.6 111 24.7 42.6
2011-13 1,236.7 13 110 24.6 NA
2012-14* 1,252.1 12.5 110 24.6 NA
2013-15* 1,267.3 11.8 110 24.4 NASource: Compiled from FAO’s Food Security Indicators. Note: *Estimated.
Table 2.11: Food security status (1990 to 2016)
Support for Smallholder Agriculture and its Implication for Food Security 77

78 Food Security for Small Farmers
declined from 45 per cent in 1990-92 to 12.5 per cent in 2012-14 and it is estimated to decline to 11.8 per cent by the end of 2013-15. But very less has been achieved in terms of reducing the depth of food deficit (kal/capita/day). The depth of food deficit was 165 (kal / capita / day) in 1990-92 and it was still 110 (kal /capita / day) in 2013-15. Even after reducing the proportion of under-nourished population to 12.5 per cent, 24.5 per cent of the population suffered from food inadequacy. Not much has been achieved on the irrigation front as the percentage of arable land which is irrigated had increased only to 42.6 per cent by 2010-12 from 30.6 per cent in 1990-92.
When it comes to providing basic services the state has failed although per capita GDP increased from US$ 1,501 in 1990 to US$ 4,192.3 in 2012 (Table 2.12). The proportion of the population having access to improved water sources in-creased from 70.3 per cent in 1990 to 92.6 in 2012. The propor-tion of population having access to basic sanitation facilities in-creased only from 17.7 per cent in 1990 to 36 per cent in 2012. Moreover, the prevalence of anaemia among pregnant women increased from the 51.8 per cent in 1990 to 53.6 per cent in 2011 and 31.3 per cent of the children under the age of five years were suffering from anaemia in 2011.
Investments in Agriculture
During the first Plan period, the government made sig-nificant promises regarding the rural economy but its priorities changed in the very next Plan. As a share of GDP, expenditure in the rural economy increased from 1.9 per cent in the 1970s to 2.8 per cent in the 1980s (Jha and Acharya, 2011). Since the early 1990s insufficient capital formation has been a main factor leading to a slower pace of technological change and agricultural infrastructure in India that has adversely affected agricultural productivity and output. The government is choosing to decrease agricultural investments in comparison to other expenditures. The decline in agricultural investments started in the 1980s and continued thereafter. The share of agricultural investments to total public investments was 15.3 per cent in 1980-81 which declined to less than 8 per cent by 2009-10 (Dhavan and Yadav, 1997; Himanshu, 2012; Jha and Acharya, 2011).

Year
GDP per capita (in purchasing power equiva-lent, constant 2011 interna-tional $)
Population with access to improved water sources (%)
Population with access to sanitation facilities (%)
Prevalence of anaemia among pregnant women (%)
Prevalence of anaemia among chil-dren under 5 years of age (%)
1990 1,501.1 70.3 17.7 51.8 53.8
1991 1,561.6 71.4 17.8 52.2 52
1992 1,666.7 72.4 18.7 52.5 49.9
1993 1,770.4 73.4 19.5 52.9 47.9
1994 1,894.7 74.5 20.4 53.3 45.9
1995 2,041.8 75.5 21.2 53.6 44
1996 2,197 76.5 22.1 54 42.1
1997 2,339.3 77.6 22.9 54.3 40.2
1998 2,436.5 78.6 23.8 54.5 38.5
1999 2,514.8 79.6 24.6 54.8 37.1
2000 2,649.7 80.6 25.5 55 35.8
2001 2,778.4 81.6 26.3 55.1 34.7
2002 2,919.9 82.7 27.2 55.2 33.7
2003 3,085.3 83.7 28.1 55.3 33
2004 3,278.4 84.7 29 55.3 32.3
2005 3,484.9 85.7 29.9 55.2 32
2006 3,687 86.7 30.7 55 31.5
2007 3,907.3 87.7 31.6 54.7 31.3
2008 4,084.8 88.7 32.5 54.4 31.1
2009 4,260 89.7 33.4 54.2 31.1
2010 4,486.3 90.7 34.2 53.9 31.1
2011 4,717 91.6 35.1 53.6 31.3
2012 4,912.3 92.6 36 NA NA
2013 5,124.6 NA NA NA NA
Table 2.12: GDP and basic services (1990 to 2013)
Source: Compiled from FAO’s Food Security Indicators.
Support for Smallholder Agriculture and its Implication for Food Security 79

80 Food Security for Small Farmers
There has been an increase in the use of inputs in Indian agriculture. Irrigation increased from 17 per cent to 41 per cent of total cultivated area between 1950–51 and 2003–04. In the same period, fertilizer consumption increased from less than 1 kg per hectare to 90 kg per hectare. The area under high yielding va-rieties as a per cent of total cropped area increased from 15 to 75 per cent between 1970-71 and the late 1990s. Agriculture’s share in total electricity consumption in the country increased from 4 per cent in 1950–51 to 30 per cent in 2003-04 (Dev, 2012).
Input subsidies are the most crucial aspect of India’s policy on food and agriculture. These require gradually larger budget shares. Subsidizing agricultural inputs is an effort to keep farm costs low and increasing production. The Government of India pays fertilizer producers directly for selling fertilizers at lower than market prices. On the other hand, the government supplies irrigation and electricity directly to the farmers at prices below the cost of production.
Under the price control subsidy system, the government subsidized phosphatic, potassic and nitrogenous fertilizers. Just after adopting the new economic policies, the government de-controlled phosphatic and potassic fertilizers. This resulted in a sharp increase in their prices and also a dramatic fall in their use. Considering the importance of such fertilizers and to make these fertilizers available to farmers at prices less than the market price the union government started giving a concession for decontrolled phosphatic and potassic fertilizers in 2002 (Mullen et al., 2005). The use of fertilizers is inversely related to the size of the farm, that is, use of fertilizers per hectare is more for small and marginal farms. This is true for both irrigated as well as un-irrigated areas. As per one study, use of fertilizers per hectare by marginal farmers increased in irrigated areas from 100 kg in 1980-81 to 252 kg in 2001-02. During the 1980s the consumption of fertilizers was al-most the same for all farm sizes but by 2001-02 this had increased for small and marginal farms (Dev, 2012).
There were changes in agricultural productive forces dur-ing the early 1980s with the entry of tractors in a major way. With the help of good access to subsidized credit, it was primarily
Support for Smallholder Agriculture and its Implication for Food Security 81
the big landowners who bought tractors. This technically trans-formed agricultural production and processing. Technical chang-es in agriculture led by tractors were not only limited to big landholders but smallholders also started using tractors and this soon became a common practice. The use of tractors started not only for ploughing but also for winnowing and threshing. This technical change benefited big landholders to a great extent as they rented out their tractors to small and marginal farmers. This way, small and marginal farmers were not able to use the subsidy equally. Subsidies for tractors or other forms of mechanization helped big farmers more (Vaddiraju, 2013).
Electricity is another extensively used input in agricul-ture. In most states, electricity for agriculture is provided at very low prices and in some cases it is even free. Subsidies for agricultural electricity in India have generated noteworthy ben-efits. They have helped increase agricultural output and food security. Since electricity is used for extraction of groundwater (tube wells or dug wells) so the ownership of these wells decides the direction of the electricity subsidy. The distribution of shal-low tube wells and dug wells’ ownership is more skewed toward small and marginal farmer (Badiani et al., 2012). Getting the benefits of the electricity subsidy also depends on the supply of electricity. Apart from inefficient electricity supply Bassi (2015: 64-65) says:
In most parts of Eastern India, groundwater is shallow and a majority of farmers depend on rented diesel pumps or cheap Chinese diesel pumps to abstract groundwater. Cost of Chinese pump varies from Rs 7,000 (for 3 hp) to Rs 8,500 (for 5 hp) (Shah et al 2009). Contrary to this, the cost of a solar irrigation pump varies from Rs 4,00,000 to Rs 4,50,000. Even after getting a subsidy of, let us say, 75per cent, farmers have to pay around Rs 1,00,000 to Rs 1,12,500 per unit. It is almost impossible for small and marginal farmers in Eastern India to shell out this money.
Irrigation is the other major input and biggest driving force in agriculture. India lacks water resources for irrigation (GoI, 2012). Realizing both the protective and productive roles of irrigation the Government of India has undertaken many large

82 Food Security for Small Farmers
projects to bring more areas under irrigation. After the Fourth Five Year Plan the gap between the irrigation potential created and utilized started increasing. Around 85.03 Mha of irriga-tion potential was created under Accelerated Irrigation Benefit Programme (AIBP) till March 2013. The Eleventh Five Year Plan also prioritized the completion of on-going irrigation projects on time and in a cost effective manner. The Plan targeted cre-ating an additional irrigation potential of 16 Mha (major and medium -- 9 Mha, minor surface irrigation -- 1.5Mha and minor groundwater projects -- 4.5Mha). The government’s investments in minor irrigation based on groundwater have not been very large as compared to its investments in surface water. Private ex-penditure is large in groundwater irrigation investments. In India development of groundwater irrigation has not been uniform. Further, there has been over-exploitation of groundwater irriga-tion in states such as Punjab, Gujarat, Haryana, Andhra Pradesh and Rajasthan (GoI, 2012). In a majority of the states groundwa-ter is the largest source of irrigation. There has been a depletion in the water table due to over-dependence on deep drilling of groundwater, especially through tube wells. Presently tube wells account for nearly 40 per cent of the irrigation. Groundwater irrigation requires high capital investments with the result that it has become very difficult for small and marginal farmers to enjoy the benefits of groundwater irrigation. So the groundwater revo-lution which was primarily fuelled by private investments has left small and marginal farmers out of the benefits of an extension in irrigation (Joshi, 1997).
The other issue regarding agrarian infrastructure is the credit system. An informal credit sector exists in almost all the villages in India. The growth of formal credit has not been suf-ficient to end the supremacy of informal lenders. There is also a difference in access to formal lending across caste and class (Swaminathan, 2012). In the 1990s, there was a sharp fall in credit flows to agriculture which also side-lined small and mar-ginal farmers in the supply of agricultural credit. In the 2000s when direct lending to agriculture increased, it was more ori-ented towards large agricultural business enterprises rather than on marginal and small farmers. After 1990, small and marginal

Support for Smallholder Agriculture and its Implication for Food Security 83
farmers were increasingly side-lined in terms of formal credit sup-ply. This decline was persistent both in terms of lending amounts as well as the number of accounts.
The share of loan accounts held by small and marginal farmers declined in the 1990s and in the 2000s. Outstanding credit per account for big farmers was more than that for small and marginal farmers and this difference in outstanding credit per account between big farmers and small and marginal farmers has increased over the years (Ramkumar, 2007). As a result of acute agrarian distress, the Government of India introduced the Agrarian and Rural Debt Relief (ARDR) scheme in 2008-09. Some provisions were made in the scheme to waive off the debts (from formal sources) of small and marginal farmers. Since most of the small and marginal farmers borrowed from the informal sector, they were excluded from the scheme (Ramkumar, 2013).
Price policy plays an important role from the point of forward linkages in agriculture not only for producers but also for consumers. India’s agricultural price policy is also crucial for achieving food security. The enormous tasks of production, pro-curement and distribution are not possible without the efficient working of the country’s price policy. Price intervention was adopted as part of the policy on the green revolution to increase agricultural production. Price intervention was meant to incen-tivize production by setting a remunerative and cost plus price for certain agricultural products.
Minimum support price (MSP) includes 24 major crops, primarily food grains. The Commission for Agricultural Costs and Prices (CACP) recommends different prices for producers, while the government by announcing the MSP guarantees the purchase at these prices. Nevertheless, the benefit of support prices is not equal for all landholding classes. The union gov-ernment’s procurement agency, the Food Cooperation of India (FCI) itself admits to this. The recommendations of a FCI high level committee say, ‘FCI needs to be pro-active, mobilizing state and other agencies to provide benefits of MSP and procurement to larger number of farmers, especially small and marginal ones’ (FCI, 2015: v). This is a result of the continuous failure of the

84 Food Security for Small Farmers
procurement agency in procuring from all small and marginal farmers. The recommendations note that farmers (primarily small and medium) are facing the problem of distress selling of agricultural products at prices which are far below MSP in states like Uttar Pradesh, Bihar, West Bengal, Assam etc. (FCI, 2015). The study also found that some small and marginal farmers sold better varieties of food grains and bought lower qualities for con-sumption. Small and marginal farmers often sold their outputs at relatively low prices just after the harvest to cover their cash expenses. Because of higher prices in the market, large farmers benefited because they produce to sell large portions of their pro-duce but smaller farmers lose because they are net buyers of food (Chandrasekhar, 2013).
The post-1990 period is also marked by the withdrawal of some other institutional support to agriculture. In 1995, India joined WTO, which resulted in a fall in output prices and also a reduction in subsides which subsequently resulted in higher input costs. Higher input costs were not equally compensated by an increase in support prices by the government. The MSP administered by the union government was not available to all farmers, especially small and marginal farmers (Ramkumar, 2013).

An Assessment of Public Investment
Priorities in Agriculture: With Reference to Food and Nutritional
Security of Smallholder Agriculture
3.1 Introduction
Issues relating to the agriculture sector, for example, key de-terminants of agricultural development, role of agriculture in overall economic transformation, trends and patterns of public investments in rural infrastructure and agriculture research and education have engaged the attention of several policy analysts and academics in recent times. It is well-acknowledged that a growing agriculture and allied services sector is expected to con-tribute vastly to overall economic growth and poverty alleviation, particularly in less developed countries. In these countries, public investments are considered a critical factor for augmenting capi-tal formation in the agriculture sector and for sustaining private investments. Although there have been strong linkages between increased public expenditure and growth in the agriculture sec-tor, prioritization of such expenditure has never been realized in the annual public budgets of these countries. If this trend is not reversed through adequate public provisioning, the growth of this sector will be far from reality. Hence, public investments in the agriculture sector are viewed as one of the most important and effective strategies for economic growth and poverty reduc-tion in rural areas.
Chapter 3
86 Food Security for Small Farmers
The agriculture sector in developing countries, which is dominated by small and marginal holders and farm labourers, provides livelihoods to a major chunk of the population, espe-cially in rural areas. Nonetheless, other sectors like industries and services also play a crucial role in developing these economies. However, developing these sectors depends primarily on the ag-riculture sector as a supplier of raw materials. Hence, developing agriculture will not only ensure the overall growth of the econ-omy in developing countries, but also provide sustained food and nutrition security to smallholder farmers. Further, available literature has also established that long-term and sustainable de-velopment of any economy can only thrive with a growth of ag-riculture. In such a scenario, the importance of appropriate rural infrastructure, physical as well as social, in facilitating agricul-tural development and the role of public investments therein are of critical concern at this juncture. But the irony is that due to inadequate attention in the overall policy framework followed by lack of budgetary support, the agriculture sector has been facing the largest brunt of under-productivity and hence, agriculture as an occupation has become unviable.
As noted earlier, available literature suggests that there exists a strong positive correlation between public investments in agriculture and economic development, especially during the post-World War-II period. In this regard W. Arthur Lewis’s contribution is probably one of the most significant . Lewis (1954) proposed a two-sector stylized model and argued that by transferring the relatively low-productive labour from the ‘tradi-tional’ sector, namely agriculture, to a relatively higher produc-tive sector, namely industry, the savings constraint can be eased considerably. He further argued that reinvestment of surplus (that is, profits) by the modern sector can lead to sustained ac-cumulation, and the rising share of profits in the national in-come will facilitate the further expansion of the modern sector in particular and of the economy as a whole in general. One of the early formal presentations of the Lewis model was the crucial message from Fei and Ranis’s (1961) analysis which stated that in the early stages of economic transformation, the agriculture sec-tor is called upon to make a substantial net surplus contribution.

An Assessment of Public Investment Priorities in Agriculture 87
At this stage, further economic growth becomes conditional on technological progress, innovational intensity etc.
The Lewis model was so influential that a number of two-sector growth models have addressed the issue of inter-sectoral resource flows. However, all these models had typical neo-classi-cal features in which full employment was guaranteed by a flex-ible real wage rate. For instance, Schultz (1964)1 argued that any withdrawal of workers from agriculture for industry will, ceteris paribus, result in a reduction in agricultural output. Jorgenson’s key result is that if technological changes in agriculture are not rapid enough, the agriculture sector can never produce either food surplus or productively release its ‘labour surplus’ to the industry relative to population growth. Hence, there have been arguments made for appropriate investments in agriculture in general, and for agriculture research and education in particular not only to increase agricultural production but also for deriv-ing its multi-pronged effects like: (i) supply of wage goods; (ii) improving the ability of agriculture to provide industrial capital through foreign trade; (iii) augmenting rural incomes and pur-chasing power by strengthening the demand for industrial and non-agricultural goods along with an expansion in the use of modern technologies. These arguments emphasize the impor-tance of prioritizing agricultural development to foster better linkages between agriculture and the rest of the economy with adequate investments (both public and private).
By the late-1970s/early-1980s, there was considerable lit-erature to suggest that agriculture itself can: (a) play a major role in providing incomes, food and savings to the rest of the economy; (b) be a provider of a whole range of raw materials needed for many industries, including small and village industries; (c) con-tribute foreign exchange through exports which in turn can facili-tate the import of capital goods and critical machineries needed for industrial advancement; and, more importantly, (d) be critical in
1 It is worthwhile to note that in his Nobel Prize Lecture (which he shared in 1979 with Lewis) he summarized his motivation for research in agriculture as: ‘most of the people in the world are poor, so if we knew the economics of being poor, we would know much of the economics that really matters. Most of the world’s poor people earn their living from agriculture, so if we knew the economics of agriculture, we would know much of the economics of being poor.’

88 Food Security for Small Farmers
expanding the domestic/internal market for the goods and services produced by the non-agriculture sectors (Jha, 2009).
A number of empirical works have also documented the vital importance of agriculture in the economic structures of many developing countries and have shown agriculture’s poten-tial in a transformative role in addressing concerns of widespread poverty, hunger and malnutrition. Widely accepted and detailed analyses of the historical experiences of agriculturally-dependent countries suggest that it would be very difficult to have any eco-nomic growth or diversification into industry in these countries without widespread fundamental improvements in agricultural productivity growth occurring first (The World Bank, 2008). While government spending is an effective instrument for pro-moting agricultural growth and poverty reduction, an assessment of its impact remains complicated. Many factors influence the relationship between public spending and development out-comes which act in complex, and at times, contradictory ways such as the time lag between the investments made and the benefits reaped. Nonetheless, an examination of the impact of public spending in agriculture and on other ‘public goods’ such as education, health and roads on growth, welfare and poverty reduction in select countries, reveals that agricultural spending has the largest positive effect on growth and poverty reduction compared to any other public good (Fan et al., 2009).
Agriculture is the largest sector in many developing coun-tries not only in terms of its share of gross domestic product (GDP) and employment, but three-quarter of the world’s poor live in rural areas and depend on agriculture for their livelihood. However, the food and nutrition security of this vast majority (almost 85 per cent are small and marginal farmers) is at stake due to continued negligence of public investment priorities. In addition, inappropriate market structures, lack of proper rural infrastructure facilities, slow progress on technological innova-tions, non-expansion of irrigation facilities, lack of appropriate policies for subsidised inputs and above all inadequate prepared-ness to counter the brunt of nature have made agriculture an unprofitable occupation. Despite knowing the fact that a ‘one per cent increase in agricultural per-capita GDP could reduce

An Assessment of Public Investment Priorities in Agriculture 89
the poverty gap five times more than an equal increase in another sector of the GDP,’2 it is disheartening to note that policymakers have not paid adequate attention to it.
More importantly, despite the obvious presence (for in-stance, about 80 per cent of the farmland in sub-Saharan Africa and Asia is managed by smallholders and they provide up to 80 per cent of the food supply) of smallholder farmers in most of the countries in the global South, with significant contributions to the total value of agricultural outputs,3 their economic vi-ability and contributions to diversified landscapes and cultures is threatened by competitive pressures from globalization and integration into a common market. Many empirical studies have also confirmed the inverse relationship between farm size and productivity per hectare. Small farmers are characterized by smaller applications of capital but higher use of labour and other family-owned inputs, and a generally higher index of cropping intensity and diversification. However, continuous pressure from land grabbers and inadequate attention by policymakers makes them more vulnerable.
A high proportion of the agricultural workforce4 in de-veloping countries is indicative of its prominence in providing livelihoods in these economies. These trends are suggestive of the imperativeness of following an agriculture-based growth strategy in developing economies. It is relevant to note that of late there has been a realization on the part of developed countries to sup-port policies which are agriculture-centred. Essentially, this re-alization at the international level has to be a global policy focus on agriculture-centred growth. The envisaged approach of such a growth-led strategy is governed by five principles: (i) no one-size-fits-all model for agriculture exists; (ii) the underlying prob-lems must be addressed by investing in everything from better
2 ‘Smallholder farmers key to new agricultural revolution (2013)’, available at: http://www.ecobusiness.com/news/smallholder-farmers-key-new-agricultural-revolution/.3 For example, in India their contribution to total farm output exceeds 50 per cent although they cultivate only 44 per cent of the total arable land.4 The term ‘workforce’ refers to those who are employed. This is thus a sub-set of ‘labour force.’ The number of ‘unemployed’ work seekers expressed as a percentage of ‘labour force’ gives the unemployment rate.

90 Food Security for Small Farmers
seeds to risk-sharing programmes, in particular to protect small farmers; (iii) multiplied impacts can be realized by involving all stakeholders to work together at the country, regional and global levels; (iv) the expertise and resources of multilateral institutions should be roped-in for better reach; and (v) long term commit-ment and accountability should be pledged.
Hence, public policy in favour of increased public invest-ments in agriculture will not only play a crucial role in shaping the overall agricultural development of the world, but also equi-table economic development which is hunger and malnutrition free. This is important as hunger and malnutrition are prevalent in most of the under-developing economies. On the other hand, there are instances of countries which have experienced negative consequences of not prioritizing their public investment policies towards this sector. For instance, economic policies that were implemented in Latin American countries in the 1990s were based on economic and trade liberalization. This exposed rural economies to the forces of the market and resulted in lower pub-lic investments in rural areas and consequently the incidence of rural poverty started climbing up, with increasing poor health and malnutrition. It is thus clear that the neo-classical approach relying on ‘price responsiveness and market corrections’ will not work for agricultural transformation, particularly in developing economies with less developed institutions and markets. While price incentives have a role, a complex combination of factors such as the political-economic structure, social institutions and public interventions in a whole range of areas are critical in de-termining the pace and quality of agricultural transformation.
This theoretical argument is clear enough that if the poli-cies of sectoral investment are directed appropriately, the result-ing labour transfer will be ideal for deriving maximum welfare for society.
Given the role of public investments in agriculture in gen-eral and in smallholder agriculture in particular, at attempt is made here to look at the status of public investments in agricul-ture since the 1980s. Before looking at the trends with respect to public spending in agriculture and other sectors at the global and

An Assessment of Public Investment Priorities in Agriculture 91
regional levels and tracing the priorities such as spending and its associated concerns, it is pertinent to note the data sources for the analysis.
3.2 Data Sources
The analysis in this chapter largely relies on data (public in-vestments/expenditure towards the agriculture sector) available through secondary sources. The data provided by the International Food Policy Research Institute (IFPRI) in its Statistics on Public Expenditures and Economic Development (SPEED) database, has been used extensively. With regard to the definition of the agriculture sector and other sectors, relevant indicators of public investment data on agriculture, data on GDP etc. readers are advised to refer to the noted source. While analysing country specific data on public investment variables, for instance India in the South Asia region and Vietnam in the East Asia and Pacific region, we have also taken into consideration the performance of the other countries in the region, depending on the availability of data. In most of the variables, availability of data pertains to the period 1980 to 2012 and appropriate statistical tools are used for the analysis.
With regard to country-specific data on public invest-ments (particularly for India) in the ‘agriculture sector’ the study referred to available secondary sources -- Indian Public Finance Statistics, an annual publication brought out by the Ministry of Finance, Government of India. The analysis here, however, is re-stricted to the period 1990-91 to 2014-15. Public investments in the agriculture sector are defined as the sum total of budgetary expenditure on agriculture and allied services (which includes expenditure on crop husbandry, soil and water conservation, animal husbandry and dairy development), cooperation, food storage and warehousing (including food and fertilizer subsidy), expenditure on rural development and other related areas as well as on irrigation. As per the budgetary classification of expendi-ture, these are the line items from which one can broadly refer to public spending on the agriculture sector. Further, given the nature of the fiscal federal architecture in India, this includes expenditure

92 Food Security for Small Farmers
carried out by the central (federal) government as well as all the state (provincial) governments for the respective years. However, the expenditure carried out by the local governments towards the development of agriculture and other related sectors has not been captured along with the investments made by the private sector.
3.3 Public Investments in Agriculture
There is a strong argument that investments in rural infrastruc-ture, which is a ‘public good’ in nature (characterized by non-rivalry in consumption and non-excludability in provision) carry relatively long capital outlays and gestation periods for the returns to show. Thus, the state’s policy inaction can have serious and adverse consequences for sectoral development and the well-being of the people, where majority of its population dependent on their livelihoods.5 Many empirical research studies have shown the significant contribution of infrastructure in the successful adoption and utilization of research and technology for agricultural development. For instance, Thirtle et al.’s (2003) study using data for 44 developing countries in Africa, Asia and Latin America found that economic returns to agricultural re-search and technology were usually high in countries and regions with good rural infrastructure. In most developing countries the major deficiencies in rural infrastructure include inadequate fi-nancial institutions for mobilizing savings and disbursing credit to farmers (particularly small and marginal landholders); these have also been highlighted in studies. This indicates that adequate and appropriate investments in rural infrastructure in particular and public investments in the agriculture sector in general could be beneficial in harnessing the returns from these rural sectors.
It is a well-recognized fact that in the era of finance capital the priority of public investments in the agriculture sector across the globe has seen a disappointing trend. However, some also argue that the declining trend in agricultural spending has recent-ly started reversing, especially after the economic crisis followed
5 Alternatively, progressive state policy action in provisioning rural infrastructure, for example, rural roads and other means of connectivity, rural godowns and marketing infrastructure could be more effective and beneficial for the agriculture sector.

An Assessment of Public Investment Priorities in Agriculture 93
by the world food price crisis; this is partially true. Despite claims to the contrary, the agriculture sector as whole has never been prioritized in policy circles in the under-developed countries.
3.3.1 Global Public Investments in Agriculture
Looking at trends with respect to public spending in agriculture, education, health, defence, transport and communication and social protection during 1980-2012, it is clear that the world economies were spending only a little share of their respective GDP on the agriculture sector. In fact, the share of agriculture in total GDP in the world was 1.72 per cent in 1980, which declined to less than 1 per cent (0.83 per cent) in 2012. The av-erage of such spending during 1980 and 2012 was around 1.23 per cent (Figure 3.1 and Table 3.1).
Similarly, the share of expenditure on education, health, defence, transport and communication and social protection was 3.30, 2.08, 3.44, 2.66 and 5.24 per cent respectively of the world GDP in 1980, the shares of education, health and social protection increased, whereas the shares of defence and transport
Figure 3.1: Share of public spending on various sectors in total world GDP (1980-2012) (in per cent)
Source: Compiled from International Food Policy Research Institute (IFPRI) (2015).

94 Food Security for Small Farmers
Wor
ld19
8019
8519
9019
9520
0020
0520
1020
1120
12
% S
hare
of A
gric
ultu
ral
Expe
nditu
re in
Tot
al G
DP
1.72
1.66
1.32
1.16
0.90
0.87
0.88
0.86
0.83
% S
hare
of E
duca
tion
Expe
nditu
re in
Tot
al G
DP
3.30
3.42
3.36
3.81
3.65
3.84
4.24
4.12
4.33
% S
hare
of H
ealth
Exp
endi
ture
in
Tot
al G
DP
2.08
2.25
2.09
2.51
2.37
2.89
3.37
3.33
3.60
% S
hare
of D
efen
ce E
xpen
ditu
re
in T
otal
GD
P3.
443.
703.
052.
472.
191.
911.
911.
971.
88
% S
hare
of T
rans
port
and
C
omm
unic
atio
n Ex
pend
iture
in
Tota
l GD
P2.
622.
231.
891.
651.
371.
411.
891.
701.
62
% S
hare
of S
ocia
l Pro
tect
ion
in
Tota
l GD
P5.
245.
634.
734.
974.
885.
707.
297.
458.
14
% S
hare
of O
ther
Exp
endi
ture
in
Tota
l GD
P9.
6011
.13
10.0
911
.42
11.9
811
.63
12.0
212
.40
12.6
1
% S
hare
of T
otal
Exp
endi
ture
in
Tota
l GD
P28
.01
30.0
126
.52
27.9
927
.35
28.2
431
.60
31.8
233
.00
Tabl
e3.1
: Sha
re o
f pub
lic sp
endi
ng o
n va
riou
s sec
tors
in to
tal w
orld
GD
P (1
980-
2012
) (in
per
cen
t)
Sour
ce: C
ompi
led
from
Inte
rnat
iona
l Foo
d Po
licy
Rese
arch
Inst
itute
(IFP
RI) (
2015
).
An Assessment of Public Investment Priorities in Agriculture 95
and communication showed a decline in 2012. The crucial mes-sage that emerges from this data is that the trend of fiscal space (budgetary (public) spending out of world GDP did not show any increase over the period, since the increase in percentage was very negligible. Over a period of 32 years, the increase was only 5 per cent (Table3.1).
Hence, it is clear that public spending on the agriculture sector is the least priority among all the sectors in the global budget. In such a scenario, one cannot expect a good perfor-mance in the sector unless there is massive public spending, which in turn will attract private investments.
Similarly, with regard to the share of public spending in the agriculture sector (out of agri-GDP), the world was spend-ing around 6.53 per cent on the agriculture sector in 1990, this increased to 9.78 per cent in 2000; however it came down to 5 per cent in 2010 (Table 3.2). Though a reversal of such spending was observed in 2012 (16.39 per cent)indicating that there has been a spurt in public investments in the sector in recent years. So, on an average, the world is spending around 12 per cent of its agri-GDP on the agriculture sector. However, the share of agriculture spending out of the world’s total expenditure also portrays a declining trend. The world was spending around 5.55 per cent of its total budget on agriculture in 1990, this declined to 3.66 per cent in 2000 and it further declined to 2.98 per cent (almost half of its spending compared to the share in 1990) in 2012. However, the average of such spending stood at 4.76 per cent between 1980 and 2012 (Table 3.1).
The most important point to note here is that during 1990 extensive withdrawal of the states’ interventionswere noticed in all the sectors including the agriculture sector as well. However, the spending pattern in the East Asia and Pacific (EAP) region showed an increasing trend during the period with consistent growth in the Euro zone countries. In fact,high income countries increased their spending on agriculture (as measured with the GDP generating from the sector). On the other hand, it has also been noticed that regions like SSA and EAP have been spend-ing a larger percentage of their total budgets on the agriculture

96 Food Security for Small Farmers
sector as compared to high income and Euro zone countries. The expenditure share for the South Asia region was the highest (7.57 per cent) among the regions of the world (Table 3.2).
3.3.2 Public Investments in Agriculture (South Asia)
As noted earlier, the South Asian countries are primarily dominat-ed by agriculture as the prime mover of their economies in terms of contribution to GDP, share of employment and contribution to other sectors. However, when it comes to the priority given to the agriculture sector in public spending vis-à-vis other sectors like education, health, defence, transport and communication and so-cial protection, it seems that the agriculture sector has never been accorded priority in regional budgets. For instance, the share of ag-riculture in the total GDP of the region was 2.37 per cent in 1980, this declined to 1.55 per cent in 1995 and further to less than 1 per cent (0.97) in 2011. However, the data shows an increase in its share to 1.16 per cent in 2012 (Figure 3.2).
While comparing the share of agriculture spending in GDP with that of other sectors, the shares of education and defence spending were on an increase throughout the period (Figure 3.2). However, with respect to spending on the agricul-ture sector, the South Asian region clearly stands out as one of the forerunnerswhen compared to the other regions of the world
Figure 3.2: Share of public spending on various sectors in South Asian countries in total GDP of the region (1980-2012) (in per cent)
Source: Same as that for Figure 3.1
An Assessment of Public Investment Priorities in Agriculture 97
since 1980. The South Asian region is followed by the sub-Saharan African region.In comparison, spending on agriculture is not seen as a priority for high income countries. However, while looking at the percentage spending on agriculture in GDP in Asian countriesa declining trend is seen since the 1980s. The region spent 2.37 per cent of its GDP on agriculture in 1980 which reduced to 1.16 per cent in 2012 (Figure 3.2).
The most crucial message that emerges from the data pre-sented in Figure 3.2 and Table3.3 is the limited/inadequate fis-cal space of the region. The fiscal space of these economies has not increased much during the last 32 years. The share of total expenditure in the region was 18.17 per cent of its total GDP in 1980, which increased to 22 per cent in 2000. However, this share declined to 20 per cent in 2012. Further, whatever increase is seen in the fiscal space of the region, the increased spending went to defence and other sectors, and the agriculture sector never got a boost in public budgets.
As per available data on agriculture expenditure, six coun-tries in South Asia, including Indialocate the priorities of public spending in the agriculture sector. Country-wise priorities of public spending in the agriculture sector, across years, show that the average share of such expenditure for India was one of the lowest (1.01 per cent), only ahead of Pakistan (0.28 per cent) and Bangladesh (0.6 per cent), whereas Bhutan was spend-ing around 5.75 per cent of its GDP on the agriculture sector (Table3.4). Similarly, Sri Lanka was spending 2.61 per cent and Nepal was spending 1.6 per cent of its GDP on the agriculture sector. What is more important is that all the countries in the South Asian region show a declining trend in public spending on the agriculture sector since 1980, except Nepal.
However, among the South Asian countries, the average share of agriculture spending in agri-GDP from 1980 to the lat-est available data, Bhutan tops the list with 17.74 per cent fol-lowed by Sri Lanka at 13.44 per cent. India’s share is only 4.38 per cent. However, during 1990 it went up to 4.91 per cent and increased further to 7.68 per cent in 2009 but declined to 6.17 per cent in 2011. As a share of expenditure on the agriculture

98 Food Security for Small Farmers
Tabl
e3.2
: Sha
re o
f agr
icul
tura
l exp
endi
ture
in a
gri-
GD
P, to
tal e
xpen
ditu
re a
nd to
tal G
DP
acr
oss
regi
ons
of th
e w
orld
(19
80-
2012
) (in
per
cen
t)
Reg
ions
EAP
ECA
EUR
O
ZON
EH
IGH
IN
CO
ME
LAC
MEN
ASO
UT
H
ASI
ASS
AW
orld
Shar
e of
Agr
icul
tura
l Exp
endi
ture
in A
gri-
GD
P
1990
6.74
16.8
127
.45
13.6
23.
805.
194.
084.
916.
53
2000
7.70
5.96
25.3
625
.59
7.84
8.06
3.37
9.81
9.78
2010
20.1
08.
7528
.18
19.3
79.
7713
.75
5.57
0.17
4.97
2011
19.5
39.
8725
.73
18.7
88.
1914
.81
5.28
0.15
4.76
2012
21.2
810
.31
24.9
219
.76
10.6
814
.39
2.79
2.39
16.3
9
Aver
age
9.28
11.8
327
.11
17.8
58.
168.
033.
8813
.26
12.1
5
Shar
e of
Agr
icul
tura
l Exp
endi
ture
in T
otal
Exp
endi
ture
1990
6.86
10.5
13.
983.
154.
443.
706.
347.
915.
55
2000
5.76
3.94
2.27
2.02
2.69
3.30
4.24
4.95
3.66
2010
5.01
3.19
1.47
1.90
2.16
1.73
5.08
5.60
3.34
2011
4.97
3.06
1.46
1.87
2.31
1.71
5.59
4.94
3.17

An Assessment of Public Investment Priorities in Agriculture 99
Sour
ce: I
nter
natio
nal F
ood
Polic
y Re
sear
ch In
stitu
te (I
FPRI
)(20
15).
Reg
ions
EAP
ECA
EUR
O
ZON
EH
IGH
IN
CO
ME
LAC
MEN
ASO
UT
H
ASI
ASS
AW
orld
2012
4.73
3.18
1.31
1.94
2.76
1.64
5.93
4.73
2.98
Aver
age
6.38
5.57
2.89
2.56
3.19
3.19
7.57
7.03
4.76
Shar
e of
Agr
icul
tura
l Exp
endi
ture
in T
otal
GD
P
1990
1.45
3.69
1.51
0.71
0.75
0.96
1.55
1.71
1.32
2000
1.13
1.01
0.90
0.39
0.48
0.91
1.02
1.07
0.90
2010
1.13
0.99
0.65
0.46
0.47
0.52
0.94
1.37
0.88
2011
1.22
0.89
0.62
0.47
0.50
0.54
0.97
1.27
0.86
2012
1.16
0.98
0.57
0.51
0.58
0.49
1.16
1.19
0.83
Aver
age
1.33
1.75
1.28
0.59
0.63
0.93
1.80
1.60
1.23

100 Food Security for Small Farmers
sector in agri-GDP, Nepal has been portraying consistent growth throughout the years of analysis. While looking at budget shares, Bhutan spent around 15.83 per cent of its budget followed by Nepal (9.85 per cent) and Sri Lanka (9.0 per cent). India spent 6.58 per cent during 1980 and 2011 (Table3.4).
Again similar observations can be made when one looks at the share of public spending on the agriculture sector in the total budgets of respective countries since 1980s. As noted ear-lier, since the fiscal space of these countries has not shown any increase and budgetary prioritiesare seen in other sectors and not in agriculture, only a small fraction of their annual budgets actu-ally provisioned for agriculture, and hardly gave scope for capital formation in the sector. During 1980-2011, the average share of the total budget for the agriculture sector in India was only 6.58 per cent (Table3.4); this when a majority of its rural population (more than 70 per cent) depends on agriculture and the allied sector for their livelihoods.
3.3.3 Public Investments in Agriculture (India)
Due to inadequate policy attention, particularly on the agricul-ture sector since long, India’s countryside has come under tre-mendous pressure with respect to all the major relevant macro-economic indicators. It is well-documented that gradual changes in the country’s macroeconomic policy which started during the late 1980sled to a fundamental change in the overall macro-pol-icy framework with the opening up of the economy to the world marketby the early 1990s. This shift from a dirigiste regime to a market-driven policy regime has had profound implications for the well-being of the people, particularly in rural India. In rural India it is primarily the agriculture sector which continues to be the lifeline for millions. The state’s action through appropriate public policies would have had significant implications with re-gard to the overall performance of this sector. As has been repeat-edly acknowledged within the policy establishment, developing the rural areas should have remained the focus of India’s policy framework whereby the overall growth of the economy with in-clusiveness could be achieved.
However, decades of under-investment (public invest-ments) has posed a threat to rural communities with respect to
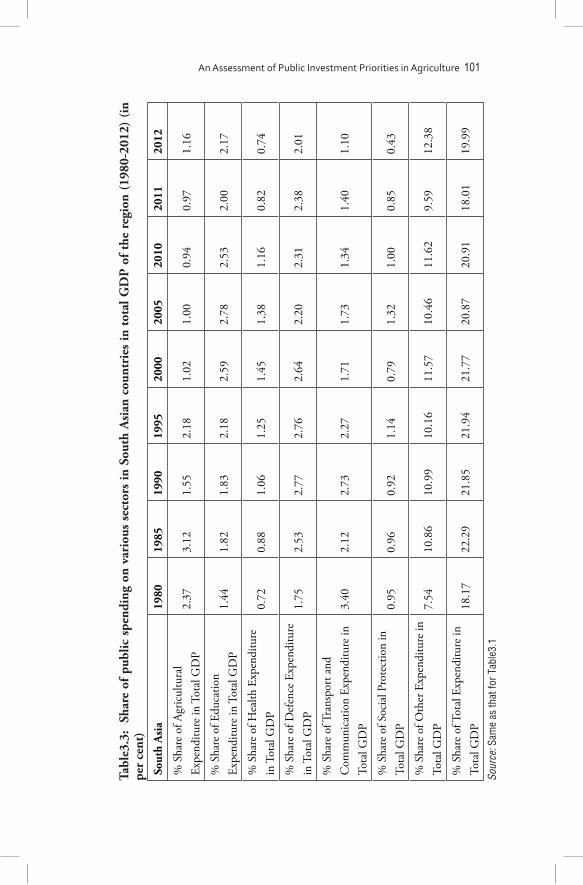
An Assessment of Public Investment Priorities in Agriculture 101
Tabl
e3.3
: Sh
are
of p
ublic
spe
ndin
g on
var
ious
sec
tors
in S
outh
Asi
an c
ount
ries
in t
otal
GD
P o
f th
e re
gion
(19
80-2
012)
(in
pe
r ce
nt)
Sout
h A
sia
1980
1985
1990
1995
2000
2005
2010
2011
2012
% S
hare
of A
gric
ultu
ral
Expe
nditu
re in
Tot
al G
DP
2.37
3.12
1.55
2.18
1.02
1.00
0.94
0.97
1.16
% S
hare
of E
duca
tion
Expe
nditu
re in
Tot
al G
DP
1.44
1.82
1.83
2.18
2.59
2.78
2.53
2.00
2.17
% S
hare
of H
ealth
Exp
endi
ture
in
Tot
al G
DP
0.72
0.88
1.06
1.25
1.45
1.38
1.16
0.82
0.74
% S
hare
of D
efen
ce E
xpen
ditu
re
in T
otal
GD
P1.
752.
532.
772.
762.
642.
202.
312.
382.
01
% S
hare
of T
rans
port
and
C
omm
unic
atio
n Ex
pend
iture
in
Tota
l GD
P3.
402.
122.
732.
271.
711.
731.
341.
401.
10
% S
hare
of S
ocia
l Pro
tect
ion
in
Tota
l GD
P0.
950.
960.
921.
140.
791.
321.
000.
850.
43
% S
hare
of O
ther
Exp
endi
ture
in
Tota
l GD
P7.
5410
.86
10.9
910
.16
11.5
710
.46
11.6
29.
5912
.38
% S
hare
of T
otal
Exp
endi
ture
in
Tota
l GD
P18
.17
22.2
921
.85
21.9
421
.77
20.8
720
.91
18.0
119
.99
Sour
ce: S
ame
as th
at fo
r Tab
le3.
1

102 Food Security for Small Farmers
Table3.4: Share of agricultural expenditure in agri-GDP, total ex-penditure and total GDP across countries in South Asia (1990-2012) (in per cent)
Country Bangladesh Bhutan India Nepal Pakistan Sri Lanka
Share of Agricultural Expenditure in Agri-GDP
1990 2.00 14.42 4.91 2.90 0.56 7.91
2000 1.55 12.59 4.16 2.34 0.45 6.85
2001 1.50 13.10 3.70 2.41 0.37 6.97
2009 5.91 20.36 7.68 4.43 3.53 10.77
2010 4.55 NA 6.18 5.07 2.58 9.60
2011 5.35 NA 6.17 4.76 0.77 9.45
Average 2.54 17.74 4.38 3.79 1.15 13.44
Share of Agricultural Expenditure in Total Expenditure
1990 4.67 14.45 8.33 8.47 0.83 5.75
2000 3.58 7.99 5.63 5.76 0.70 4.30
2009 8.92 11.18 7.70 6.86 4.40 5.71
2010 7.05 NA 6.26 8.63 3.06 5.56
2011 7.73 NA 6.51 8.54 1.03 5.47
2012 NA NA NA 8.96 2.90 NA
Average 5.89 15.83 6.58 9.85 1.57 9.00
Share of Agricultural Expenditure in Total GDP
1990 0.58 5.36 1.35 1.36 0.14 1.6
2000 0.37 3.37 0.9 0.86 0.12 1.08
2010 0.79 NA 1.04 1.68 0.6 1.23
2011 0.91 NA 1.01 1.66 0.19 1.14
2012 NA NA NA 1.71 0.61 NA
Average 0.6 5.75 1.01 1.6 0.28 2.61Source: Same as that for Table 3.1
their sustainability in occupations. Due to inadequate (inap-propriate) policy support from the state, agriculture’s viability as an occupation in India has come under tremendous strain. The widening gap between growth rates in the overall economy and in the agriculture sector has been a worrying concern for policy-makers. Although the performance of the agriculture sector during the Eleventh Five Year Plan (2007-12) was impressive, the overall

An Assessment of Public Investment Priorities in Agriculture 103
growth of the economy dropped to a low as compared to the last 15 years. For instance, the agriculture sector grew close to 4 per cent due to a spurt in public expenditure initiatives both by the union and state governments in India. But such public investment initiatives are still highly biased towards facilitating irrigated agri-culture in the country with huge subsidies providing benefits to large farmers. However, it is public support towards research and development, extension services and infrastructure development such as cold storages and market yards, which can have a higher impact on smallholders’ production and productivity, but they suf-fer due to inadequate public investments(Acharya, 2015).
It is equally true that prioritization of public expendi-ture towards the agriculture sector has not been seen in the Government of India’s annual budgets over the years. In fact most of the poorer states have been finding it hard to give a push to this sector in prioritizing their respective annual budgets due to inadequate fiscal space. Further, stringent and self-regulated budget management laws, under an arrangement of fiscal pru-dencehave restrained the states in putting in place resources for many sectors including agriculture since early 2000. Given such a scenario, India not only needs increased investments in agricul-ture for increased farm productivity of small and marginal farm-ers to achieve sustainable agricultural growth. Further, it is also important to analyse the prioritization of such investmentsfor small and marginal farmers by drawing existing policy linkages to strengthen and advocate meeting their needs.
Quantifying actual outcomes of public expenditure in any sector and so also in the agriculture sector has always been a complex task for policymakers. Defining the agriculture sector, what it constitutes of and its most direct and indirect linkages with other sectors with regard to degree of impact, has also been equally complicated. However, for the sake of simplicity, depending on a particular lens public expenditure items towards different compo-nents within the ‘agrarian sector’ of the union and state govern-mentsin India has been defined as expenditure on the following broad items: The first broad component of the ‘agrarian sector’ includes budgetary expenditure towards ‘agriculture and allied ser-vices and cooperation.’ The sub-components of the agriculture and

104 Food Security for Small Farmers
allied services sector include expenditure on crop husbandry; soil and water conservation; animal husbandry; dairy development; fisheries; other agricultural programmes (marketing and quality control); and cooperation and agricultural research and educa-tion. The second broad component of the ‘agrarian sector’ includes expenditure on food storage and warehousing, including food and fertilizer subsidy. The other components of the agrarian sector’s expenditure include expenditure on rural development and irriga-tion (which includes expenditure on major, medium and minor irrigation) and flood control and drainage.
There are arguments in favour of and against including other items such as expenditure on rural development items, particularly expenditure on rural employment and rural infra-structure-rural roads. Without negating the merits and demerits of such arguments, we keep the definition of the ‘agrarian sec-tor’ simple and look at only those items which directly impact the growth outcomes of the sector in the country. Before getting into a detailed examination of these, it is important to note the agriculture sector’s priority position in the Indian economy and comparing it with the other sectors.
As per the data presented in Table3.5, given India’s limited fiscal space of around 15 per cent of its total GDP (only for the union government), the country devotes only 1 per cent of its GDP to the agriculture sector, whereas the defence sector gets around 2 per cent of its GDP. While looking at the shares of the other sectors, particularly education and health, both the sectors have consumed less than half a per cent of its GDP since 1980. The share of social protection in the country’s GDP shows a de-clining trend and it had reached only 0.24 per cent in 2005 from 0.50 per cent in 1985 (Table3.5).
As per available data, India’s combined budget for the agriculture sector was around 16 per centin 1990-91, which de-clined to 13.3 per cent in 2000-01 (with many austerity meas-ures during the late 1990s and early 2000s). However, the trend has reversed in recent years as the country spent 15.3 per cent in 2014-15. Similarly, the share of agriculture sector spending which was 4.2 per cent of the country’s GDP during 1990-91, with ups and downs in the following years, remained the same in

An Assessment of Public Investment Priorities in Agriculture 105
2014-15 (Table 3.6 and Figure 3.3). The agriculture sector’s share in the country’s total combined budget expenditure reached its peak in 2008-09 (5.2 per cent).
While looking at priorities within the agrarian sector it is observed that agriculture and allied services and cooperation con-stituted 19 per cent of the share in 1990-91, which declined to 13 per cent in 2011-12 and reached 15 per cent in 2014-15. This indicates a declining trend since 1990-91. However, the share of food storage and warehousing, which includes food and fertilizer subsidy, increasedas it started with only 28 per cent in 1990-91, which increased to 42 per cent in 2011-12 and then declined to 38 per cent in 2014-15. This was due to an increase in the coun-try’s food subsidy bill over the period and also partially due to the enactment of the Right to Food Security Bill (Table 3.6).
Further, the share of rural development and others con-stituted was between 30-35 per cent of the total agrarian sector
Figure 3.3: Share of public expenditure towards the agriculture sec-tor in India’s combined expenditure6 and GDP
Source: Compiled from Indian Public Finance Statistics, Ministry of Finance, Government of India.
6 The data presented here has been compiled from the Indian Public Finance Statistics, which provides combined expenditure of the federal and provincial governments. As noted in the data source section, the expenditure figure is much higher compared to the data given in IFPRI’s SPEED database as the definition of the agrarian sector is broad and includes provincial expenditure data as well.
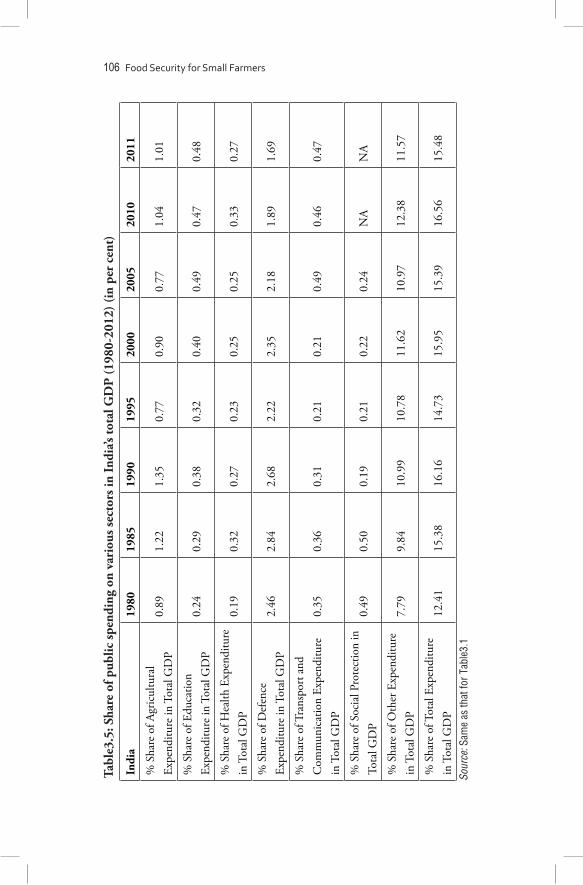
106 Food Security for Small Farmers
Tabl
e3.5
: Sha
re o
f pub
lic sp
endi
ng o
n va
riou
s sec
tors
in In
dia’s
tota
l GD
P (1
980-
2012
) (in
per
cen
t)
Indi
a19
8019
8519
9019
9520
0020
0520
1020
11
% S
hare
of A
gric
ultu
ral
Expe
nditu
re in
Tot
al G
DP
0.89
1.22
1.35
0.77
0.90
0.77
1.04
1.01
% S
hare
of E
duca
tion
Expe
nditu
re in
Tot
al G
DP
0.24
0.29
0.38
0.32
0.40
0.49
0.47
0.48
% S
hare
of H
ealth
Exp
endi
ture
in
Tot
al G
DP
0.19
0.32
0.27
0.23
0.25
0.25
0.33
0.27
% S
hare
of D
efen
ce
Expe
nditu
re in
Tot
al G
DP
2.46
2.84
2.68
2.22
2.35
2.18
1.89
1.69
% S
hare
of T
rans
port
and
C
omm
unic
atio
n Ex
pend
iture
in
Tot
al G
DP
0.35
0.36
0.31
0.21
0.21
0.49
0.46
0.47
% S
hare
of S
ocia
l Pro
tect
ion
in
Tota
l GD
P0.
490.
500.
190.
210.
220.
24N
AN
A
% S
hare
of O
ther
Exp
endi
ture
in
Tot
al G
DP
7.79
9.84
10.9
910
.78
11.6
210
.97
12.3
811
.57
% S
hare
of T
otal
Exp
endi
ture
in
Tot
al G
DP
12.4
115
.38
16.1
614
.73
15.9
515
.39
16.5
615
.48
Sour
ce: S
ame
as th
at fo
r Tab
le3.
1
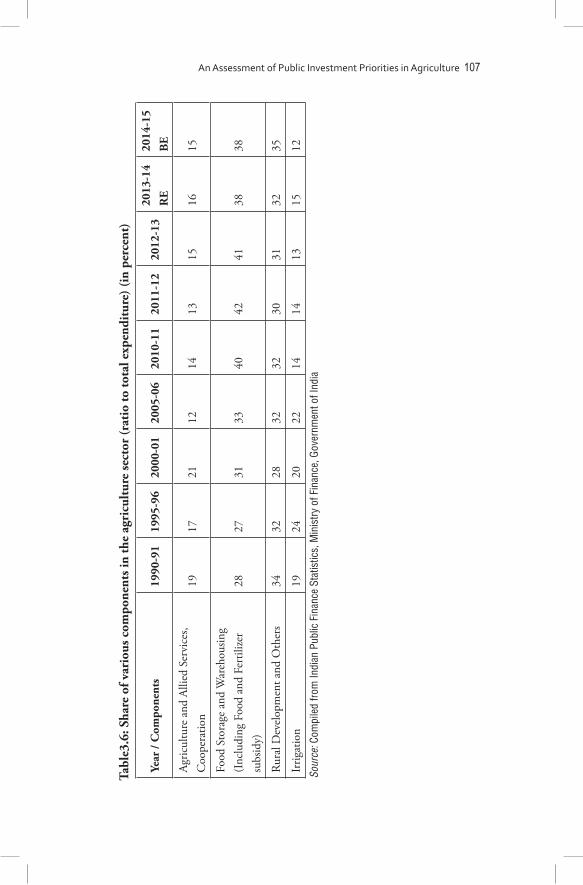
An Assessment of Public Investment Priorities in Agriculture 107
Tabl
e3.6
: Sha
re o
f var
ious
com
pone
nts i
n th
e ag
ricu
ltur
e se
ctor
(rat
io to
tota
l exp
endi
ture
) (in
per
cent
)
Year
/ C
ompo
nent
s19
90-9
119
95-9
6 20
00-0
120
05-0
620
10-1
120
11-1
220
12-1
320
13-1
4 R
E20
14-1
5 B
E
Agric
ultu
re a
nd A
llied
Ser
vice
s, C
oope
ratio
n19
1721
1214
1315
1615
Food
Sto
rage
and
War
ehou
sing
(Inc
ludi
ng F
ood
and
Fert
ilize
r su
bsid
y)28
2731
3340
4241
3838
Rura
l Dev
elop
men
t and
Oth
ers
3432
2832
3230
3132
35
Irrig
atio
n 19
2420
2214
1413
1512
Sour
ce: C
ompi
led
from
Indi
an P
ublic
Fin
ance
Sta
tistic
s, M
inis
try o
f Fin
ance
, Gov
ernm
ent o
f Ind
ia

108 Food Security for Small Farmers
Sl.
No
Year
/ Ite
ms
1990
-91
1995
-96
2000
-01
2005
-06
2010
-11
2011
-12
2012
-13
2013
-14
RE
2014
-15
BE
1A
gric
ultu
re a
nd A
llied
Ser
vice
s,
Coo
pera
tion
4599
7818
1513
116
756
4461
647
399
5688
472
457
8395
8
AC
rop
Hus
band
ry17
1636
4593
6285
4728
666
2917
635
971
4625
255
866
BSo
il an
d W
ater
Con
serva
tions
428
901
1237
1308
3060
3104
3405
4894
5314
CAn
imal
Hus
band
ry74
713
9220
8429
6365
0177
4888
9211
333
1256
7
DD
airy
Dev
elopm
ent
616
710
1299
1162
1357
1709
2314
3092
2986
EC
oope
ratio
n10
9211
7011
4927
7750
3256
6263
0268
8672
25
2Fo
od S
tora
ge a
nd W
areh
ousi
ng
(Inc
ludi
ng F
ood
and
Fert
ilize
r Su
bsid
y)70
7112
487
2253
444
490
1311
0914
9189
1581
0217
2437
2036
40
3R
ural
Dev
elop
men
t and
Oth
ers
8421
1445
120
670
4386
810
3879
1077
0012
1523
1434
1318
8595
4Ir
riga
tion
47
6010
958
1496
030
209
4679
649
373
5128
766
525
6674
2
Tabl
e3.7
: Com
bine
d bu
dget
ary
tran
sact
ions
of t
he c
entr
e an
d th
e st
ates
-com
bine
d re
venu
e an
d ca
pita
l exp
endi
ture
(exc
ludi
ng
loan
s) fo
r th
e ag
ricu
ltur
e se
ctor
(in
Rs 1
0 m
illio
n)
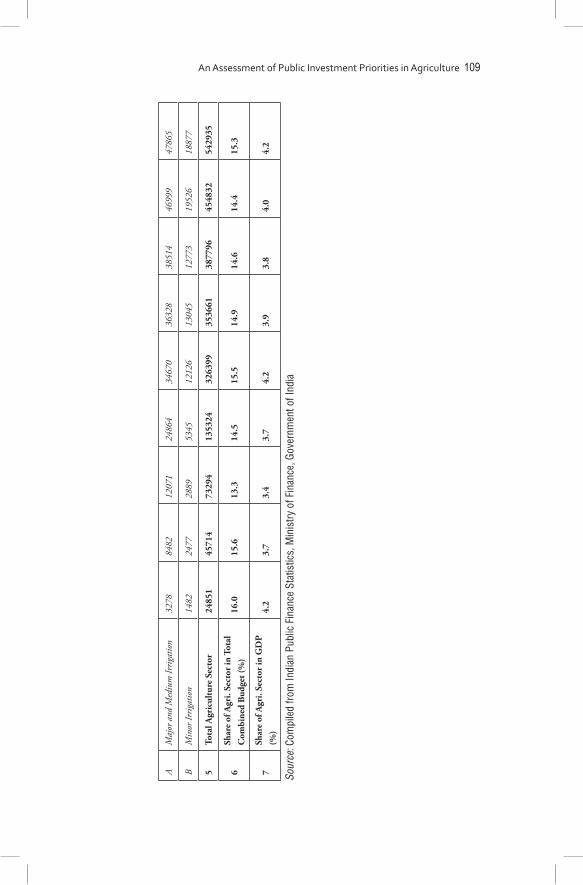
An Assessment of Public Investment Priorities in Agriculture 109
Sour
ce: C
ompi
led
from
Indi
an P
ublic
Fin
ance
Sta
tistic
s, M
inis
try o
f Fin
ance
, Gov
ernm
ent o
f Ind
ia
AM
ajor
and
Med
ium
Irrig
atio
n32
7884
8212
071
2486
434
670
3632
838
514
4699
947
865
BM
inor
Irrig
atio
n14
8224
7728
8953
4512
126
1304
512
773
1952
618
877
5To
tal A
gric
ultu
re S
ecto
r24
851
4571
473
294
1353
2432
6399
3536
6138
7796
4548
3254
2935
6Sh
are
of A
gri.
Sect
or in
Tot
al
Com
bine
d B
udge
t (%
)16
.015
.613
.314
.515
.514
.914
.614
.415
.3
7Sh
are
of A
gri.
Sect
or in
GD
P
(%)
4.2
3.7
3.4
3.7
4.2
3.9
3.8
4.0
4.2

110 Food Security for Small Farmers
expenditure over the period of analysis. The most important fea-ture of rural development programmes is public provisioning for rural employment programmes, which started in India in 2005-06. Following this there has been an increase in allocationsfor rural development programmes in the country. The most impor-tant component of the agrarian sector’s provisioning is irrigation facilities. However, public provisioning in irrigation includes expenditure on medium, large and minor irrigation projects in the country. The share of such provisioning within the agrar-ian sector declined from 24 per cent in 1995-96 to 12 per cent in 2014-15. In other words, public support for irrigation was squeezed over the period (Table 3.6).
Further, looking at the details of public provisioning within the agriculture and allied services and cooperation sector, it is ob-served that the crop husbandry component consumed much of the share (37 per cent in 1990 which increased to 67 per cent in 2014-15). It is important to note here that the crop husbandry sub-com-ponent of the agriculture and allied services and cooperation sector constitutes the core crop sector of Indian agriculture. Provisioning for food and non-food crops, including commercial crops consti-tutes the core of such provisioning. With regard to allied activities, animal husbandry and dairy development constituted around 29 per cent during 1990-91, this declined to 19 per cent in 2014-15. The irony is that India has not prioritized dairy development over the period and provisioning for animal husbandry has more or less remained stagnant over the period (Table 3.8).
It is important to note here that adequate public investments in agriculture need to be made so as to increase the growth rate of the sector and latest technologies also need to be made available to farmers. Apart from the productivity aspect, public investments in agriculture research and education can also be directed towards production of technologies that are environmentally friendly and sustainable. Hence, public investments in research and education can ensure high productivity as well as better and cleaner technolo-gies in agriculture. This is thus essential for the overall growth and development of the agriculture sector.
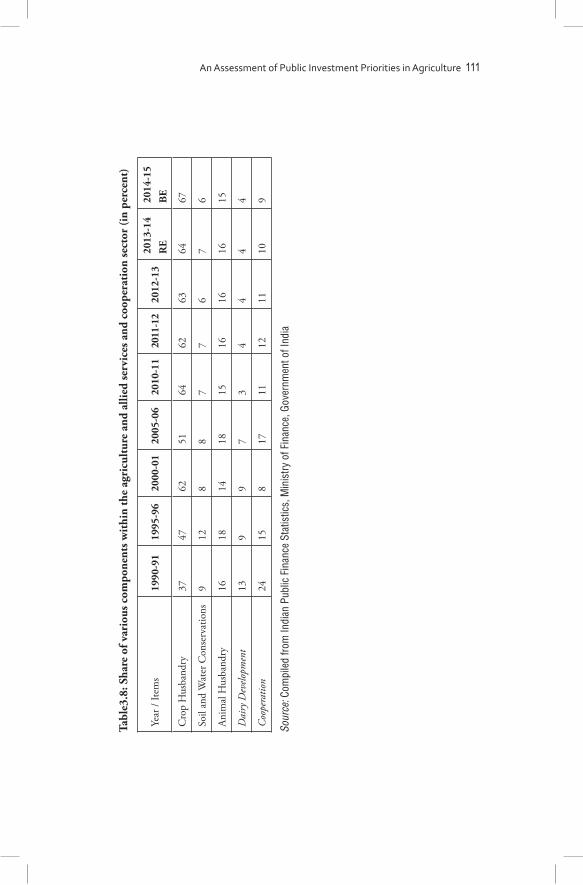
An Assessment of Public Investment Priorities in Agriculture 111
Tabl
e3.8
: Sha
re o
f var
ious
com
pone
nts w
ithi
n th
e ag
ricu
ltur
e an
d al
lied
serv
ices
and
coo
pera
tion
sect
or (i
n pe
rcen
t)
Year
/ Ite
ms
1990
-91
1995
-96
2000
-01
2005
-06
2010
-11
2011
-12
2012
-13
2013
-14
RE
2014
-15
BE
Cro
p H
usba
ndry
3747
6251
6462
6364
67
Soil
and
Wat
er C
onse
rvat
ions
912
88
77
67
6
Anim
al H
usba
ndry
1618
1418
1516
1616
15
Dai
ry D
evelo
pmen
t13
99
73
44
44
Coo
pera
tion
2415
817
1112
1110
9
Sour
ce: C
ompi
led
from
Indi
an P
ublic
Fin
ance
Sta
tistic
s, M
inis
try o
f Fin
ance
, Gov
ernm
ent o
f Ind
ia
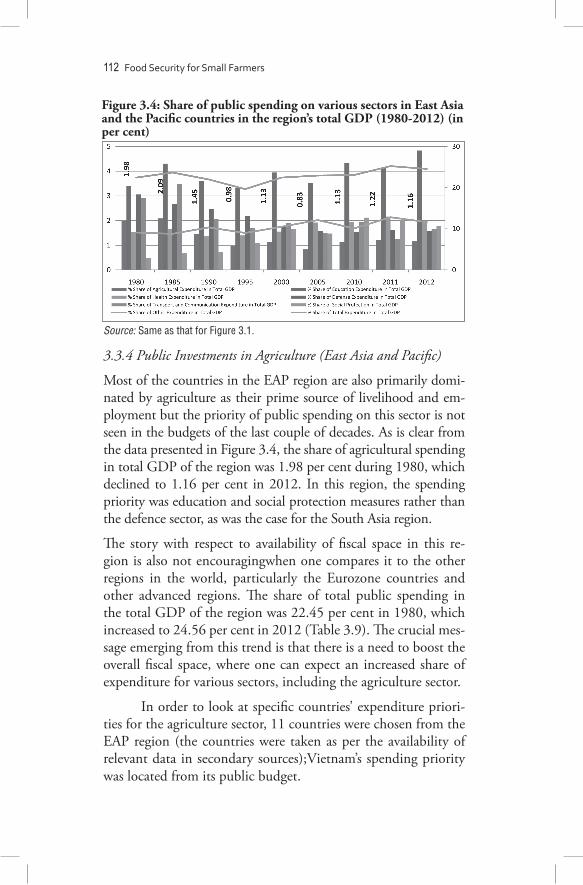
112 Food Security for Small Farmers
3.3.4 Public Investments in Agriculture (East Asia and Pacific)
Most of the countries in the EAP region are also primarily domi-nated by agriculture as their prime source of livelihood and em-ployment but the priority of public spending on this sector is not seen in the budgets of the last couple of decades. As is clear from the data presented in Figure 3.4, the share of agricultural spending in total GDP of the region was 1.98 per cent during 1980, which declined to 1.16 per cent in 2012. In this region, the spending priority was education and social protection measures rather than the defence sector, as was the case for the South Asia region.
The story with respect to availability of fiscal space in this re-gion is also not encouragingwhen one compares it to the other regions in the world, particularly the Eurozone countries and other advanced regions. The share of total public spending in the total GDP of the region was 22.45 per cent in 1980, which increased to 24.56 per cent in 2012 (Table 3.9). The crucial mes-sage emerging from this trend is that there is a need to boost the overall fiscal space, where one can expect an increased share of expenditure for various sectors, including the agriculture sector.
In order to look at specific countries’ expenditure priori-ties for the agriculture sector, 11 countries were chosen from the EAP region (the countries were taken as per the availability of relevant data in secondary sources);Vietnam’s spending priority was located from its public budget.
Figure 3.4: Share of public spending on various sectors in East Asia and the Pacific countries in the region’s total GDP (1980-2012) (in per cent)
Source: Same as that for Figure 3.1.

An Assessment of Public Investment Priorities in Agriculture 113
Tabl
e3.9
: Sha
re o
f pub
lic sp
endi
ng o
n va
riou
s sec
tors
in to
tal G
DP
of E
ast A
sia
and
Paci
fic c
ount
ries
(198
0-20
12) (
in p
er c
ent)
Sour
ce: S
ame
as th
at fo
r Tab
le 3
.1.
East
Asi
a an
d Pa
cific
1980
1985
1990
1995
2000
2005
2010
2011
2012
% S
hare
of A
gric
ultu
ral E
xpen
ditu
re
in T
otal
GD
P1.
982.
091.
450.
981.
130.
831.
131.
221.
16
% S
hare
of E
duca
tion
Expe
nditu
re in
To
tal G
DP
3.40
4.30
3.60
3.32
3.95
3.53
4.33
4.14
4.84
% S
hare
of H
ealth
Exp
endi
ture
in
Tota
l GD
P1.
531.
671.
361.
401.
561.
921.
942.
161.
95
% S
hare
of D
efen
ce E
xpen
ditu
re in
To
tal G
DP
3.06
2.68
2.47
2.19
1.79
1.57
1.54
1.61
1.57
% S
hare
of T
rans
port
and
C
omm
unic
atio
n Ex
pend
iture
in T
otal
G
DP
2.91
3.49
2.07
1.69
1.90
1.50
1.93
1.26
1.65
% S
hare
of S
ocia
l Pro
tect
ion
in T
otal
G
DP
0.49
0.67
0.72
1.08
1.64
1.47
2.12
2.03
1.77
% S
hare
of O
ther
Exp
endi
ture
in
Tota
l GD
P9.
098.
7710
.34
8.99
10.4
912
.12
10.0
912
.81
11.6
2
% S
hare
of T
otal
Exp
endi
ture
in T
otal
G
DP
22.4
523
.68
22.0
019
.65
22.4
622
.95
23.0
725
.24
24.5
6

114 Food Security for Small Farmers
Cou
ntry
Chi
naFi
jiIn
done
sia
Mal
aysi
aM
ongo
liaM
yanm
arPa
pua
New
G
uine
aPh
ilipp
ines
Thai
land
Tong
aV
iet N
am
Shar
e of
Agr
icul
tura
l Exp
endi
ture
in A
gri-
GD
P
1990
6.06
10.1
67.
2712
.45
NA
2.61
8.63
6.29
14.2
06.
072.
31
2000
8.24
7.74
3.06
7.98
2.47
2.63
2.42
7.40
18.1
213
.68
8.48
2010
22.9
53.
45 N
A15
.63
11.2
21.
18
8.05
10.8
110
.00
6.49
Aver
age
9.65
8.13
5.74
10.9
93.
883.
454.
595.
5513
.56
8.71
6.50
Shar
e of
Agr
icul
tura
l Exp
endi
ture
in T
otal
Exp
endi
ture
1990
9.98
6.75
7.64
6.72
NA
9.33
7.22
6.57
10.4
46.
425.
99
2000
7.75
3.74
2.34
3.27
1.93
17.3
82.
625.
738.
828.
628.
43
2010
10.3
51.
12 N
A6.
746.
376.
26 N
A5.
875.
763.
493.
94
2011
9.10
0.84
NA
7.96
8.95
NA
NA
3.66
7.01
2.03
NA
2012
9.51
NA
NA
8.40
2.41
NA
NA
5.09
4.56
2.88
NA
Aver
age
8.89
4.88
6.28
5.83
2.55
14.2
04.
495.
828.
566.
956.
90
Shar
e of
Tot
al E
xpen
ditu
re in
Tot
al G
DP
1990
15.9
26.1
16.7
27.1
16
.034
.018
.313
.627
.714
.9
2000
16.1
30.0
20.4
20.7
35.1
8.7
31.3
18.0
17.5
31.5
24.7
2010
22.3
30.2
15.6
24.0
25.2
6.9
NA
16.9
19.8
47.0
31.1
2011
23.1
35.2
NA
24.2
28.3
NA
NA
15.8
21.6
38.5
NA
2012
23.9
NA
NA
24.7
30.9
NA
NA
16.4
20.6
41.6
NA
Aver
age
18.0
28.5
17.1
25.1
29.2
11.2
31.1
15.8
18.2
32.1
23.3
Tabl
e3.1
0: S
hare
of
agri
cult
ure
expe
ndit
ure
in a
gri-
GD
P, t
otal
exp
endi
ture
and
tot
al G
DP
acr
oss
coun
trie
s in
Eas
t A
sia
and
Paci
fic (1
990-
2012
) (in
per
cen
t)
Sour
ce: S
ame
as th
at fo
r Tab
le 3
.1

An Assessment of Public Investment Priorities in Agriculture 115
The relevant shares of spending on the agriculture sector out of the agri-GDP for East Asia and Pacific countries show an im-provement over the period. For instance, China was spending 6.06 per cent in 1990, which increased to 8.24 per cent in 2000 and a manifold increase was seen in 2010 (22.95 per cent). However, the average share of such spending between 1980-2012 remained at 9.65 per cent. Similarly, the increase in sharewas close to three times in Vietnam. The relevant share was 2.31 per cent in 1990, which increased to 6.49 per cent in 2010. Thailand tops the list within EAP countries when it comes to average share of agriculture spending out of agri-GDP (13.56 per cent)followed by Malaysia (10.99 per cent) and China (9.65 per cent). Vietnam’s share was 6.5 per cent between 1990 and 2010 (Table 3.10).
Vietnam’s total spending on the agriculture sector out of its agri-GDP was only 2.31 per cent, which increased to 8.48 per cent in 2000 but it did not maintain the tempo as its share declined to 6.49 per cent in 2010. Similar observations can be made with respect to the share of agriculture spending in total GDP of the country. For instance, Vietnam was spending 0.89 per cent of its GDP on the agriculture sector in 1990, which increased to 2.08 per cent in 2000, but declined to 1.23 per cent in 2010. Hence, the average spending on agriculture as a per-centage of its GDP during 1990 to 2010 was only 1.54 per cent. In comparison, countries like Tonga, China, Myanmar, Malaysia and Thailand spent higher percentages of their respective budgets on agriculture during 1980 and 2012 (Table 3.10).
As noted earlier, the limited/inadequate fiscal space of this region has impacted the provisioning of a range of require-ments, including the agriculture sector. The share of total pub-lic spending in total GDP of the region was 22.45 per cent in 1980, which increased to 24.56 per cent in 2012 (Table 3.9), but this increase in limited fiscal space of the region did not reflect in an increased spending on the agriculture sector. The limited fiscal space for many countries in this region also pulled their agriculture sectors from the list of public expenditure pri-oritization in their annual budgets.

116 Food Security for Small Farmers
3.3.5 Public Investments in Agriculture (Vietnam)
If one looks at the public investment trend in Vietnam for various sectors, including agriculture, it can be observed that the share of agricultural spending as a percentage of its total GDP ranged between 0.89 to 2.08 per cent. The share of this expenditure was 0.89 per cent in 1990, increased to 2.08 per cent in 2000, but declined to 1.23 per cent in 2010. Similarly, the shares of expenditure on education, health, transport and communication and social protection were 1.74, 0.55, 20.07 and 1.47 per cent respectively during 1990 and were reported to be 4.35, 1.53, 3.98 and 3.48 per cent respectively during 2010 (Table 3.11).
The most crucial message emerging from this data is that Vietnam prioritized is spending towards education and social protection measures in 1990-2010. Further, unlike many of the East Asian and Pacific countries, the fiscal space of the country has grown more than 100 per cent. In fact the share of the country’s total
Table3.11: Share of public spending on various sectors in Vietnam’s total GDP (1990-2012) (in per cent)
Vietnam 1990 1995 2000 2005 2010
% Share of Agricultural Expenditure in Total GDP
0.89 1.67 2.08 1.66 1.23
% Share of Education Expenditure in Total GDP
1.74 2.37 2.87 3.13 4.35
% Share of Health Expenditure in Total GDP
0.55 0.75 0.78 0.83 1.53
% Share of Defence Expenditure in Total GDP
0.00 0.00 0.00 0.00 0.00
% Share of Transport and Communication Expenditure in Total GDP
2.07 3.13 4.43 5.13 3.98
% Share of Social Protection in Total GDP
1.47 2.01 2.43 1.94 3.48
% Share of Other Expenditure in Total GDP
8.20 10.44 12.08 16.05 16.55
% Share of Total Expenditure in Total GDP
14.93 20.37 24.67 28.74 31.11
Source: Same as that for Table 3.1

An Assessment of Public Investment Priorities in Agriculture 117
expenditure to its GDP was 14.93 per cent in 1990, which in-creased to 31.11 per cent during 2010. This actually facilitated the country in provisioning higher allocationsfor education and social protection measures. However, public investment prioriti-zation for the agriculture sector was not seen during the period of analysis.
3.4 Concluding Observations
Developing agriculture is essential for growth, food security, poverty reduction and environmental sustainability in many parts of the world,especially in less developed countries or what are known as agrarian economies. Improved agricultural per-formance can lead to dramatic improvements in the incomes of the poor, provide affordable food and stimulate structural trans-formations. Available literature suggests that there is evidenceto show that GDP growth originating in agriculture has been, on average, two to four times as effective in raising incomes of the poor as compared to growth generated in non-agricultural sec-tors. Again, it is commonly observed that in spite of the well doc-umented importance of rural infrastructure facilitating agricul-tural growth andwell-being of the people (for example, Hayami and Ruttan, 1971), most developing countries have done little to address this problem.
Given such growing evidence and concerns about the role and effectiveness of public expenditure in stimulating sustained growth rates and poverty reduction, it is time that developing the agriculture sector became a coordinated strategy involving a sound policy environment and well-targeted major public invest-ments over time.


Results from the Field Studies
4.1 Methodology
The study is based on interactions with 271 households in four states in India and 280 households in four provinces in Vietnam. In India, the survey was conducted in Uttar Pradesh, Odisha, Andhra Pradesh and Jharkhand and in Vietnam in Cao Bang, Ha Giang, Vinh Long and DakLak provinces. Since agriculture related policies can be different for different states/provinces the survey covered different locations which captured the differences in their economic-physical attributes and differences in the na-ture of public provisioning. The survey had two parts:a house-hold survey and focus group discussions (FGDs).
This study is based entirely on smallholder farmers. The samples for the study were collected on the basis of the size of land owned by households. After controlling for land size, the samples reflect the social background of smallholder households. The proportion of different social groups in the sample is the same as in the total smallholding households in the village. The surveyors prepared a list of all the households in the village with information about their social groups and landholdings. After clubbing all smallholder households, the proportion of differ-ent social groups in the population was calculated for selecting the sample. The surveyors ensured the same proportion in the sample and calculated the required number of households from different social groups.
The household survey was on the basis of a structured questionnaire. The survey tried to cover the nature of public provisioning and food security/insecurity including the follow-ing broad aspects: information on the nature and characteristics
Chapter 4

120 Food Security for Small Farmers
of public provisioning with particular emphasis on smallholder farmers, support to farmers in terms of backward linkages such as credit, irrigation and other inputs and support in terms of forward linkages such as marketing. The survey also tried to cover pos-sible questions related to land with the households. It gathered information on operational holdings and land ownership of the households. The financial condition of the households, indebted-ness and sources of borrowing were also asked about. To assess food security and purchasing power of the households, questions were asked to estimate households’ farm and non-farm incomes.
To cover all these aspects, the questionnaire was divided into13 blocks:
Block 1 of the questionnaire focused on the religious, so-cial and ethnic characteristics of the households. Block 2 focused on household characteristics, which primarily enquired about ownership of the house and sources of energy for lighting and cooking. Block 3 provided details such as age, gender, educa-tion levels and occupations of other household members. Block 4 is a set of descriptive questions which tried to assess informa-tion regarding public provisioning. Block 5, a second set of de-scriptive questions,dealt with external support used by farmers between September 2014 and September 2015. Blocks 6 and 7 covered questions related to crop insurance and indebtedness of the households respectively. Block 8 concentrated on land questions. It first listed all land connected with a household in-cluding own land, leased-in land, leased-out land, mortgaged-in land, mortgaged-out land and occupied land. The rest of the block enquired in detail about all types of land. Block 9 looked at cropping patterns and agricultural production. It focused on sources of irrigation and their ownership. It also assessed the net production of the households for the market. Marketing agency was also enquired about in this block. Block 10 looked at sources of income of the households other than agriculture. Block 11 tried to find out the food consumption of the households and sources of obtaining those food items. Block 12 discussed major expenditures of the households. Block 13 assessed the level of technology used by the households for cultivation.
Results from the Field Studies 121
The study created a distinction between operational hold-ings and ownership holdings. If the cultivator of the land did not have registered ownership of that particular land then such hold-ings were called operational. Apart from own land, operational holdingsalso include all types of leased-in land, occupied land and mortgaged-in land. The study captured the social dynamics of big and small operational holding families.
The second part of the village study was FGDs. At each location, two FGDs, one with the elected head and officials or administrative staff members and the other with farmers (be-longing to the same location) were held. In the FGDs with farm-ers, the investigators tried to make the group as representative as possible of the village (keeping in mind the social groups as used in the household survey).
Several themes were followed in the discussions. The FGDs first got information on the social composition of the vil-lage (religious/ethnic/caste). They also covered the topography and climatic conditions of the village (whether coming under rain-fed/dry-land/irrigated/ hilly/plain/plateau/coastal/forest etc.). To get an idea about public provisioning on other things the FGDs covered information on availability of basic facilities and services like drinking water (sources available in the village), hygiene and sanitation conditions (as per the assessment of the investigator), electricity connections and electricity supply in-cluding use for agriculture), healthcare centres (whether easily accessible, number of primary health centres), available canals/wells for the purpose of irrigation, level of literacy in the village and transportation facilities and extension services in the village.
The FGDs emphatically enquired about government sup-port for thesebasic facilities. Regarding the functioning of public procurement agencies the FGDs enquired whether the public procurement agencies procured food grains from the farmers. In the absence of public procurement agencies where did the villag-ers sell their produce? The FGDs also enquired about the func-tioning of public distribution of food grains by the government to the needy during normal and adverse situations and they also captured information about government support (other than food grains) in the case of a natural calamity (famine/flood).

122 Food Security for Small Farmers
4.2 A Brief Profile of the Field
4.2.1 Vietnam
The survey was conducted in 14 villages in seven communes across four provinces in Vietnam:
Cao Bang ProvinCe The survey was conducted in Lung Lua village in Da
Thong commune and Man Thoung Ha village in Ngoc Dong commune in Thong Nong district. This is a mountainous prov-ince located in the north-eastern part of Vietnam. Mountain forests cover more than 90 per cent of the province and only 10 per cent land is available for cultivation. The current popu-lation of the province is 519,000people. Its terrain is relatively flat which includes low hills. In general, the terrain is varied, it is divided by deep valleys, rivers, rolling hills and streams. Due to the complexity of the terrain, it has various sub-regions with specific behaviours, allowing diversified crops and livestock. Cao Bang province has fragmented land under agriculture produc-tion which is prone to soil erosion and leaching during the rainy season. The total area of the province is 670,342 hectares. Land is quite diversified with a variety of soil types which are suitable for a variety of crops. The forest area in the province has many rare plant species of high economic value.
vinh Long ProvinCe In this province the survey was conducted in QuangTrach
and QuangDuc villagesin TrungChanh commune, Quang Minh and QuangBinh villagesin Quoi An commune and Hai and RachDoi villagesin Tan Quoi Trung commune in VungLiem district. Vinh Long province is located between Tien and Hau rivers and the Mekong Delta. It has eight administrative units and six districts. It is among the provinces with the highest population density. Its terrain is relatively flat. Land is suitable for intensive cultivation, multi-cultivation and development of biodiversity due to favourable climate conditions for agriculture development. Generally, the rainfall is concentrated during the

Results from the Field Studies 123
six-month rainy season which leads to local flooding, affect-ing agricultural production and the daily lives of the people. Recently there has been an increase in the industrial and service sectors and the economic structure of the province is shifting to-wards sustainable development. Groundwater is very limited and is distributed only in certain areas in the province whilesurface water resources are assigned throughout the province.
Đaklak Province The survey was conducted in Tong Sinh and Suk villagesin
Eadar commune and Eaga and Eaknuop villagesin Cư Ni com-mune in Eakar district. DakLak is located in the central part of the central highland which also has four other provinces. It has 13 districts which have 180 communes, wards and towns. The total population of the province was 1,728,380 in 2009 out of which only 22.5 per cent lived in urban areaswhile the remaining 77.5 per cent lived in rural areas. There are 44 ethnic minorities in the province but the Kinh is the largest group constituting 70 per cent of the total population. The average population density of the province is 132 persons per sq. km but the distribution of population across the province is not even. There are 14 hospi-tals at the district level.
ha giang ProvinCe
In this province, the survey was conducted in Lo Thang II village in Thai An commune and DauCau I village in Can Ty commune in Quan Ba district. Ha Giang province lies in the north-eastern part of Vietnam and is also known as Vietnam’s final frontier. The total area of the province is 7,945sq. km and it had population of 705,000in 2008, a majority of whom were ethnic Vietnamese. Ha Giang province has a mountainous to-pography and it is considered one of the poorest provincesin the country as it has the least potential for agricultural development. Much of the land in the province is covered by forests. The central plateau in the province is good for growing and exporting plums, persimmons and peaches. Agriculture and forestry are the tradi-tional economic activities of the people in the province but re-cently there has also been a boost to the manufacturing industry.
124 Food Security for Small Farmers
4.2.2 India
In India, the survey was conducted in 29 villages across nine dis-tricts in the four states of Andhra Pradesh, Jharkhand, Odisha and Uttar Pradesh.
andhra Pradesh Seventy-five households were surveyed across six villages
in the state: Yellarthy in Holagunda mandal and Karimddela in Gadivemula mandal in Kurnool district, Settipalli and Kondampalli in Penukonda village in Anantpur district and Jogivaripalli and Mittapalli in Sadum mandal in Chittor dis-trict. Yellarthy is situated in the west in Kurnool district; it is surrounded by hills which are classified as a reserve forest. Villagers own the total 6,452 acres of land including hills and hillocks. The area has plain black soil. Karimaddela village has 350 households in 11 social groups. This village is connected with a canal. It has 1,500 acres of dry land and 4,000 acres of irrigated land. Settipalliis situated in a hilly area. Most of the population in the village dependson agriculture. The promi-nent social groups in the village are Kapu, Kamma, Doodekula, Boya, Vaddi, Weavers, Kummar and Vysyas. There are 350 households in Kondampallivillage. The major social groups are Sugali, Erukala, Kappu, Kamma, Balija, Boya, Golla, Eediga, Nese, Sakali, Vaddi, Kuruba and Acharya. The village is located in a hilly,forest area. It has 210 acres of fallow land (60 acres on the western side and 150 acres on the northern side). There are 106 households in Jogivaripalli village who live in colonies based on caste. The land ownership in the village is highly skewed in favour of the dominant caste, Reddy. Out of the 292 acres of land, four Reddy households own 220 acres; 57 households are landless; 15 landless Dalit households are entirely dependent on sharecropping. Being part of the Rayalaseema region the land has a dry red soil and is also surrounded by hillocks. Rain-fed cultivation is dominant while the landlords use irrigation tanks and bore wells. There are 109 households in Mitta Palli village most of whom are Schedule Castes (SCs). Mitta Palli village is surrounded by rocky hillocks. It is located adjacent to the main road between Sadum andKalikiri. The land is not fertile as it has

Results from the Field Studies 125
a rocky base. Cultivation is completely dependent on seasonal rains. Land under the village tank is owned by landlords. Dalits engage in agriculture as workers and sharecroppers.
Jharkhand
In Jharkhand 71 households were surveyed across 11 vil-lages : Ezamard, Dumbi, Janho, Korid and Sevdhara in Manika block in Latehar district and Kulhi, Tangarkela, Khatanga, Banai, Kishunpur and Pidul villages in Rania block in Khunti district. Ezamard is located 3 km on the west of Manika block. It is 1 km from National Highway75. It is surrounded by Dubjarwa in the north, Nawadih in the south, BesnaManika in the east and a for-est on the west. It is about 4 km in length and 2 km in breadth. It has 101 households around half whom are Schedule Castes, 35 per cent are Schedule Tribes(STs) and the remaining are Other Backward Castes (OBCs). There are two religious groups in the village, Hindus and Sarnas (animism). Janho is located 16 km towards the west from Manika block. It is 16 km from National Highway 75. Janho is surrounded by Matnag in the north, Sadhwadih in the south, Patna in the west and Koilagadha in the east. It is about 4 km in length and 4 km in breadth and has 439 households. Most of the villagers are Schedule Tribes followed by Schedule Castes. It has Sarna and Hindu religious groups. Dumbi is located 10 km towards the west from Manika block. It is 9 km from National Highway 75. Dumbi is surrounded by a forest in the north, Jagtu in the south, Nawadih in the east and another forest in the west. There are 80 households in the village. Villagers follow either Sarnaor or Hinduism. Around 60 per cent of the householdsare Schedule Castes while the remain-ing are Schedule Tribes. Sevdhara islocated 17 km towards the west from Manika block, Latehar. It is 10 km from National Highway 75. Sevdhara is surrounded by Rankikala in the north, Lanka village in the south, Koili village in the east and Oranga River and Rabdi village in the west. There are 101 households in the village. Yadavs are in a majority followed by OBCs and SCs. Hindus and Sarnasare the main religious groups. Korid is located 20 km towards the west from Manika block, Latehar. It is 20 km from National Highway 75. Korid is surrounded by a forest and Sardamdaag in the north, Matlong in the south, Beyang in the

126 Food Security for Small Farmers
east and Palheya and Kurund in the west. There are 181 house-holds in the village. The population of the village is largely tribal. Other than Hindus and Sarnas, the village also has Muslims. There are 151 households in Kulhai village; most of them are STs. The religious groups in the village are Hindus, Christians, Sarnas and Muslims. The total population of the village is 927 (464 men and 463 women). It has Doenger village on the north and Tangarkela village in the south. A seasonal river flows on the north-western side of the village. There are three hamlets in the village: SarnaToli, KathalToli and KulhadeToli. KulhadeToli is a forest area from where the villagers collect firewood. There are 82 households in Pidul village out of which 33 are STs, five are SCs and 44 are OBCs. The total population of the village is 362 (190 men and 172 women). The village consists of two hamlets, GirjaToli and MundaToli. There are three religious groups in the village: Hindus, Christians and Sarnas. The village is near hill-ocks and a forest. Jaipur village is on its east, Balkel in the west, Kello in the north and Bandipadi village in the south. There are 116 households in Kishunpur village,a majority of whom are STs followed by OBCs. The population of the village is 570 (268 men and 202 women). The main religious groups in the village are Sarnas, Hindus, Christians and Muslims.
There is a hillock on the north-western side of the village. There are 221 households in Banai village out of which 121 are ST households. The village also has 44 SC and 56 OBC house-holds. The religious groups in the village are Sarnas, Hindus and Christians. A seasonal river KoyalKatu flows on the eastern side of the village. There are 141 households in Tangarkela village of which 69 are STs, 28 are SCs and 44 are OBCs. The population of the village is 626 (298 men and 328 women). It is situated near the main road from the block headquarters. There is one small forest from where the villagers collect firewood. There are 209 households in Khatanga village of which 151 are STs, 38 OBCs, six SCs and 14 upper castes. The population of the vil-lage is 989 (507 men and 482 women). There is a small range of hillocks and a forest in the village. The forest is used for collecting firewood.

Results from the Field Studies 127
odisha
Seventy-five households were surveyed across six villages in the state. Sadanandpur village is in Paikmal block in Bargarh district. There are 110 households in the village which comprises of 456 people (235 men and 221 women). It has 12 Schedule Caste households with a total population of 53 (24 men and 29 women). The village also has 47 ST households with a population of 201 (113 men and 88 women). There are 42 OBCs in the vil-lage while the rest are upper castes. All families are Hindus. The village is surrounded by Kuapali village in the north, Nakdini, Bhengrajpur in the west, Malda in the east and Gandhmardhan hills in the south. Ramedega village is in Padampur block in Bargarh district. There are 66 households in the village with a total population of 277 (145 men and 132 women). It has 25 Schedule Caste households with a total population of 103. It also has 10 Schedule Tribe households with a population of 47, 104 OBCsin 23 households while the rest are upper castes. All the households are Hindus. The village is situated on the lower part of Jhanja hills, which are on the northern side of the village. Bhaliapani village is also in Tumudibandh block in Kandhmal district. There are 45 households in the village -- 42 STs and three SCs. All the households are Christians. The village is surrounded by a forest but connected by the state highway. SamareiSasonvillage in Nimapara block in Puri district has71 households -- 52 SCs, one ST, one OBC and 17 upper castes. This is a plain area with 75 per cent of the land being irrigated.
Uttar Pradesh In Uttar Pradesh, 75 households were surveyed in eight
villages. MuraliyaPurwavillage in Naraini block in Banda dis-trict has 94 households out of which 80 are OBCs and 14 are SC households. All households follow Hinduism. There are five ‘Domar’ households among the SCs; they are not allowed to live inside the village. The Domar hamlet is outside the village. The village is 6 km from the main road. There are 500 bighas of ag-ricultural land in the village which have a fertile soil and are also irrigated. Canal water and groundwater are used for irrigation. KachhiyaPurwa village is also in Naraini block in Banda district.

128 Food Security for Small Farmers
There are 110 households in the village -- 40 SC, 50 OBC and 20 are upper caste households. All the households follow Hinduism. The village is 6 km towards the east from the main road that connects to the block headquarters. There are 600 bighas of ag-ricultural land with the villagers out of which only 200 bighas are irrigated. The irrigated land is used for cultivating wheat and paddy while the un-irrigated land is used for producing pulses and oilseeds. Ghasraut village is in Naraini block in Banda dis-trict. The village is situated on the banks of Bagai River. There are 130 households in the village -- 40 SCs, 40 OBCs and 50 upper castes.All households in the village follow Hinduism. The upper caste ‘Thakur’ households belong to an erstwhile landlord family. These households still own most of the land in the village. The SC and OBC households are either agricultural labourers or sharecroppers. These households depend on upper caste house-holds for their economic activities. The road towards the village is unpaved. Land in the village is very uneven and that is why most of the land remains fallow. Most of the households in the village are not electrified. Gahbara village is also in Naraini block in Banda district. There are 125 households in the village. All households follow Hinduism. Thirty of the households are SCs, 15 are OBCs and 80 are upper castes. The village consists of dif-ferent hamlets on the basis of caste groups. The village is 70 km from the district headquarters and is connected with a concrete road. There is forest area near the village. The land in the village is highly uneven and most of it is un-irrigated. For most of the year the village has a drought like situation.
Erawanivillage in Birdha block in Lalitpur district is 20 km from the district headquarters and 15 km from the block head-quarters. There are 256 households in the village -- 156 OBCs, 44 SCs, 33 STs and 23 upper castes. The total land in the village is 1,600 acres of which 1,060 acres are irrigated. The un-irrigated land belongs to SC and ST households. Mudarivillage is in Bridha block in Lalitpur district. There are 98 households in the village --37 SC households, 32 OBC households, 13 ST households and 16 upper caste households. The village is 47 km from the district headquarters and 30 km from the block headquarters. Seventy-five per cent of the land in the village depends on the monsoon for irrigation while the remaining 25 per cent is irrigated by the river.

Results from the Field Studies 129
Dhoujri village in Birdha block in Lalitpur district has 220 house-holds of which 133 belong to the Sahariya tribe. Other than this, there are 46 OBC households and 41 upper caste households. The village is situated on the bank of Betwa River and is surrounded by a forest area. The land is very rocky and the groundwater level is very low. Farmers use river water for irrigation through pri-vate diesel pumps. Kuchdovillage is in Birdha block in Lalitpur district. There are 120 households in the village --95 SC, four ST and 21 OBC households. The village is 28 km from the dis-trict headquarters. No irrigation infrastructure is available in the village. Irrigation is entirely dependent on the monsoon. The groundwater level in the village is very low.
4.3 Survey Findings
4.3.1. Vietnam
Almost 99 per cent of the landholdings in Vietnam are less than 4 hectaresand 94 per cent of them are small and marginal hold-ings. Landlessness in Vietnam is widespread as the has undertak-en land reforms on many occasions but it remains an economy dominated by smallholders. More than half of the country’s population is employed in agriculture and so there is a need to support agriculture to make it sustainable. Only 4 per cent of the households have landholdings between 2 and 4 hectares. So, any policy related to the agriculture sector must be focused on smallholder farmers for the sustainability of the economy.
The picture is not much different if we look at the differ-ent provinces in which the survey was carried out, as the share of households with farm sizes less than 2 hectareswas 88.57, 71.43, 90 and 84 per cent respectively in Cao Bang, Daklak, Ha Giang and Vinh Lon provinces (Table 4.1). The size of the landholdings is going to decline with an increase in population in due course.

130 Food Security for Small Farmers
Table 4.1: Distribution of landholdings (in per cent)
ProvinceLandless (<0.02)ha
Marginal (0.02-1)ha
Small
(1-2)ha
Semi-medium (2-4)ha
Medium and Large (>10)ha
Cao Bang 0.00 88.57 7.14 4.29 0.00
DakLak 0.00 71.43 20.00 7.14 1.43
Ha Giang 1.43 90.00 2.86 5.71 0.00
Vinh Long 0.00 87.14 12.86 1.43 0.00
Average 0.36 84 10.68 4.63 0.36Source: Compiled from field survey data.
Table 4.2: Distribution of plots of land and area
Province No. of Plots Area (hectares)
Vinh Long 203 49.63
Ha Giang 203 24.89
Cao Bang 178 39.87
DakLak 144 65.79
Total 728 180.18Source: Compiled from field survey data.
The households surveyed owned 728 plots covering an area of 180.18 hectares. Vinh Long and Ha Giang had 203 plots but the area under the households in Ha Giang province was half of that in Vinh Long province. This shows that the pressure on the land is much more in Ha Giang province. Similarly, DakLak province only had 144 plots but they covered 65.79 hectares while Cao Bang had 178 plots which covered only 39.87 hectares. So, the plots in Ha Giang and Cao Bang are more stretched as com-pared to the other provinces and therefore need greater attention by the government in terms of support to agriculture (Table 4.2).
Level of awareness and use of public provisioning: The re-forms in Vietnam have benefitted agriculture as it has become an exporter of many food commodities from being their importer before the reforms. The Vietnam government has initiated many

Results from the Field Studies 131
Table 4.3: Level of awareness and use of public provisioning (in per cent)
Provinces Awareness about Price support
Price support accessed last year
Awareness about Subsidy
Subsidy received last year
Cao Bang 52.86 0.00 78.57 12.85
DakLak 14.29 1.43 35.71 18.57
Ha Giang 78.57 67.14 54.28 14.28
Vinh Long 43.66 4.23 22.53 0.00
Average 47.33 18.15 47.69 11.39Source: Compiled from field survey data.
programmes and policies for the development of the agriculture sector. Findings from the field show that households are aware of the government schemes but their accessibility is a major prob-lem (Table 4.3).
Support price: Taking the household averagein four prov-inces, 47.33 per centof those surveyed were aware of the support pricesissued by the government while only 18.15 per centhad benefitted from them. Awareness and use differed across the provinces. Awareness was the highest among Cao Bang and Ha Giang provincesas 78 and 52 per cent of the households were aware of the price support provided by the government. Sixty-seven per cent of the households in Ha Giang received price sup-port while no household received it in Cao Bang province despite being aware of it. Households in DakLak and Vinh Long were less aware of price support and most of them had not receivedany price support in the last year. Only 1.43 and 4.23 per cent of the households had received support prices in DakLak and Vinh Long provinces respectively.
Subsidy: In the study region, 47.69 per cent of the house-holds were aware of the subsidies provided by the government for inputs and various kinds of equipmentwhile only 11.39 per cent of the households had been able to access them. Again awareness about and use of subsidies given by the government was the high-est in Cao Bang and Ha Giang provinces as 78 and 54 per cent of the households in these provinces were aware of the subsidies but

132 Food Security for Small Farmers
only12 and 14 per cent of the households had received them. Of the total households, 35.71 per cent in DakLak and 22.53 per cent in Vinh Long were aware of the subsidy schemes. However, 18 per cent of the households in DakLakhad accessed these schemes in the preceding year, whereas all households in Vinh Long province could not get these benefits.
It is somewhat puzzling that even after being aware of public support, people were not able to benefit from this pro-visioning. This indicates that there are problems with regard to effective implementation. There is also the possibility of inad-equate institutional mechanisms to deliver the services, or lack of effective planning and shortage of human resources. Hence, there is a need to strengthen these institutions and processes so that people can access public support easily.
Credit:It was found that the state was quite successful in informing its people about the government’s credit provisioning as 96 per cent of the households reported being aware of the credit support provided by the government. Awareness was the highest in Cao Bang and DakLak at 94 and 91 per centrespec-tively followed by Ha Giang and Vinh Long provinces. In terms of access to credit, 65 per cent of the households surveyed were able to access it; 91 per cent and 81 per cent of the households in Cao Bang and DakLak had accessed credit while this share for Ha Giang and Vinh Long was 52 and 37 per cent (Table 4.4).
Around 22.4 per cent of the households were aware of other support related to agriculture while taking the study re-gion as a whole, while only 16.4 per cent of the households were able to access this support. Awareness was the highest among the households surveyed in Cao Bang province (52) followed by DakLak, Ha Giang and Vinh Long provinces. In terms of access-ing and benefitting from this support, Ha Giang topped the list with 22 per cent of the surveyed households followed by Vinh Long while the same number of households (12.86 per cent) had accessed it in Cao Bang and DakLak provinces.
Agricultural income: Agricultural income of the surveyed households was around US$ 0.77 per person, per day which is well below the international poverty line of US$ 1.25 per person,

Results from the Field Studies 133
Table 4.4: Level of awareness and use of credit provisioning (in per cent)
ProvinceAwareness about credit provisioning
Credit support accessed last year
Awareness about other support
Use of these sup-ports last year
Cao Bang 94.29 91.43 52.86 12.86
DakLak 91.43 81.43 15.71 12.86
Ha Giang 75.71 52.86 10.00 22.86
Vinh Long 55.71 37.14 11.43 17.14
Average 96.44 65.77 22.42 16.37Source: Compiled from field survey data.
per day. This low income level has serious consequences in terms of poverty and under-nutrition. The average farm income of the householdswas US$ 0.21 per person, per day and the average non-farm income was US$ 0.56 per person, per day. On aver-age the households surveyed in Ha Giang and Cao Bang were surviving much below the poverty line while the income of the people in DakLak was also below the poverty line though it was not very low as compared to other two regions. In Vinh Long the average income per person, per day was well above the poverty line (Table 4.5).
The agricultural income of the households surveyed was negative in Ha Giang and Cao Bang, while non-farm income was positive. This was mainly because these provinces are situat-ed in mountainous regions and the main economic activity is not agriculture. The households were engaged in non-farm activities mainly in forestry and livestock. Also because of the topography, the quality of land is not as good as it is in the plains. Extension services and infrastructure are not as developed as in the other regions. Households are unable to recover their expenditure on inputs required for production. There is a need for more public support in these provinces, as they are on the disadvantageous side, so that agriculture also becomes sustainable in these areas.

134 Food Security for Small Farmers
Table 4.5: Average per capita income (per day in US$)
Province Farm income Non-farm income Total
Vinh Long 0.57 0.93 1.5
Ha Giang -0.06 0.28 0.22
Cao Bang -0.01 0.14 0.13
DakLak 0.34 0.88 1.22
Average 0.21 0.56 0.77Source: Compiled from field survey data.
Table 4.6: Distribution of the households below percapita,perday income of US$ 1.25 (in per cent)
Province Below US$ 1.25
Vinh Long 54.93
Ha Giang 94.29
Cao Bang 94.29
DakLak 67.14
Average 77.58Source: Compiled from field survey data.
Table 4.7: Sources of energy
Provinces
Source of energy Cao Bang DakLak Ha GiangVinh Long
Average
Electricity 90.00 85.71 98.57 90.14 91.11
Kerosene 0.00 1.43 1.43 0.00 0.71
Other 10.00 8.57 0.00 9.86 7.11
Source of cooking fuel
Kerosene 0.00 1.43 0.00 0.03 0.36
LPG 0.00 21.43 0.00 0.06 5.37
Firewood/Dungcake/Farm residue
100.00 74.29 100.00 0.69 68.80
Source: Compiled from field survey data.

Results from the Field Studies 135
Even in Vinh Long the distribution of income was very un-equal.If we exclude the top 10 per cent of the households then the average income was below the poverty line (US$ 1.24). Similarly, in DakLak province by excluding the top 5 per cent of the house-holds the average income per person, per day fell much below the international poverty line to US$ 1.07 per person, per day.
Most of the smallholders were engaged in non-farm ac-tivities to supplement their incomes. Non-agricultural income was US$ 0.56 per capita, per day in Vietnam.Non-farm activi-ties enabled smallholder farmers to move out of poverty. The state,therefore,has to invest heavily in agriculture to make it profitable by supporting smallholder families. The households preferred non-farm activities because of the risk factor involved in agriculture and also because the incomes generated in the non-farm sector were much higher than those from agriculture. The government should invest more in non-farm activities which will enable smallholders to invest in farms. Further, there is a need to protect farms with agri-insurance and creating an environment where farmers are willing to invest in farm activities out of their incomes from non-farm activities.
Of the total households surveyed,77.58 per cent were liv-ing well below the international poverty line of US$ 1.25 per person, per day while only 13.5 per cent of the households had incomes more than US$ 2 per capita per day. The highest number of poor households was in Ha Giang and Cao Bang where 94 per cent of the households had incomes less than US$ 1.25 per capita, per day; 54.3 per cent and 67.14 per cent households in Vinh Long and DakLak province respectively were poor (Table 4.6).
Sources of energy: In an attempt to know the health status of household members, information relating to sources of energy and their uses was also captured. It was found that most of the house-holds surveyed used electricity as the primary source of energywhile a few households in DakLak and Ha Giang used kerosene for ener-gy purposes. The per centage share of households using electricity as the prime source of energy was the highest in Ha Giang (98.57) fol-lowed by Vinh Long (90.14), Cao Bang (90) and DakLak (85.71). Vietnam has moved towards efficient sources of energy in terms of distributing electricity to households (Table 4.7).

136 Food Security for Small Farmers
In terms of use of cooking fuel, only 5.37 per cent of the households surveyed use LPG as the primary fuel and 68.8 per cent of the households used firewood/dungcake/crop residue, while the share of households using kerosene was negligible. In particular, in Ha Giang and Cao Bang all the households surveyed used firewood/dungcake/farm residue as cooking fuel mainly because of the easy availability of firewood as most parts of the province are covered by forests. This reflects a lacuna in the distribution of basic support provided by the state, which has major health consequences. Only 5 per cent of the households which used LPG as their primary fuel for cooking purposes were concentrated in DakLak province and the share of those using this source for fuel was also negligible in the other provinces. This also shows that the living conditions of the households sur-veyed were very poor, as can also be seen from their levels of income. So there is a need to strengthen the basic facilities pro-vided by the state which will enable the households to overcome many diseases (which occur due to use of inefficient sources for cooking) and raise living standards.
Status of farm mechanization: The level of mechanization was very low in the surveyed households. The most used ma-chines for cultivation were tractors, hand tractors and broadcast seeders. Only 33 per cent of the households used tractors for cultivation, 12 per centused broadcast seeders and 13.88 per cen-tused hand tractors for ploughing purposes (Table 4.8). The use of other machines for cultivation was not prevalent much. Only 3.2 per cent of the households used sprayers, 2.49 per centused sprinklers for irrigation, 1.2 per centused seed drill techniques for cultivation and the per centage share of use of other (trans-planters, harvesters and drip irrigation) techniques was also neg-ligible in the households surveyed.
The rate of technological change or mechanization is not always a positive change. One also has to see that it has the po-tential for labour absorption and at the same time also reduces the drudgery of human labour and promotes decent work. Any blind belief in technological change is not good. The low level of mechanization indicates that farming involves more labour than

Results from the Field Studies 137
Table 4.8: Use of machines and implements by smallholders (in per cent)
Provinces
Cao Bang DakLakHa Giang
Vinh Long
Average
Hand tractor 1.43 30.00 0.00 23.94 13.88
Tractor/cultivator plough
21.43 74.29 8.57 28.17 33.10
Broadcast seeder 14.29 27.14 4.29 5.63 12.81
Seed drill 1.43 0.00 0.00 4.23 1.42
Transplanter 0.00 0.00 0.00 1.41 0.36
Sprayer 2.86 5.71 0.00 4.23 3.20
Drip irrigation 2.86 0.00 0.00 0.00 0.71
Sprinkler 1.43 5.71 0.00 0.00 2.49
Harvester 0.00 0.00 0.00 2.82 0.71Source: Compiled from field survey data.
machines. Most of the smallholder families employ their family labour in the fields so if public provisioning is strengthened,the people working on these fields will benefit and this will help them move out of poverty by reducing their costs and increasing their income levels.
From these results, there is a clear indication that public support in terms of price support for the produce andsubsidies for agri-inputs need to be strengthened. There is also an urgent need to create more public awareness about the benefits of gov-ernment policies and programmes. Further, the government should strengthen institutional mechanisms and address proce-dural issues to deliver services effectively.
From the FGDs conducted at the commune level with officials and farmers it was found that some public support was available for families, especially for poor and ethnic minorities. In the communes the state provides support in terms of both breeds and fertilizers. In terms of food security, the state provides food grains to poor households. Under government-targeted programmes, the poor and nearly poor households can get a lot

138 Food Security for Small Farmers
of support either in cash or in kind like exemption of tuition fees for children, health insurance cards and electricity for VND 35,000/month.
Most of the households in all the communes were elec-trified and primary health facilities were available at the village level. All the villages had primary schools with secondary and senior secondary schools at the commune or district level. People belonging to ethnic communities did not have to pay any school fees or tuition fees for kindergartens but had to pay for books, note pads and other items.
Drinking water facilities were available in the provinces but in the Ma Pan ward and Lung Lua village in Cao Bang prov-ince water for drinking and irrigation purposes was collected from the river and springs. Public water sources were not avail-able in this ward and there was no water pipe to take the water from the river to the homes. Public transport was not available in all the villages surveyed and the most used vehicle for transport was motorcycles.
Most households borrowed from the Vietnamese Bank for Social Policies (VBSP) for agriculture and rural development. This credit supportwas mainly for supporting agricultural activi-ties, buying land and building houses. Loans from VBSP were easier to get as no collateral is needed; only a certification by the ward authority is needed. Informal lending was not popular in the villages surveyed.
Among the surveyed households in four states in India, a majority of the smallholder farmers belonged to SC and OBC communities (Table 4.9). However, in Jharkhand, as is obvious considering the demography of the state, the majority were STs. In Uttar Pradesh, more than 20 per cent of the surveyed small-holder households belonged to the general category.
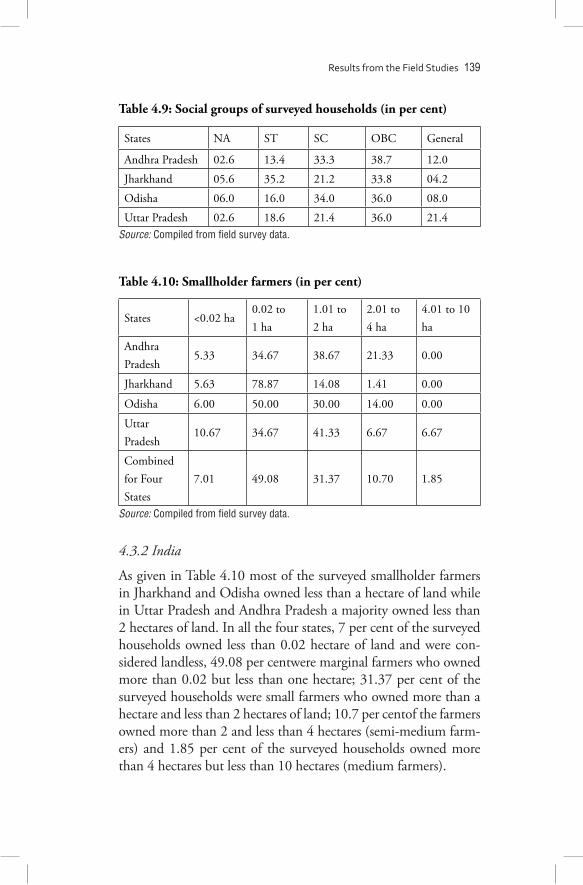
Results from the Field Studies 139
Table 4.9: Social groups of surveyed households (in per cent)
States NA ST SC OBC General
Andhra Pradesh 02.6 13.4 33.3 38.7 12.0
Jharkhand 05.6 35.2 21.2 33.8 04.2
Odisha 06.0 16.0 34.0 36.0 08.0
Uttar Pradesh 02.6 18.6 21.4 36.0 21.4Source: Compiled from field survey data.
Table 4.10: Smallholder farmers (in per cent)
States <0.02 ha0.02 to 1 ha
1.01 to 2 ha
2.01 to 4 ha
4.01 to 10 ha
Andhra Pradesh
5.33 34.67 38.67 21.33 0.00
Jharkhand 5.63 78.87 14.08 1.41 0.00
Odisha 6.00 50.00 30.00 14.00 0.00
Uttar Pradesh
10.67 34.67 41.33 6.67 6.67
Combined for Four States
7.01 49.08 31.37 10.70 1.85
Source: Compiled from field survey data.
4.3.2 India
As given in Table 4.10 most of the surveyed smallholder farmers in Jharkhand and Odisha owned less than a hectare of land while in Uttar Pradesh and Andhra Pradesh a majority owned less than 2 hectares of land. In all the four states, 7 per cent of the surveyed households owned less than 0.02 hectare of land and were con-sidered landless, 49.08 per centwere marginal farmers who owned more than 0.02 but less than one hectare; 31.37 per cent of the surveyed households were small farmers who owned more than a hectare and less than 2 hectares of land; 10.7 per centof the farmers owned more than 2 and less than 4 hectares (semi-medium farm-ers) and 1.85 per cent of the surveyed households owned more than 4 hectares but less than 10 hectares (medium farmers).
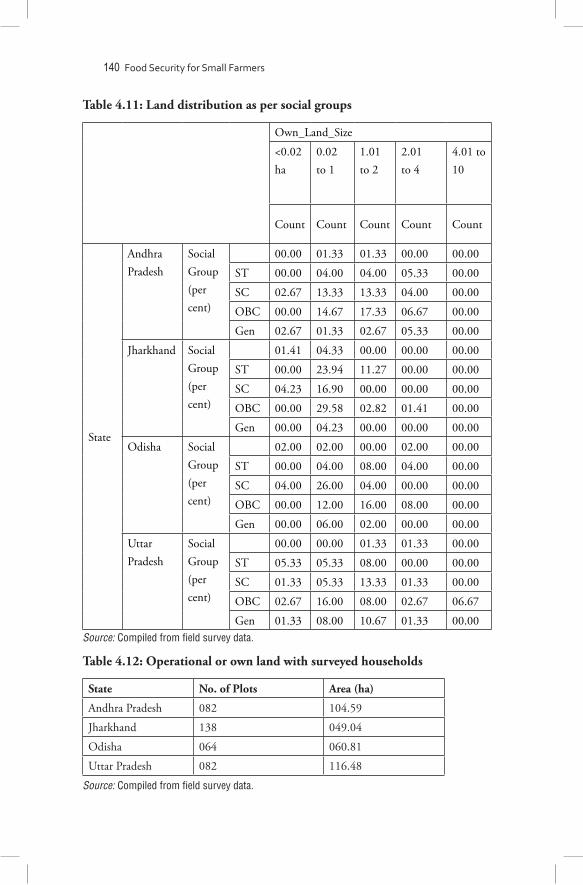
140 Food Security for Small Farmers
Table 4.11: Land distribution as per social groups
Own_Land_Size
<0.02 ha
0.02 to 1
1.01 to 2
2.01 to 4
4.01 to 10
Count Count Count Count Count
State
Andhra Pradesh
Social Group (per cent)
00.00 01.33 01.33 00.00 00.00
ST 00.00 04.00 04.00 05.33 00.00
SC 02.67 13.33 13.33 04.00 00.00
OBC 00.00 14.67 17.33 06.67 00.00
Gen 02.67 01.33 02.67 05.33 00.00
Jharkhand Social Group (per cent)
01.41 04.33 00.00 00.00 00.00
ST 00.00 23.94 11.27 00.00 00.00
SC 04.23 16.90 00.00 00.00 00.00
OBC 00.00 29.58 02.82 01.41 00.00
Gen 00.00 04.23 00.00 00.00 00.00
Odisha Social Group (per cent)
02.00 02.00 00.00 02.00 00.00
ST 00.00 04.00 08.00 04.00 00.00
SC 04.00 26.00 04.00 00.00 00.00
OBC 00.00 12.00 16.00 08.00 00.00
Gen 00.00 06.00 02.00 00.00 00.00
Uttar Pradesh
Social Group (per cent)
00.00 00.00 01.33 01.33 00.00
ST 05.33 05.33 08.00 00.00 00.00
SC 01.33 05.33 13.33 01.33 00.00
OBC 02.67 16.00 08.00 02.67 06.67
Gen 01.33 08.00 10.67 01.33 00.00Source: Compiled from field survey data.
Table 4.12: Operational or own land with surveyed households
State No. of Plots Area (ha)
Andhra Pradesh 082 104.59
Jharkhand 138 049.04
Odisha 064 060.81
Uttar Pradesh 082 116.48
Source: Compiled from field survey data.

Results from the Field Studies 141
Even within the smallholders, the larger sized land be-longed to either general categories or OBCs. In Andhra Pradesh, general category farmers were less represented in smallholders but even in that small portion, most of them were semi-medium farmers. In Jharkhand, most of the ST smallholders surveyed were either marginal or small farmers. In Odisha, most of the smallholder households were marginal farmers. In Uttar Pradesh, most of the OBC farmers owned larger size land within the smallholder category of farmers (Table 4.11).
However, the survey has some limitations as the data pre-sented here is consistent with national data as given by NSSO. The upper caste dominates the big land owning class while the small and semi-medium land owning classes are dominated by SCs and OBCs. Since the smallholder farmers belong to socially deprived sections any public policy directed towardsthem will by design be a socially just policy.
Table 4.12 gives information on the number of plots and area of land with the surveyed households. In the survey, the larg-est agricultural land was covered in Uttar Pradesh where 116.48 hectares of agricultural land was divided into 82 plots with 75 households. In Andhra Pradesh, 104.59 hectares was divided in 82 plots with 75 households. In Odisha, the survey covered 81.24 hectares of agricultural land with 50 households,divided into 64 plots. The smallest land size was covered in Jharkhand with the highest number of plots among the four surveyed states. In Jharkhand, the survey covered 49.04 hectares of agricultural land with 71 households,divided into 138 plots.
Table 4.13 gives information on the crops produced dur-ing September 2014 and September 2015 in different states. The table also gives information on state-wise gross cropped area. In Andhra Pradesh, the largest portion of land was underground-nuts and pulses. In Uttar Pradesh, the largest portion of land was used for cultivating wheat and pulses. It is worth noting here that these crops are not major crops of the respective states and that they require lesser amounts of water. As found in the FGDs, most of the irrigation in the villages in Andhra Pradesh was through water tanks which were owned by large farmers and

142 Food Security for Small Farmers
Table 4.13: Area under different crop in different states (in hectares)
Area Under Cultivation (ha)
Crop Andhra Pradesh Jharkhand OdishaUttar Pradesh
Paddy (Rice) 10.28 19.38 41.57 13.92
Wheat 0.00 1.88 0.81 74.48*
Maize 1.21 10.54 0.00 3.64
Bajra 0.00 0.00 0.00 6.47@
Jowar 10.12 0.03 0.00 10.52#
Pulses 26.51 7.87 8.50 45.90$
Potatoes 0.00 1.79 7.30 0.07
Ground Nuts 41.10 1.32 0.00 0.61
Sugarcane 0.00 0.16 0.00 0.00
Sun Flower 0.00 0.00 0.81 0.00
Rapeseed 0.00 0.52 0.00 3.04
Seed Cotton 0.68 0.00 0.00 0.00
Onion 1.42 0.23 0.81 0.00
Tobacco 0.00 0.00 0.00 0.00
Coffee 0.00 0.00 0.00 0.00
Tea 0.00 0.00 0.00 0.00
Rubber 0.00 0.00 0.00 0.00
Coconut 0.00 0.00 0.00 0.00
Corn 0.00 0.00 0.00 0.00
Sweet Potatoes 0.00 0.28 0.00 0.00
Cassava 0.00 0.00 0.00 0.00
Vegetables 3.44 0.51 0.00 0.00
Other 14.24 5.54 8.20 1.42
Gross Cropped Area
108.99 50.03 68.00 160.08
Notes: *15.26 hectares is mixed cropping with rapeseed. @All area is mixed cropping with pulses. #All area is mixed cropping with pulses. $ 5.1 hectares is mixed cropping with rapeseed. Source: Compiled from field survey data.

Results from the Field Studies 143
landowners. The FGDs also reported lack of irrigation facilities in Uttar Pradesh. The sources of irrigation were highly skewed in favour of big landowners. The major crop cultivated by small-holder farmers in Odisha was rice and in Jharkhand the major crops were rice and maize. In these two states irrigation was done using small seasonal rivers through hills.
To assess the food security situation of smallholder house-holds in the surveyed villages, we compared our survey findings with that of the National Sample Survey (NSS) (2014) (Tables 4.14-4.16). The NSS (2014) report is based on a survey con-ducted by NSSO in 2011-12. The report provides per capita consumption of ‘average rural households’ in different states. Our survey provides information on per capita consumption of ‘smallholder households’ in different states.
In Andhra Pradesh, rice is the staple food. Average weekly per capita consumption of smallholder households in 2015 was 2.89 kg while for average rural households in 2011-12 it was 2.71 kg. Forty per cent of the surveyed households had weekly per capita consumption of rice less than the NSS rural average. The lower consumption was despite the fact that 9 per cent of the gross cropped area of the surveyed households in the state was used for paddy cultivation. Average consumption of pulses by surveyed households was also slightly more than the average rural consumption in the state. This was because 24 per cent of the gross cropped area by smallholder households was devoted to cultivating pulses. In the case of pulses too, 32 per cent of the total surveyed households reported lower consumption than the NSS rural average for the state. Wheat consumption was negli-gible in the surveyed villages in the state. Consumption of edible oil in smallholder households was also slightly more than the average rural consumption as per NSS. More consumption of edible oil was mainly because of groundnut production. Despite the high production of groundnuts, 35 per cent of the surveyed smallholder households reported lower consumption of edible oil than the NSS rural average for the state. Average consump-tion of potatoes and onionswas also more in the case of small-holder households, but 25 and 57 per centof the smallholder households reported lower consumption than the NSS average.

144 Food Security for Small Farmers
Table 4.14: Weekly percapita consumption of surveyed smallhold-ershouseholds (in kg)
Food Items Andhra Pradesh Jharkhand Odisha Uttar Pradesh
Rice 2.89 2.79 3.07 1.02
Wheat --- 0.32 0.08 2.12
Pulses 0.27 0.14 0.22 0.22
Potatoes 0.28 0.46 0.59 0.79
Onion 0.33 0.11 0.19 0.23
Edible Oil 0.07 0.10 0.10 0.21
Sugar 0.09 0.08 0.13 0.27Source: Compiled from field survey data. Table 4.15: Weekly per capita consumption of average rural households as per NSS 2014 ( in kg)
Food Items Andhra Pradesh Jharkhand Odisha Uttar Pradesh
Rice 2.71 2.21 3.10 1.02
Wheat 0.07 0.67 0.17 1.79
Pulses 0.20 0.11 0.12 0.13
Potatoes 0.13 0.77 0.57 0.77
Onion 0.27 0.21 0.17 0.18
Edible Oil 0.05 0.43 0.05 0.14
Sugar 0.13 0.40 0.10 0.18Source: Compiled from field survey data.
Table 4.16: Surveyed smallholder households having consumption less than the NSS rural household consumption average (in per cent)
Food Items Andhra Pradesh Jharkhand OdishaUttar Pradesh
Rice 40 54 90 68
Wheat --- 80 84 51
Pulses 32 61 32 43
Potatoes 25 92 54 93
Onion 57 93 48 55
Edible Oil 35 100 42 44
Sugar 69 100 32 32Source: Compiled from field survey data.
Results from the Field Studies 145
Average consumption of sugar by smallholder households was less than the NSS average.
Smallholder households surveyed in Jharkhand cultivated paddy on 39 per cent of the gross cropped area followed by pulses on 16 per cent of the gross cropped area. Their production was also reflected in their consumption patterns. As per NSS (2011-12), per capita, per week consumption of rice and pulses of aver-age rural households in the state was 2.21 kg and 0.11 kg respec-tively whereasour survey revealed that in 2015, per capita, per week consumption of rice and pulses of smallholder households in the surveyed villages was 2.79 kg and 0.14 kg respectively. Other than rice and pulses, for all other food items, the average consumption of surveyed smallholder households was lower than the average rural consumption of the state. It is also noted that almost all smallholder households reported lower consumption of edible oil, sugar, onions and potatoesthan the NSS rural aver-age for the state.
Despite using 61 per cent of the gross cropped area for paddy cultivation, 90 per cent of the surveyed smallholder house-holds had per capita, per week consumption of rice less than the NSS rural average for the state. Rice and pulses are primary food items for the people in Odisha. Per week, per capita consump-tion of pulses by surveyed smallholder households was 0.22 kg, which was higher than the NSS rural average for the state. Most of the surveyed smallholder households had lower consumption of wheat, potatoes and onions than the NSS rural average. For other food items, a significant number of smallholder house-holds had per capita consumption that was lower than the NSS rural average.
Per week, per capita rice consumption of surveyed small-holder households in Uttar Pradesh was equal to the NSS rural average, though 68 per cent of the surveyed households had lower consumption of rice than the NSS rural average for the state. Consumption of wheat and pulses by the surveyed smallholder households was more than the NSS rural average for the state. More consumption of these items was mainly because 47 and more than 35 per cent of the gross cropped area respectively was

146 Food Security for Small Farmers
used for cultivating wheat and pulses. For wheat and pulses, 51 and 43 per cent of the surveyed households respectively reported lower consumption than the NSS rural average for the state.
In all the surveyed states, the food consumption of small-holder households was not very impressive. The consumption of own cultivated food items was good but still the largest por-tion of smallholder households reported consumption that was lower than the average rural consumption of the respective state. It should be noted that this comparison has been made between two data sources which have a time gap of almost four years. Our survey reveals that most of the smallholder households had lower consumption than the average rural consumption which persisted for four years.
Table 4.17 provides information regarding awareness and use of public provisions among smallholder farmers. It also gives the share of smallholder farmers who were aware of or had ever used the mentioned public provisions.
Awareness of support price: Awareness of public provision-ing among smallholder farmers was very alarming in Jharkhand, Odisha and Uttar Pradesh. Not more than 23 per cent of small-holder farmers in these four states were aware of the govern-ment’s support prices. Excluding Andhra Pradesh, only around 15 per cent smallholder households in the other three states were aware of this policy. Even in Andhra Pradesh, which is better than the other states in terms of awareness, only around 35 per cent smallholder farmers were aware of the support price policy. In ST dominated Jharkhand, not even 3 per cent of smallholder farmers reported being aware of the support price policy.
Awareness of subsidy: Less than 30 per cent of the surveyed households were aware of input subsidies. In Andhra Pradesh, 64 per cent of the smallholder farmers reported that they had in-formation on input subsidies. Jharkhand was a poor performing state in terms of information on input subsidies; 22 and 21 per cent of the surveyed smallholder households in Odisha and Uttar Pradesh respectively were aware of input subsidies.

Results from the Field Studies 147
Table 4.17: Smallholder farmers aware of or used public provisions (in per cent)
Awareness/Use of Public Provisioning
Andhra Pradesh
Jharkhand OdishaUttar Pradesh
Combined for Four States
Awareness of Support Price
34.67 2.82 26.00 28.00 22.88
Awareness of Subsidy
64.00 7.04 22.00 21.33 29.52
Awareness of Public Procurement Agencies
32.00 14.08 32.00 24.00 25.09
Awareness of Credit Support
65.33 40.85 46.00 58.67 53.51
Awareness of Extension Services
65.33 7.04 16.00 12.00 26.20
Awareness of Government Support in case of Natural Calamity
64.00 29.58 30.00 70.67 50.55
Used Public Procurement Agency?
25.33 4.23 18.00 4.00 12.55
Used Credit Support? 22.67 11.27 46.00 50.67 31.73
Used Extension Services?
32.00 2.82 12.00 5.33 13.28
Used Monetary Support in case of Natural Calamity
12.00 5.63 10.00 46.67 19.56
Source: Compiled from field survey data.

148 Food Security for Small Farmers
Awareness and use of public procurement: Only one-fourth of the surveyed households were aware of any public procure-ment agencies in the four states and only 43 per centwere aware that they could use public procurement agencies for selling their produce. Through the FGDs in villages in Jharkhand it was found that LAMPS procuredthe farmers’ produce and that is why awareness about procurement agencies was more than the awareness about support prices in the state (a little more than 14 per cent of the surveyed households reported being aware of public procurement agencies). In Odisha too awareness about procurement was more than the awareness about support prices. The situation was the opposite in Uttar Pradesh and Andhra Pradesh. Use of public procurement in all the states was less than awareness. Eleven per cent smallholder households were aware and could use a public procurement agency for selling their pro-duce. This means that even though they were aware of the policy, smallholder farmers were not able to sell their produce to public procurement agencies.
Awareness and use of credit support: Slightly more than half of the surveyed smallholder farmers in the four states were aware of credit support by the government. Andhra Pradesh recorded the highest share (65.33 per cent) and Jharkhand the lowest (40.85 per cent) among the four surveyed states. Awareness about credit support was better than awareness about any other schemebut even in this case only 41 per cent of the aware small-holder households could use credit support. Only 22.14 per cent respondents were aware and could use this provision.
Awareness and use of extension services: Findings regarding awareness and use of extension services from the field are alarm-ingly low for all the states except Andhra Pradesh. In Andhra Pradesh 65 per cent of the surveyed smallholder households were aware of any extension services followed by Odisha (16 per cent). Here again there was a big gap between awareness and use of extension services as 39 per cent of the aware house-holds could use any extension service. There were only 10 per cent households who were aware and had used any extension service.
Results from the Field Studies 149
Awareness and got monetary support in case of a natural ca-lamity: More than half of the surveyed households were aware of government support in case of a natural calamity. This figure was the highest in Uttar Pradesh, where the surveyed location had experienced drought in the last year. In Jharkhand about 30 per cent of the households were aware of this provision; this was the lowest level of awareness among the four surveyed states. Like other public policies, there was a huge gap between awareness and use of monetary support in case of a natural calamity, even in cyclone or drought affected areas. More than half of the surveyed farmers were aware of government support in case of a natural calamity but less than one-fifth of the total surveyed households could get the monetary support despite being affected by a natu-ral calamity. Eighteen per cent of the total surveyed household-swere aware and had used this provision (Table 4.18).
Public irrigation sources: Public irrigation facilities in the sur-veyed villages were not available for almost four-fifth of the plots with surveyed smallholder households. It was found that more than 38 per cent of the plots in the surveyed four states were un-irrigat-ed. Jharkhand recorded the highest number of un-irrigated plots (more than 62 per cent). Less than 10 per cent of the plots with the surveyed households were un-irrigated in Andhra Pradesh. In Odisha and Uttar Pradesh the share of un-irrigated plots with sur-veyed households was 44 and 23 per cent respectively. More than 37 per cent of the agricultural plots in Uttar Pradesh were irrigated by canals, traditional channels or streams. The share of irrigated plots through such sources was 35, 27 and 19 per cent respectively in Andhra Pradesh, Odisha and Jharkhand. Most of the plots in Andhra Pradesh were irrigated by tube wells. In Odisha, the canal was used for irrigating the largest number of irrigated agricultural plots. In Jharkhand and Uttar Pradesh, private wells irrigatedmost of the irrigated plots (Table 4.19).
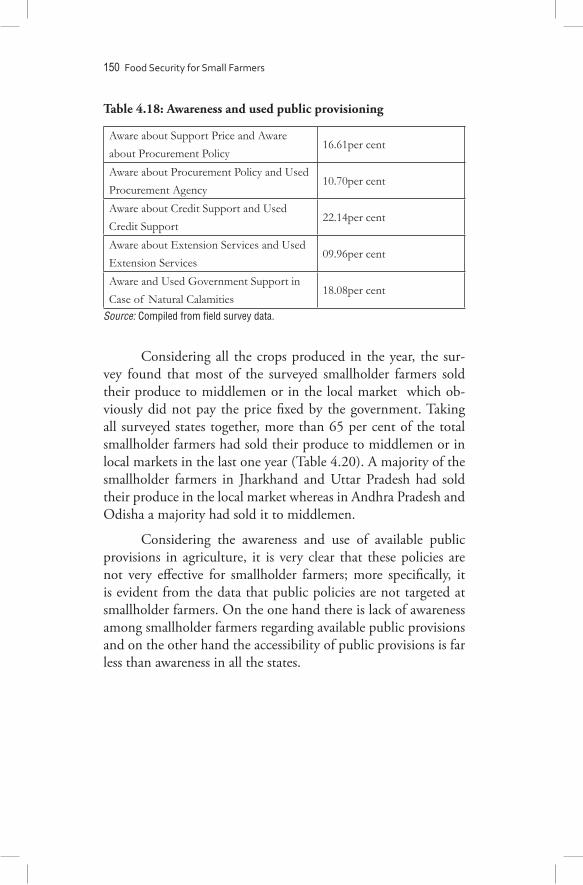
150 Food Security for Small Farmers
Table 4.18: Awareness and used public provisioning
Aware about Support Price and Aware about Procurement Policy
16.61per cent
Aware about Procurement Policy and Used Procurement Agency
10.70per cent
Aware about Credit Support and Used Credit Support
22.14per cent
Aware about Extension Services and Used Extension Services
09.96per cent
Aware and Used Government Support in Case of Natural Calamities
18.08per cent
Source: Compiled from field survey data.
Considering all the crops produced in the year, the sur-vey found that most of the surveyed smallholder farmers sold their produce to middlemen or in the local market which ob-viously did not pay the price fixed by the government. Taking all surveyed states together, more than 65 per cent of the total smallholder farmers had sold their produce to middlemen or in local markets in the last one year (Table 4.20). A majority of the smallholder farmers in Jharkhand and Uttar Pradesh had sold their produce in the local market whereas in Andhra Pradesh and Odisha a majority had sold it to middlemen.
Considering the awareness and use of available public provisions in agriculture, it is very clear that these policies are not very effective for smallholder farmers; more specifically, it is evident from the data that public policies are not targeted at smallholder farmers. On the one hand there is lack of awareness among smallholder farmers regarding available public provisions and on the other hand the accessibility of public provisions is far less than awareness in all the states.

Results from the Field Studies 151Ta
ble
4.19
: Sha
re o
f agr
icul
tura
l plo
ts w
ith
diffe
rent
sour
ces o
f irr
igat
ion
(in
per
cent
)
Stat
esU
n-Ir
rigat
edC
anal
Tank
Tube
Wel
lW
ell
Trad
ition
al
Cha
nnel
s/St
ream
s
Com
bina
tion
of
Diff
eren
t Sou
rces
Oth
er
Andh
ra P
rade
sh09
.76
08.5
407
.31
35.3
702
.44
10.9
802
.44
15.8
5
Odi
sha
43.7
526
.56
09.3
815
.63
04.6
9-
--
Jhar
khan
d62
.32
02.9
000
.72
01.4
516
.67
13.0
4-
02.9
0
Utta
r Pra
desh
23.1
718
.29
-07
.31
20.7
303
.66
18.7
515
.85
Sour
ce: C
ompi
led
from
fiel
d su
rvey
dat
a.
Tabl
e 4.
20: P
lace
of s
ale
of fo
od g
rain
s pro
duce
d by
smal
lhol
der
farm
ers (
in p
erce
nt)
Plac
e of
Sal
eAn
dhra
Pra
desh
Jhar
khan
dO
dish
aU
ttar P
rade
sh
Com
bine
d fo
r Fou
r Sta
tes
NA
17.3
350
.70
30.0
017
.33
28.4
1
Loca
l Mar
ket
30.6
637
.33
22.0
061
.33
39.8
5
Mid
dlem
en/A
gent
49.3
309
.86
42.0
005
.33
25.4
6
Coo
pera
tives
02.6
600
.00
06.0
013
.33
05.5
3
Gov
t. Pr
ocur
emen
t Age
ncy
00.0
000
.00
00.0
002
.66
00.7
0
Sour
ce: C
ompi
led
from
fiel
d su
rvey
dat
a.
152 Food Security for Small Farmers
The average farm income of the surveyed smallholder households was less than the non-farm income in all the states (Table 4.21). Taking the four states together, average percapita, perday farm income was less than Rs16 (US$0.24). The highest farm income was in Andhra Pradesh at Rs32.30 (US$0.48). The same trend existed in non-farm incomes. The average percapi-ta, perday non-farm income for these four states was Rs22.80 (UD$0.34). Non-farm incomes were the lowest in Uttar Pradesh. Combining farm and non-farm incomes the average percapita, perday income for these states was Rs33.80 (US$0.58). Odisha had the lowest percapita, perday total income and Andhra Pradesh had the highest. The low levels of farm income indicatea higher cost of inputs and lower returns on agricultural outputs of smallholder farmers. The lower farm incomes reported by small-holder farmers do not take family labour into account. So, actual farm incomes will be even lower than the incomes reported here. The total income is also not sufficient to command purchasing power to ensure food security. Except some farmers, most of the smallholder households lived under acute income poverty which obviously led to hunger.
More than 87 per cent of the total surveyed households in the four states were not able to earn the international critical minimum level of percapita, per day income of US$ 1.25 (Table 4.22). In fact almost 55 per cent of the surveyed smallholder households in the four states were not able to earn Rs 27 per-capita, perday. Andhra Pradesh was better than the other states as 72 per cent of the surveyed households earned US$ 1.25 and less than 10 per cent earned Rs 27 percapita, perday.
The findings from the survey show that most of the small-holder households in all the states had to rely on borrowing for meeting their day-to-day expenses. The largest share of borrow-ing among smallholder farmers was from informal sources (ex-cept Odisha). This was largely because of lower creditworthiness of smallholder households, which is obviously the result of a smaller size of land. Informal lending among smallholder farm-ers was the highest in Andhra Pradesh followed by Uttar Pradesh. The gap between formal and informal lending was the largest in Jharkhand where only around 5 per cent of the smallholder

Results from the Field Studies 153
Table 4.21: Average percapita,perday farm/non-farm income
States Farm (Rs/$) Non-Farm (Rs/$)
Total (Rs/$)
Andhra Pradesh 32.3 ($0.48) 41.1 ($0.62) 73.4 ($1.10)
Jharkhand 05.0 ($0.08) 19.6 ($0.29) 24.6 ($0.36)
Odisha 06.7 ($0.10) 16.4 ($0.25) 23.2 ($0.35)
Uttar Pradesh 16.03($0.24) 11.9 ($0.18) 27.9 ($0.42)
Combined (Four States)
15.9 ($0.24) 22.8 ($0.34) 33.8 ($0.58)
Source: Compiled from field survey data.
Table 4.22: Share of households below an income of US$1.25 and Rs 27 percapita,perday (in per cent)
State Below US$ 1.25 Below Rs 27
Andhra Pradesh 72.00 09.33
Jharkhand 97.18 69.01
Odisha 94.00 76.00
Uttar Pradesh 90.67 73.33Source: Compiled from field survey data.
Table 4.23: Smallholder farmers’ sources of borrowing (in per cent)
States Formal Sources Informal SourcesAndhra Pradesh 41.33 62.67Jharkhand 05.63 45.07Odisha 44.00 32.00Uttar Pradesh 37.30 58.67Combined for Four States
31.36 51.29
Source: Compiled from field survey data.
households got loans from formal sources. Taking all surveyed states together, more than half of the smallholder farmers bor-rowed from informal sources (Table 4.23).

154 Food Security for Small Farmers
Table 4.24: Smallholder farmers who used different techniques (in per cent)
Andhra Pradesh Jharkhand Odisha
Uttar Pradesh
Combined for all states
Tractor 53.3 00.0 52.0 44.0 36.5
Cultivator 81.3 22.5 24.0 90.7 57.9
Seeder 33.3 00.0 00.0 28.0 17.0
Seed drill 13.3 00.0 00.0 64.0 21.4
Transplanter 01.3 00.0 04.0 21.3 07.0
Sprayer 49.3 09.9 40.0 65.3 41.7
Drip irrigation 01.3 00.0 00.0 20.0 05.9
Sprinkler 05.3 02.8 02.0 48.0 15.9
Harvester 33.3 00.0 10.0 09.3 13.7
Thrasher 33.3 01.4 22.0 89.3 38.4
Animal 36.0 81.7 54.0 58.7 57.6Source: Compiled from field survey data.
Mechanization of agriculturefor small and marginal farm-ers was not similar in all the surveyed states. Andhra Pradesh was more mechanized than the other three states. Use of tractors for farm work was more prevalent in Andhra Pradesh followed by Odisha and Uttar Pradesh (Table 4.24). None of the surveyed households in Jharkhand reported using tractors. Use of spray-ers and sprinklers was more common in Uttar Pradesh. More than 80 per cent of the surveyed farmers in Jharkhand reported using animals for farm activities. More than 50 per cent of the surveyed households in Uttar Pradesh and Odisha used animals in farm work. A significant number of farmers in all the states used both animals and tractors for different farm activities. Even in the case of Andhra Pradesh, the most mechanized surveyed state, 32 per cent of the total surveyed households used tractors and also animals for farm work. This indicates the involvement of a large amount of human labour in smallholder agriculture. Lower mechanization is also a reflection of lower surplus gen-eration capacity of smallholder agriculture. Smallholder farmers

Results from the Field Studies 155
do not have a level of income which would induce them to use machines for farm activities. The social dimension of machine use is also very evident as in ST dominated Jharkhand, most of the smallholder farmers used animals for farm activities.
The social and economic backwardness of smallholder farmers is reflected in their standard of living. Taking all surveyed states together, one-third of the total surveyed smallholder house-holds used kerosene for lighting purposes. Andhra Pradesh was better than the other states as almost 93 per cent of the total sur-veyed smallholder households were electrified (Table 4.25). The status of smallholder households’ electrification was very poor in Uttar Pradesh followed by Jharkhand. In more than two-third of the surveyed smallholder households in the four surveyed states the main cooking fuel was firewood/cowdung cake/crop residue, which is highly dangerous for health. The use of such fuels was the largest in Jharkhand followed by Odisha and Uttar Pradesh. In these three states more than 90 per cent of the surveyed small-holder households used these dangerous cooking fuels.

156 Food Security for Small Farmers
Tabl
e 4.
25: S
mal
lhol
der
hous
ehol
ds w
ho u
sed
diffe
rent
ene
rgy
sour
ces (
in p
er c
ent)
Andh
ra P
rade
shJh
arkh
and
Odi
sha
Utta
r Pra
desh
Com
bine
d fo
r fou
r sta
tes
Sour
ce o
f En
ergy
Not
Rep
orte
d4.
00.
04.
00.
01.
8
Elec
tric
ity93
.354
.970
.044
.065
.3
Ker
osen
e2.
743
.726
.056
.032
.5
Sola
r/W
ind
0.0
1.4
0.0
0.0
0.4
Coo
king
Fue
l
Not
Rep
orte
d38
.70.
02.
02.
711
.8
Ker
osen
e1.
30.
00.
06.
72.
2
LPG
60.0
1.4
6.0
0.0
18.1
Fire
woo
d/C
ow-d
ung
Cak
e/C
rop
Resid
ue
0.0
98.6
92.0
90.7
67.9
Sour
ce: C
ompi
led
from
fiel
d su
rvey
dat
a.Ca
esil
hica
mqu
am p
ublis
mer
io, C
. Ful
tur a
ctui
t in
alar
tam
hic
oena
, C. U
rortu
s; h
um p
ublin
v er
nihi
lnes
? At
in d
i,

Concluding Observations and Policy Recommendations
5.1 Concluding Observations
This study covered a few important aspects of public provision-ing for agriculture and their implications for food security with a focus on smallholder farmers. Specifically, this study was a com-parative assessment of South and East Asia with emphasis on India and Vietnam in their respective regions. The first chapter of the report introduced the study and described its scope, objec-tives and operational framework. It set the background of the study within overall public support to the agriculture sector, in particular the priority of public expenditure towards small and marginal farmers. As is well known, South Asia houses a dispro-portionately large number of the world’s under-nourished people although the situation in East Asia has improved considerably in recent years.
The second chapter examined in some detail existing lit-erature on smallholder agriculture, public provisioning for agri-culture and food security. The major findings that emerge from existing literature show that among the developing countries poverty declined from 43 per cent in 1990 to 17 per cent in 2015. However, the incidence of food secure people living in developing or least developed areas continues to be very high. Further, an overwhelming majority of hungry and malnourished people live in rural areas and are, ironically, dependent on agri-culture. In most of these countries small-scale farmers are central to the agriculture sector and play important roles in promoting an ecologically rational and socially just food system. We may
Chapter 5

158 Food Security for Small Farmers
also note that agriculture as a sector still comprises a significant share of overall GDP and household incomes while also provid-ing essential food security in many of the poorest countries.
It emerges from literature that policies which favour in-creased public expenditure in the agriculture sector will lead to equitable economic development and contribute significantly to freedom from hunger and nutrition. Agricultural spending as a percentage of agricultural GDP has declined across all regions since the early 1980s and is extremely low in developing coun-tries as compared to developed countries. On the one hand, there is a declining trend in agricultural investments and on the other neglect of smallholders has increased. This has had severe impli-cations for food security, in particular of marginal and smaller farming households.
Chapter three presented an analysis of the secondary data available from different sources. It was found that the ag-riculture sector has got inadequate attention in terms of public spending. In 2012, the share of agricultural expenditure was only 4.76 per cent of the total world public expenditure and this declined over time. At the same time the share of agri-cultural expenditure in total GDP was only 1.23 per cent in 2012. In South Asian countries public spending on agriculture has been relatively neglected as compared to most of the other sectors such as education, health, defence, transport and com-munication and social protection. In percentage terms public expenditure on agriculture as a proportion of GDP declined from 2.37 per cent in 1980 to 1.16 per cent in 2012. In any case the fiscal space for the countries has not expanded since the early 1980s. In India, public spending on agriculture as a proportion of GDP is currently around 1 per cent whereas military spending is approximately 2 per cent of GDP.
In the East Asia and Pacific region also the share of agri-cultural spending in total GDP has declined over time from 1.98 per cent in 1980 to 1.16 per cent in 2012. One important differ-ence between EAP and the South Asian region is that education and social protection get relatively more attention as compared to the defence sector in the EAP region. With regard to Vietnam

Concluding Observations and Policy Recommendations 159
public spending on agriculture declined from 1.23 per cent of its GDP in 2000 to 2.08 per cent in 2010.
From an analysis of existing literature and data, findings from the field survey and FGDs it is evident that the state has to expand its activities to protect the interests of smallholders and to make agriculture more sustainable. Although there are many policies and programmes for the agriculture sector, they are not adequate for addressing the problems of food security and hun-ger. For instance, it clearly emerges from our analysis that farm incomes are negative for two of the four provinces in Vietnam and even non-farm incomes are meagre; there are similar findings in India as well. At the current juncture, when due to the ascend-ency of a neo-liberal macroeconomic policy regime, smallholders are being forced to compete in the global market and they are also facing the growing challenges of climate change, necessary protective mechanisms and policies have to be designed for their protection and sustenance.
Of course, the two countries that constitute our study are quite different from each other not only in terms of agro-climatic conditions but also in terms of the trajectory of agricultural poli-cies. However, there are significant similarities as well between the two, the most significant being the overwhelming presence of marginal and small farmers. In our survey in India, 271 small-holder households operated 330.92 hectares of land, which was divided into 366 plots. In the case of Vietnam, 280 smallholder households operated 180.18 hectares of land, divided into 728 plots. Clearly, this reveals that smallholder farmers in Vietnam operate relatively smaller plots of land than their Indian coun-terparts. With regard to public provisions in the two countries, awareness among smallholder farmers was relatively better in Vietnam although the gap between awareness and access is a point of concern in both countries. Regarding per capita, per day incomes of the households, the average figure for India was US$ 0.58 while her counterpart in Vietnam earned US$ 0.77.
It is striking to note that more than 88 per cent of the surveyed households earned less than US$ 1.25 per capita, per day (the World Bank norm for extreme poverty) while in the

160 Food Security for Small Farmers
case of Vietnam the relevant figure was 77 per cent. However, in two provinces in Vietnam and two states in India 94 per cent of the surveyed households were well below this cut-off level. In fact in Vietnam the average per capita, per day income (sum of farm and non-farm) was negative for Ha Giang and Cao Bang provinces.
With regard to the state of infrastructure the situation ap-peared to be better in Vietnam as compared to India. For instance, the status of household electrification on an average was much better in Vietnam as compared to India. The Indian story seems to be much more uneven compared to Vietnam. With respect to cooking fuel, in both the countries smallholder households de-pended on fire wood, crop residue etc. Except DakLak province, use of LPG was extremely low in all provinces in Vietnam; it was a similar case in India, except in Andhra Pradesh.
We could not get enough information on the food security situation in Vietnam to assess the situation for level and trends. In India the relevant findings suggest a picture of widespread distress. In fact as per our findings the average consumption of smallholder households was considerably lower in 2015 as com-pared to the relevant averages for the surveyed states reported by NSSO for 2011-12. For instance, in Andhra Pradesh, where rice is the staple diet 40 per cent of the total surveyed households had weekly per capita consumption of rice which was less than the rural average reported by NSS. We may also note that consump-tion of wheat in the surveyed villages was negligible. Further, in spite of high production of groundnuts in the state, 35 per cent of the surveyed smallholder households reported lower con-sumption of edible oil than the NSS rural average.
In Jharkhand, except for rice and pulses, for all other food items the average consumption was less than the average rural consumption of the state. In Odisha despite 60 per cent of the area in the state being under paddy cultivation, 90 per cent of the households in our survey consumed less than the rural average for the state. In Uttar Pradesh too 68 per cent of the surveyed households reported lower consumption of rice than the NSS rural average.
Concluding Observations and Policy Recommendations 161
5.2 Policy Challenges
Common policy challenges for governments in India and Vietnam
• It is very clear from the findings of our survey that informa-tion on policies related to support prices, subsidies, public procurement agencies, credit support, extension services and government’s support in case of natural calamities is not ad-equately available to smallholder farmers. Therefore, these policies need to be targeted much better to make them more effective. There is lack of awareness among smallholder farm-ers regarding available public provisions and their access to these gets seriously curtailed due to lack of institutional sup-port from policymakers.
• Levels and trends related to public expenditure on the agri-culture sector should be a matter of serious concern and due attention must be paid to it, in particular small and marginal holders need a major policy thrust.
• Smallholders are more exposed to poverty and malnutrition. Attention must be given not only to increasing their pur-chasing power, but also increasing their access to productive assets and improving the quality and productivity of land and labour through increasing investments in training, re-search, technologies and other related support services to achieve food and nutrition security.
• In general, there are serious gaps both in backward and forward linkages in the overall public policy infrastructure which must be addressed.
• The government should adopt short and long term national strategies for smallholders and should have equal participa-tion of all concerned stakeholders including smallholder organizations.
• The government should recognize individual and collective rights of the smallholders to organize democratically. In fact their participation in policy debates and implementation mechanisms must be strengthened.

162 Food Security for Small Farmers
Major policy challenges for the Government in Vietnam
• All the households surveyed (except those in Vinh Long province) were well below the international poverty line of US$ 1.25 per person, per day. This lower income has se-vere implications on food security. Thus, despite produc-ing food, small and marginal farmers are not food secure. There should be public provisions to address income poverty of smallholder farmers by strengthening the support price mechanism and taking other appropriate measures.
• Issues related to the use of firewood as cooking fuel are a serious concern in all the provinces. The government should promote the use of efficient cooking fuel and make people aware of the health issues related to it.
• Road and transport infrastructure is another significant area of concern because of which farmers have to sell their pro-duce to intermediaries. There is a need to invest in public transport so that the cost of transportation can be brought down which will also be reflected in the cost of cultivation.
• Issues related to sanitation and drinking water facilities are also matters of serious concern which need to be addressed accordingly.
Major policy challenges for the Government in India
• All surveyed households in the four states were well below the international poverty line of US$1.25 per person, per day. This obviously has severe implications for food security. Thus, despite contributing significantly to food produc-tion, small and marginal farmers are not food secure. There is a need to address income poverty of smallholder farmers through strengthening the support price mechanism and taking other appropriate measures. Of course, strengthening the public distribution system will go a long way in address-ing the problem of food insecurity.
• Most of the farmers sell their produce either in the local market or to middlemen which obviously implies that the

Concluding Observations and Policy Recommendations 163
system of public price support is ineffective. To make this mechanism effective there is an urgent need to strengthen public procurement agencies and improving their overall functioning. These public procurement agencies should particularly focus on smallholder farmers for procuring food grains. It was also found during the survey that in some cases where public procurement agencies procure food grains there is a delay in payments. This shortcoming should also be addressed by the government.
• Our survey also found that public irrigation sources are hardly available for smallholder farmers. There is a need to decrease farmers’ dependence on the monsoon. The govern-ment should invest in building required irrigation infrastruc-ture. In areas where only groundwater irrigation is feasible, proper electrification and adequate amount of electricity supply should be made available.
• Road and transport infrastructure is another significant area of concern. Because of poor road and transport infrastruc-ture farmers are forced to sell their produce to intermediar-ies. There is a need to invest more in public transport so that transportation costs can be brought down; this will also be reflected in the cost of cultivation.
• Most of the smallholder farmers rely on informal sources of lending. Despite numerous financial inclusion provisions of the government, formal sources of lending are not eas-ily accessible to smallholder farmers. Further, it is important to provide loans at concessional rates to farmers as recom-mended by several commissions. Good quality crop insur-ance schemes for smallholder farmers is another significant area where due attention is required.
• Smallholder farmers largely belong to socially deprived sec-tions of society. Obviously through better targeting of public policies the government can address their social, political and economic deprivation.
• The use of firewood as cooking fuel is alarmingly high in Jharkhand, Odisha and Uttar Pradesh. The government

164 Food Security for Small Farmers
should promote the use of efficient cooking fuel and make people aware of the health issues related to it.
• Many surveyed households used kerosene for lighting de-spite being electrified. There is a need to supply adequate electricity to villages which will reduce farmers’ dependence not only on kerosene (for cooking) but also on diesel pumps (for irrigation).
• Issues related to sanitation and drinking water facilities are also matters of serious concern which need to be addressed accordingly.

Bibliography
Acharya, Nilachala (2015), ‘Public Expenditure towards Agriculture Sector with specific reference to Smallholder Agriculture and Women Farmers in Uttar Pradesh-A Study’, A report prepared for Oxfam India, New Delhi, India (Unpublished).
Aguayo, V., G. Singh, and N. Badgaiyan (2014). ‘Scoring Child Nutrition in India; Measuring the Performance of States’, Economic and Political Weekly, 97-103.
Ahmad, M. and U. Farooq (2010). ‘The State of Food Security in Pakistan: Future Challenges and Coping Strategies’, The Pakistan Development Review, 903-923. Akram-Lodhi. (2005). ‘Vietnam’s Agriculture: Processes of Rich Peasant Accumulation and Mechanisms of Social Differentiation’, Journal of Agrarian Change 5(1): 73–116.
Akram-Lodhi and A. Haroon (2004). ‘Are ‘Landlords Taking Back the Land? An Essay on the Agrarian Transition in Vietnam’, European Journal of Development Research 16(4): 757–89.
Amin, S. (2012). ‘Contemporary Imperialism and the Agrarian Question. Agrarian South’, Journal of Political Economy, 11-26.
Anh, Vu Tuan and Nguyen Quang Thai (2011). Đầutưcông: thựctrạngvàtáicơcấu. Vietnam: Encyclopaedia Publishing House. Anwar, T., S.K. Qureshi, H. Ali, and M. Ahmad (2005). ‘Landlessness and Rural Poverty in Pakistan’, The Pakistan Development Review, 855-874.
APEC, USA (2011). ‘Promoting Sustainable, Market Based Microfinance: Vietnam Case Study and Lessons Learned from APEC economies’, Workshop on Microfinance Best Practices, Hanoi, Vietnam, 7-8 April.
Badiani, R., K.K. Jessoe, and S. Plant (2012). ‘Development and the Environment: The Implications of Agricultural Electricity Subsidies in India’, Journal of Environment & Development, 244-262.
Banik, A. (2003). ‘Evolution of Rural Informal Financial Institution in South Asia’, Savings and Development, 361-375.
166 Food Security for Small Farmers
Barker, R., C. Ringler, Nguyen Minh Tien, and M. Rosegrant (2002). ‘VN-4: Macro Policies and Investment Priorities for Irrigated Agriculture in Vietnam’, National Component Paper for the Project on ‘Irrigation Investment, Fiscal Policy, and Water Resource Allocation in Indonesia and Vietnam’, IFPRI Project No. 2635-000, Country Report, Vietnam, Vol.1, Asian Development Bank.
Bashir, Z. and A. Ahmad (2000). ‘The Role of Agricultural Growth in South Asian Countries and the Affordability of Food: An Inter-country Analysis’, The Pakistan Development Review, 751-767.
Bassi, N. (2015). ‘Irrigation and Energy Nexus; Solar Pumps Are Not Viable’, Economic and Political Weekly, 63-67.
Beresford, Melanie (1985). ‘Household and Collective in Vietnamese Agriculture’, Journal of Contemporary Asia 15(1): 5–36.
Beresford, Melanie (1993). ‘The Political Economy of Dismantling the Bureaucratic Centralism and Subsidy System in Vietnam’, in Southeast Asia in the 1990s: Authoritarianism, Democracy, and Capitalism (eds) K. Hewison, R. Robison, and G. Rodan. Sydney, Australia: Allen & Unwin, pp.2Bhaduri, A. (1973). ‘A Study in Agricultural Backwardness Under Semi-Feudalism’, The Economic Journal, 120-137.
Bioversity. (2012). “CGIAR Consortium, FAO, IFAD, IFPRI, IICA, OECD, UNCTAD, Coordination team of UN High Level Task Force on the Food Security Crisis”, WFP, World Bank and WTO.
Brzeska, J. and S. Fan (2009). ‘Agricultural Public Expenditure Reviews: A Synthesis of Six Country Cases and Two CrossCountry Studies’, Mimeo.
Byerlee, D., A. D. Janvry, and E. Sadou (2009). ‘Agriculture for Development: Toward a New Paradigm’, Annual Review of Resource Economics, 15-18.
CDHS. (2010). ‘Cambodia Demographic and Health Survey 2010, Measure DHS ICF’, Maryland, USA: Macro Calverton.
Chand, Ramesh, Prasanna, P. Lakshmi, and Aurna Singh (2011). ‘Farm Size and Productivity: Understanding the Strengths of Smallholders and Improving Their Livelihoods’, Economic and Political Weekly XLVI (26 & 27).Chandrasekhar, C. P. (2013). ‘Not a Benign Market: An Analysis of Food Price Inflation and Volatility’, Agrarian South: Journal of Political Economy, 121-159.

Concluding Observations and Policy Recommendations 167
Chandrasekhar, C. P. and J. Ghosh (2002). The Market that Failed, A Decade of Neoliberal Economic Reforms in India. New Delhi: Leftword Books.
Christiansen, L., L. Demery, and J. Kuhl (2011). ‘The (evolving) role of agriculture in poverty reduction – An empirical perspective’, Journal of Development Economics 96: 239–254.
Childress, Malcolm (2004). Regional Study on Land Administration, Land Markets, and Collateralized Lending, Rural Development and Natural Resources, East Asia Region. Washington, DC: The World Bank.
Clinton, H. R. (2009). ‘World Without Hunger: A New Approach to Global Food Security’, The Times of India, 17 November.
Collier, Paul (2008). ‘The Politics of Hunger-How Illusion and Greed Fan the Food Crisis’, Foreign Affairs (November/December). Deaton, Angus (1991).’Saving and Liquidity Constraints’, Econometrica 59 (5): 1221-1248.
Deokar, B. K. and S.L. Shetty (2014). ‘Growth in Indian Agriculture; Responding to Policy Initiatives since 2004-05’, Economic and Political Weekly, 101-105.
Deokar, B. K., S.J. Pandey, and N.R. Lokhande (2013). ‘Trends in Agricultural Production’, Economic and Political Weekly, 83-85. Dev, S. M. (2012). A note on Trends in Public Investment in India. Mumbai: Indira Gandhi Institute of Development Research. Dev, S. M. and N.C. Rao (2010). ‘Agricultural Price Policy, Farm Profitability and Food Security’, Economic and Political Weekly, 174-182.
Dhawan, B.D. and S.S. Yadav (1997). ‘Public Investment in Indian Agriculture: Trends and Determinants’, Economic and Political Weekly 32 (14): 710-714.
ESAP. (2009). ‘International Assessment of Agricultural Knowledge’, Science and Technology for Development; Volume II East & South Asia & the Pacific.Faber, Mieke and Friede Wenhold (2007). ‘Nutrition in contemporary South Africa’, African Journals Online 33 (3): 393-400.
Fan, Shenggen and N. Rao (2003). ‘Public Spending in Developing Countries: Trends, Determination and Impact”, International Food Policy Research Institute (IFPRI) discussion paper No. 99.

168 Food Security for Small Farmers
Fan, Shenggen, Pham Lan Huong, and Trinh Quang Long (2004). ‘Government Spending and Poverty Reduction in Vietnam’, Draft Report Prepared for the World Bank Funded Project ‘Pro-Poor Spending in Vietnam’, by the International Food Policy Research Institute, Washington DC and the Central Institute for Economic Management, Hanoi.
Fan, S., X. Zhang, and N. Rao (2004). ‘Public expenditure, growth and poverty reduction in rural Uganda’, Development Strategy and Governance Division Discussion Paper 4. Washington, DC: International Food Policy Research Institute.
Fan, Shenggen, B. Yu and A. Saurkar (2008). ‘Public Spending in Developing Countries: Trends, Determination and Impact’, in Fan Shenggen (ed.), Public Expenditures, Growth, and Poverty: Lessons from Developing Countries. Johns Hopkins University Press.
Fan, Shenggen, Tewodaj Mogues, and Sam Beni (2009), ‘Setting Priorities for Public Spending for Agricultural and Rural Development in Africa’, IFPRI Policy Brief No.12.
FAO. (1997). Agriculture food and nutrition for Africa. A resource book for teachers of agriculture. Rome: The United Nations.
FAO. (2001). Farming Systems and Poverty Improving Farmers’ Livelihood in a Changing World. Rome and Washington, DC: Food and Agriculture Organization.
FAO. (2002). Small holder farmers in India: Food security and agricul-tural policy. Bangkok: Food and Agriculture Organization.
FAO. (2010). Assessment of Food Security and Nutrition Situation in Nepal. Nepal: Food and Agricultural Organization of the United Nations.
FAO. (2011). Food security and nutrition status in Thailand 2005-2011. Food and Agricultural Organization of the United Nations.
FAO. (2011). Towards a Food Secure Bangladesh: Country Programming Framework 2010‐2015. Dhaka: Food and Agriculture Organization. FAO. (2011). Bhutan and FAO: Achievements and Success Stories. Rome: Food and Agriculture Organization.
FAO. (2011). Maldives and FAO: Achievements and Success Stories. Rome: Food and Agriculture Organization.
FAO. (2011). The State of Food and Agriculture-Investing in agriculture. Rome: FAO

Concluding Observations and Policy Recommendations 169
FAO. (2011). Country Profiles. Available at-https://www.cia.gov/library/publications/the-world-factbook. FAO. (2011). ‘Vietnam and FAO Achievement and Success stories’, FAO Representation in Vietnam, May 2011.
FAO. (2011). Save and Grow-A policymaker’s guide to the sustainable intensification of smallholder crop production. Rome: The United Nations.
FAO. (2014). FAOSTAT statistical database. Available at: faostat.fao.org.
FAO. (2014). The State of Food and Agriculture: Innovation in Family Farming. Rome: Food and Agriculture Organization.
FAO. (2015). Regional Overview of Food Insecurity Asia and the Pacific. Bangkok: Food and Agriculture Organization.
FAO. (2015). The State of Food and Agriculture; Social protection and Agriculture: breaking the cycle of rural poverty. Rome: Food and Agriculture Organization of the United Nations.
FCI. (2015). Report of the High Level Committee on Reorienting the Role and Restructuring of Food Corporation of India. India: The Food Corporation of India.
Fei, J.C. and G. Ranis (1961). ‘A Theory of Economic Development’, American Economic Review, 514: 533-565. George, P. S. (1994). ‘Food Security in South Asia: Performance and Prospects’, Economic and Political Weekly, 1092-1094.
Ghosh, M. (2010). ‘Spatial Price Linkages in Regional Food Grain Markets in India’, The Journal of Applied Economic Research, 495–516.
Ghosh, A. and S. K. Dey (2014). ‘How Efficiently is Chemical Fertilizer Used in Indian Agriculture?’ Agrarian South: Journal of Political Economy, 403–426.
Godfray, H.C.J., I.R. Crute, L. Haddad, D. Lawrence, J.F. Muir, N. Nisbett, J. Pretty, S. Robinson, C. Toulmin, and R. Whiteley (2010). ‘The future of the global food system’, Philosophical Transactions of the Royal Society, B: Biological Sciences 365: 2769-2777. Government of India (2012). ‘National Water Policy, 2010, Ministry of Water Resources’, available at: http://wrmin.nic.in/writereaddata/NationalWaterPolicy/NWP2012Eng6495132651.pdf.

170 Food Security for Small Farmers
GSO. (2011). The Enterprises in Viet Nam 9 years at the beginning of century. Hanoi, Vietnam: General Statistical Office.
GSO. (2012). Statistical data. Available at: http://www.gso.gov.vn.
Harris, D.N. (2006). ‘Water management in public irrigation schemes in Vietnam’, Australian Centre for International Agricultural Research (ACIAR), Canberra, November.
Harriss-White, B. (2012). ‘Capitalism and the Common Man: Peasants and Petty Production in Africa and South Asia’, Agrarian South: Journal of Political Economy, 109-160.
Hayami, Y. and V. Ruttan (1971). Agricultural Development: An International Perspective. Baltimore, Maryland, USA: Johns Hopkins Press.
High Level Panel of Experts on Food Security and Nutrition (HLPE). (2013). Committee on Food Security, June.
Himanshu (2012). ‘How Lives Change: Six Decades in a North Indian Village,’ Paper presented at an international conference on ‘Understanding Change in Rural India: Perspectives from Longitudinal Village Studies’, 19-20 November, Jawaharlal Nehru University, New Delhi.
Hugh, Rockoff (2008). ‘Great Fortunes of the Gilded Age’, NBER Working Papers 14555, National Bureau of Economic Research, Inc.
Hutterer, K. L. (1983). ‘The Natural and Cultural History of Southeast Asian Agriculture: Ecological and Evolutionary Consideration’, Anthropos, 169-212.
IFAD and UNEP. (2013). ‘Smallholders, food security, and the en-vironment’, available at: http://www.ifad.org/climate/resources/smallholders_report.pdf.
IFAD. (2011). Annual Report. Rome: The International Fund for Agricultural Development (IFAD).
IFPRI. (2014). Global nutrition report 2014: Actions and accountability to accelerate the world’s progress on nutrition. Washington, DC: International Food Policy Research Institute (IFPRI).
IFPRI. (2014). ‘2014 Global hunger index: The challenge of hidden hunger’, available at: https://www.ifpri.org/publication/2014-global-hunger-index.
Concluding Observations and Policy Recommendations 171
IFPRI. (2014-15). Global Food Policy Report. Washington, DC: IFPRI. Available at: http://dx.doi.org/10.7910/DVN/INZ3QK.
Irz, Xavier, Lin Lin, Colin Thirtle, and Steve Wiggins (2001). ‘Agricultural Productivity Growth and Poverty Alleviation’, Development Policy Review 19(4): 449-466.
Jeromi, P. D. (2007). ‘Farmers’ Indebtedness and Suicides Impact of Agricultural Trade Liberalisation in Kerala’, Economic and Political Weekly, 4 August.
Jha, P. (2007). ‘Some Aspects of the Well-Being of India’s Agricultural Labour in the Context of Contemporary Agrarian Crisis’, available at:www.macroscan.org.
Jha, Praveen (2009), ‘Agriculture and Rural Infrastructure’, Block-II, reading material for the Economics Department, MPhil Programme in Agricultural Economics. New Delhi: IGNOU.
Jha, P. and M. Negre (2007). ‘Indian Economy in the Era of Contemporary Globalisation: Some Core Elements of the Balance Sheet’, available at: www.macroscan.org.
Jha, P. and N. Acharya (2011). ‘Expenditure on the Rural Economy in India’s Budgets since the 1950s: An Assessment’, Review of Agrarian Studies, 134-156. Joshi, P. C. (1970). ‘Land Reform in India and Pakistan’, Economic and Political Weekly, A145-A152.
Joshi, P. K. (1997). ‘Farmer’s investments and government interven-tion in salt- affected and waterlogged soils’, in J. M. Kerr, D. K. Marothia, K. Singh, C. Ramasamy, and W. R. Bentley (eds), Natural Resources Economics: Concepts and Application to India. New Delhi: Oxford and IBH.
Joshi, P. K. (2012). ‘Greening Agriculture in South Asia’, IFPRI Blog.
Joshi, P. K., A. Gulati, P.S. Birthal, and L. Tewari (2004). ‘Agriculture Diversification in South Asia Patterns, Determinants and Policy Implications’, Economic and Political Weekly, 2457-2467. Kannan, K. P. (2000). ‘Food Security in a Regional Perspective; A View from “Food Deficit” Kerala, W.P. 304 July.
Kannan, K. P. and G. Raveendran (2012). ‘Counting and Profiling the Missing Labour Force’, Economic and Political Weekly, 77-80. Kerkvliet, Benedict and J. Tria (1995). ‘Village-State Relations in Viet Nam: The Effect of Everyday Politics on De-collectivization’, Journal of Asian Studies 54(2): 396–418.

172 Food Security for Small Farmers
Kerkvliet, Benedict and J. Tria (2006). ‘Agricultural Land in Vietnam: Markets Tempered by Family, Community, and Socialist Practices’, Journal of Agrarian Change 6(3): 285–305. Kerkvliet, Benedict, J. Tria, and Mark Selden (1998). ‘Agrarian Transformation in China and Vietnam’, China Journal 40: 37–58.
Kishore, R. (2013). ‘Food grain Management Policy, FCI and Implications for Food Security’, RIS Policy Brief.
Kumar, A. K. (2007). ‘Why Are Levels of Child Malnutrition Not Improving?’ Economic and Political Weekly, 1337-1345.
Kurosaki, T. and K. Wada (2015). ‘Spatial Characteristics of Long-Term Changes in Indian Agricultural Production: District-Level Analysis, 1965-2007’, Review of Agrarian Studies, 1-38.
Kuznets, S. (1973). ‘Modern Economic Growth: Findings and Reflections’, The American Economic Review, 247-258.
Lewis, W. Arthur (1954). Economic Development with Unlimited Supplies of Labour. Manchester School of Economics.
Lipton, Michal (2005). The Family Farm in a Globalizing World: The Role of Crop Science in Alleviating Poverty. Washington, DC: International Food Policy Research Institute (IFPRI).
Mackie, A. B. (1964). ‘The Role of Agriculture in Economic Growth and Development’, Illinois Agricultural Economics, 1-10.
MARD. (2004). Agriculture expenditure review. Vietnam: Department of Finance.
MARD. (2009a). ‘Agriculture investment trends – the role of public and private sector in Vietnam’, available at: http://www.fao.org/fileadmin/templates/tci/pdf/CorporatePrivateSector/Vietnam_-_Private_Sector_Investments_in_Agriculture__Final_Report.pdf.
MARD. (2009b). Decision 2194/QĐ-TTg on the approval of seed and seedling project for plantation, forestry, livestock, and fishery towards 2020.
MARD. (2012). ‘Proposal on restructuring agricultural sector towards greater added value and sustainable development’, available at: http://www.isgmard.org.vn/.
Marsh, S. P., T.G. MacAulay, and P.V. Hung (2007). ‘Agricultural Development and land Policy in Vietnam’, Policy Briefs, Australian Centre for International Agricultural Research.
Concluding Observations and Policy Recommendations 173
Mathur, A. S., S. Das, and S. Sircar (2006). ‘Status of Agriculture in India: Trends and Prospects’, Economic and Political Weekly, 5327-5336.
Ministry of Economy, I. R. (2012). Poverty and Food Security in Afghanistan. Ministry of Economy, Islamic Republic of Afghanistan.
MoE Afghanistan (2012). Poverty and Food Security in Afghanistan: Analysis based on the National Risk and Vulnerability Assessment of 2007/08. Ministry of Economy, Islamic Republic of Afghanistan and the World Bank.
Mohanty B. B. (2009). ‘Regional Disparity in Agricultural Development of Maharashtra’, Economic and Political Weekly, 44 (6).
Mohanty, B. B. (2012). ‘Regional Disparity in Agricultural Development of Maharashtra’, Economic and Political Weekly, 63-69.
Moyo, S., P. Jha, and Y. Yeros (2015). ‘The Agrarian Question in 21st Century’, Economic and Political Weekly, 35-41.
MSSRF. (2008). Report of State of Food insecurity in Rural India. Chennai: The M S Swaminathan Research Foundation. Mullen, E. J., A. Shlonsky, S.E. Bledsoe, and J.L. Bellamy (2005). ‘From concept to implementation: Challenges facing evidence-based social work. Evidence &Po/ici’, A Journal of Research, Debate and Practice, 1(1): 61-84.
Murphy, Sophia (2012). Changing Perspectives: Small-scale farmers, markets and globalization. London: International Institute for Environment and Development (IIED); The Hague: Hivos.
Nagaraj, K. (2008). ‘Farmers’ Suicides in India: Magnitudes, Trends and Spatial Patterns’, Research Report, Madras Institute of Development Studies, Chennai.
Nagpal, S. (1999). ‘Food Security in Hindukush Himalaya’, Economic and Political Weekly, 2717-2720.
Ngo, Vinh Long (1993). ‘Reform and Rural Development: Impact on Class, Sectoral, and Regional Inequalities’, in William Turley and Mark Selden (eds), Reinventing Vietnamese Socialism: Doi Moi in Comparative Perspective. Boulder, CO: Westview Press, pp. 165–207.

174 Food Security for Small Farmers
Nguyen Hang, T. (2013). ‘Fertilizers Manufacturing in Vietnam’, VietinBankSc Report. Available at: https://www.google.co.in/?gws_rd=cr#q=Fertilizers+Manufacturing+n+Vietnam.
Nguyen, Hao and Ulrike Grote (2004). ‘Agricultural policies in Vietnam’, MTID Discussion Papers 79, International Food Policy Research Institute (IFPRI).
Nguyen, T.D.N. (2012). Private Sector Investment in Vietnam: Agriculture Investment Trends- The role of Public and Private Sector in Vietnam. Hanoi: Agriculture University.
National Sample Survey (2003) (59th Round) - Schedule 1.0 - Consumer Expenditure.
NSSO (2013). Key Indicators of Situation of Agricultural Households in India. National Sample Survey Office, Ministry of Statistics & Programme Implementation, Government of India.
NSSO. (2014). Key Indicators of Situation of Agricultural Households in India, NSS 70th Round. New Delhi: Ministry of Statistics and Programme Implementation.
NSS. (2011-12). Key Indicators of Household Consumer Expenditure in India, 2011-12. National Sample Survey Office, Ministry of Statistics & Programme Implementation, Government of India (June 2013).
Osmani, G. A. and E. Hossain (2015). ‘Market participation deci-sions of small holder farmers and its determinants in Bangladesh’, Economics of Agriculture, 163-179.
Pandey, P. R. (2003). ‘Agreement on Agriculture: Issues of Market Access for South Asian Countries’, South Asia Economic Journal, 19-40.
Patnaik, P. (2012). ‘The Peasant Question and Contemporary Capitalism: Some Reflections with Reference to India’, Agrarian South: The Journal of Political Economy, 27-42. Patnaik, P. (2014). ‘Imperialism and the Agrarian Question’, Agrarian South: Journal of Political Economy, 1-15.
Patnaik, U. (1997). ‘Political Economy of State Intervention in Food Economy’, Economic and Political Weekly, 1105-1112. Patnaik, U. (2012). ‘Some Aspects of Contemporary Agrarian Question’, Agrarian South: The Journal of Political Economy, 233–254.

Concluding Observations and Policy Recommendations 175
Petersson, A., L. Nanayakkara, R.H. Kumarasiri, and R. Liyanapathirana (2011). Food Security in the Northern, Eastern and North Central Provinces. A Food Security Assessment Report. Sri Lanka: Food and Agriculture Organization.
Ramakumar, R. (2013). ‘India’s Agricultural Debt Waiver Scheme, 2008’, Review of Agrarian Studies, 135-146.
Ramakumar, R. and P. Chavan (2007). ‘Revival of Agricultural Credit in the 2000s: An Explanation’, Economic and Political Weekly, 57-63.
Ramphul. (2011). ‘WTO Agreement on Agriculture and South Asia’s Farm Trade’,. South Asian Survey, 27-62.
Rawal, Vikas (2008). ‘Ownership Holdings of Land in Rural India: Putting the Record Straight’, Economic and Political Weekly 43 (10).
RBI. (2015). Handbook of Statistics on Indian Economy. Mumbai: The Reserve Bank of India. Reddy, V. Ratna and P. Prudhvikar Redd (2007). ‘Increasing Costs in Agriculture: Agrarian Crisis and Rural Labour in India’, The Indian Journal of Labour Economics 50 (2): 273-292.
Schultz, T.W. (1964). Transforming Traditional Agriculture. New Haven, CT: Yale University Press.
Selden, Mark (1993). ‘Agrarian Development Strategies in China and Vietnam’, in Reinventing Vietnamese Socialism: DoiMoi in Comparative Perspective, (eds) William Turley and Mark Selden. Boulder, CO: Westview Press, pp. 2Shang, X. (2015). ‘What can agricultural research, extension, and input markets do for small-scale farmers in South Asia?’ IFPRI blog.
Shaw, D. J. (2007). World Food Security, A History since 1945. New York: Palgrave Macmillan. Simon, G.A. (2012). Food Security: Definition, Four Dimensions, History. University of Roma Tre, Faculty of Economics.
Singh, S. (2012). ‘Role of FDI in Multi-brand Retail Trade in India’, Review of Market Integration, 283–308.
Singh, S. and N. Singla (2011). Fresh Food Supermarkets in India: An Analysis of their Inclusiveness and Impact on Primary Producers. Association of Asia Scholars, 65-91.

176 Food Security for Small Farmers
Socialist Republic of Vietnam, Country Report (2015). 15 years achieving the Vietnam Millennium Development Goals. Available at: Available at: http://www.vn.undp.org/content/dam/vietnam/docs/Publications/Bao%20cao%20TIENG%20ANH%20-%20MDG%202015_trinh%20TTCP.pdf.
Svedberg, P. (2010). ‘Estimates of Child Malnutrition in India’, Economic and Political Weekly, 14-18.
Swaminathan, M. (2002). ‘Excluding the Needy: The Public Provisioning of Food in India’, Social Scientist, 34-58.
Swaminathan, M. (2012). ‘Who Has Access to Formal Credit in Rural India? Evidence from Four Villages’, Review of Agrarian Studies, 182-195.
Swinnen, J.F.M. (2010). ‘The political economy of agricultural and food policies: Recent contributions, new insights, and areas for further research’, Applied Economic Perspectives and Policy, 32: 33-58.
Talat, Anwar, Sarfraz K. Qureshi, Hammad Ali, and Munir Ahmad (2004). ‘Landlessness and Rural Poverty in Pakistan’, The Pakistan Development Review, 43 (4).
Talukder, R. K. (2005). ‘Food Security, Self-sufficiency and Nutrition Gap in Bangladesh’, The Bangladesh Development Studies, 35-62.
Thapa, G. and R. Gaiha (2011). Smallholder Farming in Asia and the Pacific: Challenges and Opportunities. Rome: International Fund for Agricultural Development.
The World Bank (2005). Vietnam Development Report 2006: Business. Hanoi: The World Bank.
The World Bank (2008). World Development Report- Agriculture for Development. Washington, DC: The World Bank.
The World Bank. (2014). World Development Indicators. Washington, DC: International Bank for Reconstruction and Development.
The World Bank (2015). ‘Povcalnet’, Online analysis tool for global poverty monitoring, available at: http://iresearch.worldbank.org/PovcalNet/index.htm.
The World Bank (2015). ‘The State of Social Safety Nets 2015’, International Bank for Reconstruction and Development / The World Bank.

Concluding Observations and Policy Recommendations 177
Thirtle C., J. Piesse, and L. Lin (2003). ‘The Impact of Research Led Productivity Growth on Poverty in Africa, Asia and Latin America’, World Development, 31 (12): 1959-1975.
UNICEF. (2009). The State of the World’s Children; Special Edition. New York: United Nations Children’s Fund (UNICEF)
Vaddiraju, A. K. (2013). ‘Irrigation and Agrarian Change in India’, Agrarian South: Journal of Political Economy, 213–239.
Venkatesh, Athreya (2013). ‘The Current Agrarian Crisis in India: An Overview’, The Marxist, XXIX (3).
Viet Nam Briefing (2014). ‘Foreign Investment needed for Infrastructure and Agricultural Projects in Vietnam’, 9 May. Available at: http://www.vietnam-briefing.com/news/us60-billion-foreign-investment-needed-infrastructure-agriculture-projects-vietnam.html/.
Wiggins, S. (2011). Supporting small-scale farming: Messages for the G20. Burwood East, VIC, Australia: World Vision Australia.
Wiggins, Steve, Johan Kirsten, and Luis Lambi (2010). ‘The future of small farms’, World Development 38 (10): 1341-1348.
