food properties of hull, dehulled and whole seed … examined under different neutral salt...
TRANSCRIPT
© 2013 E.I. Adeyeye, A.A. Olaleye & A.J. Adesina. This is a research/review paper, distributed under the terms of the Creative Commons Attribution-Noncommercial 3.0 Unported License http://creativecommons.org/licenses/by-nc/3.0/), permitting all non commercial use, distribution, and reproduction in any medium, provided the original work is properly cited.
Global Journal of Science Frontier Research Chemistry Volume 13 Issue 2 Version 1.0 Year 2013 Type : Double Blind Peer Reviewed International Research Journal Publisher: Global Journals Inc. (USA) Online ISSN: 2249-4626 & Print ISSN: 0975-5896
Food Properties of Hull, Dehulled and Whole Seed Samples of Bambara Groundnut (Vigna Subterranea L. Verdc)
By E.I. Adeyeye, A.A. Olaleye & A.J. Adesina Ekiti State University
Abstract - The functional properties of the testa, dehulled and whole seed samples of Vigna subterranea were examined under different neutral salt concentrations. Parameters examined for were: foaming capacity (FC), foaming stability (FS), water absorption capacity (WAC), emulsion capacity (EC), lowest gelation concentration (LGC) and protein solubility (PS). Results showed that the highest FC was recorded for NaCl at 0.5 % salt concentration, the lowest FC was recorded for Na2SO3 at 10 % salt concentration. Most of the present values of FS were lower than those reported for some legumes in literature. WAC values ranged between 250- 400 % (testa), 140-240 % (dehulled) and 100-240 % (whole seeds) in the various salt solutions; high WAC values could make the samples useful replacement in various food formulations such as baked goods and custards. The EC results showed that EC depended on salts concentrations and the type of salts under consideration. LGC results were in the range of 2.0-8.0 % which were mostly lower or within the range of most literature values for leguminous seeds.
Keywords : functional properties, bambara groundnut seed anatomical parts.
GJSFR-B Classification : FOR Code: 259999p
Strictly as per the compliance and regulations of
:
Food Properties of Hull, Dehulled and Whole Seed Samples of Bambara Groundnut Vigna Subterranea L. Verdc

Food Properties of Hull, Dehulled and Whole Seed Samples of Bambara Groundnut (Vigna
Subterranea L. Verdc)
Keywords : functional properties, bambara groundnut seed anatomical parts.
I. Introduction
ambara groundnut (Vigna subterranea L. Verdc) is a seed crop of African origin. It is cultivated principally by farmers as a famine culture crop
because of its agronomic values and the ability to produce in soils considered insufficiently fertile for cultivation of other more favoured species such as common beans and groundnuts (Anchirinahet al., 2001). It is very adaptable to hot temperatures but it is also tolerant to rainfall (Wrigley, 1981). Bambara seeds may be consumed in various forms for food. Fresh seeds may be consumed raw, boiled, grilled or dry seeds made into a powdery form to make cakes (Adebowale and Lawal, 2002).
The nutritional potentials of bambara groundnut were documented. The seed is regarded as a balanced
food because when compared to most food legumes, it is rich in iron and the protein contains high lysine and methionine (Adu-Dapaah and Sangwan, 2004). In addition, it is known to contain 63% carbohydrates, 18% oil and the fatty acid content is predominmatly linoleic, palmitic and linolenic acids (Minka and Bruneteau, 2000). It was reported also that it is richer than groundnut in essential amino acids such as leucine, isoleucine, lysine, methionine, phenylalanine, threonine and valine (Ihekoronye and Ngoddy, 1985).
Soils of medium or low fertility, with a pH of 5.0 – 6.5 will produce satisfactory crops. Yields of bambara groundnut on low – fertility soils are generally higher than those of groundnut grown on similar soils. Bambara groundnut will often yield well in environments that may be too hostile for more favoured legumes (Collinsonet al., 1996).
Recently, Pasquetet al. (1999), using isozyme analysis, found high genetic identities between wild and domesticated bambara groundnut accessions and concluded that the wild bambara is the progenitor of the domesticated form, both being characterized by low total genetic diversity.
An evenly distributed rainfall in the range 600-1000mm encourages optimum growth but satisfactory yield can be obtained in areas with pronounced dry season since the crop is relatively drought resistant. It is tolerant to periods of heavy rainfall except during the flowering period.
It has been scientifically declared that bambara bean is high in protein quotient, particularly in methionine which makes its protein more complete than any other bean. The proximate composition of the bambara groundnut was reported to be 9.7% moisture, 16.6% protein, 5.9 % fat, 2.9% ash, 4.9% crude fibre and 64.9% carbohydrate (Enwere and Hung, 1996).
The high concentration of soluble fibre than any other bean also makes it one step ahead of other beans. This further enhances its quality as nutritious food which reduces the incidence of heart disease and certain types of cancer. Also, bambara beans being nitrogen fixers themselves and along with providing the soil with essential nutrients do not require any artificial
B
9
Globa
lJo
urna
lof
Scienc
eFr
ontie
rResea
rch
V
olum
eXIII
XII
Issue
e
rsion
IV
IIYea
r
2 013
© 2013 Global Journals Inc. (US)
B)
)
fertilizer. The use of artificial flavours or preservatives during the food processing is greatly discarded.
E.I. Adeyeye α, A.A. Olaleye σ & A.J. Adesina ρ
Author α σ ρ : Department of Chemistry, Ekiti State University, PMB 5363, Ado-Ekiti, Nigeria. E-mail : [email protected]
Abstract - The functional properties of the testa, dehulled and whole seed samples of Vigna subterranea were examined under different neutral salt concentrations. Parameters examined for were: foaming capacity (FC), foaming stability (FS), water absorption capacity (WAC), emulsion capacity (EC), lowest gelation concentration (LGC) and protein solubility (PS). Results showed that the highest FC was recorded for NaCl at 0.5 % salt concentration, the lowest FC was recorded for Na2SO3 at 10 % salt concentration. Most of the present values of FS were lower than those reported for some legumes in literature. WAC values ranged between 250-400 % (testa), 140-240 % (dehulled) and 100-240 % (whole seeds) in the various salt solutions; high WAC values could make the samples useful replacement in various food formulations such as baked goods and custards. The EC results showed that EC depended on salts concentrations and the type of salts under consideration. LGC results were in the range of 2.0-8.0 % which were mostly lower or within the range of most literature values for leguminous seeds. For the five salts used in the analysis (NaCl, Na2CO3, Na2SO3, NaNO3
and CH3COONa), the proteins in the samples were more soluble in the basic region of pH. The PS figures mostly showed two distinct peaks meaning that the bambara groundnut samples might be having two major proteins.
(Arachis hypogaea)
Bambara groundnut was reported to have been fairly well supplied with calcium and iron although poor in phosphorus. It contains thiamine, riboflavin, niacin and carotene but very low
in ascorbic acid (Oyenuga, 1968).
Several other reports have been made on bambara nut. The swelling capacity increases with increase in temperature (Adebowaleet al., 2002). Bambara bean is higher in water absorption capacity than that of great Northern bean (Sathe and Salunkhe, 1981).
The water absorption capacity (WAC) of bambara groundnut flour was higher than that of starch (Piyarat, 2008). This result shows that the flour is more hydrophilic due to a higher protein and carbohydrate contents. Also, the higher oil absorption capacity (OAC) in flour could be due to its higher protein and fat contents which can entrap more oil.
The objectives of this research work therefore are to: find out the functional properties of bambara groundnut, reveal the food
properties of the samples and hence, their industrial applications in the food industry and provide useful information that can further suggest the consideration of bambara groundnut as an alternative source of nutrients, especially for populations of the
developing countries such as Nigeria.
II.
Resources and Techniques
a)
Sample collection and preparation
The sample (bambara groundnut) was obtained from the Department of Plant Science, Ekiti State University, Ado-Ekiti. The seeds were screened to eliminate the defective ones, washed and rinsed with distilled water. The seeds were divided into two parts. One
part was soaked with distilled water overnight while the other part was dried without soaking. The soaked ones were removed after 24 h and were manually dehulled. Both the cotyledon and the testa were dried in an oven at 45 oC. All the three samples (whole seed, cotyledon and testa) were dry milled separately to fine powder and stored in a dry, cool place prior to use. The three samples were used for various analyses as described below.
b)
Preparation of salt solutions
Biuret solution was prepared by weighing (30g of NaOH dissolved in 300 ml of distilled water) + (1.5g CuSO4.4H2O+6.0g potassium sodium tertarate dissolved in 500ml distilled water) and made up to 1dm3
with distilled water.
c)
Determination of foaming capacity and stability
1g of the sample was whipped with 50ml of distilled water for 5 min in a blender at speed set at “max” and was transferred into a 100ml graduated cylinder. Total volume at time interval of 0.0, 0.05, 0.1, 0.2, 0.3 and 1.0 hour was noted to study the foaming stability. Volume increase (%) was calculated according to the equation of Coffman and Garcia (1977) to obtain the foaming capacity.
d)
Determination of emulsion activity
2g of the sample, 20ml distilled water, 20ml executive chef vegetable oil was prepared in a
calibrated centrifuge tube. The emulsion was centrifuged for 5 minutes. The ratio of the height of the emulsion layer to the total height of the mixture was calculated as the emulsion activity expressed in percentage (Inklaar and Fortuin, 1969).
e)
Determination of water and oil absorption capacity
The water and oil absorption capacity of the sample was determined as described by Beuchat (1977). 10cm3 of water or salt solution was added to 1.0g sample in a centrifuge tube. The suspension was mixed vigorously
using vortex mixer. This was then centrifuged for 25 min and the volume of the supernatant left after centrifuging was noted. Water bound was calculated from the difference in volume of the initial volume of the solvent used and the final volume after centrifuging. The same procedure was used for oil absorption capacity (Inklaar and Fortuin, 1969).
f)
Determination of least gelation concentration
Appropriate sample suspensions of 2, 4, 6, 8, 10, 12, 14, 16% were prepared in 5ml of distilled water. The test tubes containing these suspensions were heated for 1 hour in boiling water followed by rapid cooling under running tap water. The test tubes were then cooled for 2 hours at 40C. The least gelation concentration was determined as concentration when the sample from the inverted test tube did not fall down or slip (Coffman and Garcia, 1977).
g)
Protein solubility determination
The protein solubilities of the samples at different salts concentration were studied using the Biuret method (Wiechselboven, 1946).
0.5g
of the sample was suspended in 10ml of different salt concentrations. The solubility at natural pH was first determined, that is no acid or alkali was added and so solubility in the case was based on the normal pH of the sample in solution. The suspension
was centrifuged at room temperature for 30 min at 3,500
© 2013 Global Journals Inc. (US)
10
Globa
lJo
urna
lof
Scienc
eFr
ontie
rResea
rch
V
olum
eXIII
XII
Issue
e
rsion
IV
IIYea
r
2013
B)
)
rpm. The supernatant obtained was filtered and the protein of filtrate was determined by Biuret method with standard Bovine Serum Albumin (BSA) (Wiechselboven, 1946).
Food Properties of Hull, Dehulled and Whole Seed Samples of Bambara Groundnut (Vigna Subterranea L. Verdc)
0.5, 1, 2, 5 and 10% (w/v) concentrations of various salts used were prepared by weighing 0.5, 1, 2, 5 and 10g of salts (NaC1, Na2CO3, NaNO3 CH3COONa and Na2SO3) which are respectively added to 99.5, 99, 98, 95 and 90 ml of distilled water for each solution to make up to 100g.

The Biuret method is a convenient assay for large number of samples of relatively soluble proteins. Kjeldahl method is not a rapid and convenient assay although useful for the determination of the amount of protein in crude mixtures.
For the determination of standard protein using Biuret
method, 1g of BSA was dissolved in 100ml distilled water in a volumetric flask. Five tubes were set up containing fractions of the BSA solution in the order: 0.0ml, 0.5ml, 1.0ml, 1.5ml, 2.0ml and they were made up to 2ml by adding 2.0ml, 1.5ml, 1.0ml, 0.5ml and 0.0ml of distilled water. The tubes were left to stand for 30 min. The solution from the tube containing 2.0ml distilled water and 8.0ml Biuret solution was used as the blank to standardize the UV spectrophotometer at 450nm. The absorbance of each of the other tubes was also taken. A standard curve was drawn for absorbance against concentration.
The determination of protein of the filtered supernatant in each sample was carried out as follows: 1.0ml of filtrate was pipetted into a test tube and 8ml of Biuret solution was added. The tube was left to stand for 30 min after which the absorbance was taken. The corresponding protein concentration was obtained. The obtained protein concentrations for the various salts were plotted (Oshodi and Ekperigin, 1989).
III.
Results and Discussion
a)
Foaming Capacity (FC)
Tables 1-3 present the foaming capacity (FC) of bambara groundnut: testa, dehulled and whole seeds under various salts and salt concentrations. The Tables revealed that foaming capacity depends on concentration and types of salts used. There was a decrease in the foaming capacity with increase in concentration of salt from 0.5 to 10%. The FC values in Table 1 showed that the FC was 9.0 cm3
(18.0%) at zero percent concentration (water only). The FC ranged from 2.0cm3
(4.0%)-7.0cm3
(14.0%) for NaCl, 2.0cm3
(4.0%) –
6.50cm3
(13.0%) for Na2CO3, 2.0cm3 (4.0%) –
4.0cm3
(8.0%) for NaNO3, 2.0cm3 (4.0%) –
5.0cm3 (10.0%) for CH3COONa and 2.0cm3 (4.0%) –
5.50cm3 (11.0%) for Na2SO3. Highest foaming capacity was reported for NaCl at 0.5% salt concentration whereas lowest foaming capacity was reported for NaCl at 5% and 10% salt concentrations, Na2CO3 at 10%, NaNO3 at 5%, CH3COONa at 10% and Na2SO3 at 5 and 10% salt concentrations in testa. In dehulled (Table 2), highest FC was recorded for Na2SO3 at 1.0% salt concentration and NaCl at 0.5% and the lowest for NaCl and Na2CO3
at 10% and CH3COONa at 2% and 10% salt concentrations. In Table3, for whole seeds, most of the FC values were fairly higher than those recorded for testa and dehulled samples. While the highest FC was recorded for NaCl at 0.5% salt concentration, the lowest FC was recorded for Na2SO3 at 10% salt concentration.
Fairly high variation in foaming capacity existed within the salt concentrations in all the samples as shown by the CV%. The values of foaming capacity in all the three samples were lower than the values earlier reported for hulled seed flours of African yam bean (AYB) (39.9-55.4%) and dehulled AYB seeds (21.3-48.4%) (Adeyeye and Aye, 1998). The low foaming capacities will reduce the functionality of bambara groundnut in its uses for the production of some foods where foaming is an important factor like cakes (Johnson et al.,
1979; Lee et al.,
1993).
b)
Foaming Stability (FS)
The foaming stability (FS) values for testa are presented in Tables 4 (NaCl), 5 (Na2CO3), 6 (NaNO3), 7 (CH3COONa) and 8 (Na2SO3). The order of increasing foaming stability among the salts were Na2CO3 (rate= 0.0-3.75% min-1)< Na2SO3 (rate = 0.0-10.0%min-1) <NaCl (rate =1.19-10.0% min-1) < NaN03
(rate = 2.5-10.0 % min-1) < CH3COONa (rate = 2.67-10.0 % min-1). The best concentration of NaCl was 0.5% (w/v), 1.0% (w/v) in Na2CO3, 1.0% (w/v) in NaNO3, 0.5% (w/v) in CH3COONa and 0.5% (w/v) in Na2SO3.
The foaming stability of dehulled bambara groundnut in Tables 9-13 revealed that the best NaCl concentration was 1.0% (w/v), 2.0% (w/v) for Na2
CO3,1.0% (w/v) for NaNO3, 5.0% for CH3COONa and 1.0% (w/v) for Na2SO3. Also, in whole seeds (Tables 14-18), the best concentration of NaCl, Na2CO3, NaNO3 and Na2SO3 was 0.5% (w/v) whereas, 1.0% (w/v) was best in CH3COONa. Most of the present values of FS% were lower than those reported for AYB seeds (Adeyeye and Aye, 1998), pigeon pea (Oshodi and Ekperigin, 1989) and raw cowpea flour (Padmashreeet al., 1987). Foaming stability is important since success of a whipping agent depends on its ability to maintain the whip as long as possible.
c)
Water absorption capacity (WAC)
The water absorption capacity (WAC) values of bambara groundnut samples: testa, dehulled and whole seeds are shown in Tables 19 (testa), 20 (dehulled) and 21 (whole seeds). The WAC in distilled water was 280%. The values ranged between 250-400% in testa, 140-240% in dehulled and 100-240% in whole seeds in the various salt solutions. The WAC values in various salt solutions were close in all the samples as seen in the coefficients of variation percent (CV %). In testa, the best salts for WAC property were NaCl particularly at 1.0% (w/v) and Na2CO3 at 2.0% (w/v) salt concentrations. In dehulled, the best salt was CH3COONa particularly at
11
Globa
lJo
urna
lof
Scienc
eFr
ontie
rResea
rch
V
olum
eXIII
XII
Issue
e
rsion
IV
IIYea
r
2 01
3
© 2013 Global Journals Inc. (US)
B)
)
5.0% (w/v) whereas in whole seeds, the best salt for WAC property was Na2SO3. All the values in the testa and most of the values in dehulled and whole seeds were comparatively higher than the WAC of 138% reported for pigeon pea flour (Oshodi and Ekperigin, 1989), 130% for soy flour, 107% for sunflower and 60.2%
Food Properties of Hull, Dehulled and Whole Seed Samples of Bambara Groundnut (Vigna Subterranea L. Verdc)
for wheat flour (Lin et al.,
1974) but compared favourably with that of cowpea flour (246%) (Olaofe et al.,1993). The high values of WAC in bambara groundnut could make it a useful replacement in viscous food formulations such as baked goods and custards.
d)
Emulsion Capacity (EC)
Tables 22–24 present the emulsion capacity (EC) of bambara groundnut testa, dehulled and whole seeds. The results showed that emulsion capacity depended on salt concentrations and the types of salts under consideration. A gradual increase in EC was observed with increase in salt concentrations in NaCl solution in all the samples and CH3COONa in testa. There was a progressive increase up to 2.0% generally in Na2CO3 solution; in Na2SO3 solution (testa and whole seeds) and CH3COONa (dehulled) after which it decreased up to 5.0% and later increased up to 10.0%. Low levels of the coefficients of variation showed that the emulsion capacity values in the various salt concentrations were close in the present report. The present report was fairly better than the 18.0% reported for soy flour and 11.0% for wheat flour (Lin et al.,
1974).
e)
Lowest gelation concentration (LGC)
The variation in lowest gelation concentration with increase in concentration of salts of bambara groundnut samples: testa, dehulled and whole seeds are indicated in Tables 25, 26 and 27 respectively. The salt free values ranged from 2.0-8.0% while the various salt concentration values ranged from 4.0-
8.0% (NaCl), 4.0-8.0% (Na2CO3), 4.0-6.0% (NaNO3), 4.0-8.0% (CH3COONa) and 4.0-8.0% (Na2SO3) (for testa); 2.0-
4.0% (CH3COONa) and 2.0-6.0% (Na2SO3) (for dehulled) and 6.0-8.0% (NaCl), 6.0-8.0% (Na2CO3), 6.0-8.0% (NaNO3), 6.0-8.0% (CH3COONa) and 6.0-8.0% (Na2SO3) (for whole seeds). Most of these values were lower or within the range of most literature values for leguminous seeds (Oshodi and Ekperigin, 1989; Adeyeye and Aye, 1998). The variation in the gelation concentration of the samples under different salt concentrations and anions might be due to their different effects on the relative ratios of different constituents: proteins, lipids and carbohydrates (Satheet al.,
1982). The low CV% of lowest gelation concentration among the various salts showed that the results were very close.
f)
Protein Solubility (PS)
The solubility of proteins is greatly influenced by pH, as might be expected from their amphoteric behaviour; solubility is at a minimum at the isoelectric point and increases with increasing alkalinity or acidity. It is worthy of note that each protein has a definite solubility in a solution of a fixed salt concentration and pH. The effect of salts in increasing the solubility of globulins is called the “salting-in” effect. The solubility is a function of the ionic strength, which is usually calculated from the molar concentrations of the ions and
their charge using the expression: μ=½ εmz2 where μ
is the ionic strength, m is the molarity and z, the charge of the ion, the ε
denotes that mz2 terms are added for each of the ions (White et al., 1973)
(Table 28). Neutral salts are known to exert striking effects on the solubility, the association-dissociation equilibrium, the enzyme activity, the stability of natural and fibrillar structures and the rate of conformational change of proteins, polypeptides and nucleic acids (Oshodi and Ojokan, 1997). The dependence of protein solubility with pH in
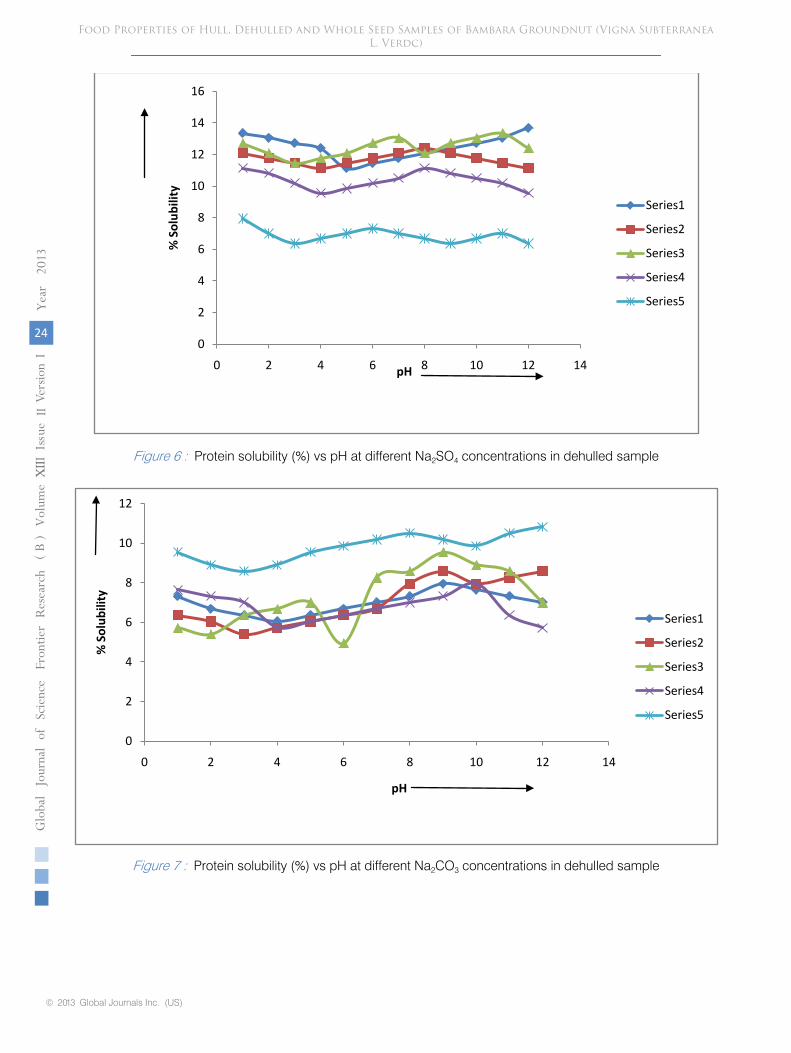
Figures 1-5 depict the protein solubility (PS) in different salts/pH of testa. The minimum solubility
pH (considering just one or two concentrations) was pH 3 (10%) in Na2SO4,
pH 3 (10%) in Na2CO3;pH 10 (2%) in Na2SO3,
pH 8 (10%) in CH3COONa, pH 3 or 5 (2%) and
the maximum solubility pH (taking the best two concentrations) was 12 (0.5%) and 11 (2%) in Na2SO4, pH 12 (10%) and 9 (2%) in Na2CO3,
pH 9 (10%) and 7 (2%) in Na2SO3,
pH 1 (2%) and 1 (1%) in CH3COONa and pH 12 (2%) and 7 (10%) in NaNO3.
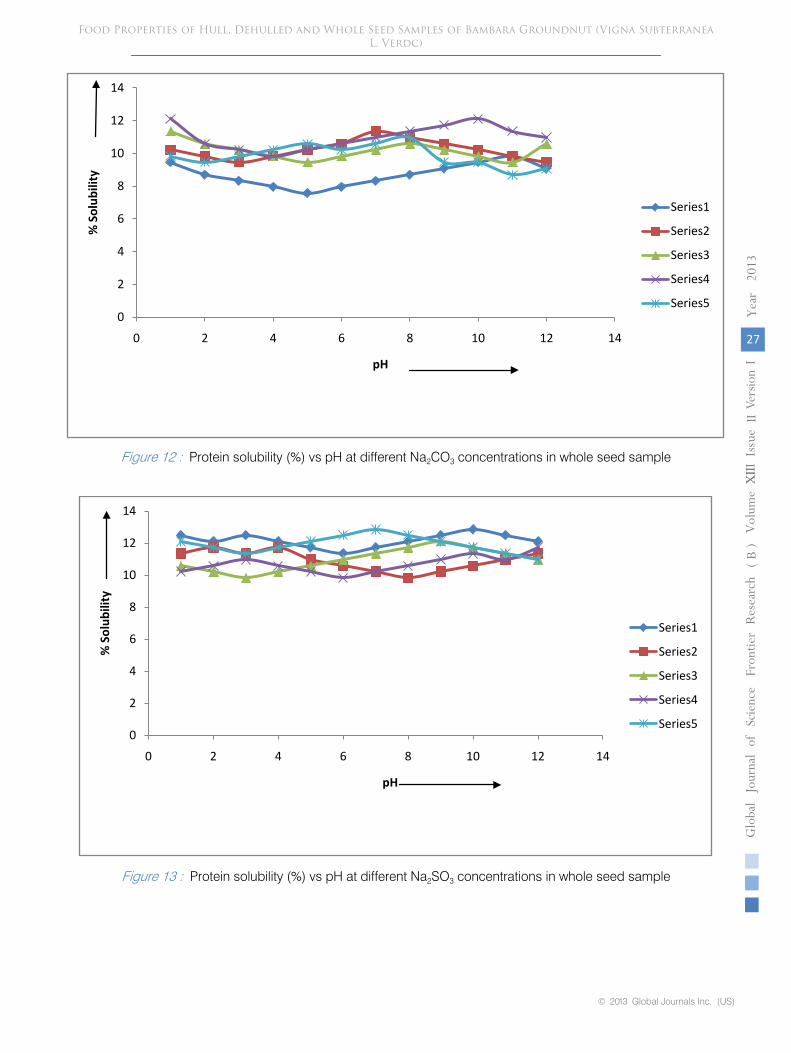
In whole seeds (Figures 11-15), the maximum solubility pH was pH 9 (1.0%) in Na2SO4, pH 1 or 10 (5.0%) in Na2CO3,
pH 10 (0.5%) and pH 7 (10.0%) in Na2SO3, pH 12 (5.0%) in CH3COONa and pH 9 (10.0%).
The minimum solubilities (pI) were recorded for various salts at various concentrations, viz: Na2CO3, 2.31% (8.5x10⁻³M or 10%); NaNO3, 6.94 (2.3x10⁻³M or
2.0% and 5.6x 10⁻³M or 5.0%); Na2SO3
3.7 (7.1x 10⁻³M or 10.0%); CH3COONa, 4.63 (1.1x10⁻²M or 10.0%) [testa], Na2CO3, 5.41 (9.3x10⁻⁴ M or 1.0% and 1.8x10⁻³M or 2.0%); Na2SO3,
1.27 (3.8x10⁻³ M or 2.0%); NaNo3, 0.64 (5.9 x10⁻⁴ M or 0.5%); NaNO3, 0.64 (5.9x10⁻⁴ M or 0.5%); Na2SO3, 1.27 (3.8 x 10⁻³ M or 5.0%); CH3COONa, 1.59(1.1 x 10⁻² M or 10.0%) [dehulled] and Na2CO3, 7.75 (4.7 x 10⁻⁴ M or 0.5%); NaNO3, 6.81 (5.9 x 10⁻⁴ M or
0.5%); Na2SO3, 9.84 (7.9 x10⁻⁴ M or 1.0%, 1.6x10⁻³ M or
2.0%. and 3.8 x 10⁻³ M
or 5.0%); CH3COONa, 6.05 (6.1x10⁻⁴ M
or 0.5%w/v) [whole seeds]. Maximum solubility values varied similarly viz: Na2CO3
16.2 (4.7x10⁻⁴ M or 0.5%); NaNO3, 12.0 (1.2x10⁻³M or 1.0%); Na2SO3
10.7 (7.9x10⁻⁴ M
or 1.0%); CH3COONa, 11.6 (2.4x10⁻³
M or 2.0% and 5.8x10⁻³ M or 5.0% w/v) [testa], Na2CO3, 10.8 (8.5x10⁻³ M or 10.0%); NaNO3, 7.64 (2.3x10⁻³ M or 2.0% and 1.1x10⁻² M or 10.0%); Na2SO3
6.36 (7.1x10⁻³ M or 10.0%); CH3COONa, 8.0 (2.4x10⁻³ M
© 2013 Global Journals Inc. (US)
12
Globa
lJo
urna
lof
Scienc
eFr
ontie
rResea
rch
V
olum
eXIII
XII
Issue
e
rsion
IV
IIYea
r
2013
B)
)
or 2.0% w/v) [dehulled] and Na2CO3, 12.1 (4.5x10⁻³ M or
5.0%); NaNO3,
13.2 (1.1x10⁻² M or 10.0%); Na2SO3 12.9 (3.9x10⁻⁴ M or 0.5% and 7.1x10⁻³ M or 10.0%); CH3COONa, 11.4 (5.8x10⁻³ M or 5.0% w/v) [whole seeds]. The lyotropic series is therefore in the order: CO3
2->NO3-> CH3COO- > SO3
2- (testa), CO32- >
CH3COO- > NO3-> SO3
2- (dehulled) and NO3-> SO3
2- > CO3
2- CH3COO- (whole seeds). It was generally observed that for the five salts
used in the analysis, the proteins in the bambara
Food Properties of Hull, Dehulled and Whole Seed Samples of Bambara Groundnut (Vigna Subterranea L. Verdc)
>
4.0% (NaCl), 2.0-4.0% (Na2CO3), 2.0-6.0% (NaNO3),2.0-
the presence of salts is presented in Figures 1-.2.5
pH 4 (5%) in NaNO3 .In dehulled sample (Figures 6 -10),

groundnut samples were more soluble in the basic region of pH. The electrostatic interactions (ionization of interior non-polar groups) are more important in hydration of proteins than the surface charge. This might contribute to the improved protein solubility in the alkaline region. Also, most of the figures showed two distinct peaks meaning that the bambara groundnut samples: testa, dehulled and whole seeds might be having two major proteins.
IV.
The samples were good in water absorption capacity and emulsion capacity but foaming capacity and stability are not favourable. It could therefore be concluded that bambara groundnut should be dehulled when it is being used as food supplement especially for infants.
References Références Referencias
1.
Adebowale, K.O., and Lawal, O.S. (2002). Effect of annealing and heat moisture conditioning on the physiological characteristics of bambara groundnut (Voandzeia subterranean) starch. Nahrung/ Food, 46, 311-316.
2.
Adeyeye, E.I., and Aye, P.A. (1998). The effects of samples preparation on the proximate composition and the functional properties of the African yam bean (SphonostylisstenocarpaHochst ex A. Rich) flours. Note1. La RivistaItalianaDelleSostanze Grasse, LXXV –
Magio, 253-261.
3.
Adu-Dapaah, H.K. and Sangwan, R.S. (2004). Improving bambara groundnut productivity using gamma irradiation and in vitro techniques. African Journal of Biotechnology, 3 (5), 260-265.
4.
Anchirinah, V.M., Yiridoe, E.K., Benneh-Lartey, S.O. (2001). Enhancing sustainable production and genetic resources conservation of bambara groundnut: A survey of indigenous agricultural knowledge system. Outlook on Agric., 30, 281-288.
5.
Beuchat, L.R. (1977). Functional and electrophoretic characteristics of succinylated peanut flour protein. J. Agric. Food Chem., 25,
258-261.
6.
Coffman, C.W., and Garcia, V.C. (1977). Functional properties and amino acid content of a protein isolate from mung bean flour. J. Food Tech., 12, 437-484.
7.
Collinson, S.T., Azam-Ali,S.N. Chavula, K.M., Hodson, D.A. (1996). Growth, development and yield of bambara groundnut (Vigina
subterranea) in response to soil moisture. J. Agric. Sci., 126, 307-318.
8.
Enwere, N.J., and Hung, Y.C. (1996). Some chemical and physical properties of bambara groundnut (Voandzeia subterranean Thouars) seed and products. Int.J. Food Sci. Nutri., 47 (6), 469-475.
9.
Ihekoronye, A.I. and Ngoddy, P.O. (1985). Integrated Food Science and Technology for the Tropics topics.
London, Macmillan Publishers.
10.
Inklaar, P.A., and Fortuin, J. (1969). Determining emulsifying and emulsion stabilizing capacity of protein meat additives. J. Food Tech., 23, 103-105.
11.
Johnson, L.A., Haved, E.F., Hoseney, R.S. (1979). Bovine Plasma as a replacement for egg in cakes. Cereal Chemistry,
56, 339-343.
12.
Lee, C.C., Love J.A., Johnson L.A. (1993). Sensory and physical of cakes with bovine plasma products substituted for egg. Cereal Chem., 70, 18-23.
13.
Lin, M.J.Y., Humbert, E.S., Sosulski, E.W. (1974). Certain functional properties of sun flower meal products. J. FoodSci.,
39, 368-370.
14.
Minka, S.R., and Bruneteau, M. (2000). Partial chemical composition of bambara pea (Vigna subterranea
(L) Verdc). Food Chem.,
68, 273-276.
15.
Olaofe, O., Umar, Y.O., Adediran, G.O. (1993). The effect of nematicides on the nutritive value and functional properties of cowpea seeds. Food
Chem.,
46, 337-342.
16.
Oshodi, A.A., and Ekperign, M.M. (1989). Functional properties of pigeon pea (Cajanuscajan) flour. Food
Chemistry, 34, 187-191.
17.
Oshodi, A.A., Ojokan, E. (1997). Effects of salts on some of the functional properties of bovine plasma protein concentrate. Food Chem., 59, 333-338.
18.
Oyenuga, V.A. (1968). Nigeria’s Foods and Feeding-stuffs. Their Chemistry and Nutritive value. Ibadan University Press.
19.
Padmashree, T.S., Vijayalashmi L. Puttaraj S. (1987). Effect of traditional processing on the functional properties of
cowpea (Vignacatjang)
flour. J. Food Sci. Tec., 24 , 221-225.
20.
Pasquet, R.S., Schwedes, S., Gepts, P. (1999). Isozyme diversity in bambara groundnut. Crop Sci., 39, 1228-1236.
21.
Piyarat, S. (2008). Structure and functional properties of starch and flour from bambara groundnut. Songklanakarin J. Sci. Technol., 30, (Suppl.1), 51-56.
13
Globa
lJo
urna
lof
Scienc
eFr
ontie
rResea
rch
V
olum
eXIII
XII
Issue
e
rsion
IV
IIYea
r
2 013
© 2013 Global Journals Inc. (US)
B)
)
22. Sathe, S.K.,Salunkhe, D.K. (1981). Functional properties of the great northern bean(Phaseolus vulgaris L.) proteins,emulsion, foaming, viscosity and gelation properties. J. Food Sci., 46, 71-76.
23. Sathe, S.K., Deshpande, S.S., Salunkhe, D.K. (1982). Functional properties of winged bean proteins. J. Food Sci., 47, 503-509.
24. White, A., Hander, P, Smith, E.I. (1973). Principles of biochemistry, 5th ed. Tokyo, McGraw Hill Kogakusha Ltd.
25. Wiechselboven, T.E. (1946). Biuret method of protein determination. Am. J. Clin. Path., 16, 40-44.
Conclusion
Food Properties of Hull, Dehulled and Whole Seed Samples of Bambara Groundnut (Vigna Subterranea L. Verdc)

26.
Wrigley, G. (1981). Tropical Agriculture. London, Longman.
Table 1 : Foaming capacity (cm3) of bambara groundnut testa in
var ious salt concentrations
Sal t concentrations (%)
Mean SD CV%
Salt
0.0
0.5
1.0
2.0 5.0
10.0
NaCl 9.0(18.0)
7.0(14.0)
5.0(10.0)
3.0(60)
2.0(4.0)
2.0(4.0)
4.67
2.88 61.7
Na2CO3
9.0(18.0)
6.50(13.0 6.0(12.0)
4.0(8.0)
3.50(7.0)
2.0(4.0) 5.17 2.50 48.4
NaNO3 9.0(18.0) 3.0(6.0)
4.0(8.0)
3.50(7.0)
2.0(4.0)
4.0(8.0)
4.25 2.44 57.4
CH3 COONa 9.0(18.0) 5.0(10.0) 5 .0(10.0) 4.0(8.0) 3.0(6.0)
2.0(4.0) 4.42 2.46 55.7
Na2 SO3
9.0(18.0)
5.50(11.0)
4.0(8.0)
3.0(6.0) 2.0(4.0)
2.0(4.0) 4.25 2.68 63.1
Table 2
:
Foaming capacity (cm3) of dehulledbambaragroundnut in various salt concentrations
Salt concentrations (%)
Mean SD CV%
Salt
0.0
0.5
1.0
2.0 5.0
10.0
NaCl 5.0(10.0) 6.0(12.0) 5.50(11.0) 3.0(6.0) 3.0(6.0) 2.0(4.0) 4.08 1.63 40.0
Na2CO3
5.0(10.0) 3.0(6.0) 4.0(8.0) 5.0(10.0) 3.50(7.0) 2.0(4.0) 3.75 1.1731.2
NaNO3
5.0(10.0) 3.0(6.0)
3.50(7.0) 4.0(8.0) 3.0(6.0)
2.50(5.0) 3.50
0.89 25.4
CH3 COONa
5.0(10.0) 4.0(8.0) 3.0(6.0) 2.0(4.0) 3.0(6.0) 2.0(4.0) 3.17
1.17 36.9
Na2 SO3
5.0(10.0) 5.0(10.0)
6.0(12.0) 4.0(8.0) 3.0(6.0)
2.50(5.0) 4.25
1.33 31.3
Table 3
: Foaming capacity (cm3) of bambara groundnut wholeseeds in various salt concentrations
Salt concentrations (%)
Mean SD CV%
Salt
0.0
0.5
1.0
2.0 5.0 10.0
NaCl
13.0(26.0) 12.0(24.0)
10.0(20.0) 11.0(22.0)
8.0(16.0)
6.0(12.0) 10.0 2.61 26.1
Na2CO3
13.0(26.0) 7.0(14.0)
6.0(12.0)
4.0(8.0) 3.0(6.0) 2.50(5.0) 5.92 3.88 65.5
NaNO3
13.0(26.0) 10.0(20.0)
8.0(16.0)
6.0(12.0)
7.0(14.0) 4.0(8.0) 8.0 3.16 39.5
CH3COONa3 13.0(26.0) 6.0(12.0)
5.0(10.0) 3.0(6.0) 3.0(6.0)
2.0(4.0)
5.33 4.03 75.6
Na2 SO3 13.0(26.0) 5.0(10.0) 3.50(7.0) 4.0(8.0) 2.0(4.0)
1.50(3.0)
4.83 4.20 87.0
14
Globa
lJo
urna
lof
Scienc
eFr
ontie
rResea
rch
V
olum
eXIII
XII
Issue
e
rsion
IV
IIYea
r
2013
B)
)
Table 4 : Foaming stability (%) of bambara groundnut testa using NaCl
Salt concentrations (%) Mean SD CV%
Time (min) 0.0 0.5 1.0 2.0 5.0 10.0
0 100(9.0) 100(7.0) 100(5.0) 100(3.0) 100(2.0) 100(2.0) 100 0.0 0.05 88.9(8.0) 85.7(6.0) 80.0(4.0) 66.7(2.0) 50.0(1.0) 100(2.0) 78.6 17.8 22.610 77.8(7.0) 71.4(5.0) 60.0(3.0) 66.7(2.0) 0.0(0.0) 50.0(1.0) 54.3 28.3 52.120 66.7(6.0) 4.0(57.1) 40.0(2.0) 0.0(0.0) 0.0(0.0) 0.0(0.0) 27.3 31.1 11430 55.6(5.0) 42.9(3.0) 20.0(1.0) 0.0(0.0) 0.0(0.0) 0.0(0.0) 19.8 24.5 12560 44.5(4.0) 28.6(2.0) 0.0(0.0) 0.0(0.0) 0.0().0) 0.0(0.0) 12.8 19.5 15290 223(2.0) 0.0(0.0) 0.0(0.0) 0.0(0.0) 0.0(0.0) 0.0(0.0) 3.7 9.1 246Rate 0.86 1.19 2.67 3.33 10.0 5.0 3.84 3.37 87.8
© 2013 Global Journals Inc. (US)
Note: The values inside the brackets represent the corresponding percentage values. Mean, SD and CV% were calculated based on volume.
Food Properties of Hull, Dehulled and Whole Seed Samples of Bambara Groundnut (Vigna Subterranea L. Verdc)

Table 5 : Foaming stability (%) of bambara groundnut testa using Na2CO3
Salt concentrations (%)
Mean SD CV%
Time (min) 0.0
0.5
1.0
2.0 5.0
10.0
0 100(9.0) 100(6.5) 100(6.0) 100(4.0) 100(3.5) 100(2.0) 100 0.0 0.0
5 88.9(8.0) 76.9(5.0) 83.3(5.0) 75.0(3.0)
57.1(2.0) 100(2.0) 80.2 14.5 18.1
10
20 66.7(6.0) 46.2(3.0) 66.0(4.0) 25.0(1.0) 28.6(1.0) 0.0(0.0) 38.9 26.1 67.1
30 55.6(5.0) 30.8(2.0) 50.0(3.0) 0.0(0.0) 0.0(0.0) 0.0(0.0)
22.7 26.2 115
60 44.5(4.0) 30.8(2.0) 33.3(2.0) 0.0(0.0) 0.0(0.0) 0.0(0.0) 18.1 20.4 113
90 22.3(2.0) 15.4(1.0)
33.3(2.0) 0.0(0.0) 0.0(0.0) 0.0(0.0)
11.8 14.2 120
Rate
0.86 0.94
0.74 3.5 3.57 0.0 1.64 1.60 97.6
Table 6 :
Foaming stability (%) of bambara groundnut testa using NaNO3
salt concentrations
Salt concentrations (%) Mean SD CV%
Time (min) 0.0
0.5
1.0
2.0 5.0
10.0
0 100(9.0) 100(3.0) 100(4.0) 100(3.50) 100(2.0)
100(4.0) 100 0.0 0.0
5 88.9(8.0) 66.7(2.0) 75.0(3.0) 57.1(2.0) 50.0(1.0) 75.0(3.0)
68.8 14.0
20.3
10 77.8(7.0) 33.3(1.0) 50.0(2.0) 28.6(1.0) 0.0(0.0) 50.0(2.0)
40.0 26.1 65.3
20 66.7(6.0)
0.0(0.0) 50.0(2.0) 0.0(0.0)
0.0(0.0) 25.0(1.0) 23.6 29.1 123
30 55.6(5.0)
0.0(0.0) 25.0(1.0) 0.0(0.0)
0.0(0.0) 0.0(0.0)
13.4 23.0 172
60 44.5(4.0)
0.0(0.0) 0.0(0.0) 0.0(0.0)
0.0(0.0)
0.0(0.0) 7.42 18.2 245
Rate
0.93 6.67
2.50 7.14 10.0 3.75
5.17 3.36 65.0
Table 7 :
Foaming stability (%) of bambara groundnut testa using CH3COONa
Salt concentrations (%) Mean SD CV%
Time (min) 0.0
0.5 1.0
2.0 5.0
10.0
0 100(9.0) 100(5.0) 100(4.0) 100(3.0) 100(3.5) 100(2.0)
100 0.0 0.0
5 88.9(8.0) 80.0(4.0) 75.0(3.0) 66.7(2.0) 85.7(3.0) 50.0(1.0) 74.4 14.3 19.2
10 77.8(7.0) 60.0(3.0) 50.0(2.0) 33.3(1.0) 57.1(2.0) 0.0(0.0)
46.4 26.9 85.0 20 66.7(6.0) 40.0(2.0) 25.0(1.0) 0.0(0.0)
0.0(0.0) 0.0(0.0)
22.0 27.5 125
15
Globa
lJo
urna
lof
Scienc
eFr
ontie
rResea
rch
V
olum
eXIII
XII
Issue
e
rsion
IV
IIYea
r
2 013
© 2013 Global Journals Inc. (US)
B)
)
77.8(7.0) 61.5 (4.0) 83.3(5.0) 50.0(2.0) 28.6(1.0) 0.0(0.0) 50.2 31.5 62.7
30 55.6(5. 0) 20.0(1.0) 0.0(0.0) 0.0(0.0) 0.0(0.0) 0.0(0.0) 12.6 22.5 179 60 44.5(4.0) 0.0(0.0) 0.0(0.0) 0.0(0.0) 0.0(0.0) 0.0(0.0) 7.42 18.2 68.0
Rate 0.93 2.67 3.75 6.67 4.29 10.0 4.72 3.21 68.0
Table 8 : Foaming stability (%) of bambara groundnut testausing Na2SO3 Salt concentrations (%) Mean SD CV%
Time (min) 0.0 0.5 1.0 2.0 5.0 10.0
0 100(9.0) 100(5.5) 100(4.0) 100(3.0) 100(2.0) 100(2.0) 100 0.0 0.0 5 88.9(8.0) 72.7(4.0) 75.0(3.0) 66.7(2.0) 100(2.0) 50.0(1.0) 75.6 17.4 23.0 10 77.8(7.0) 54.5(3.0) 50.0(2.0) 33.3(1.0) 0.0(0.0) 0.0(0.0) 35.9 31.3 87.220 66.7(6.0) 36.4(2.0) 0.0(0.0) 0.0(0.0) 0.0(0.0) 0.0(0.0) 17.2 28.3 16530 55.6(5.0) 18.2(1.0) 0.0(0.0) 0.0(0.0) 0.0(0.0) 0.0(0.0) 12.8 22.4 17560 44.5(4.0) 0.0(0.0) 0.0(0.0) 0.0(0.0) 0.0(0.0) 0.0(0.0) 7.42 18.2 245Rate 0.93 2.73 5.0 6 0 .0 10.0 4.22 3.76 89.1
Food Properties of Hull, Dehulled and Whole Seed Samples of Bambara Groundnut (Vigna Subterranea L. Verdc)

Table 9 :
Foaming stability (%) of dehulledbambara groundnut using NaCl
Salt concentrations (%) Mean SD CV%
Time (min) 0.0
0.5
1.0
2.0 5.0 10.0
0
100(5.0) 100(6.0)
100(5.50) 100(3.0) 100(3.0) 100(2.0) 100
0.0 0.0
5
80.0(4.0) 83.3(5.0) 90.9(5.0) 66.7(2.0) 66.7(2.0) 50.0(1.0) 72.9
14.7 20.2
10
60.0(3.0) 66.7(4.0) 90.9(5.0) 33.3(1.0) 66.7(2.0) 0.0(0.0) 52.9 31.8 60.1
20
40.0(2.0) 50.0(3.0) 72.7(4.0) 0.0(0.0) 33.3(1.0) 0.0(0.0) 32.7
28.6 87.5
30
20.0(1.0) 33.3(2.0) 54.5(3.0) 0.0(0.0) 0.0(0.0) 0.0(0.0) 18.0 22.5 125
60
0.0(0.0) 0.0(0.0) 36.4(2.0)
0.0(0.0) 0.0(0.0) 0.0(0.0) 6.07 14.9 245
Rate 2.67 2.22
1.06
6.67 3.34
10.0
4.33 3.36 77.6
Table 10 : Foaming stability (%) of dehulledbambara groundnut using Na2CO3
Salt concentrations (%) Mean SD CV%
Time (min) 0.0 0.5
1.0
2.0 5.0
10.0
0 100(5.0) 100(3.0) 100(4.0) 100(5.0) 100(3.5) 100(2.0) 100 0.0 0.0
5 80.0(4.0) 66.7(2.0) 75.0(3.0) 80.0(4.0) 85.7(3.0) 50.0(1.0) 72.9 13.0 17.8
10 60.0(3.0) 33.3(1.0) 50.0(2.0) 60.0(3.0) 57.1(2.0) 50.0(1.0) 51.7 10.1 19.5
20 40.0(2.0) 0.0(0.0) 25.0(1.0) 40.0(2.0) 28.6(1.0) 0.0(0.0) 22.3 18.3 82.1
30 20.0(1.0) 0.0(0.0) 0.0(0.0) 40.0(2.0) 0.0(0.0) 0.0(0.0) 10.0 16.7 167
60 0.0(0.0) 0.0(0.0) 0.0(0.0) 0.0(0.0) 0.0(0.0) 0.0(0.0) 0.0 0.0 0.0
Rate 2.67 6.67 3.75 2.0 3.57 5.0 3.94 1.69 42.9
Table 11 : Foaming stability (%) of dehulledbambara groundnut using NaNO3
Salt concentrations (%) Mean SD CV%
Time (min) 0.0
0.5
1.0
2.0 5.0
10.0
0 100(5.0) 100(3.0) 100(3.50) 100(4.0) 100(3.0) 100(2.50) 100 0.0 0.0
5 80.0(4.0)
66.7(2.0) 85.7
75.0(3.0) 66.7(2.0) 80.0(2.0) 75.7 7.74 10.2
10 60.0(3.0) 33.3(1.0) 57.1(2.0) 50.0(2.0) 33.3(1.0) 40.0(1.0) 45.6 11.8 25.9
© 2013 Global Journals Inc. (US)
16
Globa
lJo
urna
lof
Scienc
eFr
ontie
rResea
rch
V
olum
eXIII
XII
Issue
e
rsion
IV
IIYea
r
2013
B)
)
20 40.0(2.0) 0.0(0.0) 28.6(1.0) 0.0(0.0) 0.0(0.0) 0.0(0.0) 11.4 18.1 159 30 20.0(1.0) 0.0(0.0) 0.0(0.0) 0.0(0.0) 0.0(0.0) 0.0(0.0) 3.33 8.16 24560 0.0(0.0) 0.0(0.0) 0.0(0.0) 0.0(0.0) 0.0(0.0) 0.0(0.0) 0.0 0.0 0.0
Rate 2.67 6.67 3.57 5.0 6.67 6.0 5.10 1.67 32.7
Table 12 : Foaming stability (%) of dehulledbambara groundnut usingCH3COONa
Salt concentrations (%)
Mean SD CV%
Time (min) 0.0
0.5 1.0 2.0 5.0 10.0
0 100(5.0) 100(4.0) 100(3.0) 100(2.0) 100(3.0) 100(2.0) 100 0.0 0.0 5 80.0(4.0) 75.0(3.0) 66.7(2.0) 50.0(1.0) 83.3(2.50) 50.0(1.0) 67.5 14.7 21.810 60.0(3.0) 50.0(2.0) 0.0(0.0) 0.0(0.0) 66.7(2.0)
50.0(1.0)
37.8 30.0 79.420 40.0(2.0) 25.0(1.0) 0.0(0.0) 0.0(0.0) 33.3(1.0)
0.0(0.0) 16.4 18.6 11330 20.0(1.0) 0.0(0.0) 0.0(0.0) 0.0(0.0) 0.0(0.0) 0.0(0.0) 3.33 8.16 24560 0.0(0.0) 0.0(0.0) 0.0(0.0) 0.0(0.0) 0.0(0.0) 0.0(0.0) 0.0 0.0 0.0Rate 2.67 3.75 6.66
10.0 3.34 5.0 5.24 2.73 52.1
Food Properties of Hull, Dehulled and Whole Seed Samples of Bambara Groundnut (Vigna Subterranea L. Verdc)
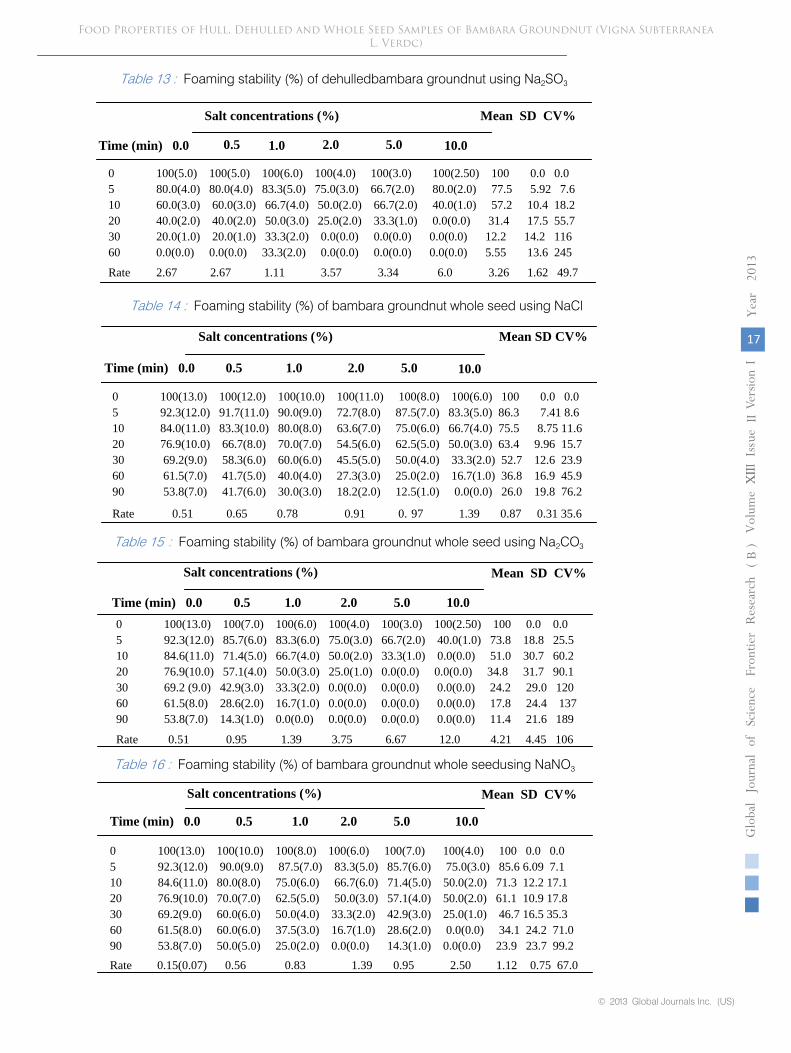
Table 13
:
Foaming stability (%) of dehulledbambara groundnut using Na2SO3
Salt concentrations (%)
Mean SD CV%
Time (min) 0.0
0.5
1.0
2.0 5.0
10.0
0
100(5.0) 100(5.0) 100(6.0) 100(4.0) 100(3.0) 100(2.50) 100
0.0 0.0
5
80.0(4.0) 80.0(4.0) 83.3(5.0) 75.0(3.0) 66.7(2.0) 80.0(2.0) 77.5
5.92 7.6
10
60.0(3.0) 60.0(3.0) 66.7(4.0) 50.0(2.0) 66.7(2.0) 40.0(1.0)
57.2
10.4 18.2
20
40.0(2.0) 40.0(2.0) 50.0(3.0) 25.0(2.0) 33.3(1.0) 0.0(0.0) 31.4 17.5 55.7
30
20.0(1.0) 20.0(1.0) 33.3(2.0) 0.0(0.0) 0.0(0.0) 0.0(0.0)
12.2 14.2 116
60
0.0(0.0) 0.0(0.0) 33.3(2.0) 0.0(0.0) 0.0(0.0) 0.0(0.0)
5.55 13.6 245
Rate
2.67
2.67
1.11 3.57
3.34 6.0 3.26 1.62 49.7
Table 14
:
Foaming stability (%) of bambara groundnut whole seed using NaCl
Salt concentrations (%)
Mean SD CV%
Time (min) 0.0
0.5
1.0
2.0 5.0
10.0
0
100(13.0) 100(12.0) 100(10.0) 100(11.0)
100(8.0) 100(6.0) 100 0.0 0.0
5
92.3(12.0) 91.7(11.0) 90.0(9.0) 72.7(8.0) 87.5(7.0) 83.3(5.0) 86.3 7.41 8.6
10
84.0(11.0) 83.3(10.0) 80.0(8.0)
63.6(7.0) 75.0(6.0) 66.7(4.0) 75.5 8.75 11.6
20
76.9(10.0) 66.7(8.0) 70.0(7.0)
54.5(6.0) 62.5(5.0) 50.0(3.0) 63.4 9.96 15.7
30
69.2(9.0)
58.3(6.0) 60.0(6.0)
45.5(5.0) 50.0(4.0) 33.3(2.0) 52.7 12.6 23.9
60
61.5(7.0)
41.7(5.0) 40.0(4.0) 27.3(3.0) 25.0(2.0) 16.7(1.0) 36.8 16.9 45.9
90
53.8(7.0)
41.7(6.0) 30.0(3.0)
18.2(2.0) 12.5(1.0) 0.0(0.0) 26.0
19.8 76.2
Rate
0.51
0.65
0.78
0.91 0. 97
1.39 0.87
0.31 35.6
17
Globa
lJo
urna
lof
Scienc
eFr
ontie
rResea
rch
V
olum
eXIII
XII
Issue
e
rsion
IV
IIYea
r
2 013
© 2013 Global Journals Inc. (US)
B)
)
Time (min) 0.0
0.5 1.0 2.0 5.0 10.00 100(13.0) 100(7.0) 100(6.0) 100(4.0) 100(3.0) 100(2.50) 100 0.0 0.0 5 92.3(12.0) 85.7(6.0) 83.3(6.0) 75.0(3.0) 66.7(2.0) 40.0(1.0) 73.8
18.8 25.510 84.6(11.0) 71.4(5.0) 66.7(4.0) 50.0(2.0) 33.3(1.0) 0.0(0.0) 51.0 30.7 60.220 76.9(10.0) 57.1(4.0) 50.0(3.0) 25.0(1.0) 0.0(0.0) 0.0(0.0) 34.8 31.7 90.130 69.2 (9.0) 42.9(3.0) 33.3(2.0) 0.0(0.0) 0.0(0.0) 0.0(0.0) 24.2 29.0 12060 61.5(8.0) 28.6(2.0) 16.7(1.0) 0.0(0.0) 0.0(0.0) 0.0(0.0) 17.8 24.4 13790 53.8(7.0) 14.3(1.0) 0.0(0.0) 0.0(0.0) 0.0(0.0) 0.0(0.0) 11.4 21.6 189
Rate 0.51
0.95 1.39
3.75 6.67 12.0
4.21
4.45 106
Table 15 : Foaming stability (%) of bambara groundnut whole seed using Na2CO3
Salt concentrations (%) Mean SD CV%
Table 16 : Foaming stability (%) of bambara groundnut whole seedusing NaNO3
Salt concentrations (%)
Mean SD CV%
Time (min) 0.0
0.5 1.0 2.0 5.0
10.0
0 100(13.0) 100(10.0) 100(8.0) 100(6.0) 100(7.0) 100(4.0) 100 0.0 0.0 5 92.3(12.0) 90.0(9.0) 87.5(7.0) 83.3(5.0) 85.7(6.0) 75.0(3.0) 85.6 6.09 7.110 84.6(11.0) 80.0(8.0) 75.0(6.0) 66.7(6.0) 71.4(5.0) 50.0(2.0) 71.3 12.2 17.1 20 76.9(10.0) 70.0(7.0) 62.5(5.0) 50.0(3.0) 57.1(4.0) 50.0(2.0) 61.1 10.9 17.830 69.2(9.0) 60.0(6.0) 50.0(4.0) 33.3(2.0) 42.9(3.0) 25.0(1.0) 46.7 16.5 35.3 60 61.5(8.0) 60.0(6.0) 37.5(3.0) 16.7(1.0) 28.6(2.0)
0.0(0.0) 34.1 24.2 71.090 53.8(7.0) 50.0(5.0) 25.0(2.0) 0.0(0.0) 14.3(1.0) 0.0(0.0) 23.9 23.7 99.2Rate 0.15(0.07) 0.56 0.83 1.39 0.95 2.50
1.12 0.75 67.0
Food Properties of Hull, Dehulled and Whole Seed Samples of Bambara Groundnut (Vigna Subterranea L. Verdc)
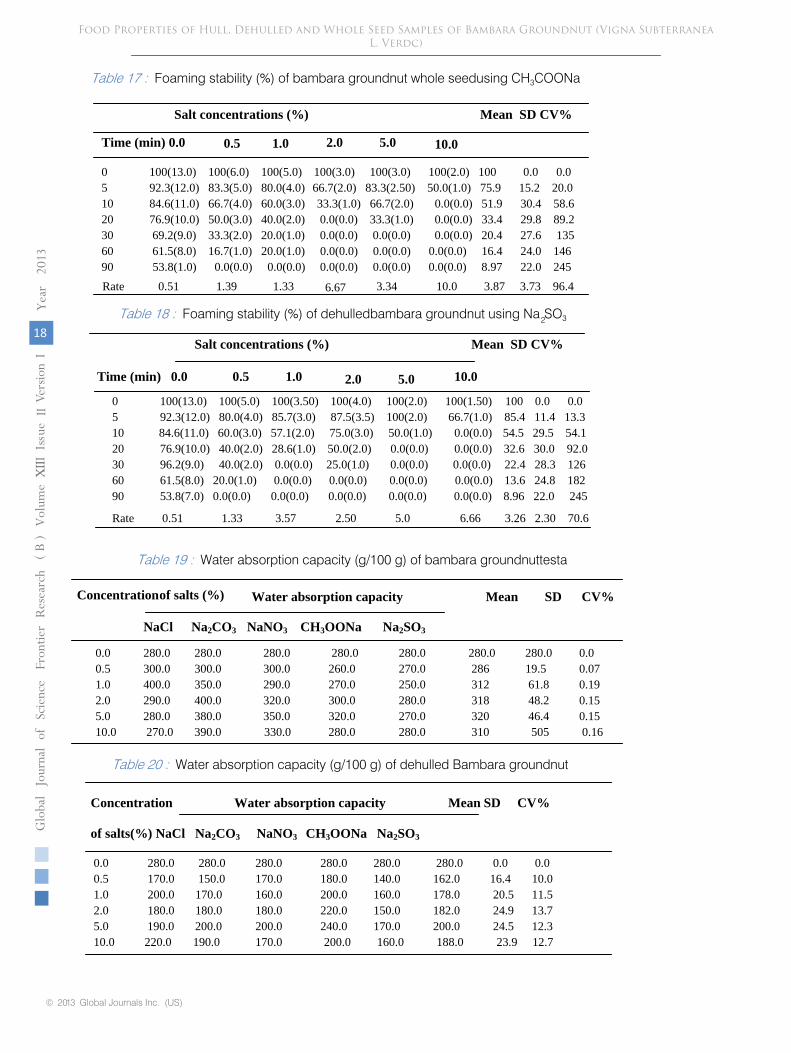
Table 17
:
Foaming stability (%) of bambara groundnut whole seedusing CH3COONa
Salt concentrations (%)
Mean SD CV%
Time (min) 0.0
0.5
1.0
2.0 5.0
10.0
0
100(13.0) 100(6.0) 100(5.0) 100(3.0) 100(3.0) 100(2.0) 100 0.0 0.0
5
92.3(12.0) 83.3(5.0) 80.0(4.0)
66.7(2.0) 83.3(2.50) 50.0(1.0) 75.9 15.2 20.0
10
84.6(11.0) 66.7(4.0) 60.0(3.0) 33.3(1.0) 66.7(2.0) 0.0(0.0) 51.9 30.4 58.6
20
76.9(10.0) 50.0(3.0) 40.0(2.0) 0.0(0.0) 33.3(1.0) 0.0(0.0) 33.4 29.8 89.2
30
69.2(9.0) 33.3(2.0) 20.0(1.0) 0.0(0.0) 0.0(0.0) 0.0(0.0) 20.4 27.6 135
60
61.5(8.0) 16.7(1.0) 20.0(1.0) 0.0(0.0) 0.0(0.0) 0.0(0.0) 16.4 24.0 146
90
53.8(1.0) 0.0(0.0) 0.0(0.0) 0.0(0.0) 0.0(0.0) 0.0(0.0) 8.97 22.0 245
Rate
0.51
1.39
1.33
6.67
3.34
10.0
3.87 3.73 96.4
Table 18
:
Foaming stability (%) of dehulledbambara groundnut using Na2SO3
Salt concentrations (%)
Mean SD CV%
Time (min) 0.0
0.5
1.0
2.0 5.0
10.0
0
100(13.0) 100(5.0) 100(3.50) 100(4.0) 100(2.0) 100(1.50)
100 0.0 0.0
5
92.3(12.0) 80.0(4.0) 85.7(3.0) 87.5(3.5) 100(2.0)
66.7(1.0) 85.4 11.4 13.3
10
84.6(11.0) 60.0(3.0) 57.1(2.0) 75.0(3.0) 50.0(1.0)
0.0(0.0)
54.5 29.5 54.1
20
76.9(10.0) 40.0(2.0) 28.6(1.0) 50.0(2.0)
0.0(0.0)
0.0(0.0) 32.6 30.0 92.0
30
96.2(9.0) 40.0(2.0)
0.0(0.0)
25.0(1.0)
0.0(0.0)
0.0(0.0)
22.4 28.3 126
60
61.5(8.0) 20.0(1.0) 0.0(0.0) 0.0(0.0) 0.0(0.0) 0.0(0.0) 13.6 24.8 182
90
53.8(7.0) 0.0(0.0)
0.0(0.0) 0.0(0.0) 0.0(0.0) 0.0(0.0)
8.96 22.0 245
Rate
0.51 1.33
3.57
2.50
5.0 6.66
3.26 2.30 70.6
© 2013 Global Journals Inc. (US)
18
Globa
lJo
urna
lof
Scienc
eFr
ontie
rResea
rch
V
olum
eXIII
XII
Issue
e
rsion
IV
IIYea
r
20
13
B)
)
Table 19 : Water absorption capacity (g/100 g) of bambara groundnuttesta
Concentrationof salts (%) Water absorption capacity
Mean SD CV%
NaCl Na2CO3 NaNO3 CH3OONa Na2SO3
0.0 280.0 280.0 280.0
280.0
280.0 280.0 280.0 0.00.5 300.0 300.0 300.0 260.0
270.0 286 19.5 0.07
1.0 400.0 350.0 290.0 270.0
250.0 312 61.8 0.192.0 290.0 400.0 320.0 300.0
280.0 318
48.2
0.15
5.0 280.0 380.0 350.0 320.0
270.0 320 46.4 0.15 10.0 270.0 390.0 330.0 280.0 280.0 310 505 0.16
Concentration
Water absorption capacity Mean SD CV%
of salts(%) NaCl Na2CO3 NaNO3 CH3OONa Na2SO3
0.0 280.0 280.0 280.0 280.0 280.0
280.0 0.0 0.00.5 170.0 150.0 170.0 180.0 140.0
162.0 16.4 10.0
1.0 200.0 170.0 160.0 200.0 160.0
178.0 20.5 11.52.0 180.0 180.0 180.0 220.0 150.0
182.0 24.9 13.7
5.0 190.0 200.0 200.0 240.0 170.0
200.0 24.5 12.310.0
220.0 190.0 170.0 200.0 160.0
188.0 23.9 12.7
Table 20 : Water absorption capacity (g/100 g) of dehulled Bambara groundnut
Food Properties of Hull, Dehulled and Whole Seed Samples of Bambara Groundnut (Vigna Subterranea L. Verdc)

Concentration
Water absorption Capacity
Mean SD CV%
of salts(%) NaCl Na2CO3
NaNO3 CH3OONa Na2SO3
0.0
280.0 280.0 280.0
280.0
280.0
280.0
0.0
0.0
0.5
100.0 120.0
150.0
160.0
220.0
150.0
45.8 30.5
1.0
110.0 140.0
160.0
180.0
230.0
164.0
45.1
27.5
2.0
150.0 110.0
180.0
220.0
150.0
162.0
40.9
25.2
5.0
120.0 150.0
160.0
160.0
210.0
160.0
32.4 20.3
10.0
140.0 150.0
210.0 170.0
240.0 182.0
42.1 23.1
Concentration
Emulsion capacity of salt
Mean
SD CV%
of salt (%)
NaCl Na2CO3
NaNO3 CH3OONa Na2SO3
0.0
13.0
15.0
15.0
15.3
15.0
14.7
0.94
6.4
0.5
14.3
14.3
23.0
16.0
21.4
17.8
4.12 23.1
19
Globa
lJo
urna
lof
Scienc
eFr
ontie
rResea
rch
V
olum
eXIII
XII
Issue
e
rsion
IV
IIYea
r
2 013
B)
)
1.0 15.0 16.0 22.0 18.4 22.0 18.7 3.27 17.52.0 16.3 18.0 24.0 20.0 23.0 20.3 3.25 16.05.0 20.0 16.0 25.0 22.2 21.0 20.9 3.18 15.2
10.0 21.0 22.0 24.0 23.0 24.0 22.8 1.30 5.7
Table 23 : Emulsion capacity (g/100g) of dehulledbambara groundnut in various salt concentrations
Concentration Emulsion capacity of salt
Mean SD CV%
of salts (%) NaCl Na2CO3 NaNO3 CH3OONa Na2SO3
0.0 13.0 15.0 15.0 15.3 15.0 14.7 0.94 6.40.5 15.0 19.0 23.0 20.4 20.4 19.6 2.93 14.91.0 16.2 20.0 22.0 22.2 30.9 22.3 5.40 24.2
© 2013 Global Journals Inc. (US)
2.0 20.0 21.4 25.5 23.0 27.0 23.4 2.88 12.35.0 21.0 18.8 26.3 21.0 28.0 23.0 3.92 17.010.0 23.5 22.0 25.3 24.7 29.3 25.0 2.73 10.9
Table 24 : Emulsion capacity (g/100 g) of bambara groundnut whole seed in various salt
ConcentrationOf salt (%) Emulsion capacity of salts Mean SD CV%
NaCl Na 2CO 3 NaNO3 CH3OONa Na2SO3 0.0 13.0 15.0 15.0 15.3 15.0 14.7 0.94 6.40.5 22.0 25.0 24.0 24.0 32.0 25.4 3.85 15.21.0 23.0 26.0 26.5 23.5 33.0 26.4 3.99 15.12.0 22.5 28.3 25.0 25.0 29.0 26.0 2.67 10.35.0 24.0 27.0 28.0 26.5 35.0 28.1 4.13 14.710.0 25.3 28.6 29.6 28.0 34.3 29.2 3.29 11.3
Table 21 : Water absorption capacity (g/100 g) of whole seed ofbambara groundnut
Table 22 : Emulsion capacity (g/100g) of bambara groundnut testa in
various salt concentrations
Food Properties of Hull, Dehulled and Whole Seed Samples of Bambara Groundnut (Vigna Subterranea L. Verdc)

Table 25 :
Least gelation concentration of bambara groundnut testa in salt concentrations
Concentration of Least gelation concentration (%) Mean SD CV%
salts in water (%) NaCl Na2CO3
NaNO3 CH3OONa Na2SO3 0.0
6.0
6.0 6.0
6.0
6.0 6.0 6.0
0.0
0.5
6.0
6.0 6.0
6.0
8.0 6.4 0.89 0.14
1.0
4.0
6.0 6.0
8.0
6.0 6.0 1.41
0.24
2.0
8.0
8.0 6.0
4.0
6.0 6.4 1.67
0.26
5.0
4.0
6.0 4.0
6.0
4.0 4.8 1.09
0.23
10.0
6.0 4.0 4.0
4.0
6.0 4.8 1.09
0.23
Table 26
:
Least gelation concentration of dehulledbambaragroundnut in salt concentrations
Concentration of Least gelation concentration(%)
Mean SD CV%
salts in water (%) NaCl Na2CO3
NaNO3 CH3OONa Na2SO3
0.0
2.0
2.0
2.0
2.0
2.0
2.0
0.0 0.0
© 2013 Global Journals Inc. (US)
20
Globa
lJo
urna
lof
Scienc
eFr
ontie
rResea
rch
V
olum
eXIII
XII
Issue
e
rsion
IV
IIYea
r
2013
B)
)
0.5 2. 0 2.0 6.0 4.0 6.0 4.0 2.0 0.5
1.0
4.0 4.0
4.0 2.0
2.0 3.2
1.09 0.342.0
2.0 2.0
6.0
4.0
4.0 3.6 1.67 0.465.0
4.0 4.0
4.0
4.0
2.0 3.6 0.89 0.2510.0
4.0 2.0
4.0
2.0
2.0 2.8 1.09 0.39
Table 27 : Least gelation concentration of whole bambara groundnut in salt concentrations
Concentration of Least gelation concentration (%)
Mean SD CV%
salts in water (%) NaCl Na2CO3 NaNO3 CH3OONa Na2SO3
0.0
8.0 8.0
8.0 8.0
8.0 8.0
0.0 0.0 0.5
8.0 8.0
6.0 6.0
8.0 6.8
1.09 0.161.0
6.0 6.0
8.0 8.0
6.0 6.8
1.09 0.162.0
6.0 6.0
8.0 8.0
6.0 6.8
1.09 0.165.0
6.0 6.0
6.0 8.0
8.0
6.8 1.09 0.1610.0 8.0 6.0 8.0 6.0 6.0 6.8 1.09 0.16
Salt
Percentageconcentration Molairty
Ionic strengthNaCl 0.5
8.5 x 10⁻⁴
8.5 x 10⁻⁴
NaCl
1.0
1.7 x 10⁻³
1.7 x 10⁻³
NaCl 2.0
3.4 x 10⁻³
3.4 x 10⁻³
NaCl
5.0
8.1 x 10⁻³
8.1 x 10⁻³
NaCl
10.0
1.5 x 10⁻²
1.5 x 10⁻²
Na2CO3
0.5
4.7 x 10⁻⁴
1.4 x 10⁻³
Na2CO3
1.0
9.3 x 10⁻⁴
2.8 x 10⁻³
Na2CO3
2.0
1.8 x 10⁻³
5.4 x 10⁻³
Na2CO3
5.0
4.5 x 10⁻³
1.35 x 10⁻²
Na2CO3
10.0
8.5 x 10⁻³
2.6 x 10⁻²
NaNO3
0.5
5.9 x 10⁻⁴
5.9 x 10⁻⁴
NaNO3
1.0
1.2 x 10⁻³
1.2 x 10⁻³
NaNO3
2.0
2.3 x 10⁻³
2.3 x 10⁻³
NaNO3 5.0 5.6 x 10⁻³ 5.6 x 10⁻³
NaNO3 10.0 1.1x 10⁻² 1.1 x 10⁻²
Table 28 : Various salts concentrations [percentage, molarity and ionic strength (μ)]
Food Properties of Hull, Dehulled and Whole Seed Samples of Bambara Groundnut (Vigna Subterranea L. Verdc)

CH3 COONa
0.5
6.1 x 10⁻⁴
6.1 x 10⁻⁴
CH3 COONa
1.0
1.2 x 10⁻³ 1.2 x 10⁻³
CH3 COONa
2.0
2.4 x 10⁻³
2.4 x 10⁻³
CH3 COONa
5.0
5.8 x 10⁻³
5.8 x 10⁻³
CH3 COONa 10.0
1.1 x 10⁻²
1.1 x 10⁻²
Na2SO3
0.5
3.9 x 10⁻⁴
1.2 x 10⁻³
Na2SO3
1.0
7.9 x 10⁻⁴
2.4 x 10⁻³
Na2SO3
2.0
1.6 x 10⁻³
4.8 x 10⁻³
Na2SO3
5.0
3.8 x 10⁻³
1.14 x 10⁻²
Na2SO3
10.0
7.1 x 10⁻³
2.14 x 10⁻²
21
Globa
lJo
urna
lof
Scienc
eFr
ontie
rResea
rch
V
olum
eXIII
XII
Issue
e
rsion
IV
IIYea
r
2 013
© 2013 Global Journals Inc. (US)
B)
)
0
5
10
15
20
25
30
35
0 2 4 6 8 10 12 14
% s o
lubi
lity
pH
Series1
Series2
Series3
Series4
Series5
Series 1 - 0.5% salt concentrationSeries 2 - 1.0% salt concentrationSeries 3 – 2.0% salt concentrationSeries 4 – 5.0% salt concentrationSeries 5 – 10.0% salt concentration
Figure 1 : Protein solubility (%) vs pH at different Na2SO4 concentrations in testa
Food Properties of Hull, Dehulled and Whole Seed Samples of Bambara Groundnut (Vigna Subterranea L. Verdc)

0
2
4
6
8
10
12
14
16
18
0 2 4 6 8 10 12 14
% Solubility
pH
Series1
Series2
Series3
Series4
Series5
© 2013 Global Journals Inc. (US)
22
Globa
lJo
urna
lof
Scienc
eFr
ontie
rResea
rch
V
olum
eXIII
XII
Issue
e
rsion
IV
IIYea
r
2013
B)
)
0
2
4
6
8
10
12
0 2 4 6 8 10 12 14
% S
olub
ility
pH
Series1
Series2
Series3
Series4
Series5
Figure 2 : Protein solubility (%) vs pH at different Na2CO3 concentrations in testa
Figure 3 : Protein solubility (%) vs pH at different Na2SO3 concentrations in testa
Food Properties of Hull, Dehulled and Whole Seed Samples of Bambara Groundnut (Vigna Subterranea L. Verdc)

0
2
4
6
8
10
12
14
0 5 10 15
% S
olub
ility
pH
Series1
Series2
Series3
Series4
Series5
23
Globa
lJo
urna
lof
Scienc
eFr
ontie
rResea
rch
V
olum
eXIII
XII
Issue
e
rsion
IV
IIYea
r
2 013
© 2013 Global Journals Inc. (US)
B)
)
0
2
4
6
8
10
12
14
0 2 4 6 8 10 12 14
% S
olub
ility
pH
Series1
Series2
Series3
Series4
Series5
Figure 4 : Protein solibility (%) vs pH at different CH3COOH concetrations in testa
Figure 5 : Protein solubility (%) vs pH at different NaNO3 concentrations in testa
Food Properties of Hull, Dehulled and Whole Seed Samples of Bambara Groundnut (Vigna Subterranea L. Verdc)
0
2
4
6
8
10
12
14
16
0 2 4 6 8 10 12 14
% S
o lub
ility
pH
Series1
Series2
Series3
Series4
Series5
© 2013 Global Journals Inc. (US)
24
Globa
lJo
urna
lof
Scienc
eFr
ontie
rResea
rch
V
olum
eXIII
XII
Issue
e
rsion
IV
IIYea
r
2013
B)
)0
2
4
6
8
10
12
0 2 4 6 8 10 12 14
% S
o lub
ility
pH
Series1
Series2
Series3
Series4
Series5
Figure 6 : Protein solubility (%) vs pH at different Na2SO4 concentrations in dehulled sample
Figure 7 : Protein solubility (%) vs pH at different Na2CO3 concentrations in dehulled sample
Food Properties of Hull, Dehulled and Whole Seed Samples of Bambara Groundnut (Vigna Subterranea L. Verdc)

0
1
2
3
4
5
6
7
0 2 4 6 8 10 12 14
% S
o lub
ility
pH
Series1
Series2
Series3
Series4
Series5
25
Globa
lJo
urna
lof
Scienc
eFr
ontie
rResea
rch
V
olum
eXIII
XII
Issue
e
rsion
IV
IIYea
r
2 013
© 201
3 Global Journals Inc. (US)
B)
)
0
1
2
3
4
5
6
7
8
9
0 2 4 6 8 10 12 14
% S
o lub
ility
pH
Series1
Series2
Series3
Series4
Series5
Figure 8 : Protein solubility (%) at different Na2SO3 concentrations in dehulled sample
Figure 9 : Protein solubility (%) vs pH at different CH3COONa concentrations in dehulled sample
Food Properties of Hull, Dehulled and Whole Seed Samples of Bambara Groundnut (Vigna Subterranea L. Verdc)

0
1
2
3
4
5
6
7
8
9
0 2 4 6 8 10 12 14
% S
o lub
ility
pH
Series1
Series2
Series3
Series4
Series5
© 2013 Global Journals Inc. (US)
26
Globa
lJo
urna
lof
Scienc
eFr
ontie
rResea
rch
V
olum
eXIII
XII
Issue
e
rsion
IV
IIYea
r
2013
B)
)
0
5
10
15
20
25
0 2 4 6 8 10 12 14
% S
olub
ility
pH
Series1
Series2
Series3
Series4
Series5
Figure 10 : Protein solubility (%) vs pH at different NaNO3 concentrations in dehulled sample
Figure 11 : Protein solubility (%) vs pH at different Na2SO4 concentrations in whole seed sample
Food Properties of Hull, Dehulled and Whole Seed Samples of Bambara Groundnut (Vigna Subterranea L. Verdc)
0
2
4
6
8
10
12
14
0 2 4 6 8 10 12 14
% S
o lub
ility
pH
Series1
Series2
Series3
Series4
Series5
27
Globa
lJo
urna
lof
Scienc
eFr
ontie
rResea
rch
V
olum
eXIII
XII
Issue
e
rsion
IV
IIYea
r
2 013
© 2013 Global Journals Inc. (US)
B)
)
0
2
4
6
8
10
12
14
0 2 4 6 8 10 12 14
% S
olub
ility
pH
Series1
Series2
Series3
Series4
Series5
Figure 12 : Protein solubility (%) vs pH at different Na2CO3 concentrations in whole seed sample
Figure 13 : Protein solubility (%) vs pH at different Na2SO3 concentrations in whole seed sample
Food Properties of Hull, Dehulled and Whole Seed Samples of Bambara Groundnut (Vigna Subterranea L. Verdc)

0
2
4
6
8
10
12
0 2 4 6 8 10 12 14
% S
olub
ility
pH
Series1
Series2
Series3
Series4
Series5
© 2013 Global Journals Inc. (US)
28
Globa
lJo
urna
lof
Scienc
eFr
ontie
rResea
rch
V
olum
eXIII
XII
Issue
e
rsion
IV
IIYea
r
2013
B)
)0
2
4
6
8
10
12
14
0 2 4 6 8 10 12 14
% S
o lub
ility
pH
Series1
Series2
Series3
Series4
Series5
Figure 14 : Protein solubility (%) vs pH at different CH3COONa concentrations in whole seed sample
Figure 15 : Protein solubility (%) vs pH at different NaNO3 concentrations in whole seed sample
Food Properties of Hull, Dehulled and Whole Seed Samples of Bambara Groundnut (Vigna Subterranea L. Verdc)