food markets in the time of conflict
TRANSCRIPT


FOOD MARKETS IN THE TIME OF CONFLICT
AND CHOLERA
Rapid Market assessment in Yemen (Sana’a, Hodeidah and Hajjah)
Authors: Oscar Maria Caccavale, Tobias Flämig, and Channon Hachandi
Published in April 2018 - Data collected in November 2017
For additional information, please contact:
WFP Yemen
Inge Breuer, Head of Programme
Zulfiqar Ali, Head of Supply Chain
Ally-Raza Qureshi, Deputy Country Director
WFP Headquarters
Oscar Maria Caccavale, Economist and Market Analyst
Tobias Flämig, Head of Economic and Market Analysis Unit
Channon Hachandi, Supply Chain Officer
Arif Husain, Chief Economist & Deputy Director Policy and Programme Division
All rights reserved. The reproduction and dissemination of material in this information product for educational or
other non-commercial uses is authorized without any prior written permission from the copyright holders, pro-
vided the source is fully acknowledged. Reproduction of material in this information product for resale or other
commercial purposes is prohibited without written permission. Applications for such permission should be ad-
dressed to the Director, Communications Division, e-mail: [email protected]
© WFP 2018
World Food Programme
Via Cesare Giulio Viola, 68/70 - 00148 Rome - Italy
http://vam.wfp.org [email protected]

FOOD MARKETS IN THE TIME OF CONFLICT AND CHOLERA
iii
Table of Contents
Table of Contents ............................................................................................................................... iii
List of Figures ...................................................................................................................................... iv
List of tables ......................................................................................................................................... iv
List of maps ........................................................................................................................................... v
Acknowledgements ............................................................................................................................ vi
Acronyms ............................................................................................................................................. vi
Executive summary .......................................................................................................................... vii
1. Introduction ...................................................................................................................................... 1
2. Yemen’s political and economic situation at a glance ................................................................ 3
2.1 Setting the stage.......................................................................................................................... 3
2.2 Economic constraints and foreign exchange shortages ........................................................ 5
3. Food production, imports and stocks ......................................................................................... 10
3.1 Food imports ............................................................................................................................. 10
3.2 Other sources of food .............................................................................................................. 13
4. Supply chain ................................................................................................................................... 15
4.1 Commercial supply chain ....................................................................................................... 15
4.2 Supply challenges .................................................................................................................... 19
5. Price analysis .................................................................................................................................. 20
5.1 Price trends ............................................................................................................................... 20
5.2 Minimum expenditure basket ................................................................................................ 22
5.3 Price triggers ............................................................................................................................. 25
6. Concluding remarks and recommendations .............................................................................. 28
Bibliography ....................................................................................................................................... 32
Annex I - Sources of food .................................................................................................................. 34
Annex II - Price forecasts and Alert for Price Spikes (ALPS) ....................................................... 36
Annex III - fMEB ................................................................................................................................ 37
Annex IV - Vector Error Correction Model .................................................................................... 40

FOOD MARKETS IN THE TIME OF CONFLICT AND CHOLERA
iv
List of figures
Figure 1 - USD/YER exchange rate .................................................................................................... 6
Figure 2 - USD/YER depreciation, July 2016 to February 2018 ...................................................... 6
Figure 3 - Remittances as share of GDP ............................................................................................ 7
Figure 4 - Flow of currency exchange ............................................................................................... 8
Figure 5 - Wheat stocks and depletion time ................................................................................... 11
Figure 6 - Food imports and grains by port ................................................................................... 12
Figure 7 - Retail Supply Chain Integration Indicator ................................................................... 15
Figure 8 - Wheat profit margins ....................................................................................................... 17
Figure 9 - Diesel in Sana'a, Aden and Hodeidah ........................................................................... 21
Figure 10 - Wheat flour in Sana'a, Aden and Hodeidah ............................................................... 21
Figure 11 - Non-food items vs. wheat flour price increases in Sana’a ........................................ 22
Figure 12 - Cost of the monthly nominal fMEB in Sana’a ............................................................ 24
Figure 13 - Cost of the monthly real fMEB in Sana'a .................................................................... 24
Figure 14 - Expenditure-based fMEB by city ................................................................................. 24
Figure 15 - Expenditure-based fMEB in Sana'a, Aden and Hodeidah ....................................... 25
Figure 16 - Local production (in metric tons) by commodity, 2012–2016 .................................. 34
Figure 17 - Year-on-year percentage change in local production by commodity, 2012–2016 . 35
Figure 18 - Year-on-year percentage change in cultivated area by commodity, 2012–2016 .... 35
Figure 19 - Forecasts and ALPS ........................................................................................................ 36
Figure 20 - Average required transfer value adjustment in 2017 ................................................ 39
Figure 21 - Impulse monthly and cumulative (dash lines) responses on wheat flour prices . 42
List of tables
Table 1 - Monthly food rations for households ............................................................................... 5
Table 2 - Beneficiaries by assistance type in Hajjah, Hodeidah and Sana'a governorates,
August 2017 .......................................................................................................................................... 5
Table 3 - Remittances by country in USD (millions), 2010-2016 .................................................... 8
Table 4 - Value of cereal imports in USD (thousands), 2010-2015 .............................................. 10
Table 5 - Wheat supply sources ....................................................................................................... 13
Table 6 - Milling and silo storage capacity ..................................................................................... 16
Table 7 - Breakdown of wheat profit margins ............................................................................... 18
Table 8 - Top 20 month-on-month price increases for fuel and cereals ...................................... 20
Table 9 - Sana’a wheat flour price response to triggers - Orthogonal impulse response ........ 27
Table 10 - WFP in-kind commodities (in metric tons) brought into Yemen 2010-2017............ 34
Table 11 - Relative poverty lines and headcount ratio in 2016 .................................................... 37
Table 12 - Per capita share of total expenditure by expenditure group ..................................... 37
Table 13 - Per capita share of food expenditure by food group .................................................. 38
Table 14 - Caloric contribution rescaled to (approximately) 2,100 kcal ..................................... 38
Table 15 - Revised fMEB weights..................................................................................................... 39

FOOD MARKETS IN THE TIME OF CONFLICT AND CHOLERA
v
Table 16 - Unit root test ..................................................................................................................... 40
Table 17 - Number of lags ................................................................................................................. 40
Table 18 - Co-integration test ........................................................................................................... 41
Table 19 - VECM results .................................................................................................................... 41
Table 20 - Diagnostic 1 (residuals tests) .......................................................................................... 41
Table 21 - Diagnostic 2 (autocorrelation) ........................................................................................ 42
Table 22 - Diagnostic 3 (stability) ..................................................................................................... 42
Table 23 - Diagnostic 4 (causality) ................................................................................................... 42
List of maps
Map 1 - Areas of control ...................................................................................................................... 4
Map 2 - Yemen entry points and most important markets .......................................................... 13

FOOD MARKETS IN THE TIME OF CONFLICT AND CHOLERA
vi
Acknowledgements
This study was prepared by Oscar Maria Caccavale, Tobias Flämig and Channon Hachandi.
The authors are grateful to WFP staff in the Yemen Country Office in Sana’a and in the Sub-
Office in Hodeidah: colleagues from Management, Programme, Supply Chain, Field Security,
and Administration units showed a high level of commitment in supporting this assessment.
We appreciate in particular the support received by the Vulnerability Analysis and Mapping
team.
The report benefited from comments by Susanna Sandström, Levan Tchatchua, Brett Hanley,
Ally-Raza Qureshi and Mira Baddour. The report was edited by Zoë Hallington.
The authors wish to thank all the traders, port authorities, members of institutions, local au-
thorities and financial institutions and other UN organizations for their willingness to be in-
terviewed and for providing valuable information and data.
The views in this report and any errors and omissions are those of the authors.
Acronyms
CBY Central Bank of Yemen
EFSNA Emergency Food Security and Nutrition Assessment
EMOP Emergency Operations
FAO Food and Agriculture Organization of the UN
fMEB Food Minimum Expenditure Basket
FSAC Food Security and Agriculture Cluster
GDP Gross Domestic Product
GPC General People's Congress
IPC Integrated Food Security Phase Classification
MEB Minimum Expenditure Basket
SAR Saudi rial
UAD United Arabic Emirates dirham
UAE United Arabic Emirates
USD United States dollar
WFP World Food Programme
YER Yemeni rial

FOOD MARKETS IN THE TIME OF CONFLICT AND CHOLERA
vii
Executive summary
The crisis in Yemen is among the most serious and complex in the world. Over 7 million peo-
ple are assisted by the World Food Programme (WFP), mostly through in-kind food assis-
tance, but also through a commodity voucher programme1 and nutrition activities.
In November 2017, rapid market assessments were conducted in Sana’a, Hodeidah and Hajjah
to evaluate a potential scale-up of the current voucher system and the feasibility of introduc-
ing cash-based transfers to broaden the portfolio of food assistance programming.2
Despite the uncertainty related to the conflict, the overall market situation seemed sufficiently
stable for conducting a market assessment. However, in November and December 2017, the
conflict changed rapidly, leaving the humanitarian community with the challenge of under-
standing and quantifying the changing needs of the most vulnerable people, and quickly
adapting their operations to the new situation.
This report presents three possible scenarios. The first is the ‘baseline scenario’, which reflects
conditions up until October 2017; the second is the ‘blockade scenario’, which arose in No-
vember 2017 when airport and seaport access to and from northern Yemen was closed; and
the third is the ‘crisis scenario’, referring to when armed clashes burst out in the streets of
Sana’a in December 2017, which led most humanitarian organizations to temporarily redeploy
some of their staff.
Under the ‘baseline scenario’, despite all challenges faced by the commercial sector, the mar-
ket environment in the assessed locations seemed vibrant enough to support a gradual scale-
up of value-based vouchers, mainly in Sana’a city. It could possibly support a gradual shift to
cash-based interventions using the existing network of traders. The challenges identified were
primarily associated with the substantial economic slowdown and the fragile business envi-
ronment, in which the Central Bank of Yemen is split into two independent ‘branches’ that
pursue different monetary policies, and the commercial banking system is scarcely able to
support the private sector. Traders often bypass banks in favour of the more agile money-
exchanger system, which is mostly based on remittance flows. Yet worrying levels of local
currency depreciation challenge all business activities. UN agencies contended with signifi-
cant exchange rate losses, especially before working at a negotiated exchange rate.
Nonetheless, some food importers have been able to establish strong business models and
control the market almost entirely. They allow a large flow of goods to reach Yemen through
three main ports of Aden, Hodeidah and Al Saleef, irrespective of depressed demand. In fact,
despite the general perception that nominal prices were increasing, real prices actually stayed
put for most of 2017 – a clear consequence of low purchasing power. The main food security
1 Commodity vouchers are distributed to WFP retailer networks in urban and peri-urban areas. Under
this modality, WFP beneficiaries living in these areas redeem the vouchers distributed by WFP’s coop-
erating partners to obtain food rations at the closest participating retail outlet linked to WFP’s Yemeni
food service provider. 2 A broader trader survey was planned but remains on hold.

FOOD MARKETS IN THE TIME OF CONFLICT AND CHOLERA
viii
constraint in Yemen until October 2017 was lack of economic access to food rather than poor
food availability. However, this observation only holds true for the ‘baseline scenario’.
When the blockade came into force, the situation changed dramatically. The most striking
effect was the almost immediate lack of fuel in the country, with diesel and petrol prices dou-
bling in some cases, as stocks were estimated to last for just a couple of weeks. By contrast,
wheat stocks were sufficient to meet consumption needs for three months, so the price rise for
wheat flour was more contained. However, the combination of the rising exchange rate and
fuel prices would make future food price rises more likely. According to our estimates, an
increase of 1 percent in diesel prices could trigger up to a 10 percent increase in the price of
wheat flour within six months in Sana’a. An appreciation of the US dollar would lead to a
3 percent increase in the same time frame. It is not clear how far the commercial sector could
adapt to this scenario, as the imposed move from the Red Sea ports to Aden would force them
to reorganize their supply chain, which would require political support unless they are one of
the few major importers operating in Yemen. In any case, the port of Aden does not seem
equipped to fully substitute the activities of the Red Sea ports on account of its limited capacity
of handling containers and the milling volume potential. If operations were to shift entirely to
Aden, WFP would have to evaluate the appropriateness of the current commodity voucher
system.
According to WFP price monitoring, both nominal and real prices rose significantly between
November 2017 and January 2018, suggesting that food supply chains have not yet adapted
to the new political situation. The cost of a broader food basket is also increasing, so the use
of cash-based transfers seems risky as traders may not be able to secure enough supply for
WFP’s caseload without the guarantee of additional profits, as is provided by commodity
vouchers. Aside from this consideration, the amount transferred with value-based vouchers
or the cash transfer should be adjusted every month to keep up with inflation, possibly with
different transfer values tailored to each governorate (although this latter recommendation
seems rather unlikely given the political situation).
In principle, the ‘crisis scenario’ does not appear to be conducive for the introduction of cash-
based transfers, nor for the scale-up of the current commodity voucher system. However, sav-
ing lives remains the imperative for WFP, so this conclusion must be carefully scrutinized.
Indeed, if the ‘crisis scenario’ lasted for months (or if it coincided with the ‘blockade scenario’),
it could become more and more difficult for WFP to maintain the current model with its blend
of in-kind food assistance and commodity vouchers; this would be challenging both for WFP
with the logistical difficulty of moving goods within the country but also for the private sector.
By contrast, the top five food traders are probably better placed to resume their operations
quickly, and as such maintaining the current network of traders could be vital to adjusting the
programme rapidly if the situation were to turn into one of the other two scenarios.
The recommendations of this report also include i) advocating for a resumption of the
monthly publication of the consumer price index (CPI) by the Central Statistical Office, ii)
expanding price monitoring to a broader minimum expenditure basket that encompasses non-
food items, iii) closely and systematically tracking changes in diesel prices and the exchange

FOOD MARKETS IN THE TIME OF CONFLICT AND CHOLERA
ix
rate, and iv) exploring closer collaboration with FAO to capture and maintain import and
stock data for staple commodities.

FOOD MARKETS IN THE TIME OF CONFLICT AND CHOLERA
1
1. Introduction
Yemen is in the third year of a convoluted civil war, with at least three internal parties in-
volved in the conflict, several terrorist and secessionist groups active mostly in the southern
governorates, and the direct or indirect involvement of other states in the region.
The humanitarian situation has been described as one of the biggest emergencies worldwide
and is forecast to require USD 2.96 billion in humanitarian aid in 2018 (OCHA, 2018). An un-
precedented cholera outbreak has swept through already exhausted communities, and many
people lack basic access to food. Meanwhile, the country is highly vulnerable to external
shocks because of its overdependence on imported food and its lack of access to foreign cur-
rencies.
Yemen is now suffering from increasingly intense conflict, coupled with restricted and dis-
rupted commercial and humanitarian import flows, population displacements, loss of liveli-
hoods and income, scarcity and high prices of fuel and food, and stressed market systems.
Emergency Operation 201068 of the WFP Yemen Country Office plans to deliver assistance to
9.1 million beneficiaries through general food distribution and nutrition interventions. In No-
vember 2017, 6.8 million severely food-insecure Yemenis received WFP emergency food as-
sistance through several different transfer modalities:3 6.1 million received in-kind food assis-
tance, while the remaining 700,000 were assisted through commodity vouchers.
Given the unpredictable security and political situation in Yemen, the introduction of market-
based interventions alongside traditional in-kind food distribution could give WFP additional
flexibility when delivering food assistance to people in need in areas where markets are func-
tioning. To inform WFP’s programme and operational decisions, a rapid market assessment
was conducted to determine the most appropriate food assistance modalities and the feasibil-
ity of market-based interventions in different governorates of Yemen.
A mission to Sana’a, with field visits to Hodeidah and Hajjah, took place in November 2017.
A national data collection exercise has been planned but can only take place once the situation
stabilizes. This report also uses the analysis of secondary data and key informant interviews.
There is an important caveat to this assessment: the political situation in Yemen has largely
deteriorated in the four weeks between the start of the study and the writing of the report.
With such a volatile situation, events could quickly unfold that significantly impact the nature
and likelihood of the scenarios explored here
In the remainder of the paper, we refer to three scenarios, which are characterized as follows:
1) ‘Baseline scenario’, which reflects the situation found at the start of the mission, when
a) the political situation in Sana’a was relatively stable except for occasional airstrikes
mostly targeting sensitive infrastructure; and b) despite significant damage to dock
infrastructure such as mobile cranes, and tedious coalition-induced procedures that
3 WFP, EMOP 201068 and WFP internal Yemen dashboard.

FOOD MARKETS IN THE TIME OF CONFLICT AND CHOLERA
2
delayed vessel berthing and pushed up demurrage costs, a relatively regular flow of
goods was reaching Sana’a.
2) ‘Blockade scenario’, which reflects the circumstances that arose when airports and
ports were closed in November 2017, namely a) airstrikes intensified in Sana’a and
several other locations in northern Yemen, and armed fighting increased; b) the Red
Sea ports were closed to commercial cargo in an attempt to divert commercial vessels
to Aden port,4 leaving access open to humanitarian actors only; and c) some goods
became increasingly scarce, particularly fuel, with soaring prices, parallel market ac-
tivities and massive queues at petrol stations.
3) ‘Crisis scenario’, which depicts a situation of escalating violence, as was seen at the
end of 2017 when a) violent conflict broke out in Sana’a, with street clashes erupting
in many neighbourhoods and civilians trapped in the middle; b) there was a tempo-
rary shut-down of most economic activities on top of the ‘blockade scenario’; and c)
humanitarian activities were rolled back.
The findings in the report mostly refer to the ‘baseline scenario’, and occasionally to the ‘block-
ade scenario’. The unfolding of the ‘crisis scenario’ in Sana’a is unpredictable and transitory;
at the time of writing, this scenario seems unlikely to permit the regular implementation of
emergency food assistance, and particularly not cash-based interventions.5
The paper is organized as follows: section 2 gives an overall picture of Yemen’s economic
situation, including insights into the availability of foreign currency, which is indispensable
for a sustained inflow of imported food. This section also tackles food availability in Yemen,
describing the trade corridors for imported food and providing some evidence for the contri-
bution made by local food. Section 3 describes supply chain actors and their business capacity
in more detail, while section 4 provides insights from different price analyses, in terms of
trend analysis of a revised minimum expenditure food basket and an econometric model to
understand the impact of different triggers on the price of wheat flour in Sana’a. The last sec-
tion contains concluding remarks and recommendations.
4 Indeed, at the beginning of the blockade, Aden port was also not working for several days. However,
it is reasonable to assume that the functioning of this port will not be at risk. 5 Cash-based transfers comprise value vouchers/cash transfers and related direct operational costs
(WFP, 2016).

FOOD MARKETS IN THE TIME OF CONFLICT AND CHOLERA
3
2. Yemen’s political and economic situation at a glance
2.1 Setting the stage
Yemen is in the midst of an unprecedented crisis. The situation is so complex because different
types of crisis have intertwined, engendering a humanitarian catastrophe. The list of chal-
lenges faced by the Yemeni people is staggering. Although investigating these crises in detail
is beyond the scope of this report, an overview of the major issues will set the stage against
which we will assess how markets are functioning.
Conflict
Until November 2017, the north of the country was largely controlled by an alliance between
the Houthis – a Zaydi Shia movement – and the former president Ali Abdullah Saleh, who
was supported by parts of the Yemeni military and the former ruling party, the General Peo-
ple's Congress. Meanwhile, “most of the south is controlled by forces that support the president, Abd
Rabbuh Mansour Hadi […], and that are backed by a Saudi-led coalition of mainly Arab states” (EIU,
2017). Heavy military operations between these two warring factions were ongoing at the time
of the assessment in Taiz, Hodeidah and Mareb, and airstrikes hit most of northern Yemen.
However, the actual control of the territory is quite fluid (Map 1): the former allies in northern
Yemen started armed clashes in Sana’a city that culminated with the death of Mr. Saleh in
December 2017, while some areas in the south remain under major threat from terrorism by
jihadi groups (e.g. Aden) (ICG, 2017).
Cholera
The collapse of basic services has left 16 million people with inadequate access to clean water,
sanitation and hygiene, contributing to an unprecedented national cholera outbreak, with
more than 900,000 suspected cases and 2,192 associated deaths.6 The governorates of Hodei-
dah, Hajjah and Amran have been worst affected (OCHA, 2017).
Economic slowdown
Even before the current crisis, Yemen was one of the poorest countries in the world and the
poorest in the Middle East and North Africa region. Nominal GDP, forecast at USD 15.4 bil-
lion for 2017, has shrunk by 57 percent since 2013 (EIU, 2017). The export of goods (mostly oil)
has collapsed completely, down by 93 percent within the same time frame, and imports have
more than halved (EIU, 2017). There is now a ‘twin gap’ (IMF, 2017) with increasing scarcity
of foreign exchange and lack of purchasing power, along with a fiscal deficit projected to reach
USD 3.5 billion, and an external financing deficit of USD 2.8 billion (World Bank, 2017). The
most striking result of the economic crisis is the suspension of the social welfare fund in 2015,
which previously covered over 1 million households (ODI, 2013). In addition to that “approx-
imately 1.25 million civil servants have not received salaries or have received them only intermittently
since August 2016” (OCHA, 2017). The economic challenges are explored in detail in the next
section, but it is worth noting here that “two market systems are operating semi-independently of
one another. Divided by the line of conflict, the north-west and central west of the country is supplied
6 Electronic Disease Early Warning System, 5 November 2017. Source: (OCHA, 2017).

FOOD MARKETS IN THE TIME OF CONFLICT AND CHOLERA
4
primarily by the port of Al Hodeidah, while the south-west of the country is supplied by the port of
Aden” (Reach, 2017).
Map 1 - Areas of control
Food insecurity
The IPC Technical Working Group7 estimated that between March and July 2017, 6.8 million
people were severely food insecure in Yemen, i.e. in IPC Phase 4 Emergency. An additional
10.2 million were classified in Crisis, creating a total of 17 million food-insecure people. In
November 2017, the Food Security and Agriculture Cluster reported that the severely food-
insecure population may have increased to 8.4 million people8 because of ongoing conflict,
civil insecurity, disrupted livelihoods, the non-payment of public servant salaries and severe
economic decline. This has led to a reliance on unsustainable and almost exhausted coping
strategies as well as poor food consumption and high malnutrition rates: wasting has sur-
passed emergency thresholds (>15%) in four governorates (WFP, 2017a). A further rise in the
numbers of food-insecure people seems likely, particularly under the ‘blockade scenario’ or
the ‘crisis scenario’. Seven governorates, including Hajjah, were in IPC Phase 4 in November,
and 10 governorates were in IPC Phase 3, including Sana’a governorate and Sana’a city.
7 The IPC analysis was also based on the 2017 WFP Emergency Food Security and Nutrition Assessment
(EFSNA). 8 OCHA press release, 27 November 2017.

FOOD MARKETS IN THE TIME OF CONFLICT AND CHOLERA
5
Humanitarian assistance by WFP
In April 2017, WFP launched a twelve-month emergency operation in Yemen: EMOP 201068.
In November 2017, the programme assisted 6.1 million people with in-kind food distributions
and 697,000 people with commodity vouchers.9,10 Through the vouchers, USD 58.6 million
was injected into the economy in 2017 in 23 districts using three networks of traders with over
120 retail outlets.
Due to funding shortfalls, beneficiaries have been divided into two categories. In October, all
3.4 million people in the top priority category received a 100 percent ration, giving them the
full entitlement of 2,100 kcal/day. The 3.6 million beneficiaries in second category received a
60 percent ration, equivalent to 1,260 kcal/day.11 The food basket for both in-kind and voucher-
based assistance contains wheat flour, vegetable oil, pulses and sugar (Table 1). In the gover-
norates of Sana’a, Hajjah and Hodeidah, WFP beneficiaries number 2.48 million, a quarter of
whom are receiving commodity vouchers (Table 2). In Sana’a city, a third of the 595,000 ben-
eficiaries are using vouchers.
Table 1 - Monthly food rations for house-
holds
Source: WFP, 2017
Table 2 - Beneficiaries by assistance type in Hajjah, Hodeidah and Sana'a
governorates, August 2017
Source: WFP, 2017
2.2 Economic constraints and foreign exchange shortages
The economic constraints facing Yemen are all too clear: the Central Bank of Yemen (CBY) is
struggling to operate, and the malfunctioning bank system is failing to support the commer-
cial sector through the issuance of ‘letters of credit’ to importers.12
The CBY deals with monetary policy and is also tasked with paying public sector salaries,
ensuring liquidity to the bank system and paying interest on treasury bills – i.e. debt service.
Yet salary payments have been delayed since mid-2016,13 the bank is no longer able to provide
support to importers, and access to deposits (also in commercial banks) has become increas-
ingly difficult.
Although formally the CBY remains an independent body, the shift of the bank headquarters
from Sana’a to Aden undermined its functioning capacity. In 2017, a significant amount of
9 “WFP is now using commodity vouchers as a stand-alone modality separate from in-kind transfers and cash-
based transfers. They can be converted easily to cash-based transfers to expand beneficiary choice” (WFP, 2016). 10 This was down from 6.5 million and 855,000 beneficiaries respectively in the previous month. 11 The prioritization and related geographic distribution is currently under review by the WFP Country
Office. 12 “Small volume importers also find it increasingly difficult to access letters of credit and correspondent banks”
(World Bank, 2017). 13 The value of the monthly payments due is estimated at YER 70 billion.
Ration 100% 60%
Wheat flour (1kg) 75 50
Pulses (1kg) 10 5
Vegetable oil (1litre) 8 4
Sugar (2.5kg) 3
Modality Beneficiaries Share of total
GFD (100% of the ration) 638,200 26%
GFD (60% of the ration) 1,216,800 49%
CV 626,800 25%
Total 2,481,800

FOOD MARKETS IN THE TIME OF CONFLICT AND CHOLERA
6
Yemeni rials had been “printed in Russia and arrived in Aden to help pay public-sector sala-
ries” (EIU, 2017) ; this risks destabilising the local currency even further with the continuous
and uncontrolled exchange of the new money for US dollars and greater pressure on prices.
Meanwhile, CBY in Sana’a reportedly no longer has a swift code to allow external transfers,
so its operational capacity is limited.
In the recent past, the
CBY somehow managed
to stabilise the Yemeni
rial against the US dollar
at a rate of YER 215 per
US dollar14 until March
2016, particularly by us-
ing hard currency re-
serves. In April 2016, the
CBY devalued the official
exchange rate to YER 250
to close the spread with
the parallel market rate
(Figure 1). Since October
2017, the rial has practi-
cally been in free fall:
compared to mid-2016,
it has lost more than 40
percent of its value (Fig-
ure 2). 15
In the first half of No-
vember 2017, the cost of
USD 1.00 jumped from
YER 405 to roughly
YER 440. At the time of
the assessment, key in-
formants said the ex-
change rate was likely to
approach YER 500/USD
in the near future, with consequences for the cost of imports and thus the prices of all goods.
Indeed, the resistance level of YER 500/USD was reached in the second week of January 2018,
although the announcement of an injection of cash from Saudi Arabia has temporarily boosted
the Yemeni rial since then.
In this context, UN agencies face significant exchange rate losses, since they are bound to work
at a negotiated exchange rate which does not necessarily capture the difference between the
official and the parallel rate.
14 Official Fx for Central Bank of Yemen, exchange rate as at Tuesday 19 December 2017. 15 The exchange rates in the report follow the price quotation system (USD/YER, also known as direct
quotation).
Figure 1 - USD/YER exchange rate
Source: WFP
Figure 2 - USD/YER depreciation, July 2016 to February 2018
Source: WFP
0%
10%
20%
30%
40%
50%
60%
0
100
200
300
400
500
600
7 8 9 10 11 12 1 2 3 4 5 6 7 8 9 10 11 12 1 2
2016 2017 2018
SP
RE
AD
US
D/Y
ER
Spread Sana'a rate UN rate

FOOD MARKETS IN THE TIME OF CONFLICT AND CHOLERA
7
In fact, the spread widened to almost 50 percent in August 2017, when the UN started nego-
tiating with commercial banks for a phased departure from the CBY rate to close the gap for
a short period. The reasons for the crushing exchange rate are manifold and range from the
malfunctioning banking system and the large trade deficit to the conflict itself and the result-
ing blockade of air and seaports in November 2017.
Protecting the value of the local currency is critical to purchasing essential goods from abroad.
Since Yemen is heavily dependent on imported food, petroleum products and other non-food
items, it relies on foreign currency reserves, which are predominantly in US dollars, Saudi rial
(SAR), and United Arabic Emirates dirham (UAD). According to key informants, the total
monthly foreign currency requirements amount to USD 260 million, including USD 80 million
for wheat and other cereals, USD 40 million for soya/fodder, and USD 140 million for petro-
leum products.
In order to pay foreign suppliers, importers and other businesses have moved foreign ex-
change transactions almost entirely to the informal market, since the banking system can only
meet around 40 percent of the forex demand through the four major banks.16 Money exchange
agents fill the gap: reportedly, 15 major money exchange companies handle between USD 5
million and USD 15 million in remittances every month. There are also 400 smaller agents,
some of whom are informal (hawala), who could exchange up to USD 136,000 a month each.
Remittances from work-
ers abroad are the life-
line keeping the econ-
omy afloat and sustain-
ing families in Yemen.
They are estimated to
reach USD 3.4 billion a
year – or 12 percent of
GDP in 2016 (Figure 3).
Around 62 percent of re-
mittances arrive from
Saudi Arabia, and 18
percent come from the
United Arab Emirates
(Table 3).17 The flow from Saudi Arabia is increasing and continues to be the dominant source,
but the other Gulf states have been catching up since 2013 and now represent almost one third
of all remittances to Yemen.
16 Namely, the International Bank of Yemen, Tadhamon International Islamic Bank, Kuwait Bank, and
Cooperative & Agricultural Credit Bank (CAC). 17 The remainder of remittances in 2016 came from Kuwait and Qatar (5 percent each), the United States
of America (4 percent), Israel (2 percent), Bahrain, Libya and United Kingdom (1 percent each). Source:
World Bank, Migration and Remittances data.
Figure 3 - Remittances as share of GDP
Source: World Bank
0%
5%
10%
15%
20%
25%
30%
-
5,000
10,000
15,000
20,000
25,000
30,000
35,000
40,000
45,000
50,000
1990 1992 1994 1996 1998 2000 2002 2004 2006 2008 2010 2012 2014 2016
Sh
are
US
D m
illio
n
Remittances as a share of GDP Remittances GDP

FOOD MARKETS IN THE TIME OF CONFLICT AND CHOLERA
8
This means that the bulk of foreign
currency does not physically enter
the Yemeni market. Importers on
the other side bring their proceeds
in local currency to the money ex-
changers and obtain foreign cur-
rency credited abroad, which ena-
bles them to pay their suppliers.
The same flow applies for other
currencies, e.g. for purchasing pe-
troleum products. The fact that de-
mand for the dollar is much higher
than the supply contributes to exchange rate destabilisation.
Figure 4 maps the currency flow through the money exchange system.
Figure 4 - Flow of currency exchange
Source: Authors’ interviews with key informants. Note: green arrows represent USD, orange arrows show YER, and black arrows
indicate goods
There are two circuits, one for foreign currencies (mostly USD but also SAR), and one for the
Yemeni rial. The former remains almost entirely in branches abroad, with limited amounts of
dollars physically transferred to Yemen. Households receive the equivalent in YER of this
remittance flow and spend it locally. Some remittance recipients may ask for USD, particularly
in northern Yemen, but this increases the pressure on the exchange rate since dollars are
scarce.
Together with other income, this money provides some purchasing power and supports the
demand for goods and services. The importers, who take the bulk of the profits along the
Money transfer branch abroad
(e.g. Dubai)
Money transfer branch in Yemen
Demand for imported goods
Commodities purchaseand transportation
Remittances sent from abroad
Financial transaction between the two branches
Proceedsin YER
Market system
Remittances receivedin YER
Supply of imported goods
Payment in US$
Table 3 - Remittances by country in USD (millions), 2010-2016
Source: World Bank
2010 2011 2012 2013 2014 2015 2016
Saudi Arabia 1,171 1,079 1,142 2,089 2,074 2,074 2,062
United Arab Emirates 104 96 102 544 558 572 590
Qatar 0 0 0 153 157 158 165
Kuwait 0 0 0 167 165 157 158
United States 101 94 99 131 132 132 132
Israel 73 67 71 69 69 69 68
United Kingdom 26 23 25 38 38 39 38
Bahrain 2 2 2 42 43 43 41
Libya 0 0 0 42 38 38 34
Others 45 40 42 70 69 70 64
Total 1,522 1,400 1,483 3,343 3,343 3,351 3,351

FOOD MARKETS IN THE TIME OF CONFLICT AND CHOLERA
9
value chain (see Figure 8 in the next section), are then able to reinvest part of their revenues
to purchase goods from abroad and organize shipments in the country. Since the financial
system is so weak, these traders must pay a large amount in advance, using dollars only. To
do so, they obtain hard currency from money transfers. In physical terms, the money supply
in YER generated through the market system turns back to the money exchangers and is even-
tually used to pay remittances to households, while the equivalent in dollars is transferred
abroad. Other actors are also pivotal in this system, even though they are not portrayed in
Figure 4. In fact, the dollars spent in the country by UN agencies and international NGOs are
crucial to increasing the overall availability of dollars, thus partially compensating for shrink-
ing oil revenues.

FOOD MARKETS IN THE TIME OF CONFLICT AND CHOLERA
10
3. Food production, imports and stocks
Although anecdotal in nature, the assessment visits to local wholesale and retail markets in
Sana’a, Hodeidah and Hajjah gave the impression of sufficient availability of both fresh and
staple foods. Except for wheat and wheat flour, the retailers interviewed were confident of
continued supplies. However, the visits took place before the blockade; for the following few
months we have to rely entirely on WFP’s price monitoring system for insights based on price
availability. This section examines the situation of imported food and other sources of food
including local production.
3.1 Food imports
Yemen imports large volumes of food, particularly wheat, rice, soybeans and sugar, but also
most of the dairy items, oil and other processed foods consumed in the country. Even so, food
imports represented just 9 percent of the value of total imports in 2015 (latest data available
from UN Comtrade, see Table 4).
Table 4 - Value of cereal imports in USD (thousands), 2010-2015
Source: UN Comtrade, retrieved from World Bank – World Integrated Trade Solution (WITS) website
The total value of imports plummeted in 2015, dropping by 44 percent compared with 2014
and 34 percent lower than the five-year average (2010–2014). Food imports also fell in 2015,
although at a slower pace: down 28 percent from 2014 and 26 percent below the five-year av-
erage.
Considering the large volumes of imports handled by Yemen’s ports before the crisis, current
port capacity is unlikely to be a limiting factor on the quantity of food imported. Despite the
partial destruction of port facilities, food imports represent such a small share of total imports
– which have themselves fallen dramatically – that remaining capacity should be sufficient to
manage them.
According to FAO data, wheat grain imports comprise the bulk of food imports, amounting
to 69 percent in 2017, followed by rice (10 percent) and sugar (10 percent) (Figure 6). Annual
2010 2011 2012 2013 2014 2015
Wheat and meslin 708,594 961,921 983,809 1,048,449 1,060,312 811,336
Rye - - - - - -
Barley - - 4 - 0 14
Oats 482 416 505 697 276 1,433
Maize (corn) 103,146 153,173 154,374 145,381 308,394 132,741
Rice 247,631 239,182 346,284 363,140 384,409 313,330
Grain sorghum 91 - 41 - - 35
Buckwheat, millet and canary seeds; other cereals 2,968 3,747 6,043 7,934 11,022 8,002
Total cereals 1,062,912 1,358,439 1,491,059 1,565,601 1,764,413 1,266,890
Foodstuff 1,687,552 2,045,004 2,251,924 2,343,797 3,306,275 1,725,976
Total 18,491,169 21,424,892 23,302,733 19,766,663 25,849,434 14,374,807
Cereal imports as a share of foodstuff imports 63% 66% 66% 67% 53% 73%
Cereal imports as a share of total imports 6% 6% 6% 8% 7% 9%

FOOD MARKETS IN THE TIME OF CONFLICT AND CHOLERA
11
wheat imports averaged 2.8 million metric tons between 2008 and 2017.18 After a peak of 3.4
million metric tons in 2014, imports fell by 18 percent in 2015 and by a further 15 percent in
2016. They partially rebounded in 2017, although data are only available for the first three
quarters of the year. Assuming a monthly consumption of 250,000 mt of wheat (World Bank,
2017), the stocks in the country are estimated to have been slightly above 800,000 mt at the
end of October 2017, enough to last for 3 months (or 97 days).
Figure 5 - Wheat stocks and depletion time
Source: Wheat imports from FAO; depletion days and stocks from authors’ calculations
In section 5, we refer to the time needed to exhaust monthly final stocks as ‘depletion days’,19
and we model it with wheat flour prices. At the beginning of the blockade, WFP conducted a
rapid internal assessment for contingency purposes,20 to understand the overall stocks held
by traders in the country. The study revealed that wheat stocks would last for 98 days, in line
with Figure 5. Stocks declined between mid-2015 and the end of 2016, which is reflected in
higher price volatility (see Figure 11 and Figure 12 in section 5). Since then, and until the
blockade, traders seemed to have built up their stocks, which is also seen in the relatively
stable prices captured by WFP’s monitoring system.
18 Data for 2008 to 2015 come from the Ministry of Trade and Industries government focal units, col-
lected in 2016-17. Data for 2015 are reportedly slightly unreliable because of the conflict, while 2017
data reflect January to September only. 19 Depletion days are calculated from the final stocks (i.e. initial stocks plus the difference between
wheat imports and consumption) divided by daily requirements (i.e. 250,000/30). 20 WFP, Impact of the blockade on Yemen, 12 November 2017.
0
0.2
0.4
0.6
0.8
1
1.2
1.4
1.6
1.8
0
20
40
60
80
100
120
140
160
180
200
1 4 7 10 1 4 7 10 1 4 7 10 1 4 7 10 1 4 7 10 1 4 7 10 1 4 7 10 1 4 7 10 1 4 7 10
2009 2010 2011 2012 2013 2014 2015 2016 2017
Met
ric
ton
s (m
illio
ns)
Sto
ck d
eple
tio
n
in d
ays
MT_Wheat Depletion_days Stocks

FOOD MARKETS IN THE TIME OF CONFLICT AND CHOLERA
12
There are few entry
points for imported
goods into Yemen.
There are only six major
ports: Hodeidah, Al
Saleef and Ras Isa (also
called the Red Sea
ports), and Aden, Muk-
alla and Mokha in the
Gulf of Aden. The Red
Sea ports21 handle the
largest volumes of im-
ports: 61 percent of all
food imports22 to
Yemen in 2017 were channelled through Hodeidah, which processed an even larger share of
wheat grain imports – close to 75 percent. This may be attributed to the concentration of mill-
ing capacity in Hodeidah, the higher demand and shorter distance to the north of the country,
and the low fees for handling a 20-feet container compared to other ports in the area.23 There
is little information on port capacity and commodity inflow for Mukalla. Interestingly, this
port seems to manage almost all imported milk products (95 percent). In the absence of trend
data, it is not clear whether this is a long-term phenomenon or whether it is related to port
procedures or capacity issues. Nevertheless, despite the destruction of the mobile cranes in
Hodeidah in mid-2016, which halved the turnover capacity for handling container cargo, there
is little doubt of the critical role played by Hodeidah in Yemen’s food supply. This is also
supported by the fact that WFP moved almost 70 percent of its in-kind food assistance through
the Red Sea ports in 2017.
Overland supply routes are of limited significance, although they are important for processed
items such as dairy products and packaged goods. There are routes through Oman (Shahen
and Hawf land access points) and Saudi Arabia (Al Wadia land access point; the routes
through Sa’ada and Hajjah governorates are now closed).
21 These two ports are very close (70 km apart). Al Saleef has a maximum allowable draft of 13 metres
and two berths, while the maximum draft is 9.75 metres in Hodeidah for 8 multi-purpose berths and 2
oil terminals. The port of Aden “consists of the outer harbour, providing anchorage areas, the oil harbour […],
and the inner harbour”, with maximum allowable draft spanning 10.4-14.5 metres (source: Wilhelmsen
Ships Service). 22 This includes wheat grain, wheat flour, rice, sugar, cooking oil and milk products. Source: FAO FSIS-
FSTS Market Bulletin, October 2017. 23 According to the Hodeidah Port Captain, the fees for a 20-feet container are USD 100 in Hodeidah,
USD 125 in Aden, USD 145 in Djibouti and USD 160 in Djetta.
Figure 6 - Food imports and grains by port
Source: FAO
Wheat flour, 3%
Sugar, 10%
Rice, 10%
Cooking oil,
2%
Dairy products,
6% Hodeidah /
Al Saleef, 50%
Mukalla, 1%
Aden, 18%
Wheat grains, 69%

FOOD MARKETS IN THE TIME OF CONFLICT AND CHOLERA
13
Map 2 - Yemen entry points and most important markets
3.2 Other sources of food
Besides commercial imports, wheat supply in Yemen is complemented by local production
and food aid (i.e. commodities distributed by WFP which are either purchased or received as
in-kind donations). Table 5 shows the relative importance of the three wheat supply sources.24
Commercial imports make up the bulk of the available supply at slightly less than 90 percent
of the total. Over the last three years, the roles played by local production and food assistance
have switched: food assistance now represents almost 10 percent of the total, while local wheat
production has been falling for the past two years.
Table 5 - Wheat supply sources
Source: (ϕ) FAO, (τ) USDA, and (χ) WFP. Food aid data until October 2017
24 Including wheat flour.
2010 2011 2012 2013 2014 2015 2016 2017
Imported (ϕ) 2,600,205 2,858,334 2,975,933 2,955,202 3,387,049 2,775,046 2,348,337 2,866,495
Local production (τ) 265,000 232,000 250,000 233,000 192,000 165,000 96,000 90,000
Food aid (χ) 53,106 73,229 123,926 153,164 76,065 228,006 181,929 287,115
Total 2,918,311 3,163,563 3,349,860 3,341,366 3,655,114 3,168,052 2,626,266 3,243,610
Imported 89% 90% 89% 88% 93% 88% 89% 88%
Local production 9% 7% 7% 7% 5% 5% 4% 3%
Food aid 2% 2% 4% 5% 2% 7% 7% 9%

FOOD MARKETS IN THE TIME OF CONFLICT AND CHOLERA
14
Table 10 in Annex I gives a breakdown of in-kind food distributed in Yemen between 2010
and 2017,25 showing that wheat and wheat flour comprise an average 79 percent of the total.
The share of wheat from local production is normally below 30 percent.26 Despite the large
and widely cited import dependency, farmers in Yemen produce a range of foods such as
cereals, vegetables, fruit, legumes and cash crops, as well as qat and fodder. In 2016, the big-
gest crops in terms of cultivated area were cereals (520,000 hectares)27 followed by qat (167,000
hectares). According to figures from FAO, local cereal production in 2016 was 15 percent of
total supply (357,000 mt vs. 2.4 million mt of imported wheat). However, since 2012 local pro-
duction has dwindled, especially for cereals and vegetables. For qat, year-on-year changes in
quantity and area cultivated remain rather small and sometimes positive (Figure 16 to Figure
18 in Annex I). Although it could appear as if cereals are being substituted by more profitable
cash crops or qat, the data do not support this conclusion. Instead, the conflict seems to have
had an impact on food production itself. This is illustrated by the downward trend in cereal
yields, which is most likely caused by poorer input availability/access28 and displacement.
Since its role is pivotal, in the next sections we refer to imported food only.
25 Data until October 2017. 26 For the available data, this share was steady at 27 percent of total cereal production (2012–2016), ex-
cept in 2015 when it made up 36 percent of the total. 27 Wheat, sorghum and millet. 28 E.g. access to fuel for irrigation was limited. In addition, fertilizers are not allowed to be imported
due to sanctions.

FOOD MARKETS IN THE TIME OF CONFLICT AND CHOLERA
15
4. Supply chain
4.1 Commercial supply chain
Despite all the challenges to the commercial sector in Yemen, the supply chain for basic goods
is developed, especially in major urban settings; in fact, at the start of the assessment, markets
in Sana’a city were bustling and full of goods. Some 45,000 traders are registered in the Cham-
ber of Commerce & Industries in Sana’a, of whom 15,000 trade food, including importers,
wholesalers, retailers, millers and bakeries.
In Figure 7, an indicator was developed to represent the retail supply chain, both in terms of
retail development and supply chain efficiency.29 To provide context, we also plotted data
from other countries30 where a similar exercise has been carried out.
In Yemen, the retail market is less for-
mal than in Lebanon, Jordan and Tur-
key. Markets offer mostly dry goods
with a limited range of fresh products,
while competition is mostly on price
and less on value-added services (e.g.
service, quality and innovation in re-
tail). Payment methods are limited
and normally there are no credit op-
tions between main suppliers (import-
ers and/or milling factories) and
wholesalers, while occasionally de-
layed-payment arrangements up to 7-
10 days may be agreed between
wholesalers and retailers. In many
cases however, retailers have to pay in
advance before collecting goods
through bank transfer, money transfer
agents or in cash.
According to the Chamber of Commerce & Industries, Yemen has 200 to 300 large traders
capable of importing 1,000 or more containers a year. There are 300 medium-scale traders who
29 The former represents the significance of the formal, regulated retail sector in the market, whereas
the latter represents the maturity of the retail supply chain to deliver variety, quality, value-adding
services and innovation at a competitive price. After that, qualitative assessment values are assigned
from 1 to 10 on both axes, thus creating one reference point in the graph. 30 These countries are all part of the WFP’s regional bureau based in Cairo. They are interesting bench-
marks either because of their geographical proximity to Yemen (Jordan, Lebanon and Turkey) or be-
cause they are similarly torn by civil war (South Sudan).
Figure 7 - Retail Supply Chain Integration Indicator
Source: WFP
0
10
20
30
40
50
60
70
80
90
100
0 10 20 30 40 50 60 70 80 90 100
Ret
ail
Dev
elop
men
t
Supply Chain Efficiency
South Sudan
Turkey
Yemen
LebanonJordan

FOOD MARKETS IN THE TIME OF CONFLICT AND CHOLERA
16
bring in between 100 and 300 containers; a further 500 small-scale importers manage fewer
than 100 containers a year. However, the supply chain for imported food is dominated by five
large companies.
Although it is hard to obtain clear estimates of market share, our assessment confirmed the
market concentration findings of a previous study, when only four firms were found to hold
almost 90 percent of market share (WFP, 2010). These companies represent a large chunk of
the food market; the concentration is particularly visible for wheat.31
Indeed, while the wheat market remains an oligopoly, at least one major new food actor has
emerged in recent years – a sign of the food sector’s adaptation to the conflict economy. This
is quite important, as in general, traders operating in conflict areas may either need strong
political backing or face obstacles. Few traders – except perhaps for the major five – can easily
adjust their supply chains from the Red Sea ports to Aden (i.e. moving from the ‘baseline
scenario’ to the ‘blockade scenario’).32 The top five importers are based in Sana’a, with
branches in Aden or Hodeidah (including milling facilities) and potentially in other cities.
Wheat imports are stored in silos before milling at large mills. These have a daily milling ca-
pacity of 4,350 mt/day in Aden and 7,650 mt/day in Hodeidah and Al Saleef (Table 6). This
capacity is supplemented by medium-sized mills with a capacity of 100-200 mt/day (two in
Sana’a and six in Hodeidah) and small mills that could mill 10-20 mt each, but whose numbers
can only be estimated; in Sana’a, they are believed to number between 200 and 300. In other
words, the total monthly milling capacity could be estimated at 406,500 mt,33 which is 70 per-
cent more than the monthly consumption of wheat flour for Yemen.
Table 6 - Milling and silo storage capacity
Location Company
Milling
capacity
(tons/day)
Silo capacity
(tons) Source
Aden Aden Silos & Mills - Al Rowaishan Group 600 80,000 Logistic Cluster
Aden
Yemen Company for Flour Mills & Silos - Hayel Saeed
Anam (Al Sanabel) 3,750 170,000 Official website
Hodeidah
Mills Company Limited - Hayel Saeed Anam (Al Sana-
bel) 1,500 50,000 Official website
Hodeidah Red Sea Mills - Al Mohsen / Al Ahady 1,800 n.a. Logistic Cluster
Hodeidah
Yemen Company for Flour Mills & Silos - Hayel Saeed
Anam (Al Sanabel) 2,250 100,000 Official website
Saleef
Yemen International Food Industries Co. Ltd. - Al Hab-
bari Group 600 150,000 Official website
Saleef Fahem Group 1,500 120,000 WFP
Total 12,000
31 According to representatives of the Chamber of Commerce and Industries, two companies trade 70
to 80 percent of the wheat grain market. 32 This insight is confirmed by price developments up to January 2018, as described in section 5.1. 33 Assuming 280,500 mt from large mills, 36,000 mt from medium-sized mills and 90,000 mt from small
mills.

FOOD MARKETS IN THE TIME OF CONFLICT AND CHOLERA
17
Onward distribution of wheat flour, other staple food items and fast-moving consumer goods
is either through wholesalers, who mostly organize transport themselves, or through distrib-
utors who receive quotas from manufacturers and millers. The main traders control this flow
of goods, especially for wheat/wheat flour.34 The conflict economy requires more cash pay-
ment than before and thus more capital and certain levels of trust, which limits the range of
potential customers. Transport from Aden to Sana’a is interrupted by 15 to 20 checkpoints,
where fees are in the range of YER 5,000 to YER 10,000 per checkpoint depending on the load.
There are fewer checkpoints between Hodeidah and Sana’a (around 10) and thus the fees are
much less, as are the fuel costs given the shorter distance. Transport rates from Hodeidah/Al
Saleef to Sana’a are around USD 39/mt35 while from Aden they are estimated at USD 56/mt,36
clearly making the port of Hodeidah the best choice from a cost perspective for the north.
Finally, the retail network is very diverse, ranging from large supermarkets with over 2,000
stock-keeping units (SKUs) to medium-sized outlets and small shops or commodity-specific
retailers on open markets. Retailers source their goods from – even fairly distant –wholesalers,
depending on location and commodity: retailers in Hajjah might source perishable goods from
Sana’a or Hodeidah, while those in Sana’a might go to wholesale markets in the capital. Re-
tailers normally stock their shops with products to cover between a week and a month of sales,
and they arrange their own transport from supplier to shop. Several traders confirmed that
they are not willing to dispatch food to areas affected by the conflict but would rather have
traders from these locations arrange transport and take the full risk.
Profit margin analysis confirms the wheat market structure described above. Figure 8 shows
the wheat grain margins based on material costs alone because data on running costs were
not sufficiently accurate.
To calculate supply chain mar-
gins, we added all the costs in-
curred by each actor along the
supply chain to the cost of the
commodity at source. In this case,
starting from the ‘free on board’
(FOB) cost of wheat in Australia,
we considered ocean shipping
costs, port costs (including de-
murrage) and any other costs re-
lated to the supplier’s warehouse.
The data used to calculate the
supply chain margin are taken
34 Reportedly, in addition to imposing quotas, traders have been artificially limiting the supply of
wheat/wheat flour to the wholesale/retail network as a consequence of the high exchange rate volatility. 35 Calculated using a YER 250/50 kg bag at an exchange rate of YER 405/USD. 36 Source: WFP Supply Chain.
Figure 8 - Wheat profit margins
Source: WFP market assessment, key informants
80.0%
15.5%2.6% 1.9%
Cost Importer Wholesaler Retailer

FOOD MARKETS IN THE TIME OF CONFLICT AND CHOLERA
18
from one of the main wheat importers through Hodeidah and from a wholesaler and retailer
in Hajjah. This generates the commodity ‘cost’ in Figure 8 and Table 7. From that, we calcu-
lated the importer’s profit margin as the percentage difference between this cost and the price
at which the importer sells wheat flour to the wholesaler. The margins for the wholesaler are
similarly calculated as the percentage difference between the importer price and the price at
which the wholesaler sells to the retailer. Finally, the retail margins are calculated in the same
way.
The supply chain margins give an indication of which stage of the supply chain offers the
most opportunity for extracting efficiencies. It is also an indicator of the levels of competition
within the supply chain. The greater the competition in the supply chain segment, the lower
the margin. The importers have significantly higher margins in the wheat supply chain, which
reveals their strong bargaining position in the market and a lack of competition in the import
sector.
Table 7 - Breakdown of wheat profit margins
Source: WFP market assessment, key informants. (*) Exchange rate of YER 400USD; (**) worldfreightrates.com/freight

FOOD MARKETS IN THE TIME OF CONFLICT AND CHOLERA
19
4.2 Supply challenges
Supply chain actors, particularly retailers, highlighted several challenges to their regular sup-
ply. If wholesalers withhold wheat flour supplies because of highly volatile exchange rates
and a lack of foreign currency, retailers may not be able to restock regularly. Rapidly rising
buying prices force them to adjust their selling prices frequently, passing the cost on to con-
sumers. The latter then suffer from lower purchasing power, which reduces demand. Prices
are also affected by rising transport costs – a function of checkpoint fees as well as higher
premiums for war insurance (currently around 7 percent), fuel shortages and fuel price surges,
and demurrage costs caused by delays in the clearance process and reduced port handling
capacity. Particularly during the blockade, commercial cargo was diverted to Aden port,37 in-
creasing the cost of shipping and lead times. The situation could worsen if the restrictions on
commercial cargo are not lifted.
Reportedly, at the onset of the ‘blockade scenario’ a black market for wheat flour materialized,
which could have been stimulated by low wheat supply, reduced milling capacity and stock
hoarding by distributors.38
The customs fees normally paid at entry ports may occasionally be higher than the legislated
fees, as both the de-facto and the legitimate government invoice duties unless the fees are split
between Aden and Dhamar, the entry point to Sana’a city from the south. It has not been
possible to ascertain exactly how much traders have to pay and to whom if they want to im-
port food and circulate it within the country. In fact, traders seem to contradict each other,
most likely because there is room to make ad hoc agreements to ease trade. While wheat grain
and rice imports are exempt from customs, importers pay 5 percent for other cereals (e.g. rye,
barley, maize and sorghum) and up to 25 percent for millet.39 Surprisingly, full duties are
charged in Aden and Hodeidah; in these cases, no additional customs were due in Dhamar at
the time of the assessment.40 By contrast, the tariffs on goods entering via Mukalla port are
reduced to 40 percent to attract more customers, but in this case the balance has to be paid in
Dhamar.
When it comes to food assistance planning, three main challenges could have an impact on
the potential engagement of the retail sector. As highlighted in Figure 7, aside from some su-
permarkets in Sana’a, the Yemeni retail sector offers a basic range of dry goods with few fresh
products – a challenge to increasing dietary diversity. Secondly, a significant portion of the
37 According to Hodeidah Port Captain, the number of container cargos reaching Hodeidah has been
falling steadily since 2014. There were 147 in 2014, 84 in 2015, 62 in 2016 and only 27 in 2017 (data until
October 2017). Meanwhile, in Aden they increased from 115 in 2015 to 140 in 2017 (source: http://por-
tofaden.net/Statistics.aspx). 38 See also footnote 34. 39 Source: Yemen Customs, Section II Vegetable products. Customs tariffs for sugar are at 5 percent. For
food preparations of cereals, flour, starch or milk and pastry products, tariffs are 5–10 percent. For meat,
they are 10 percent, and for fish, 25 percent. 40 Reportedly, in 2018, customs in Dhamar have started charging duties even when taxes are fully paid
in Aden.

FOOD MARKETS IN THE TIME OF CONFLICT AND CHOLERA
20
retail sector is informal, which could make it difficult to establish legal contracts with retailers.
Lastly, point-of-sale checkouts are only found in supermarkets, limiting the potential for au-
tomated consumer demand analysis and stock management. This restricts the level of supply
chain integration and collaborative demand forecasting and planning between manufacturers
and retail outlets. It also minimizes the amount of price data that can be collected along the
supply chain.41
5. Price analysis
In this section we investigate how prices behave when moving from the ‘baseline scenario’ to
the ‘blockade scenario’ and the ‘crisis scenario’. We provide some indications to determine
transfer values if cash-based transfers are introduced and some insights into price generation
mechanisms.
5.1 Price trends
Most prices were fairly steady in 2017 until the port blockade unleashed substantial pressure
on markets; as a result, fuel prices skyrocketed during the first three weeks of November 2017.
Table 8 shows the highest month-on-month price changes from the baseline (October 2017)
recorded by WFP’s monitoring system in November and December 2017. Data are also shown
for January 2018 to give an indication of the effect on prices during the aftermath of the ‘block-
ade’ and ‘crisis’ scenarios: the fuel market (i.e. diesel and petrol) was out of control almost
everywhere in the country, as was clear from the extraordinarily long queues at the petrol
stations.
Table 8 - Top 20 month-on-month price increases for fuel and cereals
Source: WFP
Aden prices showed the highest month-on-month increases in November 2017 (up to 186 per-
cent), perhaps because this market is dominated by just one trader, while Hodeidah port has
ten fuel importers. The supply composition is critical to understanding fuel price volatility.
41 Various WFP departments and FAO all collect price data, supposedly for different purposes. This is
a potentially unnecessary use of resources when synergies could be harnessed to avoid duplicating
efforts and gathering incompatible information.

FOOD MARKETS IN THE TIME OF CONFLICT AND CHOLERA
21
Reportedly, the price spikes in Aden were more driven by monopolistic behaviour, whereas
in Hodeidah and in the other markets served by the Red Sea ports there was a mix of hoarding
and a temporary reduction in available stocks. According to a rapid assessment conducted in
mid-November, diesel was “estimated to run out in 20 days and petrol in 10 days in the northern
areas of Yemen”.42 These temporary shocks were short-lived but have left a permanent mark.
By the end of January 2018, diesel prices converged not only in Aden and Hodeidah, but also
in Sana’a (Figure 9), although at a much higher level compared with the baseline.
Figure 9 - Diesel in Sana'a, Aden and Hodeidah
Figure 10 - Wheat flour in Sana'a, Aden and Hodeidah
Source: WFP. The red vertical lines correspond to the onset of the ‘blockade’ and ‘crisis’ scenarios
Data from November 2017 to January 2018 seem to suggest that the importer in Aden is the
price setter, and the other importers adjusted to its level. All in all, fuel prices are more stable
but remain significantly higher than the baseline. The increase in food prices was generally
lower; when the ‘blockade scenario’ came into effect, the highest price rises for wheat flour
and rice were recorded in Amran and Sa’ada (25 percent). Meanwhile, in the towns visited
during the assessment wheat flour prices rose by 18 percent in Hajjah and Sana’a, by 12 per-
cent in Hodeidah and by 13 percent in Aden. Since then, prices have continued to increase in
several locations including in Sana’a, where wheat flour prices rose by 41 percent in January
2018 (Table 8 and Figure 10). This confirms that transport costs (including checkpoints, driv-
ers, fuel and truck rental) make a strong contribution in pushing up prices as wheat flour
travels from Hodeidah and Aden (where the bulk of the imported wheat is milled) to Sana’a
and elsewhere in the country. In January 2018, wheat flour was sold at YER 200/kg in Aden
and Hodeidah, but at YER 240/kg in Sana’a (Table 8). According to our forecasts,43 further
increases are likely in the coming months, pushing markets in Stress or Crisis conditions ac-
cording to the WFP Alert for Price Spikes (ALPS) indicator (Figure 19 in Annex II).44
42 OCHA, Yemen: Impact of the closure of sea, land and airports on the humanitarian situation, Update 2, 16
November 2017. 43 Based on the Holt-Winters seasonal method. 44 See http://dataviz.vam.wfp.org/economic_explorer/price-forecasts-alerts
0
100
200
300
400
500
600
700
800
Price
/Unit
2017w1 2017w13 2017w26 2017w40 2018w1
Sana'a Aden Hodeidah
Diesel, retail, 1 LT
0
50
100
150
200
250
Price
/Unit
2017w1 2017w13 2017w26 2017w40 2018w1
Sana'a Aden Hodeidah
Wheat Flour, retail, 1 KG

FOOD MARKETS IN THE TIME OF CONFLICT AND CHOLERA
22
5.2 Minimum expenditure basket
The Central Statistical Office has not released official inflation figures since 2014, so it is hard
to assess the real cost of living in Yemen.45 Most prices for non-food items have been on the
rise, thereby increasing household expenditures. Figure 11 shows what has happened in
Sana’a with cooking gas and diesel prices as compared with wheat flour.
Food expenditures represent an average 38 to 53 percent of household expenditure, depend-
ing on the governorate (see Table 12 in Annex III). In Aden food makes up 52 percent of house-
hold expenditure, while in Hodeidah, it is 49 percent. In Sana’a city, the share is 39 percent,
while in Sana’a governorate it is 42 percent.
The feasibility of moving from
commodity vouchers to cash-
based transfers is better assessed
by analysing expenditure break-
down to understand likely ex-
penditure patterns (for cash
transfers), and to help establish
the cost of a hypothetical food
basket to fine-tune transfer val-
ues (for cash and value-based
voucher transfers). Whenever
cash is considered as a possible
assistance modality, analysts
must try to understand what
people will buy with the money
provided. Not all the cash will go
on food, in spite of efforts to calculate a transfer value that covers a required intake of 2,100
kcal per person per day. Even though WFP beneficiaries are probably the most vulnerable
people and may devote a larger share of their expenditures to food, they also have to fulfil
other essential needs beyond food. This is true with general food distributions as well, when
beneficiaries sell food – particularly vegetable oil46 – in the market to satisfy other needs.
Because of this, we have moved away from the current food minimum expenditure basket
(fMEB),47 which is used to calculate the value of the full WFP ration of commodity vouchers
and to compare the cost of the five products provided as general food distribution (wheat
45 To the best of our knowledge, the Central Statistical Office has stopped reporting the consumer price
index, so no official inflation figures are available. 46 During the market visits, it was easy to find WFP-branded vegetable oil on sale in Sana’a and Hajjah. 47 The MEB in Yemen is “an indicator of the cost of the minimum, culturally appropriate items that a Yemeni
household of 7 individuals needs for one month, while meeting basic standards for nutritious food, water use and
hygiene” (Reach, 2017).
Figure 11 - Non-food items vs. wheat flour price increases in Sana’a
Source: WFP. The red vertical lines correspond to the onset of the ‘blockade’
and ‘crisis’ scenarios

FOOD MARKETS IN THE TIME OF CONFLICT AND CHOLERA
23
flour, sugar, vegetable oil, red beans and salt).48 Instead, we have adopted an expenditure-
based approach, using the most recent reliable data available at the governorate level. The
data come from the Emergency Food Security and Nutrition Assessment (EFSNA) conducted
between November and December 2016. We used the national poverty line per capita per
month at YER 10,913 in 2014, inflated to YER 13,770 applying an inflation rate of 16.5 percent
in 2015 and 8.3 percent in 2016.49 Using the expenditure module in the EFSNA, we calculated
the share of expenditures by expenditure group for the households falling below the gover-
norate relative poverty lines (Table 11 in Annex III). Through this, we obtained a revised food
MEB. Ideally, other items beyond food should be added to this fMEB to reflect the essential
needs of the most vulnerable households but this falls beyond the scope of this assessment.50
The poorest people in Sana’a city spend relatively less on food than those in other gover-
norates (39 percent), but they spend a considerable amount on services and shelter (see Table
12 in Annex III). Expenditure on qat and tobacco are also significant (11 percent). Of the 39 per-
cent spent on food, 15 percent goes on cereals (see Table 13 in Annex III). Expenditure on food
was over 50 percent of total expenditure in the governorates of Aden, Hadramaut and Ray-
mah; in Hajjah and Hodeidah, it was 49 percent. The lowest share of expenditure on cereals
was found in Aden and Mareb (15 percent each); among the other governorates, it was as high
as 31 percent in Raymah.
Despite the data limitations, we calculated the revised fMEB using both nominal and real
prices.51 52 When moving from the ‘baseline scenario’ to the ‘blockade scenario’, both the in-
kind-based and the expenditure-based nominal fMEB rise dramatically, mostly driven by
wheat flour (Figure 12). By contrast, the real fMEB graph in Figure 13 shows an almost flat
trend since early 2017, with a slightly less prominent increase during the ‘blockade scenario’,
and a more prominent rise thereafter, almost reaching levels seen in early 2016.
48 The fMEB is based on the five goods provided as in-kind assistance through the WFP food basket
(with their relative weight): wheat flour (10.714 kg), sugar (0.3571 kg), vegetable oil (1.0571 litres), red
beans (1.4286 kg), and salt (0.1429 kg). 49 Sources for the consumer price index are as follows: Saint Louis Federal Reserve Economic Data for
1996–2013 (yearly averages); and the Consumer Price Index Worksheet from the Central Statistical Of-
fice for October 2015 and October 2016, which is the latest worksheet that we could access. 50 In the absence of detailed expenditure data, a consensus-based constitution of the non-food item part
of the MEB would be the most feasible approach. Cooking gas and fuel would probably be part of this
MEB along with other goods and services. Price monitoring should include all MEB items. 51 Real prices are calculated as the ratio between nominal prices and CPI. 52 Nominal prices were deflated using the average yearly CPI described in the footnote above, and using
World Bank forecast for 2017. We fully acknowledge the limitations of deflating monthly prices using
yearly CPI.

FOOD MARKETS IN THE TIME OF CONFLICT AND CHOLERA
24
Figure 12 - Cost of the monthly nominal fMEB in Sana’a
Figure 13 - Cost of the monthly real fMEB in Sana'a
Source: WFP, authors’ calculations. The red vertical lines correspond to the onset of the ‘blockade’ and ‘crisis’ scenarios
An explanation for the flat pattern until October 2017 can be found in the lack of household
purchasing power that dampened demand, which left real prices unaffected by the supply
constraints described in the previous section.53 This is a sign that until the blockade, most of
the food security issues in the country were related to access rather than availability.
The revised expenditure-based fMEB is notably more expensive than the in-kind based one.
Moreover, it is probably an underestimation of the real expenditure of Yemeni households if
meat (including poultry) and fish were factored in the analysis. In terms of programming, this
could mean revising the full transfer value upwards, if cash or value-based vouchers are in-
troduced as a food assistance modality. Looking back at the period January to November 2017,
applying this revised fMEB would have meant a maximum average adjustment of 28 percent
in Aden and Hadibo. In Al Ghaidha, Hodeidah, Hajjah and Mareb, the adjustment would
have been slightly above 20 percent, whereas in Sana’a city it would have been 18 percent (see
Figure 20 in Annex III).
The different costs of living in
Yemen (Figure 14) also need to
be considered when determin-
ing the transfer value. In Octo-
ber 2017 there were two major
outliers – Sayoun and Mukalla
in Hadramout governorate –
where market information is
limited as the area is partially
controlled by Al-Qaeda
groups, and the food basket
seems to be extremely expen-
sive. Other than that, someone
living in Mareb or Aden in Oc-
tober 2017 would have needed
53 “Importers also report increased difficulties in selling the purchased imports in Yemen, citing the fall in purchasing power
as a primary reason” (World Bank, 2017).
Figure 14 - Expenditure-based fMEB by city
Source: WFP. Authors’ calculations
3000
4000
5000
6000
7000
8000
YE
R, m
onth
, 7
-pe
op
le h
ouse
ho
ld
Add
ale
h
Ade
n
Al B
aid
ha
Al G
ha
idha
Al H
aw
ta
Al H
azu
m
Al Jab
ee
n
Al M
a'a
fer
Am
ran
Attaq
Ban
i M
ata
r
Dha
ma
r
Had
ibo
Hajja
h
Hod
eid
ah
Ibb
Kita
f
Ma
hw
eet
Ma
reb
Mu
ka
lla
Sa'a
da
San
a'a
Sayou
n
Taiz
Zun
gu
ba
r
January 2018 October 2017

FOOD MARKETS IN THE TIME OF CONFLICT AND CHOLERA
25
to spend more than YER 4,000 a month to fulfil their minimum food intake; in Taiz and Had-
ibo the threshold was slightly lower. In January 2018, the cost of the fMEB shot up almost
everywhere, exceeding YER 4,000 in Attaq, Amran, Al Ghaidha, Mareb, Sana’a and Sa’ada.
Figure 15 shows how the fMEB was cheaper in Aden than in Sana’a before November 2017.
In January 2018, the cost remained almost unchanged in Aden, despite the serious volatility
in November and December 2017. However, in Sana’a and Hodeidah the cost of the fMEB
increased dramatically, demonstrating how successful the blockade policy was in reducing
the flow of goods into and from Hodeidah to the northern governorates.
Admittedly, in the current political situation it would be extremely challenging to reach a
consensus among the actors in the conflict to allow for different transfer values for different
governorates, even though that would be the ideal approach, at least in the medium term.
Figure 15 - Expenditure-based fMEB in Sana'a, Aden and Hodeidah
Source: WFP. Authors’ calculations. The red vertical lines correspond to the onset of the ‘blockade’ and ‘crisis’ scenarios
5.3 Price triggers
Adjusting rapidly to the different scenarios is not easy for households or humanitarian organ-
izations. The changes are unpredictable; few indicators are available and they have to be used
to extrapolate as much information pertaining to the broader food security context as possible.
Prices are among these indicators. We developed a simple econometric model to try to under-
stand the effect on wheat flour prices in Sana’a (i.e. response variable) if other indicators
change (i.e. triggers or impulse variables). These indicators are the exchange rate in Sana’a;
diesel prices in Sana’a; wheat flour prices in Hodeidah (being the major entry point for wheat
and the location of most of the key mills); and the depletion days of the monthly final stocks,

FOOD MARKETS IN THE TIME OF CONFLICT AND CHOLERA
26
if no additional vessels arrive in the country. The latter is useful in the scenario of a full block-
ade of the Red Sea ports, but it is also a good proxy to understand the overall availability of
imported wheat in the country.
During the ‘blockade scenario’, these three triggers were paramount:
a) the Yemeni rial crashed quickly, with demand for US dollars outstripping supply;
b) people were queuing at petrol stations to fill their cars and there were fears of an eco-
nomic stand-still when fuel stocks were estimated to last only two additional weeks;
and
c) with no commercial vessels allowed in any of the Yemeni ports, the estimation of re-
maining stocks became crucial.
All the prices/rates are weekly observations averaged over the month, except for November
2017, where we used the first three weeks only.54 Further details on the Vector Error Correc-
tion model used for the analysis are in Annex IV.
Overall, the results corroborate expectations; the drivers of rising wheat flour prices in Sana’a
are diesel prices, the exchange rate and the dynamics of wheat flour prices in Hodeidah. By
contrast, an increase in the number of days required to completely exhaust imported wheat
stocks relaxes wheat flour prices, as economic operators adjust their expectations based on
better overall availability of the commodity in the market. Table 9 shows how wheat flour
prices would react in the following six months if a change occurred in one of the triggers at
time zero.
None of the shocks would return to zero, meaning that the effects on the response variable
are permanent. Diesel prices seem to be the major driver of wheat flour price increases, par-
ticularly in the first two months when wheat flour prices would rise 2.8 percent following a
1 percent increase in the fuel price, and possibly reaching a cumulative effect of 10 percent
after six months. The exchange rate also has a higher impact in the first two months (up to
2.3 percent response following an increase of 1 percent); after three months, the effect becomes
more volatile, with a cumulative effect of 3 percent after six months.
Prices in Hodeidah influence price changes in Sana’a, with the biggest response occurring
after two months (2.6 percent) and a cumulative impact of 7 percent after six months. This
could be because traders are able to buffer their stocks or because the Aden route remains
open, even though it is not convenient for most traders. The interpretation of depletion days
is slightly different, because it is the only variable in levels and not in logarithms in our model.
54 The data source for all the prices is WFP VAM price monitoring system, while the source for depletion
days is FAO, based on official custom reports. Given the difficulty in obtaining reliable data on wheat
imports, we crosschecked the 2010–2015 data with the UN Comtrade database, revealing a good fit
between the two sources (on average, the monthly discrepancy was just 2 percent).

FOOD MARKETS IN THE TIME OF CONFLICT AND CHOLERA
27
Table 9 - Sana’a wheat flour price response to triggers - Orthogonal impulse response
Each unit of change here is approximately 24 days (i.e. the standard deviation), thus an in-
crease in the overall stocks of almost one month would timidly push wheat flour prices down
by 0.1-0.2 percent each month, with a cumulative effect of just 1 percent. Interestingly, alt-
hough higher wheat stocks relax wheat flour prices, the fall in wheat flour prices is not as
large as the increase driven by exchange rates and fuel; this is quite normal in economic terms,
as prices tend to adjust more rapidly to upward trends in the market, whereas they are slower
to respond to downward trends. Another reason is that, despite all the limitations, traders
dealing in wheat imports run consolidated businesses, and in the past they have proved able
to import adequate food stocks as long as the ports are functioning.
Response variable: Wheat flour price in Sana'a
Time
(in months)
Monthly Cumulative Monthly Cumulative Monthly Cumulative Monthly Cumulative
0 0.0% 0.0% 0.0% 0.0%
+1 2.7% 2.7% 1.1% 1.1% -0.1% -0.1% 0.5% 0.5%
+2 2.8% 5.6% 2.3% 3.4% -0.2% -0.3% 2.6% 3.1%
+3 1.8% 7.3% -0.9% 2.5% -0.1% -0.4% 0.1% 3.2%
+4 1.0% 8.3% -0.9% 1.5% -0.2% -0.6% 1.6% 4.8%
+5 1.0% 9.3% 0.5% 2.0% -0.2% -0.7% 1.8% 6.6%
+6 1.0% 10.4% 0.8% 2.9% -0.1% -0.9% 0.6% 7.2%
Note: Authors' calculation. Source: WFP-VAM price monitoring (wheat flour, petrol and exchange rate), and FAO (imported wheat)
Wheat flour price in
Hodeidah
Depletion days
(imported wheat)
Exchange rate
(USD/YER)
Fuel price in Sana'a
(diesel)

FOOD MARKETS IN THE TIME OF CONFLICT AND CHOLERA
28

FOOD MARKETS IN THE TIME OF CONFLICT AND CHOLERA
29
6. Concluding remarks and recommendations
An estimated 17.8 million people in Yemen are food insecure, of whom 8.4 million are thought
to face severe food insecurity (OCHA, 2017). The escalation of the crisis in northern Yemen
with the blockade of seaports and airports has made it more difficult to estimate the number
of people in need of humanitarian assistance, also considering the lack of up-to-date assess-
ment data.
Within just one month of the start of this study, at least three major scenarios emerged in
Yemen: 1) the ‘baseline scenario’, referring to the situation at the end of October 2017, which
had lasted since the beginning of the year; 2) the ‘blockade scenario’; and 3) the ‘crisis scenario’
with the outbreak of violence in Sana’a.
For security reasons, our field activities have been strictly limited in terms of the markets we
could visit (Sana’a, Hodeidah and Hajjah) and quality of the visits. The broader data collection
planned to provide insight into market functionality across the country has had to be post-
poned.
At the beginning of the assessment, under the ‘baseline scenario’, vulnerability to food inse-
curity was largely an issue of economic access. This is confirmed by empirical observations of
the amount and variety of goods available in the markets, particularly in Sana’a, as well as by
secondary data analyses. When considering real rather than nominal prices, the price trend
has clearly been stable if not declining since the beginning of 2017. Food stock estimates cor-
roborate this finding, as importers were able to build up their stocks from the lowest level
reached in December 2016 (53 days of consumption) to around 100 days in October 2017.
However, signs of pressure were evident in the markets even before the blockade. The Yemeni
rial depreciated dramatically against the US dollar, adding a foreign exchange gap on top of
the purchasing gap. The reasons for the depreciation are manifold and all connected to the
three years of civil war. The major drivers include the split of the central bank into two prac-
tically independent branches in Sana’a and Aden; and the weak bank system – partially sub-
stituted by the parallel money exchangers system – which cannot fully support the commer-
cial sector for imported food. In this regard, the assessment found a very thin food sector with
five main importers dominating the market. These five are the least affected by the situation,
whereas minor importers can barely cope with such a restricted operating environment. When
it comes to developing food assistance programmes involving the commercial sector in a war-
torn country, assessment should be made of the governance of markets in crisis, the major
actors and how their ‘constituency’ has been built. When humanitarian needs are enormous,
there is no doubt that the private sector – particularly the oligopoly in the food market – is in
a position to support WFP’s stretched supply chain with goods, in spite of the challenging
operational environment. Yet this strategy comes at the cost of increasing the power of the
few companies that already dominate the market. This may not be the best approach to take
under all possible scenarios; other elements of market development may need to be factored
in slowly, particularly in the ‘baseline scenario’.
The following recommendations emerge from this study:

FOOD MARKETS IN THE TIME OF CONFLICT AND CHOLERA
30
i. If the situation returns to the ‘baseline scenario’, the markets in Sana’a, Hodeidah and
Hajjah seem to be functional enough to support a gradual scale-up of the current com-
modity voucher interventions. In these urban settings, the major criticality was related
to the lack of household purchasing power – as confirmed by relatively stable real
prices – which could be eased with cash-based interventions. Under this scenario, the
main markets also seemed strong enough to support a careful move from commodity-
based to value-based vouchers using the existing network of traders. This is in line
with the findings of an inter-agency cash study published in December 2017.55 Given
the tiny share of in-kind assistance compared with total wheat supply in Yemen (9
percent in 2017), it is likely that the commercial sector will be able to cope with the
drop in supply prompted by a reduction of the amount of in-kind wheat flour availa-
ble. Pure cash distributions appear rather risky at the time of writing.
ii. If the ‘blockade scenario’ remains in place for the medium term, we need to assess the
capacity of traders to reorganize their supply chain from Hodeidah to Aden, and esti-
mate the associated cost. This can be done by evaluating the functionality of the cur-
rent commodity voucher system and any bottlenecks that may exist. Ultimately, if food
stocks remain satisfactory in the coming weeks/months, a gradual scale-up of com-
modity-based vouchers could be considered. Under this scenario, if the cost of the
fMEB increases substantially, there seems to be little room for exploring cash-based
transfers, since the inflationary pressure recorded in the period November 2017 to Jan-
uary 2018 clearly suggests a stretched supply chain, coupled with an even weaker
Yemeni rial.
iii. In principle, the ‘crisis scenario’ – or a similarly tense situation that lasts for an ex-
tended period – would not allow cash-based transfers nor the scale-up of commodity
voucher interventions. This statement is valid until the humanitarian imperative of
saving lives becomes so urgent and WFP’s capacity to continue with its business-as-
usual programming so stretched that it would be advisable to adopt a second-best ap-
proach. In such a case, it would be vital to conduct a risk analysis56 to understand the
effects of the crisis on shop opening hours, supply chain capacity to move goods
within the country, and protection of customers before passing (part of) the implemen-
tation risks of food assistance programming to the private sector.
iv. The findings of the assessment refer mostly to Sana’a, Hodeidah and Hajjah. There is
little knowledge of the functionality of markets in rural settings. As soon as the situa-
tion is safe enough to send enumerators into the field, the planned trader survey may
provide insights into more remote markets.
v. WFP should advocate as much as possible with the Central Statistical Office to resume
the monthly issuance of the consumer price index, in order to better monitor possible
negative effects of cash interventions on inflation.
55 “The primary conclusion of this study was that, based upon availability, pricing, and restocking times, food
commodities, cooking gas, and hygiene items are suitable candidates for a cash based intervention” (Reach, 2017). 56 This risk analysis is beyond the scope of this assessment because of the unpredictability of the current
situation.

FOOD MARKETS IN THE TIME OF CONFLICT AND CHOLERA
31
vi. If cash-based interventions are introduced, price monitoring should cover all com-
modities in the revised fMEB, and it should include non-food expenditures to establish
the ideal transfer value for beneficiaries. If the political situation permits, different
transfer values should be determined for each governorate, to better reflect differences
in the cost of living.
vii. The persistence of changes to diesel prices and the exchange rate should be monitored,
as they are likely to be transmitted to wheat flour prices, and eventually to the cost of
the food basket. An increase of 1 percent in diesel prices in Sana’a could push wheat
flour prices up by 10 percent over a six-month period, while an appreciation of the US
dollar by 1 percent leads to 3 percent rise within the same time frame. Conversely, an
increase of 25 days in the depletion time of wheat stocks would relax wheat flour prices
by 1 percent.
viii. A closer collaboration with FAO should be explored regarding the capture and storage
of import and stock data for staple foods, with a view to creating a jointly accessible,
coherent, reliable and timely database. This database should contain information such
as the number of vessels berthing, total metric tons by commodity and arrival port, as
well as stock data of at least the five major importers, to be triangulated with infor-
mation from official sources.
ix. Although price monitoring can serve different objectives (WFP, 2017b), the methodol-
ogy for price data collection should be harmonized within WFP – and as far as possible
between UN organizations – so that resources are not wasted in parallel exercises and
the information provided is reliable, consistent and timely.
x. Given the rapid depreciation of the rial and the increasing difference between the mar-
ket exchange rate and the rate negotiated with the bank by the UN, WFP should con-
sider pegging the latter to the market exchange rate to minimize financial losses in an
underfunded operation.

FOOD MARKETS IN THE TIME OF CONFLICT AND CHOLERA
32
Bibliography
EIU. (2017). Yemen Country Report. London: Economist Intelligence Unit.
ICG. (2017). Yemen's al-Qaeda: Expanding the Base. International Crisis Group.
IMF. (2017, May 10). Yemen's short-tem financing gaps.
OCHA. (2017, November 27). Global humanitarian overview 2018; a consolidated appeal to support
people affected by disaster and conflict. Retrieved from
https://www.unocha.org/sites/unocha/files/GHO2018.PDF
OCHA. (2017, December). Humanitarian Needs Overview, Yemen. Retrieved from
https://reliefweb.int/sites/reliefweb.int/files/resources/yemen_humanitarian_needs_o
verview_hno_2018_20171204_0.pdf
OCHA. (2017). Yemen: Humanitarian Needs Overview 2018, December 2017.
OCHA. (2018). Yemen Humanitarian Response Plan - January-December 2018.
ODI. (2013). Beneficiary and community perspectives on the Social Welfare Fund in Yemen.
Retrieved from https://www.odi.org/sites/odi.org.uk/files/odi-assets/publications-
opinion-files/8312.pdf
Reach. (2017). Market Functionality and Community Perception of Cash Based Assistance. Inter-
agency Joint Cash Study.
WFP. (2010). Yemen market study. Rome: VAM.
WFP. (2016). WFP Management Plan (2017-2019). Executive Board, Second Regular Session,
Rome, 14-18 November 2016.
WFP. (2017). Yemen Situation Report #36 (16-31 August 2017).
WFP. (2017a). State of Food Insecurity in Yemen - based on the Emergency Food Security and
Nutrition Assessment (EFSNA). WFP.
WFP. (2017b). Collecting prices for food security programming - The how and why of price data
collection at WFP. Rome: VAM - Food Security Analysis.
World Bank. (2017). Toward a blueprint for the recovery and reconstruction of Yemen - Discussion
draft October.

FOOD MARKETS IN THE TIME OF CONFLICT AND CHOLERA
33

FOOD MARKETS IN THE TIME OF CONFLICT AND CHOLERA
34
Annex I - Sources of food
Table 10 - WFP in-kind commodities (in metric tons) brought into Yemen 2010-2017
Source: WFP, SAP/WINGS
Figure 16 - Local production (in metric tons) by commodity, 2012–2016
Source: FAO
Commodity 2010 2011 2012 2013 2014 2015 2016 2017 Total
Beans 4,459 3,679 3,962 12,583 9,210 1,309 0 0 35,201
Canned fish 0 0 0 0 0 304 0 0 304
Dried fruits 84 646 676 330 0 0 487 2,223
High energy biscuits 161 831 50 841 2,270 0 0 4,153
Iodised salt 462 506 489 0 1,637 1,931 0 0 5,025
Peas 0 0 0 0 0 0 1,970 0 1,970
Ready to use supplementary food 44 2,363 0 1,289 211 424 4,993 1,380 10,703
Rice 1,050 475 2,622 725 825 2,623 0 0 8,320
Split peas 420 2,425 0 1,746 2,858 24,922 12,937 26,574 71,880
Sugar 1,939 2,750 2,401 161 165 7,594 4,971 0 19,981
Vegetable oil 2,894 8,529 4,022 7,137 6,893 5,618 14,946 23,008 73,048
Wheat 19,839 9,005 75,915 112,457 58,466 189,416 153,495 251,758 870,352
Wheat flour 33,267 64,224 48,011 40,707 17,598 38,590 28,434 35,357 306,189
Wheat soya blend 9,449 7,513 6,771 68 6,374 20,736 17,092 12,744 80,746
Total 74,067 102,946 144,869 177,252 105,078 295,736 239,326 350,821 1,490,096
Wheat & wheat flour share of total 72% 71% 86% 86% 72% 77% 76% 82% 79%
0
500,000
1,000,000
1,500,000
2,000,000
2,500,000
Cereals Vegetables Fruits Legumes Cash Crops Qat Feeders
2012 2013 2014 2015 2016

FOOD MARKETS IN THE TIME OF CONFLICT AND CHOLERA
35
Figure 17 - Year-on-year percentage change in local production by commodity, 2012–2016
Source: FAO
Figure 18 - Year-on-year percentage change in cultivated area by commodity, 2012–2016
Source: FAO
-40%
-35%
-30%
-25%
-20%
-15%
-10%
-5%
0%
5%
10%
15%
Cereals Vegetables Fruits Legumes Cash Crops Qat Feeders
2013 vs. 2012 2014 vs. 2013 2015 vs. 2014 2016 vs. 2015
-25%
-20%
-15%
-10%
-5%
0%
5%
Cereals Vegetables Fruits Legumes Cash Crops Qat Feeders
2013 vs. 2012 2014 vs. 2013 2015 vs. 2014 2016 vs. 2015

FOOD MARKETS IN THE TIME OF CONFLICT AND CHOLERA
36
Annex II - Price forecasts and Alert for Price Spikes (ALPS)
Figure 19 - Forecasts and ALPS
Source: WFP, http://dataviz.vam.wfp.org/economic_explorer/price-forecasts-alerts

FOOD MARKETS IN THE TIME OF CONFLICT AND CHOLERA
37
Annex III - fMEB
Table 11 - Relative poverty lines and headcount ratio in 2016
Source: Authors’ calculations based on EFSNA 2016
Table 12 - Per capita share of total expenditure by expenditure group
Source: Authors’ calculations based on EFSNA 2016
YER US$
Abyan 249 1.00 80%
Addaleh 253 1.01 85%
Aden 261 1.04 76%
Al Baidha 302 1.21 48%
Al Jawf 280 1.12 65%
Amran 291 1.16 61%
Dhamar 244 0.98 69%
Hadramaut 232 0.93 79%
Hajjah 223 0.89 80%
Hodeidah 213 0.85 79%
Ibb 291 1.16 59%
Lahj 224 0.89 76%
Mahweet 267 1.07 69%
Mareb 297 1.19 38%
Raymah 214 0.85 83%
Sana'a 260 1.04 69%
Sana'a city 308 1.23 43%
Shabwah 194 0.78 88%
Taiz 238 0.95 76%
Relative poverty line Head-
count
ratio
Governorate
Govenorate Food Qat &
tobacco
Services Utilities Shelter Other Total
Abyan 47% 3% 25% 1% 13% 10% 100%
Addaleh 44% 9% 25% 1% 10% 11% 100%
Aden 52% 3% 25% 3% 8% 9% 100%
Al Baidha 38% 11% 21% 2% 15% 12% 100%
Al Jawf 36% 18% 17% 0% 19% 10% 100%
Amran 39% 12% 22% 2% 13% 13% 100%
Dhamar 43% 11% 17% 1% 16% 13% 100%
Hadramaut 51% 1% 28% 2% 6% 13% 100%
Hajjah 49% 7% 18% 1% 13% 11% 100%
Hodeidah 49% 12% 21% 2% 5% 11% 100%
Ibb 42% 11% 21% 1% 13% 12% 100%
Lahj 47% 6% 22% 1% 8% 16% 100%
Mahweet 47% 10% 17% 1% 14% 11% 100%
Mareb 39% 11% 25% 3% 11% 12% 100%
Raymah 53% 7% 14% 1% 15% 11% 100%
Sana'a 42% 12% 22% 0% 12% 11% 100%
Sana'a city 39% 8% 20% 14% 10% 9% 100%
Shabwah 41% 4% 26% 1% 17% 11% 100%
Taiz 38% 8% 25% 4% 10% 14% 100%

FOOD MARKETS IN THE TIME OF CONFLICT AND CHOLERA
38
Table 13 - Per capita share of food expenditure by food group
Source: Authors’ calculations based on EFSNA 2016
Table 14 - Caloric contribution rescaled to (approximately) 2,100 kcal
Source: Authors’ calculations
Govenorate Cereals Vegetables Fruits Pulses Dairy Meat Fish Poultry Snacks Oil &
sugar
Total
Abyan 20.7% 7.2% 0.8% 1.2% 2.4% 0.5% 5.5% 2.9% 0.0% 6.4% 47%
Addaleh 28.2% 2.5% 0.4% 0.4% 2.6% 0.1% 0.1% 3.5% 0.1% 6.0% 44%
Aden 15.4% 8.9% 1.3% 4.7% 3.9% 0.2% 6.2% 4.2% 0.1% 6.7% 52%
Al Baidha 18.2% 4.8% 0.7% 1.5% 1.5% 0.9% 0.1% 5.4% 0.1% 4.9% 38%
Al Jawf 16.0% 6.9% 0.3% 1.0% 1.2% 0.2% 0.0% 5.7% 0.0% 5.1% 36%
Amran 19.7% 4.5% 1.3% 1.4% 2.5% 1.2% 0.0% 3.6% 0.0% 4.8% 39%
Dhamar 21.8% 4.4% 0.9% 1.9% 3.5% 1.2% 0.3% 3.0% 0.0% 6.1% 43%
Hadramaut 23.3% 4.7% 1.3% 2.7% 4.5% 1.1% 5.5% 2.8% 0.1% 5.4% 51%
Hajjah 26.4% 5.8% 1.0% 2.3% 2.7% 1.8% 0.8% 1.5% 0.1% 7.0% 49%
Hodeidah 18.3% 10.3% 1.1% 2.0% 1.9% 0.5% 5.0% 1.0% 0.2% 8.4% 49%
Ibb 20.4% 4.8% 0.7% 3.1% 2.7% 0.5% 0.1% 4.8% 0.1% 4.9% 42%
Lahj 23.0% 5.2% 1.1% 1.5% 3.9% 0.2% 2.1% 2.2% 0.5% 7.0% 47%
Mahweet 23.1% 4.7% 2.1% 1.9% 5.2% 1.1% 0.8% 2.3% 0.1% 5.8% 47%
Mareb 15.9% 3.5% 1.0% 4.2% 1.6% 0.8% 0.1% 6.9% 0.1% 4.7% 39%
Raymah 30.5% 3.8% 1.0% 1.5% 3.1% 0.5% 0.2% 3.5% 0.1% 8.4% 53%
Sana'a 21.8% 4.8% 0.5% 2.4% 3.5% 0.5% 0.0% 2.9% 0.1% 6.0% 42%
Sana'a city 14.7% 7.8% 0.7% 3.6% 2.9% 0.5% 0.2% 3.7% 0.1% 5.1% 39%
Shabwah 20.6% 3.5% 0.3% 1.0% 2.5% 0.2% 3.0% 3.8% 0.1% 5.9% 41%
Taiz 18.8% 4.8% 0.7% 1.3% 3.2% 0.2% 0.4% 2.7% 0.0% 6.4% 38%
Govenorate Wheat
Flour
Rice Tomato Lentils Yellow
Split Peas
Red Beans White
Beans
Palm oil Sugar
Abyan 1540 36 4 7 7 7 10 267 216
Addaleh 1796 7 1 3 3 3 3 178 112
Aden 1267 43 7 34 55 33 40 347 276
Al Baidha 1610 25 2 10 17 10 13 231 180
Al Jawf 1551 47 1 7 7 7 7 223 248
Amran 1673 22 3 10 20 10 10 196 160
Dhamar 1645 18 3 10 17 10 13 214 172
Hadramaut 1691 18 5 10 20 13 13 178 148
Hajjah 1547 22 4 10 24 23 23 249 200
Hodeidah 1439 43 3 14 17 13 17 294 260
Ibb 1565 25 4 24 31 23 20 231 180
Lahj 1694 18 4 7 7 7 10 187 168
Mahweet 1663 18 4 10 10 10 10 214 160
Mareb 1512 14 3 30 34 33 34 240 200
Raymah 1740 11 2 7 7 7 7 187 140
Sana'a 1551 22 1 14 17 17 17 258 208
Sana'a city 1397 47 3 27 38 30 37 285 232
Shabwah 1659 18 1 7 7 7 7 249 148
Taiz 1442 25 2 10 14 10 13 329 256

FOOD MARKETS IN THE TIME OF CONFLICT AND CHOLERA
39
Table 15 - Revised fMEB weights
Source: Authors’ calculations
Figure 20 - Average required transfer value adjustment in 2017
Source: Authors’ calculations
Govenorate Wheat
Flour
Rice Tomato Lentils Yellow
Split Peas
Red Beans White
Beans
Palm oil Sugar
Abyan 0.44 0.01 0.02 0.00 0.00 0.00 0.00 0.03 0.05
Addaleh 0.51 0.00 0.01 0.00 0.00 0.00 0.00 0.02 0.03
Aden 0.36 0.01 0.04 0.01 0.02 0.01 0.01 0.04 0.07
Al Baidha 0.46 0.01 0.01 0.00 0.01 0.00 0.00 0.03 0.05
Al Jawf 0.44 0.01 0.01 0.00 0.00 0.00 0.00 0.03 0.06
Amran 0.48 0.01 0.02 0.00 0.01 0.00 0.00 0.02 0.04
Dhamar 0.47 0.01 0.02 0.00 0.01 0.00 0.00 0.02 0.04
Hadramaut 0.48 0.01 0.03 0.00 0.01 0.00 0.00 0.02 0.04
Hajjah 0.44 0.01 0.02 0.00 0.01 0.01 0.01 0.03 0.05
Hodeidah 0.41 0.01 0.02 0.00 0.01 0.00 0.01 0.03 0.07
Ibb 0.45 0.01 0.02 0.01 0.01 0.01 0.01 0.03 0.05
Lahj 0.48 0.01 0.02 0.00 0.00 0.00 0.00 0.02 0.04
Mahweet 0.48 0.01 0.02 0.00 0.00 0.00 0.00 0.02 0.04
Mareb 0.43 0.00 0.02 0.01 0.01 0.01 0.01 0.03 0.05
Raymah 0.50 0.00 0.01 0.00 0.00 0.00 0.00 0.02 0.04
Sana'a 0.44 0.01 0.01 0.00 0.01 0.01 0.01 0.03 0.05
Sana'a city 0.40 0.01 0.02 0.01 0.01 0.01 0.01 0.03 0.06
Shabwah 0.47 0.01 0.01 0.00 0.00 0.00 0.00 0.03 0.04
Taiz 0.41 0.01 0.01 0.00 0.00 0.00 0.00 0.04 0.06
2%
28%
12%
20%
12%
8%
20%
9%
14%
11% 11%
9%
28%
24%
14%13%
21%
13%
16%
18%
13%12%
9%
0%
5%
10%
15%
20%
25%
30%

FOOD MARKETS IN THE TIME OF CONFLICT AND CHOLERA
40
Annex IV - Vector Error Correction Model
Table 16 shows the preliminary analysis required for the model presented in section 5.57 The
Augmented Dickey Fuller test was carried out on wheat flour prices in Sana’a and Hodeidah,
fuel prices in Sana’a, the exchange rate in Sana’a (all transformed in natural logarithms) and
wheat stocks depletion days, each with its ideal number of lags.
Table 16 - Unit root test
Wheat flour and diesel prices in Sana’a, and depletion day variables are integrated of order 1
(meaning that you would need to difference them once in order to achieve stationary time-
series). Hence a vector error correction model would be required if co-integration was found58
within the variables considering the number of lags returned by the Akaike Information Cri-
terion (AIC) (Table 17).
Table 17 - Number of lags
57 Unless otherwise specified, the notations *, ** and *** imply a level of significance respectively at
10 percent, 5 percent and 1 percent. 58 Two co-integrated series remain tied together in the long run even though both can occasionally de-
part from their pattern.
AIC LagTest
Statistic
5%
Critical
value
Order of
integration
wflour_s -1.99667 1 -2.881 -3.584 0.1687 I(0)
wflour_s -1.99667 1 -4.615 -1.708 0.0001 *** I(1)
diesel_s -0.43759 2 -1.468 -3.588 0.8398 I(0)
diesel_s -0.43759 2 -3.177 -1.714 0.0021 ** I(1)
ex_rate_s -3.08578 3 -3.455 -3.592 0.0445 ** I(0)
depl_days 7.64667 1 -1.789 -3.47 0.7103 I(0)
depl_days 7.64667 1 -7.220 -1.665 0.0000 *** I(1)
wflour_h 1.117956 1 -4.269 -3.469 0.0035 ** I(0)
MacKinnon
approximate p-
value for Z(t)
# of lags Augmented Dickey-Fuller test
Selection-order criteria
Sample: 2015m9 - 2017m10
lag LL LR df p FPE AIC HQIC SBIC
0 50.9721 0.001857 -3.45940 -3.37579 -3.16907
1 52.7709 3.59750 1 0.058 0.001755 -3.52084 -3.42330 -3.18212
2 55.6079 5.67410 * 1 0.017 0.001535 * -3.66215 * -3.55067 * -3.27504
3 55.8765 0.53724 1 0.464 0.001639 -3.60589 -3.48048 -3.17039 *
4 56.2884 0.82369 1 0.364 0.001735 -3.56064 -3.4213 -3.07676
Endogenous: wflour_s
Exogenous: diesel_s ex_rate_s depl_days wflour_h dummy _cons
Number of obs = 26
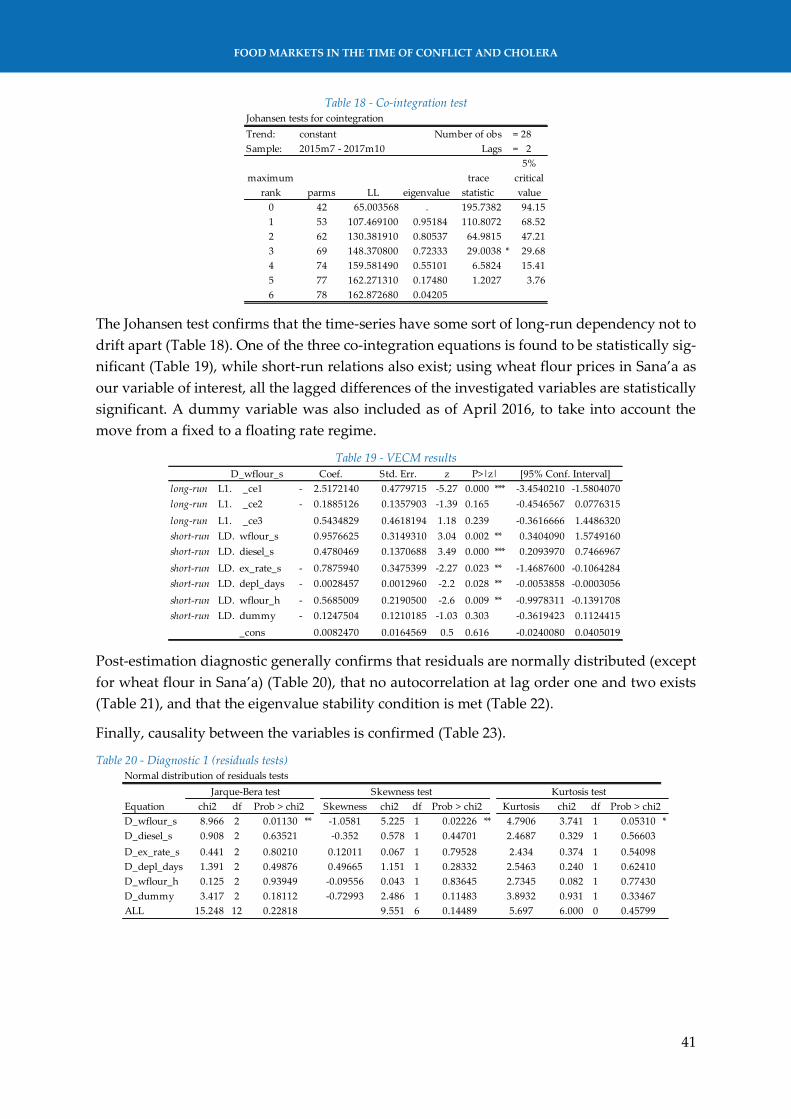
FOOD MARKETS IN THE TIME OF CONFLICT AND CHOLERA
41
Table 18 - Co-integration test
The Johansen test confirms that the time-series have some sort of long-run dependency not to
drift apart (Table 18). One of the three co-integration equations is found to be statistically sig-
nificant (Table 19), while short-run relations also exist; using wheat flour prices in Sana’a as
our variable of interest, all the lagged differences of the investigated variables are statistically
significant. A dummy variable was also included as of April 2016, to take into account the
move from a fixed to a floating rate regime.
Table 19 - VECM results
Post-estimation diagnostic generally confirms that residuals are normally distributed (except
for wheat flour in Sana’a) (Table 20), that no autocorrelation at lag order one and two exists
(Table 21), and that the eigenvalue stability condition is met (Table 22).
Finally, causality between the variables is confirmed (Table 23).
Table 20 - Diagnostic 1 (residuals tests)
Trend: constant Number of obs = 28
Sample: 2015m7 - 2017m10 Lags = 2
maximum
rank parms LL eigenvalue
trace
statistic
5%
critical
value
0 42 65.003568 . 195.7382 94.15
1 53 107.469100 0.95184 110.8072 68.52
2 62 130.381910 0.80537 64.9815 47.21
3 69 148.370800 0.72333 29.0038 * 29.68
4 74 159.581490 0.55101 6.5824 15.41
5 77 162.271310 0.17480 1.2027 3.76
6 78 162.872680 0.04205
Johansen tests for cointegration
Coef. Std. Err. z
long-run L1. _ce1 2.5172140- 0.4779715 -5.27 0.000 *** -3.4540210 -1.5804070
long-run L1. _ce2 0.1885126- 0.1357903 -1.39 0.165 -0.4546567 0.0776315
long-run L1. _ce3 0.5434829 0.4618194 1.18 0.239 -0.3616666 1.4486320
short-run LD. wflour_s 0.9576625 0.3149310 3.04 0.002 ** 0.3404090 1.5749160
short-run LD. diesel_s 0.4780469 0.1370688 3.49 0.000 *** 0.2093970 0.7466967
short-run LD. ex_rate_s 0.7875940- 0.3475399 -2.27 0.023 ** -1.4687600 -0.1064284
short-run LD. depl_days 0.0028457- 0.0012960 -2.2 0.028 ** -0.0053858 -0.0003056
short-run LD. wflour_h 0.5685009- 0.2190500 -2.6 0.009 ** -0.9978311 -0.1391708
short-run LD. dummy 0.1247504- 0.1210185 -1.03 0.303 -0.3619423 0.1124415
_cons 0.0082470 0.0164569 0.5 0.616 -0.0240080 0.0405019
D_wflour_s P>|z| [95% Conf. Interval]
Normal distribution of residuals tests
Equation chi2 df Skewness chi2 df Kurtosis chi2 df
D_wflour_s 8.966 2 0.01130 ** -1.0581 5.225 1 0.02226 ** 4.7906 3.741 1 0.05310 *
D_diesel_s 0.908 2 0.63521 -0.352 0.578 1 0.44701 2.4687 0.329 1 0.56603
D_ex_rate_s 0.441 2 0.80210 0.12011 0.067 1 0.79528 2.434 0.374 1 0.54098
D_depl_days 1.391 2 0.49876 0.49665 1.151 1 0.28332 2.5463 0.240 1 0.62410
D_wflour_h 0.125 2 0.93949 -0.09556 0.043 1 0.83645 2.7345 0.082 1 0.77430
D_dummy 3.417 2 0.18112 -0.72993 2.486 1 0.11483 3.8932 0.931 1 0.33467
ALL 15.248 12 0.22818 9.551 6 0.14489 5.697 6.000 0 0.45799
Jarque-Bera test Skewness test Kurtosis test
Prob > chi2 Prob > chi2 Prob > chi2

FOOD MARKETS IN THE TIME OF CONFLICT AND CHOLERA
42
Table 21 - Diagnostic 2 (autocorrelation)
Table 22 - Diagnostic 3 (stability)
Table 23 - Diagnostic 4 (causality)
Figure 21 - Impulse monthly and cumulative (dash lines) responses on wheat flour prices
Source: Authors’ calculations
Lagrange-multiplier test
lag chi2 df Prob > chi2
1 39.3351 36 0.32290
2 30.8598 36 0.71145
H0: no autocorrelation at lag order
Modulus
1 1
1 1
1 1
0.19718- + .8301141i 0.85321
0.19718- - .8301141i 0.85321
0.05049 + .7975821i 0.79918
0.05049 - .7975821i 0.79918
0.77015- 0.77015
0.67828 0.67828
0.37966 + .5140006i 0.63901
0.37966 - .5140006i 0.63901
0.04290 0.04290
Eigenvalue
The VECM specification imposes 3 unit
moduli (K=6 variables - r=3 cointegration
relationships)
Eigenvalue stability condition Causality test
(1) [D_wflour_s]LD.diesel_s = 0
(2) [D_wflour_s]LD.ex_rate_s = 0
(3) [D_wflour_s]LD.depl_days = 0
(4) [D_wflour_s]LD.wflour_h = 0
(5) [D_wflour_s]LD.dummy = 0
chi2(5) = 31.34
Prob > chi2 = 0.0000
H0: coefficients in specific equation are 0
-2%
0%
2%
4%
6%
8%
10%
12%
0 +1 +2 +3 +4 +5 +6
Impulse: fuel price in Sana'a
-2%
0%
2%
4%
6%
8%
10%
12%
0 +1 +2 +3 +4 +5 +6
Impulse: exchange rate in Sana'a
-2%
0%
2%
4%
6%
8%
10%
12%
0 +1 +2 +3 +4 +5 +6
Impulse: depletion days
-2%
0%
2%
4%
6%
8%
10%
12%
0 +1 +2 +3 +4 +5 +6
Impulse: wheat flour price in Hodeidah


FOOD MARKETS IN THE TIME OF CONFLICT AND CHOLERA
35