food information bulletin...the food information bulletin is a monthly publication containing...
TRANSCRIPT

FOOD INFORMATION BULLETIN
Marketing , Food Policy and Agribusiness Division
Hector Kobbekaduwa Agrarian Research and Training Institute
No 114, Wijerama Mawatha , Colombo 07.
Phone: 011-2696981 Fax: 011-2682283 E-mail: [email protected] Web:www.harti.gov.lk
RICE: Prices of all the varieties have
decreased due to the increased sup-
ply. The highest price decreased was
recorded for raw varieties.
VEGETABLES: Prices of most of the upcountry and
lowcountry varieties have decreased
by 20% with the reaching of peak
period of the harvesting of vegeta-
bles. Prices are expected to be at
lower range, until the Yala harvest
is ended in second week of Septem-
ber.
Vol 08 July - 2015 No 07

EXPLANTATORY NOTE
The Food Information Bulletin is a monthly publication containing information relating to producer,
wholesale and retail prices of selected food commodities in selected markets in and around Colombo
and main markets in the major producing areas. Data on extent, production and imports are also
available in the bulletin.
The information is analyzed and presented as, prevailing prices, price ranges, averages and comparison
of monthly prices. The changes in prices reported are always in relation to price, which prevailed
during the previous month unless otherwise stated.
Co-ordinator / Head of the Division
Mrs. C.P. Hathurusinghe
Research Team
W.A.N.Wijesooriya - Paddy
E.A.C. Priyankara - Rice
Roshini Rambukwella - Dried chilies and Onion
Ruvini Widanapathirana - Potato and Pulses
N.P.G. Samantha - Fruits
W. H. Duminda Priyadarsana - Dried fish and Meat
P.A.J. Champika - Vegetables
Indika Edirisinghe - Fish and Eggs
P.G.A.Rathnasiri - Wheat flour and Sugar
Compilation of Data and Information
P.G.A. Rathnasiri W.G.N Malkanthi
Data Processing Word Processing
Upul Arunashantha I.A. Surangani
Editor
S. Perera
Colombo Field Data Collection Team
1. S.M.C.D.K. Samarakoon 4. N.A. Rohan Wijesinghe 7. D.V.E. Priyadarshana
2 D.W.A. Rupasinghe 5. M.W.P. Mahesh 8. R.D.C. Rathuvithana
3. G.A.L.S. Kumari 6. U.D.P. Jayaratne
Field Data Collection Team
1. H.M.S. Jayarathna - Nuwara Eliya 12. M.G.P. Abeywickrama - Puttalama
2. J.C.K.B. Lional - Dambulla 13. V.K. Lakmali - Hambantota
3. G.W. Ranatunga - Matara 14. H. I. Prasad - Divulapitiya
4. Sampath Wijeratne - Kurunegala 15. M.T.H.A.I. Chandimali - Rathnapura
5. A.W. Gamini - Embilipitiya 16. Dihani Ekanayake - Keppetipola
6. Sarath Nillamulla - Kandy 17. Niranjala Premathilaka - Thambutthegama
7. Jayawardana Kitulagoda - Meegoda 18. Pradeepa Nayanakumari - Anuradhapura
8. Priyantha Liyanarachi - Kalutara 19. W.P.U. Ishara - Ampara
9. Lashika Dilrukshi - Tissamaharama 20. Namal Dissanayake - Badulla
10. K.A.D. Shanika - Nikaweratiya 21. N.P.G. Manohari - Galle
11.Anushka Perera - Polonnaruwa 22. Harshani Iroshika - Moneragala

1
1. Paddy
Crop Situation
Harvesting of paddy crop in 2015 Yala season commenced in Akkareipattu, Samanturai, Seruwila
and Batticaloa areas in the Eastern Province. It was recorded that the newly harvested high
moisture paddy arrived at the major markets from above mentioned areas. Harvesting also
progressed in the wet zone areas in Kurunegala district and Embilipitiya areas. Paddy crop was at
the ripening stage in most of the other major producing areas. Field information reveals that the
prospects of paddy crop in 2015 Yala season were satisfactory and a bumper harvest is expected
in most of the major producing areas. According to the crop forecast report of the Department of
Agriculture, the cultivated extent of paddy is 502,179 ha and it is the highest ever extent recorded
for Yala season and 60% above compared to the previous yala season. Further the report reveals
that the production forecast for the yala season is 1.93 million Mt, 68% percent higher than the
Yala 2014. Prevaling favorable weather condition and better water availability in irrigation tanks
caused the progress of paddy cultivation. Peak harvesting can be expected during August in
Anuradhapura, Polonnaruwa and Mahaweli areas. It is expected that a bumper harvest of paddy
would arrive at the market by the end of August, recording a significant decline of paddy prices
specially for long grain white varieties.
Table 1.1: Achievement of Paddy Cultivation 2015 yala season
(Up to end of July - 2015)
District Targeted
Extent (ha)
Achievement
(ha)
Achievement as a % of
the Targeted Extent
(ha)
Production forecast
Based on the Progress
(mt)
Expected
Average Yield
(mt/ha)
Anuradhapura 46,883 53,879 115 184,396 3.4
Polonnaruwa 32,166 32,378 101 132,005 4.1
Ampara 55,534 57,136 103 259,537 4.5
Kurunagala 67,440 64,124 95 224,111 3.5
Hambantota 28,458 27,850 98 117,586 4.2
Colombo 2,970 1,515 51 3,690 2.4
Gampaha 7,172 4,730 66 12,573 2.7
Kalutara 11,195 7,774 69 18,536 2.4
Galle 12,800 5,745 45 12,707 2.2
Matara 16,600 15,598 94 40,733 2.6
Ratnapura 10,389 8,218 79 25,411 3.1
Kegalle 8,254 5,177 63 13,376 2.6
Puttalam 16,285 15,156 93 48,804 3.2
Kandy 11,285 9,694 86 27,817 2.9
Matale 16,240 11,005 68 41,101 3.7
Nuwara Eliya 3,660 802 22 1,580 2.0
Badulla 9,540 8,548 90 32,457 3.8
Moneragala 20,742 18,415 89 68,757 3.7
Jaffna - - - - -
Kilinochchi 6,535 6,928 106 28,568 4.1
Vavuniya 7,454 7,912 106 32,615 4.1
Mullaitivu 6,410 6,070 95 23,768 3.9
Mannar 2,762 2,762 100 11,800 4.3
Trincomalee 24,130 23,321 97 98,641 4.2
Batticaloa 25,598 24,466 96 91,448 3.7
Udawalawa 10,807 12,426 115 62,008 5.0
System H 12,216 18,923 155 76,036 4.0
System H1 6,200 5,464 88 25,663 4.7
System B 18,000 19,266 107 90,486 4.7
System C 19,000 21,959 116 103,134 4.7
System G 4,800 4,393 92 20,632 4.7
System L 365 545 149 2,560 4.7
Sri Lanka 521,890 502,179 96 1,932,536 3.8
Source: Department of Agriculture
2
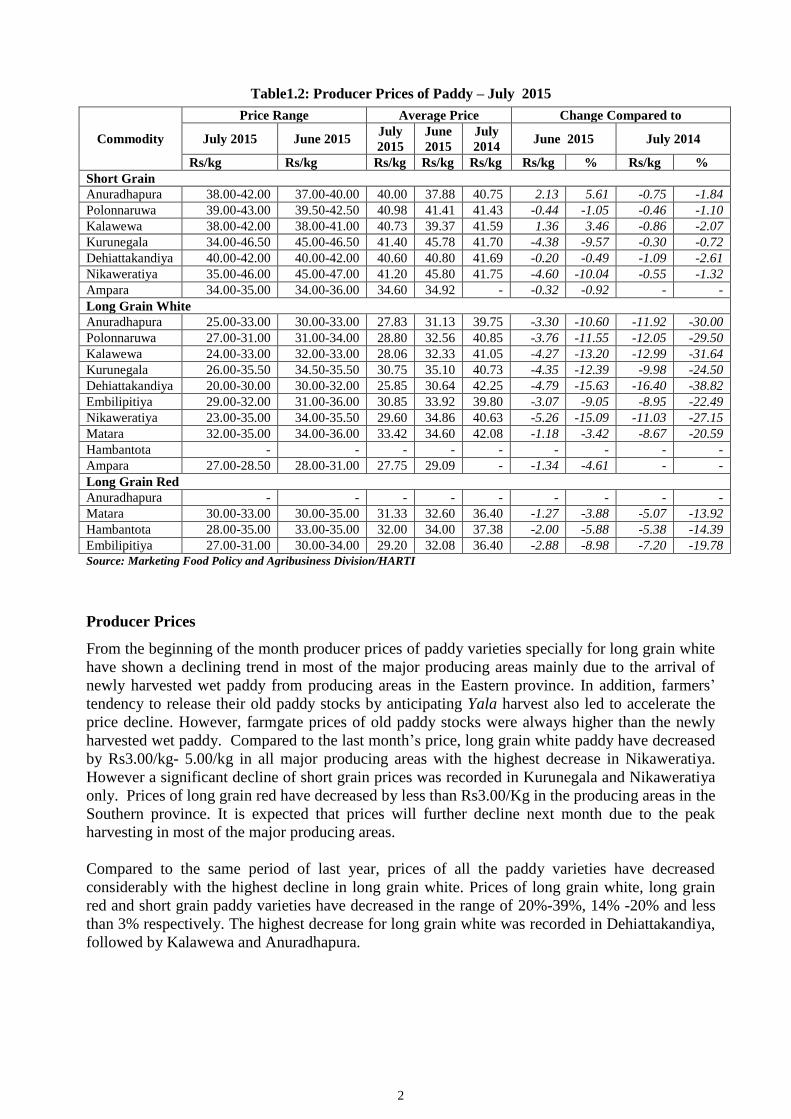
Table1.2: Producer Prices of Paddy – July 2015
Commodity
Price Range Average Price Change Compared to
July 2015 June 2015 July
2015
June
2015
July
2014 June 2015 July 2014
Rs/kg Rs/kg Rs/kg Rs/kg Rs/kg Rs/kg % Rs/kg %
Short Grain
Anuradhapura 38.00-42.00 37.00-40.00 40.00 37.88 40.75 2.13 5.61 -0.75 -1.84
Polonnaruwa 39.00-43.00 39.50-42.50 40.98 41.41 41.43 -0.44 -1.05 -0.46 -1.10
Kalawewa 38.00-42.00 38.00-41.00 40.73 39.37 41.59 1.36 3.46 -0.86 -2.07
Kurunegala 34.00-46.50 45.00-46.50 41.40 45.78 41.70 -4.38 -9.57 -0.30 -0.72
Dehiattakandiya 40.00-42.00 40.00-42.00 40.60 40.80 41.69 -0.20 -0.49 -1.09 -2.61
Nikaweratiya 35.00-46.00 45.00-47.00 41.20 45.80 41.75 -4.60 -10.04 -0.55 -1.32
Ampara 34.00-35.00 34.00-36.00 34.60 34.92 - -0.32 -0.92 - -
Long Grain White
Anuradhapura 25.00-33.00 30.00-33.00 27.83 31.13 39.75 -3.30 -10.60 -11.92 -30.00
Polonnaruwa 27.00-31.00 31.00-34.00 28.80 32.56 40.85 -3.76 -11.55 -12.05 -29.50
Kalawewa 24.00-33.00 32.00-33.00 28.06 32.33 41.05 -4.27 -13.20 -12.99 -31.64
Kurunegala 26.00-35.50 34.50-35.50 30.75 35.10 40.73 -4.35 -12.39 -9.98 -24.50
Dehiattakandiya 20.00-30.00 30.00-32.00 25.85 30.64 42.25 -4.79 -15.63 -16.40 -38.82
Embilipitiya 29.00-32.00 31.00-36.00 30.85 33.92 39.80 -3.07 -9.05 -8.95 -22.49
Nikaweratiya 23.00-35.00 34.00-35.50 29.60 34.86 40.63 -5.26 -15.09 -11.03 -27.15
Matara 32.00-35.00 34.00-36.00 33.42 34.60 42.08 -1.18 -3.42 -8.67 -20.59
Hambantota - - - - - - - - -
Ampara 27.00-28.50 28.00-31.00 27.75 29.09 - -1.34 -4.61 - -
Long Grain Red
Anuradhapura - - - - - - - - -
Matara 30.00-33.00 30.00-35.00 31.33 32.60 36.40 -1.27 -3.88 -5.07 -13.92
Hambantota 28.00-35.00 33.00-35.00 32.00 34.00 37.38 -2.00 -5.88 -5.38 -14.39
Embilipitiya 27.00-31.00 30.00-34.00 29.20 32.08 36.40 -2.88 -8.98 -7.20 -19.78
Source: Marketing Food Policy and Agribusiness Division/HARTI
Producer Prices
From the beginning of the month producer prices of paddy varieties specially for long grain white
have shown a declining trend in most of the major producing areas mainly due to the arrival of
newly harvested wet paddy from producing areas in the Eastern province. In addition, farmers’
tendency to release their old paddy stocks by anticipating Yala harvest also led to accelerate the
price decline. However, farmgate prices of old paddy stocks were always higher than the newly
harvested wet paddy. Compared to the last month’s price, long grain white paddy have decreased
by Rs3.00/kg- 5.00/kg in all major producing areas with the highest decrease in Nikaweratiya.
However a significant decline of short grain prices was recorded in Kurunegala and Nikaweratiya
only. Prices of long grain red have decreased by less than Rs3.00/Kg in the producing areas in the
Southern province. It is expected that prices will further decline next month due to the peak
harvesting in most of the major producing areas.
Compared to the same period of last year, prices of all the paddy varieties have decreased
considerably with the highest decline in long grain white. Prices of long grain white, long grain
red and short grain paddy varieties have decreased in the range of 20%-39%, 14% -20% and less
than 3% respectively. The highest decrease for long grain white was recorded in Dehiattakandiya,
followed by Kalawewa and Anuradhapura.

3
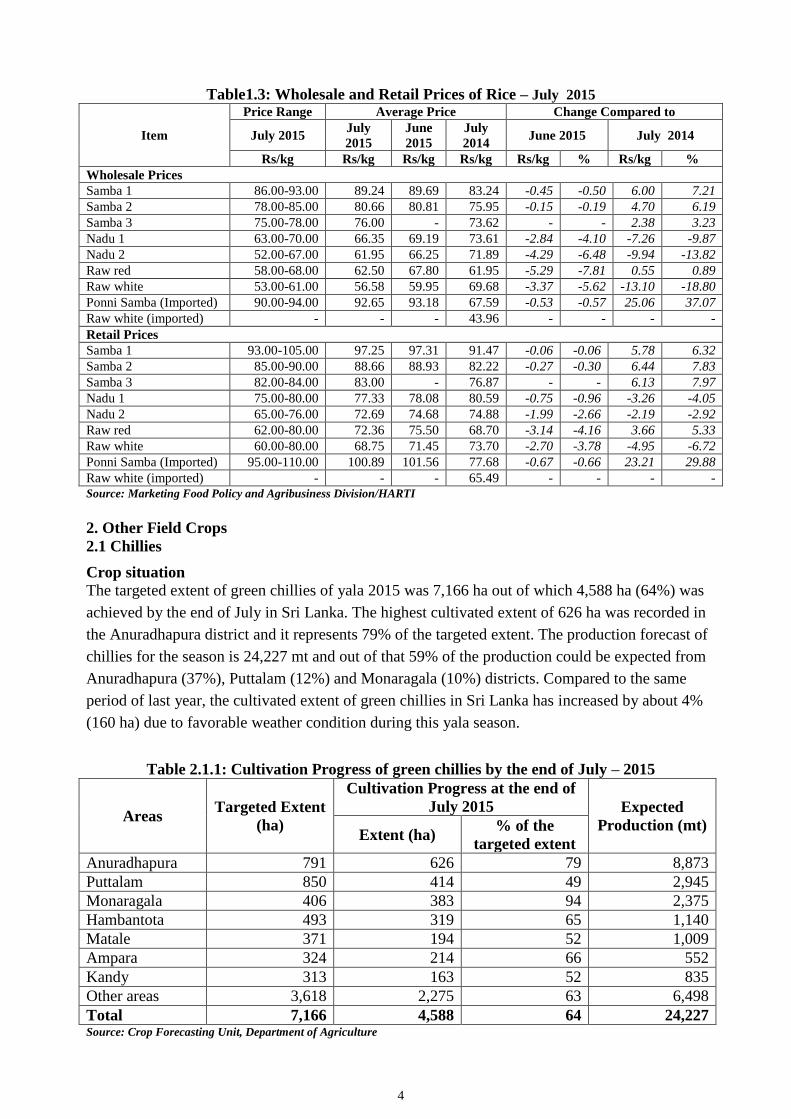
Rice Demand and Supply Situation
Wholesale prices
New rice stocks of 2015 yala season has reached to the market at the beginning of the month, and
therefore it could be seen the price decrease of most of the rice varieties. Due to high quality rice
stocks which produced by old paddy stocks of the last season, it was reported that the small price
increase of samba varieties in the first week of this month. Later on its prices have gradually
decreased with the high supply from major rice producing areas. Also, the decrease of prices of
nadu, raw red and raw white was observed within the whole month. The highest price decrease of
8% was reported for raw red while the prices have decreased by 6% for both nadu grade II and
raw white, by 4% for nadu grade I and by approximately 1% for all the other rice varieties. The
price of samba rice has decreased by less than 1%. However, short grain harvesting of the yala
season will begin on month of August and September. Consequently, new samba rice stocks will
be reached to the market on those months and it is expected that the further price increase of
samba rice. According to the statistical data released by the Department of Customs, rice imports
of this month have decreased by about 50% in line with the last month and the imported amount
was 3,133mt while basmamathi rice was the highest import amongst them. The price of imported
ponni samba has decreased within the first half of the month and however it was increased at the
end of the month.
Compared to the same period of last year, prices of nadu and raw white had decreased by 10%-
19%, while the prices of all the other rice varieties had increased by 1%-37%.
Retail Prices
The price behavior in the wholesale market was depicted in the retail market too. The prices have
decreased by Rs.3.00/kg for raw varieties, by Rs.2.00/kg for nadu grade II and by approximately
Rs.1.00/kg for all the other rice varieties. The highest price of Rs. 110.00/kg was reported for
imported ponni samba and the lowest price of Rs.60.00/kg was reported for raw white.
Compared to the same period of last year, prices of nadu and raw white had decreased by 3%-7%,
while the prices of all the other rice varieties had increased by 5%-30%.
4
Table1.3: Wholesale and Retail Prices of Rice – July 2015
Item
Price Range Average Price Change Compared to
July 2015 July
2015
June
2015
July
2014 June 2015 July 2014
Rs/kg Rs/kg Rs/kg Rs/kg Rs/kg % Rs/kg %
Wholesale Prices
Samba 1 86.00-93.00 89.24 89.69 83.24 -0.45 -0.50 6.00 7.21
Samba 2 78.00-85.00 80.66 80.81 75.95 -0.15 -0.19 4.70 6.19
Samba 3 75.00-78.00 76.00 - 73.62 - - 2.38 3.23
Nadu 1 63.00-70.00 66.35 69.19 73.61 -2.84 -4.10 -7.26 -9.87
Nadu 2 52.00-67.00 61.95 66.25 71.89 -4.29 -6.48 -9.94 -13.82
Raw red 58.00-68.00 62.50 67.80 61.95 -5.29 -7.81 0.55 0.89
Raw white 53.00-61.00 56.58 59.95 69.68 -3.37 -5.62 -13.10 -18.80
Ponni Samba (Imported) 90.00-94.00 92.65 93.18 67.59 -0.53 -0.57 25.06 37.07
Raw white (imported) - - - 43.96 - - - -
Retail Prices
Samba 1 93.00-105.00 97.25 97.31 91.47 -0.06 -0.06 5.78 6.32
Samba 2 85.00-90.00 88.66 88.93 82.22 -0.27 -0.30 6.44 7.83
Samba 3 82.00-84.00 83.00 - 76.87 - - 6.13 7.97
Nadu 1 75.00-80.00 77.33 78.08 80.59 -0.75 -0.96 -3.26 -4.05
Nadu 2 65.00-76.00 72.69 74.68 74.88 -1.99 -2.66 -2.19 -2.92
Raw red 62.00-80.00 72.36 75.50 68.70 -3.14 -4.16 3.66 5.33
Raw white 60.00-80.00 68.75 71.45 73.70 -2.70 -3.78 -4.95 -6.72
Ponni Samba (Imported) 95.00-110.00 100.89 101.56 77.68 -0.67 -0.66 23.21 29.88
Raw white (imported) - - - 65.49 - - - -
Source: Marketing Food Policy and Agribusiness Division/HARTI
2. Other Field Crops
2.1 Chillies
Crop situation
The targeted extent of green chillies of yala 2015 was 7,166 ha out of which 4,588 ha (64%) was
achieved by the end of July in Sri Lanka. The highest cultivated extent of 626 ha was recorded in
the Anuradhapura district and it represents 79% of the targeted extent. The production forecast of
chillies for the season is 24,227 mt and out of that 59% of the production could be expected from
Anuradhapura (37%), Puttalam (12%) and Monaragala (10%) districts. Compared to the same
period of last year, the cultivated extent of green chillies in Sri Lanka has increased by about 4%
(160 ha) due to favorable weather condition during this yala season.
Table 2.1.1: Cultivation Progress of green chillies by the end of July – 2015
Areas Targeted Extent
(ha)
Cultivation Progress at the end of
July 2015 Expected
Production (mt) Extent (ha)
% of the
targeted extent
Anuradhapura 791 626 79 8,873
Puttalam 850 414 49 2,945
Monaragala 406 383 94 2,375
Hambantota 493 319 65 1,140
Matale 371 194 52 1,009
Ampara 324 214 66 552
Kandy 313 163 52 835
Other areas 3,618 2,275 63 6,498
Total 7,166 4,588 64 24,227 Source: Crop Forecasting Unit, Department of Agriculture

5
Prices and Supply/Demand Situation
Supply of green chillies from the main producing areas had decreased during this month too.
Hence, the both wholesale and retail prices of green chillies had increased significantly by about
Rs.178.00/kg and Rs.273.00/kg respectively. Producer prices of green chillies ranged between
Rs.204.00-550.00/kg during this month and the highest price was recorded in Hambantota district
in the third week of the month. The average wholesale and retail prices of green chillies were
Rs.336.94/kg and Rs.533.43/kg respectively and both prices were higher than that of the prices of
dried chillies. Compared to the same period of last year, both wholesale and retail prices of green
chillies have decreased by about 32% and 22% respectively.
A quantity of 3,987 mt of dried chillies was imported during the month and it was an increase of
1,064 mt compared to that of the last month. The CIF price was Rs.205.64/kg and it was an
increase of Rs.2.50/kg compared to the previous month. However, both wholesale and retail
prices of imported dried chillies have increased by about Rs.3.00/kg due to increased imported
prices and high prices of green chillies. The average wholesale and retail prices of imported dried
chillies were Rs.238.38/kg and Rs.275.90/kg respectively and both prices have increased by about
26% and 17% respectively compared to the same period of last year.
Table 2.1.2: Wholesale and Retail Prices of Dried Chillies and Green Chillies - July 2015
Items
Price Range Average Price Change Compared to
July 2015 July 2015 June
2015
July
2014 June 2015 July 2014
Rs/kg Rs/kg Rs/kg Rs/kg Rs/kg % Rs/kg %
Wholesale Price
Green chillies 200.00-450.00 336.94 159.11 496.87 177.83 111.77 -159.93 -32.19
Dried chillies 235.00-245.00 238.38 234.83 188.59 3.55 1.51 49.79 26.40
Retail Price
Green chillies 320.00-700.00 533.43 260.45 687.31 272.98 104.81 -153.88 -22.39
Dried chillies 240.00-300.00 275.90 272.61 234.85 3.29 1.21 41.05 17.48
Source: Marketing, Food Policy and Agribusiness Division/HARTI
Table 2.1.3: Quantity, Value and CIF Prices of Imported Dried Chillies
- February to July 2015
Month Quantity
(mt)
Value
(Rs.mn.)
CIF Price
(Rs/kg)
Retail Price
(Rs/kg)
Gross
Margin
(Rs/kg)
July 3,986.71 819.85 205.64 275.90 70.26
June 2,923.47 593.87 203.14 272.61 69.47
May 4,082.94 754.08 184.69 258.15 73.46
Apr 3,215.57 584.85 181.88 258.81 76.93
Mar 6,478.41 1,179.43 182.06 266.95 84.89
Feb 4,520.79 863.63 191.04 269.09 78.05
Source: Department of Customs, Marketing, Food Policy and Agribusiness Division/HARTI
Table 2.1.4: Producer Prices of Green Chillies (Rs/kg) – July 2015
Location 1st
week 2nd
week 3rd
week 4th
week
Dambulla 345.00 364.00 348.00 208.00
Hambantota 225.00 292.50 550.00 210.00
Embilipitiya 406.00 452.00 313.00 303.00
Puttalam 460.00 460.00 218.60 204.00
A'Pura - - - 277.50
Source: Marketing, Food Policy and Agribusiness Division/HARTI

6
2.2 Big Onion and Red Onion
Crop situation
In the Matale district about 1,779 ha had been cultivated representing 51% of the total targeted
extent by the end of July 2015. About 34% decrease in the cultivated extent was observed in the
Matale district against the previous yala season as most of the farmers cultivated paddy instead of
big onion and the prevailed unfavorable weather condition for big onion cultivation at the
beginning of the season. Cultivation delay was also observed during this season by 20 days.
About 910 ha of big onion has been cultivated during this month in Matale district and it was the
highest cultivated extent when compared to the other months. At the end of July the highest
cultivated extent of big onion was reported from Dambulla are (770 ha) and followed by Sigiriya
(535 ha).
Table 2.2.1: Cultivation Progress of Big Onion in Matale district
Areas
Yala 2014 Yala 2015 % change
compared
to previous
yala
Target April May June July Total Targ
et April May June July Total
Dambulla 1,500 05 100 465 436 1,006 1,500 - 110 170 490 770 -23
Sigiriya 1,000 02 19 449 160 630 800 - 111 345 79 535 -15
Galewela 600 01 04 190 328 523 425 - - 34 195 229 -56
Dewahuwa 250 - 02 25 176 203 275 - 01 25 81 107 -47
Other areas 650 - 18 298 25 341 500 - 35 38 65 138 -60
Total 4,000 08 143 1,427 1,125 2,703 3,500 - 257 612 910 1,779 -34
Source: Crop Forecasting Unit, Department of Agriculture
It is predicted that the big onion production will be nearly 35,590 mt in Matale district and out of
that about 73% is expected from Dambulla and Sigiriya areas. However, expected production of
big onion during this season in Matale district had also dropped by about 34% when compared to
that of the previous yala season due to decrease in cultivated extent. About 14% of the production
would be harvested in August, 40% in September and 46% of the total harvesting will take place
during the month of October and it will be the peak harvesting season due to cultivation delay at
the beginning of the season.
Table 2.2.2: Expected Production of Big Onion in Matale district
Areas
2014 Yala (mt) 2015 Yala (mt) % change
compared
to
previous
yala
July Aug Sep Oct Nov
Total
Production
(mt)
Aug Sep Oct
Total
Production
(mt)
Dambulla 100 2,000 6,510 9,330 2,180 20,120 2,200 4,380 8,820 15,400 -23
Sigiriya 40 380 6,286 5,094 800 12,600 2,220 7,059 1,431 10,710 -15
Galewela 20 80 2,660 6,060 1,640 10,460 - 1,070 3,510 4,580 -56
Dewahuwa - 40 350 2,796 882 4,068 20 662 1,458 2,140 -47
Other
areas
- 360 4,172 2,163 125 6,828 700 890 1,170 2,760 -60
Total 160 2,860 19,978 25,443 5,627 54,068 5,140 14,061 16,389 35,590 -34
Source: Marketing, Food Policy and Agribusiness Division/HARTI
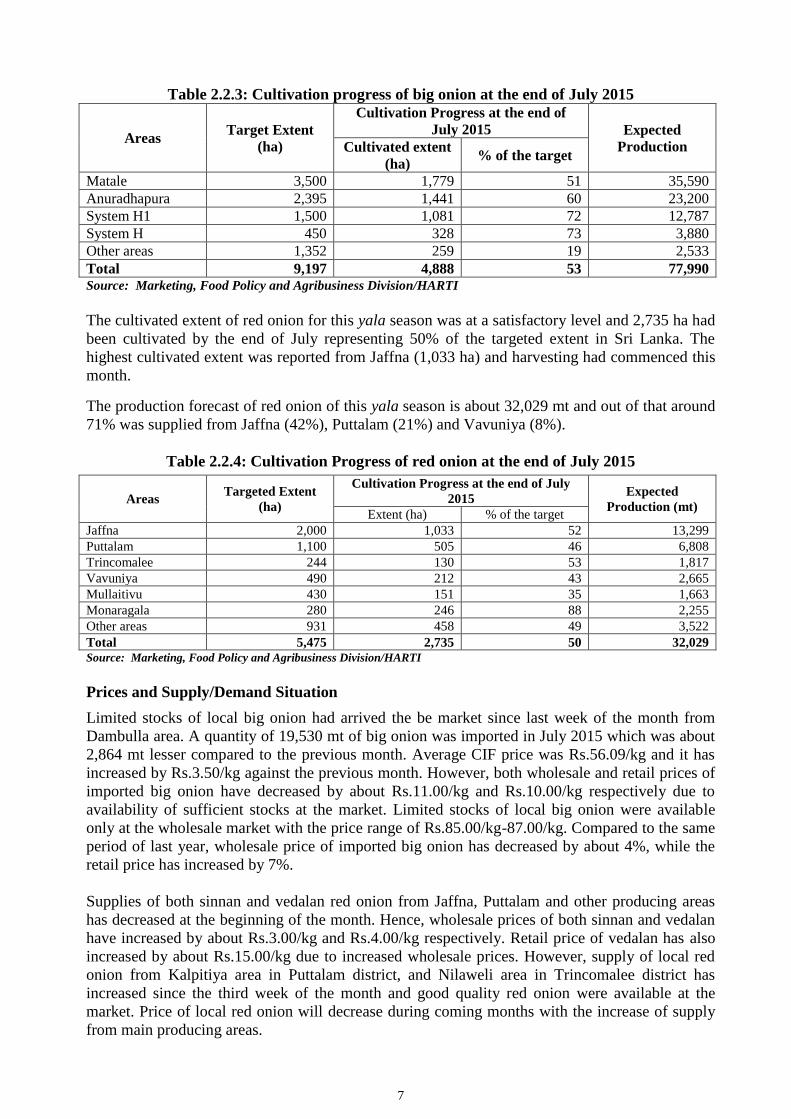
The cultivation progress of big onion in Anuradhapura district was at a satisfactory level and
1,441 ha have been achieved by the end of July. A good cultivation progress of big onion was
observed in system H1 (Huruluwewa, Galkiriyagama and Madatugama) areas and at the end of
July about 1,081 ha of big onion had been cultivated. Total big onion production for yala 2015
was estimated at nearly 77,990 mt and out of that around 92% will be supplied from Matale
(46%), Anuradhapura (30%) and system H1 (16%).
7
Table 2.2.3: Cultivation progress of big onion at the end of July 2015
Areas Target Extent
(ha)
Cultivation Progress at the end of
July 2015 Expected
Production Cultivated extent
(ha) % of the target
Matale 3,500 1,779 51 35,590
Anuradhapura 2,395 1,441 60 23,200
System H1 1,500 1,081 72 12,787
System H 450 328 73 3,880
Other areas 1,352 259 19 2,533
Total 9,197 4,888 53 77,990 Source: Marketing, Food Policy and Agribusiness Division/HARTI
The cultivated extent of red onion for this yala season was at a satisfactory level and 2,735 ha had
been cultivated by the end of July representing 50% of the targeted extent in Sri Lanka. The
highest cultivated extent was reported from Jaffna (1,033 ha) and harvesting had commenced this
month.
The production forecast of red onion of this yala season is about 32,029 mt and out of that around
71% was supplied from Jaffna (42%), Puttalam (21%) and Vavuniya (8%).
Table 2.2.4: Cultivation Progress of red onion at the end of July 2015
Areas Targeted Extent
(ha)
Cultivation Progress at the end of July
2015 Expected
Production (mt) Extent (ha) % of the target
Jaffna 2,000 1,033 52 13,299
Puttalam 1,100 505 46 6,808
Trincomalee 244 130 53 1,817
Vavuniya 490 212 43 2,665
Mullaitivu 430 151 35 1,663
Monaragala 280 246 88 2,255
Other areas 931 458 49 3,522
Total 5,475 2,735 50 32,029
Source: Marketing, Food Policy and Agribusiness Division/HARTI
Prices and Supply/Demand Situation
Limited stocks of local big onion had arrived the be market since last week of the month from
Dambulla area. A quantity of 19,530 mt of big onion was imported in July 2015 which was about
2,864 mt lesser compared to the previous month. Average CIF price was Rs.56.09/kg and it has
increased by Rs.3.50/kg against the previous month. However, both wholesale and retail prices of
imported big onion have decreased by about Rs.11.00/kg and Rs.10.00/kg respectively due to
availability of sufficient stocks at the market. Limited stocks of local big onion were available
only at the wholesale market with the price range of Rs.85.00/kg-87.00/kg. Compared to the same
period of last year, wholesale price of imported big onion has decreased by about 4%, while the
retail price has increased by 7%.
Supplies of both sinnan and vedalan red onion from Jaffna, Puttalam and other producing areas
has decreased at the beginning of the month. Hence, wholesale prices of both sinnan and vedalan
have increased by about Rs.3.00/kg and Rs.4.00/kg respectively. Retail price of vedalan has also
increased by about Rs.15.00/kg due to increased wholesale prices. However, supply of local red
onion from Kalpitiya area in Puttalam district, and Nilaweli area in Trincomalee district has
increased since the third week of the month and good quality red onion were available at the
market. Price of local red onion will decrease during coming months with the increase of supply
from main producing areas.

8
About 847 mt of red onion were imported from India during this month and it was a decrease of
536 mt compared to that of the previous month. Average CIF price was Rs.105.38/kg and it was
an increase of Rs.3.90/kg compared to that of the last month. Hence, both wholesale and retail
prices of imported red onion have increased by about Rs.8.00/kg and Rs.4.00/kg respectively.
Compared to the same period of last year, current retail prices of vedalan and imported red onion
have increased by about 54% and 41% respectively.
Table 2.2.5: Wholesale Prices and Retail Prices of Red Onion and Big Onion July 2015
Crop
Price Range Average Change Compared to
July 2015 July 2015 June 2015 July
2014 June 2015 July 2014
Rs/kg Rs/kg Rs/kg Rs/kg Rs/kg % Rs/kg %
Wholesale Prices
Red Onion (Sinnan) 60.00-135.00 106.94 103.56 44.22 3.39 3.27 62.73 141.87
Red Onion (Vedalan) 85.00-165.00 136.20 131.81 64.87 4.39 3.33 71.33 109.96
Red Onion (Imported) 75.000-140.00 123.88 115.36 56.74 8.52 7.38 67.14 118.33
Big Onion (imported) 50.00-95.00 70.99 82.29 73.67 -11.30 -13.73 -2.68 -3.63
Big Onion (Local) 85.00-87.00 85.87 - 73.25 - - 12.62 17.23
Retail Prices
Red Onion (Sinnan) - - 125.00 87.50 - - - -
Red Onion (Vedalan) 120.00-200.00 176.85 161.67 114.78 15.18 9.39 62.07 54.08
Red Onion (Imported) 120.00-200.00 147.29 142.85 104.55 4.44 3.11 42.74 40.88
Big Onion (imported) 80.00-140.00 98.64 108.39 91.93 -9.75 -9.00 6.71 7.30
Big Onion (Local) - - - - - - - -
Source: Marketing, Food Policy and Agribusiness Division/HARTI
Table 2.2.6: Monthly Average CIF, Wholesale and Retail Prices of Imported Onion
Crop Month
CIF Price Wholesale Price Retail Price
Margin (Rs/kg)
(Rs/kg) (Rs/kg) (Rs/kg) WP-CIF RP-WP
Big onion
July.2015 56.09 70.99 98.64 14.90 27.65
June.2015 52.59 82.29 108.39 29.70 26.10
July.2014 49.13 73.67 91.93 24.54 18.26
Red onion
July.2015 105.38 123.88 147.29 18.49 23.42
June.2015 101.48 115.36 142.85 13.88 27.49
July.2014 57.45 56.74 104.55 -0.71 47.81
Source: Department of Customs; Marketing, Food Policy and Agribusiness Division/HARTI
Table 2.2.7: Quantity, Value and CIF Prices of Imported Big Onion and Red Onion
Crop Quantity (mt.) Value (Rs. mn) CIF Price (Rs/kg)
July 2015 June 2015 July 2015 June 2015 July 2015 June 2015
Red Onion 847.18 1383.50 89.28 140.39 105.38 101.48
Big Onion 19530.12 22393.78 1095.39 1177.67 56.09 52.59
Source: Department of Custom

9
Table 2.2.8: Quantity Imported, CIF Price, Wholesale and Retail Price of Big Onion
- February to July 2015
Month Quantity
Imported (mt)
CIF Price
(Rs/kg)
Wholesale
Price (Rs/kg)
Retail
Price (Rs/kg)
Gross Margin
(RP-CIF)
(Rs/kg)
July 19530.12 56.09 70.99 98.64 42.55
June 22393.78 52.59 82.29 108.39 55.80
May 22288.23 45.53 91.21 115.99 70.46
Apr 17614.60 44.27 62.85 89.56 45.29
Mar 22313.71 45.33 61.69 85.73 40.40
Feb 20840.51 42.40 58.45 83.99 41.59
Source: Department of Customs
2.3 Potato
Crop Situation and Progress
The targeted extent of potato for yala 2015 is 3,076 ha and about 1,848 ha were cultivated by the
end of July achieving 60% of the total targeted extent. Though the cultivated extent was low in
April to June of this yala season, the extent of potato cultivated in July was high, which was
recorded as 1,320ha. According to the cultivated extent up to end of this month, the expected
production of potato for this yala season is 29,504 mt.
In the Nuwara Eliya district, about 583 ha of potato were cultivated by the end of this month
achieving 68% of the targeted extent. Compared to the same period of last yala season, the
cultivated extent was at a high level during this yala season due to favourable weather condition,
receiving high price in last maha season and due to the seed distribution programme of the
Department of Agriculture.
In the Badulla districts, the targeted extent is 2,214 ha for this yala season and about 1,264 ha was
cultivated by the end of this month achieving 57% of the targeted extent. During the month, about
987 ha of potato was cultivated. Compared to the same period of yala 2014, the cultivated extent
is at a low level in yala 2015 in the district.
Table 2.3.1: Cultivation Progress and Expected Production of Potato (Yala2015)
District Targeted Extent (ha) Achievement (ha) Progress (%) Expected
Yala
2014*
Yala
2015
Yala
2014*
Yala
2015
Yala
2015
Production
(mt)
N'Eliya 900 860 483 583 68 9,737
Badulla 2,198 2,214 1,503 1,264 57 19,768
Sri Lanka 3,098 3,076 1,986 1,848 60 29,504
Source: MFPAD/HARTI
Crop Forecast No.4, Yala 2015, Socio-economic & Planning Centre/DOA
*Crop Forecast No.4, Yala 2014, Socio-economic & Planning Centre/DOA
Prices and Supply/Demand Situation
A quantity of 17,005 mt of potato had been imported in July which was 5,033 mt higher than that
was imported during the previous month as the special commodity levy for imported potato has
been reduced to Rs.30.00/kg with effect from 06/06/2015. Imported stocks were received from
Pakistan, India, China and Bangladesh. About 40% of the imported stocks were received from

10
Pakistan during this month. Compared to July, 2014 (24,353 mt), the imports were low during this
month. Average CIF price was Rs.36.96/kg in July.
Both local and imported stocks were available in the market. With regard to local potato, the
supply of Welimada potato was at a low level due to end of the peak harvesting period in the
Badulla district. Also, the supply of Nuwara Eliya potato has decreased slightly. Hence, the
wholesale and retail prices of Nuwara Eliya potato have increased by 3% and 10% respectively.
On average, the producer price of Nuwara Eliya potato was Rs.104.00/kg in July. Meanwhile, the
wholesale and retail prices of imported potato have decreased by 17% and 9% respectively due to
availability of ample stocks. During the month, the wholesale prices of Nuwara Eliya and
imported potatoes ranged between Rs.90.00-130.00/kg and Rs.57.00-100.00/kg respectively.
Compared to the same period of last year, the current retail prices of Nuwara Eliya (12%) and
imported (17%) potatoes have decreased. Supply of local potato will be high from the end of
August due to commencement of the yala harvesting.
Table 2.3.2: Quantity, Value and CIF prices of Imported Potatoes - February to July 2015
Month Quantity
(mt.)
Value
(Rs.mn)
CIF price
(Rs/kg)
Retail Price
(Rs/kg)
Gross Margin
(Rs/kg)
July 17005.16 628.57 36.96 100.13 63.17
June 11972.16 369.73 30.88 110.13 79.25
May 5965.66 132.55 22.22 108.23 86.01
Apr 12471.59 302.80 24.28 90.97 66.69
Mar 8118.18 231.96 28.57 92.29 63.72
Feb 15462.91 483.51 31.27 79.99 48.72
Source: Department of Customs; Marketing Food Policy and Agribusiness Division/HARTI
Table: 2.3.3: Producer, Wholesale and Retail prices of Potato – July 2015
Items
Price Range Average Change Compared to
July 2015 July
2015
June
2015
July
2014 June 2015 July 2014
Rs/kg Rs/kg Rs/kg Rs/kg Rs/kg % Rs/kg %
Producer Prices (PP)
Welimada - - 93.95 104.24 - - - -
Nuwara Eliya 95.00-110.00 104.15 105.04 124.35 -0.89 -0.85 -20.20 -16.24
Imported – CIF 26.73-47.85 36.96 30.88 39.39 6.08 19.69 -2.43 -6.17
Wholesale Prices (WP)
Welimada - - 99.13 120.13 - - - -
Nuwara Eliya 90.00-130.00 119.31 116.15 140.41 3.16 2.72 -21.10 -15.02
Imported 57.00-100.00 72.96 88.50 86.82 -15.53 -17.55 -13.86 -15.96
Retail Prices (RP)
Welimada - - - - - - - -
Nuwara Eliya 120.00-200.00 156.77 146.91 177.57 9.86 6.71 -20.80 -11.71
Imported 80.00-160.00 100.13 110.13 121.02 -10.00 -9.08 -20.89 -17.26
Gross Margin (RP-PP)
Welimada - - - - - - -
Nuwara Eliya 52.62 41.87 53.22 10.75 25.67 -0.60 -1.13
Imported (CIF-RP) 63.17 79.25 81.63 -16.08 -20.29 -18.46 -22.61
Gross Margin (RP -WP)
Welimada - - - - - - -
Nuwara Eliya 37.46 30.76 37.16 6.70 21.76 0.30 0.80
Imported 27.17 21.63 34.20 5.53 25.57 -7.03 -20.56
Source: Marketing Food Policy and Agribusiness Division/HARTI

11
2.4 Green gram and Cowpea
Crop Situation
The targeted extent of green gram for yala 2015 is 10,710 ha and out of which about 3,933 ha
were cultivated by the end of July representing 37% of the total targeted extent. Compared to the
same period of yala 2014, the cultivated extent is low in all the major producing areas for yala
2015 due to increased extent of paddy in most of the producing areas with favourable weather
condition. According to the cultivated extent up to now, the expected production of green gram is
5,596 mt for this yala season. In the Hambantota district, the targeted extent is 3,537 ha for this
yala season and only 425 ha were cultivated by the end of this month. In Kurunegala and
Moneragala districts, the targeted extents were 1,250 ha and 880 ha respectively and about 687 ha
and 343 ha were cultivated by the end of July achieving 55% and 39% of the targeted extents.
The targeted extent of cowpea was 8,414 ha for yala 2015 and about 3,525 ha were cultivated by
the end of July achieving 42% of the targeted extent. The highest targeted extent of 3,584 ha was
recorded in the Ampara district for this yala season and about 1,448 ha were cultivated by the end
of this month achieving 40% of the targeted extent. In Kurunegala and Moneragala districts, the
targeted extents were 1,250 ha and 584 ha respectively and about 332 ha and 509 ha were
cultivated by the end of this month achieving 26% and 87% of the targeted extents. Compared to
the same period of yala 2014, the cultivated extents of cowpea in all the districts were at a low
level during this yala season due to increased cultivation of paddy during this yala season.
Table 2.4.1: Cultivation Progress and Expected Production of Green gram and Cowpea
(Yala 2015)
Crop District Targeted Ext. (ha) Achievement (ha) Progress (%) Expected
Yala
2014*
Yala
2015
Yala
2014*
Yala
2015
Yala
2015
Production
(mt)
Green Hambantota 4,690 3,537 4,303 425 12 608
gram Kurunegala 720 1,250 809 687 55 518
Moneragala 618 880 502 343 39 440
Sri Lanka 12,556 10,710 9,251 3,933 37 5,596
Cowpea Ampara 4,222 3,584 1,787 1,448 40 2,458
Kurunegala 814 1,250 405 332 26 232
Moneragala 709 584 772 509 87 542
Sri Lanka 8,542 8,414 4,940 3,525 42 4,707
Source: MFPAD/HARTI
Crop Forecast No.4, Yala 2015, Socio-economic & Planning Centre/DOA
*Crop Forecast No.4, Yala 2014, Socio-economic & Planning Centre/DOA
Prices and Supply Demand Situation
A quantity of 1,506 mt of green gram was imported in July and it was 45 mt lower than the
quantity imported in June. The average CIF price was Rs.177.00/kg in July. About 81% of the
imports were received from Australia. In addition to that, few stocks were received from
Argentina and Myanmar. Compared to July, 2014 (671 mt), the imported quantity of green gram
was higher in July, 2015. Wholesale and retail prices of green gram have decreased by 8% and
4% respectively during this month due to availability of sufficient stocks of imported green gram.
During the month, the wholesale price of green gram ranged between Rs.150.00-198.00/kg.
Compared to the same period of last year, the current retail price of green gram had decreased by
26%.

12
A quantity of 214 mt of cowpea was imported in July and about 78% of that was received from
Myanmar. The average CIF price was Rs.118.00/kg. Wholesale price of white cowpea has
increased by 1% while the retail price has decreased by 1%. However, the wholesale and retail
prices of red cowpea have decreased by 3% and 2% respectively due to high stocks of local
cowpea. During the month, the wholesale prices of white and red cowpea ranged between
Rs.165.00-225.00/kg and Rs.200.00-225.00/kg respectively. Imported stocks fetched a high price.
Compared to the same period of last year, the current retail price of white cowpea (5%) has
decreased, while the price of red cowpea (5%) has increased.
Table 2.4.2: Quantity, Value and CIF prices of Imported Green gram
- February to July 2015
Month Quantity
(mt)
Value
(Rs.mn)
CIF price
(Rs/kg)
Retail Price
(Rs/kg)
Gross Margin
(Rs/kg)
July 1,506 266.09 176.63 239.67 63.04
June 1,551 264.00 170.21 249.99 79.78
May 697 122.00 175.04 258.41 83.37
Apr 1,497 268.00 179.02 268.51 89.49
Mar 1,817 316.00 173.91 272.89 98.98
Feb 1,104 200.00 181.16 284.50 103.34
Source: Department of Custom; Marketing Food Policy and Agribusiness Division/HARTI
Table 2.4.3: Wholesale and Retail Prices of Green gram and Cowpea- July 2015
Items
Price Range Average Change Compared to
July 2015 July 2015 June 2015 July
2014 June 2015 July 2014
Rs/kg Rs/kg Rs/kg Rs/kg Rs/kg % Rs/kg % Wholesale Prices
Green gram 150.00-198.00 181.22 197.92 284.65 -16.70 -8.44 -103.43 -36.34
Cowpea (White) 165.00-225.00 196.75 194.68 170.72 2.08 1.07 26.03 15.25
Cowpea (Red) 200.00-225.00 196.73 202.20 150.89 -5.47 -2.71 45.83 30.37
Retail Prices
Green gram 200.00-270.00 239.67 249.99 324.25 -10.32 -4.13 -84.58 -26.08
Cowpea (White) 200.00-280.00 245.32 248.62 256.94 -3.30 -1.33 -11.62 -4.52
Cowpea (Red) 220.00-300.00 241.59 247.55 229.96 -5.96 -2.41 11.63 5.06 Source: Marketing Food Policy & Agribusiness Division/HARTI
Table 2.4.4: Monthly Average CIF, Wholesale and Retail Prices of Green gram And Cowpea
Crop Month CIF Price
(Rs/kg) Wholesale
price (Rs/kg) Retail price
(Rs/kg)
Gross Margin (Rs/Kg)
WP-CIF RP-WP
Green gram
July.2015 176.63 181.22 239.67 4.59 58.45
June.2015 170.21 197.92 249.99 27.71 52.07
July.2014 178.54 284.65 324.25 106.11 39.60
Cowpea (White)
July.2015 118.52 196.75 245.32 78.23 48.57
June.2015 - 194.68 248.62 - 53.94
July.2014 - 170.72 256.94 - 86.22
July.2015 - 196.73 241.59 - 44.87
Cowpea (Red) June.2015 - 202.20 247.55 - 45.35
July.2014 - 150.89 229.96 - 79.07 Source: Department of Customs, Marketing Food Policy & Agribusiness Division/HARTI

13
2.5 Red dhal
Prices and Supply/Demand Situation
A quantity of 10,858 mt of red dhal was imported in July and it was 2,311 mt lower than the
quantity imported in June. About 81% of the stocks had been received from Australia. Compared
to July, 2014 (12,714 mt), the imports of red dhal were low during this month. The average CIF
price was Rs.131.00/kg during the month.
Wholesale and retail prices of red dhal have decreased by 5% and 3% respectively. The average
wholesale price was Rs.169.00/kg in July. Compared to the same period of last year, the current
retail price of red dhal has increased by 14%.
Table 2.5.1: Wholesale and Retail Prices of Red dhal – July 2015
Red Dhal
Price Range Average Change Compared to
July 2015 July 2015 June 2015 July 2014 June 2015 July 2014
Rs/kg Rs/kg Rs/kg Rs/kg Rs/kg % Rs/kg %
Wholesale Price 160.00-185.00 169.28 177.47 149.85 -8.20 -4.62 19.42 12.96 Retail Price 170.00-220.00 188.24 193.97 165.01 -5.73 -2.95 23.23 14.08 Source: Marketing Food Policy & Agribusiness Division
Table 2.5.2: The CIF, Wholesale and Retail Prices of Red - February to July 2015
Month Quantity
(mt) CIF Price
Rs/kg Wholesale price
Rs/kg Retail price
Rs/kg
Gross Margin (Rs/kg)
CIF-WP WP-RP
July 10858.38 131.45 169.28 188.24 37.83 18.96
June 13169.48 129.29 177.47 193.97 48.18 16.50
May 10190.51 120.63 184.48 196.02 63.85 11.55
Apr 13848.16 122.90 165.69 176.96 42.79 11.27
Mar 17518.79 119.23 159.87 177.11 40.64 17.24
Feb 16159.64 119.79 161.68 171.71 41.89 10.03 Source: Department of Customs, Marketing Food Policy & Agribusiness Division/HARTI
3. Vegetables
Crop Situation
With the reaching of early phase of the Yala harvesting season, the supply started showing an
increasing trend from all the upcountry major producing areas. In the meantime, crop
establishment has progressed well in all the upcountry areas. In Matale district, the set target for
Yala season is 4,363 ha of which 1,759 ha were achieved by the end of July. The cultivation
progress in the district was 13% higher than the same period of last year. Regarding Badulla
district, the reported cultivation progress at the end of July was 40% of the seasonal target of
6,504 ha. In Nuwara Eliya district, the set target for upcountry varieties in the Yala season is
5,433 ha of which 3,218 ha were achieved by the end of July, recording an achievement of 59% of
the seasonal target. Further, crop establishment for Yala season has progressed well in the Kandy
district with the rainy weather continuing in the cultivation season. The crop progress for major
vegetables in the district was 78% at the end of July. In Ratnapura district, beans cultivation has
recorded 86% progress of the seasonal target, by the end of July.
Crop establishment has continued well, in all the lowcountry major producing areas of low
country districts with the received rainfall throughout the cultivation season. In Ratnapura
district, the set target for lowcountry varieties in the Yala season is 1,380 ha for lowcountry
varieties, whilst the extent cultivated by the end of July was 1,000 ha. In the meantime, vegetable
14
cultivation has progressed well in Puttalam district reporting the highest cultivation extent for
long beans as 400 ha followed by beetroot as 198 ha. In Hambantota district, reported lowcountry
vegetable cultivation extent was 3,091 ha, marking almost a 100% cultivation progress compared
to the same period of the last year.
Prices and supply/Demand situation
With the reaching of early phase of the Yala harvesting season for vegetables, high supplies have
reached the market from all the major producing areas of upcountry vegetables such as Nuwara
Eliya, Welimada, Badulla, Kandy, Matale and Ratnapura, in July. The total supply of vegetables
in the Matale district was around 7,700 mt in July, which recorded a 103% compared to previous
month. The highest supply from the district was recorded for cucumber, knokhol and sweet
potato as 500 mt for each, within the month of July. The daily supply of vegetables at the
Dambulla Dedicated Economic Centre was around 1,500-1,800 mt in July, which recorded a 50%
increase compared to last month.
Considering upcountry vegetables, prices of almost all the vegetable varieties have decreased in
July, compared to previous month, due to increasing trend in market supplies. The highest price
decrease was reported for radish as 44% followed by leeks as 41% and cabbage as 37%. Prices of
all the other upcountry varieties have decreased in the range of 14%-31% due to high supplies.
High stocks of leeks, radish and cabbage have reached the market from Nuwara Eliya, Badulla,
Matale and Kandy had caused a considerable price decreases in this month. Rainy weather that
prevailed throughout the growing season has increased the water availability for agricultural
purposes and raised the extent cultivated in upcountry areas, considerably. Due to continued
supply, prices remained low for three weeks in the considered month.
As the harvesting of tomato continued up to the first week of June, in the cultivation that had been
established in the previous season, re-planting of tomato was delayed in current Yala season.
Prevailed favorable weather condition had caused increased harvesting length for tomato
cultivation in the last Maha season. Therefore, supply of tomato has reduced considerably in July
and as a result prices have increased in a higher margin as 125% in July compared to June. Along
with tomato, prices of capsicum have also increased by 12% in July.
The supply of most of the domestic vegetables has increased in the peak harvesting season and
thereby prices have decreased for most of the varieties except for pumpkin, luffa and ash plantain.
The highest prices decrease was recorded for drumsticks as 74% followed by cucumber as 26%
and long beans as 12%. Prices of other varieties except pumpkin, luffa and ash plantain have
decreased in a range of 1% -11%, due to high supplies. As major low country producing such as
Hambantota has recorded 100% crop progress compared to same period of the last year, continued
supply has reached the market thorough the month.
Stocks of pumpkin have continued to reach the market from Monaragala and Anuradhapura, in
the last month, and thereby prices had decreased up to Rs.17.00/kg in June. This was evident due
to delayed planting of pumpkin in last Maha season. With the ending of Maha supply of pumpkin,
the supply has reduced considerably hence prices have increased by a higher margin, 71%
compared to last month. With the supply of Yala harvest in August, prices are expected to reduce
compared to the current month.
Regarding lime, a price decrease of 30% was experienced in July, compared to previous month,
due to increased supply from Monaragala. Meanwhile, prices of green chilies have further
increased by 111% due to decreased supply from Jaffna and Puttalam.

15
In line with the wholesale prices, retail prices of most of the vegetables had decreased in July.
The highest price decrease was reported for drumsticks as 78% followed by 23% for beetroot.
Table 3.1: Wholesale Prices of Vegetables – July 2015
Items
Price Range Average Change Compared to
July 2015 July 2015 June 2015 July
2014 June 2015 July 2014
Rs/kg Rs/kg Rs/kg Rs/kg Rs/kg % Rs/kg %
Beans (green) 100.00-160.00 134.98 162.56 85.34 -27.58 -16.97 49.64 58.17
Carrot 90.00-180.00 123.34 177.79 109.61 -54.45 -30.63 13.73 12.53
Leeks 50.00-90.00 70.29 119.51 44.50 -49.22 -41.18 25.79 57.96
Beetroot 50.00-130.00 90.70 105.65 86.52 -14.95 -14.15 4.18 4.83
Knokhol 50.00-80.00 60.47 78.89 46.09 -18.42 -23.35 14.38 31.20
Radish 30.00-50.00 36.22 65.26 29.29 -29.04 -44.50 6.93 23.66
Cabbage 25.00-40.00 33.54 53.13 81.85 -19.59 -36.87 -48.31 -59.02
Tomato 50.00-130.00 89.04 39.50 116.33 49.54 125.42 -27.29 -23.46
Ladies Fingers 40.00-70.00 51.68 63.04 41.48 -11.36 -18.02 10.20 24.59
Brinjal 20.00-60.00 34.55 44.76 42.84 -10.21 -22.81 -8.29 -19.35
Capsicum 150.00-200.00 184.49 165.06 173.95 19.43 11.77 10.54 6.06
Pumpkin 15.00-50.00 28.66 16.78 45.69 11.88 70.80 -17.03 -37.27
Cucumber 20.00-40.00 25.42 34.19 19.14 -8.77 -25.65 6.28 32.81
Bittergourd 90.00-130.00 108.03 109.01 88.40 -0.98 -0.90 19.63 22.21
Snakegourd 40.00-70.00 50.44 56.71 56.17 -6.27 -11.06 -5.73 -10.20
Drumstick 30.00-90.00 52.61 198.86 71.11 -146.25 -73.54 -18.50 -26.02
Luffa 60.00-100.00 77.27 75.07 50.50 2.20 2.93 26.77 53.01
Long Beans 60.00-100.00 79.23 89.68 62.02 -10.45 -11.65 17.21 27.75
Ash Plantain 50.00-70.00 56.30 50.03 54.46 6.27 12.53 1.84 3.38
Green Chillies 200.00-450.00 336.94 159.11 496.87 177.83 111.77 -159.93 -32.19
Lime 40.00-120.00 75.43 107.52 73.11 -32.09 -29.85 2.32 3.17
Source: Marketing, Food Policy and Agribusiness Division/HARTI
Table 3.2: Retail Prices of Vegetables – July 2015
Items
Price Range Average Change Compared to
July 2015 July 2015 June 2015 July 2014 June 2015 July 2014
Rs/kg Rs/kg Rs/kg Rs/kg Rs/kg % Rs/kg %
Beans (green) 120.00-280.00 194.90 222.82 129.50 -27.92 -12.53 65.40 50.50
Carrot 120.00-320.00 201.26 241.89 170.70 -40.63 -16.80 30.56 17.90
Leeks 80.00-240.00 152.24 198.31 109.70 -46.07 -23.23 42.54 38.78
Beetroot 80.00-240.00 155.01 180.01 142.31 -25.00 -13.89 12.70 8.92
Knokhol 80.00-200.00 138.02 170.08 118.23 -32.06 -18.85 19.79 16.74
Radish 60.00-160.00 106.51 117.62 88.85 -11.11 -9.45 17.66 19.88
Cabbage 60.00-160.00 107.13 123.32 147.21 -16.19 -13.13 -40.08 -27.23
Tomato 80.00-240.00 153.60 91.61 202.17 61.99 67.67 -48.57 -24.02
Ladies Fingers 70.00-160.00 114.08 124.75 101.91 -10.67 -8.55 12.17 11.94
Brinjal 60.00-200.00 97.20 110.77 108.12 -13.57 -12.25 -10.92 -10.10
Capsicum 200.00-350.00 260.46 236.46 262.28 24.00 10.15 -1.82 -0.69
Pumpkin 40.00-120.00 76.00 66.91 100.73 9.09 13.59 -24.73 -24.55
Cucumber 40.00-120.00 77.35 87.67 74.27 -10.32 -11.77 3.08 4.15
Bittergourd 100.00-240.00 160.63 172.87 154.38 -12.24 -7.08 6.25 4.05
Snakegourd 60.00-160.00 117.16 116.96 118.28 0.20 0.17 -1.12 -0.95
Drumstick 80.00-320.00 137.15 636.41 169.68 -499.26 -78.45 -32.53 -19.17
Luffa 80.00-240.00 142.74 139.77 123.56 2.97 2.12 19.18 15.52
Long Beans 100.00-240.00 158.27 165.31 121.45 -7.04 -4.26 36.82 30.32
Ash Plantain 80.00-160.00 120.55 115.72 112.81 4.83 4.17 7.74 6.86
Green Chillies 320.00-700.00 533.43 260.45 687.31 272.98 104.81 -153.88 -22.39
Lime 100.00-300.00 213.12 271.51 199.77 -58.39 -21.51 13.35 6.68
Source: Marketing, Food Policy and Agribusiness Division/HART
16
4. Fruits
Prices and Supply/Demand Situation
Prices of most of the fruits had increased during the month due to end of the harvesting season.
The highest price increased of mango by about 85% (vilad) followed by other varieties mango
56% (betti) 46% (karthakolomban). Supplies of papaw had increased from Wellawaya,
Embilipitiya, and Sooriyawewa areas due to rainy weather condition. Further, the low supplies of
banana reached from Embilimitiya, Hambantota, Sooriyawewa and Wellawaya areas and
wholesale prices of all the varieties of banana had increased in the range of 19%-46% with the
highest price increased of ambul. Supplies of all the sizes of pineapple had decreased from
Gampaha, Giriulla, Kuliyapitiya, Weliweriya and Kirindiwella areas and wholesale prices of all
the sizes of pineapple had increased in the range of 31%-50%. Further, the wholesale prices of
wood apple, avocado and orange had decreased by 14%, 30% and 28% respectively due to low
demand. Compared to the same period of previous year wholesale prices of most of the fruits had
decreased with the highest price increase of 196% for mango (karthakolomban).
In line with the wholesale prices, retail prices of most of the fruits had increased with the highest
price decrease of 50% for mango (karthakolomban). High supplies of pineapple, banana, mango
and papaw had recorded in all the retail markets especially in Colombo and Suburbs. Compared to
the same period of last year, retail prices of most of the fruits had increased with the highest price
crease of 181% for mango (karthakolomban).
Producer prices of all the selected fruits had increased compared to the previous month with the
highest price increase of 26% for pineapple. Compared to the same period of previous year.
Producer prices of all the fruits except pineapple had increased with the highest price increase of
121% for papaw.
Exports/Imports of Fruits
Papaw was the mostly exported type of fruit in July with the quantity of 296.69mt. The total
income of exporting pineapple, mango, papaw, orange and avocado was Rs.51.24mn in July.
Apple was the mostly imported type of fruit further in July with a quantity of 1,730.16mt. The
total import expenditure of apple, grapes and orange was Rs.467.13mn in July.

17
Table 4.1: Wholesale Prices of Fruits – July 2015
Items
Price Range Average Change Compared to
July 2015 July 2015 June 2015 July 2014 June 2015 July 2014
Rs/kg Rs/kg Rs/kg Rs/kg Rs/kg % Rs/kg %
Plantain
Ambul (Rs/kg) 30.00-60.00 42.88 29.38 36.43 13.50 45.95 6.45 17.71
Kolikuttu (Rs/kg) 100.00-160.00 132.51 106.66 78.49 25.85 24.24 54.02 68.82
Seeni (Rs/kg) 30.00-55.00 45.10 37.12 35.80 7.98 21.50 9.30 25.98
Anamalu 6.00-10.00 8.07 6.78 7.27 1.29 19.03 0.80 11.00
Ambun 10.00-15.00 12.53 10.23 10.01 2.30 22.48 2.52 25.17
Pineapple
Large 120.00-160.00 146.16 111.20 128.94 34.96 31.44 17.22 13.36
Medium 100.00-140.00 119.07 83.79 107.88 35.28 42.11 11.19 10.37
Small 80.00-110.00 94.22 62.75 85.86 31.47 50.15 8.36 9.74
Mango
Betti 16.00-33.00 26.06 16.74 9.84 9.32 55.68 16.22 164.84
Karthakolomban 72.00-155.00 106.27 71.04 35.85 35.23 49.59 70.42 196.43
Vilad 20.00-66.00 37.72 20.42 12.05 17.30 84.72 25.67 213.03
Kohu 12.00-22.00 16.11 12.04 6.87 4.07 33.80 9.24 134.50
Papaw (Rs/kg) 50.00-120.00 79.66 109.74 54.76 -30.08 -27.41 24.90 45.47
Passionfruit 6.00-10.00 8.63 7.30 8.80 1.33 18.22 -0.17 -1.93
Woodapple 20.00-60.00 43.68 51.12 26.07 -7.44 -14.55 17.61 67.55
Orange 20.00-30.00 24.21 33.83 32.67 -9.62 -28.44 -8.46 -25.90
Avocado 18.00-36.00 25.38 36.43 27.34 -11.05 -30.33 -1.96 -7.17
Slime Apple 20.00-40.00 31.30 32.71 21.48 -1.41 -4.31 9.82 45.72
Grapes Imported
(Rs/kg) 411.00-537.00 480.16 511.87 462.63 -31.71 -6.19 17.53 3.79
Source: Marketing, Food Policy and Agribusiness Division/HARTI
Table 4.2: Retail Prices of Fruits – July 2015
Items
Price Range Average Change Compared to
July 2015 July
2015
June
2015
July
2014 June 2015 July 2014
Rs/kg Rs/kg Rs/kg Rs/kg Rs/kg % Rs/kg %
Plantain
Ambul (Rs/kg) 60.00-90.00 76.70 68.17 71.70 8.53 12.51 5.00 6.97
Kolikuttu (Rs/kg) 130.00-200.00 170.10 156.00 129.80 14.10 9.04 40.30 31.05
Seeni (Rs/kg) 60.00-90.00 77.26 73.23 71.80 4.03 5.50 5.46 7.60
Anamalu 12.00-20.00 14.92 13.13 12.30 1.79 13.63 2.62 21.30
Ambun 15.00-20.00 17.68 14.84 14.25 2.84 19.14 3.43 24.07
Pineapple
Large 130.00-220.00 173.23 144.21 166.31 29.02 20.12 6.92 4.16
Medium 110.00-150.00 131.86 98.15 137.11 33.71 34.35 -5.25 -3.83
Small 90.00-130.00 102.09 74.82 108.75 27.27 36.45 -6.66 -6.12
Mango
Betti 30.00-60.00 44.26 34.93 25.70 9.33 26.71 18.56 72.22
Karthakolomban 100.00-200.00 149.31 96.68 53.11 52.63 54.44 96.20 181.13
Vilad 35.00-100.00 63.49 42.08 32.98 21.41 50.88 30.51 92.51
Kohu - - 17.50 17.51 - - - -
Papaw (Rs/kg) 80.00-180.00 134.90 164.20 84.20 -29.30 -17.84 50.70 60.21
Passionfruit 11.00-20.83 15.67 14.95 15.58 0.72 4.82 0.09 0.58
Woodapple 40.00-100.00 70.30 70.93 64.74 -0.63 -0.89 5.56 8.59
Orange 30.00-60.00 46.28 53.78 55.12 -7.50 -13.95 -8.84 -16.04
Avocado 35.00-80.00 54.29 54.31 56.72 -0.02 -0.04 -2.43 -4.28
Slime Apple 40.00-80.00 56.25 54.57 48.59 1.68 3.08 7.66 15.76
Grapes Imported
(Rs/kg) 650.00-900.00 766.13 776.74 741.32 -10.61 -1.37 24.81 3.35
Source: Marketing, Food Policy and Agribusiness Division/HARTI

18
Table 4.3: Producer Prices of Selected Fruits – July 2015
Items
Price Range Average Change Compared to
July 2015 July 2015 June 2015 July 2014 June 2015 July 2014
Rs/kg Rs/kg Rs/kg Rs/kg Rs/kg % Rs/kg %
Ambul 21.00-34.00 28.14 22.90 23.85 5.24 22.89 4.29 17.99
Kolikuttu 80.00-118.00 94.71 89.00 56.33 5.71 6.41 38.38 68.13
Papaw 55.00-95.00 76.13 66.08 34.39 10.05 15.20 41.74 121.36
Pineapple 59.00-65.00 61.00 48.30 75.85 12.70 26.29 -14.85 -19.58
Source Marketing Food Policy Agribusiness Division, HARTI
Table 4.4: Quantity, Value and FOB Prices of Exported Fruits May - July 2015
Type of Fruit
July June May
Qty
(mt)
Value
(Rs.mn)
FOB
(Rs/kg)
Qty
(mt)
Value
(Rs.mn)
FOB
(Rs/kg)
Qty
(mt)
Value
(Rs.mn)
FOB
(Rs/kg)
Fresh Pineapple 100.53 20.91 207.97 122.35 25.86 211.34 161.33 28.38 175.89
Papaw 296.69 27.43 92.46 202.81 14.70 72.47 336.04 27.84 82.86
Fresh Mango 5.60 2.90 518.23 1.67 0.91 542.89 2.36 2.36 1000.63
Fresh Oranges - - - 0.49 0.05 104.98 0.17 0.02 105.31
Avocados, fresh - - - 0.58 0.06 105.32 - - -
Source: Sri Lanka Customs(FOB=Free On Board)
Table 4.5: Quantity, Value and CIF Prices of Imported Fruits
May – July 2015
Type of
Fruit
July June May
Qty
(mt)
Value
(Rs.mn)
CIF
(Rs/kg)
Qty
(mt)
Value
(Rs.mn)
CIF
(Rs/kg)
Qty
(mt)
Value
(Rs.mn)
CIF
(Rs/kg)
Apple 1,730.16 244.12 141.09 1,964.80 304.42 154.94 1,718.59 266.54 155.09
Grapes 347.99 104.16 299.31 401.68 132.70 330.36 462.27 149.21 322.78
Oranges 1085.05 103.31 95.21 864.95 83.88 96.98 801.58 58.35 72.79
Mandarin 241.78 15.54 64.27 199.15 12.49 62.73 21.90 0.86 39.14
Source: Sri Lanka Customs
(CIF=Cost Insurance and Freight) 5. Fish, Dried Fish, Eggs and Meat Fish
Prices and Supply/Demand Situation
Prices of all the fresh fish varieties except hurulla and shrimp had increased at the wholesale level.
The highest price increase of 37% was reported for salaya. In addition, prices of balaya,
kelawalla, thora, paraw and thalapath had increased in the range of 2%-10%. Meanwhile, price of
shrimp had decreased by 17%. Of the varieties, significant price changes were not observed for
both mora and hurulla. According to the market information, stormy weather condition prevailed
in the most of the coastal areas in the country had resulted limited stocks reaching the market. At
the same time, there was a high consumer demand for fish because of the Ramazan season. These
reasons had contributed fairly to these price increases. In the month of July, the monthly average
wholesale prices of selected fresh fish varieties ranged between Rs.150.06 – 1,178.29/kg. It can be
expected that fish prices could decrease in the coming month due to the onset of the fishing
season for coastal fisheries in the Eastern coastal belt. Compared to the same month in 2014,
wholesale prices of all the fresh fish varieties except salaya, shrimp and thalapath had increased in
the range of 3%-25% with the highest price increase noted for kelawalla.

19
In line with the increased wholesale prices, prices of all the fresh fish varieties except mora and
shrimp had increased in the range of 2%-35% at the retail level. The highest price increase was
reported for salaya (35%) followed by thora (10%). A price increase of 9% was noted for balaya
while, a price increase of 5% was observed for thalapath. In addition, prices of hurulla, kelawalla
and paraw had increased by 4%, 3% and 2% respectively. Meanwhile, prices of shrimp and mora
had decreased by 15% and 2% respectively. In the month of July, the monthly average retail
prices of selected fresh fish varieties ranged between Rs.206.69 – 1,375.23/kg. Compared to the
same month in 2014, retail prices of most of the fresh fish varieties had decreased slightly in the
range of 1%-4% with the highest price decrease noted for shrimp and thalapath.
Table 5.1: Wholesale and Retail Prices of Fish – July 2015
Items
Price Range Average Change Compared to
July 2015 July
2015
June
2015
July
2014 June 2015 July 2014
Rs/kg Rs/kg Rs/kg Rs/kg Rs/kg % Rs/kg %
Wholesale Prices
Salaya 130.00-180.00 150.06 109.84 159.10 40.22 36.62 -9.04 -5.68
Hurulla 250.00-380.00 310.00 310.50 280.53 -0.50 -0.16 29.47 10.51
Balaya 300.00-460.00 385.75 369.39 375.56 16.36 4.43 10.19 2.71
Kelawalla 500.00-630.00 565.05 532.11 450.96 32.94 6.19 114.09 25.30
Thora 800.00-1400.00 1178.29 1074.70 1035.42 103.59 9.64 142.87 13.80
Paraw 450.00-620.00 548.97 539.77 526.80 9.20 1.70 22.17 4.21
Mora 450.00-620.00 536.26 534.70 462.06 1.56 0.29 74.20 16.06
Shrimp (small) 700.00-950.00 798.75 964.73 810.96 -165.98 -17.20 -12.21 -1.51
Thalapath 560.00-650.00 606.84 565.44 630.44 41.40 7.32 -23.60 -3.74
Retail Prices
Salaya 160.00-320.00 206.69 153.10 209.80 53.59 35.00 -3.11 -1.48
Hurulla 300.00-560.00 402.87 385.51 354.42 17.36 4.50 48.45 13.67
Balaya 400.00-760.00 563.14 514.79 545.63 48.35 9.39 17.51 3.21
Kelawalla 600.00-1000.00 749.19 728.73 709.38 20.46 2.81 39.81 5.61
Thora 1000.00-1700.00 1375.23 1247.94 1392.11 127.29 10.20 -16.88 -1.21
Paraw 550.00-920.00 729.87 718.62 741.66 11.25 1.57 -11.79 -1.59
Mora 550.00-800.00 638.52 649.42 633.06 -10.90 -1.68 5.46 0.86
Shrimp (small) 800.00-1200.00 932.06 1099.69 972.74 -167.63 -15.24 -40.68 -4.18
Thalapath 650.00-1040.00 789.25 750.53 823.50 38.72 5.16 -34.25 -4.16
Source: Marketing, Food Policy and Agribusiness Division/HARTI
Dried Fish
Prices and Supply/Demand Situation
Prices of most of the dried fish varieties had increased with high demand and limited supplies.
The highest price increase of 43% was reported for imported sprats due to availability of high
quality imported stocks mainly from Thailand at a higher price. Apart from that the price of local
sprats and imported maduwa had increased by 15% and the prices of local anguluwa and maduwa
had increased by 8% and 7% respectively. Increase was not significant for most of the other
varieties. However, the prices of both local and imported kattawa, local mora and balaya had
decreased slightly. Local stocks were mainly supplied from Kalpitiya, Mannar and Valachchena
areas, while the imported stocks were mainly from Thailand, Oman and United Aras Emirates.
According to the Department of Customs, a total quality of 1,737mt of dried sprats was imported
in July. The average CIF price was Rs.261.12/kg recording an increase of Rs.11.50/kg against the
previous month. However, the imported quantity of sprats had decreased by 732 mt against the

20
previous month mainly due to high priced Thailand sprats which consisted about 60% of the total
imports. Compared to the same period of last year, wholesale prices of most of the dried fish
varieties had increased with the highest price increase of 19% for local maduwa.
Regarding the retail prices, increase of wholesale prices was reflected and the prices of most of
the dried fish varieties had increased. The highest price increase was observed for imported sprats
by 23% and local sprats it was 8%. The increase in the prices of other varieties was not at a
significant level.
Compared to the same period of last year, retail prices of most of the dries fish varieties had
increased with the highest price increase of 41% was noted for local sprats.
Table 5.2: Wholesale and Retail Prices of Dried Fish – July 2015
Items
Price Range Average Change Compared to
July 2015 July
2015
June
2015
July
2014 June 2015 July 2014
Rs/kg Rs/kg Rs/kg Rs/kg Rs/kg % Rs/kg %
Dried fish – Wholesale
Sprats 700.00-850.00 813.58 707.70 730.46 105.88 14.96 83.12 11.38
Sprats (imported) 250.00-600.00 480.78 336.36 423.08 144.42 42.93 57.70 13.64
Kattawa 680.00-800.00 739.39 754.59 715.91 -15.20 -2.01 23.48 3.28
Kattawa (imported) 640.00-800.00 717.92 736.24 679.73 -18.32 -2.49 38.19 5.62
Thora - - 950.00 850.00 - - - -
Thora (imported) 940.00-1000.00 976.58 945.00 965.50 31.58 3.34 11.08 1.15
Mora 780.00-850.00 798.61 805.06 807.62 -6.45 -0.80 -9.01 -1.12
Mora (imported) 700.00-800.00 764.81 748.76 716.75 16.05 2.14 48.05 6.70
Balaya 400.00-620.00 538.67 551.23 622.41 -12.56 -2.28 -83.74 -13.45
Balaya (imported) 400.00-650.00 540.50 519.59 - 20.91 4.02 - -
Anguluwa 500.00-750.00 620.68 574.20 601.04 46.48 8.10 19.64 3.27
Anguluwa (imported) 400.00-700.00 567.29 546.77 551.91 20.52 3.75 15.38 2.79
Maduwa 400.00-620.00 531.94 496.50 446.41 35.44 7.14 85.53 19.16
Maduwa (imported) 400.00-520.00 452.87 393.30 - 59.57 15.15 - -
Koduwa 550.00-550.00 550.00 - - - - - -
Koduwa(imported) - - - - - - - -
Salaya 200.00-350.00 266.59 259.98 273.73 6.61 2.54 -7.14 -2.61
Salaya (imported) - - - - - - - -
Dried fish – Retail
Sprats 800.00-1200.00 967.36 892.76 686.25 97.27 22.91 -165.37 -24.06
Kattawa 350.00-800.00 521.88 424.61 687.25 -7.32 -0.68 56.22 5.53
Thora 800.00-1300.00 1072.64 1079.96 1016.42 28.64 2.07 141.21 11.11
Mora 1200.00-1800.00 1412.08 1383.44 1270.87 28.64 2.07 141.21 11.11
Balaya 800.00-1200.00 974.58 965.89 932.68 8.69 0.90 41.90 4.49
Anguluwa 600.00-1000.00 816.77 804.70 840.23 12.07 1.50 -23.46 -2.79
Maduwa 700.00-1100.00 908.08 895.76 852.27 12.32 1.38 55.81 6.55
Koduwa 600.00-900.00 728.27 730.63 614.29 -2.36 -0.32 113.98 18.55
Salaya - - - 885.83 - - - -
Source: Marketing, Food Policy and Agribusiness Division/HARTI
21
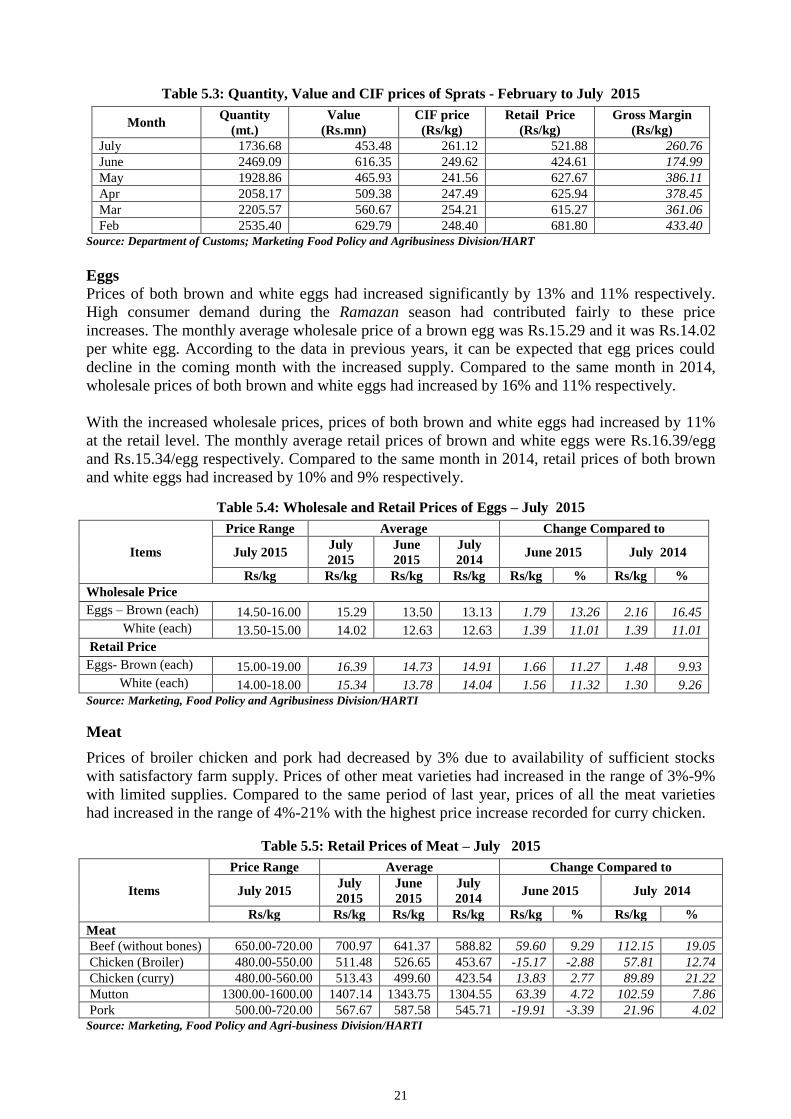
Table 5.3: Quantity, Value and CIF prices of Sprats - February to July 2015
Month Quantity
(mt.)
Value
(Rs.mn)
CIF price
(Rs/kg)
Retail Price
(Rs/kg)
Gross Margin
(Rs/kg)
July 1736.68 453.48 261.12 521.88 260.76
June 2469.09 616.35 249.62 424.61 174.99
May 1928.86 465.93 241.56 627.67 386.11
Apr 2058.17 509.38 247.49 625.94 378.45
Mar 2205.57 560.67 254.21 615.27 361.06
Feb 2535.40 629.79 248.40 681.80 433.40
Source: Department of Customs; Marketing Food Policy and Agribusiness Division/HART
Eggs
Prices of both brown and white eggs had increased significantly by 13% and 11% respectively.
High consumer demand during the Ramazan season had contributed fairly to these price
increases. The monthly average wholesale price of a brown egg was Rs.15.29 and it was Rs.14.02
per white egg. According to the data in previous years, it can be expected that egg prices could
decline in the coming month with the increased supply. Compared to the same month in 2014,
wholesale prices of both brown and white eggs had increased by 16% and 11% respectively.
With the increased wholesale prices, prices of both brown and white eggs had increased by 11%
at the retail level. The monthly average retail prices of brown and white eggs were Rs.16.39/egg
and Rs.15.34/egg respectively. Compared to the same month in 2014, retail prices of both brown
and white eggs had increased by 10% and 9% respectively.
Table 5.4: Wholesale and Retail Prices of Eggs – July 2015
Items
Price Range Average Change Compared to
July 2015 July
2015
June
2015
July
2014 June 2015 July 2014
Rs/kg Rs/kg Rs/kg Rs/kg Rs/kg % Rs/kg %
Wholesale Price
Eggs – Brown (each) 14.50-16.00 15.29 13.50 13.13 1.79 13.26 2.16 16.45
White (each) 13.50-15.00 14.02 12.63 12.63 1.39 11.01 1.39 11.01
Retail Price
Eggs- Brown (each) 15.00-19.00 16.39 14.73 14.91 1.66 11.27 1.48 9.93
White (each) 14.00-18.00 15.34 13.78 14.04 1.56 11.32 1.30 9.26
Source: Marketing, Food Policy and Agribusiness Division/HARTI
Meat
Prices of broiler chicken and pork had decreased by 3% due to availability of sufficient stocks
with satisfactory farm supply. Prices of other meat varieties had increased in the range of 3%-9%
with limited supplies. Compared to the same period of last year, prices of all the meat varieties
had increased in the range of 4%-21% with the highest price increase recorded for curry chicken.
Table 5.5: Retail Prices of Meat – July 2015
Items
Price Range Average Change Compared to
July 2015 July
2015
June
2015
July
2014 June 2015 July 2014
Rs/kg Rs/kg Rs/kg Rs/kg Rs/kg % Rs/kg %
Meat
Beef (without bones) 650.00-720.00 700.97 641.37 588.82 59.60 9.29 112.15 19.05
Chicken (Broiler) 480.00-550.00 511.48 526.65 453.67 -15.17 -2.88 57.81 12.74
Chicken (curry) 480.00-560.00 513.43 499.60 423.54 13.83 2.77 89.89 21.22
Mutton 1300.00-1600.00 1407.14 1343.75 1304.55 63.39 4.72 102.59 7.86
Pork 500.00-720.00 567.67 587.58 545.71 -19.91 -3.39 21.96 4.02
Source: Marketing, Food Policy and Agri-business Division/HARTI

22
6. Wheat grain, Wheat flour and Sugar
Wheat grain, Wheat flour
The imported quantity has shown a considerable decrease because of that the imports were very
low in the previous month. Total quantity of 149628 mt valued at Rs.5,936mn of wheat grain was
imported. The average CIF price was Rs.39.68/kg recording a significant increase of Rs.2.46/kg
against the previous month. Out of the total imports, more than 99 % were imported from Canada
and a very few stocks of only 76 mt from India which fetched the higher CIF price of
Rs.48.27/kg.
Though the imported quantity of wheat flour has shown an increase in the previous month, the
quantity has limited to 60 mt this month. The value of the imports was Rs.4mn and the average
CIF price was Rs.67.83/kg. Out of the total imports about 80% (49 mt) was from India and the
rest from the United Arab Emirates. The Indian wheat flour fetched the high CIF price of
Rs.71.63/kg while it was Rs.47.41/kg for wheat flour imported from the United Arab Emirates.
As the previous month the retail price of wheat flour remained in the range of Rs.78.00-90.00/kg
and the average was Rs.86.27/kg. Compared to the same period of last year retail price of wheat
flour had decreased by about 13%.
Table 6.1: Open Market Retail Prices of Wheat Flour and Sugar– July 2015
Items
Price Range Average Change Compared to
July 2015 July 2015 June
2015 July 2014 June 2015 July 2014
Rs/kg Rs/kg Rs/kg Rs/kg Rs/kg % Rs/kg %
Wheat Flour 78.00-90.00 86.27 86.29 98.86 -0.03 -0.03 -12.60 -12.74
Sugar 73.00-93.00 82.47 83.61 100.73 -1.14 -1.36 -18.26 -18.13
Source: Department of Census and Statistics
Table 6.2: Quantity, Value and CIF prices of Wheat Flour & Grain - February to July 2015
Month Quantity
(mt.)
Value
(Rs.mn)
CIF price
(Rs/kg)
Retail Price
(Rs/kg)
Gross Margin
(Rs/kg)
Wheat Flour
July 60.29 4.09 67.83 86.27 18.44
June 470.63 33.51 71.20 86.29 15.09
May 26.00 1.40 53.80 85.98 32.18
Apr 656.70 44.47 67.72 86.56 18.84
Mar 138.41 9.41 67.99 86.45 18.46
Feb 1188.52 79.56 66.94 87.32 20.38
Wheat Grain
July 149628.02 5936.53 39.68 86.27 46.59
June 255707.48 9517.17 37.22 86.29 49.07
May 188998.88 7444.26 39.39 85.98 46.59
Apr 115469.80 4619.23 40.00 86.56 46.56
Mar 241131.11 9615.19 39.88 86.45 46.57
Feb 64196.17 2544.84 39.64 87.32 47.68
Source: Department of Customs; Marketing Food Policy and Agribusiness Division/HARTI
Sugar
The total quantity of 62902 mt of sugar was imported recording a significant increase of 15677 mt
against the previous month. The value of imports was Rs.3,202mn. Out of the total imports, 53 %
were imported from Brazil, 31% from India, 15% from Thailand and the rest from Malaysia,
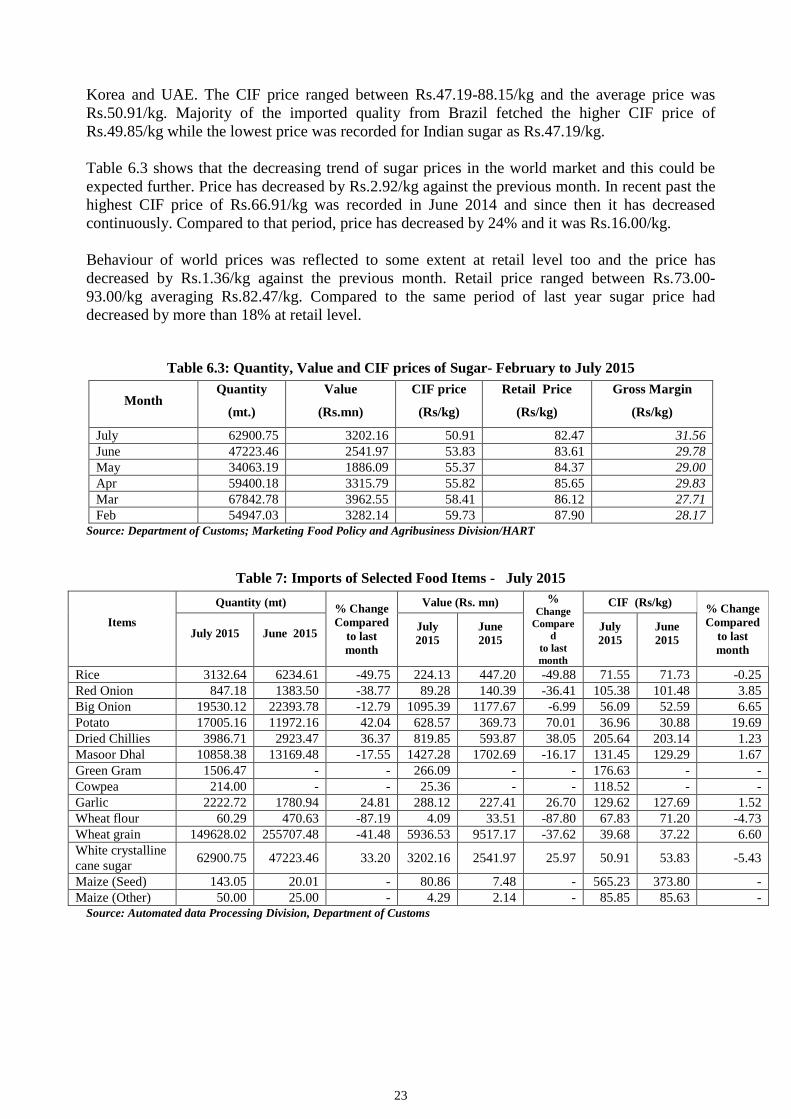
23
Korea and UAE. The CIF price ranged between Rs.47.19-88.15/kg and the average price was
Rs.50.91/kg. Majority of the imported quality from Brazil fetched the higher CIF price of
Rs.49.85/kg while the lowest price was recorded for Indian sugar as Rs.47.19/kg.
Table 6.3 shows that the decreasing trend of sugar prices in the world market and this could be
expected further. Price has decreased by Rs.2.92/kg against the previous month. In recent past the
highest CIF price of Rs.66.91/kg was recorded in June 2014 and since then it has decreased
continuously. Compared to that period, price has decreased by 24% and it was Rs.16.00/kg.
Behaviour of world prices was reflected to some extent at retail level too and the price has
decreased by Rs.1.36/kg against the previous month. Retail price ranged between Rs.73.00-
93.00/kg averaging Rs.82.47/kg. Compared to the same period of last year sugar price had
decreased by more than 18% at retail level.
Table 6.3: Quantity, Value and CIF prices of Sugar- February to July 2015
Month Quantity
(mt.)
Value
(Rs.mn)
CIF price
(Rs/kg)
Retail Price
(Rs/kg)
Gross Margin
(Rs/kg)
July 62900.75 3202.16 50.91 82.47 31.56
June 47223.46 2541.97 53.83 83.61 29.78
May 34063.19 1886.09 55.37 84.37 29.00
Apr 59400.18 3315.79 55.82 85.65 29.83
Mar 67842.78 3962.55 58.41 86.12 27.71
Feb 54947.03 3282.14 59.73 87.90 28.17
Source: Department of Customs; Marketing Food Policy and Agribusiness Division/HART
Table 7: Imports of Selected Food Items - July 2015
Items
Quantity (mt) % Change
Compared
to last
month
Value (Rs. mn) % Change
Compare
d
to last
month
CIF (Rs/kg) % Change
Compared
to last
month
July 2015
June 2015
July
2015
June
2015
July
2015
June
2015
Rice 3132.64 6234.61 -49.75 224.13 447.20 -49.88 71.55 71.73 -0.25
Red Onion 847.18 1383.50 -38.77 89.28 140.39 -36.41 105.38 101.48 3.85
Big Onion 19530.12 22393.78 -12.79 1095.39 1177.67 -6.99 56.09 52.59 6.65
Potato 17005.16 11972.16 42.04 628.57 369.73 70.01 36.96 30.88 19.69
Dried Chillies 3986.71 2923.47 36.37 819.85 593.87 38.05 205.64 203.14 1.23
Masoor Dhal 10858.38 13169.48 -17.55 1427.28 1702.69 -16.17 131.45 129.29 1.67
Green Gram 1506.47 - - 266.09 - - 176.63 - -
Cowpea 214.00 - - 25.36 - - 118.52 - -
Garlic 2222.72 1780.94 24.81 288.12 227.41 26.70 129.62 127.69 1.52
Wheat flour 60.29 470.63 -87.19 4.09 33.51 -87.80 67.83 71.20 -4.73
Wheat grain 149628.02 255707.48 -41.48 5936.53 9517.17 -37.62 39.68 37.22 6.60
White crystalline
cane sugar 62900.75 47223.46 33.20 3202.16 2541.97 25.97 50.91 53.83 -5.43
Maize (Seed) 143.05 20.01 - 80.86 7.48 - 565.23 373.80 -
Maize (Other) 50.00 25.00 - 4.29 2.14 - 85.85 85.63 -
Source: Automated data Processing Division, Department of Customs

24
Table 8: Monthly Rainfall (mm) – July 2015
Rainfall Station Total
Rainfall (mm)
30 Year Avg.
Rainfall (mm)
Total
Rainy Days
30 Year Average
Rainy Days
Anuradhapura 0 27.1 0 3
Badulla 37.8 69.3 3 6
Bandarawela 52.8 54.7 4 5
Batticaloa 23.3 41.4 3 3
Colombo 37.3 121.9 10 12
Galle 249.2 163.2 20 16
Hambantota 31.9 45.5 3 5
Jaffna 0.2 25.1 0 2
Katugastota 54.1 128.1 15 14
Katunayaka 20 99.2 7 10
Kurunegala 20.1 11.2 9 11
MahaIluppallama 0 31 0 3
Mannar 0.7 12.4 1 1
NuwaraEliya 96.9 164.9 19 17
Pottuvil 21.5 18.9 2 -
Puttalam 0.5 16.8 1 3
Ratmalana 66.6 132.7 11 12
Ratnapura 173.6 292.8 25 19
Trincomalee 9.5 63.8 1 4
Vavuniya 0 43.5 0 3
Polonnaruwa 0 65.6 0 2
Moneragala 28.5 - 2 -
Mattala 13.5 - 3 - Source: Department of Meteorology