food for progress and mcgovern-dole indicators and definitions
TRANSCRIPT

Food for Progress and McGovern-Dole Indicators and Definitions Food Assistance Division, Office of Capacity Building and Development
07/15/2014

TABLE OF CONTENTS PURPOSE AND BACKGROUND .............................................................................................................. 3
BASELINES AND TARGETS ..................................................................................................................... 4
REPORTING .......................................................................................................................................... 5
FOOD FOR PROGRESS STANDARD INDICATORS SUMMARY .................................................................. 7
FOOD FOR PROGRESS STANDARD INDICATOR DEFINITIONS ............................................................... 10
FFPr INDICATOR 1: Number of hectares under improved techniques or technologies as a result of USDA assistance ...................................................................................................................................... 10
FFPr INDICATOR 2: Number of individuals who have applied new techniques or technologies as result of USDA assistance .................................................................................................................................. 14
FFPr INDICATOR 3: Number of individuals who have applied improved farm management practices (i.e. governance, administration, or financial management) as a result of USDA assistance ................ 17
FFPr INDICATOR 4: Number of individuals receiving financial services as a result of USDA assistance . 19
FFPr INDICATOR 5: Number of loans disbursed as a result of USDA assistance ..................................... 21
FFPr INDICATOR 6: Value of loans provided as a result of USDA assistance .......................................... 22
FFPr INDICATOR 7: Number of private enterprises, producers organizations, water users associations, women’s groups, trade and business associations, and community-based organizations (CBOs) that applied improved techniques and technologies as result of USDA assistance ...................................... 24
FFPr INDICATOR 8: Number of public-private partnerships formed as a result of USDA assistance ..... 26
FFPr INDICATOR 9: Value of new public and private sector investment leveraged as a result of USDA assistance ................................................................................................................................................ 28
FFPr INDICATOR 10: Kilometers of roads improved or constructed as a result of USDA assistance ...... 30
FFPr INDICATOR 11: Total increase in installed storage capacity (dry or cold storage) as a result of USDA assistance ...................................................................................................................................... 32
FFPr INDICATOR 12: Number of policies, regulations and/or administrative procedures in each of the following stages of development as a result of USDA assistance ........................................................... 34
FFPr INDICATOR 13: Value of sales by project beneficiaries .................................................................. 36
FFPr INDICATOR 14: Volume of commodities (metric tons) sold by project beneficiaries .................... 38
FFPr INDICATOR 15: Number of jobs attributed to USDA assistance ..................................................... 40
FFPr INDICATOR 16: Number of individuals who have received short-term agricultural sector productivity or food security training as a result of USDA assistance .................................................... 42
FFPr INDICATOR 17: Total number of individuals benefiting directly as a result of USDA assistance ... 44
FFPr INDICATOR 18: Total number of individuals benefiting indirectly as a result of USDA assistance 46

MCGOVERN-DOLE STANDARD INDICATORS SUMMARY ..................................................................... 47
MCGOVERN-DOLE STANDARD INDICATOR DEFINITIONS .................................................................... 51
MGD INDICATOR 1: Number of students regularly (80%) attending USDA supported classrooms/schools ................................................................................................................................. 51
MGD INDICATOR 2: Number of textbooks and other teaching and learning materials provided as a result of USDA assistance ....................................................................................................................... 53
MGD INDICATOR 3: Number of school administrators and officials in target schools who demonstrate use of new techniques or tools as a result of USDA assistance .............................................................. 54
MGD INDICATOR 4: Number of school administrators and officials trained or certified as a result of USDA assistance ...................................................................................................................................... 55
MGD INDICATOR 5: Number of teachers/educators/teaching assistants in target schools who demonstrate use of new and quality teaching techniques or tools as a result of USDA assistance ...... 57
MGD INDICATOR 6: Number of teachers/educators/teaching assistants trained or certified as a result of USDA assistance .................................................................................................................................. 58
MGD INDICATOR 7: Number of educational facilities (i.e. school buildings, classrooms, and latrines) rehabilitated/constructed as a result of USDA assistance ...................................................................... 59
MGD INDICATOR 8: Number of students enrolled in schools receiving USDA assistance .................... 61
MGD INDICATOR 9: Number of Parent-Teacher Associations (PTAs) or similar “school” governance structures supported as a result of USDA assistance ............................................................................. 62
MGD INDICATOR 10: Number of public-private partnerships formed as a result of USDA assistance . 63
MGD INDICATOR 11: Value of public and private sector investments leveraged as a result of USDA assistance ................................................................................................................................................ 65
MGD INDICATOR 12: Number of educational policies, regulations, or administrative procedures in each of the following stages of development as a result of USDA assistance ........................................ 67
MGD INDICATOR 13: Number of take-home rations provided as a result of USDA assistance ............. 69
MGD INDICATOR 14: Number of individuals receiving take-home rations as a result of USDA assistance ................................................................................................................................................................ 70
MGD INDICATOR 15: Number of daily school meals (breakfast, snack, lunch) provided to school-age children as a result of USDA assistance .................................................................................................. 72
MGD INDICATOR 16: Number of school-aged children receiving daily school meals (breakfast, snack, lunch) as a result of USDA assistance ..................................................................................................... 73
MGD INDICATOR 17: Number of social assistance beneficiaries participating in productive safety nets as a result of USDA assistance ................................................................................................................ 75
MGD INDICATOR 18: Number of individuals trained in child health and nutrition as a result of USDA assistance ................................................................................................................................................ 77
ii

MGD INDICATOR 19: Number of schools using an improved water source ........................................... 79
MGD INDICATOR 20: Number of schools with improved sanitary facilities ........................................... 81
MGD INDICATOR 21: Number of students receiving deworming medication(s) .................................... 83
MGD INDICATOR 22: Number of child health and nutrition policies, regulations or administrative procedures in the following stages of development as a result of USDA assistance ............................. 85
MGD INDICATOR 23: Percent of school-age children receiving a minimum acceptable diet ................ 87
MGD INDICATOR 24: Percent of students who, by the end of two grades of primary schooling, demonstrate that they can read and understand the meaning of grade level text .............................. 89
MGD INDICATOR 25: Number of individuals benefiting directly from USDA-funded interventions ..... 91
MGD INDICATOR 26: Number of individuals benefiting indirectly from USDA-funded interventions .. 93
iii

PURPOSE AND BACKGROUND The Foreign Agricultural Service (FAS) places a high level of importance on managing for results. Performance monitoring is a key part of the agency’s implementation of results-oriented management. According to the FAS Monitoring and Evaluation Policy for the Food Assistance Division (FAD), all proposals and grant agreements must include a Performance Monitoring Plan (PMP) that identifies indicators for monitoring progress in achieving results and presents a strategy for collecting performance data. The plan should include applicable standard indicators and custom (project-specific) indicators (see the explanation and definitions below).
FAS uses two types of performance indicators: standard and custom. FAS defines those terms as follows:
• Standard Indicators: a common set of required (mandatory) indicators identified by FAS that must be used by all program participants, if applicable to the project. A standard indicator is applicable to a project if it addresses a result in the project’s results framework, and if planned activities target that result.
• Custom Indicators: additional project-specific performance indicators not included in the FAS list of standard indicators.
This document includes guidance on the Food for Progress (FFPr) and McGovern-Dole (MGD) standard indicators only. FAS uses standard indicators to measure progress in achieving FFPr and MGD program results, established in the FFPr and MGD program-level results frameworks. The FFPr and MGD standard indicators will allow FAS to report progress on all of its projects across result areas (i.e. literacy, good health and dietary practices, agricultural productivity, and trade) and countries. FAS will use these data for meeting requirements under the Government Performance and Results Act (GPRA), 1999 and the GPRA Modernization Act, 2010. Standard indicators will also be used for reporting program accomplishments in the USDA and FAS Strategic Plans, Congressional Budget Justifications, and for reporting on USDA’s contribution to whole-of-government initiatives such as Feed the Future1 and the Action Plan on Children in Adversity.2 In order for USDA to meet these reporting requirements, projects are required to include FFPr and MGD standard indicators in their PMPs when they are relevant to the project’s results.
FFPr and MGD standard indicators are either classified as output or outcome. Applicants may also propose custom, project-specific input, output, outcome, or impact-level indicators. FAS defines these terms as follows:
Input Indicators: Indicators that measure or quantify the financial, human, and material resources used to implement project activities or interventions.
1 For more information about the Feed the Future Initiative see: http://feedthefuture.gov/ 2 For more information on the US Government’s Action Plan on Children in Adversity see: http://www.usaid.gov/what-we-do/global-health/cross-cutting-areas/children-adversity
3

Output Indicators: Indicators that measure or quantify the products, goods, or services which directly result from the implementation of project activities. Outcome Indicators: Indicators that measure the intermediate effects of a project’s activity or set of activities and are directly related to the output indicators. Impact Indicators: Indicators that measure longer-term effects produced by a project’s activities or set of activities.
Applicants must use all applicable standard indicators in their PMPs at the proposal stage. Each standard indicator measures one or more results in the FFPr and MGD program results frameworks. If a project includes the result in its project-level results framework, the corresponding standard indicator must be included in the project’s PMP. During the agreement negotiation stage, FAS may provide further guidance on which indicators are considered relevant. The standard indicator definitions provided in this document should be used to inform the PMP. It is not necessary for an applicant to reproduce the entire indicator definition in its PMP document, but reference to the standard indicator definition must be included (i.e. the definitions section of a PMP may include: “please see FFPr or MGD Indicator #X”).
FAS requires PMPs to include performance indicators for all of the identified results in the project results frameworks. However, in some cases, applicants may need to develop custom (project-specific) indicators because the FAS standard indicators alone may not adequately measure all of a project’s planned activities or intended results. Custom indicators may include organizational or stakeholder-relevant indicators that are key to monitoring project performance and accountability. See the FAS Monitoring and Evaluation Policy for additional information on using standard and custom indicators in PMPs.
Once applicants have identified all relevant standard and custom indicators, they should establish numbers for their baselines and targets, and input those numbers into the FAS Food Aid Information System (FAIS)3. If some numbers for baselines and targets are not available during the proposal stage, applicants may provide those numbers during the agreement negotiation phase or after completion of the baseline study. If a proposal is selected for an award, the list of applicable indicators will be finalized in consultation with FAS staff during the agreement negotiation phase. After an agreement has been signed, program participants will be required to report on their actual progress toward meeting their indicator targets in FAIS.
BASELINES AND TARGETS Projects must establish indicator baselines and targets, which will be used to regularly measure performance. Initially, indicator baselines and targets are established in the project proposal. They are then finalized, according to the FAS Monitoring and Evaluation Policy, following the approval of the PMP, Evaluation Plan and submission of the baseline survey report. Program participants must seek an
3 https://www.fas.usda.gov/fais/public
4

amendment to their agreement in order to (a) finalize baselines and targets during the first year of the project, or (b) amend indicators and targets at any other time during the life of the project.
Baseline information for all indicators must be measured and reported prior to the start of project activities. For output indicators that count the number of services or goods provided, the baseline will be zero. For example, the “number of individuals receiving short-term agricultural sector productivity or food security training as a result of USDA assistance” has a baseline of zero because that activity or service was not provided previously. Outcomes that measure an anticipated change in condition such as the “Percent of school-age children receiving a minimum acceptable diet” require measuring the status of the condition, in this case, the level of attendance, at baseline. Baselines for such indicators should always be greater than zero. For these types of measures, projects should establish a baseline that is as close to the condition prior to the start of project implementation as possible. For example, for projects funded in FY2012, the baseline should be for the condition in FY2012, with activity implementation taking place in FY2013. Where secondary data are being used to establish baselines (i.e. literacy tests) the baseline timeframe may differ if data collection occurs at established intervals.
Annual and “life of project” (or “total for the agreement”) targets must be established for all standard and custom indicators. Projects must follow guidance contained in this handbook for the disaggregation required under each standard indicator, and establish disaggregation as necessary across custom indicators. Annual targets must be established on a fiscal year basis (October 1 – September 30) unless otherwise specified or negotiated. Established targets for planned activities should ambitious, but also realistic.
All standard indicators and their disaggregation, as specified in this guidance, including baselines and targets, must be established and reported to FAS in FAIS. All standard indicators must be included in the PMP and entered into FAIS using the exact wording of the standard indicator and its definition as it appears in this guidance document. PMPs may include more detailed standard indicator definitions such as project-specific information (i.e. data sources and measurement notes) as needed.
REPORTING FFPr and MGD projects are required to establish annual targets; however, projects are required to report to FAS on a semi-annual basis. Projects must submit semi-annual reports based on the following schedule:
Period covering Report due date
October 1 – March 31 May 16
April 1 – September 30 November 16
5
Semi-annual reports are created and submitted through the “Compliance” tab at the top of the FAIS page, and under “Agreement-level Reports” in the drop-down menu. If a disaggregation (such as “Male/Female” or “New/Continuing”) is marked as required in the “DISAGGREGATION” section of the indicator descriptions below, projects must set targets and report upon it. However, projects are not required to set targets for all indicator disaggregation sub-types. For example, if a project is introducing integrated pest management and improved seeds, then the “number of individuals who have applied new techniques and technologies” (FFPr Standard Indicator 2, page 13) should include disaggregation related to crop genetics and pest management relevant to the technique or technology type; however, the project would not include irrigation, disease management or water harvesting disaggregation since these are not technology types applicable to the project.
The project should specify in the PMP which disaggregation(s) is relevant to the project and program participants will be expected to report actual data on each relevant disaggregation in their semi-annual reports to FAS. Further clarification upon how to disaggregate indicators is also provided for each under the “Data Entry in FAIS” section. This is a collaborative effort between award recipients and Food Assistance Division (FAD) staff. Indicators are chosen, and all parties must ensure indicators are precisely entered in either “Results” or “Activity & Indicators” of FAIS’ Performance Reporting section. This is a collaborative decision between award recipients and Food Assistance Division (FAD) staff during agreement negotiation. While the indicator type (output, outcome, etc.) is often a factor, the individual agreement’s structure will also play a role.
Where the data collection for a standard or custom indicator is expected to be too costly, infeasible, or unrealistic given the nature of the indicator or existing data collection plans and resources, program participants may propose an alternative data collection schedule. Projects must also include a narrative in the “comments” section of the semi-annual performance report describing trends in the data, reasons for significant differences between the actual data and targets, any data discrepancies or nuances in the data, reasons for not reporting data or reporting zero, or any another explanations of project performance, as appropriate.
6

FOOD FOR PROGRESS STANDARD INDICATORS SUMMARY
Indicator Number Result # Result
(from framework) Indicator
Type Indicator Feed the
Future? Unit
1 FFPr 1.2 Increased Use of Improved Agricultural Techniques and Technologies outcome
Number of hectares of land under improved techniques or technologies as a result of USDA assistance
Y* Hectares
2 FFPr 1.2 Increased Use of Improved Agricultural Techniques and Technologies outcome
Number of individuals who have applied new techniques or technologies as result of USDA assistance
Y* Number
3 FFPr 1.3 Improved Farm Management outcome
Number of individuals who have applied improved farm management practices (i.e. governance, administration, or financial management) as a result of USDA assistance
N Number
4 FFPr 1.2.3 /2.2.3.1 /2.3.1.2
Increased Use of Financial Services output Number of individuals receiving financial services as a result of USDA assistance N Number
5 FFPr 1.2.3 /2.2.3.1 /2.3.1.2
Increased Use of Financial Services output Number of loans disbursed as a result of USDA assistance N Number
6 FFPr 1.2.3 /2.2.3.1 /2.3.1.2
Increased Use of Financial Services output Value of loans provided as a result of USDA assistance Y* US Dollars
7 FFPr
1.4.4/2.4.4
Improved Capacity of Key Groups in the Agriculture Production Sector (Co-ops and Small Shareholder Farmers)
outcome
Number of private enterprises, producers organizations, water users associations, women’s groups, trade and business associations, and community-based organizations (CBOs) that applied improved techniques and technologies as result of USDA assistance
Y* Number
8 FFPr 1.4.5 Increased Leverage of Private Sector Resources output Number of public-private partnerships formed as a
result of USDA assistance Y Number
7

Indicator Number Result # Result
(from framework) Indicator
Type Indicator Feed the
Future? Unit
9 FFPr 2.2 Increased Access to Markets to Sell Agricultural Products outcome Value of new public and private sector investment
leveraged by USDA assistance N US Dollars
10 FFPr
2.1.3/2.3.1
Improved Market and Trade Infrastructure output Kilometers of roads improved or constructed as a
result of USDA assistance Y*
Kilometers
11 FFPr - 2.1.2.2 Improved Post-Harvest Infrastructure output Total increase in installed storage capacity (dry or cold
storage) as a result of USDA assistance Y Total Cubic Meters
12 FFPr 2.4.2 Improved Policy & Regulatory Framework
output and
outcome
Number of policies, regulations and/or administrative procedures in each of the following stages of development as a result of USDA assistance
Y Number
13 FFPr SO1 and SO2
Increased Agricultural Productivity/Expanded Trade of Agricultural Products
outcome Value of sales by project beneficiaries Y U.S. Dollar
14 FFPr SO1 and SO2
Increased Agricultural Productivity/Expanded Trade of Agricultural Products
outcome Volume of commodities sold by project beneficiaries Y Metric Tons
15 FFPr SO1 and SO2
Increased Agricultural Productivity/Expanded Trade of Agricultural Products
outcome Number of jobs attributed to USDA assistance Y Number
16 FFPr SO1 and SO2
Increased Agricultural Productivity/Expanded Trade of Agricultural Products
output Number of individuals who have received short-term agricultural sector productivity or food security training as a result of USDA assistance
Y* Number
8

Indicator Number Result # Result
(from framework) Indicator
Type Indicator Feed the
Future? Unit
17 FFPr SO1 and SO2
Increased Agricultural Productivity/Expanded Trade of Agricultural Products
output Number of individuals benefiting directly from USDA-funded interventions N Number
18 FFPr SO1 and SO2
Increased Agricultural Productivity/Expanded Trade of Agricultural Products
output Number of individuals benefiting indirectly from USDA-funded interventions N Number
* Whole of Government Indicator
9
FOOD FOR PROGRESS STANDARD INDICATOR DEFINITIONS FFPr RESULTS FRAMEWORK 1: Increased Agricultural Productivity
FFPr 1.2: Increased Use of Improved Agricultural Techniques and Technologies
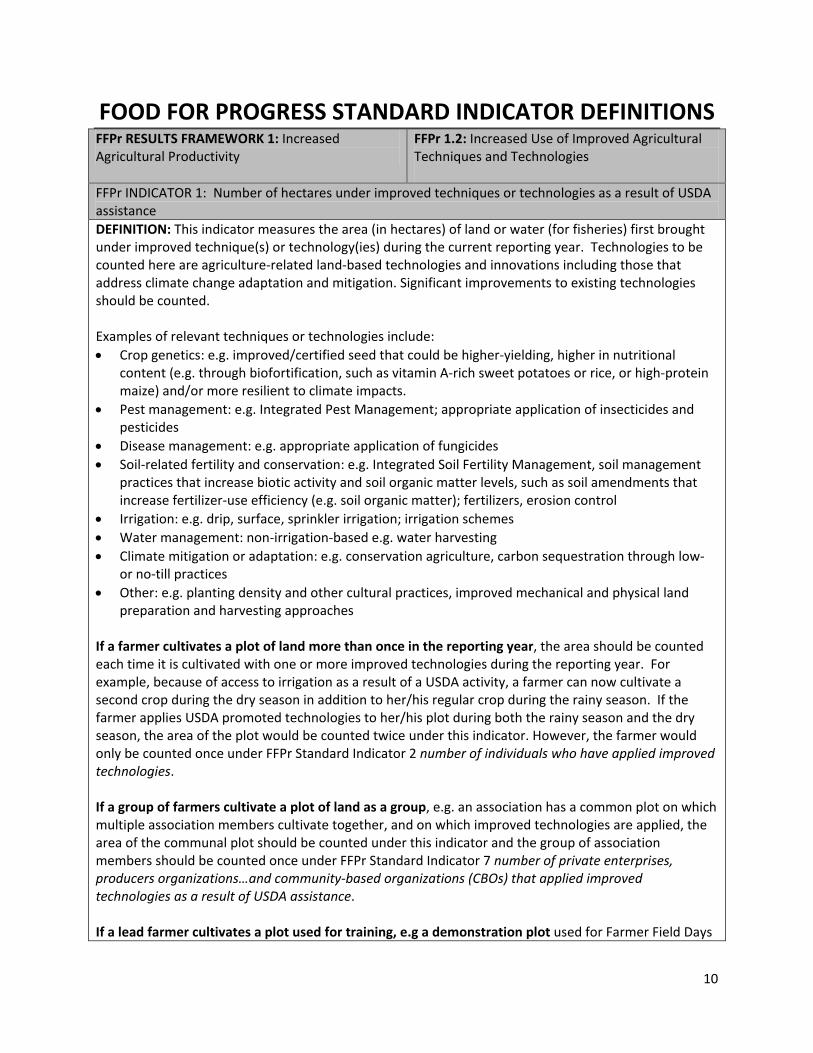
FFPr INDICATOR 1: Number of hectares under improved techniques or technologies as a result of USDA assistance DEFINITION: This indicator measures the area (in hectares) of land or water (for fisheries) first brought under improved technique(s) or technology(ies) during the current reporting year. Technologies to be counted here are agriculture-related land-based technologies and innovations including those that address climate change adaptation and mitigation. Significant improvements to existing technologies should be counted. Examples of relevant techniques or technologies include: • Crop genetics: e.g. improved/certified seed that could be higher-yielding, higher in nutritional
content (e.g. through biofortification, such as vitamin A-rich sweet potatoes or rice, or high-protein maize) and/or more resilient to climate impacts.
• Pest management: e.g. Integrated Pest Management; appropriate application of insecticides and pesticides
• Disease management: e.g. appropriate application of fungicides • Soil-related fertility and conservation: e.g. Integrated Soil Fertility Management, soil management
practices that increase biotic activity and soil organic matter levels, such as soil amendments that increase fertilizer-use efficiency (e.g. soil organic matter); fertilizers, erosion control
• Irrigation: e.g. drip, surface, sprinkler irrigation; irrigation schemes • Water management: non-irrigation-based e.g. water harvesting • Climate mitigation or adaptation: e.g. conservation agriculture, carbon sequestration through low-
or no-till practices • Other: e.g. planting density and other cultural practices, improved mechanical and physical land
preparation and harvesting approaches If a farmer cultivates a plot of land more than once in the reporting year, the area should be counted each time it is cultivated with one or more improved technologies during the reporting year. For example, because of access to irrigation as a result of a USDA activity, a farmer can now cultivate a second crop during the dry season in addition to her/his regular crop during the rainy season. If the farmer applies USDA promoted technologies to her/his plot during both the rainy season and the dry season, the area of the plot would be counted twice under this indicator. However, the farmer would only be counted once under FFPr Standard Indicator 2 number of individuals who have applied improved technologies. If a group of farmers cultivate a plot of land as a group, e.g. an association has a common plot on which multiple association members cultivate together, and on which improved technologies are applied, the area of the communal plot should be counted under this indicator and the group of association members should be counted once under FFPr Standard Indicator 7 number of private enterprises, producers organizations…and community-based organizations (CBOs) that applied improved technologies as a result of USDA assistance. If a lead farmer cultivates a plot used for training, e.g a demonstration plot used for Farmer Field Days
10

or Farmer Field School, the area of the demonstration plot should be counted under this indicator, and the farmer counted under FFPr Standard Indicator 2 number of farmers and others who have applied improved technologies. However, if the demonstration or training plot is cultivated by extensionists or researchers, e.g. a demonstration plot in a research institute, neither the area nor the extensionist/researcher should be counted under the respective indicators. RATIONALE: Tracks successful adoption of technologies and management practices in an effort to improve agricultural productivity, agricultural water productivity, sustainability, and resilience to climate impacts.
INDICATOR CHARACTERISTICS UNIT OF MEASURE: Number: Hectares
INDICATOR LEVEL: Outcome
DIRECTION OF CHANGE: Higher is better
FREQUENCY OF REPORTING: Biannually covering the periods: October 1-March 31 and April 1-September 30
DISAGGREGATION: New/continuing (required):
• New = this is the first year the hectare came under improved techniques or technologies • Continuing = the hectare being counted continues to be under improved techniques or
technologies from the previous year, and no additional improved technique/technology are being newly applied. If additional improved technique/technology were applied for the first time during the reporting year, count the hectare under “New”.
Technique or technology type (if applicable):
• Crop genetics • Pest management • Disease management • Soil-related fertility and conservation • Irrigation • Water management (non-irrigation based) • Climate mitigation or adaptation • Other • Total w/one or more improved techniques or technologies
DATA SOURCE: WHO COLLECTS DATA FOR THIS INDICATOR: Data will be collected by Program Participants. HOW SHOULD IT BE COLLECTED: Data will be collected through interviews of program beneficiaries, direct observation of measures of land at the project level, farmer surveys, or through farmer associations, and should only be reported on hectares under improved techniques and technologies supported by USDA MEASUREMENT NOTES: Technique or technology type disaggregation: If more than one improved technology is being applied on a hectare, count the hectare under each technology type (i.e. double count). In addition, count the hectare under the category “total w/one or more improved techniques or technology”. Since it is very common that more than one improved technology is disseminated and applied, this approach allows an accurate count of the uptake of different technique/technology types, and to accurately count the total number of hectares under improved technologies. For example: An activity supports dissemination of improved seed, Integrated Pest Management and
11

drip irrigation. During the reporting year, a total of 1,000 hectares were under improved technologies: 800 with improved seed, 600 with IPM and 950 with drip irrigation. New/Continuing Disaggregation: If a hectare is under more than one improved technology, some of which continue to be applied from the previous year and some of which were newly applied in the reporting year, count the hectare under new. Any first-time application of an improved technology categorizes a hectare as new, even if other improved technologies being applied are continuing. Double counting of hectares only occurs in the specific technology/practices type disaggregation categories, not in the new/continuing disaggregation. There should be a clear link between Indicator 1, the number of hectares under improved techniques and technologies, Indicator 2, the number of individuals (farmers, processors, etc.) applying improved techniques and technologies, and Indicator 7, associations/cooperatives/Community Based Organizations (CBO), and Micro-, Small, Medium Enterprises (MSMEs) applying improved technologies and technologies as a result of USDA assistance. If a farmer applied new techniques/technologies to his/her land, then the farmer would be counted under Indicator 2 and the # of hectares s/he applied the new techniques or technologies on would be counted in Indicator 1. Likewise, if a producer association/group applied a new technique or technology, it would be counted under Indicator 7, and the hectares on which it was applied counted under Indicator 1. DATA ENTRY IN FAIS: The indicator title must be entered into the relevant performance reporting section of FAIS VERBATIM to allow for the information to be collected correctly. Indicator-specific disaggregation guidance: Enter the indicator in FAIS for each required/applicable disaggregation. In this case new, continuing, and technology type. Identify in parentheses the disaggregation at the end of the indicator title. For example:
- Number of hectares under improved techniques or technologies as a result of USDA assistance (new)
- Number of hectares under improved techniques or technologies as a result of USDA assistance (continuing)
- Number of hectares under improved techniques or technologies as a result of USDA assistance (insert applicable technology type and repeat as necessary)
RELATIONSHIP TO THE FEED THE FUTURE (FtF) INITIATIVE FtF INDICATOR: Yes [4.5.2-2]
FtF WHOLE OF GOVERNMENT INDICATOR: Yes
DEFINITIONAL AND MEASURMENT NOTES: FtF includes off farm activities such as post-harvest handling, processing, and packaging in this indicator; whereas, FFPr considers these off farm activities to fall under Results Framework 2 focused on Expanding Trade and Markets. The FtF definition excludes water (fisheries). FFPr Branch needs to confirm that it is relevant to include water (for fisheries) in this indicator.
12

As this is an FtF Whole of Government indicator, FtF has produced additional guidance on the measurement of this indicator. Please refer to this guidance for additional information: Feed the Future Agricultural Indicators Guide (http://agrilinks.org/library/feed-the-future-ag-indicators-guide).
13

FFPr RESULTS FRAMEWORK 1: Increased Agricultural Productivity
FFPr 1.2: Increased Use of Improved Agricultural Techniques and Technologies
FFPr INDICATOR 2: Number of individuals who have applied new techniques or technologies as result of USDA assistance DEFINITION: This indicator measures the total number of agricultural producers, ranchers and other primary sector producers (i.e. food and non-food crops, livestock products, wild fisheries, aquaculture, and agro-forestry) that applied new techniques or technologies anywhere within the food and fiber system as a result of USDA assistance. This includes innovations in efficiency, value-addition, on-farm post-harvest management, sustainable land management, forest, and water management. Technologies to be counted here are agriculture-related technologies and innovations. Examples of relevant techniques or technologies include: • Crop genetics: e.g. improved/certified seed that could be higher-yielding, higher in nutritional
content (e.g. through biofortification, such as vitamin A-rich sweet potatoes or rice, or high-protein maize) and/or more resilient to climate impacts.
• Pest management: e.g. Integrated Pest Management; appropriate application of insecticides and pesticides
• Disease management: e.g. appropriate application of fungicides • Soil-related fertility and conservation: e.g. Integrated Soil Fertility Management, soil management
practices that increase biotic activity and soil organic matter levels, such as soil amendments that increase fertilizer-use efficiency (e.g. soil organic matter); fertilizers, erosion control
• Irrigation: e.g. drip, surface, sprinkler irrigation; irrigation schemes • Water management: non-irrigation-based e.g. water harvesting • Climate mitigation or adaptation: e.g. conservation agriculture, carbon sequestration through low-
or no-till practices • Other: e.g. planting density and other cultural practices, improved mechanical and physical land
preparation and harvesting approaches
RATIONALE: Technological change and its adoption by different actors in the agricultural supply chain will be critical to increasing agricultural productivity. In addition, private sector and civil society behavior change leads to increased agricultural sector productivity.
INDICATOR CHARACTERISTICS UNIT OF MEASURE: Number: Individuals
INDICATOR LEVEL: Outcome
DIRECTION OF CHANGE: Higher is better
FREQUENCY OF REPORTING: Biannually covering the periods: October 1-March 31 and April 1-September 30
DISAGGREGATION: Gender: Male, Female (required) New/Continuing (required):
• New = this reporting year is the first year the person applied the new technology or technique • Continuing = the person first applied the new technology or technique in the previous year and
continues to apply it Technique or technology type (if applicable):
• Crop genetics • Pest management
14

• Disease management • Soil-related fertility and conservation • Irrigation • Water management (non-irrigation based) • Climate mitigation or adaptation • Other • Total w/one or more improved techniques or technologies
DATA SOURCE: WHO COLLECTS DATA FOR THIS INDICATOR: Data will be collected by Program Participants. HOW SHOULD IT BE COLLECTED: Data will be collected via survey, observation, project or association records, or farm records of all targeted individuals MEASUREMENT NOTES: All significant improvements to existing techniques or technologies should be counted. In a case where, for example, a farmer applies more than one innovation as a result of USDA assistance, count the farmer one time, but disaggregate all the improvements under type of technique and technology. If more than one adult farmer in a household is applying new technologies, count all the adult farmers. Any technique or technology that was first adopted in a previous reporting year and continues to be applied should be marked as “continuing.” This indicator counts individuals who applied new techniques and technologies learned through training provided through USDA assistance. Therefore, there should be a clear link between the number of individuals who applied a new technique or technology and the number of individuals who have received short-term agricultural sector productivity or food security training should be reported under Indicator 15. Furthermore, there should be a clear link between Indicator 1, number of hectares under improved techniques and technologies, Indicator 2, number of individuals (farmers, processors, etc.) who have applied improved techniques and technologies, and Indicator 7, associations/cooperatives/Community Based Organizations (CBO), who have applied improved techniques and technologies as a result of USDA assistance. If a farmer applied new techniques/technologies to his/her land, then the farmer would be counted under Indicator 2 and the # of hectares s/he applied the new techniques or technologies on would be counted in Indicator 1. Likewise, if a producer association/group applied a new technique or technology, it would be counted under Indicator 7, and the hectares on which it was applied counted under Indicator 1. DATA ENTRY IN FAIS: The indicator title must be entered into the relevant performance reporting section of FAIS VERBATIM to allow for the information to be collected correctly. Indicator-specific disaggregation guidance: Enter the indicator in FAIS for each required/applicable disaggregation. In this case male, female, new, continuing, and technology type. Identify in parentheses the disaggregation at the end of the indicator title. For example:
- Number of individuals who have applied new techniques or technologies as result of USDA
15
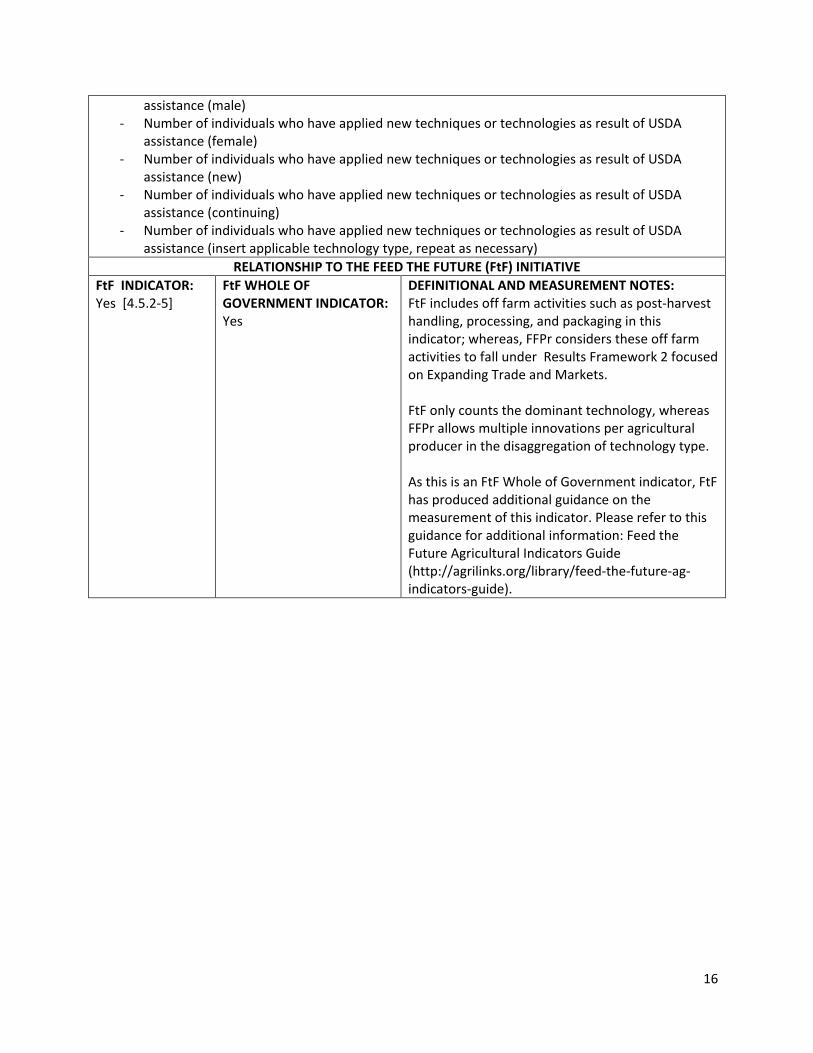
assistance (male) - Number of individuals who have applied new techniques or technologies as result of USDA
assistance (female) - Number of individuals who have applied new techniques or technologies as result of USDA
assistance (new) - Number of individuals who have applied new techniques or technologies as result of USDA
assistance (continuing) - Number of individuals who have applied new techniques or technologies as result of USDA
assistance (insert applicable technology type, repeat as necessary) RELATIONSHIP TO THE FEED THE FUTURE (FtF) INITIATIVE
FtF INDICATOR: Yes [4.5.2-5]
FtF WHOLE OF GOVERNMENT INDICATOR: Yes
DEFINITIONAL AND MEASUREMENT NOTES: FtF includes off farm activities such as post-harvest handling, processing, and packaging in this indicator; whereas, FFPr considers these off farm activities to fall under Results Framework 2 focused on Expanding Trade and Markets. FtF only counts the dominant technology, whereas FFPr allows multiple innovations per agricultural producer in the disaggregation of technology type. As this is an FtF Whole of Government indicator, FtF has produced additional guidance on the measurement of this indicator. Please refer to this guidance for additional information: Feed the Future Agricultural Indicators Guide (http://agrilinks.org/library/feed-the-future-ag-indicators-guide).
16
FFPr RESULTS FRAMEWORK 1: Increased Agricultural Productivity
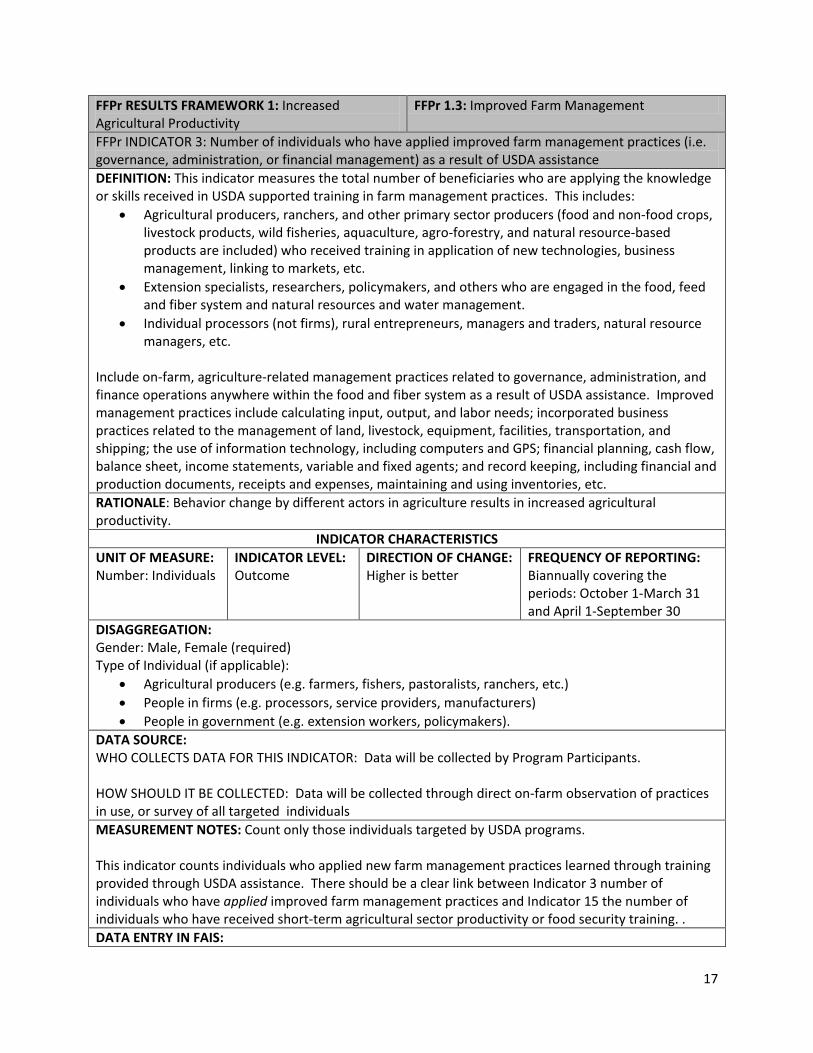
FFPr 1.3: Improved Farm Management
FFPr INDICATOR 3: Number of individuals who have applied improved farm management practices (i.e. governance, administration, or financial management) as a result of USDA assistance DEFINITION: This indicator measures the total number of beneficiaries who are applying the knowledge or skills received in USDA supported training in farm management practices. This includes:
• Agricultural producers, ranchers, and other primary sector producers (food and non-food crops, livestock products, wild fisheries, aquaculture, agro-forestry, and natural resource-based products are included) who received training in application of new technologies, business management, linking to markets, etc.
• Extension specialists, researchers, policymakers, and others who are engaged in the food, feed and fiber system and natural resources and water management.
• Individual processors (not firms), rural entrepreneurs, managers and traders, natural resource managers, etc.
Include on-farm, agriculture-related management practices related to governance, administration, and finance operations anywhere within the food and fiber system as a result of USDA assistance. Improved management practices include calculating input, output, and labor needs; incorporated business practices related to the management of land, livestock, equipment, facilities, transportation, and shipping; the use of information technology, including computers and GPS; financial planning, cash flow, balance sheet, income statements, variable and fixed agents; and record keeping, including financial and production documents, receipts and expenses, maintaining and using inventories, etc. RATIONALE: Behavior change by different actors in agriculture results in increased agricultural productivity.
INDICATOR CHARACTERISTICS UNIT OF MEASURE: Number: Individuals
INDICATOR LEVEL: Outcome
DIRECTION OF CHANGE: Higher is better
FREQUENCY OF REPORTING: Biannually covering the periods: October 1-March 31 and April 1-September 30
DISAGGREGATION: Gender: Male, Female (required) Type of Individual (if applicable):
• Agricultural producers (e.g. farmers, fishers, pastoralists, ranchers, etc.) • People in firms (e.g. processors, service providers, manufacturers) • People in government (e.g. extension workers, policymakers).
DATA SOURCE: WHO COLLECTS DATA FOR THIS INDICATOR: Data will be collected by Program Participants. HOW SHOULD IT BE COLLECTED: Data will be collected through direct on-farm observation of practices in use, or survey of all targeted individuals MEASUREMENT NOTES: Count only those individuals targeted by USDA programs. This indicator counts individuals who applied new farm management practices learned through training provided through USDA assistance. There should be a clear link between Indicator 3 number of individuals who have applied improved farm management practices and Indicator 15 the number of individuals who have received short-term agricultural sector productivity or food security training. . DATA ENTRY IN FAIS:
17

The indicator title must be entered into the relevant performance reporting section of FAIS VERBATIM to allow for the information to be collected correctly. Indicator-specific disaggregation guidance: Enter the indicator in FAIS for each required/applicable disaggregation. In this case male, female, and individual type. Identify in parentheses the disaggregation at the end of the indicator title. For example:
- Number of individuals who have applied improved farm management practices (i.e. governance, administration, or financial management) as a result of USDA assistance (male)
- Number of individuals who have applied improved farm management practices (i.e. governance, administration, or financial management) as a result of USDA assistance (female)
- Number of individuals who have applied improved farm management practices (i.e. governance, administration, or financial management) as a result of USDA assistance (insert individual type, repeat as necessary)
RELATIONSHIP TO THE FEED THE FUTURE (FtF) INITIATIVE FtF INDICATOR: No
FtF WHOLE OF GOVERNMENT INDICATOR: No
DEFINITIONAL AND MEASUREMENT NOTES: None
18

FFPr RESULTS FRAMEWORK 1: Increased Agricultural Productivity FFPr RESULTS FRAMEWORK 2: Expanded Trade of Agricultural Products
FFPr 1.2.3/2.2.3.1/2.3.1.2: Increased Use of Financial Services
FFPr INDICATOR 4: Number of individuals receiving financial services as a result of USDA assistance DEFINITION: Total number of agricultural producers, fishers, pastoralists, ranchers, etc., cooperatives, MSMEs [micro (1-5), small (6-50), medium (51-100)*], business enterprises (processors, service providers, manufacturers), and other entities receiving services from financial enterprises as a result of USDA assistance. Examples of financial services include those services that help identify and access funds through formal and alternative channels that include supplier or buyer credits, factoring companies, equity financing, venture capital, credit unions, banks, and the like; assist buyers in establishing links with commercial banks (letters of credit, etc.) to help them finance production directly. USDA assistance may include partial loan guarantee programs or any support facilitating the receipt of a loan or other equity (e.g. an in-kind loan such as a tractor, plow or other equipment given as a loan.) Loans could be given by informal lenders and in-kind lenders of equipment or other inputs (e.g. fertilizer, seeds) transport or food with repayment being in cash or in-kind. Loans and credit can be extended to farmers and agribusinesses by financial institutions such as commercial banks, government banks, non-bank financial institutions, financial NGOs and input suppliers, or equity financing. *parenthesis = number of employees RATIONALE: Increased access to and utilization of financial services will help expand markets and trade, which will, in turn, expand agricultural productivity.
INDICATOR CHARACTERISTICS UNIT OF MEASURE: Number: Individuals
INDICATOR LEVEL: Output
DIRECTION OF CHANGE: Higher is better
FREQUENCY OF REPORTING: Biannually covering the periods: October 1-March 31 and April 1-September 30
DISAGGREGATION: Gender: Male, Female (required) DATA SOURCE: WHO COLLECTS DATA FOR THIS INDICATOR: Data will be collected by Program Participants. HOW SHOULD IT BE COLLECTED: Data will be collected through a survey of targeted individuals of FFPr projects , review of bank/financial institution or USDA records, or survey of financial institutions. MEASUREMENT NOTES: The indicator does not measure the value of the assistance but the number of agricultural producers and others who received financial services as a result of USDA assistance. Only count the recipient once per reporting year, even if multiple, financial services are accessed. For agricultural producers, the sex of the person should be used to classify the recipient. For firms, if the enterprise is a single proprietorship, the sex of the proprietor should be used for classification. For larger enterprises, the majority ownership should be used. When this cannot be ascertained, the majority of the senior management should be used. This indicator is to count individuals who received financial services. If a cooperative or MSME enterprise is receiving financial assistance, the members of the cooperative or employees of the MSME
19

should be counted as the number of individuals receiving financial services. For example, if 2 cooperatives receive loans through USDA-supported activities and there are 60 cooperative members directly benefitting from the loans, 60 should be reported rather than 2. Indicator 4 measures number of individuals receiving financial services. Indicator 5 measures the number of loans disbursed to farmers and others, and Indicator 6 measures the value of the loans disbursed to farmers and others. Financial services do not include grants or other cash purchases made by the project to increase productivity or expand trade. DATA ENTRY IN FAIS: The indicator title must be entered into the relevant performance reporting section of FAIS VERBATIM to allow for the information to be collected correctly. Indicator-specific disaggregation guidance: Enter the indicator in FAIS for each required/applicable disaggregation. In this case male and female. Identify in parentheses the disaggregation at the end of the indicator title. For example:
- Number of individuals receiving financial services as a result of USDA assistance (male) - Number of individuals receiving financial services as a result of USDA assistance (female)
RELATIONSHIP TO THE FEED THE FUTURE (FtF) INITIATIVE FtF INDICATOR: No
FtF WHOLE OF GOVERNMENT INDICATOR: No
DEFINITIONAL AND MEASUREMENT NOTES: None
20

FFPr RESULTS FRAMEWORK 1: Increased Agricultural Productivity FFPr RESULTS FRAMEWORK 2: Expanded Trade of Agricultural Products
FFPr 1.2.3/2.2.3.1/2.3.1.2: Increased Use of Financial Services
FFPr INDICATOR 5: Number of loans disbursed as a result of USDA assistance DEFINITION: This indicator captures the number of loans made/disbursed during the reporting year as a result of USDA assistance to agricultural producers, fishers, pastoralists, ranchers, etc., cooperatives, MSMEs [micro (1-5), small (6-50), medium (51-100)*], business enterprises (processors, service providers, manufacturers), and other entities. The indicator counts loans disbursed to the recipient not loans merely in process (e.g. loan applications, loan applications approved but not yet available to the recipient). Loans and credit can be extended to farmers and agribusinesses by financial institutions such as commercial banks, government banks, non-bank financial institutions, financial NGOs and input suppliers, or equity financing. *parenthesis = number of employees RATIONALE: Making more financial loans shows that there is improved access to business development and financial services. This, in turn, will help expand markets and trade and should also contribute to IR1’s expanding agricultural productivity which will help achieve the key objective of inclusive agriculture sector being defined broader than just crop production. In turn, this contributes to both goals of reducing poverty and hunger.
INDICATOR CHARACTERISTICS UNIT OF MEASURE: Number: Loans
INDICATOR LEVEL: Output
DIRECTION OF CHANGE: Higher is better
FREQUENCY OF REPORTING: Biannually covering the periods: October 1-March 31 and April 1-September 30
DISAGGREGATION: None DATA SOURCE: WHO COLLECTS DATA FOR THIS INDICATOR: Data will be collected by Program Participants. HOW SHOULD IT BE COLLECTED: Data will be collected through a survey of targeted individuals of FFPr projects, a review of banking/lending institution records or a survey of survey of financial institutions. MEASUREMENT NOTES: Indicator 4 measures number of individuals receiving financial services. Indicator 5 measures the number of loans disbursed to farmers and others, and Indicator 6 measures the value of the loans disbursed to farmers and others. DATA ENTRY IN FAIS: The indicator title must be entered into the relevant performance reporting section of FAIS VERBATIM to allow for the information to be collected correctly. Indicator-specific disaggregation guidance: None
RELATIONSHIP TO THE FEED THE FUTURE (FtF) INITIATIVE FtF INDICATOR: No
FtF WHOLE OF GOVERNMENT INDICATOR: No
DEFINITIONAL AND MEASUREMENT NOTES: None
21

FFPr RESULTS FRAMEWORK 1: Increased Agricultural Productivity FFPr RESULTS FRAMEWORK 2: Expanded Trade of Agricultural Products
FFPr 1.2.3/2.2.3.1/2.3.1.2: Increased Use of Financial Services
FFPr INDICATOR 6: Value of loans provided as a result of USDA assistance DEFINITION: Value (in US dollars) of loans and credit extended to agricultural producers, fishers, pastoralists, ranchers, etc., cooperatives, MSME [micro (1-5), small (6-50), medium (51-100)*], business enterprises (processors, service providers, manufacturers), and other entities. The indicator counts the value of loans and credit disbursed to the recipient, not loans merely made (e.g. in process, but not yet available to the recipient). Loans and credit can be extended to farmers and agribusinesses by financial institutions such as commercial banks, government banks, non-bank financial institutions, financial NGOs and input suppliers, or equity financing. *parenthesis = number of employees RATIONALE: Making more financial loans shows that there is improved access to business development and financial services. This, in turn, will help expand markets and trade and ought to also contribute to IR1’s expanding agricultural productivity which will help achieve the key objective of inclusive agriculture sector being defined broader than just crop production. In turn, this contributes to both goals of reducing poverty and hunger.
INDICATOR CHARACTERISTICS UNIT OF MEASURE: US Dollars
INDICATOR LEVEL: Output
DIRECTION OF CHANGE: Higher is better
FREQUENCY OF REPORTING: Biannually covering the periods: October 1-March 31 and April 1-September 30
DISAGGREGATION: Gender of loan recipient: Male/Female/Joint/Not Applicable (required) Note: For producers, the gender of the loan recipient should be used. For firms, if the enterprise is a single proprietorship, the gender of the proprietor should be used for classification. For larger enterprises, the majority ownership should be used. When this cannot be ascertained, the majority of the senior management should be used. If this cannot be ascertained, use n/a (not available).
DATA SOURCE: WHO WILL COLLECT DATA FOR THIS INDICATOR: Data will be collected by Program Participants. HOW SHOULD IT BE COLLECTED: Data will be collected using a survey of targeted individuals of FFPr projects, review of lending reports of financial institutions with agricultural and rural loan programs, or a survey of financial institutions with agricultural and rural loans. MEASUREMENT NOTES: Count targeted individuals within the scope of the USDA project. Convert local currency to US dollars at the average market foreign exchange rate for the reporting period or convert periodically throughout the year if there is rapid devaluation or appreciation. Report exchange rate in indicator narrative in FAIS. Indicator 4 measures number of individuals receiving financial services. Indicator 5 measures the number of loans disbursed to farmers and others, and Indicator 6 measures the value of the loans disbursed to farmers and others. DATA ENTRY IN FAIS:
22

The indicator title must be entered into the relevant performance reporting section of FAIS VERBATIM to allow for the information to be collected correctly. Indicator-specific disaggregation guidance: Enter the indicator in FAIS for each required/applicable disaggregation. In this case male, female, joint, and not applicable. Identify in parentheses the disaggregation at the end of the indicator title. For example:
- Value of loans provided as a result of USDA assistance (male) - Value of loans provided as a result of USDA assistance (female) - Value of loans provided as a result of USDA assistance (joint) - Value of loans provided as a result of USDA assistance (not applicable)
RELATIONSHIP TO THE FEED THE FUTURE (FtF) INITIATIVE FtF INDICATOR: Yes [4.5.2-29]
FtF WHOLE OF GOVERNMENT INDICATOR: Yes
DEFINITIONAL AND MEASUREMENT NOTES: FtF frequency of reporting is annually
23

FFPr RESULTS FRAMEWORK 1: Increased Agricultural Productivity FFPr RESULTS FRAMEWORK 2: Expanded Trade of Agricultural Products
FFPr 1.4.4/2.4.4: Improved Capacity of Key Groups in the Agriculture Production Sector (Coops and Small Shareholder Farmers)
FFPr INDICATOR 7: Number of private enterprises, producers organizations, water users associations, women’s groups, trade and business associations, and community-based organizations (CBOs) that applied improved techniques and technologies as result of USDA assistance DEFINITION: This indicator measures the total number of private enterprises (processors, input dealers, storage and transport companies), producer associations, water users associations, cooperatives, women’s groups, trade and business associations, and community-based organizations (CBOs), that applied improved techniques or technologies. Techniques and technologies are described in FFPr Indicator 2. RATIONALE: Tracks private sector and civil society behavior change to increase agricultural sector productivity.
INDICATOR CHARACTERISTICS UNIT OF MEASURE: Number: Organizations
INDICATOR LEVEL: Outcome
DIRECTION OF CHANGE: Higher is better
FREQUENCY OF REPORTING: Biannually covering the periods: October 1-March 31 and April 1-September 30
DISAGGREGATION: New/Continuing (if applicable):
• New = this reporting year is the first year the entity applied the targeted new technology or management practices for the first time during the reporting year
• Continuing = the entity first applied the new technology or management practice in the previous year and continues to apply it
Type of organization (if applicable): • Private enterprise • Producer organization • Women’s group • Trade and business association • Water users association • Community-based organization • Other
DATA SOURCE: WHO COLLECTS DATA FOR THIS INDICATOR: Data will be collected by Program Participants. HOW SHOULD IT BE COLLECTED: Data will be collected via survey, observation, or project records of all targeted individuals. MEASUREMENT NOTES: Count all types of technology or management practices that were improved. Only count the entity once per reporting year, even if multiple technologies or management practices are applied. Any groups applying a technology that was first applied in a previous year and continues to be applied in the reporting year should be included under “continuing”. However, if they added a new technology or practice during the reporting year to the ones they continued to apply from previous year(s), they would be counted as “new”. No entity should be counted under both “new” and “continuing” in one year.
24

Adoption of a new technology or management practice by the enterprise, association, cooperative or CBO is counted as one and not as applied to the number of their employees and/or membership. For example, when a farmer association incorporates new corn storage innovations as part of member services, the application is counted as one association and not multiplied by the number of farmer-members. This indicator is to count firms, associations, or other group entities applying new technologies or management practices, whereas Indicator 2 is to count individuals applying improved techniques/technologies. This indicator counts the application of new farm management practices learned through training provided through USDA assistance. Therefore, there should be a clear link between Indicator 7, the application of improved techniques/technologies and Indicator 15, the number of individuals who have received short-term agricultural sector productivity or food security training. DATA ENTRY IN FAIS: The indicator title must be entered into the relevant performance reporting section of FAIS VERBATIM to allow for the information to be collected correctly. Indicator-specific disaggregation guidance: Enter the indicator in FAIS for each required/applicable disaggregation. In this case new, continuing, and organization type. Identify in parentheses the disaggregation at the end of the indicator title. For example:
- Number of private enterprises, producers organizations…that applied improved techniques and technologies as result of USDA assistance (new)
- Number of private enterprises, producers organizations…that applied improved techniques and technologies as result of USDA assistance (continuing)
- Number of private enterprises, producers organizations…that applied improved techniques and technologies as result of USDA assistance (insert organization type, repeat as necessary)
RELATIONSHIP TO THE FEED THE FUTURE (FtF) INITIATIVE FtF INDICATOR: Yes [4.5.2-42]
FtF WHOLE OF GOVERNMENT INDICATOR: Yes
DEFINITIONAL AND MEASURMENT NOTES: None
25

FFPr RESULTS FRAMEWORK 1: Increased Agricultural Productivity FFPr RESULTS FRAMEWORK 2: Expanded Trade of Agricultural Products
FFPr 1.4.5/2.4.5: Increased Leverage of Private Sector Resources
FFPr INDICATOR 8: Number of public-private partnerships formed as a result of USDA assistance DEFINITION: The number of public-private partnerships in agriculture or nutrition formed during the reporting year due to USDA intervention (i.e. agricultural or nutrition activity, as described below.) Private partnerships can be long or short in duration (length is not a criteria for measurement.) Partnerships with multiple partners should only be counted once. A public-private alliance (partnership) is considered formed when there is a clear agreement, usually written, to work together to achieve a common objective. There must be either a cash or in-kind significant contribution to the effort by both the public and private entity. A private entity can be a for-profit entity, an NGO using private funds, a private company, a community group, or a state-owned enterprise which seeks to make a profit (even if unsuccessfully). A public entity can be a donor-funded program participant, a national or sub-national government, or state-owned enterprises which are non-profit. A project may form more than one partnership with the same entity, but this is likely to be rare. In counting partnerships, we are not counting transactions with a partner entity; we are counting the number of partnerships formed during the reporting year. Public-private partnerships counted should be only those formed during the current reporting year. Any partnership that was formed in a previous year should not be included. An agricultural activity is any activity related to the supply of agricultural inputs, production methods, agricultural processing or transportation. A nutritional activity includes any activity focused on attempting to improve the nutritional content of agricultural products as provided to consumers, develop improved nutritional products, increase support for nutrition service delivery, etc. RATIONALE: The assumption of this indicator is that if more partnerships are formed it is likely that there will be more investment in agriculture or nutrition-related activities, which ultimately contributes to agriculture sector growth. The improvement in growth will increase the incomes of all, but because the focus of project work is on the vulnerable (women, children and the poor) there will also be a reduction in poverty.
INDICATOR CHARACTERISTICS UNIT OF MEASURE: Number: Partnerships
INDICATOR LEVEL: Output
DIRECTION OF CHANGE: Higher is better
FREQUENCY OF REPORTING: Biannually covering the periods: October 1-March 31 and April 1-September 30
DISAGGREGATION: Type of partnership (refer to the primary focus of the partnership if applicable):
• Agricultural production • Agricultural post-harvest transformation • Nutrition • Multi-focus (use this if there are several components of the above sectors in the partnership) • Other (do not use this for multi-focus partnerships)
DATA SOURCE: WHO WILL COLLECTS DATA FOR THIS INDICATOR: Data will be collected by Program Participants. HOW SHOULD IT BE COLLECTED: Data will be collected at the project-level, through project records of
26
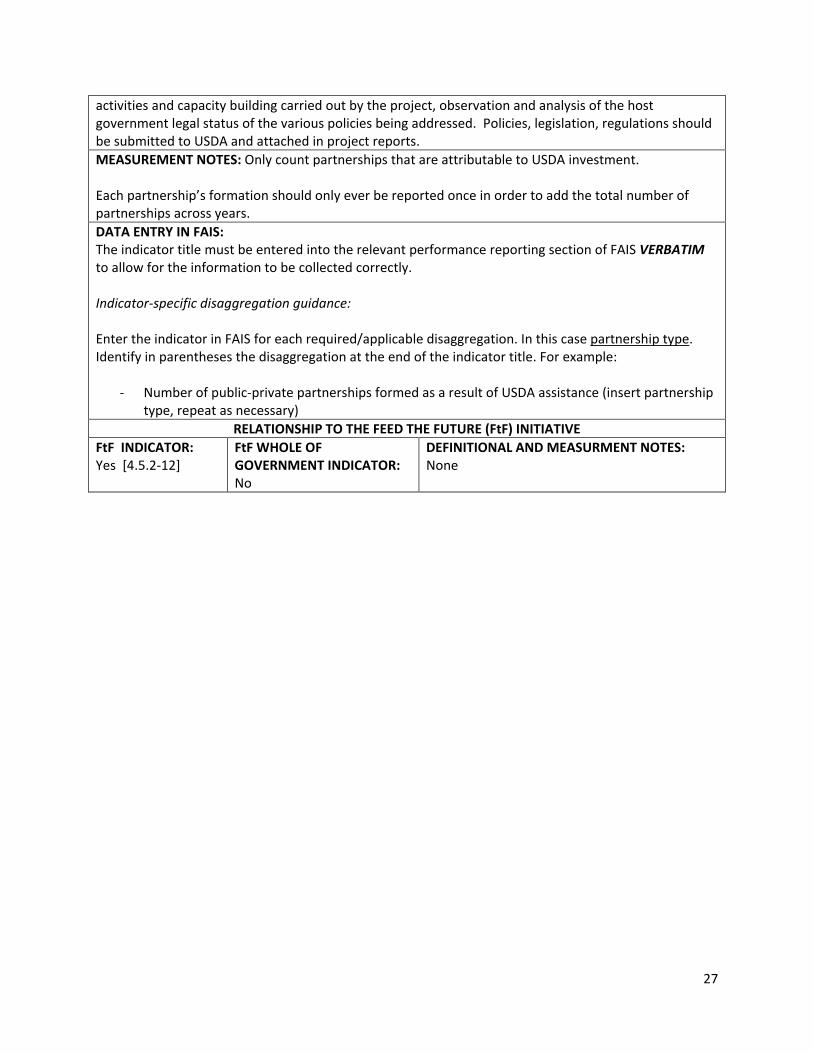
activities and capacity building carried out by the project, observation and analysis of the host government legal status of the various policies being addressed. Policies, legislation, regulations should be submitted to USDA and attached in project reports. MEASUREMENT NOTES: Only count partnerships that are attributable to USDA investment. Each partnership’s formation should only ever be reported once in order to add the total number of partnerships across years. DATA ENTRY IN FAIS: The indicator title must be entered into the relevant performance reporting section of FAIS VERBATIM to allow for the information to be collected correctly. Indicator-specific disaggregation guidance: Enter the indicator in FAIS for each required/applicable disaggregation. In this case partnership type. Identify in parentheses the disaggregation at the end of the indicator title. For example:
- Number of public-private partnerships formed as a result of USDA assistance (insert partnership type, repeat as necessary)
RELATIONSHIP TO THE FEED THE FUTURE (FtF) INITIATIVE FtF INDICATOR: Yes [4.5.2-12]
FtF WHOLE OF GOVERNMENT INDICATOR: No
DEFINITIONAL AND MEASURMENT NOTES: None
27

FFPr RESULTS FRAMEWORK 2: Expanded Trade of Agricultural Products
FFPr RESULTS FRAMEWORK 2: Expanded Trade of Agricultural Products
FFPr INDICATOR 9: Value of new public and private sector investment leveraged as a result of USDA assistance DEFINITION: Investment is defined as any use of public or private sector resources intended to increase future production output or income, to improve the sustainable use of agricultural-related natural resources (soil, water, etc.), to improve water or land management, or anywhere along the food, feed and fiber system and natural resources management. “Private sector” includes any investment from a private actor, including for example for-profit companies, corporate investment banks, etc. “Public sector” includes any investments provided by public actors, for example, other donor agencies including USG (i.e. MCC, USAID, OPIC), local or national host-country government. “Leveraged as a result of USDA assistance” indicates that the new investment was directly encouraged or facilitated by the activities funded or resources provided by USDA. New investment means investment made during the reporting year. RATIONALE: Increased investment is essential to inclusive economic growth in the agricultural sector. Public and private sector investment is key to achieving long-term impact in improvements in food security, agricultural sustainability and expanded trade. Public and private sector investments should be coordinated and complimentary. Private sector investment is critical because it indicates that the investment is perceived by private agents as providing a positive financial return and therefore is likely to lead to sustainable increases in agricultural production and expanded trade. Public sector investments can be used to pilot programs, test innovation, and scale-up effective programs.
INDICATOR CHARACTERISTICS UNIT OF MEASURE: U.S. Dollar
INDICATOR LEVEL: Outcome
DIRECTION OF CHANGE: Higher is better
FREQUENCY OF REPORTING: Biannually covering the periods: October 1-March 31 and April 1-September 30
DISAGGREGATION: Type of investment (required):
• Public • Private
DATA SOURCE: WHO COLLECTS DATA FOR THIS INDICATOR: Data will be collected by Program Participants. HOW SHOULD IT BE COLLECTED: Data will be collected by project records, firm/farm records.
MEASUREMENT NOTES: Convert local currency to US dollars at the average market foreign exchange rate for the reporting period. Report exchange rate in indicator narrative in FAIS.
DATA ENTRY IN FAIS: The indicator title must be entered into the relevant performance reporting section of FAIS VERBATIM to allow for the information to be collected correctly. Indicator-specific disaggregation guidance: Enter the indicator in FAIS for each required/applicable disaggregation. In this case public and private. Identify in parentheses the disaggregation at the end of the indicator title. For example:
28

- Value of new public and private sector investment leveraged as a result of USDA assistance
(public) - Value of new public and private sector investment leveraged as a result of USDA assistance
(private) RELATIONSHIP TO THE FEED THE FUTURE (FtF) INITIATIVE
FtF INDICATOR: Linked to 4.5.2-38
FtF WHOLE OF GOVERNMENT INDICATOR: No
DEFINITIONAL AND MEASURMENT NOTES: USDA measures public and private sector investments whereas FtF only measures private sector investments.
29
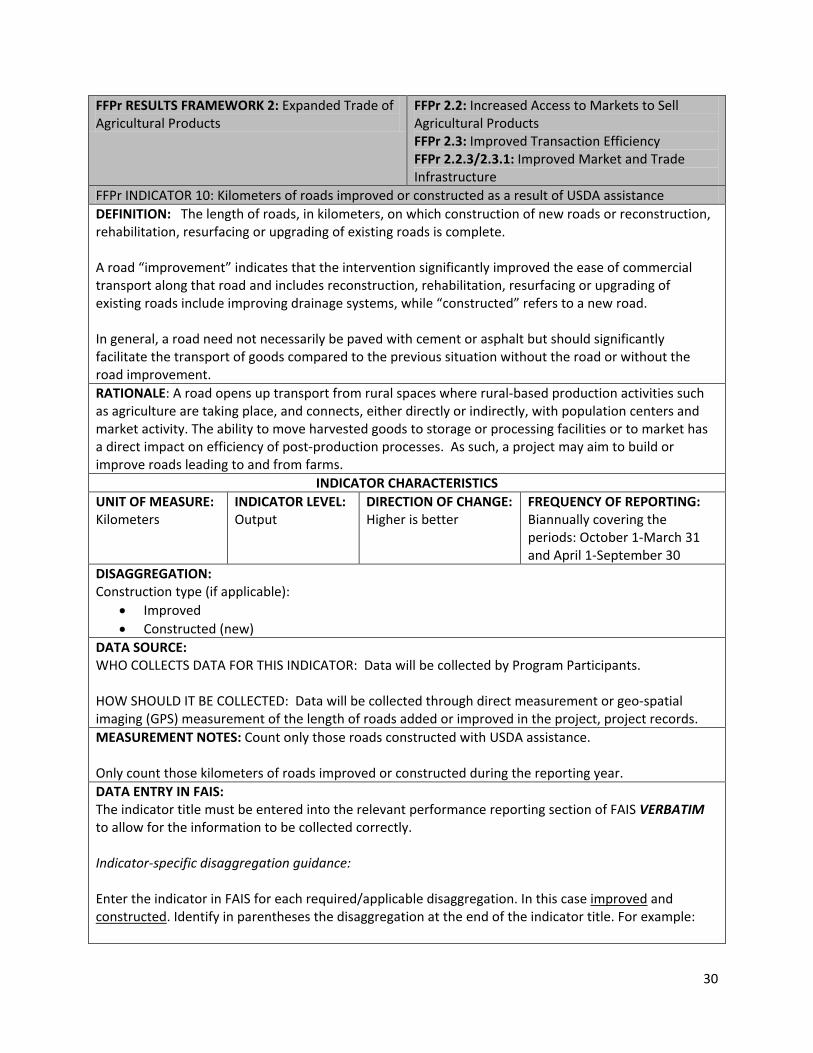
FFPr RESULTS FRAMEWORK 2: Expanded Trade of Agricultural Products
FFPr 2.2: Increased Access to Markets to Sell Agricultural Products FFPr 2.3: Improved Transaction Efficiency FFPr 2.2.3/2.3.1: Improved Market and Trade Infrastructure
FFPr INDICATOR 10: Kilometers of roads improved or constructed as a result of USDA assistance DEFINITION: The length of roads, in kilometers, on which construction of new roads or reconstruction, rehabilitation, resurfacing or upgrading of existing roads is complete. A road “improvement” indicates that the intervention significantly improved the ease of commercial transport along that road and includes reconstruction, rehabilitation, resurfacing or upgrading of existing roads include improving drainage systems, while “constructed” refers to a new road. In general, a road need not necessarily be paved with cement or asphalt but should significantly facilitate the transport of goods compared to the previous situation without the road or without the road improvement. RATIONALE: A road opens up transport from rural spaces where rural-based production activities such as agriculture are taking place, and connects, either directly or indirectly, with population centers and market activity. The ability to move harvested goods to storage or processing facilities or to market has a direct impact on efficiency of post-production processes. As such, a project may aim to build or improve roads leading to and from farms.
INDICATOR CHARACTERISTICS UNIT OF MEASURE: Kilometers
INDICATOR LEVEL: Output
DIRECTION OF CHANGE: Higher is better
FREQUENCY OF REPORTING: Biannually covering the periods: October 1-March 31 and April 1-September 30
DISAGGREGATION: Construction type (if applicable):
• Improved • Constructed (new)
DATA SOURCE: WHO COLLECTS DATA FOR THIS INDICATOR: Data will be collected by Program Participants. HOW SHOULD IT BE COLLECTED: Data will be collected through direct measurement or geo-spatial imaging (GPS) measurement of the length of roads added or improved in the project, project records. MEASUREMENT NOTES: Count only those roads constructed with USDA assistance. Only count those kilometers of roads improved or constructed during the reporting year. DATA ENTRY IN FAIS: The indicator title must be entered into the relevant performance reporting section of FAIS VERBATIM to allow for the information to be collected correctly. Indicator-specific disaggregation guidance: Enter the indicator in FAIS for each required/applicable disaggregation. In this case improved and constructed. Identify in parentheses the disaggregation at the end of the indicator title. For example:
30

- Kilometers of roads improved or constructed as a result of USDA assistance (improved) - Kilometers of roads improved or constructed as a result of USDA assistance (constructed)
RELATIONSHIP TO THE FEED THE FUTURE (FtF) INITIATIVE FtF INDICATOR: Yes [4.5.1-17]
FtF WHOLE OF GOVERNMENT INDICATOR: Yes
DEFINITIONAL AND MEASURMENT NOTES: None
31
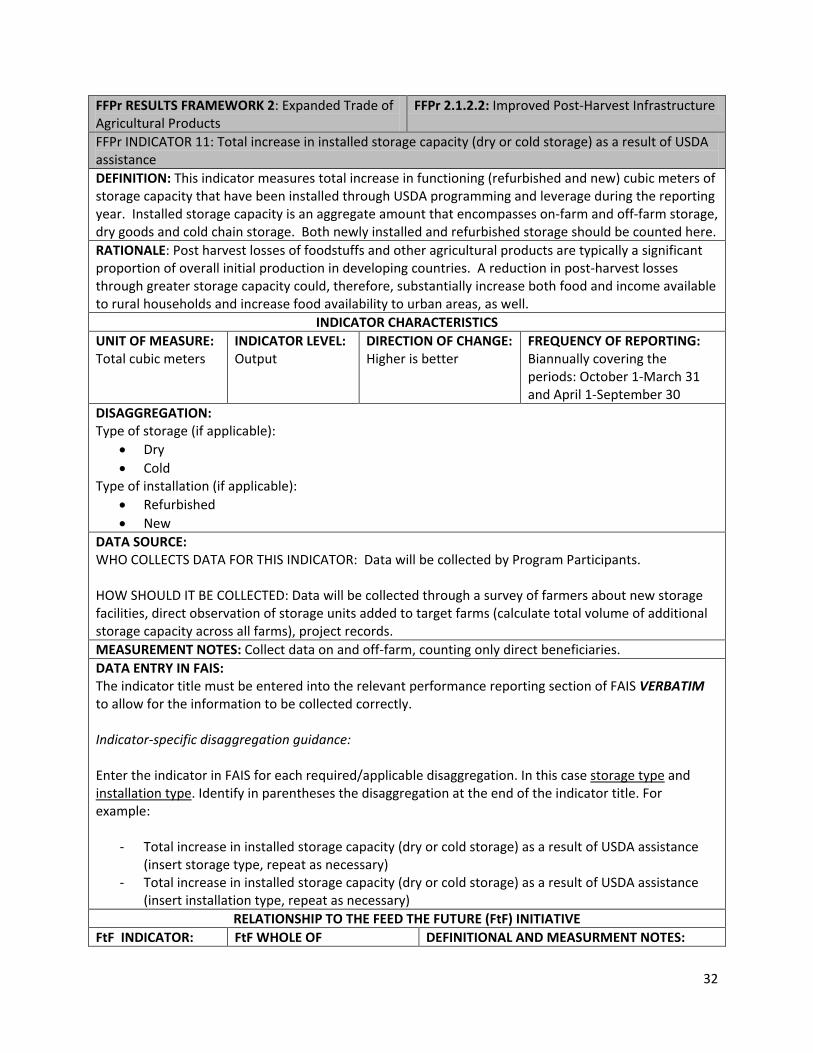
FFPr RESULTS FRAMEWORK 2: Expanded Trade of Agricultural Products
FFPr 2.1.2.2: Improved Post-Harvest Infrastructure
FFPr INDICATOR 11: Total increase in installed storage capacity (dry or cold storage) as a result of USDA assistance DEFINITION: This indicator measures total increase in functioning (refurbished and new) cubic meters of storage capacity that have been installed through USDA programming and leverage during the reporting year. Installed storage capacity is an aggregate amount that encompasses on-farm and off-farm storage, dry goods and cold chain storage. Both newly installed and refurbished storage should be counted here. RATIONALE: Post harvest losses of foodstuffs and other agricultural products are typically a significant proportion of overall initial production in developing countries. A reduction in post-harvest losses through greater storage capacity could, therefore, substantially increase both food and income available to rural households and increase food availability to urban areas, as well.
INDICATOR CHARACTERISTICS UNIT OF MEASURE: Total cubic meters
INDICATOR LEVEL: Output
DIRECTION OF CHANGE: Higher is better
FREQUENCY OF REPORTING: Biannually covering the periods: October 1-March 31 and April 1-September 30
DISAGGREGATION: Type of storage (if applicable):
• Dry • Cold
Type of installation (if applicable): • Refurbished • New
DATA SOURCE: WHO COLLECTS DATA FOR THIS INDICATOR: Data will be collected by Program Participants. HOW SHOULD IT BE COLLECTED: Data will be collected through a survey of farmers about new storage facilities, direct observation of storage units added to target farms (calculate total volume of additional storage capacity across all farms), project records. MEASUREMENT NOTES: Collect data on and off-farm, counting only direct beneficiaries. DATA ENTRY IN FAIS: The indicator title must be entered into the relevant performance reporting section of FAIS VERBATIM to allow for the information to be collected correctly. Indicator-specific disaggregation guidance: Enter the indicator in FAIS for each required/applicable disaggregation. In this case storage type and installation type. Identify in parentheses the disaggregation at the end of the indicator title. For example:
- Total increase in installed storage capacity (dry or cold storage) as a result of USDA assistance (insert storage type, repeat as necessary)
- Total increase in installed storage capacity (dry or cold storage) as a result of USDA assistance (insert installation type, repeat as necessary)
RELATIONSHIP TO THE FEED THE FUTURE (FtF) INITIATIVE FtF INDICATOR: FtF WHOLE OF DEFINITIONAL AND MEASURMENT NOTES:
32

Yes [4.5-10] GOVERNMENT INDICATOR: No
None
33

FFPr RESULTS FRAMEWORK 2: Expanded Trade of Agricultural Products
FFPr 2.1.1.1: Increased Adoption of Established Standards by Industry
FFPr INDICATOR 12: Number of policies, regulations and/or administrative procedures in each of the following stages of development as a result of USDA assistance DEFINITION: Number of agricultural enabling environment policies/regulations/administrative procedures in the areas of agricultural resource, food, market standards & regulation, public investment, natural resource or water management and climate change adaptation/mitigation as it related to agriculture that:
• Stage 1: Underwent the first stage of the policy reform process i.e. analysis (review of existing policy/regulation/administrative procedure and/or proposal of new policy/regulations/administrative procedures.)
• Stage 2: Underwent the second stage of the policy reform process. The second stage includes public debate and/or consultation with stakeholders on the proposed new or revised policy/regulation/administrative procedure.
• Stage 3: Underwent the third stage of the policy reform process (policies were presented for legislation/degree to improve the policy environment for smallholder-based agriculture.)
• Stage 4: Underwent the fourth stage of the policy reform process [official approval (legislation/decree) of new or revised policy/regulation/administrative procedure by relevant authority.]
• Stage 5: Completed the policy reform process (implementation of new or revised policy/regulation/administrative procedure by relevant authority.)
RATIONALE: This indicator measures the number of policies/regulations/administrative procedures in the various stages of progress towards an enhanced enabling environment for agriculture whose sub-elements are specific policy sectors. It includes the development, implementation and enforcement of policies and regulations that support the achievement of one or more results in the FFPr framework focused on expanding trade in agricultural products.
INDICATOR CHARACTERISTICS UNIT OF MEASURE: Number: policies, regulations, and/or administrative procedures and supplementary narrative
INDICATOR LEVEL: Stages 1 & 2: Output Stages 3, 4 & 5: Outcome
DIRECTION OF CHANGE: Although this set of five indicators tracks individual policies through the stages, one should see the aggregates of these indicators, over time, change in certain ways. One should expect the value of the indicators measuring the earlier stages to decline and the indicators measuring the later stages of progress to increase as the enabling environment is strengthened (i.e. move from analysis to adoption and implementation of reforms)
FREQUENCY OF REPORTING: Biannually covering the periods: October 1-March 31 and April 1-September 30
DISAGGREGATION (required): Stage: (1-5) DATA SOURCE: WHO COLLECTS DATA FOR THIS INDICATOR: Data will be collected by Program Participants. HOW SHOULD IT BE COLLECTED: Data will be collected at the project-level, through project records of
34

activities and capacity building carried out by the project, observation and analysis of the host government legal status of the various policies being addressed. Policies, legislation, regulations should be submitted to USDA and attached in biannual project reports. MEASUREMENT NOTES: Only count policies specifically addressed with USDA assistance. This indicator tracks the policy, regulation, or administrative procedure. Multiple project participants working in the same country or region (with regard to regional policies) may report the same policy, regulation, or administrative procedure as long as the program participant participated in the process and provided assistance to the development, drafting, formation of the law or policy. DATA ENTRY IN FAIS: The indicator title must be entered into the relevant performance reporting section of FAIS VERBATIM to allow for the information to be collected correctly. Indicator-specific disaggregation guidance: Enter the indicator in FAIS for each required/applicable disaggregation. In this case stages 1, 2, 3, 4, and 5. Identify in parentheses the disaggregation at the end of the indicator title. For example:
- Number of policies, regulations and/or administrative procedures in each of the following stages of development as a result of USDA assistance (stage 1)
- Number of policies, regulations and/or administrative procedures in each of the following stages of development as a result of USDA assistance (stage 2)
- And so on as necessary… RELATIONSHIP TO THE FEED THE FUTURE (FtF) INITIATIVE
FtF INDICATOR: Yes [4.5.1-24]
FtF WHOLE OF GOVERNMENT INDICATOR: No
DEFINITIONAL AND MEASUREMENT NOTES: None
35

FFPr RESULTS FRAMEWORK 2: Expanded Trade of Agricultural Products
FFPr RESULTS FRAMEWORK 2: Expanded Trade of Agricultural Products
FFPr INDICATOR 13: Value of sales by project beneficiaries DEFINITION: This indicator will collect the value (in US dollars) of sales of targeted commodities by all project beneficiaries. This includes all sales by direct project beneficiaries of the targeted commodity(ies), not just farm-gate sales. The actual number reported for the indicator will be the value of sales of a product (crop, animal or fish) by direct project beneficiaries in the reporting period. Only count sales in the reporting period attributable to USDA investment. USDA will use the data reported for this indicator to calculate the value of incremental sales for reporting to the Feed the Future Initiative. The value of incremental sales indicates the value (in USD) of the total amount of agricultural products sold by targeted beneficiaries relative to a base year and is calculated as the total value of sales of a product (crop, animal or fish) during the reporting year minus the total value of sales in the base year. Please note that the value of incremental sales indicator cannot be calculated without a value for baseline year’s sales. If data on the total value of sales of the value chain commodity by direct beneficiaries prior to USDA activity implementation is not available, do not leave the baseline blank or enter ‘0.’ Use the earliest reporting year sales actual as the baseline year sales. This will result in some underestimation of the total value of incremental sales achieved by the USDA project, but this is preferable to being unable to calculate incremental sales at all. If a direct beneficiary sample is used to collect sales data, sample survey estimates must be extrapolated to total beneficiary estimated values before entry into FAIS to accurately reflect total sales by the activity’s direct beneficiaries. RATIONALE: Value (in US dollars) of sales at the farm and enterprise level of targeted commodities is a measure of the competitiveness of those beneficiaries receiving USDA assistance. This measurement also helps track access to markets and progress toward commercialization by farmers and enterprises receiving USDA assistance. An increase in sales of agricultural products is directly related to increasing agricultural productivity and expanding trade of agricultural products.
INDICATOR CHARACTERISTICS UNIT OF MEASURE: U.S. Dollar
INDICATOR LEVEL: Outcome
DIRECTION OF CHANGE: Higher is better
FREQUENCY OF REPORTING: Biannually covering the periods: October 1-March 31 and April 1-September 30
DISAGGREGATION: Commodity Type Note: Horticultural product-specific disaggregation is not required for this indicator. The overall “horticulture” commodity disaggregate can be used if desired. DATA SOURCE: WHO COLLECTS DATA FOR THIS INDICATOR: Data will be collected by Program Participants. HOW SHOULD IT BE COLLECTED: Data will be collected by project records, firm/farm records.
MEASUREMENT NOTES: Collect data only at the project-level, attributed to USDA assistance. Data should only be collected from direct project beneficiaries. These beneficiaries should be reported in Indicator 17.
36

Convert local currency to USD at the average market foreign exchange rate for the reporting period. Report exchange rate in comments in FAIS. Note that the volume (in metric tons) of sales will be reported in Indicator 14. There should be a correlation between the value of sales reported for this Indicator and the volume (in metric tons) of sales reported in Indicator 14. DATA ENTRY IN FAIS: The indicator title must be entered into the relevant performance reporting section of FAIS VERBATIM to allow for the information to be collected correctly. Indicator-specific disaggregation guidance: Enter the indicator in FAIS for each required/applicable disaggregation. In this case commodity type. Identify in parentheses the disaggregation at the end of the indicator title. For example:
- Value of sales by project beneficiaries (insert commodity type, repeat as necessary) RELATIONSHIP TO THE FEED THE FUTURE (FtF) INITIATIVE
FtF INDICATOR: Yes [4.5.2-23]
FtF WHOLE OF GOVERNMENT INDICATOR: Yes
DEFINITIONAL AND MEASURMENT NOTES: FtF collects this data at the farm level based on purchases from smallholder farmers while FFPr collects this data at all levels (farm and enterprise-level) based on value of sales by all targeted beneficiaries. As this is an FtF Whole of Government indicator, FtF has produced additional guidance on the measurement of this indicator. Please refer to this guidance for additional information: Feed the Future Agricultural Indicators Guide (http://agrilinks.org/library/feed-the-future-ag-indicators-guide).
37
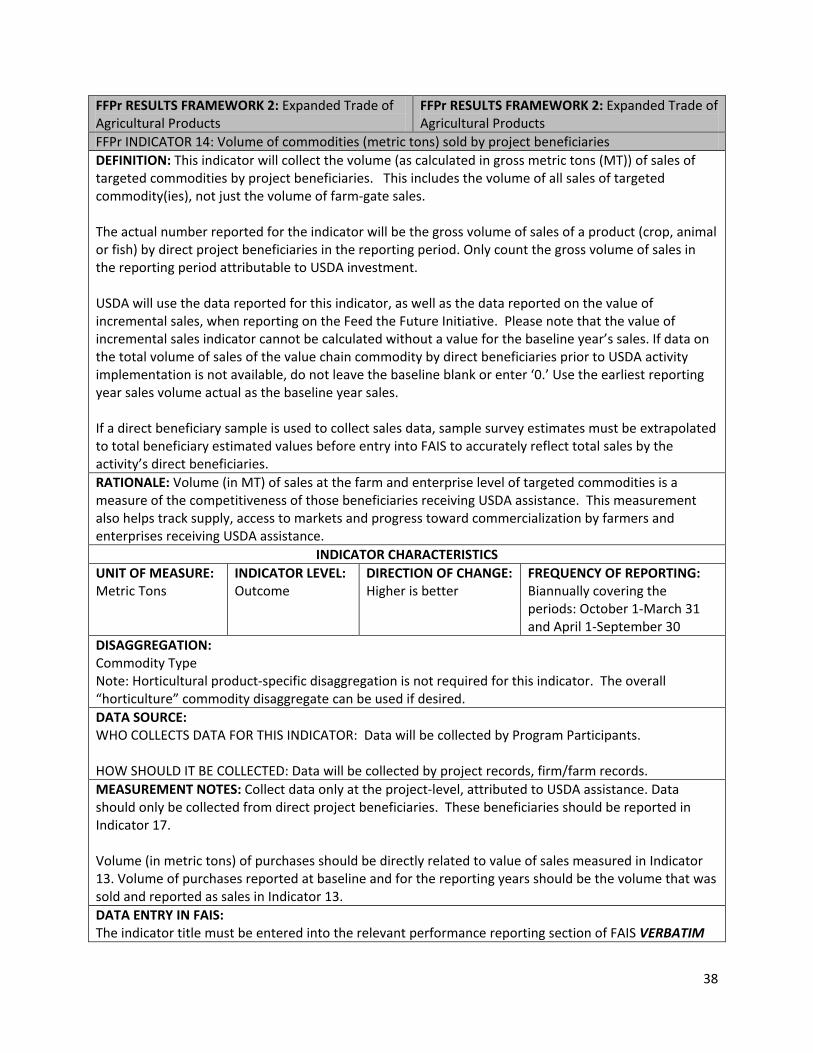
FFPr RESULTS FRAMEWORK 2: Expanded Trade of Agricultural Products
FFPr RESULTS FRAMEWORK 2: Expanded Trade of Agricultural Products
FFPr INDICATOR 14: Volume of commodities (metric tons) sold by project beneficiaries DEFINITION: This indicator will collect the volume (as calculated in gross metric tons (MT)) of sales of targeted commodities by project beneficiaries. This includes the volume of all sales of targeted commodity(ies), not just the volume of farm-gate sales. The actual number reported for the indicator will be the gross volume of sales of a product (crop, animal or fish) by direct project beneficiaries in the reporting period. Only count the gross volume of sales in the reporting period attributable to USDA investment. USDA will use the data reported for this indicator, as well as the data reported on the value of incremental sales, when reporting on the Feed the Future Initiative. Please note that the value of incremental sales indicator cannot be calculated without a value for the baseline year’s sales. If data on the total volume of sales of the value chain commodity by direct beneficiaries prior to USDA activity implementation is not available, do not leave the baseline blank or enter ‘0.’ Use the earliest reporting year sales volume actual as the baseline year sales. If a direct beneficiary sample is used to collect sales data, sample survey estimates must be extrapolated to total beneficiary estimated values before entry into FAIS to accurately reflect total sales by the activity’s direct beneficiaries. RATIONALE: Volume (in MT) of sales at the farm and enterprise level of targeted commodities is a measure of the competitiveness of those beneficiaries receiving USDA assistance. This measurement also helps track supply, access to markets and progress toward commercialization by farmers and enterprises receiving USDA assistance.
INDICATOR CHARACTERISTICS UNIT OF MEASURE: Metric Tons
INDICATOR LEVEL: Outcome
DIRECTION OF CHANGE: Higher is better
FREQUENCY OF REPORTING: Biannually covering the periods: October 1-March 31 and April 1-September 30
DISAGGREGATION: Commodity Type Note: Horticultural product-specific disaggregation is not required for this indicator. The overall “horticulture” commodity disaggregate can be used if desired. DATA SOURCE: WHO COLLECTS DATA FOR THIS INDICATOR: Data will be collected by Program Participants. HOW SHOULD IT BE COLLECTED: Data will be collected by project records, firm/farm records. MEASUREMENT NOTES: Collect data only at the project-level, attributed to USDA assistance. Data should only be collected from direct project beneficiaries. These beneficiaries should be reported in Indicator 17. Volume (in metric tons) of purchases should be directly related to value of sales measured in Indicator 13. Volume of purchases reported at baseline and for the reporting years should be the volume that was sold and reported as sales in Indicator 13. DATA ENTRY IN FAIS: The indicator title must be entered into the relevant performance reporting section of FAIS VERBATIM
38

to allow for the information to be collected correctly. Indicator-specific disaggregation guidance: Enter the indicator in FAIS for each required/applicable disaggregation. In this case commodity type. Identify in parentheses the disaggregation at the end of the indicator title. For example:
- Volume of commodities (metric tons) sold by project beneficiaries (insert commodity type, repeat as necessary)
RELATIONSHIP TO THE FEED THE FUTURE (FtF) INITIATIVE FtF INDICATOR: Yes [4.5.2-23]
FtF WHOLE OF GOVERNMENT INDICATOR: Yes
DEFINITIONAL AND MEASURMENT NOTES: FtF collects this information as part of the Value of Incremental Sales indicator. In order to capture this data in USDA’s database system, a separate indicator on volume has been developed.
39

FFPr RESULTS FRAMEWORK 1: Increased Agricultural Productivity
FFPr RESULTS FRAMEWORK 2: Expanded Trade of Agricultural Products
FFPr INDICATOR 15: Number of jobs attributed to USDA assistance DEFINITION: Jobs are all types of employment opportunities created during the reporting year in agriculture- or rural-related enterprises (including paid on-farm/fishery employment.) Jobs lasting less than one month are not counted in order to emphasize those jobs that provide more stability through duration. Jobs should be converted to full-time equivalents (FTE). Thus, a job that lasts four months should be counted as 1/3 FTE and a job that lasts for 130 days should be counted as ½ FTE. Number of hours worked per day or per week is not restricted as work hours may vary greatly. Attributed to USDA assistance includes farming and non-farm jobs where USDA investments were intentional in assisting in any way to expand (or contract) jobs and where a program objective of the USDA investment was job creation. Examples of jobs created include cash for work programs, construction of roads and other infrastructure and on-farm employment. To be considered a job created, the positions must last longer than one month in duration. RATIONALE: This is a direct measure of improved livelihoods, as it measures creation of employment and related income. However, USDA is concerned about creation of sustainable employment, not temporary employment (of short duration such as a period of less than one month.)
INDICATOR CHARACTERISTICS UNIT OF MEASURE: Number: Jobs
INDICATOR LEVEL: Outcome
DIRECTION OF CHANGE: Higher is better
FREQUENCY OF REPORTING: Biannually covering the periods: October 1-March 31 and April 1-September 30
DISAGGREGATION (required): Gender of Job Holder: Male, Female DATA SOURCE: WHO COLLECTS DATA FOR THIS INDICATOR: Data will be collected by Program Participants. HOW SHOULD IT BE COLLECTED: Data will be collected by project records, firm/farm records. MEASUREMENT NOTES: Collect data only at the project-level, attributed to FFPr programs. In determining the sex of the job holder, if one FTE is split by a male and a female, then it would be a 0.5 FTE for females and 0.5 FTE for males Each job created should only ever be reported once in order to add the total number of jobs across years. DATA ENTRY IN FAIS: The indicator title must be entered into the relevant performance reporting section of FAIS VERBATIM to allow for the information to be collected correctly. Indicator-specific disaggregation guidance: Enter the indicator in FAIS for each required/applicable disaggregation. In this case male and female. Identify in parentheses the disaggregation at the end of the indicator title. For example:
- Number of jobs attributed to USDA assistance (male) - Number of jobs attributed to USDA assistance (female)
40

RELATIONSHIP TO THE FEED THE FUTURE (FtF) INITIATIVE FtF INDICATOR: Yes [4.5-2]
FtF WHOLE OF GOVERNMENT INDICATOR: No
DEFINITIONAL AND MEASURMENT NOTES: None
41

FFPr RESULTS FRAMEWORK 1: Increased Agricultural Productivity
FFPr RESULTS FRAMEWORK 2: Expanded Trade of Agricultural Products
FFPr INDICATOR 16: Number of individuals who have received short-term agricultural sector productivity or food security training as a result of USDA assistance DEFINITION: The number of individuals to whom significant knowledge or skills have been imparted through interactions that are intentional, structured, and purposed for imparting knowledge or skills should be counted as training, through formal or informal means. There is no pre-defined minimum or maximum length of time for the training; what is key is that the training reflects a planned, structured curriculum designed to strengthen capacities, and there is a reasonable expectation that the training recipient will acquire new knowledge or skills that s/he could translate into action. Count an individual only once, regardless of the number of trainings received during the reporting year and whether the trainings covered different topics. Do not count sensitization meetings or one-off information meetings. Short-term includes all non-degree seeking training. Individuals include agricultural producers, ranchers, fisheries, and other primary sector producers who receive training in a variety of best practices in productivity, post-harvest management, linking to markets, etc. It also includes rural entrepreneurs, processors, managers and traders receiving training in application of new technologies, business management, linking to markets, etc., and extension specialists, researchers, inspectors, government employees, policy makers, and others who are engaged in the food, feed and fiber system and natural resources management. In-country and offshore training are included. Delivery mechanisms can include a variety of extension methods as well as technical assistance activities. RATIONALE: Enhanced human capacity for increased agriculture productivity, improved food security, policy formulation and/or implementation, is key to transformational development.
INDICATOR CHARACTERISTICS UNIT OF MEASURE: Number: Individuals
INDICATOR LEVEL: Output
DIRECTION OF CHANGE: Higher is better
FREQUENCY OF REPORTING: Biannually covering the periods: October 1-March 31 and April 1-September 30
DISAGGREGATION: Gender: Male/Female (required) New/Continuing (required):
• New = this reporting year is the first year the person applied the new technology or technique • Continuing = the person first applied the new technology or technique in the previous year and
continues to apply it Type of individual (if applicable):
• Producers (farmers, fishers, pastoralists, ranchers, etc.) • People in firms (e.g. processors, service providers, manufacturers) • People in government (e.g. extension workers, policymakers) • People in civil society (e.g. NGOs, CBOs, research and academic organizations)
o Note: While private sector firms are considered part of civil society more broadly, only count them under the Private Sector Firms and not the Civil Society disaggregate to avoid double counting.
DATA SOURCE: WHO COLLECTS DATA FOR THIS INDICATOR: Data will be collected by Program Participants.
42

HOW SHOULD IT BE COLLECTED: Data will be collected from program participant training records, reports, or surveys. Program participants should keep detailed training lists for all training sessions. MEASUREMENT NOTES: Count only those individuals targeted by USDA programs. This indicator is a comprehensive indicator that includes all USDA supported training. This indicator is to measure individuals receiving training, for which the outcome, individuals applying new practices should be reported under Indicator 2 (Number of individuals who have applied new techniques or technologies as a result of USDA assistance). Groups applying new technology or practices should be reported under Indicator 7 (Number of private enterprises, producer organizations, water users associations, women’s groups, trade and business associations and community-based organizations that applied new techniques and technology as a result of USDA assistance). Individuals should not be double counted in a given fiscal year. For example, if one individual participates in multiple project-sponsored training courses in a given fiscal year, they should only be counted one time in that fiscal year. Individuals participating in project-sponsored training courses in multiple fiscal years may be counted once in each fiscal year. DATA ENTRY IN FAIS: The indicator title must be entered into the relevant performance reporting section of FAIS VERBATIM to allow for the information to be collected correctly. Indicator-specific disaggregation guidance: Enter the indicator in FAIS for each required/applicable disaggregation. In this case male, female, new, continuing, and individual type. Identify in parentheses the disaggregation at the end of the indicator title. For example:
- Number of individuals who have received short-term agricultural sector productivity or food security training as a result of USDA assistance (male)
- Number of individuals who have received short-term agricultural sector productivity or food security training as a result of USDA assistance (female)
- Number of individuals who have received short-term agricultural sector productivity or food security training as a result of USDA assistance (new)
- Number of individuals who have received short-term agricultural sector productivity or food security training as a result of USDA assistance (continuing)
- Number of individuals who have received short-term agricultural sector productivity or food security training as a result of USDA assistance (insert individual type, repeat as necessary)
RELATIONSHIP TO THE FEED THE FUTURE (FtF) INITIATIVE FtF INDICATOR: Yes [4.5.2-7]
FtF WHOLE OF GOVERNMENT INDICATOR: Yes
DEFINITIONAL AND MEASURMENT NOTES: FtF frequency of reporting is annually.
43
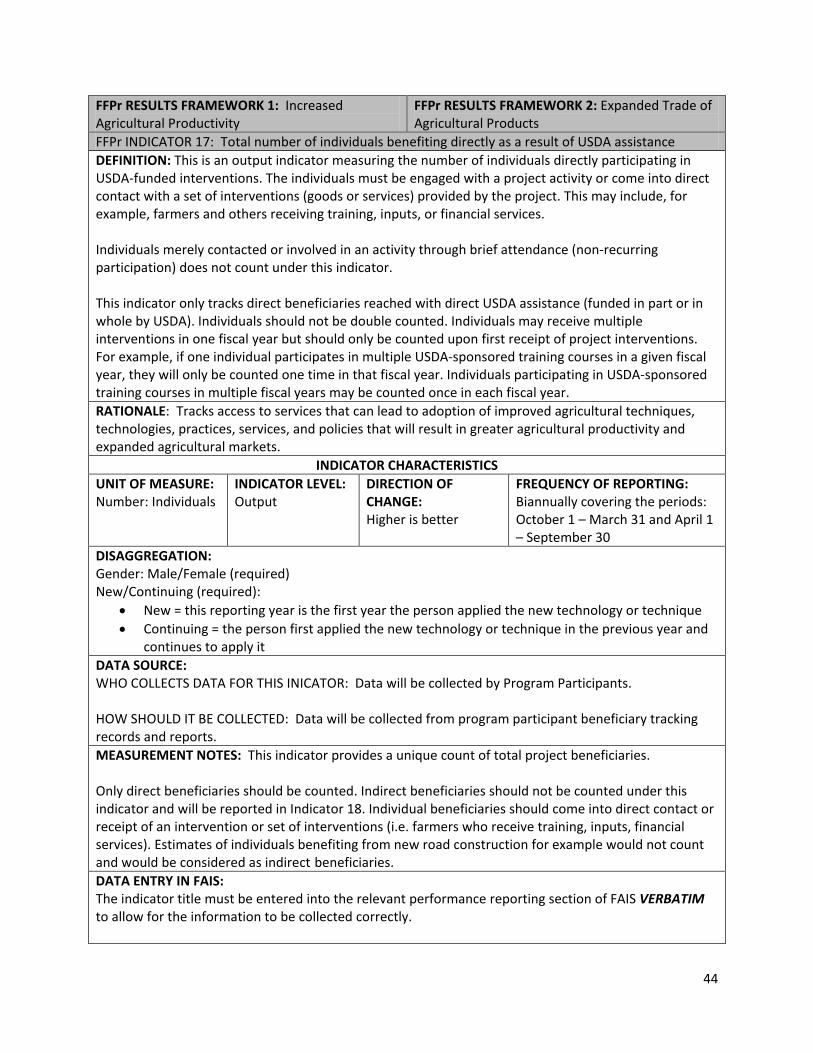
FFPr RESULTS FRAMEWORK 1: Increased Agricultural Productivity
FFPr RESULTS FRAMEWORK 2: Expanded Trade of Agricultural Products
FFPr INDICATOR 17: Total number of individuals benefiting directly as a result of USDA assistance DEFINITION: This is an output indicator measuring the number of individuals directly participating in USDA-funded interventions. The individuals must be engaged with a project activity or come into direct contact with a set of interventions (goods or services) provided by the project. This may include, for example, farmers and others receiving training, inputs, or financial services. Individuals merely contacted or involved in an activity through brief attendance (non-recurring participation) does not count under this indicator. This indicator only tracks direct beneficiaries reached with direct USDA assistance (funded in part or in whole by USDA). Individuals should not be double counted. Individuals may receive multiple interventions in one fiscal year but should only be counted upon first receipt of project interventions. For example, if one individual participates in multiple USDA-sponsored training courses in a given fiscal year, they will only be counted one time in that fiscal year. Individuals participating in USDA-sponsored training courses in multiple fiscal years may be counted once in each fiscal year. RATIONALE: Tracks access to services that can lead to adoption of improved agricultural techniques, technologies, practices, services, and policies that will result in greater agricultural productivity and expanded agricultural markets.
INDICATOR CHARACTERISTICS UNIT OF MEASURE: Number: Individuals
INDICATOR LEVEL: Output
DIRECTION OF CHANGE: Higher is better
FREQUENCY OF REPORTING: Biannually covering the periods: October 1 – March 31 and April 1 – September 30
DISAGGREGATION: Gender: Male/Female (required) New/Continuing (required):
• New = this reporting year is the first year the person applied the new technology or technique • Continuing = the person first applied the new technology or technique in the previous year and
continues to apply it DATA SOURCE: WHO COLLECTS DATA FOR THIS INICATOR: Data will be collected by Program Participants. HOW SHOULD IT BE COLLECTED: Data will be collected from program participant beneficiary tracking records and reports. MEASUREMENT NOTES: This indicator provides a unique count of total project beneficiaries. Only direct beneficiaries should be counted. Indirect beneficiaries should not be counted under this indicator and will be reported in Indicator 18. Individual beneficiaries should come into direct contact or receipt of an intervention or set of interventions (i.e. farmers who receive training, inputs, financial services). Estimates of individuals benefiting from new road construction for example would not count and would be considered as indirect beneficiaries. DATA ENTRY IN FAIS: The indicator title must be entered into the relevant performance reporting section of FAIS VERBATIM to allow for the information to be collected correctly.
44

Indicator-specific disaggregation guidance: Enter the indicator in FAIS for each required/applicable disaggregation. In this case male, female, new, and continuing. Identify in parentheses the disaggregation at the end of the indicator title. For example:
- Total number of individuals benefiting directly as a result of USDA assistance (male) - Total number of individuals benefiting directly as a result of USDA assistance (female) - Total number of individuals benefiting directly as a result of USDA assistance (new) - Total number of individuals benefiting directly as a result of USDA assistance (continuing)
RELATIONSHIP TO THE FEED THE FUTURE (FtF) INITIATIVE FtF INDICATOR: No
FtF WHOLE OF GOVERNMENT INDICATOR: No
DEFINITIONAL AND MEASUREMENT NOTES: None
45

FFPr RESULTS FRAMEWORK 1: Increased Agricultural Productivity
FFPr RESULTS FRAMEWORK 2: Expanded Trade of Agricultural Products
FFPr INDICATOR 18: Total number of individuals benefiting indirectly as a result of USDA assistance DEFINITION: This is an output indicator measuring the number of individuals indirectly benefitting from USDA-funded interventions. The individuals will not be directly engaged with a project activity or come into direct contact with a set of interventions (goods or services) provided by the project. This may include for example family members of farmers trained. Individuals should not be double counted. Individuals may benefit from multiple interventions in one fiscal year but should only be counted once per fiscal year. If an individual is already counted as a direct beneficiary, the individual should not also be counted as an indirect beneficiary if they are indirectly benefitting from other project interventions. For example, if a farmer is counted as a direct beneficiary after directly participating in a training course, the farmer should not also be counted as an indirect beneficiary if another family member participates in a different training course. RATIONALE: Tracks indirect impact of project on community or area of intervention.
INDICATOR CHARACTERISTICS UNIT OF MEASURE: Number: Individuals
INDICATOR LEVEL: Output
DIRECTION OF CHANGE: Higher is better
FREQUENCY OF REPORTING: Biannually covering the periods: October 1 – March 31 and April 1 – September 30
DISAGGREGATION: None DATA SOURCE: WHO COLLECTS DATA FOR THIS INICATOR: Data will be collected by program participants. HOW SHOULD IT BE COLLECTED: Data will be collected from program participant beneficiary tracking records and reports. MEASUREMENT NOTES: Only indirect beneficiaries should be counted under this indicator. Individual beneficiaries should not come into direct contact or receipt of an intervention or set of interventions, but should indirectly benefit from one or more of the project’s interventions. For example, family members who benefit from training should be counted under this indicator but farmers receiving the training should be counted as a direct beneficiary. DATA ENTRY IN FAIS: The indicator title must be entered into the relevant performance reporting section of FAIS VERBATIM to allow for the information to be collected correctly. Indicator-specific disaggregation guidance: None
RELATIONSHIP TO THE FEED THE FUTURE (FtF) INITIATIVE FtF INDICATOR: No
FtF WHOLE OF GOVERNMENT INDICATOR: No
DEFINITIONAL AND MEASURMENT NOTES: None
46
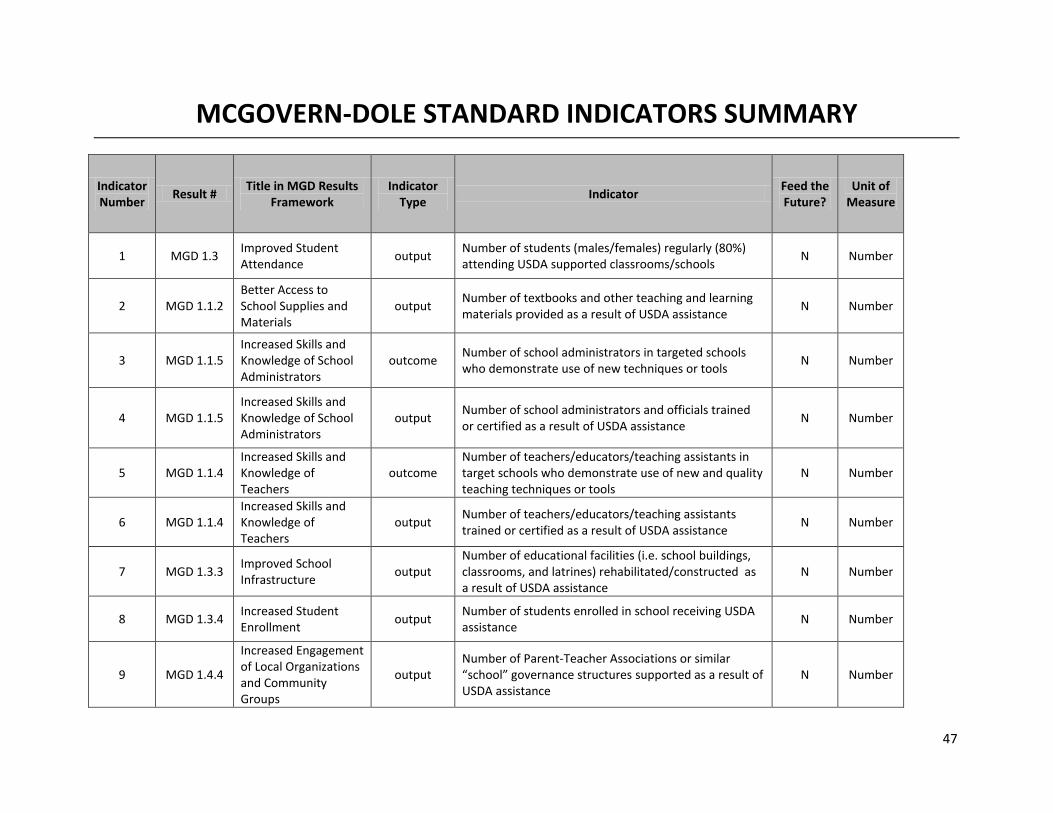
MCGOVERN-DOLE STANDARD INDICATORS SUMMARY
Indicator Number Result # Title in MGD Results
Framework Indicator
Type Indicator Feed the Future?
Unit of Measure
1 MGD 1.3 Improved Student Attendance output Number of students (males/females) regularly (80%)
attending USDA supported classrooms/schools N Number
2 MGD 1.1.2 Better Access to School Supplies and Materials
output Number of textbooks and other teaching and learning materials provided as a result of USDA assistance N Number
3 MGD 1.1.5 Increased Skills and Knowledge of School Administrators
outcome Number of school administrators in targeted schools who demonstrate use of new techniques or tools N Number
4 MGD 1.1.5 Increased Skills and Knowledge of School Administrators
output Number of school administrators and officials trained or certified as a result of USDA assistance N Number
5 MGD 1.1.4 Increased Skills and Knowledge of Teachers
outcome Number of teachers/educators/teaching assistants in target schools who demonstrate use of new and quality teaching techniques or tools
N Number
6 MGD 1.1.4 Increased Skills and Knowledge of Teachers
output Number of teachers/educators/teaching assistants trained or certified as a result of USDA assistance N Number
7 MGD 1.3.3 Improved School Infrastructure output
Number of educational facilities (i.e. school buildings, classrooms, and latrines) rehabilitated/constructed as a result of USDA assistance
N Number
8 MGD 1.3.4 Increased Student Enrollment output Number of students enrolled in school receiving USDA
assistance N Number
9 MGD 1.4.4
Increased Engagement of Local Organizations and Community Groups
output Number of Parent-Teacher Associations or similar “school” governance structures supported as a result of USDA assistance
N Number
47

Indicator Number Result # Title in MGD Results
Framework Indicator
Type Indicator Feed the Future?
Unit of Measure
10 MGD 1.4.4
Increased Engagement of Local Organizations and Community Groups
output Number of public-private partnerships formed as a result of USDA assistance Y Number
11 MGD 1.4.3/ 1.4.4
Increased Government Support/ Increased Engagement of Local Organizations and Community Groups
outcome Value of new public and private sector investments leveraged as a result of USDA assistance N U.S.
Dollar
12 MGD 1.4.2 Improved Policy or Regulatory Framework
output (stages 1 &
2)
outcome (stages 3, 4
& 5)
Number of educational policies, regulations and/or administrative procedures in each of the following stages of development as a result of USDA assistance: Stage 1: Analyzed Stage 2: Drafted and presented for public/stakeholder consultation Stage 3: Presented for legislation/decree Stage 4: Passed/Approved Stage 5: Passed for which implementation has begun
N Number
13 MGD 1.2.1.1
Increased Access to Food (school feeding) output Number of take-home rations provided as a result of
USDA assistance N Number
14 MGD 1.2.1.1
Increased Access to Food (school feeding) output Number of individuals receiving take-home rations as a
result of USDA assistance N Number
15 MGD 1.2.1.1
Increased Access to Food (school feeding) output Number of daily school meals (breakfast, snack, lunch)
provided as a result of USDA assistance N Number
48

Indicator Number Result # Title in MGD Results
Framework Indicator
Type Indicator Feed the Future?
Unit of Measure
16 MGD 1.2.1.1
Increased Access to Food (school feeding) output
Number of school-aged children receiving daily school meals (breakfast, snack, lunch) as a result of USDA assistance
N Number
17
MGD 1.2.1.1/ 1.3.1.1/
2.5
Increased Access to Food (school feeding)/Increased Access to Preventative Health Interventions
output Number of social assistance beneficiaries participating in productive safety nets as a result of USDA assistance Y Number
18 MGD 2.3 Increased Knowledge of Nutrition output Number of people trained in child health and nutrition
as a result of USDA assistance Y Number
19 MGD 2.4 Increased Access to Clean Water and Sanitation Services
output Number of schools using an improved water source N Number
20 MGD 2.4 Increased Access to Clean Water and Sanitation Services
output Number of schools with improved sanitation facilities N Number
21 MGD 2.5 Increased Access to Preventative Health Services
output Number of students receiving deworming medication(s) N Number
22 MGD 2.7.2 Improved Policy or Regulatory Framework
output (stages 1 &
2)
outcome (stages 3, 4
& 5)
Number of child health and nutrition policies, regulations and/or administrative procedures in each of the following stages of development as a result of USDA assistance: Stage 1: Analyzed Stage 2: Drafted and presented for public/stakeholder consultation Stage 3: Presented for legislation/decree Stage 4: Passed/Approved Stage 5: Passed for which implementation has begun
N Number
23 MGD SO2 Increased Use of Health and Dietary Practices
outcome Percent of school-age children receiving a minimum acceptable diet N Percent
49

Indicator Number Result # Title in MGD Results
Framework Indicator
Type Indicator Feed the Future?
Unit of Measure
24 MGD SO1 Improved Literacy of School Aged Children outcome
Percent of students who, by the end of two grades of primary schooling, demonstrate that they can read and understand the meaning of grade level text
N Percent
25 MGD SO1 Improved Literacy of School Aged Children output Number of individuals benefiting directly from USDA-
funded interventions N Number
26 MGD SO1 Improved Literacy of School Aged Children output Number of individuals benefiting indirectly from USDA-
funded interventions N Number
50

MCGOVERN-DOLE STANDARD INDICATOR DEFINITIONS
MGD RESULTS FRAMEWORK 1: Improved Literacy of School-Age Children
MGD 1.3: Improved Student Attendance
MGD INDICATOR 1: Number of students regularly (80%) attending USDA supported classrooms/schools DEFINITION: This indicator measures the number of males and females attending school regularly. The indicator goes beyond a one-time measure of attendance collected at a single point in time during the school year and attempts to measure consistent school attendance during a given school year. “Students” are learners of school-age in formal or non-formal schools or non-school based settings for the purpose of acquiring academic basic education, knowledge or skills. “Regular” school attendance is measured by at least 80% attendance during normal school operating hours during the school year. Regular, nationally recognized school holidays and breaks (i.e. winter/summer) are excluded. Similarly, if the school remains closed for a particular reason (i.e. teacher did not show up or a holiday is declared locally) then the total number of school days should be adjusted. As such, the official total number of school days may not be equal to the actual total number of school days (denominator). “USDA supported classrooms/school” is defined as those classrooms or schools that receive direct services from a USDA supported program. Services include, for example, school meals and/or take home rations; subsidies for school books, uniforms, and transportation fees; school enrollment fees; and activities focused on increasing parents’ and communities’ knowledge of the importance of schooling. RATIONALE: The indicator is useful for measuring the impact of USDA projects in boosting the number students that regularly attend school. The McGovern Dole program legislation targets low-income areas where children's enrollment and attendance in school is low or female enrollment and participation in preschool or school is low. Children who regularly attend school are expected to have improved levels of performance in school. Most measures of school attendance measure attendance in the previous school week taken at a single point in time during the school year. However, chronic absenteeism or irregular school attendance during the school year may significantly affect school attendance.
INDICATOR CHARACTERISTICS UNIT OF MEASURE: Number: Students
INDICATOR LEVEL: Output
DIRECTION OF CHANGE: Higher is better
FREQUENCY OF REPORTING: Annually covering the periods: October 1-September 30, and End of Project
DISAGGREGATION: Gender: Male, Female (required) DATA SOURCE: WHO COLLECTS DATA FOR THIS INDICATOR: Data will be collected by program participants. HOW SHOULD IT BE COLLECTED: Individual student data from school/teacher attendance records will be collected and analyzed MEASUREMENT NOTES: None DATA ENTRY IN FAIS: The indicator title must be entered into the relevant performance reporting section of FAIS VERBATIM to allow for the information to be collected correctly.
51
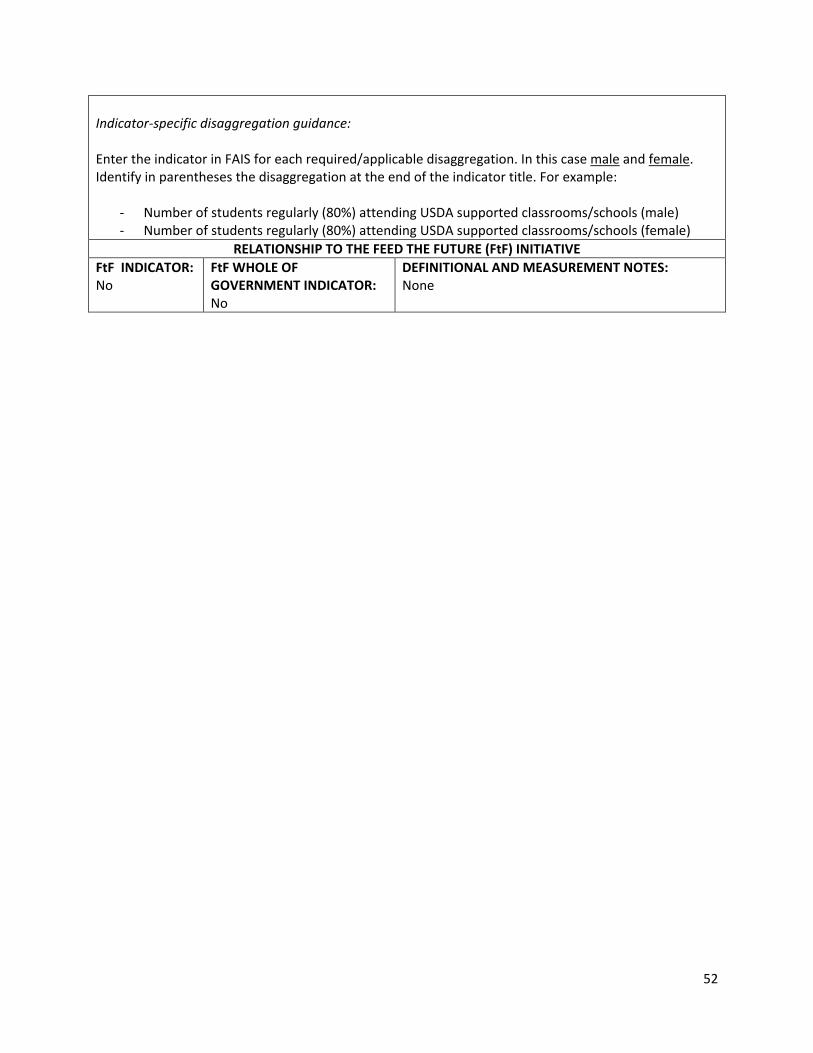
Indicator-specific disaggregation guidance: Enter the indicator in FAIS for each required/applicable disaggregation. In this case male and female. Identify in parentheses the disaggregation at the end of the indicator title. For example:
- Number of students regularly (80%) attending USDA supported classrooms/schools (male) - Number of students regularly (80%) attending USDA supported classrooms/schools (female)
RELATIONSHIP TO THE FEED THE FUTURE (FtF) INITIATIVE FtF INDICATOR: No
FtF WHOLE OF GOVERNMENT INDICATOR: No
DEFINITIONAL AND MEASUREMENT NOTES: None
52

MGD RESULTS FRAMEWORK 1: Improved Literacy of School-Age Children
MGD 1.1.2: Better Access to School Supplies and Materials
MGD INDICATOR 2: Number of textbooks and other teaching and learning materials provided as a result of USDA assistance DEFINITION: This indicator measures the number of teaching and learning materials provided as a result of USDA assistance. This may represent a range of final ‘products’, including materials that are designed and then printed and published, or documents that are purchased and distributed. For the purposes of this indicator, however, the same material should only be counted once: in its final stage of USG support. Teaching and learning materials may include textbooks, student workbooks, supplementary reading books, educational tapes and CDs, and reference material in hard or electronic copies for use in preschool, primary, secondary, adult education, and/or teacher training classes. Library books or materials, and support materials for educational radio, cassette, CD or TV broadcasts should be counted. Small materials and supplies (e.g. pencils, small materials produced as hand-outs in training etc.), even if paid for by USDA funds should not to be counted. RATIONALE: Learning materials, including an adequate amount of materials per student, is critical to supporting educational quality. This measure provides an overall sense of the scope of products resulting from investments in this area.
INDICATOR CHARACTERISTICS UNIT OF MEASURE: Number: Textbooks and Other Teaching/Learning Materials
INDICATOR LEVEL: Output
DIRECTION OF CHANGE: Higher is better
FREQUENCY OF REPORTING: Biannually covering the periods: October 1 – March 31 and April 1 – September 30
DISAGGREGATION: None DATA SOURCE: WHO COLLECTS DATA FOR THIS INDICATOR: Data will be collected by program participants. HOW SHOULD IT BE COLLECTED: Data will be collected from program participant records and reports, school administrator/teacher records. MEASUREMENT NOTES: None DATA ENTRY IN FAIS: The indicator title must be entered into the relevant performance reporting section of FAIS VERBATIM to allow for the information to be collected correctly. Indicator-specific disaggregation guidance: None
RELATIONSHIP TO THE FEED THE FUTURE (FtF) INITIATIVE FtF INDICATOR: No
FtF WHOLE OF GOVERNMENT INDICATOR: No
DEFINITIONAL AND MEASUREMENT NOTES: USG Standard Foreign Assistance Indicator 3.2.1-33
53

MGD RESULTS FRAMEWORK 1: Improved Literacy of School-Age Children
MGD 1.1.5: Increased Skills and Knowledge of School Administrators
MGD INDICATOR 3: Number of school administrators and officials in target schools who demonstrate use of new techniques or tools as a result of USDA assistance
DEFINITION: This indicator measures the total number of school administrators who are applying the new knowledge and skills received in USDA supported training and certification programs. Areas of training may include finance, management (e.g. logistics, monitoring, personnel use and support), governance (e.g., legislation, communication, enforcement), infrastructure (e.g. building, supplies) or quality assurance for improving literacy skills. School administrators should demonstrate the use of at least one new technique or technology in their standard practices or procedures related to finance, management, infrastructure or quality assurance of instruction. RATIONALE: Increasing the skills and knowledge of school administrators builds human capital and supports institutional capacity building in countries. Increasing skills and knowledge of school administrators will support the improved quality of literacy instruction by fostering an environment that promotes quality teaching and that is conducive to student learning.
INDICATOR CHARACTERISTICS UNIT OF MEASURE: Number: Administrators / Officials
INDICATOR LEVEL: Outcome
DIRECTION OF CHANGE: Higher is better
FREQUENCY OF REPORTING: Annually covering the periods: October 1-September 30, and End of Project
DISAGGREGATION: None DATA SOURCE: WHO COLLECTS DATA FOR THIS INDICATOR: Data will be collected by program participants. HOW SHOULD IT BE COLLECTED: Data will be collected from program observations, interviews, site visits, and reports. MEASUREMENT NOTES: This indicator counts the application of improved techniques and tools developed through USDA sponsored training, whereas the count of individuals trained is reported under MGD Indicator 4. DATA ENTRY IN FAIS: The indicator title must be entered into the relevant performance reporting section of FAIS VERBATIM to allow for the information to be collected correctly. Indicator-specific disaggregation guidance: None
RELATIONSHIP TO THE FEED THE FUTURE (FtF) INITIATIVE FtF INDICATOR: No
FtF WHOLE OF GOVERNMENT INDICATOR: No
DEFINITIONAL AND MEASUREMENT NOTES: None
54
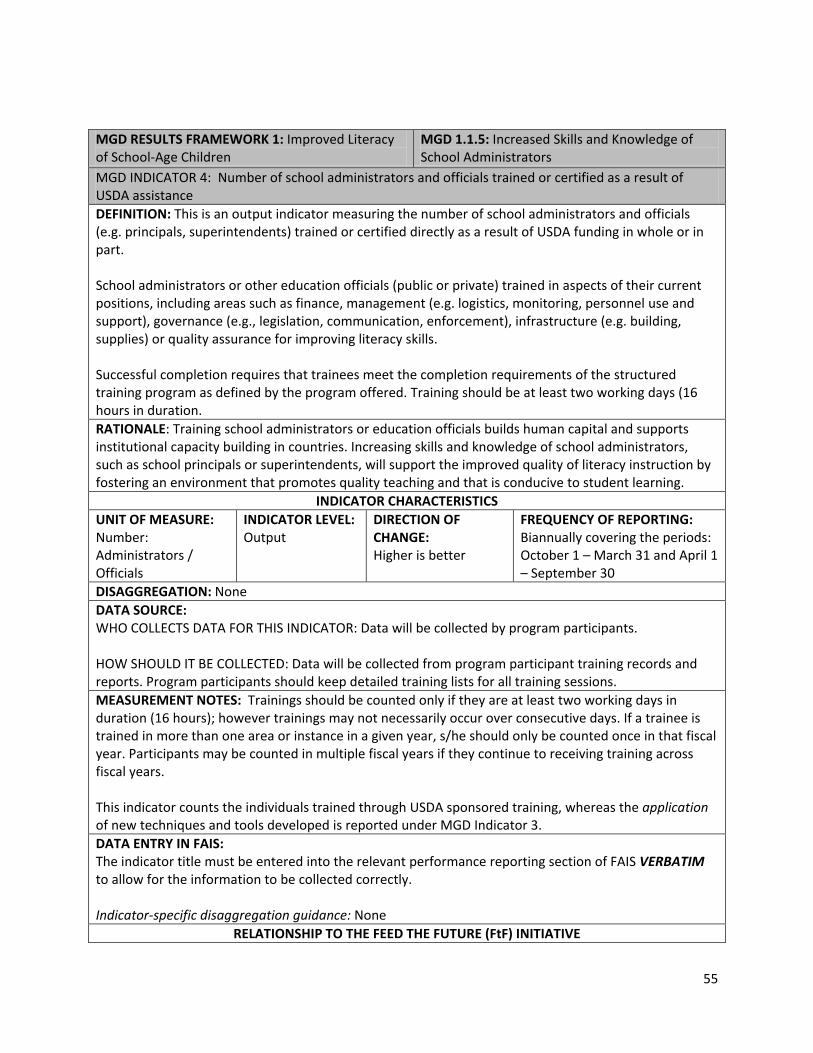
MGD RESULTS FRAMEWORK 1: Improved Literacy of School-Age Children
MGD 1.1.5: Increased Skills and Knowledge of School Administrators
MGD INDICATOR 4: Number of school administrators and officials trained or certified as a result of USDA assistance DEFINITION: This is an output indicator measuring the number of school administrators and officials (e.g. principals, superintendents) trained or certified directly as a result of USDA funding in whole or in part. School administrators or other education officials (public or private) trained in aspects of their current positions, including areas such as finance, management (e.g. logistics, monitoring, personnel use and support), governance (e.g., legislation, communication, enforcement), infrastructure (e.g. building, supplies) or quality assurance for improving literacy skills. Successful completion requires that trainees meet the completion requirements of the structured training program as defined by the program offered. Training should be at least two working days (16 hours in duration. RATIONALE: Training school administrators or education officials builds human capital and supports institutional capacity building in countries. Increasing skills and knowledge of school administrators, such as school principals or superintendents, will support the improved quality of literacy instruction by fostering an environment that promotes quality teaching and that is conducive to student learning.
INDICATOR CHARACTERISTICS UNIT OF MEASURE: Number: Administrators / Officials
INDICATOR LEVEL: Output
DIRECTION OF CHANGE: Higher is better
FREQUENCY OF REPORTING: Biannually covering the periods: October 1 – March 31 and April 1 – September 30
DISAGGREGATION: None DATA SOURCE: WHO COLLECTS DATA FOR THIS INDICATOR: Data will be collected by program participants. HOW SHOULD IT BE COLLECTED: Data will be collected from program participant training records and reports. Program participants should keep detailed training lists for all training sessions. MEASUREMENT NOTES: Trainings should be counted only if they are at least two working days in duration (16 hours); however trainings may not necessarily occur over consecutive days. If a trainee is trained in more than one area or instance in a given year, s/he should only be counted once in that fiscal year. Participants may be counted in multiple fiscal years if they continue to receiving training across fiscal years. This indicator counts the individuals trained through USDA sponsored training, whereas the application of new techniques and tools developed is reported under MGD Indicator 3. DATA ENTRY IN FAIS: The indicator title must be entered into the relevant performance reporting section of FAIS VERBATIM to allow for the information to be collected correctly. Indicator-specific disaggregation guidance: None
RELATIONSHIP TO THE FEED THE FUTURE (FtF) INITIATIVE
55

FtF INDICATOR: No
FtF WHOLE OF GOVERNMENT INDICATOR: No
DEFINITIONAL AND MEASUREMENT NOTES: USG Standard Foreign Assistance Indicator 3.2.1-3
56

MGD RESULTS FRAMEWORK 1: Improved Literacy of School-Age Children
MGD 1.1: Improved Quality of Literacy Instruction MGD 1.1.4: Increased Skills and Knowledge of Teachers
MGD INDICATOR 5: Number of teachers/educators/teaching assistants in target schools who demonstrate use of new and quality teaching techniques or tools as a result of USDA assistance
DEFINITION: This indicator measures the number of teachers/educators/teaching assistants who are using improved techniques and tools in their classrooms as a result of USDA assistance. Teachers, educators, teaching assistants who have successfully completed a pre- or in-services training program to teach in schools or equivalent non-school based settings with USDA support (i.e. scholarships or training program funded in whole or in part with USDA funds) should be evaluated as to whether the learned technologies and techniques are being applied in their classroom instruction. Successful application requires that teachers, educators, teaching assistance have incorporated the learned methods into their curriculum and are actively applying these methods in their daily classroom instruction. RATIONALE: Increasing the skills and knowledge of teachers builds human capital and supports institutional capacity building in countries. Increasing skills and knowledge of teachers will support the improved quality of literacy instruction by fostering an environment that promotes quality teaching and that is conducive to student learning.
INDICATOR CHARACTERISTICS UNIT OF MEASURE: Number: Teachers / Educators / Teaching Assistants
INDICATOR LEVEL: Outcome
DIRECTION OF CHANGE: Higher is better
FREQUENCY OF REPORTING: Annually covering the periods: October 1-September 30, and End of Project
DISAGGREGATION: None DATA SOURCE: WHO COLLECTS DATA FOR THIS INDICATOR: Data will be collected by program participants. HOW SHOULD IT BE COLLECTED: Data will be collected from program observations, interviews, site visits, and reports. MEASUREMENT NOTES: This indicator counts the application of improved techniques and tools developed through USDA sponsored training, whereas the count of individuals trained is reported under MGD Indicator 6. DATA ENTRY IN FAIS: The indicator title must be entered into the relevant performance reporting section of FAIS VERBATIM to allow for the information to be collected correctly. Indicator-specific disaggregation guidance: None
RELATIONSHIP TO THE FEED THE FUTURE (FtF) INITIATIVE FtF INDICATOR: No
FtF WHOLE OF GOVERNMENT INDICATOR: No
DEFINITIONAL AND MEASUREMENT NOTES: None
57

MGD RESULTS FRAMEWORK 1: Improved Literacy of School-Age Children
MGD 1.1.4: Increased Skills and Knowledge of Teachers
MGD INDICATOR 6: Number of teachers/educators/teaching assistants trained or certified as a result of USDA assistance DEFINITION: This is an output indicator measuring the number of teachers/educators/training assistants, trained or certified directly as a result of USDA funding in whole or in part. Teachers, educators, teaching assistants who have successfully completed a pre- or in-services training program to teach in schools or equivalent non-school based settings with USDA support (i.e. scholarships or training program funded in whole or in part with USDA funds). Successful completion requires that trainees meet the completion requirements of the structured training program as defined by the program offered. Training should be at least two working days (16 hours in duration. RATIONALE: Training teachers and/or educators builds human capital and supports institutional capacity building in countries. This indicator provides an overall sense of scope by giving a count of the total number of teachers/educators trained through pre-service training. Training teachers to effectively teach literacy to children of different skill levels is essential to improving the overall quality of instruction.
INDICATOR CHARACTERISTICS UNIT OF MEASURE: Number: Teachers / Educators / Teaching Assistants
INDICATOR LEVEL: Output
DIRECTION OF CHANGE: Higher is better
FREQUENCY OF REPORTING: Biannually covering the periods: October 1 – March 31 and April 1 – September 30
DISAGGREGATION: None DATA SOURCE: WHO COLLECTS DATA FOR THIS INDICATOR: Data will be collected by program participants. HOW SHOULD IT BE COLLECTED: Data will be collected from program participant training records and reports. Program participants should keep detailed training lists for all training sessions. MEASUREMENT NOTES: Trainings should be counted only if they are at least two working days in duration (16 hours). If a trainee is trained in more than one area or instance in a given year, s/he should only be counted once in that fiscal year. Participants may be counted in multiple fiscal years if they continue to receiving training across fiscal years. This indicator counts the individuals trained through USDA sponsored training, whereas the application of new techniques and tools developed is reported under MGD Indicator 5. DATA ENTRY IN FAIS: The indicator title must be entered into the relevant performance reporting section of FAIS VERBATIM to allow for the information to be collected correctly. Indicator-specific disaggregation guidance: None
RELATIONSHIP TO THE FEED THE FUTURE (FtF) INITIATIVE FtF INDICATOR: No
FtF WHOLE OF GOVERNMENT INDICATOR: No
DEFINITIONAL AND MEASUREMENT NOTES: USG Standard Foreign Assistance Indicator 3.2.1-32
58

MGD RESULTS FRAMEWORK 1: Improved Literacy of School-Age Children
MGD 1.3.3: Improved School Infrastructure
MGD INDICATOR 7: Number of educational facilities (i.e. school buildings, classrooms, and latrines) rehabilitated/constructed as a result of USDA assistance DEFINITION: This indicator measures the number of classroom/schools/latrines rehabilitated or constructed funded in whole or in part by a USDA project. Rehabilitation ranges from cosmetic upgrades such as whitewashing walls, to structural improvements (replacing broken windows, fixing leaking roofs, rebuilding damaged walls or roofs, repairing latrines, and upgrading fixing school kitchens), and mending broken furniture. Latrines/toilets that are repaired must meet set local government standards and should also be counted. Toilets counted are only those that have hand washing facilities within or near the toilets. Classrooms are expected to be safe and secure spaces in which organized group learning takes place. Classrooms range from environmentally-appropriate, roofed structures without walls, to traditional four-walled structures with a roof and windows. Latrines/toilets constructed must allow for gender-specific latrines/toilets and must meet host country standards regarding the ratio of students per squat hole. If a classroom block is rehabilitated/constructed, the number of classrooms in that block affected by the repair/construction should be counted. This indicator does not include temporary classrooms (such as tents, open spaces set aside for instruction) frequently found in refugee settings. RATIONALE: Classrooms of acceptable quality are an essential component of education, making instruction possible, more enjoyable and more acceptable for children. Classroom construction can also encourage parents to send their children to school especially in areas where schools were previously too far away. Schools in flagrant disrepair are a deterrent to attendance, especially for females, a distraction from instruction, and frequently unsafe and inadequate for teaching and learning inclement weather. Adequate school buildings positively impact school attendance.
INDICATOR CHARACTERISTICS UNIT OF MEASURE: Number: Facilities
INDICATOR LEVEL: Output
DIRECTION OF CHANGE: Higher is better
FREQUENCY OF REPORTING: Biannually covering the periods: October 1 – March 31 and April 1 – September 30
DISAGGREGATION: Type of Facility (if applicable):
• Classrooms • Kitchens, cook areas • Latrines • Other school grounds or school buildings
DATA SOURCE: WHO COLLECTS DATA FOR THIS INDICATOR: Data will be collected by program participants. HOW SHOULD IT BE COLLECTED: Data will be collected from program participant records and reports. MEASUREMENT NOTES: Schools should only be counted if they receive direct assistance whether in whole or in part from a USDA project. DATA ENTRY IN FAIS:
59
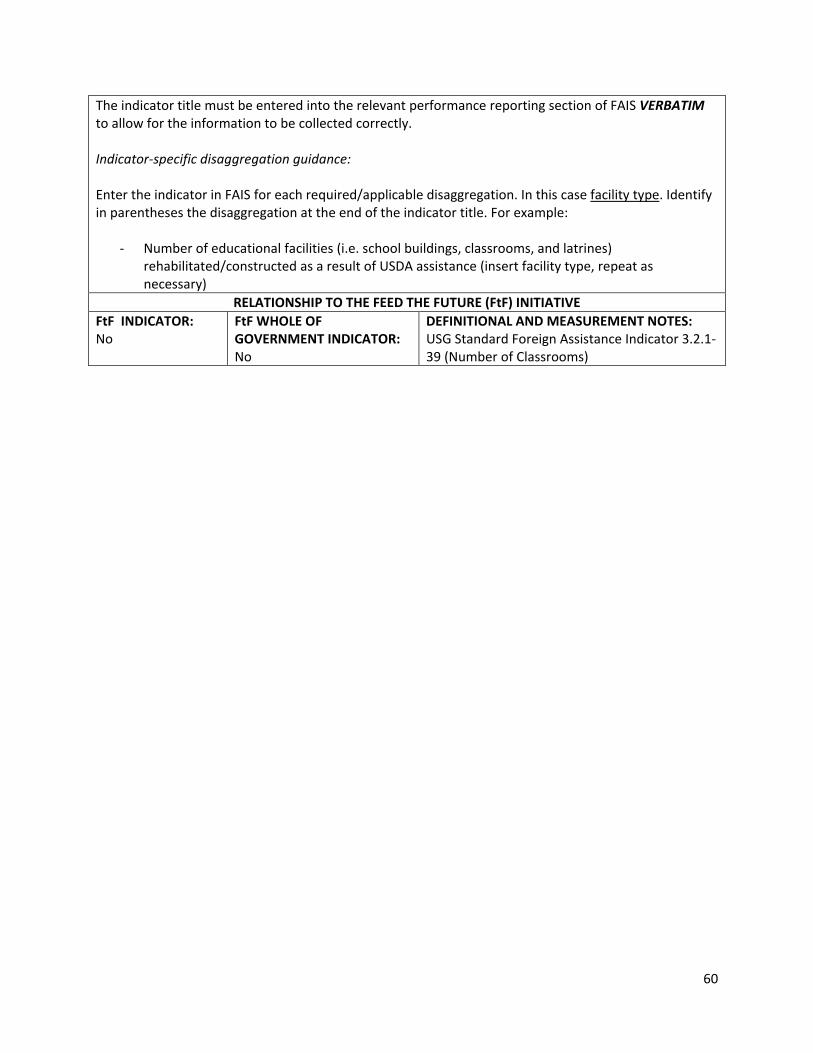
The indicator title must be entered into the relevant performance reporting section of FAIS VERBATIM to allow for the information to be collected correctly. Indicator-specific disaggregation guidance: Enter the indicator in FAIS for each required/applicable disaggregation. In this case facility type. Identify in parentheses the disaggregation at the end of the indicator title. For example:
- Number of educational facilities (i.e. school buildings, classrooms, and latrines) rehabilitated/constructed as a result of USDA assistance (insert facility type, repeat as necessary)
RELATIONSHIP TO THE FEED THE FUTURE (FtF) INITIATIVE FtF INDICATOR: No
FtF WHOLE OF GOVERNMENT INDICATOR: No
DEFINITIONAL AND MEASUREMENT NOTES: USG Standard Foreign Assistance Indicator 3.2.1-39 (Number of Classrooms)
60

MGD RESULTS FRAMEWORK 1: Improved Literacy of School-Age Children
MGD 1.3.4: Increased Student Enrollment
MGD INDICATOR 8: Number of students enrolled in schools receiving USDA assistance DEFINITION: This is an output indicator measuring the number of school-age students or learners formally enrolled in school or equivalent non-school based settings for the purpose of acquiring academic basic education skills or knowledge. This number may include learners enrolled in educational radio and/or TV programming. Only students enrolled at schools that are directly benefitting from USDA assistance should be counted under this Indicator. For this indicator, USDA assistance to schools includes the provision of commodities for school feeding and/or the rehabilitation of school infrastructure. RATIONALE: Student enrollment is typically a precursor to attendance, as children usually must be formally enrolled in order to attend class. Children must regularly attend school in order to improve their reading skills and understanding of grade-level text.
INDICATOR CHARACTERISTICS UNIT OF MEASURE: Number: Students
INDICATOR LEVEL: Output
DIRECTION OF CHANGE: Higher is better
FREQUENCY OF REPORTING: Biannually covering the periods: October 1 – March 31 and April 1 – September 30
DISAGGREGATION: Gender: Male, Female (required) DATA SOURCE: WHO COLLECTS DATA FOR THIS INDICATOR: Data will be collected by program participants. HOW SHOULD IT BE COLLECTED: Data will be collected from program participant records and reports, school/teacher enrollment records. MEASUREMENT NOTES: None DATA ENTRY IN FAIS: The indicator title must be entered into the relevant performance reporting section of FAIS VERBATIM to allow for the information to be collected correctly. Indicator-specific disaggregation guidance: Enter the indicator in FAIS for each required/applicable disaggregation. In this case male and female. Identify in parentheses the disaggregation at the end of the indicator title. For example:
- Number of students enrolled in schools receiving USDA assistance (male) - Number of students enrolled in schools receiving USDA assistance (female)
RELATIONSHIP TO THE FEED THE FUTURE (FtF) INITIATIVE FtF INDICATOR: No
FtF WHOLE OF GOVERNMENT INDICATOR: No
DEFINITIONAL AND MEASURMENT NOTES: USG Standard Foreign Assistance Indicators 3.2.1-14 and 3.2.1-15
61

MGD RESULTS FRAMEWORK 1: Improved Literacy of School Aged Children
MGD 1.4.4: Increased Engagement of Local Organizations and Community Groups
MGD INDICATOR 9: Number of Parent-Teacher Associations (PTAs) or similar “school” governance structures supported as a result of USDA assistance DEFINITION: A count of PTA, School Management Committee (SMC), or other similar governance bodies for an individual school (or equivalent non-school setting) who meet at least four times during the school year, participate in education activities by meeting with school officials quarterly, contribute to school governance by reviewing all policies and procedures, or in any other way to be more supportive of the school or non-school equivalent education setting. USDA support includes, but is not limited to, direct financial support (grants) and/or training in skills related to serving on a PTA, SMC, or equivalent governance body. RATIONALE: Support for PTA or other school governance structures are an important way to promote capacity building at the grassroots, local level. Such structures promote opportunities for democracy in action as well as improved local ownership, accountability, and educational quality.
INDICATOR CHARACTERISTICS UNIT OF MEASURE: Number: PTAs or similar
INDICATOR LEVEL: Output
DIRECTION OF CHANGE: Higher is better
FREQUENCY OF REPORTING: Biannually covering the periods: October 1 – March 31 and April 1 – September 30
DISAGGREGATION: None DATA SOURCE: WHO COLLECTS DATA FOR THIS INDICATOR: Data will be collected by program participants. HOW SHOULD IT BE COLLECTED: Data from project, school, community and/or administrative records. MEASUREMENT NOTES: None DATA ENTRY IN FAIS: The indicator title must be entered into the relevant performance reporting section of FAIS VERBATIM to allow for the information to be collected correctly. Indicator-specific disaggregation guidance: None
RELATIONSHIP TO THE FEED THE FUTURE (FtF) INITIATIVE FtF INDICATOR: No
FtF WHOLE OF GOVERNMENT INDICATOR: No
DEFINITIONAL AND MEASUREMENT NOTES: USG Standard Foreign Assistance Indicator 3.2.1-18
62

MGD RESULTS FRAMEWORK 1: Improved Literacy of School Aged Children
MGD 1.4.4: Increased Engagement of Local Organizations and Community Groups
MGD INDICATOR 10: Number of public-private partnerships formed as a result of USDA assistance DEFINITION: Number of public-private partnerships in education or nutrition formed during the reporting year due to USDA assistance (i.e. education or nutrition activity, as described below). Private partnerships can be long or short in duration (length is not a criteria for measurement). Partnerships with multiple partners should only be counted once. A public-private alliance (partnership) is considered formed when there is a clear agreement, usually written, to work together to achieve a common objective. There must be either a cash or in-kind significant contribution to the effort by both the public and the private entity. A private entity can be a for-profit entity, an NGO using private funds, a private company, a community group, or a state-owned enterprise which seeks to make a profit (even if unsuccessfully). A public entity can be a donor-funded program participant, a national or sub-national government, or state-owned enterprises which are non-profit. A project may form more than one partnership with the same entity, but this is likely to be rare. In counting partnerships we are not counting transactions with a partner entity; we are counting the number of partnerships formed during the reporting year. Public-private partnerships counted should be only those formed during the current reporting year. Any partnership that was formed in a previous year should not be included. A nutritional activity includes any activity focused on improving the nutritional content of agricultural products as provided to consumers, develop improved nutritional products, increase support for nutrition service delivery, etc. An educational activity includes any activity focused on improving educational support to improve quality of literacy or any other lower level result in the MGD results framework such as improving access to school supplies and materials, improved school infrastructure, increased access to food, and improved literacy instructional materials. RATIONALE: The assumption of this indicator is that if more partnerships are formed it is likely that there will be more investment in education or nutrition-related activities. This will help achieve improved literacy and increased use of health and dietary practices which then contribute to the key objective of improving the literacy of school age children and sustaining the benefits made during project implementation to literacy, attendance, and enrollment by graduating the project to the host country.
INDICATOR CHARACTERISTICS UNIT OF MEASURE: Number: Partnerships
INDICATOR LEVEL: Output
DIRECTION OF CHANGE: Higher is better
FREQUENCY OF REPORTING: Biannually covering the periods: October 1 – March 31 and April 1 – September 30
DISAGGREGATION: Type of Partnership (if applicable):
• Education • Nutrition • Health • Multi-focus (use this if there are several components of the above sectors in the
partnership) • Other
63
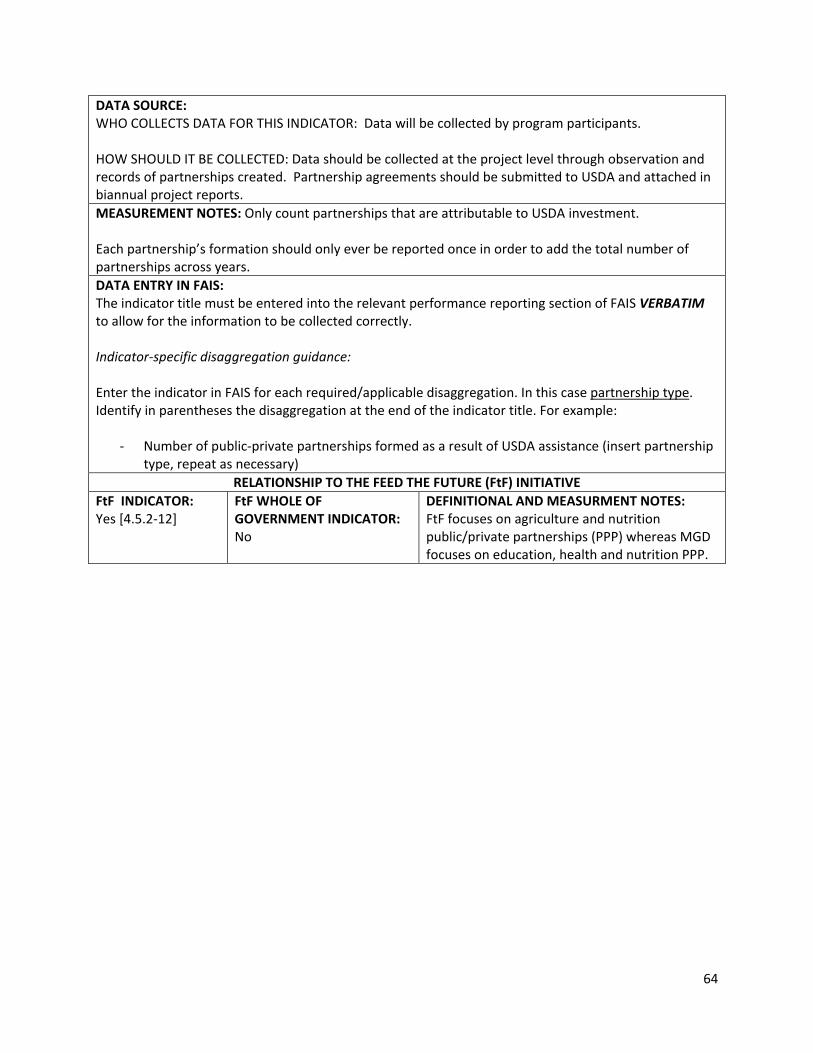
DATA SOURCE: WHO COLLECTS DATA FOR THIS INDICATOR: Data will be collected by program participants. HOW SHOULD IT BE COLLECTED: Data should be collected at the project level through observation and records of partnerships created. Partnership agreements should be submitted to USDA and attached in biannual project reports. MEASUREMENT NOTES: Only count partnerships that are attributable to USDA investment. Each partnership’s formation should only ever be reported once in order to add the total number of partnerships across years. DATA ENTRY IN FAIS: The indicator title must be entered into the relevant performance reporting section of FAIS VERBATIM to allow for the information to be collected correctly. Indicator-specific disaggregation guidance: Enter the indicator in FAIS for each required/applicable disaggregation. In this case partnership type. Identify in parentheses the disaggregation at the end of the indicator title. For example:
- Number of public-private partnerships formed as a result of USDA assistance (insert partnership type, repeat as necessary)
RELATIONSHIP TO THE FEED THE FUTURE (FtF) INITIATIVE FtF INDICATOR: Yes [4.5.2-12]
FtF WHOLE OF GOVERNMENT INDICATOR: No
DEFINITIONAL AND MEASURMENT NOTES: FtF focuses on agriculture and nutrition public/private partnerships (PPP) whereas MGD focuses on education, health and nutrition PPP.
64

MGD RESULTS FRAMEWORK 1: Improved Literacy of School Aged Children
MGD 1.4.3: Increased Government Support MGD 1.4.4: Increased Engagement of Local Organizations and Community Groups
MGD INDICATOR 11: Value of public and private sector investments leveraged as a result of USDA assistance DEFINITION: The term “investments” is defined as public or private sector resources intended to complement existing/ongoing USDA-funded activities (i.e. education or nutrition activity, as described below), including resources provided for purposes of cost-share or matching. While the majority of such resources will be monetary in nature, non-monetary resources (e.g. in-kind contributions, labor, etc.) should be expressed in their respective dollar values. Data should be collected for three categories: “host government,” “other public sector,” and “private sector”. “Host Government” includes any investments from the national, regional or local governments. “Other public sector” includes any investments provided by the Program Participant itself, other Private Voluntary Organizations, or other donor countries or agencies including other USG agencies (i.e. MCC, USAID, OPIC). “Private sector” includes any investments from a private actor, including for-profit organizations, private philanthropic organizations, or individuals. “Leveraged as a result of USDA assistance” indicates that the investment was directly encouraged or facilitated by the activities funded or resources provided by USDA. “Investments” means the level of resources provided during each reporting year. A nutritional activity includes any activity focused on improving the nutritional content of agricultural products provided to consumers, develop improved nutritional products, increase support for nutrition service delivery, etc. An educational activity includes any activity focused on improving educational support to improve the quality of literacy or any other lower level result in the MGD results framework such as improving access to school supplies and materials, improved school infrastructure, increased access to food, and improved literacy instructional materials. RATIONALE: The assumption of this indicator is that the higher the value of investment, particularly by the host government, the greater the chances for long-term sustainability of education and nutrition-related activities beyond USDA’s initial commitment. These non-USDA investments are key to achieving long-term impact in project areas by increasing host country capacity and ownership of programs. Coordinated and complementary investments from the host government and other public and private sector donors will help achieve improved literacy and increased use of health and dietary practices, which then contribute to the key objective of improving the literacy of school age children and sustaining the benefits made during project implementation to literacy, attendance, and enrollment by graduating the project to the host country.
INDICATOR CHARACTERISTICS UNIT OF MEASURE: U.S. Dollar
INDICATOR LEVEL: Outcome
DIRECTION OF CHANGE: Higher is better
FREQUENCY OF REPORTING: Biannually covering the periods: October 1-March 31
65
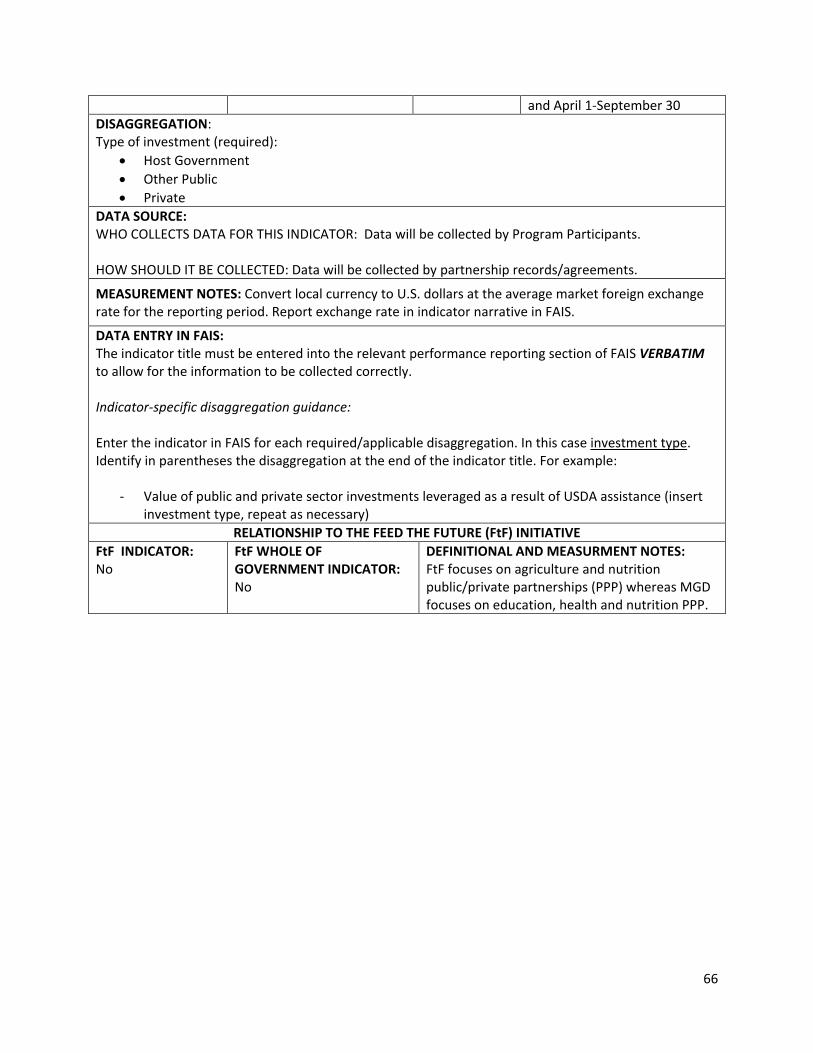
and April 1-September 30 DISAGGREGATION: Type of investment (required):
• Host Government • Other Public • Private
DATA SOURCE: WHO COLLECTS DATA FOR THIS INDICATOR: Data will be collected by Program Participants. HOW SHOULD IT BE COLLECTED: Data will be collected by partnership records/agreements.
MEASUREMENT NOTES: Convert local currency to U.S. dollars at the average market foreign exchange rate for the reporting period. Report exchange rate in indicator narrative in FAIS.
DATA ENTRY IN FAIS: The indicator title must be entered into the relevant performance reporting section of FAIS VERBATIM to allow for the information to be collected correctly. Indicator-specific disaggregation guidance: Enter the indicator in FAIS for each required/applicable disaggregation. In this case investment type. Identify in parentheses the disaggregation at the end of the indicator title. For example:
- Value of public and private sector investments leveraged as a result of USDA assistance (insert investment type, repeat as necessary)
RELATIONSHIP TO THE FEED THE FUTURE (FtF) INITIATIVE FtF INDICATOR: No
FtF WHOLE OF GOVERNMENT INDICATOR: No
DEFINITIONAL AND MEASURMENT NOTES: FtF focuses on agriculture and nutrition public/private partnerships (PPP) whereas MGD focuses on education, health and nutrition PPP.
66

MGD RESULTS FRAMEWORK 1: Improved Literacy of School-Aged Children
MGD 1.4.2 Improved Policy or Regulatory Framework
MGD INDICATOR 12: Number of educational policies, regulations, or administrative procedures in each of the following stages of development as a result of USDA assistance DEFINITION: Number of education enabling environment policies/ regulations/ administrative procedures in the areas of education, including school finance, assessment, teacher recruitment and selection, etc., that: Stage 1: Underwent the first stage of the policy reform process i.e. analysis (review of existing policy/regulation/administrative procedure and/or proposal of new policy/regulations/administrative procedures Stage 2: Underwent the second stage of the policy reform process. The second stage includes public debate and/or consultation with stakeholders on the proposed new or revised policy/regulation/administrative procedure Stage 3: Underwent the third stage of the policy reform process (policies were presented for legislation/decree to improve the policy environment for education) Stage 4: Underwent the fourth stage of the policy reform process [official approval (legislation/decree) of new or revised policy/regulation/administrative procedure by relevant authority] Stage 5: Completed the policy reform process (implementation of new or revised policy/regulation/administrative procedure by relevant authority) To be counted, actions must have, as their ultimate purpose, improving equitable access to or the quality of education services. Count the highest stage completed during the reporting year. RATIONALE: The indicator measures the number of policies/regulations/administrative procedures in the various stages of progress towards an enhanced enabling environment for education. It is includes the development, implementation and enforcement of policies and regulations that support the achievement of one or more results in the MGD framework focused on improving literacy of school-age children.
INDICATOR CHARACTERISTICS UNIT OF MEASURE: Number: Policies, regulations, and/or administrative procedures and supplementary narrative
INDICATOR LEVEL: Stages 1 & 2: Output Stages 3, 4 & 5: Outcome
DIRECTION OF CHANGE: Because this indicator tracks individual policies through the disaggregated stages, one should see actual for each stage change over time in certain ways. One should expect the value of disaggregates measuring the earlier stages to decline and the disaggregates measuring later stages of progress to increase as the enabling environment is strengthened (i.e. move from analysis to adoption and implementation of reforms)
FREQUENCY OF REPORTING: Annually covering the periods: October 1-September 30, and End of Project
DISAGGREGATION (required):
67

Disaggregates will be shown by stages (1-5) as noted above. DATA SOURCE: WHO COLLECTS DATA FOR THIS INDICATOR: Data will be collected by program participants. HOW SHOULD IT BE COLLECTED: Data collected at the project-level, through project records of activities and capacity building carried out by the project, observation and analysis of the host government legal status of the various policies being addressed. Policies, legislation, regulations should be submitted to USDA and attached in project reports. MEASUREMENT NOTES: Only count policies specifically addressed and supported with USDA assistance. Enter the name of the policy/regulation/administrative procedure and its stage in order to track movement through the stages. Count the highest stage completed during the reporting year. This indicator tracks the policy, regulation, or administrative procedure. Multiple project participants working in the same country or region (with regard to regional policies) may report the same policy, regulation, or administrative procedure as long as the program participant participated in the process and provided assistance to the development, drafting, formation of the law or policy. Policies, regulations, administrative procedures focused on child health and nutrition should be counted under MGD Indicator 21. DATA ENTRY IN FAIS: The indicator title must be entered into the relevant performance reporting section of FAIS VERBATIM to allow for the information to be collected correctly. Indicator-specific disaggregation guidance: Enter the indicator in FAIS for each required/applicable disaggregation. In this case stages 1, 2, 3, 4, and 5. Identify in parentheses the disaggregation at the end of the indicator title. For example:
- Number of educational policies, regulations, or administrative procedures in each of the following stages of development as a result of USDA assistance (stage 1)
- Number of educational policies, regulations, or administrative procedures in each of the following stages of development as a result of USDA assistance (stage 2)
- And so on as necessary… RELATIONSHIP TO THE FEED THE FUTURE (FtF) INITIATIVE
FtF INDICATOR: No
FtF WHOLE OF GOVERNMENT INDICATOR: No
DEFINITIONAL AND MEASUREMENT NOTES: This indicator is similar to FtF Indicator 4.5.1-24 number of policies/regulations/administrative procedures in each of the following stages of development as a result of USG assistance in each case; however the FtF indicator is focused on the agricultural enabling environment and not education. It is also similar to the F Education Indicator, IIP 2.1 – Basic Education, Indicator Title: number of laws, policies, regulations or guidelines developed or modified to improve equitable access to or the quality of education services.
68

MGD RESULTS FRAMEWORK 1: Improved Literacy of School-Aged Children
MGD 1.2.1: Reduced Short-Term Hunger MGD 1.2.1.1: Increased Access to Food (school feeding)
MGD INDICATOR 13: Number of take-home rations provided as a result of USDA assistance DEFINITION: A take-home ration is counted each time it is provided to a student, family, teacher or other person in a USDA supported project. Take-home rations transfer food resources to families conditional upon school enrollment and regular attendance of children, especially females. Rations are given to families typically once a month or once a term. They increase school participation and probably learning. Their effect depends on whether the value of the ration offsets some of the costs of sending the child to school. Rations may also be given as an incentive to teachers, or cooks in return for their time or service. RATIONALE: School meals, coupled with take home rations, can serve as an effective mechanism for encouraging attendance, particularly among females and attentiveness in school. Take home rations also increase household access to food in the short term.
INDICATOR CHARACTERISTICS UNIT OF MEASURE: Number: Rations
INDICATOR LEVEL: Output
DIRECTION OF CHANGE: Higher is better
FREQUENCY OF REPORTING: Biannually covering the periods: October 1 – March 31 and April 1 – September 30
DISAGGREGATION: None DATA SOURCE: WHO COLLECTS DATA FOR THIS INDICATOR: Data will be collected by program participants. HOW SHOULD IT BE COLLECTED: Participating partners will count the total number of take home rations at the project level, through reports and program data. For this indicator, count the number of rations without distinguishing whether the same person or family received multiple rations. In that case, the person/family would be counted several times, which is acceptable for this indicator. MEASUREMENT NOTES: The number of take-home rations provided is counted under Indicator 12, while the number of individuals receiving take-home rations is counted under MGD Indicator 13. The number of daily school meals provided to school-age children is counted under MGD Indicator 14 and the number of individual school-age children receiving school meals is counted under MGD Indicator 15. DATA ENTRY IN FAIS: The indicator title must be entered into the relevant performance reporting section of FAIS VERBATIM to allow for the information to be collected correctly. Indicator-specific disaggregation guidance: None
RELATIONSHIP TO THE FEED THE FUTURE (FtF) INITIATIVE FtF INDICATOR: No
FtF WHOLE OF GOVERNMENT INDICATOR: No
DEFINITIONAL AND MEASUREMENT NOTES: None
69

MGD RESULTS FRAMEWORK 1: Improved Literacy of School-Aged Children
MGD 1.2.1: Reduced Short-Term Hunger MGD 1.2.1.1: Increased Access to Food (school feeding)
MGD INDICATOR 14: Number of individuals receiving take-home rations as a result of USDA assistance DEFINITION: Take-home rations transfer food resources to families conditional upon school enrollment and regular attendance of children, especially females. Rations are given to families typically once a month or once a term. They increase school participation and probably learning. Their effect depends on whether the value of the ration offsets some of the costs of sending the child to school. Rations may also be given as an incentive to teachers, or cooks in return for their time or service. RATIONALE: School meals, coupled with take home rations, can serve as an effective mechanism for encouraging attendance, particularly among females. Take home rations also increase household access to food in the short term.
INDICATOR CHARACTERISTICS UNIT OF MEASURE: Number: Individuals
INDICATOR LEVEL: Output
DIRECTION OF CHANGE: Higher is better
FREQUENCY OF REPORTING: Biannually covering the periods: October 1 – March 31 and April 1 – September 30
DISAGGREGATION: New/Continuing (required):
• New = this reporting year is the first year the individual received take-home rations • Continuing = the person first received take-home rations in the previous year and continues to
receive them Type of Beneficiary (if applicable):
• Male Students • Female Students • Pregnant and Lactating Women • Others
DATA SOURCE: WHO COLLECTS DATA FOR THIS INDICATOR: Data will be collected by program participants. HOW SHOULD IT BE COLLECTED: Participating partners will count the total number of individuals receiving take home rations at the project level, through reports and program data. MEASUREMENT NOTES: The number of take-home rations provided is counted under MGD Indicator 12. The number of daily meals provided to school age children is counted under MGD Indicator 14 and the number of school age children receiving school meals is counted under MGD Indicator 15. Individuals should not be double counted in a given fiscal year. The individual should be counted the first time that they receive a take-home ration in that fiscal year. Students that receive a take-home ration in multiple fiscal years may be counted once in each fiscal year. DATA ENTRY IN FAIS: The indicator title must be entered into the relevant performance reporting section of FAIS VERBATIM to allow for the information to be collected correctly. Indicator-specific disaggregation guidance: Enter the indicator in FAIS for each required/applicable disaggregation. In this case new, continuing, and
70

beneficiary type. Identify in parentheses the disaggregation at the end of the indicator title. For example:
- Number of individuals receiving take-home rations as a result of USDA assistance (new) - Number of individuals receiving take-home rations as a result of USDA assistance (continuing) - Number of individuals receiving take-home rations as a result of USDA assistance (insert
beneficiary type, repeat as necessary) RELATIONSHIP TO THE FEED THE FUTURE (FtF) INITIATIVE
FtF INDICATOR: No
FtF WHOLE OF GOVERNMENT INDICATOR: No
DEFINITIONAL AND MEASUREMENT NOTES: None
71

MGD RESULTS FRAMEWORK 1: Improved Literacy of School-Aged Children
MGD 1.2.1: Reduced Short-Term Hunger MGD 1.2.1.1: Increased Access to Food (school feeding)
MGD INDICATOR 15: Number of daily school meals (breakfast, snack, lunch) provided to school-age children as a result of USDA assistance DEFINITION: A school meal may include a breakfast or lunch meal or a snack provided in the mornings or afternoon during the school period. A school meal is counted each time it is provided to a student in a USDA supported project. A school feeding program provide meals, where the primary objective is generally to provide breakfast, mid-morning meals, lunch, or a combination (depending on the duration of the school day) to alleviate short-term hunger, increase attention span, facilitate learning, and obviate the need for children to leave the school to find food. School meals can be prepared in schools or in the community, or can be delivered from centralized kitchens. They can be an important source of micronutrients if prepared using fortified commodities, or if micronutrient powder is added during or after preparation. RATIONALE: School meals, provided early in the school day to alleviate hunger before or while classes are in session, will help children to be more attentive and improve concentration. Ultimately, these children will be more successful in school and progress further and more quickly. School meals or snacks can also alleviate specific nutritional deficiencies of school-age children. The alleviation of hunger via school meals can be critical to improving the capacity of children to learn.
INDICATOR CHARACTERISTICS UNIT OF MEASURE: Number: Meals
INDICATOR LEVEL: Output
DIRECTION OF CHANGE: Higher is better
FREQUENCY OF REPORTING: Biannually covering the periods: October 1 – March 31 and April 1 – September 30
DISAGGREGATION: None DATA SOURCE: WHO COLLECTS DATA FOR THIS INDICATOR: Data will be collected by program participants. HOW SHOULD IT BE COLLECTED: Participating partners will count the total number of school meals at the project level, through reports and program data. For this indicator, count the number of meals without distinguishing whether the same person received multiple meals. In that case, the person would be counted several times, which is acceptable for this indicator. MEASUREMENT NOTES: The number of school age children receiving school meals is counted under MGD Indicator 15.The number of take home rations is counted under MGD Indicator 12 and the number of individuals receiving take-home rations in counted under Indicator 13. DATA ENTRY IN FAIS: The indicator title must be entered into the relevant performance reporting section of FAIS VERBATIM to allow for the information to be collected correctly. Indicator-specific disaggregation guidance: None
RELATIONSHIP TO THE FEED THE FUTURE (FtF) INITIATIVE FtF INDICATOR: No
FtF WHOLE OF GOVERNMENT INDICATOR: No
DEFINITIONAL AND MEASUREMENT NOTES: None
72

MGD RESULTS FRAMEWORK 1: Improved Literacy of School-Aged Children
MGD 1.2: Improved Attentiveness MGD 1.2.1: Reduced Short-Term Hunger MGD 1.2.1.1: Increased Access to Food (school feeding)
MGD INDICATOR 16: Number of school-aged children receiving daily school meals (breakfast, snack, lunch) as a result of USDA assistance DEFINITION: A school meal may include a breakfast or lunch meal or a snack provided in the mornings or afternoon during the school period. A school feeding program provide meals, where the primary objective is generally to provide breakfast, mid-morning meals, lunch, or a combination (depending on the duration of the school day) to alleviate short-term hunger, increase attention span, facilitate learning, and obviate the need for children to leave the school to find food. School meals can be prepared in schools or in the community, or can be delivered from centralized kitchens. They can be an important source of micronutrients if prepared using fortified commodities, or if micronutrient powder is added during or after preparation. RATIONALE: School meals, provided early in the school day to alleviate hunger before or while classes are in session, will help children to be more attentive and improve concentration. Ultimately, these children will be more successful in school and progress further and more quickly. School meals or snacks can also alleviate specific nutritional deficiencies of school-age children. The alleviation of hunger via school meals can be critical to improving the capacity of children to learn.
INDICATOR CHARACTERISTICS UNIT OF MEASURE: Number: Children
INDICATOR LEVEL: Output
DIRECTION OF CHANGE: Higher is better
FREQUENCY OF REPORTING: Biannually covering the periods: October 1 – March 31 and April 1 – September 30
DISAGGREGATION: Gender: Male, Female (required) New/Continuing (required):
• New = this reporting year is the first year the individual received daily school meals • Continuing = the individual first received daily meals in the previous year and continues to
receive them DATA SOURCE: WHO COLLECTS DATA FOR THIS INICATOR: Data will be collected by program participants. HOW SHOULD IT BE COLLECTED: Participating partners will count the total number of school-age children receiving school meals at the project level, through reports and program data. MEASUREMENT NOTES: The number of school meals provided is counted under MGD indicator 14. The number of take home rations is counted under MGD Indicator 12 and the number of individuals receiving take-home rations in counted under Indicator 13. Students should not be double counted in a given fiscal year. The student should be counted the first time that they receive a school meal in that fiscal year. Students that receive a school meal in multiple fiscal years may be counted once in each fiscal year. DATA ENTRY IN FAIS: The indicator title must be entered into the relevant performance reporting section of FAIS VERBATIM to allow for the information to be collected correctly.
73

Indicator-specific disaggregation guidance: Enter the indicator in FAIS for each required/applicable disaggregation. In this case male and female. Identify in parentheses the disaggregation at the end of the indicator title. For example:
- Number of school-aged children receiving daily school meals (breakfast, snack, lunch) as a result of USDA assistance (male)
- Number of school-aged children receiving daily school meals (breakfast, snack, lunch) as a result of USDA assistance (female)
- Number of school-aged children receiving daily school meals (breakfast, snack, lunch) as a result of USDA assistance (new)
- Number of school-aged children receiving daily school meals (breakfast, snack, lunch) as a result of USDA assistance (continuing)
RELATIONSHIP TO THE FEED THE FUTURE (FtF) INITIATIVE FtF INDICATOR: No
FtF WHOLE OF GOVERNMENT INDICATOR: No
DEFINITIONAL AND MEASURMENT NOTES: None
74
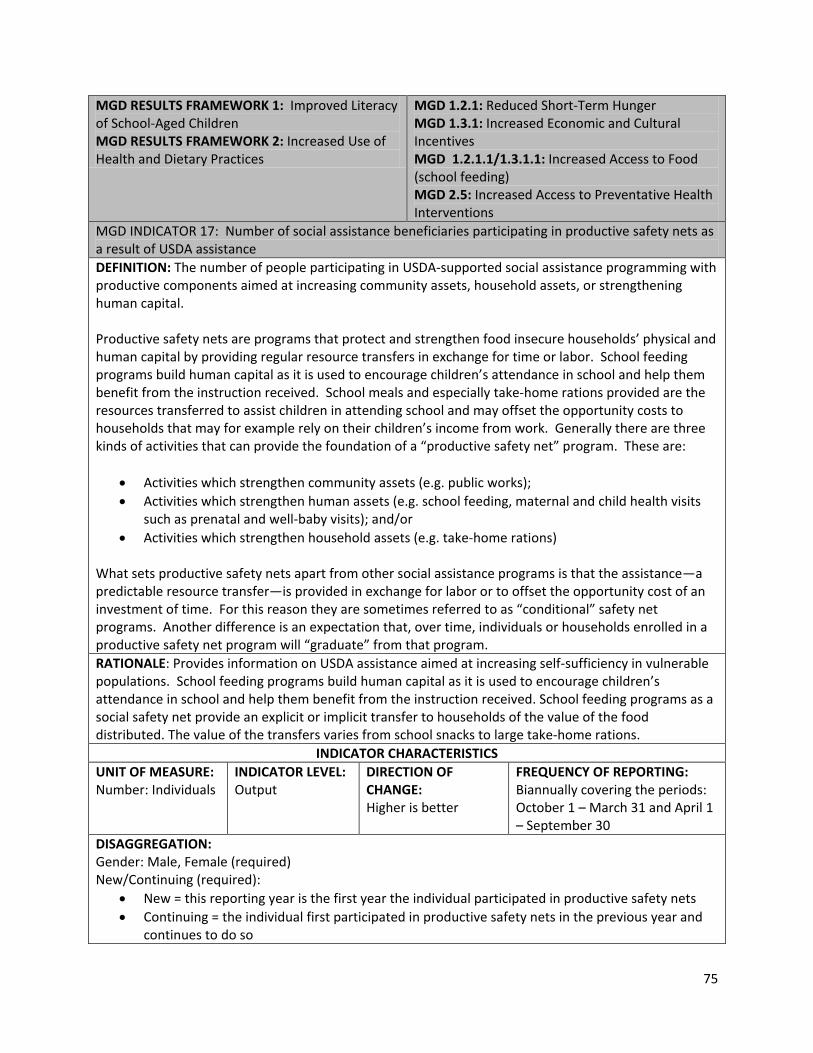
MGD RESULTS FRAMEWORK 1: Improved Literacy of School-Aged Children MGD RESULTS FRAMEWORK 2: Increased Use of Health and Dietary Practices
MGD 1.2.1: Reduced Short-Term Hunger MGD 1.3.1: Increased Economic and Cultural Incentives MGD 1.2.1.1/1.3.1.1: Increased Access to Food (school feeding) MGD 2.5: Increased Access to Preventative Health Interventions
MGD INDICATOR 17: Number of social assistance beneficiaries participating in productive safety nets as a result of USDA assistance DEFINITION: The number of people participating in USDA-supported social assistance programming with productive components aimed at increasing community assets, household assets, or strengthening human capital. Productive safety nets are programs that protect and strengthen food insecure households’ physical and human capital by providing regular resource transfers in exchange for time or labor. School feeding programs build human capital as it is used to encourage children’s attendance in school and help them benefit from the instruction received. School meals and especially take-home rations provided are the resources transferred to assist children in attending school and may offset the opportunity costs to households that may for example rely on their children’s income from work. Generally there are three kinds of activities that can provide the foundation of a “productive safety net” program. These are:
• Activities which strengthen community assets (e.g. public works); • Activities which strengthen human assets (e.g. school feeding, maternal and child health visits
such as prenatal and well-baby visits); and/or • Activities which strengthen household assets (e.g. take-home rations)
What sets productive safety nets apart from other social assistance programs is that the assistance—a predictable resource transfer—is provided in exchange for labor or to offset the opportunity cost of an investment of time. For this reason they are sometimes referred to as “conditional” safety net programs. Another difference is an expectation that, over time, individuals or households enrolled in a productive safety net program will “graduate” from that program. RATIONALE: Provides information on USDA assistance aimed at increasing self-sufficiency in vulnerable populations. School feeding programs build human capital as it is used to encourage children’s attendance in school and help them benefit from the instruction received. School feeding programs as a social safety net provide an explicit or implicit transfer to households of the value of the food distributed. The value of the transfers varies from school snacks to large take-home rations.
INDICATOR CHARACTERISTICS UNIT OF MEASURE: Number: Individuals
INDICATOR LEVEL: Output
DIRECTION OF CHANGE: Higher is better
FREQUENCY OF REPORTING: Biannually covering the periods: October 1 – March 31 and April 1 – September 30
DISAGGREGATION: Gender: Male, Female (required) New/Continuing (required):
• New = this reporting year is the first year the individual participated in productive safety nets • Continuing = the individual first participated in productive safety nets in the previous year and
continues to do so
75

DATA SOURCE: WHO COLLECTS DATA FOR THIS INICATOR: Data will be collected by program participants. HOW SHOULD IT BE COLLECTED: Data will be collected from program participant administrative records and reports. Program participants should keep detailed lists of all program participants. MEASUREMENT NOTES: The key to qualifying as a social assistance beneficiary under this indicator is the receipt of a cash or in-kind resource transfer. A conditional cash or in-kind transfer “provides poor households with cash, food, or other benefits on condition that they keep children in school, attend health clinics, or make other desired behavioural changes.” Therefore, students that received school meals and/or take-home rations should be counted as social assistance beneficiaries for this indicator. If the take-home ration size is calculated taking household requirement into account (i.e. with the objective of providing support to the family rather than the individual) then all family members should be counted as direct beneficiaries under this indicator. Teachers, cooks and other school administrators that receive school meals as a form of payment for their services should not be counted as a beneficiary under this indicator. To avoid double counting, persons should not be counted multiple times in the aggregate total in one fiscal year. For example, if a beneficiary (student) receives a school meal and a take home ration, they should be counted once per fiscal year in the total beneficiaries. DATA ENTRY IN FAIS: The indicator title must be entered into the relevant performance reporting section of FAIS VERBATIM to allow for the information to be collected correctly. Indicator-specific disaggregation guidance: Enter the indicator in FAIS for each required/applicable disaggregation. In this case male, female, new, and continuing. Identify in parentheses the disaggregation at the end of the indicator title. For example:
- Number of social assistance beneficiaries participating in productive safety nets as a result of USDA assistance (male)
- Number of social assistance beneficiaries participating in productive safety nets as a result of USDA assistance (female)
- Number of social assistance beneficiaries participating in productive safety nets as a result of USDA assistance (new)
- Number of social assistance beneficiaries participating in productive safety nets as a result of USDA assistance (continuing)
RELATIONSHIP TO THE FEED THE FUTURE (FtF) INITIATIVE FtF INDICATOR: Yes [3.3.3-15]
FtF WHOLE OF GOVERNMENT INDICATOR: No
DEFINITIONAL AND MEASURMENT NOTES: The definition for the indicator was revised to include relevant examples for MGD. For example, FtF does not list nutrition or school-feeding related examples of productive safety nets.
76

MGD RESULTS FRAMEWORK 2: Increased Use of Health and Dietary Practices
MDG 2.3: Increased Knowledge of Nutrition
MGD INDICATOR 18: Number of individuals trained in child health and nutrition as a result of USDA assistance DEFINITION: This is an output indicator measuring the number of health professionals or others trained or certified in child health and nutrition directly as a result of USDA funding in whole or in part. This includes health professionals, primary health care workers, community health workers, volunteers, non-health personnel trained in child health and child nutrition through USDA-supported programs during the reporting year. Successful completion requires that trainees meet the completion requirements of the structured training program as defined by the program offered. Training should be at least two working days (16 hours) in duration. RATIONALE: Development of human capacity through training is a major component of USDA-supported health area programs in this element. Training health professionals builds human capital and supports institutional capacity building in countries.
INDICATOR CHARACTERISTICS UNIT OF MEASURE: Number: Individuals
INDICATOR LEVEL: Output
DIRECTION OF CHANGE: Higher is better
FREQUENCY OF REPORTING: Biannually covering the periods: October 1 – March 31 and April 1 – September 30
DISAGGREGATION: Gender: Male, Female (required) DATA SOURCE: WHO COLLECTS DATA FOR THIS INICATOR: Data will be collected by program participants. HOW SHOULD IT BE COLLECTED: Data will be collected from program participant training records and reports. Program participants should keep detailed training lists for all training sessions. MEASUREMENT NOTES: For this indicator, simply count the training attendance numbers without distinguishing whether the same person received multiple trainings. In that case, that person would be counted several times, which is acceptable for this indicator. Educational professionals (teachers/educators/teaching assistants) trained should be counted in MGD Indicator 6 and school administrators trained should be counted in MGD indicator 4. School administrators and educational professionals receiving training in child health and nutrition in should be also counted in MGD indicator 4 or 6 (respectively) in addition to this indicator. DATA ENTRY IN FAIS: The indicator title must be entered into the relevant performance reporting section of FAIS VERBATIM to allow for the information to be collected correctly. Indicator-specific disaggregation guidance: Enter the indicator in FAIS for each required/applicable disaggregation. In this case male and female. Identify in parentheses the disaggregation at the end of the indicator title. For example:
- Number of individuals trained in child health and nutrition as a result of USDA assistance (male)
77

- Number of individuals trained in child health and nutrition as a result of USDA assistance (female)
RELATIONSHIP TO THE FEED THE FUTURE (FtF) INITIATIVE FtF INDICATOR: Yes [3.1.9-1]
FtF WHOLE OF GOVERNMENT INDICATOR: No
DEFINITIONAL AND MEASURMENT NOTES: FtF does not establish a training hour requirement. The 16 hour requirement is established in F indicator training requirements and is consistent with MGD Indicators 4 and 6.
78

MGD RESULTS FRAMEWORK 2: Increased Use of Health and Dietary Practices
MGD 2.4: Increased Access to Clean Water and Sanitation Services
MGD INDICATOR 19: Number of schools using an improved water source DEFINITION: This indicator measures the number of schools using an improved water source. To determine whether a school is using an improved water source, the school administrator is asked:
1. To identify the main source of water for the school 2. Whether the water is normally available from the identified source(s) 3. Whether the water was unavailable from the identified source(s) in the past two weeks for a day
or longer An improved water source is an infrastructure improvement to a water source, a distribution system, or a delivery point. By nature of its design and construction, the improvement is likely to protect the water source from external contamination, in particular fecal matter. Improved water sources are:
• Piped water into dwelling, plot, or yard • Public tap/standpipe • Tube well/borehole • Protected dug well • Protected spring • Rainwater collection
Unimproved water sources are:
• Unprotected dug well • Unprotected spring • Cart with small tank/drum • Tanker truck • Surface water (river, dam, lake, pond, stream, canal, or • irrigation channel) • Bottled water
Note: Bottled water is considered unimproved water by default. However, organizations can opt to consider “bottled water” an improved drinking water source if they can determine that the bottled water is of reliable quality and that the all students, teachers and cooks use bottled water for all drinking, cooking, and personal hygiene. RATIONALE: Poor sanitation, water and hygiene have many serious repercussions. Inadequate access to safe water and sanitation services, coupled with poor hygiene practices, kills and sickens thousands of children every day. Illness prevents children from attending school. Assess to clean water at the schools is vital to ensure safe food preparation and improved hygiene practices, including hand washing before meals.
INDICATOR CHARACTERISTICS UNIT OF MEASURE: Number: Schools
INDICATOR LEVEL: Output
DIRECTION OF CHANGE: Higher is better
FREQUENCY OF REPORTING: Biannually covering the periods: October 1-March 31 and
79

April 1-September 30 DISAGGREGATION: None DATA SOURCE: WHO COLLECTS DATA FOR THIS INDICATOR: Data will be collected by Program Participants. HOW SHOULD IT BE COLLECTED: Data will be collected at the project level, through reports and program data. MEASUREMENT NOTES: This indicator measures the number of schools using a clean water source. The water source must be accessible to the school for use every day of the school year for the school to be considered one that has access to a clean water source. The water source does not need to be implemented or installed by the project to be counted as a clean water source. DATA ENTRY IN FAIS: The indicator title must be entered into the relevant performance reporting section of FAIS VERBATIM to allow for the information to be collected correctly. Indicator-specific disaggregation guidance: None
RELATIONSHIP TO THE FEED THE FUTURE (FtF) INITIATIVE FtF INDICATOR: No
FtF WHOLE OF GOVERNMENT INDICATOR: No
DEFINITIONAL AND MEASUREMENT NOTES: None
80

MGD RESULTS FRAMEWORK 2: Increased Use of Health and Dietary Practices
MGD 2.4: Increased Access to Clean Water and Sanitation Services
MGD INDICATOR 20: Number of schools with improved sanitary facilities DEFINITION: This indicator measures whether there are adequate sanitary facilities at the school and whether that sanitary facility meets the improved sanitation standards defined in the Millennium Development Goals (MDGs). To be considered adequate, the school must have separate improved sanitation facilities available for the use of both males and females. The sanitation facilities must meet the definition of an improved sanitation facility as noted below: Improved sanitation is defined as:
• Flush or pour/flush facilities connected to a: o Piped sewer system o Septic system o Pit latrine
• Pit latrines with a slab • Composting toilets • Ventilated improved pit latrines
Unimproved sanitation includes:
• Flush or pour/flush toilets without a sewer connection • Pit latrines without slab/open pit • Bucket latrines • Hanging toilets/latrines • No facilities, open defecation
RATIONALE: Poor sanitation, water and hygiene have many serious repercussions. Inadequate access to safe water and sanitation services, coupled with poor hygiene practices, kills and sickens thousands of children every day. Children – and particularly females – are often denied their right to education because their schools lack private and decent sanitation facilities.
INDICATOR CHARACTERISTICS UNIT OF MEASURE: Number: Schools
INDICATOR LEVEL: Output
DIRECTION OF CHANGE: Higher is better
FREQUENCY OF REPORTING: Biannually covering the periods: October 1-March 31 and April 1-September 30
DISAGGREGATION: None DATA SOURCE: WHO COLLECTS DATA FOR THIS INDICATOR: Data will be collected by Program Participants. HOW SHOULD IT BE COLLECTED: Data will be collected at the project level, through reports and program data. MEASUREMENT NOTES: This indicator measures the percent of schools that have improved sanitation facilities. It does not measure the number of sanitation facilities constructed by the project or the number of sanitation facilities at the schools. Organizations should consider whether the sanitation facilities at the school are adequate in serving the needs of the students – particularly female students – at each school.
81

DATA ENTRY IN FAIS: The indicator title must be entered into the relevant performance reporting section of FAIS VERBATIM to allow for the information to be collected correctly. Indicator-specific disaggregation guidance: None
RELATIONSHIP TO THE FEED THE FUTURE (FtF) INITIATIVE FtF INDICATOR: No
FtF WHOLE OF GOVERNMENT INDICATOR: No
DEFINITIONAL AND MEASUREMENT NOTES: None
82
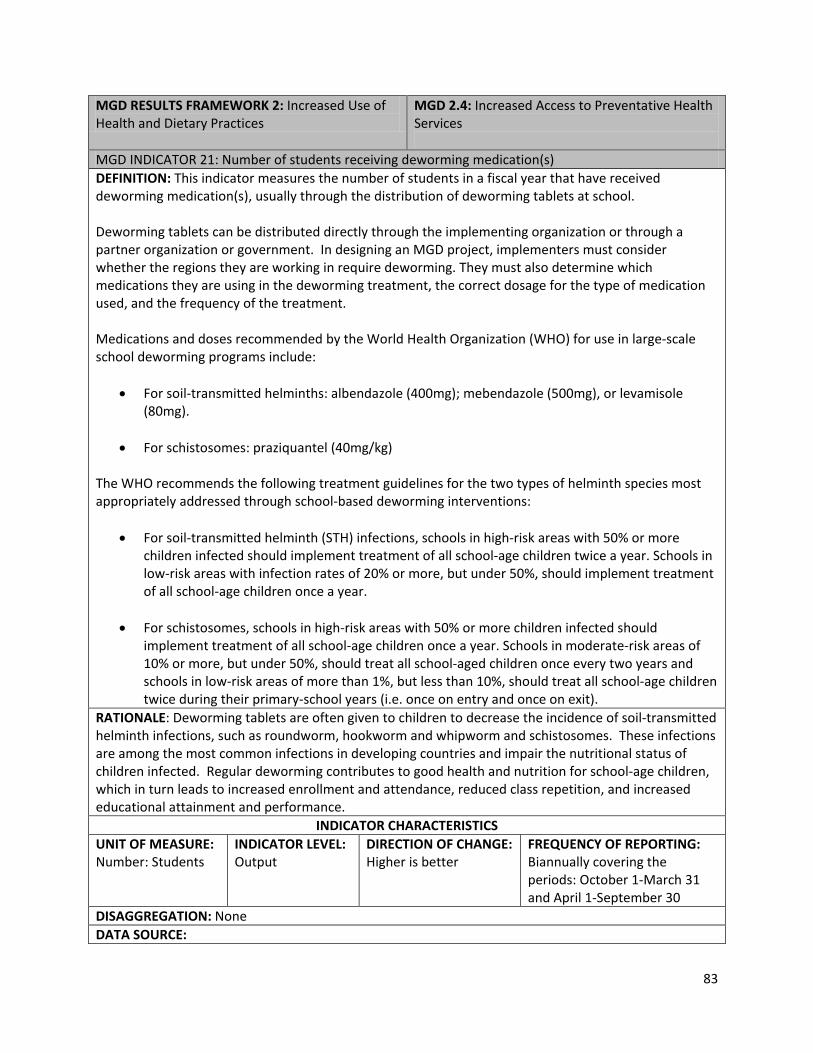
MGD RESULTS FRAMEWORK 2: Increased Use of Health and Dietary Practices
MGD 2.4: Increased Access to Preventative Health Services
MGD INDICATOR 21: Number of students receiving deworming medication(s) DEFINITION: This indicator measures the number of students in a fiscal year that have received deworming medication(s), usually through the distribution of deworming tablets at school. Deworming tablets can be distributed directly through the implementing organization or through a partner organization or government. In designing an MGD project, implementers must consider whether the regions they are working in require deworming. They must also determine which medications they are using in the deworming treatment, the correct dosage for the type of medication used, and the frequency of the treatment. Medications and doses recommended by the World Health Organization (WHO) for use in large-scale school deworming programs include:
• For soil-transmitted helminths: albendazole (400mg); mebendazole (500mg), or levamisole (80mg).
• For schistosomes: praziquantel (40mg/kg)
The WHO recommends the following treatment guidelines for the two types of helminth species most appropriately addressed through school-based deworming interventions:
• For soil-transmitted helminth (STH) infections, schools in high-risk areas with 50% or more children infected should implement treatment of all school-age children twice a year. Schools in low-risk areas with infection rates of 20% or more, but under 50%, should implement treatment of all school-age children once a year.
• For schistosomes, schools in high-risk areas with 50% or more children infected should
implement treatment of all school-age children once a year. Schools in moderate-risk areas of 10% or more, but under 50%, should treat all school-aged children once every two years and schools in low-risk areas of more than 1%, but less than 10%, should treat all school-age children twice during their primary-school years (i.e. once on entry and once on exit).
RATIONALE: Deworming tablets are often given to children to decrease the incidence of soil-transmitted helminth infections, such as roundworm, hookworm and whipworm and schistosomes. These infections are among the most common infections in developing countries and impair the nutritional status of children infected. Regular deworming contributes to good health and nutrition for school-age children, which in turn leads to increased enrollment and attendance, reduced class repetition, and increased educational attainment and performance.
INDICATOR CHARACTERISTICS UNIT OF MEASURE: Number: Students
INDICATOR LEVEL: Output
DIRECTION OF CHANGE: Higher is better
FREQUENCY OF REPORTING: Biannually covering the periods: October 1-March 31 and April 1-September 30
DISAGGREGATION: None DATA SOURCE:
83

WHO COLLECTS DATA FOR THIS INDICATOR: Data will be collected by program participants. HOW SHOULD IT BE COLLECTED: Participating partners will count the total number of individuals receiving the medication(s) at the project level, through reports and program data. The data are normally obtained from forms completed by the health professional administering the treatment. If the accuracy of the data collected via the forms is questioned, the project may consider conducting a “confirmation survey” to verify the information in a small sample of schools. According to monitoring and evaluation guidelines established by WHO, to improve the accuracy of data, this indicator should be collected immediately after the administration of a round of deworming medications. MEASUREMENT NOTES: As noted above, in determining the appropriate treatment for the specific beneficiary student population of the project, organizations should work with the Ministry of Health and follow guidance provided by the World Health Organization, http://whqlibdoc.who.int/publications/2011/9789241548267_eng.pdf?ua=1 Students should only be counted once per fiscal year. Students that are treated for worms multiple fiscal years may be counted once in each fiscal year. DATA ENTRY IN FAIS: The indicator title must be entered into the relevant performance reporting section of FAIS VERBATIM to allow for the information to be collected correctly. Indicator-specific disaggregation guidance: None
RELATIONSHIP TO THE FEED THE FUTURE (FtF) INITIATIVE FtF INDICATOR: No
FtF WHOLE OF GOVERNMENT INDICATOR: No
DEFINITIONAL AND MEASUREMENT NOTES: None
84
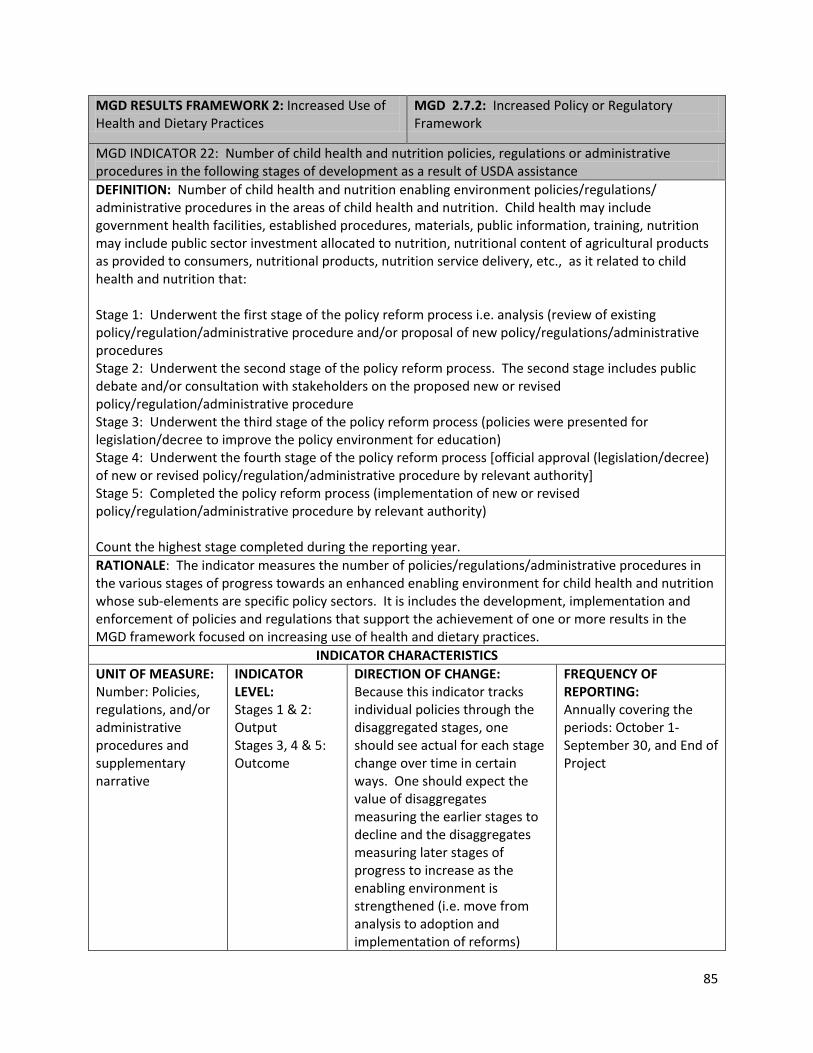
MGD RESULTS FRAMEWORK 2: Increased Use of Health and Dietary Practices
MGD 2.7.2: Increased Policy or Regulatory Framework
MGD INDICATOR 22: Number of child health and nutrition policies, regulations or administrative procedures in the following stages of development as a result of USDA assistance DEFINITION: Number of child health and nutrition enabling environment policies/regulations/ administrative procedures in the areas of child health and nutrition. Child health may include government health facilities, established procedures, materials, public information, training, nutrition may include public sector investment allocated to nutrition, nutritional content of agricultural products as provided to consumers, nutritional products, nutrition service delivery, etc., as it related to child health and nutrition that: Stage 1: Underwent the first stage of the policy reform process i.e. analysis (review of existing policy/regulation/administrative procedure and/or proposal of new policy/regulations/administrative procedures Stage 2: Underwent the second stage of the policy reform process. The second stage includes public debate and/or consultation with stakeholders on the proposed new or revised policy/regulation/administrative procedure Stage 3: Underwent the third stage of the policy reform process (policies were presented for legislation/decree to improve the policy environment for education) Stage 4: Underwent the fourth stage of the policy reform process [official approval (legislation/decree) of new or revised policy/regulation/administrative procedure by relevant authority] Stage 5: Completed the policy reform process (implementation of new or revised policy/regulation/administrative procedure by relevant authority) Count the highest stage completed during the reporting year. RATIONALE: The indicator measures the number of policies/regulations/administrative procedures in the various stages of progress towards an enhanced enabling environment for child health and nutrition whose sub-elements are specific policy sectors. It is includes the development, implementation and enforcement of policies and regulations that support the achievement of one or more results in the MGD framework focused on increasing use of health and dietary practices.
INDICATOR CHARACTERISTICS UNIT OF MEASURE: Number: Policies, regulations, and/or administrative procedures and supplementary narrative
INDICATOR LEVEL: Stages 1 & 2: Output Stages 3, 4 & 5: Outcome
DIRECTION OF CHANGE: Because this indicator tracks individual policies through the disaggregated stages, one should see actual for each stage change over time in certain ways. One should expect the value of disaggregates measuring the earlier stages to decline and the disaggregates measuring later stages of progress to increase as the enabling environment is strengthened (i.e. move from analysis to adoption and implementation of reforms)
FREQUENCY OF REPORTING: Annually covering the periods: October 1-September 30, and End of Project
85

DISAGGREGATION (required): Disaggregates will be shown by stages (1-5) as noted above. DATA SOURCE: WHO COLLECTS DATA FOR THIS INDICATOR: Data will be collected by program participants. HOW SHOULD IT BE COLLECTED: Data collected at the project-level , through project records of activities and capacity building carried out by the project, observation and analysis of the host government legal status of the various policies being addressed. Policies, legislation, regulations should be submitted to USDA and attached in biannual project reports. MEASUREMENT NOTES: Only count policies specifically addressed with USDA assistance. Enter the name of the policy/regulation/administrative procedure and its stage in order to track movement through the stages. Count the highest stage completed during the reporting year. This indicator tracks the policy, regulation, or administrative procedure. Multiple project participants working in the same country or region (with regard to regional policies) may report the same policy, regulation, or administrative procedure as long as the program participant participated in the process and provided assistance to the development, drafting, formation of the law or policy. Policies, regulations, administrative procedures focused on education should be counted under MGD Indicator 11. DATA ENTRY IN FAIS: The indicator title must be entered into the relevant performance reporting section of FAIS VERBATIM to allow for the information to be collected correctly. Indicator-specific disaggregation guidance: Enter the indicator in FAIS for each required/applicable disaggregation. In this case stages 1, 2, 3, 4, & 5. Identify in parentheses the disaggregation at the end of the indicator title. For example:
- Numbers of child health and nutrition policies, regulations or administrative procedures in the following stages of development as a result of USDA assistance (stage 1)
- Numbers of child health and nutrition policies, regulations or administrative procedures in the following stages of development as a result of USDA assistance (stage 2)
- And so on as necessary… RELATIONSHIP TO THE FEED THE FUTURE (FtF) INITIATIVE
FtF INDICATOR: No
FtF WHOLE OF GOVERNMENT INDICATOR: No
DEFINITIONAL AND MEASUREMENT NOTES: This indicator is similar to FtF Indicator 4.5.1-24 number of policies/regulations/administrative procedures in each of the following stages of development as a result of USG assistance in each case; however the FtF indicator is focused on the agricultural enabling environment and not education.
86

MGD RESULTS FRAMEWORK 2: Increased Use of Health and Dietary Practices
MGD SO2: Increased Use of Health and Dietary Practices
MGD INDICATOR 23: Percent of school-age children receiving a minimum acceptable diet DEFINITION: This indicator measures the proportion of school-age children who receive a minimum acceptable diet. The “minimum acceptable diet” indicator measures both the minimum feeding frequency and minimum dietary diversity, as appropriate for various age groups. If a child meets the minimum feeding frequency and minimum dietary diversity for their age group then they are considered to receive a minimum acceptable diet. Tabulation of indicator results requires that data on dietary diversity and number of feeds be collected for school-age children the day preceding the survey. Guidance for this indicator can be found using the Food and Agriculture Organization’s (FAO) Guidelines for Measuring Household and Individual Dietary Diversity: http://www.fao.org/docrep/014/i1983e/i1983e00.htm Minimum dietary diversity for children is defined as four or more food groups out of the following seven food groups:
• Grains, roots and tubers • Legumes and nuts • Dairy products (milk, yogurt, cheese) • Flesh foods (meat, fish, poultry and liver/organ meats) • Eggs • Vitamin-A enriched foods, including vegetable oil, fruits and vegetables • Other fruits and vegetables
Minimum meal frequency for children is defined as three or more feedings of solid, semi-solid or soft food per day. RATIONALE: Individual dietary diversity scores aim to reflect nutrient adequacy. Studies in different age groups have shown that an increase in individual dietary diversity scores is related to increased nutrient adequacy of the diet. Dietary diversity scores have been validated for several age/sex groups as proxy measures for macro and/or micronutrient adequacy of the diet.
INDICATOR CHARACTERISTICS UNIT OF MEASURE: Percent
INDICATOR LEVEL: Outcome
DIRECTION OF CHANGE: Higher is better
FREQUENCY OF REPORTING: Annually covering the periods: October 1-September 30, and End of Project
DISAGGREGATION: Gender: Male/Female (required) DATA SOURCE: WHO COLLECTS DATA FOR THIS INDICATOR: Data will be collected by Program Participants. HOW SHOULD IT BE COLLECTED: Data will be collected through surveys with a sample of students participating in the school feeding program. Sample size should be appropriate for the number of beneficiaries served under the project and should be representative of the students served by the project. MEASUREMENT NOTES: Dietary diversity is defined as the number of individual food items or food
87
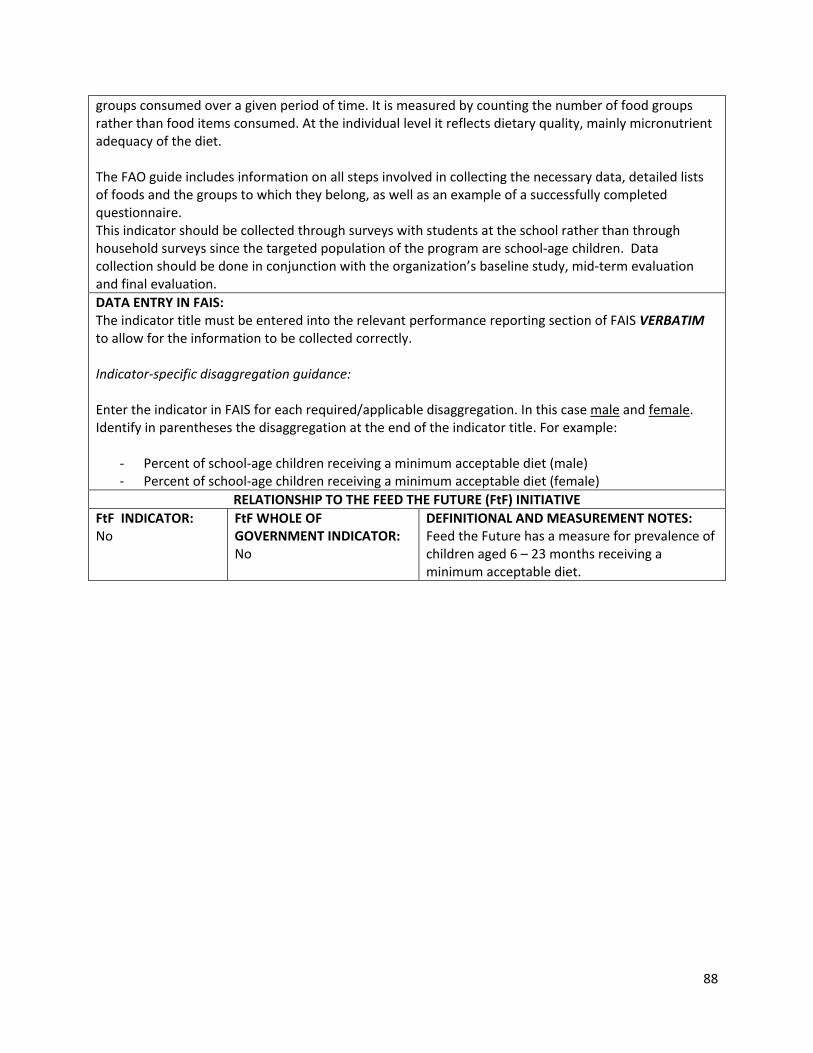
groups consumed over a given period of time. It is measured by counting the number of food groups rather than food items consumed. At the individual level it reflects dietary quality, mainly micronutrient adequacy of the diet. The FAO guide includes information on all steps involved in collecting the necessary data, detailed lists of foods and the groups to which they belong, as well as an example of a successfully completed questionnaire. This indicator should be collected through surveys with students at the school rather than through household surveys since the targeted population of the program are school-age children. Data collection should be done in conjunction with the organization’s baseline study, mid-term evaluation and final evaluation. DATA ENTRY IN FAIS: The indicator title must be entered into the relevant performance reporting section of FAIS VERBATIM to allow for the information to be collected correctly. Indicator-specific disaggregation guidance: Enter the indicator in FAIS for each required/applicable disaggregation. In this case male and female. Identify in parentheses the disaggregation at the end of the indicator title. For example:
- Percent of school-age children receiving a minimum acceptable diet (male) - Percent of school-age children receiving a minimum acceptable diet (female)
RELATIONSHIP TO THE FEED THE FUTURE (FtF) INITIATIVE FtF INDICATOR: No
FtF WHOLE OF GOVERNMENT INDICATOR: No
DEFINITIONAL AND MEASUREMENT NOTES: Feed the Future has a measure for prevalence of children aged 6 – 23 months receiving a minimum acceptable diet.
88

MGD RESULTS FRAMEWORK 1: Improved Literacy of School-Age Children
This indicator is required for all proposals and all agreements.
Note: Use this indicator to measure result SO1
MGD INDICATOR 24: Percent of students who, by the end of two grades of primary schooling, demonstrate that they can read and understand the meaning of grade level text DEFINITION: Proportion of learners who attain the specified threshold at the end of two grades of primary schooling, the beginning of the third year of primary schooling, or the equivalent levels of accelerated learning programs. Students and learners in formal and non-formal education programs should be included. Measures of the indicator will be determined in consultation with the country, and informed by national (or regional, if applicable) curriculum standards, and by international experience. Illustrative examples include country-specific benchmarks on national assessments that have satisfactory psychometric validity and reliability and limited corruption issues or levels of oral fluency based on acceptable oral assessments, e.g. demonstrating satisfactory levels of comprehension as measured by comprehension questions on grade 2 texts, or reading a country-determined number of words correct per minute. The language(s) of assessment will be determined by country policies. Any assessment system with adequate psychometric validity and reliability is acceptable, e.g. ASER, EGRA, and national assessments. A census of all the students and learners who received the treatment or intervention is not necessary. Rather, a statistical sample that is representative of that population is adequate. Those findings then may be extrapolated to the population.
MGD indicator 23 =
# of students and learners reading with sufficient understanding at the end of the first two grade of primary schooling
Total # of students and learners at the end of the first two grades of primary schooling
RATIONALE: The indicator is useful for measuring the impact of USDA projects in improving the literacy of school aged children.
INDICATOR CHARACTERISTICS UNIT OF MEASURE: Percent
INDICATOR LEVEL: Outcome
DIRECTION OF CHANGE: Higher is better
FREQUENCY OF REPORTING: Annually covering the periods: October 1-September 30, and End of Project
DISAGGREGATION: Gender: Male, Female (required) DATA SOURCE: WHO COLLECTS DATA FOR THIS INDICATOR: Data will be collected by program participants. HOW SHOULD IT BE COLLECTED: For students and learners in both formal and non-formal education programs, data will be generated through early grade reading assessments (most likely oral). Assessments should be done at baseline and endline, and possibly at midline as well, using comparable assessments given at the same grades or their equivalents (at the end of grade two, the beginning of grade 3, or at the equivalent level of accelerated learning programs). These assessments may be carried out by or in partnership with host governments or other organizations, national or international. MEASUREMENT NOTES: Note that the sampling approach must generate data representative at the
89

level of USDA interventions. If, for instance, programs intervene in only two provinces, data representative of those two provinces must be collected. Nationally-representative data cannot be disaggregated by province unless the sampling frame was designed to do so, and is large enough for this type of disaggregation. DATA ENTRY IN FAIS: The indicator title must be entered into the relevant performance reporting section of FAIS VERBATIM to allow for the information to be collected correctly. Indicator-specific disaggregation guidance: Enter the indicator in FAIS for each required/applicable disaggregation. In this case male and female. Identify in parentheses the disaggregation at the end of the indicator title. For example:
- Percent of students who, by the end of two grades of primary schooling, demonstrate that they can read and understand the meaning of grade level text (male)
- Percent of students who, by the end of two grades of primary schooling, demonstrate that they can read and understand the meaning of grade level text (female)
RELATIONSHIP TO THE FEED THE FUTURE (FtF) INITIATIVE FtF INDICATOR: No
FtF WHOLE OF GOVERNMENT INDICATOR: No
DEFINITIONAL AND MEASUREMENT NOTES: USG Standard Foreign Assistance Indicator 3.2.1-27
90

MGD RESULTS FRAMEWORK 1: Improved Literacy of School-Aged Children
MGD RESULTS FRAMEWORK 2: Increased Use of Health and Dietary Practices
MGD INDICATOR 25: Number of individuals benefiting directly from USDA-funded interventions DEFINITION: This is an output indicator measuring the number of individuals directly participating in USDA-funded interventions. The individuals must be engaged with a project activity or come into direct contact with a set of interventions (goods or services) provided by the project. This may include for example student’s receiving school meals, teacher/administrator training, family members receiving take home rations or loan recipients. Individuals merely contacted or involved in an activity through brief attendance (non-recurring participation) does not count under this indicator. This indicator only tracks direct beneficiaries reached with direct USDA assistance (funded in part or in whole by USDA). Individuals should not be double counted. Individuals may receive multiple interventions in one fiscal year but should only be counted upon first receipt of project interventions. For example, if one individual participates in multiple USDA-sponsored training courses in a given fiscal year, they will only be counted one time in that fiscal year. Individuals participating in USDA-sponsored training courses in multiple fiscal years may be counted once in each fiscal year. RATIONALE: Tracks access to services and overall project direct beneficiaries.
INDICATOR CHARACTERISTICS UNIT OF MEASURE: Number: Individuals
INDICATOR LEVEL: Output
DIRECTION OF CHANGE: Higher is better
FREQUENCY OF REPORTING: Biannually covering the periods: October 1 – March 31 and April 1 – September 30
DISAGGREGATION: Gender: Male, Female (required) New/Continuing (required):
• New = this reporting year is the first year the individual benefited directly from USDA-funded interventions
• Continuing = the person first benefited directly from USDA-funded interventions in the previous year and continues to benefit directly
DATA SOURCE: WHO COLLECTS DATA FOR THIS INICATOR: Data will be collected by program participants. HOW SHOULD IT BE COLLECTED: Data will be collected from program participant beneficiary tracking records and reports. MEASUREMENT NOTES: This indicator provides a unique count of total project beneficiaries. It is linked to other MGD indicators such as MGD indicators 4, 6, and 18 related to school administrator, teacher and health specialists trained and MGD indicator 16 related to persons participating in social safety nets through the receipt of school meals, take home rations, etc. Only direct beneficiaries should be counted. Indirect beneficiaries should not be counted under this indicator. Individual beneficiaries should come into direct contact or receipt of an intervention or set of interventions (i.e. children who receive school meals, tuition waivers, uniforms, books). Family members benefiting from take home rations would all count but if children in the family also receive school meals they should not be double counted. Further, students who benefit from teacher training should not be counted under this indicator but teachers receiving the training should be counted.
91

DATA ENTRY IN FAIS: The indicator title must be entered into the relevant performance reporting section of FAIS VERBATIM to allow for the information to be collected correctly. Indicator-specific disaggregation guidance: Enter the indicator in FAIS for each required/applicable disaggregation. In this case male, female, new, and continuing. Identify in parentheses the disaggregation at the end of the indicator title. For example:
- Number of individuals benefiting directly from USDA-funded interventions (male) - Number of individuals benefiting directly from USDA-funded interventions (female) - Number of individuals benefiting directly from USDA-funded interventions (new) - Number of individuals benefiting directly from USDA-funded interventions (continuing)
RELATIONSHIP TO THE FEED THE FUTURE (FtF) INITIATIVE FtF INDICATOR: No
FtF WHOLE OF GOVERNMENT INDICATOR: No
DEFINITIONAL AND MEASURMENT NOTES: None
92
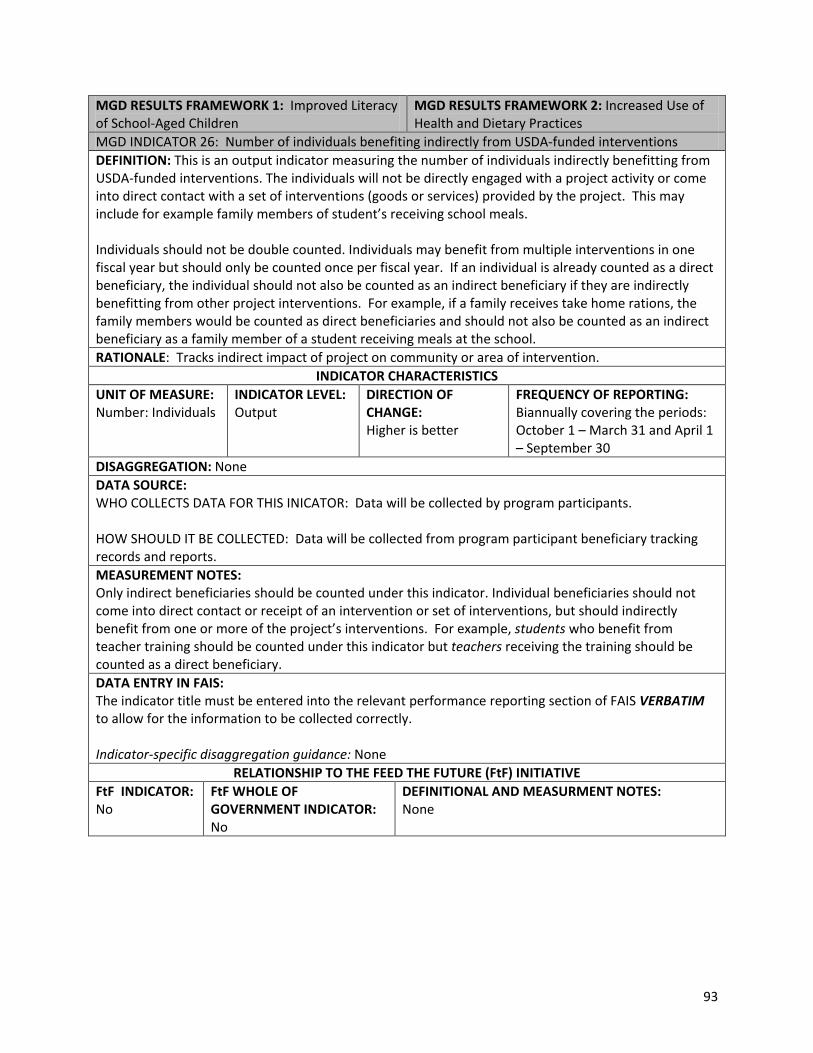
MGD RESULTS FRAMEWORK 1: Improved Literacy of School-Aged Children
MGD RESULTS FRAMEWORK 2: Increased Use of Health and Dietary Practices
MGD INDICATOR 26: Number of individuals benefiting indirectly from USDA-funded interventions DEFINITION: This is an output indicator measuring the number of individuals indirectly benefitting from USDA-funded interventions. The individuals will not be directly engaged with a project activity or come into direct contact with a set of interventions (goods or services) provided by the project. This may include for example family members of student’s receiving school meals. Individuals should not be double counted. Individuals may benefit from multiple interventions in one fiscal year but should only be counted once per fiscal year. If an individual is already counted as a direct beneficiary, the individual should not also be counted as an indirect beneficiary if they are indirectly benefitting from other project interventions. For example, if a family receives take home rations, the family members would be counted as direct beneficiaries and should not also be counted as an indirect beneficiary as a family member of a student receiving meals at the school. RATIONALE: Tracks indirect impact of project on community or area of intervention.
INDICATOR CHARACTERISTICS UNIT OF MEASURE: Number: Individuals
INDICATOR LEVEL: Output
DIRECTION OF CHANGE: Higher is better
FREQUENCY OF REPORTING: Biannually covering the periods: October 1 – March 31 and April 1 – September 30
DISAGGREGATION: None DATA SOURCE: WHO COLLECTS DATA FOR THIS INICATOR: Data will be collected by program participants. HOW SHOULD IT BE COLLECTED: Data will be collected from program participant beneficiary tracking records and reports. MEASUREMENT NOTES: Only indirect beneficiaries should be counted under this indicator. Individual beneficiaries should not come into direct contact or receipt of an intervention or set of interventions, but should indirectly benefit from one or more of the project’s interventions. For example, students who benefit from teacher training should be counted under this indicator but teachers receiving the training should be counted as a direct beneficiary. DATA ENTRY IN FAIS: The indicator title must be entered into the relevant performance reporting section of FAIS VERBATIM to allow for the information to be collected correctly. Indicator-specific disaggregation guidance: None
RELATIONSHIP TO THE FEED THE FUTURE (FtF) INITIATIVE FtF INDICATOR: No
FtF WHOLE OF GOVERNMENT INDICATOR: No
DEFINITIONAL AND MEASURMENT NOTES: None
93