food feed - library and archives...
TRANSCRIPT

University of Alberta
Analyses of Food and Feed Compounds using Matrix-Assistecl Laser
Desorptiodionization Mass Spectrometry
Jian Wang O
A thesis submined to the Faculty of Graduate Studies and Research in partial fulfillment
of the requirements for the degree of Doctor of Philosophy
Food Science and Technology
Department of Agficultural, Food and Nutritional Science
Edmonton, AIberta
Fall2000

National Library i*i of Canada Bibliothèque nationale du Canada
Acquisitions and Acquisitions et Bibliographie Services services bibliographiques 385 WeHIngton Street 395, rue Weiliigtun ûttawaON KIA ûN4 Ottawa ON K1A ON4 Canada Canada
The author has granted a non- L'auteur a accordé une licence non exclusive licence allowing the exclusive permettant à la National Library of Canada to Bibliothèque nationale du Canada de reproduce, loan, distn'bute or sell reproduire* prêter, distri'buer ou copies of this thesis in rnicroform, vendre des copies de cette thèse sous paper or electronic formats. la forme de microfiche/fïh, de
reproduction sur papier ou sur foxmat électronique.
The author retains ownership of the L'auteur conserve la propriété du copyright in this thesis. Neither die droit d'auteur qui protège cette thèse. thesis nor substantiai extracts fiom it Ni la thèse ni des extraits substantie1s may be printed or otherwise de celle-ci ne doivent être imprimés reproduced without the author's ou autrement reproduits sans son permission. autorisation.

ABSTRACT
Matrix-assisted laser desorptiodionization mass spectrometry (MALDI-MS) has
several advantages over other techniques: speed of analysis, high sensitivity, wide mass
range, mass determination of unfragmented molecules, tolerance to contaminants, and
ability to analyze complex mixtures. This thesis presents the application of MALDI-MS
to analyze fnictooligosaccharides, debranched starch, anthocyanins, flavonoi glycosides,
and coccidiostats in food or feed samples. Important MALDEMS conditions for these
compounds are described, including the selection of matrices, the use of an intemal
standard or standard addition, and the determination of response factors.
FructooIigosaccharides demonstrated similar responses on a molar basis when
2',4' ,6'-trihydroxyacetophenone (THAP) was used as a matrix. FructooIigosaccharides in
onions, shallots, and garlic were quantified using MALDI-MS and the results compared
with high performance anion exchange chromatography with pulsed arnperornetiic
detection. Both techniques provided similar results, but MALDI-MS showed a higher
tolerance to impurities. The use of MALDI-MS to study the molecular size profile of
debranched starch was also achieved. 2,s-Dih ydrox y benzoic acid (DHB) w as the best
matrix for the maltooligosaccharides from debranched starch, which exhibited similar
response factors on a weight basis.
MALDI-MS analysis of anthocyanins was possible when THAP was used as the
matrix. Anthocyanins fragment in the MALDI-MS ion source with loss of carbohydrate
residues, but in a ptedictable rnanner. Chemically similar anthocyanins had similar
responses. Anthocyanias in highbush bluebemes were quantified using MALDEMS and

the results compared with high performance liquid chromatography (WLC). Both
techniques provided similar quantitative anthocyanin profiles for the samples. HPLC
could distinguish anthocyanin isomers, while MALDI-MS proved to be more rapid in
accurate anaiysis of anthocyanins with different masses.
Details of ionization, response factors, and fragmentation were studied for
flavonol glycosides in MALDI-MS using THAP as the matnx. This information allowed
for proper interpretation of MALDI-MS spectrum for these analytes in food samples.
The use of MALDI-MS for quantification of coccidiostats in poultry feeds is also
described. DHB was selected as the best matrix. The MALDI-MS limit of detection for
lasalocid, monensin, saiinomycin and narasin standards was 25 1,22,24 and 24 fmole,
respectively. The method detection limit for salinomycin and narasin in poultry feeds was
2.4 wg*

This thesis is dedicated to my wife Min Liu,
to my daughter Rachel,
to my parents,
and
to everyone who has supported me with their love.
I am thankful to the Faculty of Graduate Studies and Research and the
Department of Agricultural, Food and Nutritional Science at the University of Alberta for
financial support.
In particular, 1 am grateful to Dr. Frank E. Robinson for his great support during
my PhD program, both as my cornmittee member and for coordinating acquisition of
poultry feed sarnples, and to al1 my cornmittee members: Dn. Feral Temelli, Marvin J.
Dudas, Thava Vasanthan, and Ronald E. Wrolstad (Oregon Staie University).
1 wish to specifically thank: Dr. Thava Vasanthan for his provision of starch
samples and suggestion of the debranched starch project; Dr. Gaosong Jiang for
preparation of debranched starch samples; Dr. Nicholas H. Low (Department of Applied
Microbiology and Food Science, University of Saskatchewan) for his HPAEC-PAD
anaiysis of fnictooligosaccharides in food samples; Dr. Wilhelmina Kalt (Atlantic Food
and Horticulture Research Center, Agriculture and Agri-Food Canada) for her research
group conducting HPLC analysis of anthocyanins in highbush bluebemes.
I am especially grateful to my supervisor, Dr. Peter Spoms, for his great
supervision and patience. He taught and encouraged me throughout my PhD program.
Thanks also to Len Steele for his great technical and editorial help, and to Dr. Darcy
Driedger for his daily support when we worked as lab partnen.

Table of Contents
....................................................................... Cbap ter1 . In traduction Matrix-Assisted Laser DesorptiodIonization Mass Spectrometry .............
........................................................... MALDI-MS Quantification ...................................................... MALDI-MS in Food Analyses
...................................................................... Thesis Objectives .............................................................................. References
Chapter 2 . AnalIysis of Food Oügosaccharides using MALDI-MS: ................................................ Quantif~cation of Fructooligosaccharides
............................................................................ Introduction ............................................................... Materiais and Methods
ResuIts and Discussion ............................................................... .............................................................................. References
Chapter 3 . MALDI-MS Cbaraeterization of MaltooligolPolysaccharides from ................................. Debranched Starcb Amylopecth of Corn and Barley
............................................................................ Introduction Materiais and Methods ............................................................... Results and Discussion ...............................................................
.............................................................................. References
Chapter 4 . Analysis of Anthocyanins in Red Wine and Fruit Juice using MALDI-MS ....................................................................................
............................................................................ introduction Materials and Methods ............................................................... Results and Discussion ...............................................................
.............................................................................. References
Chapter 5 . Cornparison between HPLC and MALDI-MS AnaIysis of Anthocyanins in Highbush Blueberries ................................... .. ...........
............................................................................ Introduction ............................................................... Materials and Methods
Resuits and Discussion ............................................................... .............................................................................. References
Chapter 6 . MALDI-MS Analysis of Food Flavonol Glycosides ........................ ............................................................................ Introduction
Materials and Methods ............................................................... Results and Discussion ...............................................................
....................................... References .......... ... .. ........................
......... Chapter 7 . MALDI-MS Quantification of Coccidiostats in Poultry Feeds 122 ............................................................................ Introduction 122
............................................................... Materials and Methods 124

Results and Discussion ............................................................... 125 References .. ............................................................................ 133
Chapter 8 . General D i s d o n and Conclusions ....................................... 136
Appendix I . Experhental design for analysis of fmctooligosaccharides &g both HPAEC-PAD and MALDI-MS (Chapter 2) ....................................... 142
Appendix II . Experimental design for analysis of anthocyanins ushg both HPLC and MALDI-MS (Cbapter 5) ....................................................... 143

List of Tables
Table 1-1
Table 1-2
Table 2-1
Table 2-2
Table 2-3
Table 4- 1
Table 4-2
Table 5- 1
Table 6- 1
Table 6-2
Table 7- 1
Summary of MALDI-MS quantifcation .................................
........................... Summary of food analyses using MALDI-MS
Performance of matrices for desorption and ionization of maltohexaose and y.cyclodextrin ...........................................
.......................... The repeatability of MALDI-MS analysis data
Fructooligosaccharide content using HPAEC-PAD and MALDI- MS ...............................................................................
Anthocyanins in Vitis vinifera L . grapes ..................................
.................................. Anthocyanins from Concord grape juice
Quantitative fragmentation of anthocyanins in MALDLMS ..........
Fragmentation and responses of flavonol glycosides in MALDI- .............................................................................. MS
MALDI-MS identification of flavonol glycosides in green tea .........
MALDI-MS quantification of coccidiostats in poultry feeds ........... 132

List of Figures
Figure 1-1 Schematic of the basic components of a linea. MALDLMS ............
Figure 1-2 Chemical structures of common MALDI-MS matrices .................
Figure 1-3 Schematic of a reflectron MALDI.MS .....................................
Figure 2- 1 Chemical structures of fructooligosaccharides. maltohexaose. and ................................................................. y-c yclodextrin
Figure 2-2 MALDI-MS positive ion spectra of y-cyclodextrin and .......................................... maltohexaose in various matrices
Figure 2-3 MALDI-MS positive ion spectnirn of inulin from lerusalem articho kes .....................................................................
Figure 2-4 MALDI-MS positive ion spectra of fructooligosaccharides from ......................................................................... shdlots
Figure 2-5 Relationship between laser strength and resolution .....................
Figure 2-6 Relationship between laser strength and analyte peak ratios ...........
Figure 2-7 Responses of individuai fructooligosaccharides in MALDI-MS ......
Figure 2-8 HPAEC-PAD chromatograrn of shailots .................................
Figure 2-9 Distribution of individual fructooligosaccharides in red onions (Y = 159.~e'"~, R~ = 0.99), shallots (Y = R' = 0.97), and
-0.14X ........................................ garlic (Y = 18.73e . R ~ = 0.99)
Figure 2- 10 HPAEC-PAD chromatograrn of carbohydrate standards ...............
Figure 3- 1 MALDI-MS spectra of standard maltooligosaccharides ...............
Figure 3-2 MALDI-MS spectrum of a debranched waxy corn starch sarnple passed through the Macro-sep and desaiting procedure ................
Figure 3-3 The trend of peak ratios of [M+K]' or w-H2û+Na]+ over w+Na]' changing with the degree of polymerization in a debranched waxy corn starch sample ................+.......................+..................

Figure 3 4 MALDI-MS spectra of the same sample as in Figure 3-2. DHB was used as the m a ~ x . The top spectrum was produced at the same Laser strength as in Figure 3-2 with the internai standard maitoheptaose (DP 7) added and the bottom spectmm, at a higher laser strength and without the interna1 standard.. .......................
Figure 3-5 MALDI-MS spectrum of debranched. Waxy Candle barley starch passed through desalting and Macro-sep procedure (top spectrum) and regular Phoenix barley starch prepared by traditional method. fteeze dried, 6.4 mg/mL in double deionized water (bottom
..................................................................... specmrn)
Figure 4- 1 MALDI-MS spectnim of standard maividin 3-glucoside.. .............
Figure 4-2 MALDI-MS natural cation spectra of anthocyanins from red wine ....................................................................... extracts.
Figure 4-3 MALDI-MS natural cation spectra of anthocyanins from ................. ........................... preparative HPLC fractions.. ..
Figure 4-4 MALDI-MS naturai cation spectrum of anthocyanins from Concord . * grape juice extracts. .........................................................
Figure 4-5 MALDI-MS naturai cation spectmm of anthocyanins from . . cranbeny juice extracts.. ....................................................
Figure 4-6 MALDEMS natural cation spectmm of anthocyanins from raspberry synip extracts .....................................................
Figure 4-7 MALDI-MS natural cation spectrum of standard individual ......................................... ...................... anthoc y anins ..
Figure 4-8 Linear responses of individual anthocyanins in MALDEMS .........
Figure 4-9 Linear MALDI-MS response of malvidin -3-glucoside (Y= 0.03 1X + 0.27, ~ ~ = 0 . 9 9 ) in Concord grape juice extracts.. ......................
Figure 4- 10 MALDI-MS naniml cation spectra of anthocyanins with and without internd standard.. .................................................
Figure 4-1 1 HPLC chromatography of standard anthocyanins in Figure 4-7.. ....
Figure 5-1 Structures of anthocyanidins.. ..............................................
Figure 5-2 W I - M S positive ion spectrum of highbush bluebeny anthocyanins (stored for 4 days) ..........................................

Figure 5-3 HPLC chromatography of anthocyanins (same sarnple as in Figure 5-2) ....................................................... .......... . . 97
Figure 5-4 Cornparison between HPLC and MALDI-MS analysis of highbush blueberry individual anthocyanins (stored for 4 days) . . . . . . . . . . . . . . . ... Comparison between HPLC and MALDI-MS anthocyanin profiles at three different stages of color development.. . . . . . . . . . . . . . . . . . . . . . . . . .
Figure 5-5
Comparison of total anthocyanin content determined by HPLC and MALDI-MS at different stages of color development.. . .. . . . . . . . . . . . . .
Figure 5-6
Figure 5-7 HPLC profile of anthocyanins in bluebemes at different stages of color development . . . . . . . . . . . . . . . . . . . . . . . . . . . . . . . . . . . . . . . . . . . . . . . . . . . . . . . . . . . .
Figure 5-8 MALDI-MS profile of anthocyanins in bluebemes at different stages of color development.. . . . . . . . . . . . . . . . . . . . . . . . . . . . . . . . . . . . . . . . . . . . ...
Figure 6- 1
Figure 6-2
Figure 6-3
Structures of flavonols.. . . . . . . . . . . . . . . . . . . . . . . . . . . . . . . . . . . . . . . . . . . . . . . . . . .. MALDI-MS positive ion spectra of flavonol glycoside standards.. ..
MALDI-MS positive ion spectrum of flavonol glycosides from green tea.. . . . . . . . . . . . . . . .. . . . . . . . . . . . . . . . .. . . . . . . . . . . . . . . . . . . . . . . . . . . . . . . . . . . ..
MALDI-MS positive ion spectra of rutin ( 1.5 x 10'~ M dissolved in 0.01 M alkali 70 % methmol) with different alkali adduct ions (Li', Na', EC+ and Cs?. . . . . . . . . . .. . . . . . . . . . . . . . . . . . . . . . . . . . . . . . . . . . . . . . . . . . . . . . . . . .
Figure 6-4
MALDI-MS negative ion spectra of flavonol gl ycoside standards.. . Figure 6-5
Figure 6-6 MALDI-MS positive ion spectra of flavonol glycosides (fiom yellow onion) after HPLC separation ...... .. . ... .. .. ... .. .. . . .. .. . ... . . ..
Figure 6-7 MALDI-TOF MS positive ion spctra of Bavonol glycosides (fiom green tea) after HPLC separation.. . . . . . . . . . . . . . . . . . . . . . . . . . . . . . . . . . . . . . . . .
Figure 7- 1
Figure 7-2
Structures of coccidiostats.. . . .. . . . . . . . . . . . . . . . . . . . . . . . . . . . . . . . . . . . . . . . . . . .. Performance of different matrices for coccidiostat standards in W I - M S . . . . . . . . . . . . . . . . . . . . . . . . .. . . . . . . . . . . . . . . . . . . . . . . . . . . . . . . . . . . . . . . . .
Figure 7-3 Ionkation of coccidios tat standards in MALDI-MS positive mode with DHB as matrix.. . . . . . . . . . . . . . . . . . . . . . . . . . . . . . . . . . . . . . . . . . . . . . . . . .. . . . . .
Figure 7-4 Stability of coccidiostats in MALDI-MS samples. .. . . . . . . . . . . . . . .. . .... 129

Figure 7-5 MALDI-MS spectra of coccidiostats from poultry feeds.. . . . . . . . . . .... 13 1

List of Abbreviations
3-AQ Cl8 DHB DP ELISA ES1 FAB FT-KR fwhm GC GF2 GF3 GF4 HABA HCCA Krc HN-APCI
HPAEC-PAD
HPLC KPLC-PCD
IDA ISD m/z MALDI MS NMR PSD RSD S N SA SDS-PAGE
THAP TOF W-Vis
3-aminoquinoline octadec y1 silane 2,Sdihydroxybenzoic acid degree of polymerization enzyme-linked immun.+îorbent assay electrospray ionization fast atom bombarhent Fourier transfonn ion cyclotron full width at half maximum gas chromatograph y 1 -kestose nys tose P-fmctofuranos yln ystose [2-(4hydroxyphenylazo)-benzoic acid] a-cyano4hydroxycinnamic acid l -hydroxyisoquinoline heated nebulizer atrnospheric pressure chernical ionization high performance anion exchange chromatography with pulsed amperometnc detection high performance liquid chromatography high performance liquid chromatography with post-column derivatization tram-3-indoleacrylic acid in-source decay mass-to-charge ratio matrix-assisted laser desorption/ionization mass spectrometry nuclear magnetic resonance post-source decay relative standard deviation signal to noise ratio sinapinic acid sodium dodecyl sulfate-polyacrylamide gel electrop horesis 2',4',6'-trih ydroxyacetophenone time-of-flight Ultraviolet-visible

Chapter 1
Introduction
Mass spectrometry is perhaps the most widely applicable of al1 the analytical
techniques available to scientists since it is capable of providing structural as well as
quantitative information about an anaiyte of interest. It is based upon the in vacuum
separation of ions, in the gas phase, according to their mass-to-charge (dz) ratio.
Sarnples may be introduced from gas, liquid or solid States. In the latter two cases
volatilization must be accomplished either pt-ior to, or accompanying ionization. Many
ionization techniques are available to produce charged species from analytes in the gas
phase and the most common are electron impact ionization and chemical ionization. In
electron impact ionization, a neutral analyte molecule is hit by accelerated electrons,
knocking free other electrons and resulting in a positively-charged ion. The ionization
can either produce intact molecular ions, which will have the same molecular weight as
the original molecule, or fragment ions (daughter ions), which correspond to a lower
mass portion of the original analyte molecule. The molecular ions and fragment ions
result in reproducible mass spectra (full ion scanning), which cm be searched through
detailed spectral libraries to determine the structure of the analyte of interest. However,
instead of scanning and obtaining a full spectmm, the mass spectrometer can be
ernployed as a detector and used simply to monitor one or more ions from the spectmm to
achieve quantification of the analyte of interest. Chemical ionization relies on the
interaction of analytes of interest with a reactive ionized reagent species. The chemical
ionization process begins when a reagent gas, such as methane, is ionized by electron
impact. The ionized reagent can react with the analytes to produce analyte ions in both
positive and negative mode. Generally chemicai ionization produces less fragmentation
than electron impact. Chemical ionization is probably one of the most common
procedures for producing ions for mass spectrometry. Both electron impact ionization and
chernical ionization are applied only to therrnally stable lower mass (4 1000) volatile
compounds, which limits their applications in some circumstances. A quadmpole mass

analyzer, with a practical m/z limit less than 2000, is often used for electron impact and
chemical ionization to determine the masses of the ions formed.
The development of desorption ionization techniques allows analysis of
nonvolatile or thermally unstable analytes. Fast atom bombardment (FAB), heated
nebulizer atmospheric pressure chemical ionization (HN-APCI). electrospray ionization
(EST), and matrix assisted laser desorption/ionization (MALDI) are the most significant
methods. In FAB, a sample is dissolved in a liquid matrix such as glycerol and then
placed on a target. In a vacuum, the target is bombarded with a fast atom beam, for
example xenon, that desorbs the analyte to produce molecular ions and Fragment ions
(Barber et al., 198 1). FAB yields minimal fragmentation and performs well for polar and
thermally-labile compounds. It is also applicable to masses up to 10000 daltons.
However, it has high chernical background or noise, with moderate sensitivity. The
heated nebulizer with atmospherk pressure chernical ionization is a robust interface for
coupling HPLC at convendonal flow rates (0.5 - 1.5 Wrnin.) to a mass spectrometer
(Homing et al., 1973; Sakairi and Karnbara, 1988). In HN-APCI, a corona discharge is
used to ionize the analyte in an atmospheric pressure region when the analyte is
introduced into the ion source using a heated capillary tube. It is typically used to analyze
molecules less than 1000 daltons using quadrupole or ion trap mass analyzers.
Electrospray ionization had a tremendous impact in the 1990's on the use of mass
spectrometry. Dole et al. (1968) were first able to bring macromolecules into the gas-
phase at atmospheric pressure by spraying a solution from the tip of an electrically
charged capillary. However, it was in 1985 that Whitehouse et al. (1985) developed
electrospray as a tnie interface for mass spectrometry. Electrospray ionization can
produce multiply-charged ions, with the number of charges tending to increase as the
molecular weight increases. Because mass spectmmeters mesure mass-to-charge ratios
rather than mass itself, it is possible for higher mass molecules to carry sufflcient
numbers of charges to fall within a mass-to-charge ratio or mass range of 2000, which
cm be determined using a quadrupole mass analyzer. ES1 can be used to analyze
molecules up to 200000 daltons. However, the technique is very sensitive to
contamiriants such as alkali metals. Both electrospray and matrix assisted laser

desorptionfionization techniques (discussed below) have contributed dramatically to the
progress in sensitivity and accessible mass range of mass spectrometry.
MATRIX-ASSISTED LASER DESORPTION/IONIZATION MASS
SPECTROMETRY
Matrix-assisted laser desorption/ionization (MALDI) mass spectrometry (MS)
was developed in the rniddle to late 1980s (Karas et al., 1985, 1987; Karas and
Hillenkamp, 1988; Tanaka et al., 1988). It is a "soft" ionization process that produces
molecular ions from large nonvolatile molecules. Therefore, it provides a tool to analyze
intact molecular ions for proteins, oligonucleotides, polysaccharides, and synthetic
polyrners, with minimal fragmentation. MALDI-MS is usually coupled to tirne-of-flight
(TOF) mass analyzers, but several applications have been demonstrated using a Fourier
transform ion cyclotron (Fï-ICR) (Buchanan and Hettich. 1993; Castoro et al., 1993),
magnetic sector analyzers (Harvey, 1996), and quadrupole ion trap mass spectrometers
(Jonscher et al., 1993; Hall et al., 1999). For this thesis the acronyrn MALDI-MS will
aiways represent MALDI TOF MS, that is the ionization technique coupled to time-of-
flight mass analysers.
MALDI-MS has advantages over other methodologies, including speed of
analysis, high sensitivity, wide applicability combined with a good toierance towards
contaminanu, and the ability to analyze complex mixtures (Karas, 1996). However,
simple MALDI-MS instruments can not tell the ciifference between isomee, which have
identical mass. The potential application of MALDI-MS allows for analysis of most
molecules. MALDI-MS analysis of any compounds consists of sample introduction,
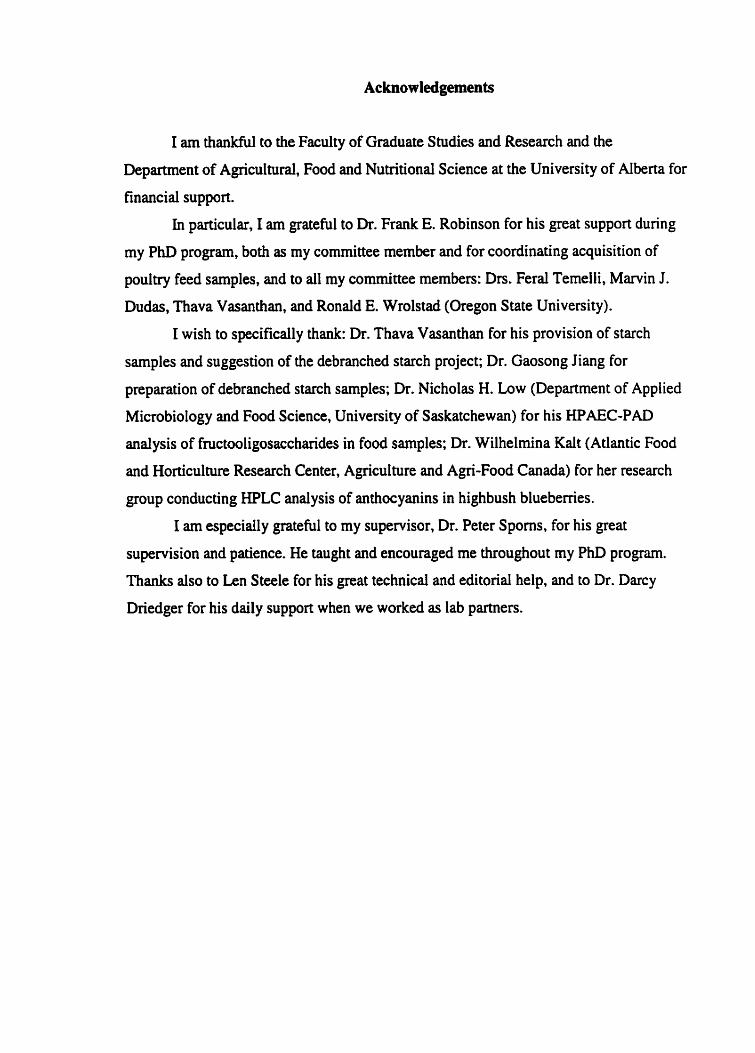
ionization, ion separation, ion detection andor data analysis. Figure 1 - 1 shows the basic
MALDI-MS components: ion source, time-of-flight mass analyzer, and detector.
A sample is placed in the MALDI-MS ion source directly after it has been
cocrystailized with ma& on a probe. A laser ionizes analytes. Using a laser as a
de~orptio~onization method for organic molecdes dates back to the 1970'~~ but al1
earlier experiments on laser desorption of organic ions were restricted to the analysis of
molecular masses below 2000 (Bahr et al., 1994; Borman, 1995). The major
breakthrough in laser desorption/ionization was achieved in 1988 when the matrix was
Desorption and Ionization Laser Beam
Iton Source Time of Flight Mass halyzer Detector
Figure 1-1. Schematic of the basic cornponents of a linear MALDI-MS.
introduced to assist the desorpion and ionization of large nonvolatile molecules to
overcorne the m a s limitation of ionizing just the analyte with the laser (Karas and
Hillenkarnp, 1988; Tanaka et al., 1988). That is, to desorb large molecules, higher laser
strength was needed for ion production and this inevitably destroyed larger molecules. A
nitrogen (N2) laser emitting at 337 nm is now almost universally employed for MALDI-
MS analysis, and is supplied as standard on al1 commercial instruments (Harvey, 1999).
The laser beam can be attenuated to reduce the strength of the initial beam. A typical
laser strength is 106 - 10' watts/crnz and occun over a probe area of only 0.01 mm2
(User's Guide to the proflexW DI, undated).
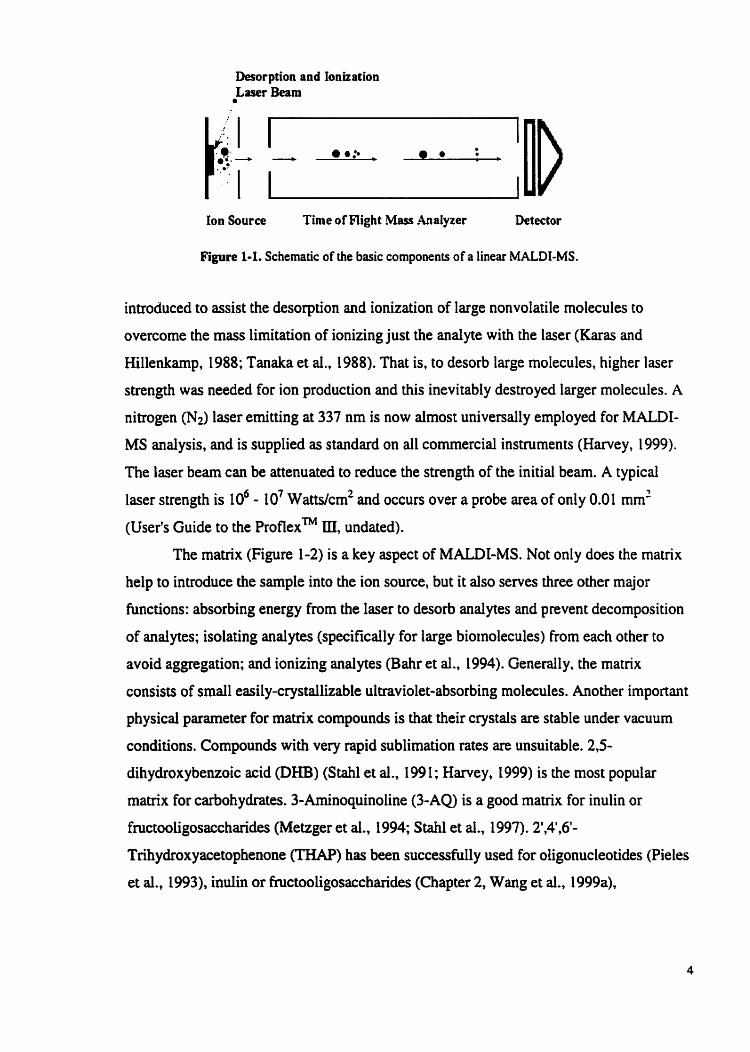
The matrix (Figure 1-2) is a key aspect of MALDI-MS. Not only does the matrix
help to introduce the sample into the ion source, but it also serves three other major
functions: absorbing energy from the laser to desorb analytes and prevent decomposition
of analpes; isolating analytes (specifically for large biotnolecules) from each other to
avoid aggregation; and ionizing analytes (Bahr et ai., 1994). Generall y, the matnx
consists of small easily-crystallizable ultraviolet-absorbing molecules. Another important
physical parameter for matrix compounds is that their crystals are stable under vacuum
conditions. Compounds with very rapid sublimation rates are unsuitable. 2,s-
dihydroxybenzoic acid (Dm) (Stahl et al., 199 1 ; Harvey, 1999) is the most popular
matrix for carbohydrates. 3-Aminoquinoline (3-AQ) is a good matrix for inulin or
fnictooligosaccharides (Meizger et al., 1994; Stahl et al., 1997). 2',4',6'-
Trihydroxyacetophenone (THAP) has been successfully used for oligonucleotides (Pieles
et al., 1993). in& or fnictooligosaccharides (Chapter 2, Wang et al., 19993,

sinapinic acid a-cyano4hydroxy cinnamic acid
Figure 1-2. Chernicd structures of comrnon MALDI-MS matrices.
giycoalkaloids (Abel1 and Spoms, 1996). anthocyanins (Chapter 4, Wang and Spoms,
1999), and flavonol glycosides (Chapter 6, Wang and Sporns, 2000). Sinapinic acid (SA)
is often used for large molecular proteins (Kussrnann et al., 1997), and a-cyan04
hydroxycinnamic acid (HCCA) is a good matrix for peptides (Kussmann et al., 1997).
Proper preparation of the matnx and sample is important to obtain good MALDI-
MS spectra. It is usually necessary to maintain a 500 or more fold molecular excess of
rnatrix to analyte. There are two cornmon methods to prepare matrix and sample, dried-
droplet and fast evaporation. For the dried-droplet method, a 5-20 mg/mL solution, which
is often a saturated solution, is prepared in either p w water or a mixture of water and
organic solvent (acetonitrile, ethanol) or a mixture of water acidified with trifluoroacetic
acid (O. 1%) and acetonitrile (2:f). The anaiyte concentration is of the order of 10" to [O*'
M. Smdl arnounts of both matrix solution and analyte solution (between 0.5 - 30 pL) are
then mixed. The mixture (1 or 2 pLJ of rnatrîx and analyte is spotted on a metal target

wheel or probe. The solvent is evaporated and the cocrystalized sample is ready for
MALDI-MS analysis (Karas and Hillenkamp, 1958; Bruker, 1995; Kussmann et al.,
1997).
Fast evaporation was developed to improve MALDI-MS resolution and
sensitivity (Vorm et al., 1994; Nicola et al., 1995). The matrix is dissolved in acetone (or
acetone containing 1-2% water or 0.1 % aqueous TFA), e.g. THAP in acetone. The matrix
solution (0.3 - 0.5 pL) is spotted on the probe first. Because of the rapid evaporation of
acetone, more homogeneous crystals are formed. Then the sarnple solution (0.5 - 1 pL) is
spotted on top of the matrix crystals. The fast evaporation method results in very good
spot-to-spot repeatability, which is important for MALDI-MS quantification (Abel1 and
Spoms, 1996; Chapter 2, Wang et al., 1999a; Driedger and Spoms, 1999% b; Chapter 4.
Wang and Spoms, 1999). Usually, the arnount of analytes, applied to MALDLMS, is in
the picornole or fentomole range (10"~ - IO-'' M). Other techniques have also been developed to improve the preparation of matrix
and sample. Nitrocellulose has been used to improve crystal homogeneity (Preston et al.,
1993; Kussmann et al., 1997). Nitrocellulose solution (5 mg/mL in methanol) was spotted
on the probe first, and then a mixture of matrix and sample was applied on top of the
nitrocellulose. Preston et al. (1993) used this method to improve homogeneity of crystals
and quantify bradykinin (a peptide) without using an intemal standard. Electrospray
deposition, traditionally used to prepare thin, uniform samples for piasma desorption and
secondary ion m a s spectrometry, has also been utilized to prepare MALDI-MS sarnples
(Hensel et ai., 1997). The small droplets formed during the electrospray process have
been found to also significantly improve the homogeneity of the sample surface.
MALDI-MS is tolerant of impurities, but signal suppression caused by
contarninants in a sample occurs through inhibition of analyte ionization in the ion source
and samples, i.e. biologicdly-derived samples, must still be isolated and purified prior to
analysis to obtain the best results. Purification removes saits and buffer components,
which may interfere with the signal during data acquisition. Some simple cleanup
procedures have been developed to remove impurities directly €rom the probe (on-probe
cleanup). Rouse and Vath (1996) used an on-probe sample cleanup method involving
placement in situ of amounts of cbromatographic media such as cation- or anion-

exchange resins ont0 a probe containing a drop of matrix and sarnple. M e r air-drying,
removal of the chromatographie media eliminated interference from salts or detergents in
the sarnples. Brockman et al. (1 997, 1998) derivatized the probe's surface with
octadecanethiol (C 18). The C 18-derivatized probe could be used as a hydrophobic solid-
phase extraction device to isolate and desalt biopolymers directly on the probe surface.
On-probe affinity or immunoaffinity is a technique that combines affinity separations
directly with MALDI-MS. In this approach, a binding molecule, such as an antibody, is
attached to the surface of a MALDI probe. This pemiits the analyte of interest to be
selectively captured and concentrated on the probe surface prior to MALDEMS analysis
(Brockman and Orlando, 1995, 1996; Liang et al., 1998).
The ionization mechanisms involved in MALDI are still largely unknown. Ions
may be pre-formed in the solid state or may be fomed in the gas phase by ion-molecule
reactions imrnediately following desorption by the laser (Harvey, 1999). The most
significant feature of MALDI ionization is the formation of singlycharged ions through
protonation, alkali adducts (sodium andor potassium), or deprotonation (Karas et al.,
2000). After analytes have been ionized, they are accelerated in the ion source by a high
voltage, typically 20 - 30 kV, to a fixed kinetic energy with variable velocity depending
on their mas. Then the ions enter a time-of-flight mass analyzer or field-free drift tube
(0.5 - 2 m, Figure 1-1). In time-of-flight (TOF), the mas-tocharge ratio (&) of an ion is
determined by measuring its flight time. An equation relating the flight time of an ion
with its m/z value can be expressed as follows:
t = a (m/z)lR+ b
where a and b are constants for a given instrument condition, and are determined
experimentally from fiight times of ions of known masses, e.g. calibrants. The flight time
of an ion is t. Ionized species, including matrix ions and analyte ions, pass the time-of-
Bight mass analyzer, with a velocity proportional to (m/z)ln. Due to their mLz dependent
velocities, ions are separated during their fight. A detector at the end of the flight tube
produces a signal for each ion species. Typical fiight times are between a few
microseconds and several hundred microseconcis.
The initial kinetic energy or velocity distribution of analytes during the
desorptiodionization process causes a poor resolution, e.g. 500 fwhm (full width at half
maximum). For ions of the same m/l, those with higher axial velocity will move m e r
from the repeller than the initially less-energetic ions. So far, two techniques have been
used to increase the resolution, delayed extraction (Colby et al., 1994; Vestal et al., 1995;
Guihaus et al., 1997) and a reflectron (Bahr et al., 1994). In delayed extraction, ions.
after desorption, are allowed to randornly distribute for hundreds of nanoseconds to
several Ncroseconds, followed by extraction of the ions into the flight tube. Dunng the
process, the closer ions are to the repeller (lower initial velocity), the more kinetic
energy, resulting in ions of the same m/l reaching the detector at the same tirne if the
delayed time is properly adjusted (Figure 1-1). Thus resolution is improved to at least
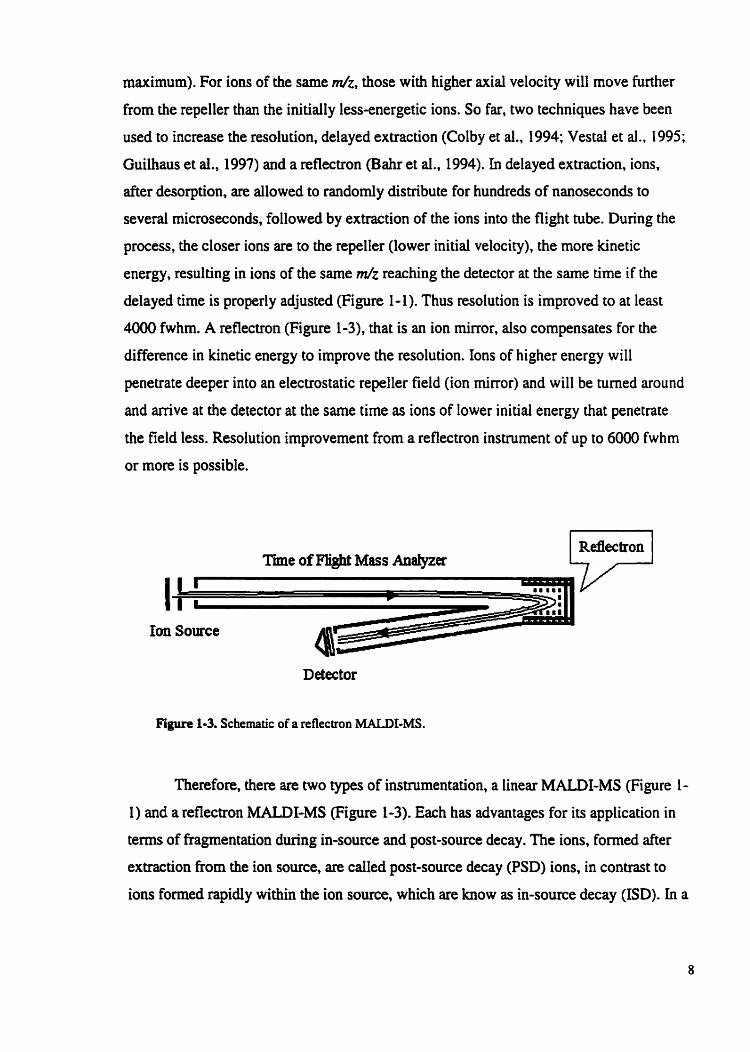
4000 fwhm. A reflectron (Figure 1-3), that is an ion mirror, also compensates for the
difference in kinetic energy to improve the resolution. Ions of higher energy will
penetrate deeper into an electrostatic repeller field (ion rnirror) and will be turned around
and arrive at the detector at the same time as ions of lower initiai energy that penetrate
the field less. Resolution improvement from a reflectron instrument of up to 6000 fwhm
or more is possible.
Tfme of Flight Mass Analyzer
I C-: Ion Source
Figure 1-3. Schematic of a reflectron MALDI-MS.
Therefore, there are two types of instrumentation, a linear MALDI-MS (Figure 1-
1) and a reflectron MALDI-MS (Figure L -3). Each has advantages for its application in
terms of fragmentation during in-source and post-source decay. The ions, formed after
extraction from the ion source, are called post-source decay (PSD) ions, in conuast to
ions formed rapidly within the ion source, which are know as in-source decay (ISD). In a

linear mode, PSD ions, such as neutral and charged fragments generated through
hgmentation of molecular ions in the field-€ree drift tube, cannot be distinguished from
the parent ions, because their velocity remains the sarne. Nevertheless, this is a great
advantage for MALDI-MS quantification because parent ions and PSD ions from the
same molecules will be observed as one single peak at the mass of the parent ions. For a
reflectron mode, PSD ions generated priot to reflection have the sarne velocity as their
parent ion, but can be separated by the reflectron. Using the reflectron mode, combining
ISD and PSD information, can be a powerfùl tool for structural or sequencing
determination of analytes that exhibit characteristic fragmentation, such as carbohydrates
and peptides (Harvey, 1999; Pfeifer et ai., 1999).
MALDI-MS QUANTIFICATION
The reasons for using MALDI-MS for quantification are related to previously
noted advantages, such as speed of analysis, ease of use, high sensitivity, toierance of
contaminants, and ability to analyze complex mixtures. It is possible to use MALDI-MS
to analyze most compounds in a sample after the analytes of interest have been extracted.
The quantification is usually achieved using a linear MALDI-MS. MALDI-MS is known
for its poor reproducibility, which means that for a series of MALDI-MS sarnples
prepared under identical conditions, the analyte signal intensity or peak height intensity is
remarkably variable. This variable analyte signal intensity or peak height intensity is
related to the matrix used, the number of laser shots acquired, the laser strength
attenuation, and spot-to-spot or sarnple-to-sarnple desorption. Therefore, key concems for
MALDI-MS quantification include the selection of matrices, preparation of matrix and
sample, and the use of an intemal standard. Significant MALDI-MS quantitative studies
are sumrnarized in Table 1 - 1.
MALDI-MS Quantification. Three strategies have been employed for MALDI-
MS quantification: using an intemal standard; using standard addition rnethod; and
without using any standard. Since 1993, there have been investigations into the
quantitative aspects of MALDI-MS using pure carbohydrate or protein standards as
samples. Abel1 and Spoms (1996) first used MALDI-MS to quanti@ glycoalkaloids in

Table 1-1. Summary of MALDI-MS Quantification Analytes methods of quantification ref e re nces Benzoyiecgonine (a cocaine intemal standard: deuterated Hall et al., metabolite f o m human urine) benzoylecgonine 1999 Sulfatide (acidic intemal standard: hydrogenated Sugiyama et - -
glycosphingolipid) lysosuifatide al., 1999 Polyunsaturated diacylglycerols intemal standard: polyunsaturated Benard et al.,
. - .
diacvla lvcerols 1999 - - - C haconine, solanine interna1 standard: tomatine (glycoalkaloid) Driedger and - -
(glycoalkaloid) Sporns, 1999b Chaconine, solanine intemal standard: tornatine (glycoalkaloid) Driedger and (glycoalkaloid) Spoms, 1999a Debranched starch standard addition: maltoheptaose (DP7) Wang et ai.,
1 999b Anthocyanins intemal standard: cyanidin 3-rutinoside Chapter 4,
(anthocyanin) Wang and Spoms, 1999
Fructooligosaccharides standard addition: p- Chapter 2, fructofuranosylnystose (DP 5) Wang et al.,
1999a Maltooligosaccharides intemal standard: N-acetylgalactosamine Kazmaier et
al., 1998 Dinoterb (pesticide) intemal standard: dinitrophenol Benazouz et
al., 1998 Aminotriazole (pesticide) without intemal standard Sulfonamide (antibiotics) intemal standard: acetarninophen Ling et al.,
1998 Avenins without intemal standard Camafeita and
Mendez, 1998 bovine insulin interna1 standard: des-pentapeptide Wilkinson et
human insulin al., 1997 Gliadins without intemal standard Carnafeita et
al., 1997b Gliadins without intemal standard Camafeita et
al., 1997a Cocaine hydrochloride interna1 standard: cocaine-da (a Nicola et al.,
deuterated analog of cocaine) 1996 21 -base oligonucleotide (m/z intemal standard: 36-base Bruenner 1996 6361) oligonucIeotide ( d z 1 1 131 ) Chaconine, solanine intemal standard: tomatine (glycoalkaloid) Abell and (g l ycoalkaloid) Spoms, 1996 Permethylated cyclodextrins intemal standard: permethylated Bartsch et al.,
cyclodextrin 1996 B-cyclodextrin intemal standard: maltohexaose
Cyclosporin A (dz1202.2, intemal standard: cyclosporin D (mlz Gusev et al., oligopeptide) 121 6.2) 1996 bovine insulin ( d z 5733.5) intemal standard: human Arg-insulin (Mz
5963.8) bovine insulin ( d z 5733.5) intemal standard: cytochrome C (Mz
12384)

Angiotensin II intemal standard: 1 4AR-8-lle Nicola et al., angiotensin II 1995
Peptides/proteins in rnass range intemal standard: peptides/proteins in Jespersen et 1000-1 2000 mass range 1000-1 2000 al., 1995
Cytochrome C internai standard: myog lobin Nelson and McLean, 1994
Lactofemn intemal standard: human serum albumin 3,4-dihydroxyphenylalanine intemal standard: ["ce] labeled 3,4- Duncan et al.,
di hydroxyp henylalanine 1993
Acetyicholine intemal standard: f ~ ~ d labeled acetyicholine
H-Ser-Ala-Leu-Arg-His-Tyr-NH2 intemal standard: Ac-Ser-lle-Arg-His-Tyr- NH2
bovine insuiin intemal standard: cytochrome C or Gusev et al., bovine insulin chain B 1993
B radykin in without intemal standard Preston et al., 1993
Lysozyme, myoglogin intemal standard: cytochrome C Tang et al., 1993
3 or 4 base (mer) nucleotide internal standard: 2 base (mer) nucleotide Oligosaccharide NA2 intemal standard: fucosylated Harvey, 1993
oligosaccharide NA2 Oligosaccharide NA2 without internai standard
crude food samples. A few eatlier studies (Harvey, 1993; Tang et ai., 1993; Preston et al.,
1993) reported good correlation between andyte signal and concentration, but the linear
response was significantly influenced by the laser strength, matrix, and the preparation of
the matrix and sample. Generally, an internai standard was required to overcome this
problem. Samples were spiked with known arnounts of a molecule, which was sirnilar to
the andyte molecule (internai standard method); it was a structural analogue, or the sarne
molecule, such as a stable isotope-labeled form (for instance with "C or 'H) (Duncan et
al., 1993). The intemal standard should also be able to mimic the behavior of the analyte
at al1 stages of sample preparation, desorption, and ionization. and give a sirnilar response
in MALDI-MS as the analyte. In theory, a stable isotope-labeled form (having the same
chernicd properties but distinguishable mass) of the same molecule would be the best
intemal standard. h n c a n et al. (1993) first used isotope-labeled internai standards in
MALDI-MS quantification. The analyte and its isotope-labeled f o m showed similar
response and good ünearity was achieved. but this method is likely only practicai in the
lower-mass region (below m+z 200) due to the cost of making large isotope-labeled
molecules (Duncan et al., 1993). Therefore, using a stnictural analogue as an intemal

standard is often a more simple and cheaper approach. For exarnple, when quantifying
oügosaccharide NA2, its fucosylated analogue was used as an intemal standard (Harvey,
1993). Ac-Ser-ne-Arg-His-Tyr-NH2 was used as an interna1 standard for quantification of
the peptide H-Ser-Na-Leu-Arg-Es-Tyr-NH2 (Duncan et al., 1993). in fact, a structural
analogue does not always give the sarne response as the analyte. The response of y-
cyclodextrin was only one twentieth the response of 2,3,6-tri-O-methyl-yçcyclodexuin
(Sporns and Wang, 1998) and was half the response of fructooligosaccharides (Chapter 2,
Wang et al., 1999a). Gusev et al. (1993) investigated the use of an intemal standard
having chemical properties different from the analyte. For example, cytochrome C was
used as an intemal standard to anaiyze bovine insulin, and good linearity was achieved.
However, Gusev et ai. (1996) also indicated that the different chemical properties of the
internai standard and anaiyte led to discrimination in the analytelintemal standard
intensity ratios and might be caused by the changing of the analytelmatrix ratio or
competition of analyte and internai standard with the matrix. If the concentration of the
internai standard was kept constant and close to the highest analyte concentration,
quantification was possible. In general, for a single analyte, a structural analogue has
usually been chosen as the internai standard (Table 1 - 1).
However, an ideai intemal standard is not always available. Specifically, when
MALDI-MS is used to analyze a group of analytes or polymen in a mixture, effects
between analytes, the internai standard, or the sample environment become complicated.
Different responses of analytes and their internai standards may cause poor
reproducibility for MALDI-MS quantification. One good exarnple is the use of y-
cyclodextrin standard addition to quantify fructooligosaccharides in food extracts
(Chapter 2, Wang et ai., 1999a). Although the response of y~yclodextrin (intemal
standard) was consistent for pure standard fnictooligosaccharides, its response changed in
crude food extracts. Food extracts from red onions, for example, completely suppressed
the production of ions from added y-cyclodextrin. Therefore, a standard addition method
was developed to quant@ analytes in a mixture using MALDI-MS (Chapter 2, Wang et
al., 1999a). A standard added is usualIy one of the analytes. The peak height increase is
proportional to the amount of the standard added to the sarnple. Based on the increased
peak height, the amount of other analytes cm be calculated. The prerequisite or

assurnption is that d l analytes have the same responses as that of the standard added.
Standard addition has the advantage to quantify a complex analyte mixture, for example
oligosaccharides, but the analysis time is doubled.
Although it showed poor spot-to-spot repeatability, MALDI-MS is still often used
to quanti@ analpes without using an intemal standard. Camafeita et al. (1997% 1997b)
used MALDI-MS to quantify gliadins (about m/t 3 1 D a ) and extended the method to
quantify avenins ( d z 18-33 kDa) for screening gluten in the diet of coeliac patients
(Camafeita and Mendez, 1998). In these studies, absolute peak intensities or areas were
used to plot a standard curve. It seemed that good linemity (R' not reported) was
achieved in the range of 0.4 - 1.0 mg/100 g, with a detection lirnit 0.4 mg1100 g of food,
which permitted the andysis of gluten-free foods below the toxic threshold (5 mgllûû g,
Camafeita et al., 1997b). Furthemore, MALDI-MS results were well conelated to those
of high sensitive ELISA (enzyme-linked immunosorbent assay) (Camafeita et al., 1997b).
This indicates that MALDI-MS quantification without intemal standard is feasible, and
may apply to higher mass molecules if sufficient laser shots are collected.
In addition, quantification can also be achieved in MALDI-MS negative mode
using an intemal standard when analytes of interest are easily ionized through
deprotonation to form negative ions. Sulfatide is one type of acidic glycosphingolipid,
and MALDI-MS negative mode provided a sensitive, convenient, reliable technique to
quantifi sulfatide in serum, with linearity between 2 pmol and 1 nmol (Sugiyarna et al.,
1999).
Other Coasiderations. The selection of matrices is very important for MALDI-
MS quantification of any anaiyte. The sensitivity of MALDI-MS for any anal yte is matrix
related. The selected mahix also needs to be applicable to cmde sample extracts. Several
matrices could produce flavonol glycoside ions From pure standards. Only 2',4',6'-
trihydroxyacetophenone (THAP) worked for crude tlavonol giycoside extracts (Chapter
6, Wang and Sporns, 2000). The response of a mixture of anaiytes in a sample in
MALDI-MS is another key concern. First, for a group of chemicall y similar anal ytes,
their responses with changing concentration should be Lineu. Secondly, ail analytes in a
mixture shodd show s i d a responses with addition of any single anaiyte for
quantification (Chapter 2, Wang et ai., 1999a; Chapter 3, Wang et al., 1999b).

Fragmentation of analytes in the ion source provides strucnual information but causes a
problem for quantification. Fragment ions may overlap other molecular ions. Often
fragmentation can be consistent, predictable and therefore quantitatively determined
(Chapter 6, Wang and Spoms, 2000; Chapter 5, Wang et al., 2000).
Repeatabüity of MALDI-MS quantification. Driedger and Sporns (1999a)
reported the repeatability of MALDI-MS quantification on two glycoalkaloids, chaconine
and solanine. The sarne potato sarnple was analyzed in triplicate on seven separate days
over a 4-month period. The relative standard deviations of triplicate measurements
ranged from 1 to 16%. with an average of 9%. The day-to-day relative standard deviation
for replicate determinations was 10% for chaconine and 12% for solanine. Recoveries of
spiked samples were within 5% of their expected values. These results indicated that
MALDI-MS is a reliable technique for quantification and can serve for routine analysis.
MALDI-MS in FOOD ANALYSES
Theoretically, MALDI-MS has the ability to analyze most molecules in a food
matrix, yet it is even more applicable than competing techniques for nonvolatile
compounds. Usually, MALDI-MS is used for determination of masses between 500 and
300,000. In practice the upper mass lirnit is about at m/Z 1.5 x 10⁶ (Schriemer and Li,
1996). Low mass determinations are also possible. For example, dz at 84, aminotriazole.
a pesticide (possible contaminant of water) was determined by Benazouz et al (1998). A
summary of MALDI-MS food analyses is presented in Table 1-2. The compounds
analyzed in various foods include carbohydrates, proteins, peptides, lipids, bacterial
extracts, antioxidants or polyphenols, steroidal glycosides, pesticides, and many others.
Since 1995, MALDI-MS has been used to analyze complex food matrices (Table 1-2).
Most of the food analysis applications are in the area of protein or peptide analyses. The
contribution of MALDI-MS to food analyses is significant and is discussed below.
Accessing High Moledar Weight Compounds. MALDI-MS allows for
analysis of higher mass compounds in foods. High molecular weight wheat glutenin
subunits, wheat gliadin, barley hordeins, rye secaliris, and oat avenins are groups of high
molecular weight proteins, which have masses of m/z 20000 to 90000. Analyses of these

Table 1-2. Summary of Food Analyses using MALDI-MS Grouo s~ecifics references -. . - -r
Bacte ria fingerprints and biomarkers of E. coli and B. Jarman et al., atrophaeus 1999 fingerprints matching of E. colistrains Amold and
Reilly, 1998 fingerprints and biomarkers of Enterobactedaceae Lynn et al., 1999
fingerpnnts and biomarkers of E. coliand B. Saenz et al., atruphaeus 1999
Bacte riocin identification of product formed by reaction of nisin Rose et al., and glutathione- 1999b - identification of bacteriocin from Lactococcus lacïr's Lee et al., 1999a detection of bacteriocins frorn culture supematants Rose et al.,
1999a G lycoal kaloid quantification of potato glycoalkaloids Driedger and
Soorns. 1999a - - -. - - - -
quantification of potato glycoalkaloids Driedger and
quantification of potato glycoalkaloids Abell and Spoms, 1996
Lipids structural elucidation of fruit juice carotenol fatty acid Wingerath et al., esters and carotenoids 1996 triacyglycerol profile of flaxseed, walnut, sesarne, Ayorinde et al., grapeseed, and hazelnut oils 1999a triacyglycerol profile of cod liver oil Ayorinde et al.,
. -
1999b triacyglycerol profile of canola, castor, and olive oils Ayorinde et al.,
1999c triacyglycerol profile of olive oil and onion seeds Asbury et al.,
1999 quantification of saturated and polyunsaturated Benard et al., diacyîglycerols 1999
Maillard reaction identification of melanoidin-like Maillard polyrners or Tressl et al., reaction 1 998a identification of melanoidin-like Maillard polymers or Tressl et al., reaction 1 998b mass determination of protein glycosytation Kim et al,, 1997 products
Naringin identification of maItosylnaringin in citrus fruits Lee et al., 1999b Oligosaccharides quantification of fructooligosaccharides in onions, Chapter 2,
shallots and gariic Wang et al., 1999a
mass distribution of fructooligosaccharides in gariic Losso and Nakai, 1997
quantification aspects of rnaitooligo/polysaccharides Chapter 3, from corn and bariey debmnched starch Wang et al,,
1999b structural and bmching pattern determination of Vinogradov and ol iao~acch~des from beer Bock, 1998

size distribution of oligosaccharides from enzymatic Chmelik et al., hydrolysis of barley starc h 1998 structural characterization of cinnamoyl- Lequart et al., oligosaccharides 1999 size distribution of fnictans Stahl et al., 1997
Anthocyanins identification and quantification of anthocyanins in Chapter 4, red wine and fruits juice Wang and
Sporns, 1999 identification of catechin oligorners (condensed Ohnishi- tannins) in apples Kameyama et
al., 1997 identification of anthocyanins in grape skins Sugui et al.,
1999 analysis of 3-deoxyanthocyanidins and Sugui et al., anthocyanins present in crude extracts from 1998 sorghÜm plant tissue
Flavonols qualitative and quantitative aspects of flavonol Chapter 6, glycosides in tea and onion Wang and
Sporns, 2000 Proteins or peptides cheese flavor peptides identified and sequenced Gouldsworthy et
al.. 1996 -. . . . - - -
mass of lysyl oxidase (a cuproenzyme) in chick Ruker et al., - - tendons 1999 mass of patatin and identification of protease Pots et al., 1999 inhibitors in ~otatoes mass of novel cysteine protease D3-alpha and beta Asano et al., in germinating soybean cotyledons 1999 maçs of alkylated and unalkylated subunits in wheat Masci et al., - mass changes of the chymotrypsin derivatives RaweI et al.,
1998 identification of 60% (vh) aqueous ethanol soluble Sotell et al., proteins or gluten in food samples 1998 identification of gluten avenins in foods Camafeita and
Mendez, 1998 selective identification of qliadins, hordeins, scalins, Camafeita et al., - and avenins in food 1998 identification of allergens, lysozyme and ovomucoid Besler et al., in egg white 1998 mass detemination of beta-primeverosidase for ljima et al., 1998 black tea processing mass determination of deglycosylated ovomucoid Besler et al., - - -
(allgergen in egg white) 1997 quantification of gliadins in food Carnafeita et al.,
1997a mass determination of glutaredoxin Sha et al., 1997 (thioltransferase, catalyst of thio/disulfide exchange reaction) in rice identification of gliadins in food Camafeîta et al.,
1997b mass detemination of glutenin subunits Hickrnan et al.,
1995

mass of a heparin-binding peptide derived from Shimazaki et al., bovine lactofenin 1998 determination of the changes of milk protein profite Fedele et al., in yogurt piiiduction 1999 milk protein composition screening or quality control Catinella et al.,
1996 identification of high molecular weight glutenin Garouo et al., subunits from wheat 1999 identification of wheat varieties Bloch et al.,
1999 protein profiles of infant formulae Sabbadin et al.,
1999 mass deterrnination of high molecular weight Hickman et al., subunits of rrlutenin 1995 - protein profiles of water buffato mozzarella cheese Angeletti et al., in quality control 1998 protein profiles of ewe cheese in quality control Fanton et al.,
1998 protein profiles of hurnan milk Catinella et al.,
1999 Pesticides quantitative study of four pesticides, aldicarb, Benazouz et al.,
aminotriazole, dkoterb, and ioxynil 1998
proteins are of significance, for example for wheat variety identification, wheat quality
assessrnent, and gluten screening for coeliac disease. Traditionally, these proteins were
anaiyzed by using SDS-PAGE or ELISA. The molecular weight determined using SDS-
PAGE is commonly assumed to be within 5-IO%, which is very inaccurate. ELISA
antibodies can recognize mainly wheat gliadins, rye secalins. and to a much lesser extent
barley hordeins, but they fail to detect avenins (Camafeita and Mendez, 1998). However.
MALDI-MS provides a powefil tool to accurately analyze ail these different high
molecular weight proteins in foods. Applications of MALDI-MS on gluten proteins have
been successfully established (Hickman et al., 1995; Mendez et al., 1995; Camafeita et
al., 1997a, i997b, 1998; Camafeita and Mendez, 1998; Sorel1 et al., 1998; Bloch et al.,
1999; Garozzo et ai., 1999).
Providing Authentic Figerprints. MALDI-MS has the ability to analyze a
complex mixture in a few minutes. The acquired MALDI-MS spectra provide authentic
fingerprints of the samples of interest. The MALDI-MS fingerprints or biomarkers of
bacteria, such as E. coli, have demonstrated this approach as a practical technique for
rapid bacterial identification in the ara of food safety. Assignment of specific
biomarkers for several bacteria has also been reported (Arnold and ReiiIy, 1998; Saenz et

al., 1999; Jarman et al., 1999; Lynn et ai., 1999). The pnnciple behind the fingerprints or
biomarkers is that, approximately, 50% of the bacterial ce11 is protein. MALDI-MS is
ideal for the detection of high and low molecular proteins, i.e. bacterial proteins at m/Z
2000 - 20000. MALDI-MS, with automated statistics-based data analysis algorithms
(Arnold and Reilly, 1998; Jarman et al., 1999) or with an intemet-accessible protein
database (Demirev et al., 1999), showed good spot-to-spot and sample-to-sample
repeatability for the acquisition of fingerprints. The accuracy and speed of MALDI-MS
data make it a potentially important tool for screening food-borne pathogens.
Fingerprints can aiso serve as a tool for quality control. MALDI-MS has
demonstrated its applicability in quality control or fraudulence in water buffalo
mozzarella and ewe cheese (Angeletti et al., 1998; Fanton et ai., 1998). MALDI-MS
could generate fingerprints for bovine, buffalo, and ewe milk or cheese, thus venfying
their authenticity. Other potential applications of MALDI-MS fingerprints have been
reported. Anthocyanin profiles of various fruit juices. red wines, and grapes, and flavonol
glycoside profiles of tea and onion have been reponed and might also serve for quality
control (Sugui et al., 1999; Chapter 4, Wang and Sporns, 1999; Chapter 6. Wang and
Spoms, 2000).
Aigh Sensitivity for Oiigosaccharides. There are two cornpetitive techniques for
analysis of oligosaccharides, high performance anion exchange chromatography
(HPAEC) with pulsed arnperornetric detection (PAD) and MALDI-MS. Stahl et al.
(1997) used HPAEC-PAD to resolve inulin with a degree of polyrnerization (DP) of
approximately 70 single sugar units, but sensitivity and resolution decreased with
increasing of DP. Wong and Jane (1997) used HPAEC-PAD and post-column enzyrnatic
pad to convert debranched starch into glucose before detection to increase the sensitivity
of HPAEC-PAD, and a tesolution of DP 80 was achieved. However, Mohr et al. ( 1995)
showed the potential of using MALDI-MS to resolve carbohydrates (dextran 40 kDa) of
DP 100 or more. MALDI-MS showed higher or more constant sensitivity towards higher
DP oligosaccharides than HPAEC-PAD (Kazmaier et al., 1998; Chapter 2, Wang et al.,
1999a). MALDI-MS has been used to analyze hctooligosaccharides in onions, shallot,
garlic (Stahl et al., 1997; Losso and Nakai, 1997; Chapter 2, Wang et al., 1999a),
debranched starch in corn and barley (Chmelik et al., 1998; Chapter 3, Wang et al.,

1999b), and the branching pattern of oligosaccharides in beer (Vinogradov and Bock,
1998). It is believed that MALDI-MS can provide quantitative information for
oligosaccharides with different DP in foods (Chapter 2, Wang et al., 1999a; Chapter 3,
Wang et ai., 1999b).
Applicabiiity to Non-polar or Thermally Labiie Molecules. One charac teris tic
feature of MALDI-MS is high quasimolecular or intact ion yield with little or no
fragmentation (Karas et al., 1987; Karas and Hillenkarnp, 1988). As stated earlier, the
rnatrix is believed to function to prevent decomposition of the analytes of interest by the
laser. This is of significance for analysis of labile molecules in foods. For exarnple,
MALDI-MS has been successfull y used to and yze intact triac y lgl ycerols of
polyunsaturated fatty acids in canola, castor, olive (Ayorinde et al., 1999a), flaxseed,
wainut, sesarne, grapeseed, hazelnut (Ayorinde et al., 1999b), and cod liver oils
(Ayorinde et al., 1999c), and phospholipids in soybean and egg yolk (Schiller et al.,
1999). MALDI-MS has the power to differentiate these intact lipids. Sixty-four
triacylglycerols have been assigned in cod liver oils using MALDEMS (Ayorinde et al.,
1999~). Traditional gas chromatographic (GC) analysis is impractical for analysis of the
non-volatile triacylglycerols and phospholipids unless they are saponified and the fatty
acids Iiberated are further esterified to f o m volatile fatty acid methyl esters. HPLC,
coupled with desorption chernical ionization or electrospray ionization mass
spectrometry, has also been used to characterize these lipids, but the analyticd protocols
are tedious and time consuming, with cornplex instrumentation, and requiring specialized
chromatographic columns (Ayorinde et al., 1999b. 1999~).
Another exarnple for MALDI-MS detemination of labile molecules is anaiysis of
carotenoids and their fatty acid esters. Carotenoids and their fatty acid esters are complex
non-volatile but thermally labile compounds, which makes them hard to analyze using
other techniques. MALDI-MS provided both molecular ions and fragment ions of
carotenoids and their fatty acid esters, from which structural information was easily
obtained, with high sensitivity (Kaufman et al., 1996; Wingerath et al., 1996).
Tolerance of Impurity and High Speed Analysis. MALDI-MS is a technique
showing high tolerance towards contaminanis since crude sample extracts can be
determined by MALDI-MS directly without purification. This may be due to the

selectivity of the matrix for certain analytes. When cmde methanol/water (1: 1) extract of
potato was applied to MALDI-MS, only glycoaikaloids were detected in this cmde
complex extract mixture using THAP as matrix (Abell and Spoms, 1996; Driedger and
Sporns, 1999% 199%). Fructooligosaccharides, in onions, shallots, and garlic, could be
determined when hot water cmde extracts were spotted directly for MALDI-MS analysis
without any purification, using THAP as matrix (Chapter 2, Wang et al., 1999a). Since
foods contain many compounds, partial purification is sometimes necessary. Solid-phase-
extraction has demonstrated its importance in preparation for MALDI-MS food analysis.
After extraction using a Sep-pak C 18 cartridge, anthocyanins and flavonol glycosides
were successfully analyzed using MALDI-MS (Chapter 4, Wang and Sporns, 1999;
Chapter 6, Wang and Spoms, 2000).
The speed of MALDI-MS is also attractive to food scientists for routine analysis.
The analysis or MALDI-MS run time depends on the number of laser shots collected.
One hundred laser shots require about 1 minute to collect, and normally around 200 laser
shots are collected for one spectrum. For tripiicate analysis of glycoaikaloids, MALDI-
MS used 20 rninlsample, while 2 hrlsample was required for HPLC analysis (Abell and
Spoms, 1996).
Other Applications. MALDI-MS cm readily detect the mass change of a
molecule. It can monitor chernical reactions in foods, such as interactions of a-
chyrnotrypsin (a serine protease) with benzyl isothiocyanate (Rawel et al., 1998), nisin (a
bacteriocin) with glutathione (Rose et al., 1999b), or the Maillard reaction (Kim et al.,
1997; Tressl et al., 1998a, 1998b).
THESIS OBJECTIVES
The overall objectives of this thesis were to explore MALDI-MS applicability in
food science. Food and feed compounds examined included fructooligosaccharides,
debranched starch, anthocyanins, flavonol glycosides, and coccidiostats. Standards of
each group of compounds were used to mode1 analytes, to study their performances in
MALDI-MS, including ionization and fragmentation, and to determine response factors
(in a mixture) for quantification. Methodologies were developed to quantify these

compounds in food and feed samples using MALDI-MS. For each group of compounds,
the research objectives were:
MALDI-MS of Oügosaccharides. To select proper matrices for
Fnictooligosaccharides and maltooligosaccharide or debranched starch; to study their
responses in MALDI-MS; to compare HPAEC-PAD and MALDI-MS quantitative
analysis results of fructooligosaccharides in food sarnples (Chapter 2 and 3).
MALDI-MS Quantification of Anthocyanins. To study the responses of the
monoglycosides and diglycosides in MALDI-MS; to analyze anthocyanins from various
food sources using MALDI-MS; to define quantitative fragmentation of anthocyanins in
MALDI-MS; to compare HPLC and MALDI-MS quantitative analysis results of
anthocyanins in highbush blue bemes (Chapter 4 and 5).
MALDI-MS Analysis of Flavonol Glycosides. To understand the performance
of flavonol glycosides in MALDI-MS both positive and negative mode: to study the
responses and fragmentation of flavonol glycosides, i.e. kaempferol and quercetin
glycosides, in MALDI-MS; to analyze flavonol glycosides in food sarnples (Chapter 6).
MALDI-MS Quanafi~cation of Coccidiostats. To select a proper matrix for
lasalocid, monensin, salinomycin and narasin; to develop a methodology to quantify
these coccidiostats with simple sample preparation; to study the limit of detection for
lasalocid. monensin, salinomycin or narasin using MALDI-MS (Chapter 7).
REFERENCES
Abell, D. C.; Spoms, P. Rapid quantitation of potato glycoalkaioids by matrix-
assisted laser desorptionhonization time-of-flight mass spectrometry. J. Agric. Fwd
Chem. 1996,44,2292-2296.
Angeleni, R.; Gioacchini, A. M.; Seraglia, R.; Piro, R.; Traldi, P. The potential of
matrix-assisted laser desorptionlionization mass spectrometry in the quality control of
water buffalo mozzarella cheese. J. Mas3 Spectrom. 1998,33,525-53 1.
Arnold, R. I.; Reilly, 5. P. Fingerprint matching of E. coli strains with matrix-
assisted laser desorptionlionization time-of-flight mass spectrometry of whole cells using
a modified correlation approach. Rapid Commun. Mass Spectrom. 1998,12,630-636.

Asano, M.; Suzuki, S.; Kawai, M.: Miwa, T.; Shibai, H. Characterization of novel
cysteine proteases From germinating cotyledons of soybean [Glycine max (L.) Memll]. J.
Biochem. 1999,126,296-30 1.
Asbury, G. R.; Al Saad K.; Siems, W. F.; Hannan, R. M.; Hill, H. H. Analysis of
tnacylglycerols and whole oils by matrix-assisted laser desorptiodionization time of
flight mass spectrometry. J. A m Soc. Mass Spectrorn. 1999, 10,983-99 1.
Ayorinde, F. O.; Elhilo, E.; Hlongwane, C. Matrix-assisted laser
desorption/ionization time-of-flight mass spectrometry of canola, castor and olive oils.
Rapid Commun. Mass Spectrom. 1999a, 13,737-739.
Ayorinde, F. O.; Enbo, B. E.; Balan, K. V.; Johnson, J.H.; Wan, L.W.
Determination of major triacylglycerol components of polyunsaturated specialty oils
using matrix-assisted laser desorption ionization time-of-flight mass spectrometry. Rapid
Commun. Mass Spectrom. 1999b, 13,937-942.
Ayorinde, F. O.; Keith, Q. L.; Wan, L. W. Mauix-assisted laser
desorptiodionization time-of-flight mass spectrometry of cod liver oil and the effect of
analyte/matrix concentration on signal intensities. Rapid Commun. Mass Spectrom.
1999~, 1 3, 1762- 1769.
Bahr, U.; Karas, M.; Hillenkamp, F. Analysis of biopolyrners by matrix assisted
laser desorption/ionization (MALDI) mass spectrometry. Fresenius J. Anal. Chem. 1994,
348,783-79 I . Barber, M.; Bordoli, R. S.; Sedgewick, R. D. Fast atom bombardment of solids
(F.A.B.): A new ion source for mass spectrometry. J. Chem. Soc. D Chem. Commun.
1981,7,325-327.
Bartsch, H.; Konig, W. A.; Strassner, M.; Hintze, U. Quantitative determination
of native and methylated cyclodextrins by matrix-assisted laser desorptiodionization
time-of-flight mass spectrometry. Carbohydr. Chem. 1996,286,41-53.
Benard, S.; Amhold, J.; Lehnert, M.; Schiller, J.; Arnold, K. Experiments towards
quantification of saturated and polyunsaturated diacylglycerols by matrix-assisted laser
desorption and ionization time-of-tlight mass spectrometry. Chem. Phys. L. 1999, 100,
115-125.

Benazouz, M.; Hakim, B.; Debrun, J. L. Study of laser desorption/ionization tirne-
of-flight mass spectrometry for the analysis of pesticides. Rapid Commun. Mass
Spectrom. 1998, 12, 10 18- 1020.
Besler, M.; Steinhart, H.; Paschke, A. Ailergenicity of hen's egg-white proteins:
IgE binding of native and deglycosylated ovomucoid. Food Agric. Zmmunol. 1997,9,
277-288.
Besler, M.; Steinhart, H.; Paschke, A. hunological charactenzation of egg
white allergens collected by capillary electrophoresis. Food Agric. Immunol. 1998, 10,
157- 160.
Bloch, H. A.; Kesmir, C.; Petersen, M.; Jacobsen, S.; Sondergaard, I.
Identification of wheat varieties using matrix-assisted laser desorptiodionization time-of-
flight mass spectrometry and an artificial neural network. Rapid Commun. Mass
Spectrom. 1999, 13, 1535-1 539.
Borman, S. Biochemical applications of mass spectrometry take flight. Chem.
Eng. News. 1995,23-32.
Brochan, A. H.; Dodd, B. S.; Orlando, N. A desalting approach for MALDI-MS
using on-probe hydrophobic self-assembled monolayers. Anal. Chem. 1997,69,47 1 6-
4720.
Brockman, A. H.; Orlando, R. New immobilization chemistry for probe affinity
m a s spectrometry. Rapid Commun. Mass Spectrom. 1996,10, 1688- 1692.
Brochan, A. H.; Orlando, R. Probe immobilized affinity chrornatography mass
spectrometry. Anal. Chem. 1995,67,458 1-685.
Brockman, A. H.; Shah, N . N.; Orlando, R. Optirnization of a hydrophobic solid-
phase extraction interface for matrix-assisted laser desorptiodionization. J. Mass
Spectrom. 1998,33, 1 141- 1 147.
Bnienner, B. A.; Yip, T . T.; Hutchens, T. W. Quantitative analysis of
oligonucleotides by mauix-assisted laser desorption/ionization mass spectrometry. Rapid
Commun. Mass Spectrom. 1996, IO, 1797- 180 1.
Bruker. MALDI-TOF Mass Spectrometer. User's Guide to the proflexTM , 1995.
Buchanan, M. V.; Hettich, R. L. Fourier transform mass spectrometry of high
mass biomoIecuIes. Anal. Chem. 1993,65,245A-259A.
Camafeita, E.; Alfonso, P.; Acevedo, B.; Mendez, E. Sample preparation
optimization for the anaiysis of gliadins in food by matrix-assisted laser
desorptiodionization time-of-flight mass spectrometry. J. Mass Spectrom. 1997a, 32,
444-449.
Carnafeita, E.; Alfonso, P.; Mothes, T.; Mendez, E. Matrix-assisted laser
desorptiodionization time-of-flight mass spectromeûic micro-analysis: The fmt non-
immunologicai alternative attempt to quantify gluten gliadins in food samples. J. Mass
Spectrom. 1997b, 32,940-947.
Camafeita, E.; Mendez, E. Screening of gluten avenins in foods by matnx-
assisted laser desorptionlionization time-of-flight mass spectrometry. J. Mass Spectrom.
1998,33, 1023-1028.
Camafeita, E.; Solis, J.; Alfonso. P.; Lopez. J. A.; Sorell, L.; Mendez, E. Selective
identification by matrix-assisted laser desorptionlionization time-of-flight mass
spectrometry of different types of gluten in foods made with cereal mixtures. J.
Chromatogr. A. 1998,823.299-306.
Castoro, J. A.; Kaster, C.; Wilkins, C. L. Investigation of a "screened"
electrostatic ion trap for analysis of high mass molecules by Fourier transform mass
spectrometry. Anal. Chem. 1993,65,784-778.
Catinella, S.; Seraglia, R.; Marsilio, R. Evaluation of protein profile of human
rnilk by matrix-assisted laser desorptionlionization mass spectrometry. Rapid Commun.
Mass Spectrom. 1999, 1 3, 1 546- 1549.
Catinella, S.; Traldi, P.; Pinelli, C.; Dallaturca, E.; Marsilio, R. Maulx-assisted
laser desorptionlionization mass spectrometry in milk science. Ropid Commun. Mass
Spectrom. 1996, 10, 1629- 1637.
Chmelik, J.; Knunova, A.; Caslavsky, J. Characterization of starch materials
fiom barley by gravitational field-flow fractionation and matrix-assisted laser
desorption/ionization mass spectrometry. Chem. Pap. 1998,52, SI 360-36 1.
Colby, S. M.; King, T. B.; Reilly, J. P. hproving the resolution of matrix-assisted
laser desorptionlionization time-of-flight mass spectrometry by exploiting the correlation
between ion position and velocity. Rapid Commun. M m Spectrom. 1994,8,865-868.

Demirev, P. A.; Ho, Y. P.; Ryzhov, V.; Fenselau, C. Microorganism identification
by mass spectrometry and protein database searches. Anal. Chem 1999,7 1,2732-273 8.
Dole, M.; Mack, L. L; Hines, R. L.; Mobley, R. C.; Ferguson, L. D.; Alice, M. B.
Molecular beams of macroions. J. Chem. Phys. 1968,49,2240-2249.
Driedger, D. R.; Spoms, P. Glycodkdoid concentration in Alberta potatoes
determined by matrix-assisted laser desorptiordionization mass spectrometry. J. AOAC
Int. 1999a, 82,908-9 14.
Driedger, D.; Spoms, P. Glycoalkaloid concentration in by-products of potato
starch extraction as rneasured by rnatrix-assisted laser desorptiodionization mass
spectrometry. 3. Food Process. Preserv. 1999b, 377-390.
Duncan, M. W.; Matanovic, G.;Cerpa-Poljak, A. Quantitative analysis of low
molecular weight compounds of biological interest by matrix-assisted laser desorption
ionization. Rapid Commun. M u s Spectrom. 1993,7, 1090- 1094.
Fanton, C.; Delogu, G.; Maccioni, E.; Podda, G.; Seraglia, R.; Traldi, P. Matrix-
assisted laser desorptionlionization mass spectrometry in the dairy industry 2. The protein
fingerprint of ewe cheese and its application to detection of adulteration by bovine rnilk.
Rapid Commun. Mass Spectrom. 1998, 12, 1569- 1573.
Fedele, L.; Seraglia, R.; Battismi, B.; PineIli, C.; Traldi, P. Matrix-assisted laser
desorptiodionization mass spectrornetry for monitoring bacterial protein digestion in
yogurt production. J. Mass Spectnun. 1999, 1338- 1345.
Garouo, D.; Cozzolino, R.; Di Giorgi, S.; Fisichella, S.; Lafi~andra, D. Use of
hydroxyacetophenones as matrices for the analysis of high molecular weight glutenin
mixtures by mauix-assisted laser desorptiodionization mass spectrometry. Rapid
Commun. M m Spectrom. 1999,13,2084-2089.
Gouldsworthy, A. M.; Leaver, J.; Banks, J. M. Application of a mass
spectrometry sequencing technique for identiQing peptides present in cheddar cheese.
Int. Dairy J. 1996,6,78 1-790.
Guilhaus, M.; Miynski. V.; Selby, D. Perfect timing: Time-of-flight rnass
spectrometry. Rapid Commun. Mass Spectrom. 1997, 1 1,95 1-962.

Gusev, A. 1.; Wilkinson, W. R.; Proctor, A.; Hercules, D. M. Direct quantitative
analysis of peptides using matrix assisted laser desorption ionization. Fresenius J. Anal
Chem. 1996,354,455463.
Gusev, A. L; Wilkinson, W. R.; Proctor, A.; Hercules, D. M. Quantitative analysis
of peptides by matrix assisted laser desorptionlionization time-of-flight mass
spectrometry. Appl. Spect. 1993,47, 109 1 - 1092.
Hall, B. J.; Goolsby, B.; Brodbelt, J. S. Solid-phase extraction in conjunction with
matrix-assisted laser desorption ionization/quadnipole ion trap mass spectrometry for the
determination of benzoylecgonine in urine. Appl. Spect. 1999,53, 136 1 - 1366.
Harvey, D. J. Matrix-assisted laser desorptionlionisation mass spectrometry of
oligosaccharides and glycoconjugates. J. Chromatogr. A. 1996,720,429-446.
Harvey, D. J. Matrix-assisted laser desorptionlionisation mass spectrometry of
carbohydrates. Mars Spectrom. Rev. A. 1999, 1 8,349-45 1.
Harvey, D. J. Quantitative aspects of the matrix-assisted laser desorption mass
spectrometry of complex oligosaccharides. Rapid Commun. Mass Spectrom. 1993,7,
6 14-6 19.
Hensel, R. R.; King, R. C.; Owens, K. G. Electrospray sample preparation for
improved quantitation in matrix-assisted laser desorption/ionization time-of-flight mass
spectrometry. Rapid Commun. Mass Spectrom 1997,ll. 1785- 1793.
Hickman, D. R.; Roepstorff, P.; Shewry, P. R.; Tatham, A. S. Molecular weights
of high molecular weight subunits of glutenin determined by mass spectrometry. J.
Cereal Sci. 1995,22,99-103.
Horning, E. C.; Horriing, M. G.; Carroll, D. L; Dzidic, 1.; Stillwell, R. N. New
picogram detection system based on a mass spectrometer with an extemal ionization
source at atmosperic pressure. Anal. Chem 1973,45,936-943.
Ijima, Y.; Ogawa, K.; Watanabe, N.; Usui, T.; Ohnishi Kameyama, M; Nagata,
T.; Sakata, K. Characterization of beta-primeverosidase, being concemed with alcoholic
aroma formation in tea leaves to be processed into black tea, and preliminary
observations on its substrate specificity. J. Agric. Food Chem. 1998,46, 17 12-17 18.

Jarman, K. H.; Daly, D. S.; Petersen, C. E.; Saenz, A. J.; Vdentine, N. B.; Wahl,
K. L. Extracting and visualizing rnatrix-assisted laser desorption/ionization time-of-flight
mass spectral fingerprints. Rapid Commun. Mass Spectrom. 1999, 13, 1586- 1594.
Jespersen, S.; Niessen, W. M. A.; Tjaden, U. R.; vanderûreef, J. Quantitative
bioanalysis using matrix-assisted laser desorption ionization mass spectrometry. J. Mass
Spectrom. 1995,30,357-364.
Jonscher, K.; Cume, G.; McCormack, A. L.; Yates, J. R. Matrix-assisted laser
desorption of peptides and proteins on a quadrupole ion trap mass spectrometer. Rapid
Commun. Mass Spectrom. 1993,7,20-26.
Karas, M.; Matnx-assisted laser desorption ionization MS: a progress report.
Biochem. Mass Spectrom. 1996,24,897-900.
Karas, M.; Bachmann, D.; Bahr, U.; Hillenkamp, F. Matrix-assisted ultraviolet
laser desorption of non-volatile compounds. Int. J. Mass Spectrom. Ion Processes. 1987,
78,53-68.
Karas, M.; Bachrnann, D.; Hillenkarnp, F. Influence of the wavelength in high-
inadiance ultraviolet laser desorption mass spectrometry of organic molecules. Anal.
Chem. 1985,57,2935-2939.
Karas, M.; Glückmann, M.; Schafer, J. Ionization in matrix-assisted laser
desorptiordionization: single charged molecular ions are the lucky survivon. J. Mass
Spectrom. 2000,35, 1-12.
Karas, M.; Hillenkamp, F. Laser desorption ionization of proteins with molecular
masses exceeding 10 000 daltons. Anal. Chem. 1988,60,2299-230 1.
Kaufmann, R.; Wingerath, T.; Kirsch, D.; Stahl, W.; Sies, H. Analysis of
carotenoids and carotenol fatty acid esters by matrix-assisted laser desorption ionization
(MALDI) and MALDI-post-source-decay mass spectrometry. Anal. Biochem. 1996,238,
117-128.
Kazrnaier, T.; Roth, S.; Zapp, J.; Harding, M.; Kuhn, R. Quantitative andysis of
malto-oligosaccharides by MALDI-TOF mass spectrometry, capillary electrophoresis and
anion exchange chrornatograph y. Fresenius J. Anal. Chem. 1998,36 1,473-478.

Kim, H. J.; Leszyk, J.; Taub, 1. A. Direct observation of protein glycosylation by
matrix-assisted laser desorption ionization time-of-flight mass spectrometry. J. Agric.
Food Chem. 1997,45,2 158-2 165.
Kussmann, M.; Nordhoff, E.; RahbekNielsen, H.; Haebel, S.; RosselLanen, M.;
Jakobsen, L.; Gobom, J.; Mirgorodskaya, E.; KrollKristensen, A.; Palm, L.; Roepstorff.
P. Matrix-assisted laser desorption/ionization mass spectrometry sample preparation
techniques designed for various peptide and protein analytes. J. Mass Spectrom. 1997,
32,593-60 1 .
Lee, H. J.; Joo, Y. J.; Park, C. S.; Kim, S. H.; Hwang, 1. K.; Ahn, J. S.; Mheen. T.
1. Purification and characterization of a bacteriocin produced by Lactococcus lactis subsp
lactis H-559 isolated from kimchi. J. Biosci. Bioeng. 1999a, 88, 153- 159.
Lee, S. J.; Kim, J. C.; Kim, M. J.; Kitaoka, M.; Park, C. S.; Lee, S. Y.; Ra, MJ.;
Moon, T. W.; Robyt, J. F.; Park, K. H. Transglycosylation of naringin by Bacillus
stearothennophilus maltogenic amylase to give glycosylated naringin. J. Agric. Food
Chem. 1999b, 47,3669-3674.
Lequart, C.; Nuzillard, J. M.; Kurek, B.; Debeire, P. Hydrolysis of wheat bran and
straw by an endoxylanase: production and structural characterization of cinnamoyl-
oligosaccharides. Carbohydr. Res. 1999,3 19, 102- 1 1 1.
Liang, X. L.; Lubman, D. M.; Rossi, D. T.; Nordblom, G. D.; Barksdale, C. M.
On probe i r n m u n ~ ~ n i t y extraction by matrix-assisted laser desorption/ionization mass
spectrometry. Anal. Chem. 1998,70,498-503.
Ling, Y. C.; Lin, L. N.; Chen, Y. T. Quantitative analysis of antibiotics by matrix-
assisted laser desorption/ionization time-of-flight mass spectrometry. Rapid Commun.
Mass Spectrom. 1998, 12,3 17-327.
Losso, D. N.; Nakai, S. Molecular size of garlic fructooligosacchatides and
fnictopolysaccharides by matrix-assisted laser desorption ionization mass spectrometry.
J. Agric. Food Chem. 1997,45,4342-4346.
Lynn, E. C.; Chung, M. C.; Tsai, W. C.; Han, C. C. Identification of
Enterobacteriaceae bacteria by direct matrix-assisted laser desorption/ionization mass
spectrometric analysis of whole cells. Rapid Commun. Mass Spectrom. 1999, 13,2022-
2027,

Masci, S.; Egorov, T. A.; Ronchi, C.; Kuzmicky, D. D.; Kasarda, D. D.;
Lafiandra, D. Evidence for the presence of only one cysteine residue in the D-type low
molecular weight subunits of wheat subunits of wheat glutenin. J. Cereal Sci 1999,29,
17-25.
Mendez, E.; Camafeita, E.; SanSebastian, J.; Valle, 1.; Solis, J.; MayerPosner, F.
J.; Suckau, D.; Marfisi, C.; Sotiano, F. Direct identification of wheat gliadins and related
cereal prolamins by matrix-assisted laser desorption ionization time-of-flight mass
spectrometry. J. Mass Spectrom. 1995, Suppl., S 1 2 3 4 128.
Metzger, J. O.; Woisch, R.; Tuszynski, W.; Angermann, R. New type of rnatrix-
assisted laser desorption mass spectrometry of polysaccharides and proteins. Fresenius. I.
Anal. Chem. 1994,349,473-474.
Mohr, M. D.; Bornsen, K. O.; Widmer, H. M. Matrix-assisted laser
desorption/ionization mass spectrometry: Improved matrix for oligosaccharides. Rapid
Commun. Mass Spectrom. 1995,9,809-8 14.
Nelson, R. W.; Mckan, M. A. Quantitative deterrnination of proteins by matrix-
assisted laser desorptiodionization time-of-flight mass spectrometry. Anal. Chem. 1994,
66, 1408-141s.
Nicola, A. J.; Gusev, A. 1.; Hercules, D. M. Direct quantitative analysis from thin-
layer chromatography plates using matrix-assisted laser desorptiordionization mass
spectrometry. Appl. Spect. 1996,50, 147% M82.
Nicola, A. J.; Gusev, A. 1.; Proctor, A.; Jackson, E. K.; Hercules, D. M.
Application of the fast-evaporation sarnple preparation rnethod for improving
quantification of angiotensin II by matrix-assisted laser desorption ionization. Rapid
Commun. Mass Spectrom. 1995,9, 1 164- 1 17 1.
Ohnishi-Kameyama, M.; Yanagida, A.; Kanda, T.; Nagata, T. Identification of
catechin oligomers from apple (Malus pumila cv Fuji) in matrix-assisted laser
desorption/ionization time-of-flight mass spectrometry and fast-atom bombardment mass
spectrometry. Rapid Commun. Mass Spectrom 1997,11,3 1-36.
Pfeifer, T.; Drewello, M.; Schierhom, A. Using a matrix-assisted laser
desorption/ionization the-of-flight mass spectrometer for combined in-source
decayfpost-source decay experiments. J. Mus Spectrom. 1999,34,644-650.

Pieles, U.; Zuercher, W.; Schor, M.; Moser, H. E. Matrix-assisted laser desorption
ionization time-of-flight mass spectrometry: A powefil toul for the mass and sequences
analysis of natural and modified oligonucleotides. Nucleic Acih Res. 1993,2 1,3 19 1 - 3 196.
Pots, A. M.; Gruppen, H.; van Diepenbeek, R.; van der Lee, J. J.; van Boekel M.
A. J. S.; Wijngaards, G.; Voragen, A. G. J. The effect of storage of whole potatoes of
three cultivars on the patatin and protease inhibitor content; a study using capillary
electrophoresis and MALDI-TOF rnass spectrometry. J. Sci Food Agric. 1999,79, 1557-
1564.
Preston, L. M.; Murray, K. K.; Russell, D. H. Reproducibility and quantitation of
matrix-assisted laser desorption ionization mass spectrometry: Effects of nitrocellulose
on peptide ion yields. Biol. Mass Spectrom. 1993,22,544-550.
Rawel, H . M.; Kroll, J.; Riese Schneider, B.; Haebel, S. Physicochernical and
enzymatic properties of benzyl isothiocyanate derivatized proteinases. J. Agric. Food
Chem 1998,46,5043-505 1.
Rose, N. L.; Sporns, P.; McMullen, L. M. Detection of bactenocins by matrix-
assisted laser desorptiodionization time-of-flight mass spectrometry. Appl. Environ.
Microbiol. 1999a, 65,2238-2242.
Rose, N. L.; Sporns, P.; Stiles, M. E.; McMullen, L. M. Inactivation of nisin by
glutathione in fkesh meat. J. Food Sei. 1999b, 64,759-762.
Rouse, J. C.; Vath, J. E. On-the-probe sarnple cleanup strategies for glycoprotein-
released carbohydrates pnor to matrix-assisted laser desorption-ionization time-of-fiight
mas spectrornetry. Anal. Biochem. 1996,238,82-92.
Rucker, R. B.; Rucker, B. R.; Mitchell, A. E.; Cui, C. T.; Clegg, M; Kosonen, T.;
Uriu-Adams, J. Y.; Tchaparian, E. H.; Fishman, M.; Keen, C. L. Activation of chick
tendon 1 ys y1 oxidase in response to dietary copper. J. Nutr. 1999, l29,2 143-2 146.
Sabbadin, S.; Seraglia, R.; Allegri, G.; Bertazzo, A.; Traldi, P. Matrix-assisted
laser desorptionhonization mass spectrometry in evaiuation of protein profiles of infant
fomulae. Rapid Commun. Mass Spectrom. 1999; 13, 1438- 1443.
Saenz, A J.; Petersen, C. E.; Valentine, N. B.; Gantt, S. L.; Jarman, K. H.;
Kingsley, M. T.; Wahl, K. L. Reproducibility of matrix-assisted laser

desorptiodionization time-of-flight mass spectrometry for replicate bacterial culture
analysis. Rapid Commun. Mass Spectmm. 1999,13, 1580- 1585.
Sakairi, M.; Kambara, H. Characteristics of a liquid chromatograph/atmospheric
pressure ionization mass spectrometer. Anal. Chem 1988,60,774-780.
Schiller, J.; Arnhold, J.; Benard, S.; Muller, M.; Reichi, S.; Arnold, K. Lipid
analysis by matrix-assisted laser desorption and ionization mass spectrometry: A
methodological approach. Anal. Chem. 1999,267,46-56.
Schriemer, D. C.; Li, L. Detection of high molecular weight narrow polydispene
polymers up to 1.5 million Daltons by MALDI mass spectrometry. Anal. Chem. 1996,68,
272 1 -2725.
Sha, S.; Minakuchi, K.; Higaki, N.; Sato, K.; Ohtsuki, K.; Kurata. A.; Yoshikawa.
H.; Kotaru, M.; Masumura, T.; Ichihara, K.; Tanaka. K. Purification and characterization
of glutaredoxin (thioltransferase) from rice (Oryza sativa L). J. Biochem. 1997, 12 1,842-
848.
Shimazaki, K.; Tamme, T.; Uji, K.; Tanaka, M.; Kumura, H.; Mikawa, K.;
ShimoOka, T. Properties of a heparin-binding peptide derived from bovine lactofemn. J.
Daity Sci. 1998,8 1,284 1-2849.
Sorell, L.; Lopez, I. A.; Valdes, L; Alfonso, P.; Camafeita, E.; Acevedo, B.;
Chirdo, F.; Gavilondo, J.; Mendez, E. An innovative sandwich ELISA system based on
an antibody cocktail for gluten analysis. FEBS Let?. 1998,439,4640.
Spoms, P.; Wang, J. Explonng new frontiers in food analysis using MALDI-MS.
Food Res. Int. 1998, 18 1 - 1 89.
Stahl, B.; Linos, A.; Karas, M.; Hillenkamp, F.; Steup, M. Analysis of fructans
from higher plants by matrix-assisted laser desorption/ionization m a s spectrornetry.
Anal. Biochem. 1997,246, 195-204.
Stahl, B.; Steup, M.; Karas, M.; Hillenkamp, F. Anaiysis of neutral
oligosaccharides by rnauix-assisted laser desorptiodionization mass spectrometry. Anal.
Chem 1991,63,1463-1466.
Sugiyama, E.; Hara, A.; Uemura, K. A quantitative analysis of serum suifatide by
mat&-assisted laser desorption ionization time-of-fiight mass spectrometry with delayed
ion extraction. Anal. Biochem 1999,274,9047.

Sugui, J. A.; Bonham, C.; Lo, S. C.; Wood, K. V.; Nicholson, R. L. MALDI-TOF
analysis of mixtures of 3-deoxyanthocyanidins and anthocyanins. Phytochem. 1998,48,
1063- 1066.
Sugui, J. A.; Wood, K. V.; Yang, Z. Y.; Bonham, C. C.; Nicholson, R. L. Matrix-
assisted laser desorption ionization mass spectrometry analysis of grape anthocyanins.
Am. J. End. Vitic. 1999,50, 199-203.
Tanaka, K.; Waki, H.; Ido, Y.; Akita, S.; Yoshida, Y.; Yoshida, T. Protein and
polymer analyses up to m/z 100,000 by laser ionization time-of-flight mass spectrometry.
Rapid Commun. Mass Spectrom 1988,2, 1 5 1 - 1 53.
Tang, K.; Allman, S. L.; Jones, R. B.; Chen, C. H. Quantitative anlysis of
biopolymea by matrix-assisted laser desorption. Anal. Chem. 1993,65,2 164-2 166.
Tressl, R.; Wondrak, G. T.; Garbe, L. A.; Kruger, R. P.; Rewicki, D. Pentoses and
hexoses as sources of new melanoidin-like Maillard polymers. J. Agric. Food Chem.
1998% 46, 1765- 1776.
Tressl, R.; Wondrak, G. T.; Kruger, R. P.; Rewicki, D. New melanoidin-like
Maillard polymers from 2-deoxypentoses. J. Agric. Food Chem. 1998b,46, 104- 1 10.
Vestd, M. L; Juhasz, P.; Martin, S. A. Delayed extraction matrix-assisted laser
desorption time-of-flight mass spectrometry. Rapid Commun. Mass Spectrom. 1995,9.
1044-1050.
Vinogradov, E.; Bock, K. Structural determination of some new oligosaccharides
and analysis of the branching pattern of isomaltooligosaccharides from beer. Carbohydr.
Res. 1998,309,5764.
Vorm, O.; Roepstorff, P.; Mann, M. Irnproved resolution and very high sensitivity
in MALDI TOF of matrix surfaces made by fast evaporation. Anal. Chem. 1994,66,
328 1-3287.
Wang, J.; Jiang, G. S.; Vasanthan, T.; Sporns, P. MALDI-MS characterization of
maltooligo/polysaccharides fiom debranched starch arnylopectin of corn and barley.
Starch. 1999b, 5 1,243-248.
Wang, J.; Kalt, W.; Spoms, P. Cornparison between HPLC and MALDI-TOF MS
analysis of anthocyanins in highbush bluebemes. Submitted to J. Agric. Food Chem.
2000.
Wang, J.; Sporns, P. Anaiysis of anihocyanins in red wine and fruit juice using
MALDI-MS. J. Ag* Food Chem 1999,47,2ûû9-20 15.
Wang, J.; Spoms, P. MALDI-TOF MS analysis of food flavonol glycosides. J.
Agric. Food Chem. U)OO, In press.
Wang, J.; Spoms, P.; Low, N. H. Analysis of food oligosaccharides using
MALDI-MS : Quantification of fructooligosacc harides. J. Agric. Food Chem. 1999a, 47,
1 549- 1 557.
Whitehouse, C. M.; Dreyer, R N.; Yamashita, M.; Fenn, .J. B. Electrospray
interface for liquid chrornatographs and mass spectrometers. Anal. Chem. 1985,57,675-
679.
Wilkinson, W. R.; Gusev, A. 1.; Roctor, A.; Houalla, M.; Hercules, D. M.
Selection of interna1 standards for quantitative anaiysis by matrix assisted laser
desorption ionization (MALDI) time-of-flight mass spectrometry. Fresenius J. Anal.
Chem. 1997,357.24 1-248.
Wingerath, T.; Stahl, W.; Kirsch, D.; Kaufmann, R.; Sies, H. Fruit juice carotenol
fatty acid esters and carotenoiàs as identified by rnatrix-assisted laser desorption
ionization (MALDI) mass spectrometry. J. Agric. Food Chem. 1996,44,2006-20 1 3.
Wong, K. S.; Jane, J. Quantitative analysis of debranched amylopectin by
HPAECPAD with a postcolumn enzyme reactor. J. Liq. Chromatogr. Relut. Technol.
1997,20,297-3 IO.

Chapter 2
Analysis of Food Oligosaccharides using MALDI-MS:
Quantification of Fructooligosaccharidesl
INTRODUCTION
Fructans are nonreducing water-soluble carbohydrates formed in higher plants
composed of fmctosyl units but usuaily containing one terminal glucose moiety per
molecule. They occur as linear, branched, or, less frequently, as cyclic molecules
(Darbyshire and Henry, 1978. 198 1 ; Bancal and Gaudillere. 199 1 ; Stahl et al., 1997).
Naturai p-fructans have a degree of polymerization (DP) ranging from 2 to 55 or more.
Lower mass @P of 2 to 20) hctans are also called fnictooligosaccharides (Figure 2- l),
while higher mass polymers are known as inulin. It has been found that these
nondigestible carbohydrates are effective in improving intestinal flora and increasing
calcium and magnesium absorption (Ohta et al., 1995, 1998). Fructans have also been
examined for their biological role in plant osmoregulation, adaptation to low temperature
photosynthesis, protection €rom freezing stress (Darbyshire and Henry, 1978; Pollock,
1984; Nelson and Smith, 1986; Chatterton et al., 1990; Livingston. 1990), and stonge life
of bulbs (Darbyshire and Henry, 198 1 ; Suzuki and Cutcliffe, 1989).
Traditionally a variety of techniques have been used to analyze
fnictooligosaccharides. Gel permeation chromatography (Darbyshire and Henry, 1978)
has been used, but detection and identification of the separated fructooiigosaccharides
requires extensive additional methodology involving acid hydrolysis and various
enzymatic and colorimetric procedures to identify the carbohydrates. The method of
Manglu et al. (1995) detects hctooligosaccharides after various enzyme treatments and
identification of the carbohydrates produced by hi& performance liquid chromatography
-- - -
' A version of lhis chapter has beeu published. Wang, 1.; Sponis, P.; Low, N. H. Anafysis of food oligosaccharides ushg MALDI-MS: Quantification of huctootigosaccharides. 3. Agric. Food Chem 1999, 47,1549-1557.

Figure 2-1. Chemicai structures of fructooligosaccharides~ maltohexaose, and y-cyclodextrin.
(HPLC). However, the procedure is also lengthy and gives minimal information about
which polymers are present. Loo et al. (1995) describe a number of analytical procedures
for determination of fkuctooligosaccharides including HPLC for Iow DP
fnictooligosaccharides and a gas chromatography (GC) procedure. While the latter can
be used for sensitive determination of fnictooligosaccharides up to about DP of L 2,
extensive purification and derivatization with water sensitive reagents are required. in
addition GC conditions of very high temperatures are required to volatilize the
derivatized mictooügosaccharides. By f a - the most commonly used procedure for
analysis of hctooligosaccharides is high performance anion exchange chromatography
with pulsed amperometric detection (EIPAEC-PAD) (Chatterton et al., 1989, 1993;
Shiorni et al., 1991; Timmermans et al., 1994; Loo et al., 1995). The
fnictooligosaccharide response with HPAEC-PAD does Vary (Timmermans et al., 1994)
and the analyses often requin signifïcant sample purification.

Matrk-assisted laser desorptiodionization mass spectrometry (MALDI-MS) was
originally developed for measuring the mass of large molecules such as proteins.
MALDI-MS has also been applied to carbohydrates since about 199 1 (Mock et al., 199 1 ;
Stahl et al., 1991). Fmctooligosaccharides or inulin in some plants have been qualitatively
analyzed using MALDI-MS (Metzger et al., 1994; Stahl et al., 1997; Losso and Nakai,
1997) but there have been no reports on quantitative analysis. Our purpose in this study
was to develop methodology for both qualitative and quantitative analysis of
fructooligosaccharides in selected food samples.
MATERIALS AND METHODS
Materiah and Reagents. Red onion bulbs (Allium cepa L.), shallot bulbs (Alfium
cepa L. var. oscalonicwn), and elephant garlic (Allium ampeloprasum) were purchased
from local markets in Edmonton, Alberta, Canada. Inulin from Jerusalem artichokes, y-
cyclodextrin, maltohexaose, 4-hydroxy-a-cyanocinnamic acid (HCCA), and sinapinic
acid were purchased fkom Sigma Chem. Co. (St. Louis, MO). A mixture of l -kestose
(GF?, DP = 3), nystose (GF,, DP = 4). and p-fnictofuranosylnystose (GR, DP = 5 ) (34%,
53% and 10%) and these individual f'ctooligosaccharides in pure form were a gift from
Dr. A. Ohta, Nutritional Science Center, Meiji Seika Kaisha, lapan. 2'.4',6'-
Trih ydrox yacetophenone monohydrate (THAP), [2-(4-h ydroxyphen ylazo)-benzoic acid]
(HABA), 3-aminoquinoline (3-AQ), 1 -hydroxyisoquinoline (HIC), and 2,s-
dihydroxybenzoic acid (DHB) were obtained from Aldrich Chem. Co. (Milwaukee, m. Extraction of Fructwügosaccbarides €rom Onion, Shdot, and Garlic
Samples. Fresh samples were peeled to remove the dry outer layers and then chopped
using a food processor (Braun, UK 100, Type 4259, Germany) for 5 min. The chopped
samples were freeze-dried. Samples were extracted according to Stahl et al. (1997) using
water instead of 8096 of ethanol as extraction solvent. Each heze-dried sample ( 1 g) was
extracted with two portions of 40 mL doubly deionized water heated to reflux for I hr.
The cooled sample was centnfuged for 15 min. at 10 000 rprn after each water extraction;
the supernatants were combined and made up to 100 mL with water. The aqueous extract
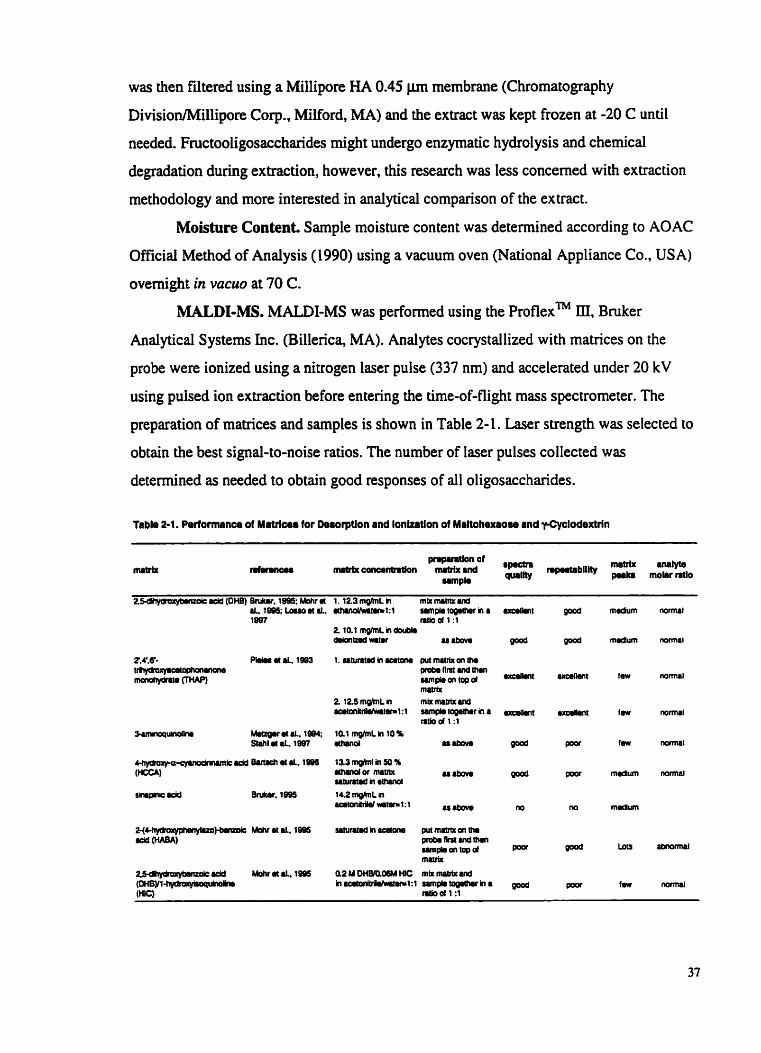
was then filtered using a MiIlipore HA 0.45 p membrane (Chromatography
DivisionlMillipore Corp., Milford, MA) and the extract was kept frozen at -20 C until
needed. Fructooligosacch~des might undergo enzymatic hydrolysis and chernical
degradation during extraction, however, this research was less concemed with extraction
methodology and more interested in analytical comparison of the extract.
Moishue Content. Sample rnoisture content was determined according to AOAC
Official Method of Analysis (1990) using a vacuum oven (National Appliance Co., USA)
overnight in vacuo at 70 C.
MALDEMS. MALDI-MS was performed using the I?roflexM ID, Bruker
Analytical Systems Inc. (Billerica, MA). Analytes cocrystallized with matrices on the
probe were ionized using a nitrogen laser pulse (337 nm) and accelerated under 20 kV
using pulsed ion extraction before entenng the tirne-of-flight mass spectrometer. The
preparation of matrices and sarnples is shown in Table 2-1. Laser strength was selected to
obtain the best signal-to-noise ratios. The number of laser pulses collected was
determined as needed to obtain good responses of al1 oligosaccharides.
Table 2-1. Performance of Matrices for Deurrption and Ionkailon of Maltohexaose and yCyclodextrin
Quantification of fnictooligosaccharides using MALDI-MS was achieved using
standard addition. The frozen sample extracts were ailowed to warm to room temperature.
Samples were prepared by taking 50 pL of extract and mixing this with 50 of aqueous
0.01 M potassium chloride solution. The standard addition samples had GF4 (7.9 x 1 0 ~ M
in 50 pL of aqueous 0.01 M potassium chloride) added to 50 pL of sample extracts.
Samples and standard addition samples were each spotted in five separate positions on
the probe. A single spectrum was then generated for each position on the probe ( 10
spectra in dl, five for each sample and five for each standard addition sample) by random
selection of three different spots for each probe position and collecting 60 laser pulses for
each spot. That is, one specûum represented the sum of 3 x 60 or 180 laser pulses. Peak
heights (for potassium adducts) were determined for each fructooligosaccharide from
each spectrum. These peak heights were then scaled relative to the GF3 peak, which was
arbitrarily set at a value of 1 .O. Each of the five spectra for the sample was compared to a
different spectrum from the five standard addition samples and the average increase in
scaled relative peak height for GF4 (standard fructooligosaccharide added) determined. . - This gave a value for the average increased response due to the addition of GF4. This
response factor was then used to detemine the average amount of each
fructooligosaccharide in the five sample spectra. The acquisition of the MALDI-MS data
took about 20 minutes. Al1 samples were analyzed in duplicate. That is, an entirely new
10 spots (five samples and five standard addition samples) were analyzed (see Appendix 1
for experimental design).
EIPAEC-PAD? The frozen n d onion. shailot and garlic sample extracts were
allowed to corne to room temperature and diluted 1 5 (in 5-mL volumetric flask) with
water. Fnictooligosaccharide standards (10.0 mg) were prepared in a 50-rnL volumetric
flask with HPLC grade water. Each sample was passed through a 0.2-pm syringe filter
(25 mm; Chromatographic S pecialties, Brockville, ON). Filtered samples were anal yzed
on a Waters 625 metal free gradient HPLC (Waters Chrornatography, Milford, MA). Al1
samples and standards were injected (50 pL) with a Waters 7 12 Wisp autosampler.
HPAEC-PAD was conducted by Dr. Low in Dcpartment of Applied Microbiology and Food Science at the University of Saskatchewan, Saskatoon, Saskatchewan.

Carbohydrates were separated on a Carbo Pac PA1 colurnn (250 mm ~4 mm; Dionex,
Sunnyvale, CA) coupled with a Carbo Pac PA1 guard column (50 mm x 4 mm). The
solvents used were 100 mM sodium hydroxide (solvent A), 100 m M sodium
hydroxide1400 mM sodium acetate (solvent B), and 300 mM sodium hydroxide (solvent
C). The mobile phase flow rate was maintained at 1 mUmin, with a linear gradient profile
consisting of solvent A with the following proportions (v/v) of solvent B or C: 0-8 min,
maintain 0% B and 0% C; 8-60 min, 100% B; 60-61 min, 100% C; 61-90 min, maintain
100% C; 90-91 min, 0% B and 0% C. Sodium hydroxide (300 mM) was added post
colurnn (Waters Chromatography) at a flow rate of 0.70 mUmin to minimize baseline
drift. Detection was achieved employing a Waters 464 pulsed amperometric detector
(PAD) with a dual gold electrode and triple pulsed amperometry at a sensitivity of 50 pA.
The electrode was maintained at the following potentials and durations: El= 0.05V (Ti =
0.299 s); E2 = 0.60V (T2 = 0.299 s); E3 = -0.80V (T3 = 0.499 s). Chromatograrns were
plotted employing Millenium 20 10 Chromatography manager software (Waters
Chromatography). Al1 samples were analyzed in duplicate. Quantification of
fructooligosacchatides was determined from peak areas using sucrose as the external
standard (the peak area of sucrose was used as the reference value to calculate al1 other
response factors as in Timmermans et al., 1994).
Statisocs. Linear regressions, exponentiai distributions, means and standard
deviations were analyzed using Microsoft Excel97 (Microsoft Office 97).
RESULTS AND DISCUSSION
For quantification of carbohydrates using MALDI-MS, several factors must be
examined individually, including the selection of matrices, matrix and sample
preparation, and the selection of an appropriate interna1 standard for quantification
(Harvey 1993; Jespersen et al., 1995; Gusev et al., 1995; Abel1 and Spoms, 1996; Bartsch
et al., 1996; Wilkinson et al., 1997). The best ma& offers spot-to-spot and sample-to-
sample repeatabiiity and reproducibility, which makes quantitative anaiysis of the
analytes of interest possible.

Selection of Matrices. The main problerns associated with matrix-assisted laser
desorption/ionization (MALDI) quantitative analysis are poor spot-to-spot repeatability or
crystai inhomogeneity (Gusev et al., 1995). Roper homogeneous crystallization over the
entire probe area and a homogeneous embedding of analyte molecules in the matrix are
the prime criteria for high repeatability and quantification. The selection of matrices is
usually based on a comparison of spot-to-spot or sample-to-sample repeatability and the
ability to obtain a good quality spectmm with ceasonable signal-to-noise ratios with the
best possible resolution. 2,s-Dihydroxybenzoic acid OHB) (Bruker, 1995; Mohr et al.,
1995; Losso and Nakai, 1997), 3-aminoquinoline (3-AQ) (Metzger et al., 1994). 4-
hydroxy-a-cyanocinnamic acid (HCCA) (Bartsch et al., 1 W6), and 2,s-
dihydrooxybenzoic acid @HB)/l-hydroxyisoquinoline (HIC) (Mohr et al., 1995) have a11
been recommended as matrices for carbohydrate analysis using MALDI-MS. These
matrices were tested for their suitability to ionize the oligosaccharides, maltohexaose and
y-cyclodextrin (Figure 2-1). The preparation of matrices and their performance are listed
in Table 2-1. DHB, 3-AQ, HCCA, and DHB/HIC matrices al1 gave good quality spectra
(Figure 2-2). The repeatability with DHB was acceptable, whereas the matrices 3-AQ,
HCCA and DHB/HIC could not meet the need for high repeatability. DHB showed many
matrix peaks in the low mass region, which could interfere with low molecular weight
analytes of interest, such as kestose with a mas of 504. Metzger et al. (1994) first
introduced 3-AQ as matrix for inulin using MALDI-MS. Compared to DHB, 3-AQ
showed sharper peaks (that is better resolution) and a lower background, but the high
quality spectra could not be repeatedly obtained in Our experiments. Mohr et al. ( 1995)
noted that DHB crystals formed only near the rim of the probe, complicating the location
of suitable laser ionization positions because only a few crystals could be found in the
center of the probe. Stahl et al. (1997) found 3-AQ to be more sensitive to contarninants.
such as salts. Naven et al. (1997) found the spectra acquired fkom DHB exhibited the
most abundant fragmentation and that those using 3-AQ exhibited the least. Mohr et al.
(1995) pointed out that DHB/HIC crystallized equally over the entire probe as a fine
powder using vacuum-drying for a few seconds. This resulted in high quality spectra with
few matrix peaks and intense analyte peaks. However, thîs procedure was not suitable for

Figure 2-2. MALDI-MS positive ion spectra of y-cyclodexuin and rnaltohexaose in various matrices. A: 4-Hydroxy-a-cyanocinnamic acid, 13.3 mg/mL in ethanollwater ( 1 : 1 ). A 20 pL of sample mixture containing y-cyclodextrin ( 2 . 5 ~ 10'b. marked M2) and rnaltohexaose ( I . lxl~"h, marked M 1) in double deionized water was mixed with 20 pL of matrix in solution and vortexed for 30 S. Then 05-Cu, mixture of matrix and sample was applied to the probe. Laser strength was set at an attenuation of 44. Twenty shots were accumulated for the final specenim. 8: 23-Dihydroxybenzoic acid, 12.3 rng/mL in ethanollwater (1:l). Other parameters were the same as in A except the Iaser strength was set at an attenuation of 32. C: 2',4',6'-Trihydroxyacetophonenone monohydrate saturated in acetone. A 0.3-pL aliquot of matrix was applied to the probe first and airdned. Then, 0.5 pL of sample was put on the top of matrix. Other parameters were the same as in B. D: 3-Aminoquinoline (10.1 mg/mL in 10% etfianol). Other parameters were the same as in B.
a multiple-position probe, because samples could not be spotted and vacuum dned
simultaneously so irregular crystals are formed, leading to poor spot-to-spot repeatability.
The laser strength used for the matrices 3-AQ, DHB, and DHB/HIC was almost
the sarne, with an attenuation around 30 to 33, which was just above laser strength
threshold values required to desorb and ionize analytes (Note that for the MALDI-MS
proflexRY' III, attenuation is opposite to laser strength; that is, the higher the attenuation
the lower the laser strength). At the same laser strength, DHB produced more matrix
peaks than 3-AQ, or DHBMC. Whereas a much lower laser strength (attenuation of 44
or 49) was used for HCCA or HABA to desorb and ionize maltohexaose and y-
cyclodextrin, both of these matrices showed numerous rnatrix peaks making analysis of

masses below 600 difficult. Furthermore, the peak ratio (0.30) of maltohexaose to y-
cyclodextrin obtained from HABA was quite far from the actual molar ratio (0.63).
The rate of the evaporation of the solvent affects the cocrystallization of matrix
and sample. Fast evaporation leads to fine crystals and more homogeneous incorporation
of sample. Improvement in sample homogeneity using the fast-evaporation method
enhanced both shot-to-shot repeatability and sample-to-sample reproducibility (Nicola et
al., 1995). Fast evaporation could be enhanced with THAP using acetone as the solvent.
THAP is very soluble in acetone, which then evaporates rapidly giving srna11
homogeneous crystals. Previously, THAP was successfully used as a matrix for peptides
and oligonucleotides (Kussmann et al., 1997; Pieles et al., 1993). Mohr et ai. (1995)
indicated that THAP was not a good matrix for carbohydrates such as DHB/HIC due to
irregular crystallization and relative signal-to-noise ratios. However, they used water as
solvent for this matrix. With water both the lower solubility of THAP and slower
evaporation rate likely led to the noted problems. To get an appropriate excess of matrix
to analyte the THAP was fint crystallized from acetone and then the aqueous sample
applied on top of the formed crystals. The water redissolved some of the matrix and the
remaining undissolved THAP acted as seed crystais for rapid recrystallization of analyte
and matrix as the water evaporated. This technique resulted in high quality MALDI-MS
spectra (Figure 2-2) with high spot-to-spot repeatability. The technique can be used to
resolve the oligosaccharides in inulin up to a mass of 9000 (DP of about 55, Figure 2-3).
Another advantage of this technique was its tolerance to small arnounts of protein or other
impurities in samples, with few interfering matrix peaks from THAP and reasonable
signai-to-noise ratio at an attenuation of between 30 and 32. Therefore, THAP with
acetone prepared in a two step procedure was chosen as the matrix for later studies.
Aikali Metai Adducts. In general, carbohydrates ionize in a MALDI-MS source
only after cationization with alkali ions (Bornsen et al., 1995). For quantification it was
desirable that the investigated carbohydrate sample contained predominately one kind of
aikali metal, resulting in a single rnolecular ion peak. With no modification the matrix
and sample contain both sodium and potassium ions (Figure 2-2), resulting in multiple
carbohydrate peaks. The peak intensity of carbohydrate alkali-metal ion adducts in an

Figure 2-3. MALDI-MS positive ion spectnim of inulin fiom Jemalem artichokes. Inulin was dissolved in double deionized water to give a final concentration of 4 m g M . A 0.3 pL of saturated THAP in acetone was f h t placed on the probe and a 05-pL inulin sample was put on top of the crystallized matrix ta dry. Sixty laser pulses at an attenuation of 22 were accumulated for the final spectrum.
unmodified sarnple is dependent on the concentration of the alkali metal ions in final
solution applied to the probe and the afinity between the metal and the carbohydrate. It
has been shown that the affinity of aikali metals to carbohydrates follows the order of
HcLicNa<K<Cs (Mohr et al., 1995; Bomsen et al., 1995). Ion exchange and purification
of carbohydrates on a Nafion membrane has been successfully used as a sarnple
pretreatment for MALDI-MS producing a single alkali ion adduct (Bornsen et al., 1995).
However, there is another simpler method to obtain a single alkali ion adduct peak. By
dissolving carbohydrates in a 0.01 M solution of the alkali ion salt (e.g., potassium
chloride) we were able obtain a single alkali ion adduct peak. The concentration of alkali
ions was crucial, since too high a concentration of salts would also suppress the
molecular ions. Often food samples, such as onions, shdlots, and garlic, naturally contain
a high concentration of potassium ions, and could be analyzed without m e r addition of

salts. The molecular ions seen in MALDI-MS for these food samples were almost entirely
potassium adducts (Figure 2-4).
Figure 2-4. MALDI-MS positive ion spectra of fntctooligosaccharides from shdIots. The sample was prepared by fmt applying 0.3 pL satmted THAP in acetone on the probe, air- drying and then applying OS pL of aqueous sampIe solution followed by M e r air-ârying. Laser strength was set at attenuation of 3 1 and 180 laser pulses were accwnulated in three random positions for the final spectnim.
Laser Strength. Laser strength determines the degree of the desorption and
ionization of analytes in MALDI-MS. Usually, with increases of laser strength, more
ions, including both matrix and molecular ions, are generated. Also higher laser strengths
can lead to more hgmentation. For a high quality spectmm and quantitation, the ideal
laser strength is very important. Generally, laser sangth has been chosen based on the
signal-to-noise ratios (Bartsch et al., 1996; Naven et al., 1997). However, the
relationships between laser strength, resolution, and the analyte response have not been
thoroughly investigated for carbohydrates. We found that laser strength played a very
important role in obtaining quality spectra. As the laser strength increased over a certain
amount, the resolution detenorated rapidIy. Figure 2-5 indicates the trend of the
resolution of mdtohexaose sodium adduct peak with the variation in laser strength. At the

4- lncreaslng Laser Strength
Figure 2-5. Relations hip between laser strength and resolution. The sample was prepared by first applying 0.3 pL of saturated 2',4',6'-trihydroxyacetophonenone monohydrate satmted in acetone, air-drying and then applying 0.5 of maltohexaose (1.1 x 1 0 ~ M) as described in Figure 24. The laser strength was changed h m an attenuation of 34 down to 20 (x axis). At each attenuation, two spots were randomly chosen to collect two spectra (resolution shown for each specûum) with 20 l a ~ r pulses totaled for each spot. The resolution of the molecular ion peaks was obtained from sodium adduct ion peak of maitohexaose (y axis).
attenuation between 30 and 33, high quality spectra were obtained with well resolved
isotopic m a s peaks having resolutions close to 3000 (full width at half maximum,
fwhm), and exact isotopic mass could be determined with an accuracy 100 ppm or less
using intemal calibration. However, when the attenuation was decreased to 27. the
resolution deteriorated rapidly to 500 fwhm. This effect can be easily seen in spectra since
isotopic resolution is lost. These isotopic peaks include the main peak plus one unit mass
(M+1) and (M+2) peaks due mainly to 13c isotopes. At the same time, because of the Ioss
of isotopic resolution, molecular ion peaks becarne broad and the measured
masses of peaks were shifted to high masses with increasing laser strength (data not
shown). More important, the molar peak ratio between maltohexaose and y-cyclodextrin
changecl, making quantitative analysis impossible using one as the internai standard for
the other, even though chemically these two molecules are very sirnila. oligosaccharides.
In Figure 2-6 the actual molar ratio of maltohexaose to y-cyclodextrin was 4.4 and within
the region of attenuation between 28 and 34, the peak ratio of maltohexaose and y-

4-. Increasing Laser Strength
Figure 2 4 . Relationship between laser strength and andyte peak ratios. The sample, preparation of matrix and sample, and other MALDI-MS parameters are the same as described in Figure 2-5. yCyclodextrin was present at a concentration of ZSx LO' ' M. Total peak height of both sodium and potassium adduct peaks were used to plot this trend.
cyclodextrin was very close to this molar ratio (4. lt 0.53) even though both sodium and
potassium adduct peaks were used. However, with the increase in laser strength, the peak
ratio decreased. This indicated that relatively more y-cyclodexuin was desorbed and
ionized during the ionization than maltohexaose. It can be concluded that the behavior of
molecules, even when they are only slightiy different in their molecular structure, can be
quite different during the ionization process. While higher laser strength does result in a
significant increase in ions formed, another advantage of lower laser strength is to limit
any molecular fragmentation.
Oiigosaccharide Response in MALDI-MS. The response of the analytes in
MALDI-MS plays a very important role in quantimng analytes of interest. In theory, the
intensity or response of an analyte should be linearly correlated to its molar ratios in the
MALDI-MS sample. Figure 2-7 indicates the linearity between the concentration of
individual fiuctooligosaccharides and their response in MALDI-MS using y-cyclodextrin
as an intemal standard. The slopes or the relative response factors of the
fiuctooligosaccharides using MALDI-MS, were 2.1 for kestose, 2.1 for nystose, and 2.3
for GF4. This indicated that the response of the individual mictooligosaccharides in

Concentration of huctooligosaccharides Figure 27. Responses of individual fniEtoo1igosaccharides in MALDI-MS.
Diamond shapes: kestose (slope = 2.1. R~ = 0.93). Squares: nystose (slope = 2.3. R' = 0.99). Triangles: GF4 (slope = 2.1, R ~ = 0.98). Intemal standard ycydodextrin (4.0 x 10" M) was dissolved in 0.01 M potassium chloride solution. The concentration of individual hctooligosaccharide ranged fiom 1.0 x 1 0 ~ to 1.0 x 10"M for kestose. 8.2 x 1O"M to 8.2 x 1 o4 M for nystose and 6.7 x 10' M to 6.7 x lo4 M for GFS in 0.0 1 M aqueous potassium chloride. Other MALDI-MS parameters were the same as in Figure 2-4. Each data point was the mean of three random positions for a total of 180 laser pulses. Each spectrum from a single sarnple position was collected from three random spots for a total three of the 180 laser pulses. Peak heighis were used as for quantification. Each error bar stands for the standard deviation fiom the mean of three different spectra
MALDI-MS was very sirnilar and was more than twice that of y-cyclodextrin. Although
the responses of ysyclodextrin and the fructooligosaccharides were different on a rnolar
bais, the molar ratio of fnictooligosaccharides to y-cyclodextnn seemed to be consistent.
making it possible to use y-cyclodextrin as an intemal standard. y-Cyclodextrin was a
useful internai standard for hctooligosaccharides since it is readily available in pure
form, was likely similar in chernical stability to fnictooligosaccharides since al1
compounds are nonreducing sugan, and had a unique mass that would not overlap with
any other mictooligosaccharide (18 mass uni& less than the corresponding DP
Fnictooligosaccharide because of its cyclic structure).
Analysis of F~ctooiigosaccharides in Food Samples. When y-cyclodextnn was
added as an intemal standard to extracted food samples, the relative responses noted
above (about a 2: 1 molar ratio) for pure standards changed. It became obvious that in the
difierent food extract environrnents y-cyclodextrin responded differently than
fnictooligosaccharides. Food extracts from red onions, for example, completely

suppressed the production of ions from added y-cyclodextrin, even though the
fnictooligosaccharides could be seen. For this reason yccyclodextrin was abandoned as an
interna1 standard.
Table 2-2. The Repeatability of MALDCMS Analysis Data
fntctoollgosaccharides fructwligosaccharides standard A' standard B~
concentration of GF1 (OP = 5) degree of amal ~ A L O [ - M s actual value, MALDI-MS
added standard, mdmL pomwization mgrnL da& mgimL dataC
0.72 DP = 3 (kestose) 0.23 0.21 (0.01) 0.37 0.41 (0.09)
Total 0.67 0.68 (0.01) 1.20 1.26 (0.07)
DP = 4l (nystose) 0.35 0.37 0.46 0.50 DP = 5 (GF4) 0.070 0.073 (0.01) 0.37 0.38 (0.04)
Total 0.67 0.65 (0.03) 1.20 1.23 (0.02)
' A mixture of 1 -kestase (34%), nystose (53%) and GF4 (10%) made in Nutritional Science Center, Meiji Seika Kaisha, Japan.
A mixture of 1 -kaose, nystose, and GF4 prepared in out experiment. Mean of a duplicate with fhre repliates, each replicate f m îhree of 60 laser pulses and
standard deviations (n = 2). The peak of fnictooligosaaharfde wtth DP = 4 (GF3) was taken as the reference peak.
While working with food exûacts, however, one feature seemed very consistent
and that was the relative ratios of the individual fiuctooligosaccharides. For this reason it
was decided to attempt the use of a single purified fructooligosaccharide in a standard
addition method to quantitate ail of the fructooligosaccharides.
Table 2-2 shows the results for standard addition using nystose (GF3) as a
reference peak (that is al1 other peak heights are cornpared to the peak height of this peak)
and GF4 as the standard added. Cornparisons were c d e d out for two samples of known
concentration, a supplied oligosaccharide mixture with known composition (standard A)
and another mixture prepared from pure fnictooligosaccharide standards (standard B).
Even though differing amounts of internai standard (GF4 added at both 0.72 and 0.33
mg/mL Ievels) were added, quantitation of three oligosaccharide compounds compared
nicely with known values.
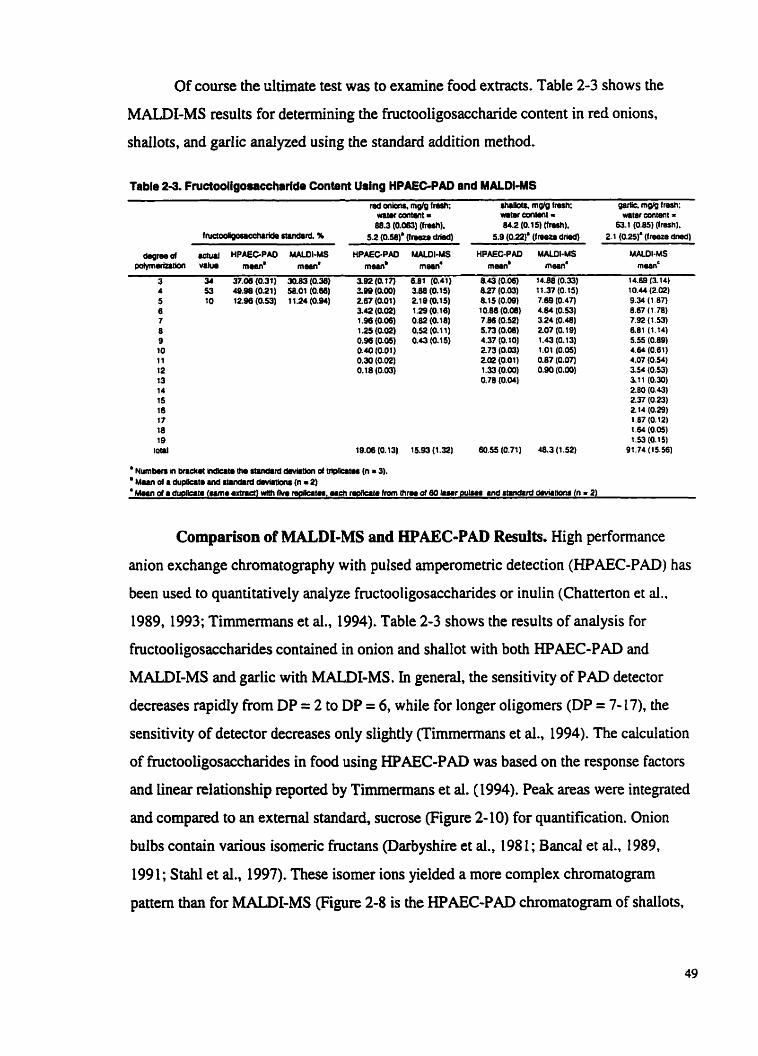
Of course the ultimate test was to examine food extracts. Table 2-3 shows the
MALDI-MS results for determining the fiuctooligosaccharide content in red onions,
shallots, and garlic anaiyzed using the standard addition method.
Table 2-3. Fructooligusaccharide Content Using HPAEC-PAD and MMDCMS
rad ankna. mgîg f m d t shabts, matg frmh; (pitic. mOlgfierci: wrtircontmtr wam cmmt - water content = 08.3 (0.083) (ml. ara (0.1 5) (ftsdi), 63.1 (0.85) (frash).
fniaodlgosrcdiu#ertsndsrd.% 5.2 (0.58). (Ilme20 drkd) 5.9 (0.22). (f ieete clnedl Z 1 (0.25). (fnwuh drwid)
HPAEC-PA0 MALDI-MS HPAEGPAO MMDI-MS HPAEC-PAD MALDI-MS MAU11 A S WyrnsrfLatlor, vilue m m D m d mean' mean' mean' m m ' m m C
3 34 37.06 (0.31} 30.83 (0.38) 332 (O. t ï ) 6.81 (0.61) 6.43 (0.06) 14.88 (0.33) 14.W (3.14) 4 53 4e.m (0.21) sa01 (am ase (am) ase (0.15) a n (0.03) I t 37 (o. 1s) to.4 (202) 5 10 1 2 M (0.53) 1124 (0.94) 267 (0.01) 219 (0.15) 8.15 (0.09) 7.69 (0.47) 9.34 (1 87) 6 3.42 (0.02) 1.29 (0.16) 1O.M (0.08) 4.84 (0.53) 8.87 (1 78) 7 i.ss(o,oe) o.@ (o.la) 7.86 (0.521 3.24 (0.481 7.92 (1.53) 8 1.25 (0.02) 0.52 (0. i l ) 5.13 (0.08) 207 (0.19) 8.81 (1.14) 9 O,% (0.05) 0.13 (0.15) 4.37 (O. 10) 1.43 (0.13) 5.55 (0.09) 10 0.40 (0.01) z n (0.03) 1.01 (O.OS) 4.ô4 (0.61) 11 0.30 (0.02) 2@ (0.01) 0.87 (0.m 4.07 (OS) 12 O. la (0.03) 1.33 (0.00) 0.90 (0.00) 3.54 (0.53) 13 0.78 (0.04) 3.1 1 (0.30) 14 2.80 (0.43) 15 2.37 (0.23) 16 2 14 (0.29) 17 1 07 (412) 18 1 .64 (0.05) 1 B 1.53 (0.15)
1oW 1S.M (0.13) 15.93 (1.32) 60.55 (0.7t) 48.3 (1 .52) 91.74 (15.56)
Cornparison of MALDI-MS and HPAEC-PAD Results. High performance
anion exchange chromatography with pulsed amperometric detection (HPAEC-PAD) has
been used to quantitatively analyze fnictooligosaccharides or inulin (Chatterton et al..
1989, 1993; Timmermans et al., 1994). Table 2-3 shows the results of andysis for
fnictooligosaccharides contained in onion and shallot with both HPAEC-PAD and
MALDI-MS and garlic with MALDI-MS. In general, the sensitivity of PAD detector
decreases rapidly from DP = 2 to DP = 6, while for longer oligomen (DP = 7- 17), the
sensitivity of detector decreases only slightly (Timmermans et al., 1994). The calculation
of fructooligosaccharides in food using HPAEC-PAD was based on the response factors
and linear relationship reported by Timmermans et al. (1994). Peak areas were integrated
and compared to an extemal standard, sucrose (Figure 2-10) for quantification. Onion
bulbs contain various isorneric fnictans (Darbyshire et ai., 198 1 ; Bancal et al., 1989,
1991; Stahl et al., 1997). These isomer ions yielded a more complex chrornatogram
pattern than for MALDI-MS (Figure 2-8 is the HPAEC-PAD chrornatogram of shallots,

- 1 - r 7 r - 0.0 2d.o 40.0 4.0
Rettntion T î e / Min
Figure 2-8. HPAEC-PAD chromatograrn of shaiIots. Peak are identified by comparison of the retention time with standards. The higher DP (DP = 6 or more) of fnictooligosaccharides are labeled by retention time compared to DP = 5 and two adjacent peaks are treated as isomers.
while Figure 2-4 is the MALDEMS spectrum for this sample). The retention times of
individual peaks from both red onions and shallots were very comparable. Kestose
@P=3), nystose @ P d ) and GF4 @P=5) in red onion and shallot samples were
determined in comparison to the retention times of fnictooligosaccharide standards. With
higher DP mictooligosaccharides, because of lack of individuai standards, we assumed
that adjacent peaks (Figure 2-8) were isomen to calculate the arnount of individual
fhctooligosaccharide content. The HPAEC-PAD technique was more sensitive in terms
of detection lirnit than MALDI-MS. The small amounis of higher DP
hctooligosaccharides in onion or shdlot samples were detected by HPAEC-PAD (Table
2-3) and could only be seen with MALDI-MS using higher laser strength where
resolution and therefore quantitation suffered.
Both Loo et al. (1995) and Stahl et al. (1997) stated that for onion bulbs the major
fnictooiigosaccharide had a DP = 5. However, using either anaiytical method.
fnictooligosaccharides other than DP = 5 were the major fnictooligosaccharides in our
onion sample. The distribution of fnictooligosaccharides in red onions, shd1ots. and

garlic seeo by MALDI-MS followed a definite pattern and the amounts of individual
fructooligosaccharides could be correlated to different exponential distributions
(correlation coefficients ranged from 0.97-099, Figure 2-9). The natural symmetry of
these exponential distributions for Fnictooligosaccharides in red onions, shallots, and
garlic seems to support the relative amounts of fnictooligosaccharides assigned by
MALDI-MS. Also this distribution may be useful in predicating the amounts of
mictooiigosaccharides with higher DP in a sample or elucidating the changes of
fructooligosaccharides in onions, shallots, and garlic during storage.
Figare 2-9. Distribution of individuai fnictooIigosaccharides in red onions (Y = 1595ea4x, R~ = 0.99). shallots (Y = 82.8e03sX. R'= 0.97), and garlic (Y = 18.73ea1dX. R*= 0.99). Each data point and the error bars were determined from duplicate analyses.
The fructooligosaccharides in the garlic sarnpie. however, could not be analyzed
using HPAEC-PAD because of problems with baseline drift, but they could be analyzed
using MALDI-MS with a slightly higher laser strength at an attenuation of 28 or 29. We
are uncertain if the lack of sample purity affected the quantification of the other HPAEC-
PAD samples. It was clear that the best comlation between the two analysis methods was
for the pure fnictooligosaccharide standard mixture.
While there are obvious difierences in the quantitation of fnictooligosaccharides
using HPAEC-PAD and MALDI-MS, we fctl that the MALDI-MS results more

accurately reflect the hue amounts of individual fnictooligosaccharides in these food
samples. As has already been noted the response of a pulsed amperometric detector
(PAD) is different for different DP €ructooligosaccharides (Timmermans et al., 1994).
However, while we tried to account for this changing response, this is only the detector
nsponse for linear fnictooligosaccharides. Onion bulbs contained various isomeric
fructooligosaccharides, including branched fnictooligosaccharides Oarbyshire et al..
1981; Bancal et al., 1989, 1991; StaM et al., 1997), and nothing is known about the
differing responses of the PAD detector to these differently linked (2-16 links)
fructooligosaccharides. However, standards for similar mass branched and linear glucose
oligosaccharides are available and their PAD responses Vary a great deai (Figure 2- 10).
Retention T h e I Min
Figure 2-10. HPAEC-PAD chrornatograrn of carbohydrate standards. Glucose, 98 ppm/5.98 min; hctose, 104 ppd6.68 min; isodtose, 98 ppdt028 min; sucrose, 98 ppmfii50 min; isomaItotriose, 108 ppm/19.47 min; maltose, 102 ppm122.55 min; maltorriose 100 ppnin4.58 min; maltotetraose, 98 ppm136.93 min; maitopentaose, 96 ppd38.23 min; rndtohexaose, 98 ppmf39.28 min; maltoheptaose, 102 ppd40.25.
In fact the branched glucose oligosaccharides (that is 1-6 linked isomaltose and
isomaltotriose; measured peak areas of 12.0 and 10.6 million, respectively) have
significantly greater PAD responses than their linear mass equivalents (maltose and

maltotriose; measured peak areas of 8.1 million and 6.8 million, respectively). It would
therefore be expected that using linear oligosaccharide PAD response factors, one would
overestimate fnictooligosacch~des with branched forms present. As cm be seen from
Table 2-3, HPAEC-PAD values are generally higher than corresponding MALDI-MS
values.
MALDI-MS is a somewhat faster analysis method than HPAEC-PAD, taking
about 20 minutes (for determinhg peak heights for 10 probe positions) rather than an
hour for each analysis and MALDI-MS is more tolerant to impurities (as noted for our
garlic sample). Further reduction in MALDI-MS analysis time cm be obtained by a less
~ ~ O ~ O U S quantitation procedure (i.e. less laser pulses, fewer spots), but even with the
numerous replicates that were performed in our experiments standard deviations for
MALDI-MS were stiil higher than for the HPAEC-PAD method. Finally, MALDI-MS
gives better assurance of correct molecular assignment since the isotopic mass of each
peak is available, although because of similar masses branched and linear isomen can not
be distinguished. In fact with MALDI-MS the assignments can be further checked by
substituting a different alkaii metal in the sample preparation procedure to see expected
mass shifts for each oligosaccharide adduct.
While we have concentrated on the analysis of fructooligosaccharides in this
study, Our feeling is that MALDI-MS cm aiso be used to quantitate other
oligosaccharides found in food by developing similar analfical methodology. To our
knowledge this paper represents the first use of standard addition to quantitate using
MALDI-MS.
Abell, D. C.; Spoms, P. Rapid quantitation of potato glycoalkaloids by matrix-
assisted laser desorption/ionization timesf-flight mass spectrometry. J. Agric. Fwd
Chem 1996,44,2292-2296.
AOAC Q97ciul Methodi of Analysis 1990.

Bancal, P.; Gaudillère, J. P. Fructan chernical structure and sensitivity to an
exohydrolase. Carbohydr. Res. 1991,2 17, 137- 15 1.
Band, P.; Henson, C. A.; Gaudillère, J. P.; Carpita, N. P. Oligofmctan
separation and quantfication by high performance liquid chromatography. Application to
Asparagus oAçcalis and Trificm aestivum. Plant Physiol. Biochem. 1989,27,745-750.
Bartsch, H.; Konig, W. A.; Strassner, M.; Hintze, U. Quantitative determination
of native and methylated cyclodexüins by matrix-assisted laser desorption/ionization
time-of-flight mass spectrometry. Carbohydr. Res. 1996,286,4 1-53.
Bomsen, K. O.; Mohr, M. D.; Widmer, H. M. Ion exchange and purification of
carbohydrates on a Nafion membrane as a new sample pretreatment for matrix-assisted
laser desorption/ionization mass spectrometry. Rapid Commun. Mass Spectrom. 1995.9,
103 1-1034.
Bruker. MALDI-TOF Mass Spectrometer. User's Guide to the ~ r o f l e x * ~ . 1995.
Chatterton, N. J.; Harrison, P. A.; Thornley, W.R.; Bennett, J. H.
Sucrooligosaccharides and cool temperature growth in 14 forb species. Plant Phvsiol.
Biochem. 1990,28, 167- 172.
Chatterton, N. J.; Harrison, P. A.; Thomley, W. R.; Bennett, J. H. Separation and
quantification of Fructan (inulin) oligomea by anion exchange chromatography. Inufin
and Inulin-containing Crops. 1993,93 -99.
Chatterton, N. J.; Harrison, P. A.; Thornley, W. R.; Bennett, J. H. Purification and
quantification of kestoses (fructosylsucroses) by gel permeation and anion exchange
chromatography. Plant Physiol. Biochem. 1989,27,289-295.
Darbyshire, B.; and Henry, R. J. DEerences in fiuctan content and synthesis in
sorne Alliwn species. New Phytol. 1981,87,249-256.
Darbyshire, B.; and Henry, R. J. The distribution of hctans in onions. New
Phytol. 1978,8 1,29-34.
Gusev, A. 1.; Wilkinson, W. R.; Proctor, A; Hercules, D. M. Improvement of
signal reproducibility and matrix/comatrix effects in MALDI analysis. Anal. Chem. 1995,
67, 1034-1041.

Harvey, D. J. Quantitative aspects of the matrix-assisted laser desorption mass
spectrometry of complex oligosaccharides. Rapid Commun. Mass Spectrom. 1993,7,
614-619.
Jespersen, S; Niessen, W. M. A.; Tjaden, UR; vandeffireef, J. Quantitative
bioanalysis using matrix-assisted laser desorption ionization mass spectrometry. J. Mass
Spectrom. 1995,30,357-364.
Kussmann, M.; Nordhoff, E.; RahbekNielsen, H.; Haebel, S.; RosselLarsen, M.;
lakobsen, L.; Gobom, J.; Mirgorodskaya, E.; Krollfistensen, A.; Palm, L.; Roepstorff,
P. Matrix-assisted laser desorptionlionization mass spectrometry sample preparation
techniques designed for various peptide and protein analytes. J. Mass Spectrom. 1997,32.
593-60 1.
Livingston, D.P., m. Fructan precipitation from waterlethanol extract of oats and
barley. Plant Physiol. 1990,92,767-769.
Loo, J, van.; Coussement, P.; Leenheer, L. de,; Hoebregs, H.; Srnits, G. On the
presence of inulin and oligofnictose as natural ingredients in the western diet. Crit. Rev.
Food Sci. Nutr. 1995,35,525-552.
Losso, J. N.; Nakai, S. Molecular size of garlic fructooligosacch~des and
fructopolysaccharides by matrix-assisted laser desorption ionization mass spectrorneiry. J.
Agric. Food Chem. 1997,45,43424346.
Manghi, P.; Vernazza, F.; Ferrarini, O.; Cagnasso, P.; Salvadori, C.; Fockedey, J.
Analytical method for the determination of inulin in yogurt enriched with soluble fibre.
Eur. J. Clin. Nutr. Suppl. 1995,3, S2964297.
Metzger, J. O.; Woisch. R.; Tuszynski, W.; Angermann, R. New type of rnatrix
for matrix-assisted laser desorption mass spectrometry of polysaccharides and proteins.
Fresenius J. Anal. Chem. 1994,349,473-474.
Mock, K. K; Daevy, M.; Cottrell, J. S. The analysis of underivatized
oligosaccharides by Mahix-Assisted Laser Desorption Mass Spectrometry. Biochem.
Biophys. Res. Commun. 1991,177,644-65 1.

Mohr, M. D.; Bornsen, K. O.; Widmer, H. M. Matrix-assisted laser
desorptionhonization mass spectrometry: improved matrix for oligosacchxides. Rapid
Commun. Mass Spectrom. 1995,9,808-8 14
Naven, T.J.P.; Harvey, D.J.; Brown, J.; Critchley, G. Fragmentation of complex
carbohydrates following ionization by matrix-assisted laser desorption with an instrument
fitted with time-lag focusing. Rapid Commun. Mass Spectrom. 1997, 1 1, 168 1 - 1686.
Nelson, C. J.; Smith, D. Fructans: their nature and occurrence. Curr. Top. Plant
Biochem. P hysiol. 1986,5, 1 - 16.
Nicola, A. J.; Gusev, A. L; Proctor, A; Jackson, E. K.; Hercules, D. M.
Application of the fast-evaporation sarnple preparation method for improving
quantification of angiotensin II by matrix-assisted laser desorption ionization. Rapid
Commun. Mass Spectrom. 1995,9,1164- 1 17 1.
Ohta, A.; Ohuuki, M.; Baba, S.; Hirayama, M.; Adachi, T. Cornparison of the
nutritional effects of fructooligosaccharides of different sugar chah length in rats. Nuir.
Res. 1998. 18, 109-1 20.
Ohta, A.; Ohtsuki, M.; Baba, S.; Takizawa, T.; Adachi, T.; Kimura, S. Effects of
f'ctooligosaccharides on the absorption of iron, calcium and magnesium in iron-
deficient anernic rats. J. Nutr. Sci. Vitaminol. 1995,42, 28 1-29 1.
Pieles, U.; Zuercher, W.; Schor, M.; Moser, H. E. Matrix-assisted laser desorption
ionization timesf-flight mass spectrometry: A powerful tool for the mass and sequences
analysis of naturd and modified oligonucIeotides. Nucleic Acids Res. 1993,2 1.3 19 1 - 3 196.
Pollock, C. J. Sucrose accumulation and the initiation of fructan biospthesis in
Lolim temulentum L. New Phytul. 1984,96,527-534.
Shiomi, N.; Onodera, S.; Chatterton, N. J.; Harrison, P.A. Separation of
fnictooligosaccharide isomers by anion-exchange chromatography. Agnc. Biol. Chem.
1991,5, 1427-1428.
Stahl, B.; Lions, A.; Karas, M.; Hillenkamp, F.; Steup, M. Analysis of fmctans
from higher plants by matrix-assisted laser desorptionlionization mass spectrometry.
Anal. Chem. 1997,246, 195-204.

Stahl, B.; Steup, M.; Karas, M.; Hillenkamp, F. Analysis of neutral
oligosaccharides by ma&-assisted laser desorption/ionization mass spectrometry. Anal.
Chem. 1991,63,1463-1466.
Suniki, M.; and Cutcliffe, J. A. Fructans in onion bulbs in relation to storage life.
Can. J. Plant Sci. 1989,69, 1327- 1333.
Timmermans, J. W.; van Leeuwen, M. B.; Tournois, H.; de Wit, D.; Vliegenthart.
J. F. G. Quantification analysis of the molecular weight distribution of inulin by means of
anion exchange HPLC with pulsed arnperometric detection. J. Curbohydr. Chem. 1994,
t 3,88 1-888.
Wilkinson, W. R.; Gusev, A. 1.; Proctor, A.; Houalla, M.; Hercules, D. M.
Selection of intemal standards for quantitative analysis by matrix-assisted laser
desorption-ionization (MALDI) time-of-flight mass spectrometry. Fresenius J. Anal.
Chem. 1997,357,24 1-248.

Chapter 3
MALDI-MS Characterization of Maltooligo/Polysaccharides from
Debranched Starch Amylopectin of Corn and Barleyl
INTRODUCTION
Starch, an a-D-glucan biopolyrner, is composed of two molecular entities, a linear
fraction, amylose, and its branched counterpart, amylopectin. Physicochemical properties
of isolated starches differ widely due to plant origin, and the information on properties is
vital in choosing starches for various food and nonfood (paper, textiles, mining,
phannaceutical, etc.) industrial applications. These properties depend on the starch
molecular structure, composition and morphology of the starch granule itself. The
structure refers to both fine structure (molecular size, degree of branching, chain length,
etc.) of the component molecules (amylose and amylopectin) and the supra-molecular
order, i.e. the manner in which amylose and amylopectin are arranged within the granule
and the degree of intemolecular interaction arnong them.
Arnylopectin is a highly branched starch molecule composed of many linear
chains (a-1.4-D-glucan) with about 4-61 of the total glucosidic bonds branching from
the linear polymers via a-l,6-D-glucan linkages. The presence of these branching points
gives rise to a number of possible arrangements of the linear chains. Because of its
general dominance in the composition of a starch granule (usually > 75%). the structure
and properties of amylopectin have been the subject of many investigations on molecular
size, branching, innerfouter chah lengths, etc. (Robin et al., 1974; Hinikuri et al., 1983;
Hizukuri, 1985; Jane and Chen, 1992). These studies suggest that the molecular structural
features of amytopectin highly influence starch physicochemical properties and
functionality .
- -
I A version of this chapter has been published. Wang, I.; Jiang, O. S.; Vasanthan, T.; Spom, P. MALDI- MS characterimion of maitooIigo/polysaccharides from debrancheci starch amyiopectin of corn and bariey. Starch. 1999,s t ,243-248.

Structural investigation of amylopectin has relied upon the progress in
methodological development, both enzymatic and instrumental. Enzymatic debranching
of amylopectin using puliulanase or isoamylase, followed by the separation of linear
chains using liquid chromatography, has been the most commonly used technique in the
analysis and interpretation of the amylopectin fine structure. Various types of columns
packed with size exclusion and anion exchange gels have been used for the separations.
The analysis generally gives a bi- or tri-modal elution profile, indicating the presence of
chains with different chah length or molecular weight (Hizukuri et al., 1983: Hizukuri.
1985).
The use of high performance anion exchange liquid chromatography (HPAEC)
connected to a pulsed arnperometric detector (PAD) has show the highest resolution of
molecular weights of the debranched chains. Usually in the application of this technique,
after elution from the HPAEC column but prior to detection with PAD, the linear starch
chah is converted to glucose using an enzyme pad. This conversion is carried out with
the assumption that the conversion of linear debranched starch chains to glucose is
quantitative. This is a requirement since different saccharides, such as glucose and
maltose for example, can have different responses with PAD detection. The efficiency of
enzymatic conversion is usually established using low molecular weight
maltooligosaccharides as standard (with degree of polymerization, or DP, of 1-7) and
then extrapolated to higher molecular weight debranched starch polysaccharides.
Matrix-assisted laser desorption/ionization mass spectrometry (MALDI-MS) was
originally developed for determining the mass of large molecules such as proteins.
MALDI-MS has also been applied to carbohydrate molecular sizing and quantification
(Mock et al., 199 1 ; Stahl et al., 1997; Chapter 2, Wang et al., 1999). The measurement is
quick and the technique often requires little sample purification. The objective of this
snidy was to develop a methodology to determine the chah length profile of debranched
amy lopectin using W I - M S .

MATERIALS AND METHODS
Materials and Reagents. A small sample of waxy corn starch was obtained from
Prof. Jay Lin Jane, Department of Food Science and Human Nutrition, Iowa State
University, IA. Waxy barley grains (Candle) were obtained from Agricore, Calgary,
Alberta. Regular barley grains (Phoenix) were obtained fiom Dr. Jim Helm Alberta
Agriculture, Food and Rural Development, Lacombe, Alberta. Isoarnylase (E.C 3.2.1.68),
Sepharose CL-6B, maltotriose @P 3), maltotetraose (DP 4), maltopentaose (DP 5)
maltohexaose (DP 6) and maltoheptaose (DP 7) were purchased from Sigma Chem. Co.
(St. Louis, MO). Sep-pak Cl8 cartridges was from Waters Corp. (Milford, MA). Macro-
sep centrifuge concentrator (30 K), from Filtron Tech. Corp. (Northborough, MA); and
the Sephadex G10 desalting columns, from Amersharn Pharmacia Biotech AB, (Uppsala,
Sweden). 2' ,4' ,6'-Trihydroxyacetophenone (THAP) monohydrate, 3-aminoquinoline (3-
AQ) and 2,s-dihydroxy-benzoic acid (DHB) were obtained fiom Aldrich Chem. Co.
(Milwaukee, WI).
Debranching of starch? Starch from barley grains (waxy Candle and regular
Phoenix) was extracted according to Vasanthan and Bhatty (1995). The method of
debranching of starch was a modification of that used by Jane and Chen ( 1992) and Yuan
et al. (1993). The use of dimethyl sulfoxide (DMSO) was avoided as it interfered with
MALDI-MS analysis and led to difficulties in the freeze-drying of the debranched
amylopectin hydrolysate. Purified starch (100 mg) was dispened in 9 mL distilled water
and heated in a boiling water bath for 1 h. After k ing cooled to room temperature, I mL
sodium acetate buffer (0.5 M, pH 3.5) and 1 mL isoarnylase solution (30000 U) were
added to the above starch solution in sequence. The mixture was incubated in a shaker
bath at 40 C for 48 hr to complete the debranching reaction. The debranched starch
solution was boiled for 5 min to inactivate the enzyme, cooled, and 10 rnL of solution
filtered through a Sep-pak Cl8 carüidge at a flow rate of 1 mUmin.
D d t i n g and Macro-sep procedure for MALDI-MS. The filtrate from the
Seppak Cl8 cartridge afier debnuiching was then put into a 30 K Macro-sep
' Dcbranching of starch was conducted by Dr. Jiang in Department of Agriculniral. Food and Nutritional Science at the University of Alberta, Edmonton, AIberta.

concentrator and centrifuged at 5000 x g for 90 min. The 30 K Macro-sep filtrate (2 mL)
was loaded on a Sephadex G10 desalting column (1.8 cm x 13 cm). A flow rate of 0.7
mUmin was maintained and fractions (1 mUfhction) were collected. Fractions 10 to 17
were combined and made up to 10 rnL. This sample solution was ready for MALDI-MS
analysis.
Gel pemeation column chromatography? The debranched starch solution was
also concentrated using a rotary evaporator under vacuum at 50 C and fractionated on a
Sepharose CL-6B column. The column (1.5 cm x 80 cm) was run in the descending mode
with degassed and deionized distilled water as the eluent. The flow rate was about 0.33
mUrnin, and fractions of 2.3 1 mL each (7 min.) were collected and analyzed for total
carbohydrate content using the phenoi sulfuric acid method (Dubois et al., 1956). The gel
permeation chromatography profile showed two peaks. One narrow peak (Fraction I)
followed by a broad peak (Fraction Q. Fraction II was used for MALDI-MS analysis.
MALDI-MS. MALDI-MS was performed using the Bmker proflexTM III linear
mode, Bruker Analpical Systems hc. (Billerica, MA). Mdtooligosaccharides, that
cocrystallized with matrices on the probe using solvent evaporation, w m desorbed and
ionized by a nitrogen laser pulse (337 nrn), and then accelerated under 20 kV with tirne-
delayed extraction before entering the time of flight mass spectrometer. THAP, 3-AQ,
and DHB were used as matrices. The preparation of matrices and samples followed Wang
et al. (1999, Chapter 2), but 10% ethanol was used as a solvent for DKB. Laser strength
was selected based on the degree of polymenzation of oligosaccharides to obtain good
signal-to-noise ratios. The number of laser pulses was acquired as 3 x 60 or 180 laser
pulses for a final MALDI-MS spectrum.
Quantification of standard maltooligosaccharides (DP 3 to DP 7) using MALDI-
MS was achieved using the standard addition rnethod (Chapter2, Wang et al., 1999).
Concentration of individuai maltooligosaccharides in the mixture was as follows: DP 3 =
1.62 x 10-~ M, DP 4 = 1.40 x 10-~ M, DP 5 = 1.47 x 10-~ M, DP 6 = 1.65 x 10-~ M and
DP 7 = 1.69 x M. The mixture was put through the entire sample preparation
Gel permeation colurnn chmatography was conducted by Dr. Jiang in Department of AgriculRirai. Food and Nutritionai Science at the University of Alberta, Edmonton, Alberta.

procedure (desalting and Macro-sep) before MALDI-MS andysis. DP 7 (2.8 x lo4 M)
was used as an added standard.
Statistics. Linear regressions, means and standard deviations were analyzed using
Microsoft Exce197 (Microsoft Office 97).
RESULTS AND DISCUSSION
For successful quantification of oligosaccharides using MALDI-MS there are
several concerns that must be addressed. Key concerns are selection of the appropriate
matnx and sample preparation conditions. The matrix should allow for good spot-to-spot
repeatability and a linear response for the senes of oligosaccharides of interest (discussed
later). Fragmentation of the oligosaccharides or their reaction with the matrix should be
avoided if possible, and there should be no discrimination for either high or low mass
ions at a single run/scan.
Choice of Matrix and Sample Conditions. The performance of different
matrices with oligosaccharides has been studied (Mohr et al., 1995; Pfenninger et al.,
1999). This study investigated the suitability of three commonly used matrices. 2',4',6'-
trihydroxyacetophenone (THAI)), 3-aminoquinoline (3-AQ), and 2,s-dihydroxybenzoic
acid (DHB). THAP gave very good spot-to-spot repeatability and produced abundant
molecular ions in the case of fnictooligosaccharides (Chapter 2, Wang et al., 1999). 3-AQ
generated sharp ion peaks with littie fragmentation to give good quality spectra. However
3-AQ was sensitive to contaminants, such as salts (Stahl et al., 1997; Naven et al., 1997).
DHB was the most cornmonly used matrix for a variety of different oligosaccharides
(Harvey, 1993; Garrozzo et al., 1995; Mohr et al., 1995; Kazmaier et al., 1998; Hao et al..
1998; Vinogradov and Bock, 1998). Quantification of carbohydrates using MALDI-MS
is possible when response factors are detedned in cornparison to an intemal standard.
For single oligosaccharides. linear responses were reported by Harvey (1993) and Bartsch
et al. (1996). However, the objectives of the present snidy were to analyze and quantify a
mixture of oligosaccharides in a single sample. Wang et al. (1 999, Chapter 2) have
reported similar linear responses for fnictooligosaccharides with different degrees of

polymerization and successfully used these response factors for quantification of these
oligosaccharides in a number of different food samples.
For makooligosaccharides (DP 3 to 7), the responses were influenced by the
matrix (Figure 3- 1). While the maltooligosaccharides depicted in Figure 3-1 had very
s i d a r molar concentrations, using THAP as matrix (Figure 3- 1B) their response
decreased with increasing masddegree of polymerization, while for 3-AQ and DHB
(Figure 3- 1A and C) the reverse was true. Kazmaier et ai. (1998) also found that when
Figure 3-1. MALDI-MS spectra of standard maltooligosaccharides. individual maltooIigosaccharides were dissolved in 0.01 M NaCl solution at a concentration of DP 3 = 1.62 x 10-~ M. DP 4 = 1.40 x M. DP 5 = 1.47 x IO" M, DP 6 = 1.65 x 10-~ M and DP 7 = 1.69 x lV3 M. Manices used: A. 3-AQ. B. THAP, and C. DHB.
DHB was used as the mauix, the responses of maltose (DP 2) and maltotriose (DP 3)
were much lower than those of mdtohexaose (DP 6) and mdtoheptaose (DP 7), although
the exact response relationships were not described. Further investigation of matrices
focused on THAP and DHB since these gave the best spot-to-spot repeatability, aiso
noted by Wang et al. (1999, Chapter 2) for fnictooligosaccharides.
Using DHB as the rnatrix and an excess of sodium chionde (0.0 1M in sarnple
solution), the concentrations of maltootigosaccharide standards, DP 4 to DP 7, were

varied and their responses compared to an identical amount of maltotriose (DP 3). The
responses for the predominant ionic f o m (molecuiar mass of positive ion plus one
sodium atom, w+Na]+) for each standard were linear with almost the same slope but
different intercepts (the parallel lines were in the order DP4eDP5 - DP 7 c DP 6).
However, from preliminary experiments with debranched starch samples, it was obvious
that the ionic f o n s of maltooligo/polysaccharides in these samples would be difficult to
control. Attempts to preferentially fom a single ion using Nafion membrane ion
exchange (Bomsen et ai., 1995) or by adding excess alkali salt (Chapter 2, Wang et al.,
1999; Pfenninger et al., 1999) could not be used since both methods suppressed the
formation of high DP maltooligo/polysaccharide ions, especially for DP > 15. A further
complication that had to be addressed in the MALDI-MS of maltooligo/polysaccharides
was the formation of fragmentation peaks.
Using a Linear MALDI-MS, post-source decay, that is fragmentation of ions after
extraction, is not a concem. However in-source decay cm lead to multiple peaks.
Fragmentation of complex carbohydrates is known to occur by both giycosidic and cross-
ring cleavage (Naven et al., 1997). It became clear that THAP (Figure 3-1 B) gave more
fragmentation peaks than DHB (Figure 3-1 C). For this reason, and improved sensitivity
for maltooligo/polysaccharides, DHB was chosen for further investigations. The major
peaks noted with standards and debranched starch samples using DHB were a sodium
adduct ion (m+Na]+), a potassium adduct ion (w+K]+), and a fragment ion with a loss
of water from its parent sodium adduct ion ([M-H20+Na]3. While the affinity of alkali
metals to carbohydrates has been described in the following order H<Li<Na<K<Cs
(Bomsen et al., 1995; Naven et al., 1997). the ion relationship was more complex in the
debranched starch samples. Generally loss of water occurred more frequently with low
molecular mass maltooligo/polysaccharides whiie the arnount of potassium adduct ions
increased with the incieasing mass of the maltooligo/polysaccharides (Figure 3-2), until
(around DP 26) the potassium adduct ion became the predominant peak rather than the
sodium adduct ion. However, a detailed examination of the ratio of these peaks in
debranched starch samples indicated an even more complex relationship (Figure 3-3).
This general trend was also noted in the debranched waxy barley starch sample.

Figure 3-2. MALDI-MS spectrum of a debranched waxy corn starch sample passed through the Macro-sep and desalting procedure. DHB was used as the rnatrix.
Quantification of maltooligolpolysaccharides in debranched starch sarnples.
Initially the experiments were carried out with debranched waxy corn starch. Considering
dl factors the matrix of choice was DHB. Increased laser strength resulted in some
increase in fragmentation so the laser power was attenuated as much as possible and kept
constant from sarnple to sample. The fragmentation of greatest concem with debranched
starch samples would be glycosidic cleavage since this would overestimate lower DP
maItooligolpolysaccharides, however when these samples were subjected to increasing
laser strength there was no large shift in the distribution of maitooligo/polysaccharides
(Figure 3-2 and Figure 3 4 , bottom spectrum). Note that the DP 11 peak had the highest
response in both spectra Since dimethyl sulfoxide interferes with MALDI-MS response,
this solvent was avoided in the starch debranching step. Sample preparation after
debranching of the starch with isoamylase involved filtration of the solution through a
reversed phase camidge, ultracentrifugation using a centrifuge concentrator io remove
hi@ molecular weight starch (amylose or undebranched amylopectin) and desalting to
remove ionic suppression from excess alkaii ions.

ûegree of polyrnerization
Figare 33. The trend of peak ratios of [M+K]' or [M-H20+Na]' over [M+NaJ+ changing with the degree of polyrnerization in a debranched waxy corn starch sample. Curve A and diamonds: Peak ratios of [M+KJ' over [M+Na]'. Curve B and triangles: Peak ratios of FI-&û+Na]+ over [M+Na]+.
Figure 3-4. MALDI-MS spectra of the same sample as in figure 3-2. DHB was used as the ma& The top spectnm was produccd at the same laser strength as in Figure 3-2 with the interna1 standard dtoheptaose (DP 7) added and the bottom spectrum, at a higher laser strength and without the internat standard.

When standard maltooligosaccharide (i.e. using DP 7 with DP 6 as the intemal
standard) responses were evaluated with DHB using different concentrations, it was
found that summation of the various ion responses (M+NalC plus MM]' plus FI- HzO+Na]9 gave an excellent linear correlation (R' = 0.99) on a weight basis. It should be
noted that for individual maltooligo/polysaccharides al1 ion responses exhibited a linear
comlation, but as noted above and also indicated in Figure 3-3, lower DP
maltooligo/polysaccharides had very different ion ratios than higher DP
maltooligo/polysaccharides. The linear relationship for maltooligoipolysaccharides was
different from that found for fnictooligosaccharides (Chapter 2, Wang et al., 1999) since
the linearity for fiuctooligosaccharides was for molar concentrations not weight
concentrations.
When maltooligosaccharide standards at known concentrations were subjected to
the entire debranched starch purification sequence (desalting and Macro-sep), the
recoveries of DP4 to 7 were within 5% of their expected values using MALDI-MS
quantification. This indicated that there were no significant losses of material in the
purification scheme and that the MALDI-MS quantification, at least for these
maltooligosaccharides, was valid. Finally, as can be seen in Figure 3-4 (upper spectmm)
addition of a pure maltooligosaccharide interna1 standard @P 7) to the debranched starch
mixture did not have a marked effect on the relative ion ratios. This meant that a standard
addition method could be used (as fint show by Wang et al., 1999, Chapter 2) to
determine both the relative and absolute amounts of each maitooligo/poIysaccharide
using the weight concentration relationship.
In order to compare both protocols for sample preparation (after debranching by
enzyme hydrolysis), the maltooligo/polysaccharides pattern of debranched waxy corn
amylopectin was determined by the developed method, that is desdting and Macro-sep
procedure, and the traditional column elution method. The patterns obtained (not
presented) through both methods were found to be identical. To test the use of the
developed methodology to examine the maltooligo/poIysacchande pattern from some
other debranched starch samples, MALDI-MS was carried out for debranched starch
amylopectin fiom waxy and regular barley (Figure 3-5).

Figure 3-5. MALDI-MS spectrurn of debranched. Waxy Candle barley starçh passed through desaiting and Macro-sep procedure (top spectrum) and regular Phoenix barley starch prepared by traditional method, k e z e dried, 6.4 mg/mL in double deionized water (bottom spectrum),
This protocoUmethodology can be used to obtain maltooligo/polysaccharide
patterns in less than two hours afier the debranching step and therefore has advantages in
speed as well as detail over other methods presently used for starch molecular
c haracterization.
While Our methodology could be shown to apply to the quantification of al1 pure
maltooligosaccharide standards available, there might still be doubt that the higher DP
maltooligo/polysaccharides (higher than DP 7) in debranched amylopectin behaved in a
similar manner. As a final check, the average DP of the maltooligo/polysaccharides in the
investigated debranched waxy corn sample (Figure 3-2) was determined using MALDI-
MS quantification. The average DP was found to be 14.5 0.4 (n = 3, RSD = 2.7%). One
of the most accurate assessments of the degree of branching (and therefore the average
DP in debranched starch) is a recent 13c IWR study, which indicated that the branching
degree of amylopectin fiom waxy corn was 6.0 * 0.746 (Falk et al., 1996). From this

value, the derived average DP would range from 14.9 to 18.9, very close to the value
found using the MALDI-MS method.
In conclusion, MALDI-MS is a very rapid and accurate technique with high
sensitivity for analysis of maltooligo/polysaccharide mixtures. The responses of
maltooligo/polysaccharides in MALDI-MS were matnx related, and DHB was found to
be most effective for quantification of the maltooligo/polysaccharides that resulted from
debranched amylopectin using a weight to summed ion response relationship. Along with
the new rapid purification procedure this methodology can be used to determine the
relative pattern of debranched starch rnaitooligo/polysaccharides faster and with greater
accurac y than an y present anal ytical methodology.
Bartsch, H.; Konig, W. A.; StraBner, M.; Hintze, U. Quantitative determination of
native and methylated cyclodextrins by matnx-assisted laser desorptionhonization time-
of-flight mass spectrometry. Carbohydr. Res. 1996,286,4 1-53.
Bomsen, K. O.; Mohr, M. D.; Widmer, H. K. Ion exchange and purification of
carbohydrates on a ~afion" membrane as a new sample pretreatment for matrix-assisted
laser desorption/ionization mass spectrometry. Rapid Commun. Mass Spectrom. 1995,9,
103 1-1034.
Dubois, M.; Gilles, K. A.; Hamilton, J. K.; Rebers, P. A.; Smith, F. Colorimetric
method for determination of sugan and related substances. Anal. Chem. 1956,28,35&
356.
Falk, H.; Micura, R.; Stanek, M.; Wutka, R. Structural aspects of native and acid
or enzyme degraded amylopectins - A "C NMR study. StarcNStürke. 1996,48,344-
346.
Garrozzo, D.; Impallomeni, G.; Spina, E.; Sturiale, L. Matrix-assisted laser
desorptionhonization mass spectrometry of polysaccharides. Rapid Commun. Mass
Spectrom. 1995,9,937-94 1.

Hao, C.; Ma, X.; Fang, S.; Liu, 2.; Liu, S.; Song, F.; Liu, J. Positive and negative
ion mahix-assisted laser desorptionlionization mass spectromeûy of saccharides. Rapid
Commun. Mass Spectrom 1998,12,345-348.
Harvey, D. J.; Quantitative aspects of the mauix-assisted laser desorption mass
spectrometry of complex oligosaccharides. Rapid Commun. Mass Spectrom. 1993,7,
614-619.
Hizukuri, S. Relationship between the distribution of the chah length of
amylopectin and the crystalline structure of starch granules. Carbohydr. Res. 1985, 14 1,
295-306.
Hizukuri, S.; Kaneko, T.; Takeda, Y. Measurement of the chain length of
amylopectin and its relevance to the origin of crystalline polymorphism of starch
granules. Biochem. Biophys. Acta. 1983,760, 188- 19 1.
Jane, J. L.; Chen, J. F. Effect of amylose molecular size and amylopectin branch
chain length on paste properties of starch. Cereal Chem. 1992,69,6û-65.
Kazmaier, T.; Roth, S.; Zapp, J.; Harding, M.; Kuhn, R. Quantitative analysis of
maltooligosaccharides by MALDI-TOF mass spectrometry, capillary electrophoresis and
anion exchange chromatography. Fresenius J. Anal. Chem. 1998,36 1,473478.
Mock, K. K.; Davey, M.; Cottrell, J. S. The analysis of underivetised
oligosaccharides by matrix-assisted laser desorption mass spectrometry. Biochem.
Biophys. Res. Commun. 1991, 177,644-65 1.
Mohr, M. D.; Bomsen, K. O.; Widmer, H. M. Matrix-assisted laser
desorptiodionization mass spectrometry: Improved matnx for oligosaccharides. Rapid
Commun. Mass Spectrom 1995,9,809-8 14.
Naven, T. J. P.; Harvey, D. J.; Brown, J.; Critchiey, G. Fragmentation of complex
carbohydrates following ionization by matrix-assisted laser desorption with an instrument
fitted with time-lag focusing. Rapid Commun. Mms Spectrom 1997,11, 168 1-1686.
Pfenninger, A.; Karas, M.; Finke, B.; Stahl, B.; Sawaaki, G. Matrix optimization
for matrix-assisted laser desorption/ionization mass spectmmetry of oligosaccharides
fiom human milk. J. Mms Spectrom 1999,34,98-104.

Robin, J. P.; Mercier, C.; Charbonniere, R.; Guilbot, A. Litnerized starches, gel
filtration and enzyrnatic studies of insoluble residue from prolonged acid treatment of
potato starch. Cereol Chem. 1974,57,389406.
Stahl, B.; Lions, A.; Karas, M.; Hillenkamp, F.; Steup, M. Analysis of fmctans
fiom higher plants by matrix-assisted laser desorptiodionization mass spectrometry.
Anal. Chem. 1997,246,195-204.
Vasanthan, T.; Bhatty, R. S. Starch purification after pin-rnilling and air-
classification of waxy, normal and high amylose barleys. Cereal Chem. 1995,72,379-
384.
Vinogradov, E.; Bock, K. Stnictural determination of some new oligosaccharides
and analysis of the branching pattern of isomaltooligosaccharides from beer. Carbohydr.
Res. 1998,309,5744.
Wang, J.; Spoms, P.; Luw, N. L. Analysis of food oligosaccharides using
MALDI-MS: Quantification of fmctooligosaccharides. J. Agric. Food C h . 1999,47,
1549-1 557.
Yuan, R. C.; Thompson, D. B.; Boyer, C. D. Fine structure of amylopectin in
relation to gelatinization and retrogradation behavior of maize starches from three wxy-
containing genotypes in two inbred Iines. Cereal Chem. 1993,70,8 1-89.

Chapter 4
Analysis of Anthocyanins in Red Wine and Fruit Juice using
MALDI-MS1
INTRODUCTION
Anthocyanins are an important family of flavonoid compounds and have been
thoroughiy studied. They are widely distributed in nature, occumng in most higher
plants, and are responsible for most of the red or purple colors in red wine and fruit juice.
The anthocyanin profile for any given plant is distinctive, and the arnount and
composition of anthocyanins are important to red wine and h i t juice color (Gao et ai..
1997; Hong and Wrolstad 1990a). Anthocyanin anaiysis has been very useful in studying
the changes in anthocyanins in red wine or fruit juice and in distinguishing arnong
dif feren t species.
Anthocyanins from many plants, including fruits, have been separated and
analyzed by paper chromatography (Dekazos, 1970; Carnire and Clydesdale, 1979;
Francis, 1985; Mazza and Veliogiu, 1992; Gao and Cahoon, 1995), thin-layer
chromatography (Wrolstad and Stnithers, 1971; Barritt and Torre, 1973; Pouget et ai.,
1990; Dussi et ai., M5), and high performance liquid chromatography (HPLC) (Wulf
and Nagel, 1978; Camire and Clydesdale, 1979; Goiffon et al., 199 1: Mana and
Velioglu, 1992; Gao and Mazza, 1994; Gao et al., 1997). HPLC coupled with photodiode
array detection has often been used to quditatively and quantitatively analyze
anthocyanins and their glycosylated or acylated groups utilizing relative retention times
and UV-vis spectra (Williams et al., 1978; Hong and Wrolstad, 1990% b; Goiffon et ai.,
199 1; Dallas et al., 1996). Fast atom bombardment mass spectrometry (FAB-MS) and
nuclear magnetic resonance (NMR) have proven to be powerful supporting techniques
for detailed structural determination of anthocyanins (Terahara and Yamaguchi, 1986;
' A version of this chapter has been published. Wang, J.; Spoms, P. Analysis of anthocyanins in red wine and fruit juice using MALDI-MS. J. Agric. Food Chem 1999,47,2M39-20 15.

Baubils and Berber Jiménez, 1995; Farina et al., 1995; Escribano et al., 1996; Bakker et
al., 1997% b; Takeoka et al., 1997). HPLC coupled with a mass spectrometer (HPLCIMS)
using an atmospheric pressure ionization (API) interface has also been successfully
applied to identify anthocyanins of Vitis vinifiera L. (Baldi et al., 1 995). Recently,
electrospray ionization (EST) mass spectrometry and ion trap multiple mass spectrometry
(MSMS) have aiso been used as another tool for detection and identification of
anthocyanins (Takeoka et ai., 1997; Piovan et ai., 1998).
Matrix-assisted laser desorptiodionization mass spectrometry (MALDI-MS) was
fint introduced in 1987 and originally developed for large biomolecules (Karas et al.,
1987). MALDI-MS has advantages over other methodologies including the ease of use,
speed of analysis, high sensitivity, wide applicability combined with a good tolerance
towards contarninants, and the ability to analyze complex mixtures (Karas, 1996).
However, simple MALDI-MS instruments can not tell the difference between isornen,
which have the sarne mas. The potential application of MALDEMS in food systems
allows for the analysis of most molecules. Presently MALDI-MS food applications are
limited and reviewed by Spoms and Wang (1998). While this manuscript was under
review, Sugui et al. (1998) reported using MALDI to analyze 3-deoxyanthocyanidins and
anthocyanins in sorghum plant tissue. This study focused on qualitative aspects and
detection lirnits for some anthocyanins. However, our study represents the first
application of a rapid MALDI-MS procedure for both qualitative and quantitative
analysis of anthocyanins in several important foods.
MATERIALS AND METHODS
Materials and Reagents. Merlot '96, Pinot Noir '96, and Cabernet Sauvignon
'97 were purchased fiom local markets in Edmonton, Alberta, Canada. Zinfandel'98 was
homemade wine from a kit. Concord grape juice, cranberry juice, and raspberry symp
were also fiom local markets. Malvidin 3,5-glucoside was purchased from Indofine
Chem. Co. (St. Louis, MO). Pelargonidin 3-glucoside, cyanidin 3-glucoside, cyanidin 3-
rutinoside, peonidh 3-glucoside and malvidin 3-glucoside were obtained from
Extrasynthese S.A. (Genay Cedex, France). 1-Kestose and nystose were a gift fm Dr.

A. Ohta, Nutritional Science Center, Meiji Seika Kaisha, Japan. 2',4',6'-
Trihydroxyacetophenone monohydrate (THAP) was obtained from Aldrich Chem. Co.
(Milwaukee, WI).
Extraction of Anthocyanins €rom Red Wine, Fruit Juice and Spp. A 200
mL sample of red wine was fust prepared by removai of ethanol (about % volume) using
a Rotavopor in vacuo with a bath temperature maintained at 35 C, and then made up to
200 mi, with doubly deionized water in a volurnetric flask. Fruit syrup was diluted with
an equal volume of water because of its high viscosity. Either 10 rnL of ethanol free red
wine or h i t juice or 20 mL of diluted syrup sample was loaded ont0 a Sep-pak C 18
cartridge (Waters Associates, Milford, MA) with a flow rate of 1 mUmin, washed with
10 rnL of doubly deionized water three times, and eluted with 2 mL of methanoVformic
acidlwater in a ratio of 70:2:28 (v/v/v). The reddish purple anthocyanin extracts were
kept in a freezer at -20 C until used.
MALDI-MS. MALDI-MS was perfomed using the proflexTM III linear mode,
Bruker Analytical Systems Inc. (Billerica, MA). Anthocyanins cocrystailized with
matrices on the probe were ionized by a nitrogen laser pulse (337 nm) and accelerated
under 20 kV with time-delayed extraction before entering the tirne of flight mass
spectrometer. 2',4',6'-Tri h ydrox yacetophenone (THAP) in acetone (0.5 pL) was applied
on the probe fust, air-dried, and then 1 pL of extracted anthocyanin solution or 2 pL of
preparative HPLC fraction spotted directiy over the THAP crystds and further air dried.
MALDI-MS was perfomed at an attenuation of 3 1 (the Iower the attenuation, the higher
the laser strength) to obtain the best signal-to-noise ratios and the best possible isotopic
resolution with two-point extemal caiibration using [kestose + KI+ (exact isotopic mass =
543.1327) and [nystose + KI' (exact isotopic mas = 705.1856) as calibrants, resulting in
a mass accuracy of S 400 ppm. Each spectrum represents the sum of 30 laser pulses.
The responses of individuai anthocyanins in MALDI-MS were recorded using
cyanidin 3-nitinoside as the internal standard. The response of maividin 3-glucoside in a
food sample using MALDI-MS was obtained by adding malvidin 3-glucoside to Concord
grape juice extracts, diluted with an equal volume of appropriate solution from the
original anthocyanin extracts. The preparation of matrix and samples was as descnbed
above. In this study, the peak with a mass of 449 (cyanidin 3-glucoside) was used as a

reference peak and therefore was arbitrarily set to a value of 1.0 to study the response of
added malvidin 3-glucoside in the juice extract. Each data point represented the mean of
spectra collected from ihree sample positions. Therefore, each specaim was collected
from three randomly chosen spots per sample position for a total of 3 x 30 laser pulses, or
90 laser pulses in total. The major isotopic 12c peak height was used for quantification.
Preparative EPLC. The preparative HPLC system consisted of a Varian VISTA
5500 high performance liquid chromatography, a Varian 9090 autosarnpler, and a Spectro
Monitor III W detector. The chromatography system was equipped with a 75 mm x 4.5
mm pre-injection C 18 saturator column containing silica-based packing (1 2 p) and a 50
mm x 4.6 mm guard column containing Supelco LC- 18 reverse-phase packing (20-40
pm). Anthocyanins were separated on a SPLC- 18-DB 250 mm x 10 mm (5 pm)
preparative reverse-phase colurnn (SUPELCOSIL, SUPELCO, Bellofonte, PA). The
solvents used were 5% (v/v) aqueous formic acid (solvent A) and formic
acid/water/methanol in a ratio of 5:5:90 (v/v/v) (solvent B). The flow rate was rnaintained
at 4.5 mUmin, with a linear gradient profile consisting of solvent A with the foilowing
proportions (vlv) of solvent B: O min, 5% B; 0-1 min, 520% B; 1-12 min. 20-25% B; 12-
32 min, 2532% B; 32-38 min, 3245% B; 38-44 min, 100% B; 44-46 min, 100% B; 46-
47 min, 100-5% B. Detection was at 525 nm. The total run time was 55 min. Sample
extracts (500 pL) were injected into the HPLC for preparative collection. A Shimadzu
CLASS-VPchromatography data systern was used to monitor the eluted peaks, and the
anthocyanin fractions of interest were collected for direct UV-vis spectrometry and
MALDI-MS analysis.
The chromatography of individual standard anthocyanins was achieved using the
same conditions as above except employing a linear gradient profile as follows: O min,
5% B; 0-1 min, 5% B; 1-2 min, 547% B; 2-7 min, 17-1946 B; 7-9 min, 19-28% B; 9-17
min, 28-34% B; 17-21 min, 3470% B; 21-22 min, 70-100% B; 22-23 min, 100% B; 23-
24 min, 5% B. Total run time was 26 min. The flow rate was set at 5.5 mifmin. For these
analyses, an injection volume of 140 pL was used.
Statistics. Linear regnssions were analyzed using Microsoft Exce197 (Microsoft
Office 97).

RESULTS AND DISCUSSION
Anaiytes are usually desorbed and ionized in the MALDI-MS source, forming
protonated or alkali adduct ions. However, because anthocyanins under acidic condition
are predominately in the aromatic oxonium ion fom, they easily ionize in MALDEMS to
form molecular weight cations M+ in the positive ion mode (Figure 4-1).
Figure 4-1. MALDI-MS spectrum of standard mdvidin 3-glucoside (3.90 xl~*'M). Note that rnatrix peaks are! al1 at masses l es than 400.
Anthocyanins in Red Wine. Figure 4-2 is the MALDI-MS anthocyanin spectra
from red wine extracts. Anthocyanins listed in HPLC elution order from important wine
varieties are shom in Table 4-1. Malvidin 3-glucoside, as expected, was the major
anthocyanin (Wulf and Nagel, 1978; Nage1 and Wulf, 1979; Gao et ai., 1997). Table 4- 1
also shows some of the anthocyanin masses obtained using MALDI-MS, which are in
excellent agreement to their theontical values. The peak with mass of 493 (rnalvidin 3-
glucoside) is the major peak. Three major anthocyanins were successfully isolated as
preparative HPLC fractions from ZUifandel wine extract and then were applied to
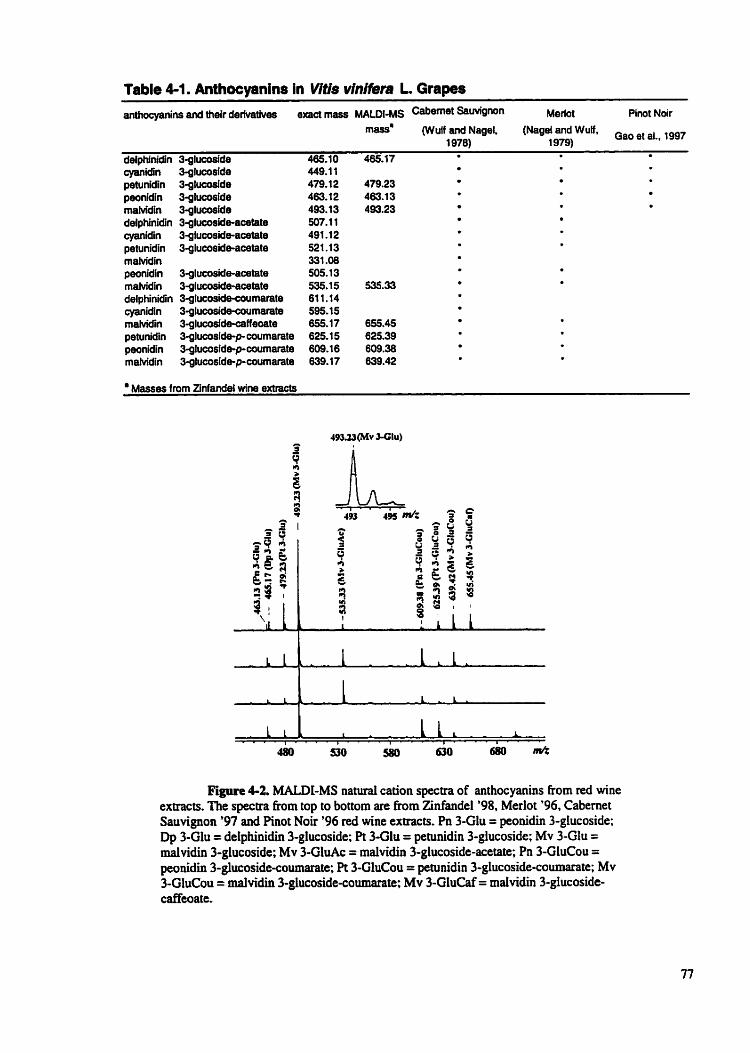
Table 4-1. Anthocyanins in Vitis vinifera L, Grapes
anthowns and their derivathres exact m a s MAU)[-MS Sauvigmn Merlot Pinot Noir masse (Wuif and Nagel. (Nagel and Wulf. et &, 1997
1 978) 1979)
delphinidfn 3glucoside 465.10 465.17 O *
cyanidin 3qlucoside 449.1 1 *
petunidin 3-glucoside 479.12 479.23 . peonidin 3-glucodde 463.12 483.13 O O
maMdin 3glucosfde 403.13 493.23 *
delphinidin 3glucosMe-acetate Sû7.11 cyanidin 3qluwside-acetate 491.12 t
petunidin 3-glucoside-acetate 521 .13 . *
maividin 331 .O8 peonidin 3-glucoside-acetate 505.13 O
maividin 3glucosiâe-acetate 535.1 5 535.33 delphinidin 3-glucosidecoumarate 61 1 . t 4 O
cyanidin 3glucosidecoomarate 595.15 mahridin 3-glucoside-caffeoate 655.17 655.45 petunidin 3-glucoside-p coumarate 625.1 5 625.39 O
peonidin 3-gluçasfde-pcoumarate 609.1 6 609.38 maividin 3glucoslde-p-coumarate 639.17 639.42 t
Masses from llnfandel wine extracts
Figure 4-2. MALDI-MS natural cation spectra of anthocyanins from red wine extracts. The spectra fiom top to bottom a e fkom Zinfandel '98, Merlot '96, Cabernet Sauvignon '97 and Pinot Noir '96 red wine exîracts. Pn 3-Glu = peonidin 3-glucoside; Dp 3-Glu = defphinidin 5glucoside; Pt 3-Glu = petunidin 3-glucoside; Mv 3-Glu = maividin 3-glucoside; Mv IGluAc = malvidin 3-glucoside-acetate; Pn 3-GluCou = peonidii 3-glucoside-coumarate; Pt 3-GluCou = petunidin 3-glucoside-coumarate; Mv 3-GluCou = malvidiin 3-glucoside-coumarate; Mv 3-GluCaf = mdvidin 3-glucoside- caffeoate-
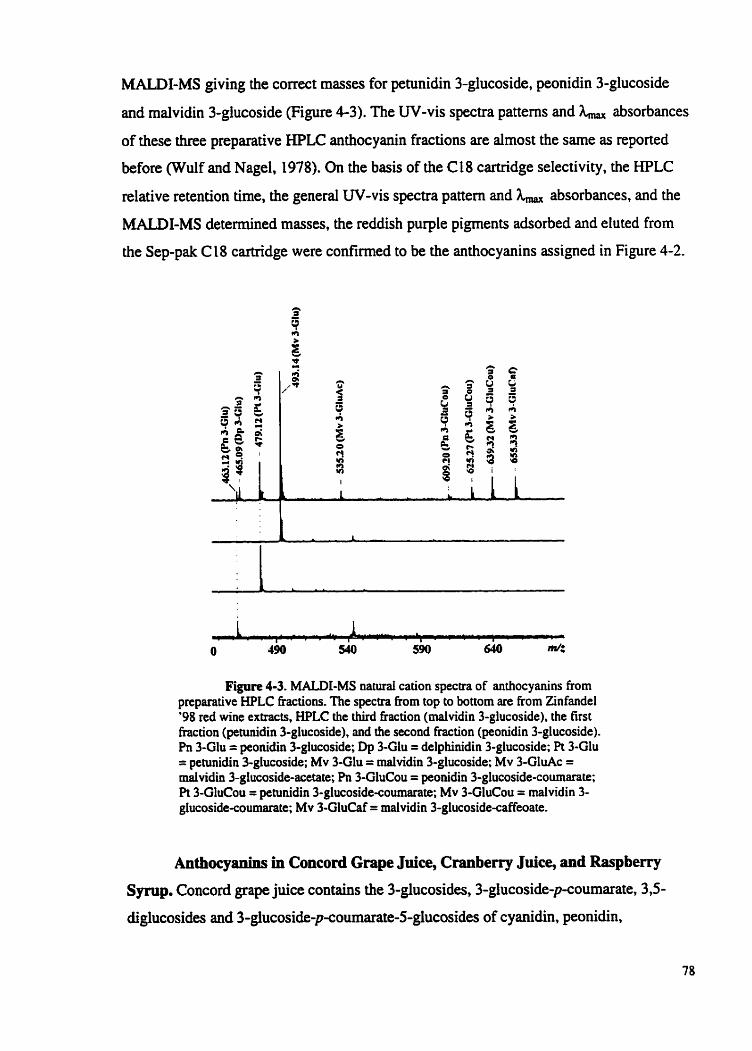
MALDI-MS giving the correct masses for petunidin 3-glucoside, peonidin 3-glucoside
and malvidin 3-glucoside (Figure 4-3). The UV-vis spectra patterns and absorbances
of these three preparative HPLC anthocyanin fractions are almost the same as reported
before (Wulf and Nagel, 1978). On the basis of the Cl 8 cartridge selectivity, the KPLC
relative retention time, the general W-vis spectra pattern and & absorbances. and the
MALDI-MS detemiined masses, the reddish purple pigments adsorbed and eiuted from
the Sep-pak C 18 cartridge were confimed to be the anthocyanins assigned in Figure 4-2.
Figure 43. MALDI-MS naturai cation specira of anthocyanins from preparative EPLC fractions. The spectra from top to bottom are from Zinfandel '98 red wine extracts, HPLC the third fraction (malvidin 3-glucoside), the first fraction (petunidin 3-glucoside), and the second frciction (peonidin 3-glucoside). Pn 3-Glu = peonidin 3-glucoside; Dp 3-Glu = delphinidin Zglucoside; Pt 3-Glu = petunidin Iglucoside; M v 3-Glu = malvidin 3-glucoside; Mv 3-GluAc = malvidin 3-glucoside-acetate; Pn 3-GluCou = peonidin 3-glucoside-coumarate; Pt 3-GluCou = petunidin 3-glucoside-coumarate; M v 3-GluCou = malvidin 3- ghcoside-coumarate; M v 3-GluCaf = malvidin 3-glucoside-caffeoate.
Anthocyanins in Concord Grape Juice, Craaberry Juice, and Raspberry
Syrnp. Concord grape juice contains the 3-glucosides, 3-glucoside-p-coumarate, 33-
diglucosides and 3-glucoside-p-coumarate-5-glucosides of cyanidin, peonidin,

Figure 44. MALDI-MS naturai cation spectrum of anthocyanins Irom Concord grape juice extracts Cy 3-Glu = cyanidin 3-glucoside; Pn 3-Glu = peonidin 3-glucoside; Dp 3-Glu = delphinidin 3-glucoside; Pt 3-Glu = petunidin 3- glucoside; Mv 3-Glu = malvidin 3-glucoside; Cy 3-GtuCou = cyanidin 3- glucoside-coumarate: Pn 3-GluCou = peonidin 3-glucoside-coumarare; Cy 3 5 diGlu = cyanidin 3,idiglucoside: Dp 3-GluCou = delphinidin 3-glucoside- cournarate; Pn 33-diG1u = peonidin 3.5-diglucoside: Pt 3-GluCou = petunidin 3- glucosidecoumarate; Mv 3-GluCou = malvidin 3-glucoside-coumarate; Cy 3- GluCou-5-Glu = cyanidin 3-glucoside-coumarate-5-glucoside; Pn 3-Glucou-5-Glu = peonidin 3-glucoside-coumarate-5-glucoside; Pt 3-GluCou-5-Glu = petunidin 3- glucoside-coumarate-5-glucoside; Mv 3-GluCou-5-Glu = malvidin 3-glucoside- coumarate-5-glucoside.
delphinidin, petunidin and malvidin with cyanidin Zgiucoside and delphinidin 3-
glucoside as the major pigment constituents (Hrazdina 1975; Williams and Hrazdina
1978). MALDI-MS results confcmed the presence and relative amounts of these
anthocyanin and their derivative profiles, in good agreement with the literature. The
peaks with masses 449 (cyanidin 3-glucoside) and 465 (delphinidin 3-glucoside) are the
major peaks (Figure 4-4; Table 4-2). Because delphinidin 3-glucoside-ptoumarate and
cyanidin 3,s-diglucosides have dmost the same mass of 6 1 1, these anthocyanins came
out at the same d z of 6 1 1 in MALDI-MS spectra, as did peonidin 3,s-diglucosides and

Table 4-2. Anthocyanins from Concord Grape Juice
anthocyanins exact mass MALDI-MS mass
delphinidin 3,5-diglucoside 627.1 6 cyanidin 3,Sdiglucoside 61 1 .16 611.19 petunidin 3.5-diglucoside 641.1 7 peonidin 3,S-diglucoside 625.1 8 625.23 malvidin 3,5-diglucoside 655.1 9 delphinidin 3-glucoside 465.1 O 465.1 6 cyanidin 3-g lucoside 449.1 1 449.1 4 petunidin 3-glucoside 479.1 2 479.1 8 peonidin 3-glucoside 463.1 2 463.1 6 malvidin 3-glucoside 493.1 3 493.1 7 delphinidin 3-glucoside-coumarate 611.14 611.19 cyanidin 3-g1ucoside-coumarate 595.1 5 595.21 petunidin 3-glucoside-coumarate 625.1 5 625.23 peonidin 3-glucoside-coumarate 609.1 6 609.23 malvidin 3-glucoside-coumarate 639.17 639.24 delphinidin 3-glucoside-coumarate-5-glucoside 773.1 9 cyanidin 3-glucoside-coumarate-5-glucoside 757.1 9 757.18 petunidin 3-glucoside-coumarate-5-glucoside 787.21 787.1 2 peonidin 3-glucoside-coumarate-5-glucoside ni .21 nt .16 malvidin 3-glucoside-coumarate-5-glucoside 801.22 801 .O9
Previous research has confirmed the presence of the 3-galactoside and 3-
arabinoside of cyanidin and peonidin as the four major anthocyanins in cranberries with
the additional srnaIl amount of cyanidin fglucoside or peonidin 3-glucoside (Carnire
and Clydesdaie, 1979; Hong and Wrolstad, 1990a). Figure 4-5 shows the anthocyanin
spectra from cranberry juice, closely matching the exact isotopic masses of cyanidin 3-
arabinoside (theoretical value, 4 19.1 O), cyanidin 3-galactoside (449.1 1 ), peonidin 3-
arabinoside (433.1 1 ), and peonidin 3-galactoside (463.12).
Anthocyanins expected in raspbemes included cyanidin 3-sophoroside (mass:
6 1 1; the major anthocyanin), cyanidin 3-rutinoside, cyanidin 3-(2G-glucosylrutinose),
cyanidin 3-glucoside, pelargonidin 3-sophoroside, and pelargonidin 3-(2G-
glucosylnitinose) (Goiffon et al., 199 1 ; Boyles and Wrolstad, 1993). The anthocyanin
MALDI-MS spectrurn from raspberry syrup extracts shows the molecular cations M' at
m/r 449,595,6 1 1, and 757 corresponding to the exact isotopic masses of cyanidin 3-
glucoside (449.11), cyanidin 3-rutinoside (595.17) or pelargonidin fsophoroside
(595.17), cyanidin 3-sophoroside (6 1 1-16), and cyanidin 3-(2G-gIucosylnitinose) (757.22)
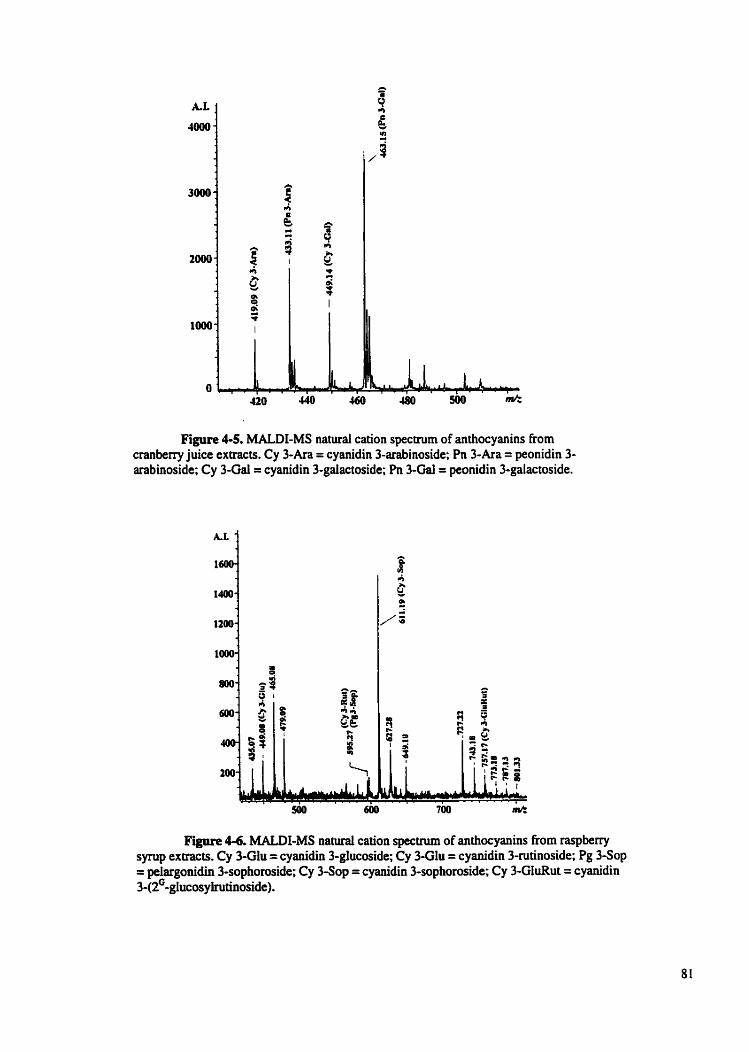
Figure 4-5, MALDI-MS natural cation spectrum of anthocyanins from cranberry juice extracts. Cy 3-Ara = cyanidin 3-arabinoside; Pn ?-Ara = peonidin 3- arabinoside; Cy 3-Ga1 = cyanidin 3-galactoside; h 3-Gai = peonidin 3-galactoside.
Figure 4-6. MALDI-MS natural cation spectnun of anthocyanins From raspberry s p p extracts. Cy 3-Glu = cyanidin 3-glucoside; Cy 3-Glu = cyanidin 3-rutinoside; Pg 340p = pelargonidin 3-sophomside; Cy 3Sop = cyanidin Esopboroside; Cy EGIuRut = cyanidin 3-(2G-g~ucosyirutinoside).

Responses of Anthocyanin 3-Glucosides. For quantification of anthocyanins
using MALDI-MS, the relative responses of the analytes are a key factor. Ideally, the
intensity or response of an analyte should be linearly correlated to its relative molar ratios
in a MALDI-MS sample. The relative responses of known amounts of individual
anthocyanins in MALDI-MS are shown in Figure 4-7. For monoglucoside anthocyanins,
the responses were only slightly different, but for a diglucoside anthocyanin, e.g.,
malvidin 3,5-diglucosides, or an anthocyanin with a second carbohydrate moiety to a 3-
glucoside, e.g., cyanidin 3-rutinoside, the relative molar response was only about one
fourth of that noted for monoglucoside anthocyanins. Figure 4-8 indicates the exact
Figure 4-7. MALDI-MS naturai cation spectrum of standard individuai anthocyanins. Pg 3-Glu = pelargonidin 3-glucoside (1.60 x IO" M, peak height 1060.8); Cy 3-Glu = cyanidin 3-glucoside (158 x 10'' M, peak height 1 122.0); Pn 3-Glu = peonidin Eglucoside (1.42 x ICI-' M. peak height 1357.6); M v 3-Glu = malvidin 3- glucoside (1.47 x 10' M. peak height 1256.6); Cy 3-Glu = cyanidin 3-rutinaside (2.21 x 10" M. peak height 489.6); M v 35-Glu = malvidin 3,5diglucosides (2.03 x IO-' M. mak heiht 38 1 . 9 .
responses of different concentration of monoglucoside anthocyanin for MALDI-MS
using cyanidin 3mtinoside as the interna1 standard. The Linear models were fit to the
responses of all monogIucoside anthocyanins (p = 0.94). Other evidence that the

0.0 I I I I l 1
2 4 6 8 10 12 Anthocyanfn concentration(pmolar)
Figure 4-8. Linear responses of individud anthocyanins in MALDI-MS. o. pelargonidin 3-glucoside; a. cyanidin 3-glucoside; x. peonidin 3-glucoside: +. rnalvidin 3- glucoside. For the total data points, Y = 0.29X -0.29 ( R ~ = 0.94). The concentration of individual anthocyanins ranged fiom 3.19 x lu6 M to 1.12 x lu5 M for pelargonidin 3-glucoside. 3.16 x 10 .~ M to 1.1 1 x 10.' M for cyanidin 3-glucoside. 2.83 x lad M to 1 .O x 10'' M for peonidin 3- glucoside, and 2.94 x L O ~ M to 1.03 x lûs M for maividin 3-glucoside. and interna1 standard cyanidin 3-rutinoside (4.42 x IO*^ M) in methanoUformic acidlwater = 70:2:28 (vtvtv).
responses of anthocyanins fit a linear mode1 was the response of maividin 3-glucoside
added to concord grape juice extracts. The addition of this anthocyanin to food extracts
also showed a linear response with ~ ~ d . 9 9 (Figure 4-9). AIso, the relative responses of
anthocyanins, for example, anthocyanins in red wine extracu, were not affected in
MALDI-MS by an addition of intemal standard cyanidin 3-rutinoside as shown in Figure
4-10. Al1 these factors indicate that the responses of individual anthocyanins in MALDI-
MS are predictable and unaffected by each other. When the individual anthocyanin
standard curves are plotted using an appropriate intemal standard or using the standard
addition method (Abel1 and Spoms. 1996; Chapter 2, Wang et al., 1999). al1 the
anthocyanins in food can be also quantitatively analyzed.
For cornparison, Figure 4-1 1 indicates the relative responses of standard
individual anthocyanins in HPLC system with detection at 525 nm. The peak areas of
individud anthocyanins with almost the same molar amount of anthocyanins were quite
different. This was because the maximum absorbance of anthocyanins was slightiy

Concentration of malvidin 3-glucoside in concord grape /uice extracts (p m olar)
Figure 4-9. Lin= MALDI-MS response of malvidin -3-glucoside (Y= 0.03 LX + 0.27. ~~=0.99) in Concord grape juice extracts. The concentration malvidin 3-glucoside ranged h m 1.95 x lo4 M to i .95 x 10" M.
Figure! 4-10. MALDI-MS natwaI cation spectra of anthocyanins with and without intemal standard. The spectra are Eiom Zinfandel'98 red wine extracts, which were diluted 20 times from original extracts, Top: with internal standard cyanidin frutinoside (4.42 x 10"~) ; Bottom: without internal standard. Note chat the addition of the internai standard has no effect on the relative responses of the O ther anthocyanins.

Figure 4-11. HPLC ctuomatography of standard anthocyanins in Figure 4-7. Integration values are (1) malvidin 3,5- diglucoside (peak area 227 729), (2) cyanidin 3-glucoside (peak area 295 507), (3) cyanidin 3-nitinoside (peak area 439 029), (4) pelasgonidin 3-glucoside (peak area 206 928). (5) peonidin 3- glucoside (peak area 157 198), (6) malvidin 3-glucoside (peak area 225 6 14).
different and the various isomeric fonns that can be formed were very dependent on pH
and the solvent variation. For quantification using HPLC, delphinidin 3-glucoside or
cyanidin 3-glucoside are often used as extemal standards and the arnount of individual
anthocyanins in samples expressed in tems of these standard anthocyanins (Takeoka et
al., 1997; Gao et al., 1997). Because responses Vary in different solvent systems, the
absolute arnount of anthocyanins in samples may be misinterpreted by comparîng to a
single extemal standard. Compared to HPLC, MALDI-MS shows a more consistent
response for a group of anthocyanins. Ceaallily for at least mono-glucoside anthocyanins,
it seems that any individuai anthocyanin can be used as a standard for others.
In conclusion, MALDI-MS is a very valuable technique for the rapid analysis of
anthocyanins. MALDI-MS can be used to obtain the exact masses of various
anthocyanins in food and can provide the anthocyanin profie in a food sarnple within a

few minutes. Also, the use of MALDI-MS to quanti@ anthocyanins has been
demonstrated with the use of appropriate intemal standards. FinalIy, we feel that
MALDI-MS can rnake a significant contribution to the use of anthocyanin "fingerprints"
to determine the authenticity of samples and to explore varietal and growth differences.
REFERENCES
Abell, D. C; Spoms, P. Rapid quantitation of potato glycoalkaloids by matrix-
assisted laser desorption/ionization time-of-flight mass spectrometry. J. Agric. Food
Chem. 1996,44,2292-2296.
Bakker, J.; Bride, P.; Honda, T.; Kuwano, H.; Saito, N.; Terahara, N.:
Timberlake, C.F. Identification of an anthocyanin occumng in some red wines.
Phytochem. 1997a. 44, 1375-1 382.
Bakker, J; Tirnberlake, C. F. Isolation, identification, and characterization of new
color-stable anthocyanins occurring in some red wines. J. Agric. Food Chem. 1997b, 45.
3 5-43.
Baldi, A; Romani, A; Mulinacci, N; Vincieri. F. F; Casetta, B. HPLCMS
application to anthocyanins of Vitis vinifera L. J. Agric. Food Chem. 1995,43,2 104-
2109.
Barritt, B. H.; Torre, L. C. Cellulose thin-layer chromatographie separation of
Rubus fruit anthocyanins J. Chromatogr. 1973,75. 15 1 - 155.
Baubils, A. J.; Berber Jimenez, M. D. Structural and conformational
characterization of a stable anthocyanin from Tradescantia pallida. J. Agric. Food Chem.
1995,43,64Q-646.
Boytes, M. J.; Wrolstad, R. Anthocyanin composition of red raspberry juice:
influences of cultivar, processing, and environmental factors. J. Food Sci. 1993,58,
1135-1 141.
Carnire, A. L.; Clydesdale, F. M. High-pressure liquid chromatography of
cranberry anthocyanins. J. Food Sci. 1979,44,926-927.

Dallas, C.; Ricardo da Silva, J. M.; Laureano, O. Products formed in mode1 wine
solutions involving andiocyanins, procyanidin B2, and acetaldehyde. J. Agric. Food
Chem. 1996,44,2402-2407.
Dekazos, E. D. Anthocpain pigments in red tart chemes. J. Food Sci. 1970,35,
237-24 1.
Dussi, M.C.; Sugar, D.; Wrolstad, R. E. Characterizing and quantifying
anthocyanins in red pears and the effect of Light quality on fruit color. J. Am. Soc. Hoflic.
Sci. 1995, 120,785-789.
Escribano, B. T.; Dangles, O.; Brouillard, R. Coupling reactions between
flavylium ions and catechin. Phytochem. 1996,41, 1583- 1592.
Farina, A; Doldo, A; Cotichini, V; Rajevic, M; Quaglia, M. G.; Mulinacci, N;
Vincieri, F. F. HPTLC and reflectance mode densitometry of anthocyanins in Malva
silvestris L.: A cornparison with gradient-elution reversed-phase HPLC. J. Phann.
Biomed. Anal.. 1995, 14,203-2 1 1.
Francis, F. J. Detection of enocyanin in cranberry juice cocktail by color and
pigment profile. J. Food Sci. 1985,50, 1640- 1642, 166 1.
Gao, L.; Girard, B.; Mazza, G.; Reynolds, A. G. Changes in anthocyanins and
color characteristics of Piont Noir wines during different vinification processes. J. Agric.
Food Chem. 1997,45, 2003-2008.
Gao, L.; Mazza, G. Quantification and distribution of simple and acylated
anthocyanins and other phenolics in blueberries. J. Food Sei. 1994,59, 105% 1059.
Gao, Y; Cahoon, G. A. High performance liquid chrornatographic analysis of
anthocyanins in the red seedless table grape Reliance. Am. J. Enol. Vitic. 1995,46,339-
345.
Goiffon, J. P.; Brun, M.; Beurrier, M. J.; Hi&-performance liquid
chromatography of red fniit anthacyanins. J. Chrornatogr. 1991,537, 10 1 - 12 1.
Hong, V.; Wrolstad, R. E. Characterization of anthocyanintontaining colorants
and fruit juices by HPLUphotodiode array detection. J. Agrîc. Food Chem. 1990b, 38.
698-708.
Hong, V.; Wrolstad, R. E. Use of HPLC separatiodphotodiode array detection for
characterization of anthocyanins. J. Agric. Food Chem 1990a, 3 8,708-7 15.

Hrazdina., G. Anthoc yanin composition of concord grapes. Lebensm Wiss.
Technol. 1975,8, 1 1 1 - 1 13.
Karas, M.; Bachrnann. D.; Bahr, U.; Hillenkamp, F. Matrix-assisted ultraviolet
laser desorption of non-volatile compounds. Int. J. Mass Spectrom. ion Processes. 1987,
78,53-68.
Karas, M.; Matrix-assisted laser desorption ionization MS: a progress report.
Biochem Mus Spectrom. 1996,24,897-900.
Mazza, G.; Velioglu, Y. S. Anthocyanins and other phenolic compounds in fruits
of red-flesh apples. Food Chem. 1992, 43. 1 13- 1 17.
Nagel, C.W.; Wulf, L.W. Changes in the anthocyanins, flavonoids and
hydroxycinnamic acid esters during fermentation and aging of Merlot and Cabernet
Sauvignon. Am. J. Enol. Vitic. 1979,30, 1 1 1 - 1 16.
Piovan, A.; Filippini, R.; Favretto, D. Characterization of the anthocyanins of
Catharanthus roseus (L.) G. Don in vivo and in vitro by electrospray ionization ion trap
mass spectrometry. Rapid Commun. Mass Spectrom. 1998, 12.36 1-367.
Pouget, M. P.; Vennat. B.; Lejeune, B.: Pourrat, A. Identification of anthocyanins
of Hibiscus sabdarfffa L. Lebenm Wiss. Technol. Food Sci. Technol. 1990,23, 10 1 - 102.
Sporns, P.; Wang, I. Exploring new frontiers in food analysis using MALDI-MS.
Food Res. Int. 1998,3 1, 18 1- 189.
Sugui, J. A.; Bonham, C.; La, S. C.; Wood, K. V.; Nicholson, R. L. MALDI-TOF
analysis of mixtures of 3-deoxyanthocyanidins and anthocyanins. Phytochemistq. 1998,
48, 1063-1066.
Takeoka, G. R.; Dao, L. T.; Full, G. H.; Wong, R. Y.; Harden, L. A.; Edwards, R.
H.; Bemos, J. D. J. Characterization of black bean (Phaseolus vulgatis L.) anthocyanins.
J. Agric. Food C h m 1997,45,3395-3400.
Terahara, N.; Yamaguchi, M. 1H NMR spectral analysis of the malylated
anthoc yanins from Dian thus. Phytochemistry* 1986,25,2906-2907.
Wang, J.; Sporns. P. Law, N. H. Analysis of food oligosaccharides using
MALDI-MS : quantification of Fnictooligosaccharides. J. Agric. Food Chem. 1999,47,
1549- 1557.

Williams, M.; Hrazdina, G. High-pressure liquid chromatographic separation of
3-glucosides, 3,s-diglucosides, 3-(6-O-p-coumaryl)glucosides 3-(6-O-p-coumaryl-
glucoside)-5-glucosides of anthocyanidins. J. Chromatogr. 1978, 15,389-398.
Wrolstad, R. E.; Struthers, B. Polyvinylpyrrolidone column chromatography of
strawberry, rhubarb, and raspberry anthocyanins. J. Chromtogr. 1971,55,405-408.
Wulf, L. W.; Nagel, C. W. High-pressure liquid chromatographic separation of
anthocyanins of Viris vinifera Am. J. Enol. Vitic. 1978.29.42-49.

Chapter 5
Comparison between HPLC and MALDI-MS Analysis of
Anthocyanins in Highbush Bineberries'
INTRODUCTION
Highbush bluebemes (Vaccinium corymboswn) are one of several Vaccinium
species native to North America Highbush bluebemes are grown commercially in Nonh
America, and more recently in other parts of the world, primarily for use in processed
food products. Highbush bluebemes. like some other commercial Vaccinium species (e.g.
lowbush blueberry, bilbeny) are noted for their high content of anthocyanin pigments. For
exarnple, highbush blueberries may contain more than 15 times the anthocyanin content
of strawbemes, and more than 3 times the pigment IeveI of raspberries (Kalt et al., 1999).
Anthocyanins have been of great interest to the food industry because of their important
contribution to food color. An extract of bilbeny (V. Myriillus) called ~ ~ r t o c ~ a n " is used
for various heaith applications, based on the reported bioiogicai activities of its
anthocyanins (Marazzoni and Bombardelli, 1996).
Rapid accumulation of anthocyanins is a characteristic event during ripening of
many fmit species. In highbush bluebemes, the extent of color change from white/green
to blue serves as an important visual indicator of fruit maturity. Under ripe fruit will
accumulate anthocyanins when either attached to, or detached from, the plant (Woodruff
etal., 1960; Suornalainen and Keranen, 1961). Anthocyanin analysis has been an
important element in characterizing the changes that occur in fruit during ripening and
after harvest.
There are fifieen major anthocyanins in highbush bluebemes (Sapers et al.. 1984;
Mana and Miniati, 1993; Kader et al., 1996); these are the 3-rnonoarabinosides, 3-
' A version of this chapter has been accepted for publication. Wang. J.; Kalt, W.: Spoms. P. Comparison between HPLC and MALDI-TOF MS analysis of anthocyanins in highbush bluebemes. J. Ag* Food Chem

monogdactosides, and 3-monoglucosides of cyanidin, delphinidin, peonidin, petunidin
and malvidin (Figure 5-1). Gao and Mazza (1994a) have identified small amounts of
acetylated anthocyanidin monoglycosides in the highbush variety Bluecrop. Detailed
anthocyanin anaiysis has k e n very usefui in studying the changes that occur in the
maturation and storage of fniits. Ultra Violet-visible spectroscopy (UV-Vis) (260-600
nm) has been widely used to study anthocyanins (Harbome, 1958, 1967; Gao and Mazza,
1994b; Baidi et al., 1995; Bakker et al., 1997). High performance liquid chromatography
Figure 5-1. Structures of anthocyanidins. Cyanidin: Ri = H, R2 = OH. Delphinidin: RI = R2 = OH. Peonidin: Rt = 0CH3, R2 = H. Petunidin: RI = 0CH3, R2 = OH. Malvidin: Rt = Rt = =3.
(HPLC) is the main technique used to quantify anthocyanins (Wulf and Nagel, 1978;
Camire and Clydesdaie, 1979; Goiffon et al., 199 1 ; Mazza and Velioglu, 1992; Gao and
Mazza, 1994a; Gao et al., 1997). The coupling of HPLC and W-Vis spectroscopy
(HPLC I photodiode array detection) has been the most cornmon method to determine
anthocyanin identity and quantification (Andersen, 1985, 1987; Hong and Wrolstad,
1 990% 1 WOb; Goiffon et al., 199 1 ; Dallas et al., 1996; Garcia-Viguera et al., 1997).
Matrix-assisted laser desorption/ionization time-of-flight mass spectrometry
(MALDI-MS) was fmt introduced in 1987 and originally developed for large
biomolecuIes (Karas et al., 1987). MALDI-MS has several advantages over other
methodologies, including speed of anaiysis, high sensitivity, wide applicability with a
good tolerance towards contaminants, and the ability to anaiyze complex mixtures (Karas,
1996). However, simple MALDI-MS instruments can not tell the difference between
isomers, which have identical molecular weight. Recent research on applications of

MALDI-MS has been extensive. In food analysis, MALDI-MS has been used to identifj
anthocyanins (Sugui et al., 1998; Spoms and Wang, 1998; Chapter 4, Wang and Spoms,
1999; Sugui et al., 1999). Wang and Spoms (1999, Chapter 4) reported the potential
quantitative analysis of anthocyanins in foods using MALDI-MS. The objective of this
study was to compare HPLC and MALDI-MS analysis of anthocyanins in bluebeny
samples.
Materials and Reagents. Highbush bluebemes (V. corymbosum, cv. Bergitta)
were harvested when the fruit surface color was between 5 and 50% fully blue. The
remaining surface area of the fruit was pink; the stem end of the fruit was largely white.
Three replicate samples were collected from three different shmbs at the same production
site. Fruit samples were stored in the dark in a controlled temperature room set at 20 r
O.S°C. A constant vapor pressure deficit of 0.212 kPa was maintained in the chambers
using solutions of glycerol-water as described by Fomey and Brandl(1992). The three
replicate samples were removed after 0.2.4, and 8 days of storage. Pelargonidin 3-
glucoside, cyanidin 3-glucoside, peonidin 3-glucoside and malvidin 3-glucoside were
obtained from Extrasynthese S.A. (Genay Cedex, France). Maltotriose and rnaltotetraose
were purchased from Sigma Chem. Co. (St. Louis, MO). 2',4',6'-Trihydroxyacetophenone
monohydrate (THAP) was obtained from Aldrich Chem. Co. (Milwaukee. WI). Al1 water
used was double deionized (~ill i-Q@ water purification system, MiIlipore Corp.,
Bedford, MA).
Extraction of Anthocyanins Rom Blueberries. The samples were prepared by
grinding 30 g of frozen bluebemes in a small food processor. Approximately 15 g of
these ground samples was added with a half teaspoon of Celite 545 (J.T. Baker Inc.
PhiIlipsburg, NI) to 30 rnL of mixed solvent (acetone:methanol:water:formic acid,
40:40:20:0.1, vfv/v/v). This sample was blended for 2 min. on a Vinis homogenizer (The
Sample collection, anthocyanin extracâon and anthocyanin HPLC analyses were conducted under the supe~sion of Dr. Kalt in Atlantic Food and Horticulture Research Centre, Agriculture and Agri-Food Canada, KentviUe, Nova Scotia,
Virtis Company Inc., Gardiner, NY) at a speed setting of 4. The soüd material was
removed from the extract using vacuum and a Buchner funnel lined with two sheets of
Whatman No. 4 filter paper (Whatman International Ltd., Maidstone, UK). The residue
was nnsed with the solvent and the filtrate was made up to 50 mL. Some sarnples (7.5 g),
which were less than 15 g, were extracted with only 25 mL total volume of solvent. The
solvent was removed under vacuum using a centrifugai evaporator (Savant Instruments
Inc., Hicksville, NY) and then dried extracts were resolubilized in an equivalent volume
(i.e. 50 or 25 mi,) of water. Extract (8 mL) was passed through a Sep-Pak C 18 cartridge
(Waters Scientific, Mississauga, ON) which had been prerinsed with 2 mL of 100%
methanol and 5 mL of water. Once loaded, the column was rinsed with 5 mL of water to
remove sugars and organic acids. Anthocyanins were eluted with 10 mL of O. 1 % fonnic
acid in methanol, and stored at -20 C until analyzed.
HPLC Analysis Blueberry Anthocyanias. Samples for HPLC analysis were
dried, resolubilized in an equivdent volume (i.e. 10 mL) of 86% Solvent A and 14%
Solvent B (see below) and then filtered through a 0.2 pm PVDF filter (Whatman
International Ltd., Maidstone, UK). 20 jL of extract was injected ont0 the HPLC. The
HPLC system consisted of a Hewlett-Packard 1 100 Senes HPLC (Hewlett-Packard
[Canada], Mississauga, Ontario, Canada) coupled with an auto sarnpler and a photodiode
array detector. Anthocyanins were separated on a Zorbax SBC 18 150 x 4.6 mm (5 pm)
reverse phase colurnn (Hewlett-Packard (Canada), Mississauga, Ontario, Canada). The
solvents used were 5% (vlv) aqueous formic acid (solvent A) and 100% HPLC grade
methanol (solvent B). The flow rate was at 1 mUmin, with a linear gradient profile
consisting of solvent A with the following proportions (vlv) of solvent B: O min, 14% B;
1-10.24 min, 1447% B; 10.24-35.28 min, 17-23% B; 35.28-64.59 min, 23-47% B;
64.59-66.59 min, 47-1446 B. The total run time was 70 min. The column temperature was
maintained at 26 C. Quantification of anthocyanins was based on peaks areas determined
at 520 nm and cornpared to the absorbance of cyanidin 3-glucoside, which was used as
the standard. For each storage stage, three samples were analyzed.
MALDI-MS. MALDI-MS was perfomed using a ~ r o f l e x ~ III in linear mode
(Bruker Analytical Systems Inc., Biilerica, MA). Anthocyanins co-crystailized with

matrix on the probe were desorbed and ionized by a nitrogen laser pulse (337 nm) and
accelerated under 20 kV with time-delayed extraction before entering the time of flight
mass spectrometer. 2',4',6'-Trihydroxyacetophenone monohydrate (THAP) was used as
matrix. THAP was saturated in acetone. Matrix solution (0.3 pL ) was applied on the
probe first and air dried. Then 1 pl, of final anthocyanin extracts was spotted directly over
THAP crystals and again air dried. Laser strength was attenuated (the lower the
attenuation, the higher the laser strength) to obtain the best signal-to-noise ratios while
isotopic resolution was maintained. Anthocyanin extracts were diluted to obtain about
0.35 Aszo using methano1:formic acid:water (70:2:28, v/v/v) before MALDI-MS analysis
so that the detector would not be saturated. When the UV-Vis absorbance of dilute
extracts at 520 nm was 0.35 f 0.05, anthocyanins would not cause detector saturation
problems and fit in the linear MALDI-MS response range (Chapter 4, Wang and Spoms,
1999). MALDI-MS was calibrated with two point external calibration using [maltotriose
+ KI+ (exact isotopic mass = 543.13) and [maltotetraose + KI+ (exact isotopic mass =
705.19) as calibrants, resulting in a mass accuracy 1 500 ppm.
Quantification of anthocyanins using MALDEMS was achieved using a standard
addition method, as reported earlier by Wang et al. (1999, Chapter 2). MALDI-MS
samples contained 30 pL of dilute extract and 30 jL of solvent (methano1:formic
acid:water, 70:2:28, v/v/v), while the standard addition samples contained 30 pL of the
extract plus 30 of cyanidin 3-glucoside (9.5 x IO-' M in solvent). Sarnples and
corresponding standard addition sarnples were applied to the ten positions on the probe:
one probe could be used for the analysis of five samples and their standards. From each of
the ten probe positions, a single spectrum was obtained by collecting 3 x 40 or total of
120 laser pulses from three randornly selected spots. Peak heights were determined for
each anthocyanin €rom each spectrum. These peak heights were then scaled relative to
the delphinidin 3-glycoside's peak, which was arbitrarily set at a value of 1.0. Each of the
five spectra for the sample were compared to a different spectrum from the five standard
addition samples and the average increase in scaled dative peak height for cyanidin 3-
glucoside (standard anthocyanin added) was determined. This gave a value for the
average inmased response due to the addition of cyanidin 3-glucoside on molar basis.

This response factor was then used to determine the average amount of each anthocyanin
in the five sample spectra. The acquisition of the MALDI-MS data (five ans, total of 10
spectra) took about 20 minutes. One single run represented acquiring two spectra (one
fiom sample and another fiom standard added sarnple). The mean of five runs was used
to calculate the average anthocyanin content of each sample. For each storage stage. three
samples were analyzed (see Appendix II for experimental design).
Statistics. Means and standard deviations were analyzed using Microsoft Exce197
(Microsoft Office 97).
RESULTS AND DISCUSSION
HPLC has been a very popular and widely used technique for analysis of
anthocyanins in foods or plants (Andersen, 1985, 1987; Hong and Wrolstad, 1990a,
1 WOb; Goiffon et al., 199 1; Dallas et al., 1996; Garcia-Viguera et al., L 997).
Quantification of anthocyanins using HPLC was based mainly on peak areas determined
at a certain wavelength such as 525 nm (Gao et al., 1997), which was usually close to the
maximum absorbance wavelength (L) of individual anthocyanins. Malvidin 3-
glucoside or cyanidin fglucoside were usually selected as the standard for quantification
(Wulf and Nagel, 1978; Boyles and Wrolstad, 1993; Gao et al., 1997). Studies have
show that anthocyanins with different chromophores have different A- even in the
sarne solvent system (Harbome, 1958, 1967; Francis, 1982; Hong and Wrolstad, 1 WOb).
For example, the & of pelargonidin 3-glucoside, cyanidin 3-glucoside, delphinidin 3-
glucoside, peonidin 3-glucoside, petunidin 3-glucoside and malvidin 3-glucoside were
506,523,534,523,534 and 534 nm respectively in 0.01 % HC1 in methanol (Francis.
1982). Gradient elution in HPLC likely also has an effect on the anthocyanin visible
absorbance characteristics due to changes in solvent composition during spectral
detection. Therefore, direct comparison of spectral characteristics with those published in
the Literature may be inappropriate and quantifcation of anthocyanins using HPLC at a
fixed wavelength, e.g. 525 nm, may over- or under-estimate some anthocyanins. Wang
and Spoms (1999, Chapter 4) have noted considerable variation in KPLC responses at

525 m. In this study, if cyanidin 3-glucoside was selected as the standard and its peak
area was arbitrarily set at a value of 1 .O, the relative rnolar response factors of malvidin
3,s-diglucoside, cyanidin 3-nitinoside, pelargonidin 3-glucoside, peonidin 3-glucoside,
maividin 3-glucoside would be 0.60, 1.06,0.69,0.60,0.82 respectively. This would
indicate that the arnount of most individual anthocyanins and the total arnount of
anthocyanins might be under-estimated if cyanidin 3-glucoside was used as standard for
quantification.
In MALDI-MS, it has been shown that anthocyanin monoglucosides gave similar
responses (Chapter 4, Wang and Spoms, 1999). Therefore, using a single anthocyanin
monoglucoside standard one can determine the correct amounts of anthocyanins present
(individuaily and in total).
A major disadvantage for MALDI-MS anaiysis is that it can not distinguish
anthocyanin isomers. For example, the peak at m/r 449 (Figure 5-2) could be produced by
Figure 5-2. MALDI-MS positive ion spectnun of highbush biueberry anthocyanins (stored for 4 days). Number in parentheses indicates componding peak number megsured by HPLC (Figure 5-3). A = cyanidin 3-arabinoside (7); B = peonidin 3-arabinoside; C = delphinidin 3-arabinoside (4); D = cyanidin 3-galactoside (3) + cyanidin 3-glucoside (5) + petunidin 3-arabinoside (10); E = peonidin 3-galactoside (9) + malVidin 3-arabinoside (13); F = delphinidia 3-galactoside (1) + delphinidin 3- giucoside (2); G = petunidin 3-gdactoside (6) + petunidin 3-glucoside (8); H = malvidin 3-gaiactoside (1 1) + rnalvidin 3-aucoside (12). Note that any anthocyanin can also be ionized in F o m of potassium adducts (0 combined with deprotonation.

cyanidin 3-gdactoside, cyanidin 3-glucoside or petunidin 3-arabinoside. HPLC can
differentiate these three anthocyanins (Figure 5-3, peaks 3,s and 10). However since
MALDI-MS gives a mass weight, it can identQ anthocyanin mass directly without the
use of standards.
mAU 1
200 11
13 10
, - , , , , , 30 40 50 60 min
Figure 5-3. HPLC chromatography of anthocyanins (same sample as in Figure 5-2). 1 = delphinidin 3-galactoside; 2 = delphinidin 3-glucoside; 3 = cyanidin 3- galactoside; 4 = delphinidin 3-arabinoside; 5 = cyanidin 3-glucoside; 6 = petunidin 3- galactoside; 7 = cyanidin 3-arabinoside; 8 = petunidin 3-glucoside; 9 = peonidin 3- galactoside: 10 = petunidin 3-arabinoside: t 1 = d v i d i n 3-galactoside: 12 = malvidin 3-glucoside; 13 = malvidin 3-arabinoside.
Another concern with MALDI-MS is fragmentation of anthocyanins. Using a
linear MALDI-MS, post-source decay, or fragmentation of ions after extraction, is not a
concem. However in-source decay can lead to the loss of a portion of the molecule such
as loss of carbohydrate residues from anthocyanins forming different mass ions. Wang
and Spoms (2000, Chapter 6) have found that fragmentation patterns and amounts of
flavonol glycosides were predictable for any defined sample preparation method. Funher
research on anthocyanins has shown that the monoglucosides aiso fragment
quantitatively. This fiagrnentation was exarnined by using a mixture of the
monoglucosides (pelargonidin 3-glucoside, cyanidin 3-glucoside, peonidin 3-glucoside
and maividin 3-glucoside). These glucosides fragment with loss of their 3-glucoside
moieties. The arnount of fragmentation of individual anthocyanins was calculated based
on the percentage of fragment ions (loss of 3-glucoside) to their unfragmented parent ions
(aromatic oxonium ion fom) in a single MALDI-MS sample or MALDI-MS spectnirn
(Table 5-1). The fragmentation of individual anthocyanins varied widely from MALDI-
MS sample-to-sample as indicated by the large inter-standard deviation

Table M. Quantitative fragmentationR (%) of anthocyanins In MALDCMS nt hocyanins' MALDI-TOF MS samples ~ ~ t ~ ~ - ~ ~ ~ ~ ~ ~ ~ ~ Inter-standard
1 2 3 4 5 deviationd Pelargonidin 3-glucoside 1 2.4 25.5 18.4 14.3 16.9 17.5 5.0 Cyanidin 3-glucoside 13.3 22.8 19.7 14.5 13.1 16.7 4.4 Peonidin 3-glucosfde 13.3 24.0 22.5 16.5 17.2 18.7 4.4 Malvidin 3-glucoside 15.2 27.7 16.9 15.6 14.8 18.0 5.4 lntra-averagec 13.5 25.0 19.4 152 15.5 Intra-standard deviationC 1.2 2.1 2.4 1 .O 1.9
' Quantitative fragmentation (%) was expressed as ratios of the fragment ions ( l o s of Sgiucoside) to their unfragmented parent ions (aromatic oxonium ion form). Number of laser puises equals 3 x 40 or total of 120 for each MALDI-MS sarnple. ' Concentration of individual anthocyanins in the mixture was 9.0 t 0.5 10" M. Average or standard deviation of individual anthocyanins within one single MALDI-MS sarnple (in columns). Average or standard deviation of each anthacyanin from fwe MALDI-MS samples (in rows).
(Table 5-1). However, within any single MALDI-MS sarnple, al1 anthocyanins exhibited
a sirnilar fragmentation percentage with srnall intra-standard deviation (Table 5- 1). That
is, the ratios of fiagrnent ions to parent ions were very consistent for the monoglucosides
in a single MALDI-MS sarnple. in generai, an internai standard, such as cyanidin 3-
glucoside, will fragment with the same pattern or relative amount as other anthocyanins,
and therefore can be confidently used as a reference for al1 other anthocyanin
monoglycosides. Further quantitative fragmentation studies on di- or triglycosides present
in other foods would be necessary to determine the applicability of MALDI-MS
quantification of samples containing these anthocyanin derivatives.
Cornparison between HPLC and MALDI-MS Quantifkation on individual
Anthocyanins. Figure 5-3 shows a HPLC chromatogram of anthocyanins in bluebemes.
There were thirteen anthocyanins. Based on retention time, they were assigned as
delphinidin 3-galactoside (l), delphinidin 3-glucoside (2), cyanidin 3-galactoside (3).
delphinidin 3-arabinoside (4), cyanidin 3-glucoside (3, petunidin 3-gdactoside (6),
cyanidin 3-arabinoside (7), petunidin 3-glucoside (8), peonidin kgalactoside (9).
petunidin 3-arabinoside (10). malvidin 3-gaiactoside (1 1), malvidin 3-glucoside (l2),
malvidin 3-arabinoside (13). Peonidin 3-arabinoside was not detected using HPLC, but it
was identified in MALDI-MS (Figure 5-2).
When analyzed by MALDI-MS in positive mode, anthocyanins were detected in
the aromatic oxonium ion form m+ (Sugui et al., 1998; Spoms and Wang, 1998;
Chapter 4, Wang and Spoms, 1999; Sugui et al., 1999). Our current study indicated that

anthocyanins may aiso form single alkaii metd adducts @l-H+Na]+ or FI-H+K]' ions,
depending on the amount of alkali metai in MALDI-MS samples. Since most plants
contain large arnounts of potassium. anthocyanins €rom blueberries can also be detected
as potassium adducts (Figure 5-2). Also anthocyanins showed higher mnity towards
potassium than sodium (data not shown). MALDI-MS spectrum (Figure 5-2) shows eight
anthocyanins at m/z 419,433,435,449,463,465,479 and 493 respectively. They were
cyanidin 3-arabinoside (A, m/Z 419.15), peonidin 3-arabinoside (B, m/z 433.18).
delphinidin 3-arabinoside (C, d z 435.15), cyanidin 3-galactoside or cyanidin 3-glucoside
or petunidin 3-arabinoside @, m/z 449.13), peonidin 3-galactoside or malvidin 3-
arabinoside (ET m/z 463.12). delphinidin 3-galactoside or delphinidin 3-glucoside (F, m/z
465.1 1). petunidin 3-galactoside or petunidin 3-glucoside (G, m/z 479.1 l), malvidin 3-
galactoside or malvidin 3-glucoside (HP m/z 493.12). The potassium adduct peaks were
also detected with 38 mass shift (addition of potassium and loss of one proton). For
quantification, peak heights of both aromatic oxonium ion FI]' and potassium adduct ion
[M-H+KJC were totaled. Obviously, MALDI-MS can not differentiate anthocyanins with
the same mass (Figure 5-2-53 and 5-4). Generally, as expected the arnount of individual
anthocyanins determined by MALDI-MS was higher than that by HPLC (Figure 5-4 and
5-5), except for delphinidin 3-arabinoside. A~so, total amount of anthocyanins determined
by MALDI-MS was higher than that of HPLC (Figure 5-6).
Changes of total. individual anthocyanins at different storage stages are shown in
Figure 5-6,5-7 and 5-8. Both HPLC and MALDI-MS analyses indicated that the total
amount of anthocyanins increased with increased storage (Figure 5-6). For individual
anthocyanins, HPLC results (Figure 5-7) illustrated changes of 13 anthocyanins at each
stage while MALDI-MS (Figure 5-8) showed changes of 8 anthocyanins (on moiecular
weight basis) at each stage. HPLC (Figure 5-7) showed that delphinidin 3-galactoside,
delphinidin 3-arabinoside, petunidin 3-gaiactoside, malvidin 3-galaetoside and malvidin
3-arabinoside were the major anthocyanins that changed during color development.
MALDI-MS (Figure 5-8) indicated that anthocyanins, F (delphinidin 3-galactoside and
delphinidin 3-glucoside), C (delphinidin 3-arabinoside), G (petunidin 3-gdactoside and

nHPLCdata MMALDI dota DMALDI ddd
A B C D E F G H
Anthocyanins
Figure 5-4. Comparison between HPLC and MALDI-MS analysis of highbush blueberry individual anthocyanins (stored for 4 days), Number in parentheses indicates corresponding peak number measured by HPLC (Figure 5-3). Percentages in parentheses represent the proportion of correspondent anthocyanins caiculated from HPLC data (tnplicates). A = cyanidin 3-arabinoside (7); B = peonidin 3-arabinoside; C = delphinidin 3-arabinoside (4); D = cyanidin 3-gdactoside (3) (40%) + cyanidin 3-glucoside (5) (4%) + petunidin 3-arabinoside (10) (56%); E = peonidin 3-galactoside (9) (12%) + malvidin 3-arabinoside (13) (88%); F = delphinidin 3-galactoside (1) (97%) + delphinidin 3-glucoside (2) (3%); G = petunidin 3-gaiactoside (6) (95%) + petunidin 3-glucoside (8) (5%); H = mdvidin 3- galactoside (1 1) (96%) + malvidin 3-glucoside (12) (4%), Each column represents the mean of t h e samples. Ermr bars indicate standard deviations (n=3). ' Data calcuiated from one single MALDI-MS run.
DqO DqrO D q 2 Dqr2 Ds/8 Dcy8 HPLC MALDI HPLC MALDI HPLC MALDI
Time
Figure 5-5. Comparison between HPLC and MALDI-MS anthocyanin profiles at three dIfferent stages of color development. A to H denotes the same anthocyanins as shown in Figure 5-2. Each column represents the mean of three samples. Error bars indicate standard deviations (n=3).

Day O Day 1 Day 2 Day 4 Day 8
Figure 5-6. Cornparison of total anthocyanin content detennined by HPLC and MALDI-MS at different stages of color development. Each column represents the mean of three samples. Error ban indicare standard deviations (n=3). ' Data were calculated fiom one single MALDI-MS run.
1 2 3 4 5 6 7 8 9 1 0 1 1 1 2 1 3
Anthocyanins
Figure 5-7. HPLC profile of itllthocyanins in bluebemes at different stages of color developmcnt. Numbers denote the same anthocyanins as shown in Figure 5-3. Each column represents the mean of three sampIes. Error bars indicate standard deviations (n=3).

A B C D E F G H
Anthocyanins
Figure 5-8. MALDI-MS profile of anthocyanins in bbebemes at different stages of color development. A to H denotes the same anthocyanins as shown in Figure 5- 2. Each column represents the mean of three samples. Error bars indicate standard deviations (n=3).
petunidin 3-glucoside), H (malvidin 3-galactoside and malvidin 3-glucoside), E (peonidin
3-galactoside and malvidin 3-arabinoside), followed the same trend as HPLC results. In
generd, HPLC and MALDI-MS provided sirnilar quantitative profiles of anthoc yaoins in
bluebemes at different stages.
Cornparison of Analysis Speed. Under our experimental conditions, it took 70
min. to complete one HPLC run. The total run time could be reduced, but some
anthocyanins would not be resolved. The acquisition of the MALDI-MS data consisted of
five runs per sample, and took about 20 minutes. It has been suggested that MALDI-MS
shows poor repeatability from spot-to-spot due to crystal inhornogeneity. Therefore,
increasing MALDI-MS runs for a sarnple c m reduce sample standard deviations.
However, as shown in Figure 5-4 and 5-6, there was no significant difference between
five and one W I - M S run on both individual and total anthocyanins @ L 0.05). One
MALDI-MS nin took just 4 min.
In conclusion, HPLC and MALDI-MS are both valuable techniques for
quantification of anthocyanins. HPLC has the power to differentiate anthocyanin isomen
but may underestimate the amount of anthocyanins when cyanidin is used as the intemal
standard. MALDI-MS is a more rapid techniqua to identiQ and quanti@ a group of

anthocyanins with different masses. It is likely that MALDI-MS has the potential to
rapidly identify and quantZy anthocyanins in other foods, and could make a significant
contribution in developing anthocyanin 'fingerprints" to explore differences in h i t
varieties and maturities.
REFERENCES
Andersen, O. M. Anthocyanins in fmits of Vacciniwn uliginosum L. (Bog
Whortleberry). J. Food Sci. 1987,52,665-666,680.
Andersen, O. M. Chromatographic sepmtion of anthocyanins in cowberry
(Lingonberry) Vaccinium vites-idaea L. J. Food Sci. 1985,50, 1230- 1232.
Bakker, J.; Bridle, P.; Honda, T.; Kuwano, H.; Saito, N.; Terahara, N.:
Timberlake, CF. Identification of an anthocyanin occumng in some red wines.
Phytochem. 1997,44, L 375- 1382.
Baldi, A.; Romani, A.; Mulinacci, N.; Vincieri, F. F.; Casetta, B. HPLCMS
application to anthocyanins of Vitis vinfera L. J. Agric. Food Chem. 1995,43,2lW-
2109.
Boyles. M. J.; Wrolstad, R. Anthocyanin composition of red raspbeny juice:
influences of cultivar, processing, and environmentai factors. J. Food Sci. 1993,58,
1135-1 141.
Camire, A. L.; Clydesdale, F. M. High-pressure iiquid chromatography of
cranberry anthocyanins. J. Food Sci 1979,44,926-927.
Dallas, C.; Ricardo da Silva, J. M.; Laureano, O. Products formed in mode1 wine
solutions involving anthocyanins, procyanidin B2, and acetaidehyde. J. Ag&. Food
Chem. 1996,44,2402-2407.
Fomey, C.F.; Bra.mil, DG. Control of hurnidity in small controlled environment
chamben using glycerol-water solutions. HortTech. 1992,2,52-54.
Francis, F. J. Analysis of anthocyanins. In Anthocyonins as food colors; Markakis,
P., Eds.; Academic Ress, Inc: New York, New York, 1982.

Gao, L.; Girard, B.; Maua, G.; Reynolds, A. G. Changes in anthocyanins and
color characteristics of Pinot Noir wines during different vinification processes. J. Agric.
Food Chem 1997,45,2003-2008.
Gao, L.; Maaa, G. Quantification and distribution of simple and acylated
anthocyanins and other phenolics in blueberries. J. Food Sei. 1994a, 59, 1057- 1059.
Gao. L.; Maua, G. Rapid method for complete chemical characterization of
simple and acylated anthocyanins by high-performance liquid chromatography and
capillary gas-liquid chromatography. J. Agric. Food Chem. 1994b, 42, 1 18-125.
Garcia-Viguera, C.; Zafrilla, P.; Tomas-Barberan, F. A. Detemination of
authenticity of fruit jams by HPLC analysis of anthocyanins. J. Sci Food Agric. 1997,73,
207-2 13.
Goiffon, J. P.; Brun, M.; Boumer, M. J.; High-performance liquid
chromatography of red fruit anthocyanins. J. Chromutogr. 1991,537, 10 1 - 12 1.
Harbome, J. B. Spectral methods of characterizing anthocyanins. Biochem J.
1958,70,22-28.
Harborne, J. B. The anthocyanin pigments. In Comparative biochernistry of the
flavonoids; Harbome, J . B., Eds.; Academic Press, Inc: New York, New York, 196%
Hong, V.; Wrolstad, R. E. Characterization of anhocyanin-containing colorants
and h i t juices by HPLC/photodiode array detection. J. Agric. Food Chem 1990a, 38.
698-708.
Hong, V.; Wrolstad, R. E. Use of HPLC separationlphotodiode may detection for
characterization of anthocyanins. J. Agric. Food Chem. 1990b, 38,708-7 15.
Kader, F.; Rovel, R.; Girardin, M.; Metche, M. Fractionation and identification of
the phenolic cornpounds of highbush bluebemes (Vaccinium coynbosum, L.) Food
Chem. 1996,55,35-40.
Kalt, W.; Fomey, C.F.; Martin, A.; Prior, R.L. Antioxidant capacity, vitamin C,
phenolics, and anthocyanins after fresh storage of small fmits. J. Agric. Food Chem.
1999,47,4638-4644.

Karas, M.; Bachmann, D.; Bahr, U.; Hillenkamp, F. Matrix-assisted ultraviolet
laser desorption of non-volatile compounds. Int. J. Mass Spectrom. Ion Processes. 1987,
78,53-68.
Karas, M.; Matrix-assisted laser desorption ionization MS: a progress report.
Biochem. Mass Spectrom. 1996,24,897-900.
Marazzoni, P.; Bombardelli, E. Vaccinium myrtillus L. Fitoterapia.. 1996,67,3-
28.
Mazza, G.; Miniati, E. Small fniits. In Anthocy~ins infruits, vegetables. and
grains; Mazza, G.; Miniati, E., Eds.; CRC Press, Inc: Boca Raton, Rorida, 1993.
Mana, G.; Velioglu, Y. S. Anthocyanins and other phenolic compounds in fruits
of red-flesh apples. Food Chem. 1992,43. 1 13- 1 17.
Sapers, G. M.; Burgher, A. M.; Phillips. J. G.; Jones, S. B .; Stone, E. G. Color and
composition of highbush blueberry cultivars [Vaccinium corymbosum, anthocyanins,
wax, pH, juice]. J. Am. Soc. Hortic. Sci 1984, 109, 105- 1 1 1.
Spoms, P.; Wang, I. Exploring a new frontier in food analysis using MALDI-MS.
Food Res. Int. 1998,3 1 , 1 8 1 - 1 89.
Sugui, J. A.; Bonham, C.; Lo, S. C.; Wood, K. V.; Nicholson, R. L. MALDI-TOF
analysis of mixtures of 3-deoxyanthocyanidins and anthocyanins. J. Agric. Food Chem.
1998,48,1063- 1066.
Sugui, J. A; Wood, K. V.; Yang, 2. Y.; Bonham, C. C.; Nicholson, R. L. Matrix-
assisted laser desorption ionization rnass spectrometry analysis of grape anthocyanins.
Am. J. End. Vitic. 1999,50, 199-203.
Suornalainen, H.; Keranen, A. J. A. The fint anthocyanins appearing during the
ripening of bluebemes. Nature. 1961, 19 1,448-449.
Wang, J.; Spoms, P. Analysis of anthocyanins in red wine and miit juice using
MALDI-MS . J. Agric. Food Chem. 1999,47,2ûû9-20 15.
Wang, J.; Spoms, P. MALDI-TOF MS analysis of food flavonol glycosides. J.
Agric. Food Chem. 2000, In press.

Wang, J.; Spoms, P.; Nicholas, H. L. Analysis of food oligosaccharides using
MALDI-MS: quantification of hyctooligosaccharides. J. Agric. Food Chem. 1999,47.
1549-1557.
WoodniffT R. E.; Dewey, D. H.; Sell, H. M. Chernical changes of Jersey and
Rubel biueberry fmit associated with npening and deterioration. Proc. Am. Soc. Hortic.
Sei. 1960,75,387-401.
Wuif, L. W.; Nagel, C. W. High-pressure Iiquid chromatographie separation of
anthocyanins of Viris vinifera. Am. J. Enol. Vitic. 1978.29.42-49.

Chapter 6
MALDI-MS Analysis of Food Flavonol Glycosidesl
INTRODUCTION
Flavonoids are polyphenolic compounds that occur ubiquitously in foods of plant
origin. More than 2000 chemically distinct flavonoids have been reported, and each fits
into one of several classes. In a dietary context, the most significant are the flavonols
(Figure 6-1). especially quercetin and kaempferol, which are found at high concentrations
in onions, tea and apples. The flavonols are aimost entirely found in glycosylated forms,
with one, two or three carbohydrates attached to fiavonol hydroxyl groups (Williamson et
al., 1998). Epidemiological studies have shown that flavonols have anticarcinogenic and
antioxidant properties (Formica and Regelson, 1995; Rhodes and Price, 1996; Lean et al.,
1999).
Figure 6-1. Structures of flavonols. Kaernpferol: RI = R2 = H. Quercetin: RI = OH, Rz = K. Myricetin: RI = R2 = OH. Isorhamnetin: RI = 0CH3, RI = H.
Because of the importance of flavonol giycosides, many techniques have been
used to identiQ and quanti9 these compounds. Early investigations on flavonol
giycosides were carried out using paper chromatography and thin-layer chromatography
(Robcrts et ai., 1956; Oshima and Nakabayashi, 1953 a,b). In the early 1990fs, high
' A version of this chapter bas been acceptexi for publication. Wang. J.; Sporns, P. MALDI-TOF MS andysis of food fiavonol giycosides. J. A g k Food Chcm

performance liquid chromatography (HPLC) with photodiode array detection was used to
isolate and quanti@ flavonol glycosides in tea (McDowell et al., 1990; Bailey et al., 1990;
Finger et al., 199 1). 'H and 13c NMR spectroscopy were the most powerfixl techniques
for detednation of flavonol glycoside molecular structure (Finger et al., 199 1). The
coupling of HPLC and mass spectrometry methods, such as electrospray, thermospray or
fast atom bombardment, has been widely used to provide molecular weight and
characteristic fragment ions for structural elucidation of flavonol glycosides (Finger et al..
199 1; Bailey et ai., 1994; Kiehne and Engelhardt, 1996; Sagesser and Deinzer, 1996;
Price et al., 1997).
Matrix-assisted laser desorption/ionization time-of-flight mass spectrometry
(MALDI-MS) was first introduced in 1987 and originally developed for large
biomolecules (Karas et al., 1987). MALDI-MS has advantages over other methodologies
including speed of anaiysis, high sensitivity, wide applicability combined with a good
tolerance towards contarninants, and the ability to analyze complex mixtures (Karas,
1996). However, simple MALDI-MS instruments cm not tell the difference between
isomers, which have identical mass. The potential application of MALDI-MS in food
systems allows for analysis of most molecules. Presently, MALDI-MS food applications
are limited (Spoms and Wang, 1998). MALDI-MS has been reported for both qualitative
and quantitative analysis of anthocyanins, which are stnicturally very similar to flavonols,
in several important foods (Chapter 4, Wang and Spoms, 1999). This study presents the
use of MALDI-MS to study food flavonol glycosides.
MAïZRIALS AND METEODS
Materials and Reagents. Yellow onion bulbs (Allium cepa L.) and green tea
were purchased from local markets in Edmonton, Alberta, Canada. Isoquercitrin
(quercetin 3-glucoside), kaempferol 3-g lucoside and kaempferol3-rutinoside w ere
obtained from Extrasynthese S.A. (Genay Cedex, France). Rutin (quercetin 3-rutinoside),
4-hydroxy-acyan0i:innamic acid (HCCA), N-t-Boc-Met-Asp-Phe Amide, N-t-Boc-Trp
Met-Asp-Phe Amide were purchased fiom Sigma Chem. Co. (St Louis, MO). 1-Kestose

and nystose were a gi f t from Dr. A. Ohta (Nutritional Science Center, Meiji Seika Kaisha,
Japan). 2' ,4* ,6'-Trihydroxyacetophenone monohydrate (THAP), 2-(4-hydroxypheny1azo)-
benzoic acid (HABA), 3-aminoquinoline (3-AQ), trm-3-indoleacrylic acid (DA) and
2.5-dihydroxybenzoic acid (Dm) were obtained €rom Aldrich Chem. Co. (Milwaukee,
WI). Al1 water used was double deionized (Milli-Q water purification system, Millipore
Corp., Bedford, MA). A comrnon solvent used was aqueous 70% methanol.
Extraction of Flavonol Glycosides from Yeilow Onion and Green Tea. Fresh
yellow onion was peaied to remove the dry outer layers and then chopped using a food
processor (Braun. UK 100. Type 4259. Germany) for 5 min. The mixed sarnple was
freeze dried. The dried sample (5 g) was extracted with 100 mL 701 methanol for 30
min. with stimng, and then filtered through Whatman No. 4 filter paper. Methano1 was
removed from the filtrate using a Rotavopor 46 1 water bath (Brinkmann Instruments Ltd.,
Mississauga, Ontario, Canada) in vacuo with a bath temperature of 35 C. Methanol-free
filtrate (10 mL) was loaded ont0 a Sep-pak Cl8 cartridge (Waters Corp., Milford. MA) at
a flow rate of about 1 mUmin, washed with 10 mL water three times, and eluted with 2
mL 70% methanol. Green tea (4 g) was extracted with 100 mL of hot water (80 C),
stirred for 15 min, then filtered through glass wool. The purification of flavonol
glycosides using a Sep-pak C 18 caruidge was the sarne as the onion sample. except that 2
rnL filtrate was loaded on the Sep-pak C 18 cartridge and the final eluant was 2 mL 0.0 1
M NaCl in 70% methanol. The yellowish flavonol glycoside extracts were kept in a
refrigerator until used.
MALDI-MS. MALDI-MS was performed using a Proflexm III in linear mode
(Bruker Analytical Systems Inc., Billerica, MA). Flavonol glycosides co-crystallized with
matrices on the probe were ionized by a nitrogen laser pulse (337 nm) and accelerated
under 20 kV with time-delayed extraction More entering the time of flight mass
spectrometer. For THAP. HABA, 3-AQ, DHB and HCCA, the preparation of matrix and
sample was the same as previously reported (Chapter 2, Wang et al., 1999). For IDA, the
rnatrix solution contained 10 mg/mL IDA in 1: 1 acetone:water. The ratio of matrix
solution and sample was 1 : 1. For al1 matrices either 1 pL sample solution or a 2 pL
mixture of rnatrix and sample was applied to a MALDI-MS probe and air dried. When

fiavonol glycosides were identified after HPLC separation, 0.5 pL THAP (satwated in
acetone) was applied on the probe first and air dried. Then 2 pL, of the preparative HPLC
fiaction was spotted on the THAP crystals and further air dried. MALDI-MS was
attenuated (the lower the attenuation, the higher the laser strength) to obtain the best
signal-to-noise ratio and isotopic resolution for the matrix used. Two point extemal
calibrations were performed using [kestose + KI' (exact isotopic mass = 543.13) and
[nystose + KI+ (exact isotopic mass = 705.19) for positive MALDI-MS mode, and [N-t-
Boc-Met-Asp-Phe Amide - Hl- (exact isotopic mass = 509.2 1) and [N-t-Boc-Trp-Met-
Asp-Phe Amide - HJ* (exact isotopic mass = 695.29) for the negative mode. The mass
accuracy was below 500 ppm. Each spectrum represents the sum of 60 laser pulses.
Preparative EIPLC. The preparative HPLC system consisted of a Varian VISTA
5500 HPLC (Varian Canada hc., Mississauga, Ontario, Canada), a Varian 9090 Auto
sampler, and a Spectro Monitor III W detector (LDC/MIF,TON ROY, Riviera Beach,
FL). The system was equipped with a 75 x 4.5 mm pre-injection Cl8 saturator column
containing silica-based packing (12 pm) and a 50 x 4.6 mm guard column containing
Supelco LC-18 reverse phase packing (20-40 pm, Supelco, Bellefonte, PA). Flavonol
glycosides were separated on a ~ u ~ e l c o s i l ~ ~ SPLC-18-DB 250 x 10 mm (5 ym)
preparative reverse phase column (Supelco, Bellefonte, PA). The solvents used were 2%
(vfv) aqueous acetic acid (solvent A) and acetonitrile (solvent B). The Bow rate was at 5
mUmin, with a linear gradient profile consisting of solvent A with the following
proportions (vfv) of solvent B: O min, 15% B; 0-26 min, 15- 1 8% B; 26-30 min, 1 8-3 1 %
B; 30-32 min, 3 1% B; 32-33 min, 3145% B; 33-34 min, 15% B. Detection was at 354
nm, and the total run time was 38 min. Sarnple extracts (500 w) were injected into the
HPLC for preparative collection. A Shimadni CLASS-VP~~ chromatography data system
(Shimadni Scientific Instruments Inc., Columbia, MD) was used to rnonitor the eluted
peaks and the flavonol glycoside fractions of interest were collected for MALDI-MS
analysis.
Statistics. Means and standard deviations were analyzed using Microsoft Exce197
(Microsoft Office 97).

RESULTS GND DISCUSSION
For analysis of any compound in food samples using MALDI-MS, several factors,
including the selection of matrices, preparation of matnx and sample, signal-to-noise
ratio and spot-to-spot repeatability, must be considered.
Selection of MALDI-MS Matrices for Fiavonol Glycosides. Six cornmon
matrices were exarnined for desorption and ionization of flavonol glycosides. Of these
matrices, 4-hydroxy-a-cyanocinnamic acid (HCCA), 2',4',6'-trihydroxyacetophenone
monohydrate (THAP), 2-(4hydroxyphenylazo)-benzoic acid (HABA), frans-3-
indoleacrylic acid (DA) and 2,5-dihydroxybenzoic acid (DHB) produced good quality
spectra in MALDI-MS positive mode for flavonol glycosides. THAP and IDA were aiso
good matrices for producing negative ions with Ravonol giycosides. 3-Arninoquinoline
(3-AQ) was not a suitable rnatrix since matrix and sample did not cosrystallize properly,
although noticeable (but poor) anaiyte signal was still observed. Among al1 the matrices
studied, THAP was chosen as ideal for flavonol glycosides for further study in terms of
the ease of preparation of matrix and sample, tolerance to contaminants, good spot-to-
spot repeatability, and ability to generate both positive and negative analyte ions. Al1
figures presented in this paper are spectra using THAP as matrix.
Laser strength used for desorption and ionization of flavonol glycosides was
matrix related. HCCA, HABA and IDA can desorb and ionize flavonol glycosides at very
low laser strength, while THAP and DHB required higher laser strength. Generally, laser
strength was selected based on good signai-to-noise ratio and the best resolution of
analytes of interest (Chapter 2, Wang et al., 1999). In dl experiments, isotopic resolution
was achieved in both positive and negative modes for al1 matrices. The best spectra were
those that reduced fragmentation to a minimum while maintaining isotopic resolution.
I o h t i o n of Fiavonol Glycosides. When analyzed by MALDI-MS in positive
mode, flavonol glycosides showed ion forms of protonated [M+H]+, single alkali rnetal
adducts w+Na]+ or m+K]+ and double alkali rnetal adduct [M-H+Na+K]+ ions (Figure
6-2). Ionization of flavonol glycosides was mainly infiuenced by matrices. HCCA and
HABA generated alkali adduct ions only, whereas DHB, IDA and THAP produced

7006
6000:
SOOO:
um-
3000-
2000 - I w o -
\
Figure 62. MALDI-MS positive ion spectra of flavonol glycoside standards. Lek rutin (1.5 x 10" M in 70% methanol). Right: isoquerciûin (1.5 x 10" M in7O% methanol).
both protonated and alkali adduct ions. Compared to flavonol monoglycosides, the di- or
triglycosides exhibited high affinity for alkali rnetals (Figure 6-3). Furthemore, the
relative amount of M+NalC vs w+H]+ was correlated to the concentration of alkali
metais in a sample. By addition of an aikali metal (0.01 M NaCl) in the sampie solution,
[M+m4 ion formation decreased while w+Na]+ ion intensity increased. Alkali adduct
ions could be exchanged by adding a relatively high concentration (0.0 1 M) of various
alkali rnetal salts (Figure 6-4).
In MALDI-MS negative mode, flavonol glycosides were ionized through
deprotonation. Only one molecular negative ion form (Figure 6-5) was observed.
Generally, the intensity or abundance of molecular ions in negative mode was much less
(4 times or more) than in positive mode. The laser strength used for desorption and
ionization was slightly higher in negative mode than in positive mode.
Fragmentation of Flavonol Glycosides. In MALDI-MS positive mode, dl the
flavonol giycosides exhibited fragmentation with loss of their carbohydrate residues.

Figure 6-3. MALDI-MS positive ion spectm of flavonol glycosides from green tea. 1 : 286.83 [kaempferol+HJ'. 2: 302.88 [quercetin+w*. 3: 3 18.93 [myricerin+H]*. 4: 449.15 [kaempfeml3-glycoside+H]*. 5: 465.15 [quercetin 3-glycoside+K1'. 6: 47 1.20 [kaempferol3- glycoside+Na]*. 7: 48 1.20 [myricetin Eglycoside+~*. 8: 487.20 [quercetin 3-gIycoside+Na]'. 9: 503.20 [myricetin 3-glycoside+Na]+. 10: 6 17.28 [kaempferol3-rutinoside+Na]+. 1 1 : 633.33 [quercetin 3-nitinoside+Na]'. 12: 649.25 [myricetin 3-mtinoside+Na]*. 13: 763.3 1 unknown (possibly [kaempferol3-glucosyIrhamnosylrhamnoside+Na]~. 14: 779.29 [kaempferol3- glucosylrhamnosylglycoside+Na]*. 15: 795.27 [quercetin 3-glucosylrharnnosylglycoside+Na]~. 16: 801.27 [kaernpferol3-glucosylrhamnosylglycoside-H+2Na]~. 17: 8 17.28 [quercetin 3-
Figure 64. MALDI-MS positive ion spectra of rutin (15 x lu3 M dissoived in 0.01 M alkali 70% wthanol) with différent alkali adduct ions (Li+, Na*, K+ and Cs+). Note that di the other peaks are matrix peaks by hgrnentation,
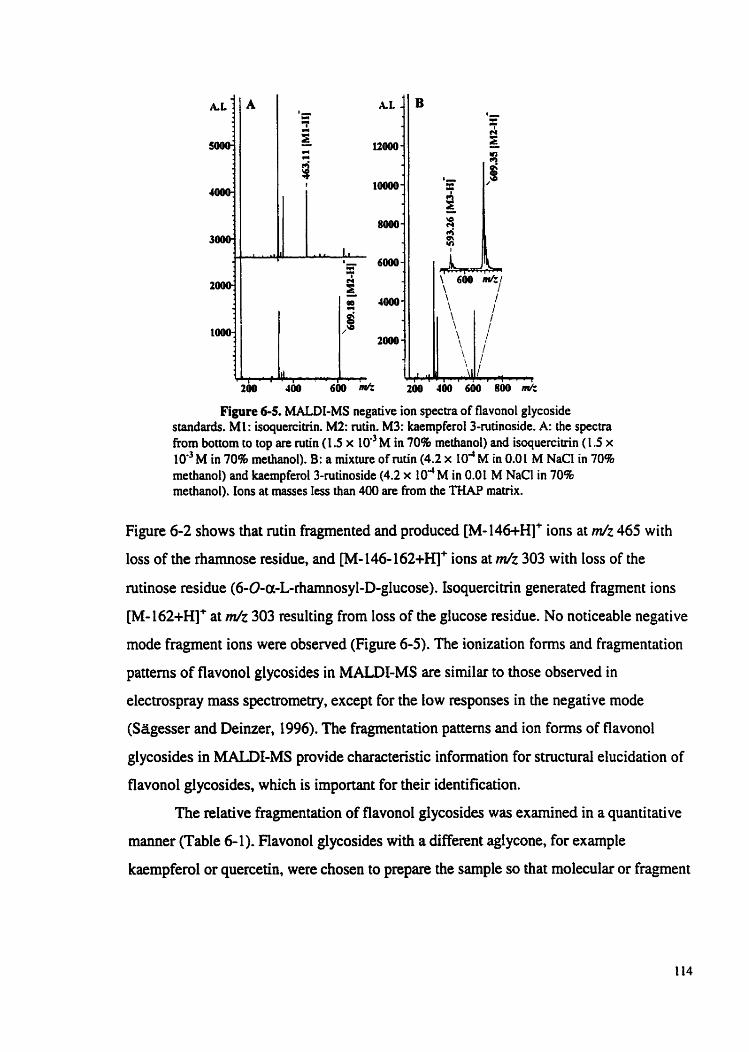
Figure 6-5. MALDI-MS negative ion spectra of flavonol glycoside standards. Ml: isoquercitrin. M2: rutin. M3: kaempferol3-rutinoside. A: the spectra fiom bottom tu top are rutin (15 x 10" M in 70% methanol) and isoquercinin ( 1.5 x 1v3 M in 70% methanol). B: a mixture of nitin (4.2 x 10⁴M in 0.01 M NaCl in 70% rnethanol) and kaempferol3-rutinoside (4.2 x lo4 M in 0.01 M NaCl in 70% methanol). Ions at masses Iess than 400 are fkom the THAP matnx.
Figure 6-2 shows that rutin fragmented and produced W-l46+H]+ ions at ml2 465 with
loss of the rhamnose residue, and FI-146-162+H]+ ions at d z 303 with loss of the
nitinose residue (6-O-a-L-rhamnosyl-D-glucose). Isoquercitrin generated fragment ions
w-162+H]+ at m/z 303 resulting from loss of the glucose residue. No noticeable negative
mode fragment ions were observed (Figure 6-5). The ionization forms and fragmentation
pattems of flavonol glycosides in MALDI-MS are similar to those observed in
electrospray mass spectmmetry, except for the low responses in the negative mode
(Sagesser and Deinzer, 1996). The fiagmentation patterns and ion foms of flavonol
glycosides in MALDI-MS provide characteristic information for structural elucidation of
flavonol glycosides, which is important for their identification.
The relative fragmentation of BavonoI glycosides was exarnined in a quantitative
manner (Table 6-1). Flavonol glycosides with a different aglycone, for exarnple
kaempferol or quercetin, were chosen to prepare the sarnple so that molecular or fragment

Oiti- 1 2 3 4 5 6 uKM.LIs Kaa~RUt*+RUtln 1.05 (024) 0.94 (0.14) 39.3 (14.7) 3û.7 (1 t .ô) 0 . g (0.08) 1.25 (O-ûô) pdlhUob. W 3 - G l u 0 ~ r e a r i f l 37.0 (8.Q 373 (34 1.00 (0.07) 1.24 (0.06)
Kae 3 a k i d ~ n 0.S (0.W 29.5 (1 63) 29.3 (1 7.9) 1 .[)3 (0.10) t .O2 (0.1 O) Kae SM+mrciMn 1.03 (0.15) 2û.3 (7.4) 24.8 (9.8) 0.82 (0.1 O) 1.53 (O.OS) Kae $Rut' am (0.14) 31 2 (14.8) F(ida 1 .O1 (0.1 4 10.4 (52)
MAU~~.US ~ ~ e 3 - û t u ~ ~ ~ n 0.1 4 (0.02) ngiri~uodi +Kae~fhf+Rufjn 0.17 (0.031
ions would not overlap. The fragmentation of individuai flavonol glycosides was
calculated based on ail the fragment ions (loss of carbohydrates) to their parent ions (total
of unfragmented protonated and alkali metal adduct ions) in ternis of percentage observed
in a single MALDI-MS sample or MALDI-MS spectnim (Table 6-1, data columns 3 and
4). The fragmentation of each flavonol glycoside varied widely from sample-to-sample as
indicated by the large standard deviation (Table 6-1, data columns 3 and 4). However,
within any single MALDI-MS sarnple, al1 the flavonol glycosides exhibited a similar
fragmentation percentage. This sirnilarity was shown by the ratios of fragment ions of
kaempferol glycosides to those of quercetin glycosides, which were close to 1 (Table 6-1,
data column 5). That is, for individuai MALDI-MS spectra the ratios of fragment ions to
parent ions were very consistent and sirnilar for different flavonol glycosides. With
further investigation on mtin, it was found that the formation of [M-146+H]+ ions was
linearly proportional to m+H]+ ions in an equal arnount (slope = 0.95, R' = 0.98) for
varying concentrations of rutin. This relationship was aiso evident since ratios of [M-
146+H]+ to [M+H]+ were close to 1 even in a mixture of flavonol glycosides (Table 6-1.
data colurnns 1 and 2). The above quantitative information about fragment ions is usehl
for proper evaluation of the arnount of monoglycosides in a mixture, since fragment ions
from the diglycosides, e.g. w - 1 4 m + ions at m/t 465 from rutin (quercetin 3-
rutinoside), would overlap the monoglycosides with the sarne aglycone, e.g. M+H]' ions
at d z 465 of isoquercitrin (quercetin 3-glucoside). In general, it seems that fragmentation
patterns and amounts are predictable for any defined sampte preparation method.

Therefore, any flavonol glycoside MALDI-MS spectrum should provide both qualitative
and quantitative information about the flavonol glycosides in a sample.
Responses of Flavonol Glycosides in MALDI-MS. Generall y the in tensi ty (total
of al1 ions) or response of flavonol glycosides in MALDI-MS positive mode was linearly
correlated to their molar ratios in the sample. This linearity (slope=1.24, ~ ~ d . 9 8 ) was
determined by choosing kaempferol3-nitinoside (ranging from 8.4 x IO-' M to 4.2 x 10'
M) as an analyte while using rutin (quercetin 3-rutinoside, 4.2 x 10⁴ M) as interna1
standard. Extensive studies showed that the responses of kaempferol and quercetin
glycosides were al1 similar and the ratios of the intensity of kaempferol glycosides over
quercetin glycosides were close to 1 (Table 6-1, data column 6). However, in MALDI-
MS negative mode, kaempferol glycosides exhibited one fifth or less the responses of
quercetin glycosides (Figure 6-SB; Table 6- 1, data column 6).
In general, because MALDI-MS positive mode can generate abundant ions and
the spectra provided more structural information, subsequent studies on flavonol
glycosides in food samples were carried out in the positive mode.
MALDI-MS Identification of Flavonol Glycosides in Yellow Onion Extntcts.
Onions primarily contain two or three quercetin conjugates, quercetin 3,4'-diglucoside,
the 4'-glucoside (Pnce et al., 1997) and isorhamnetin 4'-glucoside (Park and Lee, 1996).
After HPLC separation, three major peaks, at 7.7,25.9 and 32.1 min, were collected and
analyzed by MALDI-MS. The characteristic ions, observed at d z 465,627.649 and 665
([M-1 62+WC, [M+H]+, m+Na]+ and [M+K]+, respectively), were assigned to quercetin
34'-diglucoside (HPLC peak at 7.7 min.), at mtz 465 and 487 ([M+H]+ and [M+Na]',
respectively) for 4'-glucoside (HPLC peak at 25.9 min), and at m/z 479 and 50 1 ([MiH]'
and M a ] + , respectively) for isorhamnetin 4'-glucoside (HPLC peak at 32.1 min)
(Figure 66). The fragmentation patterns were as expected. The monoglycosides produced
fragment ions at m/t 303 or 3 17 (W-l62+H]3, and the diglucosides generated fragment
ions at m/z 465 (@%162+H]+) and 303 ( F I - 1 62-1 62+H]+). THAP also generated matrix
ion peaks at d z 303 and 287. The intensities of matrix ions were affected by the
concentration of Bavonol glycosides. High concentrations of flavonol glycosides
suppressed the matrix ions in the 200 and 400 d z region (Figure 6-2). Therefore, the

peak at d z 303 (Figure 6-2) is definitely from the fragmentation of the flavonol
glycosides. However, at lower flavonol glycoside concentrations, both flavonol glycoside
and THAP fragmentation cm contribute to ion peaks at ml' 303 and 287.
Figure 6-6. MALDEMS positive ion spectra of flavonol glycosides (fiom yellow onion) after HPLC separation. A: quercetin 3.4'-diglucoside. B: quercetin 4'-glucoside. C: isorhamnetin 4'- glucoside.
MALDI-MS Identifkation of Havon01 Glycosides in Green Tea Extracts.
Flavonol glycosides present in green tea are kaempferol. quercetin and myricetin mono-,
di-, and triglycosides. They are listed in Table 6-2 using the HPLC retention time order
according to Bailey et al. (1990), Engelhardt et al. (1992) and McDowell et al. (1995).
Figure 6-3 shows the MALDI-MS specmirn of flavonol glycosides in a green tea extract.
Because flavonol glycosides were prepared with an excess of sodium ions (0.01 M NaCl
in 70% methanol), the di- and triglycosides were predominately ionized in the form of
sodium adduct ions, while monoglycosides were ionized as both protonated and sodium
adduct ions. Since only very mall amounts or no noticeable w+m+ ions were observed
for €lavon01 diglycoside (masses between 590 and 650) or triglycoside (masses between
740 and 820), the amounts of the fragment ions FI-glycoside+m+ at d z 465 or 449 were
assurned to be insignificant. The W I - M S profiles in the monoglycoside region

Table 6-2 MALDI-MS Identification of Fiawnol Glycosidea in Green Tm
' Based on the HPLC retention tirne order ' Shown in Figure 6A
Shown hi Figure 68 THAP a b producd frngmemt bns at milr 287 and 303
Figure 6-7. MALDI-TOF MS positive ion spectra of flavonol glycosides (fkom green tea) after HPLC separation. A: myricetin 3-glucoside. B: quercetin 3-glucosylrtiamnosyIgdactoside.
(masses between 400 and 500) should represent the monoglycosides in the onginal
sample. The masses of flavonol glycosides were detemiined in eleven HPLC fractions by
M A L D M (two of them given in Figure 6-7). The MALDI-MS spectra provided the
characteristic molecular or fragment ions for al1 these HPLC fractions, which were then
assigned as flavonol glycosides in green tea (Table 6-2). However, flavonol triglycosides,
such as quercetin 3-glucosylrhamnosyIgalactoside, did not exhibit fragment ions FI-

162+H]+ at d z 61 1 with loss of the glucose residue. This may be because of the low
concentration of the triglycoside in the HPLC fraction or the easy cleavage of glycosidic
iinkage between rhamnose and galactose, since mass at d z 465 (Ioss of
glucosylrhamnose residue) was observed (Figure 6-7B).
In conclusion, MALDI-MS is a vaiuable rapid technique for identification of
flavonol glycosides, even in complex mixtures. The fragment ions of flavonol glycosides
provided characteristic information for structural elucidation of flavonol glycosides.
Fragmentation and arnounts of flavonol glycosides were predictable in a MALDI-MS
sarnple. MALDI-MS spectra, therefore, could provide the flavonol glycoside profiles for
food sarnples and also be used to identiS, flavonol glycosides in conjunction with other
separation techniques such as HPLC. It is likely that MALDI has the potential to analyze
flavonol glycosides in other foods and that these spectral ion patterns could be used for
identification and quaiity control.
REFERENCES
Bailey, R. G.; McDowell, L; Nursten, H. E. Use of an HPLC photodiode-array
detector in a study of the nature of a black tea liquor. J. Sci Food Agric. 1990,52,509-
525.
Bailey, R. G.; Nursten, H. E.; McDowell, 1. A liquid chromatography-mass
spectrometry study of a black tea liquor using the plasma spray interface. J. Sci Food
Agric. 1994,66,203-208.
Engelhardt, U. H.; Finger, A.; Heaig, B.; Kuhr, S. Deterrnination of flavonol
glycosides in black tea Deut. Lebensm. Rundrch. 1992,88(3), 69-73.
Finger, A.; Engelhardt, U. H.; Wray, V. Ravonol glycosides in tea: Kaempferol
and quercetin rharnnodiglucosides. J. Sci. Food Agric. 1991,55,3 13-322.
Formica, J. V.; Regelson, W. Review of the biology of quercetin and related
bioflavonoids. Food Chem Toxicoi. 1995,33, IO6 1 - 1080.
Karas, M.; Bachmann, D.; Bahr, U.; Hillenkamp, F. Matrix-assisted ultraviolet
laser desorption of non-volatile compounds. Int. J. Mws Spectrom. Ion Processes. 1987,
78,53-68.
Karas, M.; Matrix-assisted laser desorption ionization MS: a progress report.
Biochem. Mass Spectrom. 1996,24,897-900.
Kiehne, A.; Engelhardt, U. H. Thennospray-LC-MS analysis of various groups of
polyphenols in tea: 1. Catechins, flavonol O-glycosides and flavone C-glycosides. 2.
Lebenm. Unters. Forsch. 1996, 202,48-54.
Lean. M. E. J.; NorooU, M.; Kelly, L; Burns, J.; Talwar, D.; Sattar, N.; Crozier,
A. Dietary flavonols protect diabetic human lymphocytes against oxidative damage to
DNA. Diabet. 1999,48, 176- 1 8 1.
McDowell, 1.; Bailey, R.G.; Howard, G. Flavonol glycosides in black tea. J. Sei.
Food Agric. 1990,53,411-4 14.
McDowell, L; Taylor, S.; Gay, C. The phenolic pigment composition of black tea
liquon: Part 1. Predicting quaiity. J. Sci. Food Agric. 1995,69,467-474.
Oshima, Y.; Nakabayashi, T. Catechins and pigments in tea leaves (4). Separation
and determination of rutin. J. Agric. Chem. Jap. 1953a, 26,274-276.
Oshima, Y.; Nakabayashi, T. Catechins and pigments in tea leaves (5). Paper
chromatography of tea flavones. J. Agric. Chem Jap. 1953b, 26,754-756.
Park, Y. K.; Lee, C. Y. Identification of isorhamnetin 4'-glucoside in onions. J.
Agric. Food Chem 1996,44,34-36.
Price. K. R.; Bacon, J. R.; Rhodes, M. J. C. Effect of storage and domestic
processing on the content and composition of flavonol glucosides in onion (Allium cepa).
J. Agric. Food Chem. 1997,45,938-942.
Rhodes, M. J. C.; Mce, K. R. Analytical problems in the study of flavonoid
compounds in onions. Food Chem. 1996,57, 1 13- 1 17.
Roberts, E. A. H.; Cartwright, R. A. Wood D. J. The flavonols of tea. J. Agric.
Food C h m 1956,7,637-646.
Sagesser, M.; Deinzer. M. HPLC-ion spray-tandem mass spectmnetry of flavonol
glycosides in hops. J. Am. Soc. Brew. C h m 1996,54 129-134.

Spoms, P.; Wang, 3. Exploring new fiontien in food analysis using MALDI-MS.
Food Res. In?. 1998,3 1, 18 1 - 189.
Wang, J.; Spoms, P. Analysis of anthocyanins in red wine and fmit juice using
MALDI-MS. J. Agric. Food Chem. 1999,47,2009-2015.
Wang, J.; Spoms, P.; Low, N. K. Analysis of food oligosaccharides using
MALDI-MS : quantification of fructooligosacc harides. J. Agric. Food Chem. 1999,47,
1549-1557.
Williamson, G.; Faulkner, K.; Plumb, G. W. Glucosinolates and phenolics as
antioxidants from plant foods. Eur. J. Cancer Prev. 1998,7, 17-2 1.

Chapter 7
MALDI-MS Quantification of Coccidiostats in Poultry Feedsl
INTRODUCTION
Lasalocid, monensin, salinomycin and narasin (Figure 7-1) are polyether
ionophores and serve as the four major coccidiostats for prevention of coccidiosis in the
poultry industry (Elliott et al., 1998). Their mode of action is attributed to their
ionophoric properties (forming complexes with polar cations, i.e. K+, Na', Ca*, and
~ g t ç ) and effects on ce11 membrane function (Pressman and Fahim, 1982; Braunius,
1985). Typical fortification levels of feeds range from 20 to 125 mgkg, depending on the
species treated (Braunius, 1985; Rodewald et al., 1994; Moran et al., 1994; Muldoon et
al., 1995; Blanchflower and Kennedy, 1995; Elliot et al., 1998). Toxicity studies have
shown that coccidiostats exert marked cardiovascular effects in expenmental animals
(Novilla, 1992; Novilla and Owen, 1994; Elliott et al., 1998), and might poison poultry or
other animals (Rollinson et al., 1987; Salles et al., 1994; Andreasen and Schleifer, 1995).
Although withdrawal penods from medicated feeds are required pnor to slaughter, there
is still concem over possible toxicological problems for humans consuming poultry meat.
Therefore reliable analytical techniques are required for these compounds.
Several analytical techniques for the identity and quantification of coccidiostats
were reviewed by Elliot et al. (1998). Of chernical methods for detection and
quantification of coccidiostats, high performance liquid chromatography (HPLC) with
post-column derivatization (PCD) with vanillin (Rodewald et al., 1994; Moran et al.,
1994, 1995) was the most common technique used. HPLC-PCD, with either a liquid-
liquid or a silica gel solid-phase extraction, had a Iimit of detection of under 5 nglg
(Moran et al., 1994, 1995). HPLC electrospray mass spectrometry (MS) was another
sensitive technique and offered the best possible confirmation of low levels of
A version of this chapter has been accepteci for publication. Wang, J.; Spom, P. MALDI-TOF MS quantification of coccidiostats in pouliry feeds. J. Agri Food Chem.

Figure 7-1. Structures of coccidiostats.
coccidiostats after a simple clean-up procedure (Blanchflower and Kennedy, 1995, 1996:
Harris et ai., 1998). The detection limit of this assay was 1 nglg (Blanchflower and
Kennedy, 1995,1996).
Ma&-assisted laser desorptiodionization time-of-flight mass spectrometry
(MALDI-MS) was first introduced in 1987 and originally developed for large
biomolecules (Karas et ai., 1987). The advantages MALDI-MS has over other
rnethodologies include speed of analysis, high sensitivity, wide applicability combined
with a good tolerance towarcls contaminants, and the ability to analyze complex mixtures
(Karas, 1996). The performance of MALDI-MS allows for analysis of most molecules,
except that simple linear instruments can not tell the difference between isomers, which

have identical mas. Presently, MALDI-MS food related applications are limited. The
objective of this study was to explore and develop a simple fast protocol using MALDI-
MS to quanti@ the comrnonly used coccidiostats in poultry feeds.
MATERIALS AND METHODS
Materials and Reagents. Narasin (70 mglkg) or salinomycin (60 mgkg)
medicated poultry feeds were obtained fiom Unifeed Grain Growers Ltd. (Okotoks,
Alberta). Blank poultry feeds were from the Poultry Center, University of Alberta
(Edmonton, Alberta). Poultry feed sarnples were acquired under the coordination of Dr.
Frank Robinson of the Department of Agicultural, Food and Nutritional Science,
University of Alberta. Lasalocid (sodium salt), monensin (sodium salt), salinomycin.
narasin, maltotriose and maltotetraose were purchased from Sigma Chem. Co. (St. Louis,
MO). 2' ,4' ,6'-Trihydroxyacetophenone monohydrate (THAP), 3-arninoquinoline (3-AQ),
and 2,s-dihydroxybenzoic acid (DHB) were obtained from Aldrich Chem. Co.
(Milwaukee, WI). Al1 water used was double deionized (Milli-Q water purification
system, MiIlipore Corp., Bedford, MA). Individual stock solutions, lasalocid ( 1.34 x IO-'
M in methanol), monensin (1.16 x 10⁴ M in acetonitrile), salinomycin (1 -28 x lo4 M in
acetonitrile), and narasin (1.28 x 10⁴ M in acetonitrile), were prepared and stored at 4 C
until used.
Extraction of Coccidiostats from Poultry Feeds. The feed sarnples were
pulverized using a coffee grinder (Braun Inc., Wobum, MA) to obtain a hornogeneous
powder. Ground feed (1 g) was added to 10 mL of acetonitrile containing the intemal
standard monensin (1.45 x 10** M). The mixture was shaken with a horizontal shaker for
1 hr., and then filtered through Whatman No. 4 filter paper. Filtrate (2 mL) was loaded
ont0 a Sep-pak Cl8 cartridge (Waters Corp., Milford, MA) at a flow rate of about 1
mUmin. Filtrate fiom the Seppak Cl8 cartridge was collected in a 10 mL volumetric
Bask A M e r 4 mL of methanoVwater (94:6) was used tu elute the retained
coccidiostats on the Seppak Cl8 carüidge at the same flow rate. This eluent was aiso
collected in the 10 rnL volumetric Bask. The volume was then made up to 10 rnL with

methanoVwater (94:6). This partially purified coccidiostat extract was kept at 4 C for
MALDI-MS anal ysis.
MALDI-MS. MALDI-MS was performed using a hofiex" III in linear positive
mode (Bmker Analytical Systerns Inc., Billerica, MA). Coccidiostats CO-crystallized with
matrices on the probe were ionized by a nitrogen laser pulse (337 nm) and accelerated
under 20 kV with time-delayed extraction before entering the time-of-flight mass
spectrorneter. When THAP and 3-AQ were used, the preparation of matrix and sample
was the sarne as previously reported (Chapter 2, Wang et al., 1999). When DHB was
used, two types of matrix solutions were made. One contained 10- 15 mg/& DHB in
10% ethanol and the other 10- 15 mg/mL DHB in 0.0 1 M NaCl in 10% ethanol. The ratio
of matrix solution and sample was 1: 1. For al1 matrices either 1 pL sarnple solution or 1.5
pL mixture of matrix and sample was applied to a probe. The MALDI-MS sample was
air dned using a fan for 5 min. Laser strength was attenuated (the lower the attenuation.
the higher the laser strength) to obtain the best signai-to-noise ratio and isotopic
resolution. MALDI-MS was calibrated with two-point extemal caiibration using
[mahotriose + KI4 (exact isotopic mass = 543.13) and [rnaltotetraose + K]+ (exact
isotopic mass = 705.19) as calibrants, resulting in a mass accuracy 1 500 ppm. Any one
spectrum or one MALDI-MS run was acquired using 40 laser pulses at each of three
randornly chosen spots per MALDI-MS sarnple, for a total of 120 laser pulses, which
took about 2 min. The major isotopic '*c peak height or intensity was used for
quantification.
Statistics. Linear regressions, means and relative standard deviations (RSD) were
analyzed using Microsoft Exce197 (Microsoft Onice 97).
RESULTS AND DISCUSSION
It is possible to use MALDI-MS to anaiyze most compounds in a sarnple after the
anaiytes of interest have been extracted €rom a sample maaix. Key concems include the
selection of matrices, preparation of matrix and sample, signal-to-noise ratio, spot-to-spot
repeatability and response factors. Because of spot-to-spot variation, an internai standard
is a requirernent for quantification of anaiytes using MALDI-MS.

Selection of Matrices and Internd Standard. Based on Our previous research,
we chose three common matrices, 2',4',6'-trihydroxyacetophenone monohydrate
(THAP), 3-arninoquinoline (3-AQ), and 2,s-dihydroxybenzoic acid (DHB) to examine
their applicability for desorption and ionization of coccidiostats using MALDI-MS. Al1
three matrices produced good quality spectra for coccidiostats (Figure 7-2). Laser
Figure 7-2. Performance of different matrices for coccidiostat standards in MALDI-MS. A: THAP. B: 3-AQ. C: DHB. A mixture of lasalocid (Ml), monensin (M2), salinomycin (M3) and narasin (M4) was made by rnixing equal amounts of stock solution (vlv). Note that only predominant sodium adduct peaks are labeled, while potassium adduct peaks (with 39 mas shift) and double sodium adduct peaks (loss of one proton, with 45 mass shift) are not lakled.
strength used for desorption and ionization of coccidiostats was matrix related. 3-AQ
required higher laser strength than THAP and DHB. Laser strength was selected based on
good signal-to-noise ratio and the best resolution of analytes of interest (Chapter 2, Wang
et ai., 1999). In aLl experiments, isotopic resolution was achieved for ail matrices.
Compared to 3-AQ, THAP and DHB are good matrices for coccidiostats since they
produced good quaIity spectra with a relatively low laser strength. The response or peak
intensity was another factor used to determine the best ma&. No matter which matrix
was used, lasalocid exhibited only one fiifth or less the response of monensin under

s i d a r molar concentrations. Therefore, lasalocid was not the best intemal standard to be
selected for other coccidiostats in MALDI-MS quantification. When THAP was used as
matrix (Figure 7-ZA), sdinomycin and narasin showed one third the response of
monensin. In 3-AQ (Figure 7-2B) or DHB (Figure 7-2C), monensin, salinomycin and
narasin displayed similar responses in MALDI-MS. Since DHB gave reasonable peak
intensities for monensin, salinomycin and narasin under lower laser strength with good
spot-to-spot repeatability and high sensitivity, it was selected as the best matrix for
coccidiostats. Al1 further research was carried out using DHB. Monensin, salinomycin or
narasin could serve as intemal standards for each other using DHB.
Figure 7-3. Ionization of coccidiostat standards in MALDI-MS positive mode with DHB as macrix. A: salinomycin (M3) (3.20 x IW'M). B: lasaiocid (Ml) (1.34 x ko4 M). C: monensin (M2) (2.87 x lûs M). D: narasin (M4) (3.20 x 10" M). Detailed ionization for salinomycin is labeled in A. For lasalocid, monensin and narasin, only sodium adduct peaks are labeled.
I o ~ t i o n and Lhear Responses. In MALDI-MS, salinomycin (Figure 7-3A),
lasalocid (Figure 7-3B), monensin (Figure 7-3C) and narasin (Figure 7-3D) were
predominately ionized as @M+Na]+ ions, with additional small amounts of w+K]+ and
FI-H+2Na]+ ions (Figure 7-3A). When an excess of sodium (0.01 M NaCl in DHB
matrix solution) was appiied to the preparation of MALDI-MS samples, only sodium
adduct ions, M+Nalf and FI-H+ZNa]+, were observed. For quantification, peak heights

of m+Na]+ and [M-H+2Na]+ were summed if FI-H+2Na]+ was observed in a spectrum.
There were no observed fragmentation or fragment ions for coccidiostats in MALDI-MS.
However, in HPLC electrospray MS, they do fragment, for example, salinomycin formed
fragment ions at d z 225 and 373 (Harris et al., 1998).
Coccidiostats, for exarnple monensin or narasin, contain molecular variations
known as coccidiostat factors. Some minor factors are often with 14 mass lower or
higher, occasiondy 2 mass lower, than the major coccidiostats (Coleman et al., 1994;
Rodewald et al., 1994). MALDI-MS could easily detect ail facton when the
concentration of the total coccidiostats was high enough. e.g., in order of x 10" M.
However, as expected, peak intensities from these rninor factors were very low and 5% or
in most cases much less than the peak height of the major coccidiostats. In this paper,
MALDI-TOF MS quantification of coccidiostats focused on the major coccidiostats. For
exarnple for narasin, only narasin factor A was determined, and for monensin, only
monensin factor A was studied. These minor factors account for the slightly reduced
purity of standards noted in the Materials and Reagents section.
Since monensin, salinomycin and narasin showed similar responses (Figure 7-
2C), and the sample to be analyzed contained salinomycin or narasin, monensin was
selected as an internai standard for quantification. Generally, peak intensity (total of d l
ions) or response of coccidiostats in MALDI-MS was linearly correlated to their rnolar
ratios in a MALDI-MS sample. The linearity was separately determined for salinomycin
(slope-0.82, ~ ~ = 0 . 9 8 ) and narasin (slope=1. 15, ~'4.97) in a range from 3.20 x 1 O-' M
(0.24 pg/mL) to 3.20 x I O ~ M (2.40 pg/mL) using monensin as an intemal standard (2.87
x 106 M). The slopes were used as response factors to quantify salinornycin or narasin in
poultry feeds and spiked samples.
Stabiiity of Coccidiostats in MALDI-MS Samples. Arnong the four
coccidiostats, salinomycin and narasin tended to degrade in aqueous solutions. Davis et
al. (1999) indicated that some coccidiostats, particuiariy salinomycin and narasin, were
unstable in waterlmethanol(98:2) solution. However, no significant degradation was
observed in pure acetoniûile or methanol for these compounds. When analyzed using
MALDI-MS, we found the preparation method of matrix and sample could result in the
degradation of saiinomycin and narasin. This rnight have occurred because the mixture of

matrix @HB) solution and coccidiostats was acidic, which could have caused
salinomycin and narasin to dissociate. The stability of salinomycin and narasin was
studied in two ways to determine a method to prepare stable MALDI-MS coccidiostat
samples for quantification. The fmt experiment was perfomed by applying the mixture
to the probe at 0,30,60 and 120 min. intervals after coccidiostats had been mixed with
matrix solution before acquiring MALDI-MS data The second experiment involved
applying the mixture to the probe immediately after the coccidiostats had been mixed
with matrix solution, followed by acquiring MALDI-MS data at 0,30,60 and 120 min.
intervals. (Note that it took 5 min. for the mixture to dry on the probe.) Figure 7-4 shows
the spectra of the four coccidiostats under these conditions. Peak intensities of lasalocid
and monensin (Figure 7-4A and B) remained constant, which indicated they were stable
under either condition. However, peak intensities of salinomycin and narasin (Figure 7-
4A) decreased significantly at each interval under the condition of the first experiment.
I 60 min.
Figare 7-4. Stability of coccidiostats in MALDLMS samples. A: spectra of coccidiostats by applying the mixture to probe at different intervals (0,30,60, 120 min,) afier coccidiostats had been mixed with matrix solution and followed directly by acquisition of MALDI-TOF data. B: spectra of coccidiostats applied to the probe and dned immediately after coccidiostats had been mUred with matrix solution, foUowed by acquisition of MALDI-TOF data at different intervals (0,30,60, 120 min.). A mixture of lasalocid, monensin, saliaomycin and narasin was made by mixing equal amounts of stock solutions (vfv). Arrows, h m Ieft to right, indicate Iasalocid, monensin, salinomycin and narasin sodium adduct peaks.

An attempt was made to study details of the degradation since several peaks at masses
between 490 and 590 were generated as the peak intewities of salinomycin and narasin
decreased (spectra not shown). However, the degradation of salinomycin and narasin was
complex and peaks between m/z 490 and d z 590 tended to degrade further with
increased time. Nevertheles, if salinomycin and narasin were dried on the probe
immediately after mixing with matrix, the peak intensities (Figure 74B) stayed constant.
Al1 the linear responses and quantification of coccidiostats in this study were carried out
in this manner with 0.01 M NaCl in the matrix solution. It also seemed that salinomycin
and narasin were slightly more stable with addition of the sodium salt (data not shown).
MALDI-MS Quanofication of Coccidiostats. One of the advantages of
MALDI-MS is its tolerance of contarninanü. Cnide sample extracts can be applied to
MALDI-MS directly without purification, and the analytes of interest can still be
determined (Abel1 and Spoms, 1996; Chapter 2, Wang et al., 1999; Driedger and Spoms.
1999). Coccidiostats (Figure 7-543 and B3) in crude extracts or acetonitrile extracts were
identified. The extracts also contained a group of unidentified compounds (at d z 758,
780,782 and 804; Figure 7-5A1, A3, B1 and B3). These cornpounds were close eoough
in mass to interfere with the detection of saiinomycin (Figure 7-5A3) or narasin (Figure
7-5B3), or possibly suppress the coccidiostat molecular ions. Therefore, a simple fast
protocol was developed to remove interfering compounds using a Sep-pak C 18 cartridge.
After crude extracts were loaded on the cartridge, interfering compounds were retained
on the cartridge. Some coccidiostats passed through the cartridge and some were aiso
retained. With elution of an additional 4 mL of methanollwater (94:6), al1 coccidiostats
were eluted from the cartridge. Because of this selective elution, the use of other C 18
cartridges could required a modified elution protocol. After the cartridge purification
procedure, coccidiostats and interfering compounds were separated, and MALDI-MS
could generate clean spectra for coccidiostats of poultry feed extracts (Figure 7-SA2 and
82). The interfenng compounds, retained on the cartridge, were eluted with
chlorofomilmethanol(95:5) and the spectra are shown in Figure 7-5Al and B 1. The
recovery of the purification procedure for coccidiostats was studied with standards. A 2
mL mixture of coccidiostats (monensin = 2.1 x 10 " M, salinomycin = 2.1 x 10 " M, and
narasin = 2.1 x 10 " M.) was loaded on the cartridge and carried through the entire

Figure 7-5. MALDI-MS spectra of coccidiostats from poultry feeds. Al and B 1: interfering compounds eluted with chloroform/methanol (955). Arrows, fiom left to right, indicate interfering compounds at d z 758,780,782, and 804 respectively. A2 (salinomycin [M3]) and B2 (narasin w4]): purified coccidiostats from poultry feed samples (using Seppak Cl8 cartridge purification procedure). M2: intemal standard monensin. A 3 salinomycin medicated poultry feed crude extracts. B3: narasin medicated poultry feed crude extracts.
procedure. After 3 mL of methanovwater (94:6) washing, no coccidiostat standards could
be detected in the eluent by MALDI-MS. Because the concentration of coccidiostats in
sample extracts was lower than that of the above standard mixture. it was assumed that ail
sample coccidiostats were recovered since the cartridge could not be overloaded.
Al1 poultry feed sarnples and spiked samples were analyzed using the developed
method and the results are presented in Table 7-1. Monensin (1.45 x 10" M) was used as
an intemal standard and added io the extraction solvent (acetonitrile). Medicated poultry
feed contained 60 pg/g salinomycin or 70 pg/g narasin, and the MALDI-MS assay for
salinomycin or narasin in medicated samples found 60.3 pg/g and 66.0 pdg respectively
(Table 7- 1). The validation of the method was M e r confirmed by spiking experiments.
Blank poultry feed was spiked at two concentrations and medicated samples were spiked
at one concentration of salinomycin or narasin (Table 7-1). Recovery for salinomycin
ranged from 99 to 102%, and recovery for narasin was fkorn 92 to 96%. AU these data
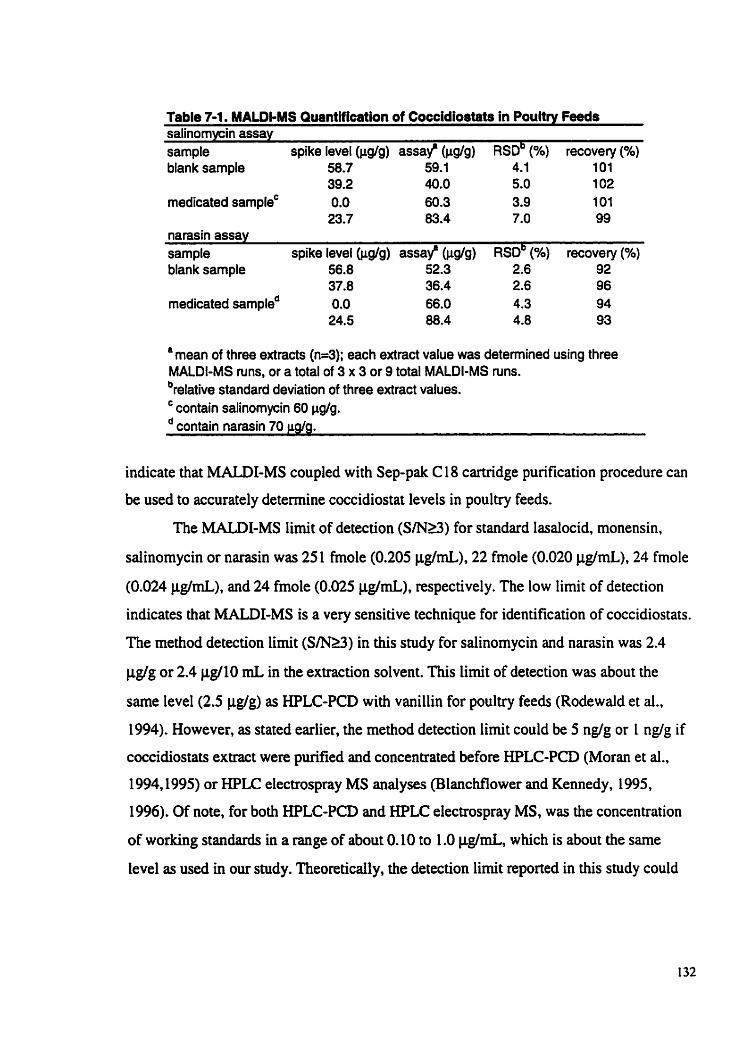
Table 7-1. MALDCMS QuantHication of Coccidiostats in Poultw Feeds salinomycin assay sample spike level (pg/g) assaf (pglg) R S D ~ (%) recovery (%) blank sample 58.7 59.1 4.1 101
39.2 40.0 5.0 102 medicated sampleC 0.0 60.3 3.9 101
23.7 83.4 7.0 99 narasin assay sampte spike level @dg) assaf (pg/g) R S D ~ (%) recovery (%) blank sample 56.8 52.3 2.6 92
37.8 36.4 2.6 96 medicated sampled 0.0 66.0 4.3 94
24.5 88.4 4.8 93
arnean of three extracts (n=3); each extract value was determined using three MALDI-MS runs, or a total of 3 x 3 or 9 total MALDI-MS mns. brelative standard deviation of three extract values.
contain salinomycin 60 pg/g. contain narasin 70 Mg.
indicate that MALDI-MS coupled with Sep-pak C 18 cartridge purification procedure cm
be used to accurately determine coccidiostat levels in poultry feeds.
The MALDI-MS lirnit of detection (Sm) for standard lasalocid, monensin,
salinomycin or narasin was 25 1 ho l e (0.205 pg/mL), 22 fmole (0.020 pg/mL), 24 fmole
(0.024 pg/mL), and 24 fmole (0.025 pg/rnL), respectively. The low Iimit of detection
indicates that MALDI-MS is a very sensitive technique for identification of coccidiostats.
The method detection lirnit ( S m ) in this study for salinomycin and narasin was 2.4
pg/g or 2.4 j@10 rnL in the extraction solvent. This lirnit of detection was about the
same Ievel(2.5 pg/g) as HPLC-PCD with vanillin for poultry feeds (Rodewald et al.,
1994). However, as stated earlier, the method detection limit could be 5 ng/g or 1 ng/g if
coccidiostats extract were purified and concentrated before HPLC-PCD (Moran et al.,
1994,1995) or HPLC electrospray MS analyses (BlancMower and Kennedy, 1995,
1996). Of note, for both HPLC-PCD and HPLC electrospray MS, was the concentration
of working standards in a range of about 0.10 to 1.0 pg/rnL, which is about the sarne
level as used in our study. Theoretically, the detection limit reported in this study could
also be improved by concentrating sample extracts andor increasing sample size in the
extraction procedure.
In conclusion, MALDI-MS is a simple technique to identify and quantify
coccidiostats without derivatization, or without HPLC separation More use of a mass
spectrometer. MALDI-MS can serve as a valuable rapid and sensitive technique for
quantification of coccidiostats in poultry feeds with minimum sample purification. It is
also likely that MALDI-MS has the potential to analyze coccidiostats in other complex
sample matrices and to be used as an alternative to HPLC-PCD and HPLC electrospray
mass spectrometry .
REFERENCES
Abell, D. C.; Spoms, P. Rapid quantitation of potato glycoalkaloids by matrix-
assisted laser desorption/ionization time-of-flight mass spectrometry. J. Agric. Food
Chem. 1996,44,2292-2296.
Ancireasen, J. R. Jr.; Schleifer, J. H. Salinomycin toxicosis in male breeder
turkeys. Avian Dis. 1995,39,638-642.
Blanchflower, W. J.; Kennedy, D. G. Determination of lasalocid in eggs using
liquid chromatography-electrospray mass spectrometry. Analyst. 1995, 120, 1 129- 1 132.
Blanchflower, W. I.; Kennedy, D. G. Determination of monensin, salinomycin
and narasin in muscle, Liver and eggs from domestic fowl using liquid chromatography-
electrospray mass spectrometry. J. Chromatogr. 1996,675,225-233.
Braunius, W. W. Ionophorous anticoccidiai dmgs in coccidiosis control. World's
Poult. Sci. J. 1985,4 1, 198-209.
Davis, A. L.; Harris, J . A.; Russell, C. A. L.; Wilkins, J. P. G. Investigations by
WLC-electrospray m a s spectrometry and NMR spectroscopy into the isomerisation of
salinomycin. Analyst. 1999, l24,25 1 -256.
Driedger, D. R.; Spoms, P. Glycoalicaloid concentration in Aiberta potatoes
determined by ma&-assisted laser desorptiodionization mass spectrometry. J. AOAC.
Int. 1999,82,908-9 14.

Ellion, C. T.; Kennedy, D. G.; McCaughey, W. J. Methods for the detection of
polyether ionophore residues in poultry. Analyst. 1998, 123,45R-56R.
Harris, J. A.; Russell, C. A. L.; Wilkins, J. P. G. The characterisation of polyether
ionophore veterinary drugs b y HPLC-electrospray MS . Analyst. 1998, 1 23,2625-2628.
Karas, M.; Bachmann, D.; Bahr, U.; Hillenkamp. F. Matrix-assisted ultraviolet
laser desorption of non-volatile compounds. Int. J. Muss Spectrom. Ion Processes. 1987,
78,53-68.
Karas, M.; Matrix-assisted laser desorption ionization MS: a progress report.
Biochem. Muss Spectrom 1996,24,897-900.
Moran, J. W.; RodewaId, J. M.; Donoho, A. L.; Coleman, M. R. Determination of
monensin in chicken tissues by liquid chromatography with postcolumn derivatization. J.
AOAC Int. 1994,77,885-890.
Moran, J. W.; Turner, J. M.; Coleman, M. R. Determination of monensin in edible
bovine tissues and milk by liquid chromatography. J. AOAC. Int. 1995,78,668-673.
Muldoon, M. T.; Elissalde, M. H.; Beier, R. C.; Stanker, L. H. Development and
validation of a monoclonal antibody-based enzyme-linked immunosorbent assay for
saiinomycin in chicken liver tissue. J. Agric. Food Chem. 1995,43, 1745-1750.
Novilla, M. N. The veterinary importance of the toxic syndrome induced by
ionophores. Vet. Hum. Toxicol. 1992,34,66-70.
Novilla, N. M.; Owen, N. V.; Todd, G. C. The comparative toxicology of narasin
in laboratory animais. Vet. Hum. Toxicol. 1994,36,3 1 8-323.
Pressman, B. C.; Fahirn, M. Pharmacology and toxicology of the monovalent
carboxylic ionophores. Annu. Rev. Pharmacol. Toxicol. 1982,7 1,480-484.
Rodewald, J. M.; Moran, J . W.; Donoho, A. L.; Coleman, M. R. Determination of
narasin in raw matenal, premix, and animal feeds by liquid chromatography and
correlation to microbiological assay. J. AOAC. Int. 1994,77,82 1-828.
Rollinson, J.; Taylor, F. G. R.; Chesney, J. Salinomycin poisoning in hones. Vet.
Rec. 1987,121,126-128.
Salles, M. S.; Lombardo de Barros, C. S.; Banos, S. S. Ionophore antibiotic
(narasin) poisoning in rabbits. Vet. Hum Toxicol. 1994,36,437-444.

Wang, J.; Sporns, P.; Low, N. H. Analysis of food oligosacchacides using
MALDI-MS: quantification of fnictooligosaccharides. J. Agric. Food Chem. 1999,47,
1549-1557.
Chapter 8
General Discussion and Conclusions
The introduction of MALDI-MS in the latter part of the 1980's has brought
tremendous change and progress in the analyses of non-volatile large andor thermally
labile molecules (Karas et al., 1985, 1987; Karas and Hillenkarnp, 1988; Tanaka et al.,
1988). The applications of MALDI-MS in food science have exhibited advantages over
other techniques, including speed of analysis, high sensitivity, wide mass range. mass
determination of unfragmented molecules, tolerance to contaminants, and ability to
analyze complex mixtures. This thesis explored the applicability of MALDI-MS for
analyses of fructooligosaccharides, debranched starch, anthocyanins, flavonol glycosides,
and coccidiostats, using an intemal standard or standard addition.
MALDI-MS of Oiigosaccharides. High performance anion exchange
chromatography (HPAEC) with pulsed arnperometnc detection (PAD) and MALDI-MS
are currently the two most powefil techniques for analysis of oligosaccharides.
However, the sensitivity and resolution of HPAEC-PAD decrease with increasing degree
of polyrnerization (DP), therefore it does not provide accurate quantitative profiles for
oligosaccharides (Timmermans et al., 1994; Wong and Jane, 1997; Stahl et al., 1997;
Kazmaier et al., 1998). When analyzed by MALDI-MS, fmctooligosaccharides showed
sirnilar responses on a molar bais (THAP as matrix, Chapter 2, Wang et al., 1999a) and
maltooligosaccharides exhibited sirnilar responses on a weight basis (DHB as matrix,
Chapter 3, Wang et ai., 1999b). Consequently, MALDI-MS provided accurate
quantitative profiles for fnictooligosaccharides or maltooligosaccharides in food samples.
For higher DP, Mohr et ai. (1995) showed the potential of using MALDI-MS to resolve
carbohydrates (dextran 40 ma) of DP 100 or more. MALDI-MS, so far, is the simplest,
fastest and most accurate method to analyze fnictooligosaccharides in foods such as
onions, shallots, and garlic, and maltooligosaccharides from debranched starch. The
sensitivity and accuracy of MALDI-MS for oligosaccharides open up opportunities for
M e r understanding the structure of some very large molecular carbohydrates, such as
p-glucans or branching patterns of amyiopectin in various crops. Furthemore, since it

can determine molecular weight changes, MALDI-MS should have a great impact on the
study of modifed starch products.
MALDI-MS Quantification of Anthocyanins. Anthocyanins are a group of
important antioxidants in food. Since under acidic conditions they are predominately in
the aromatic oxonium ion form, anthocyanins easily ionize to form molecular weight
cations (M3 and occasionally potassium adducts in MALDI-MS (Chapter 4, Wang and
Spoms, 1999; Chapter 5). Traditional HPLC has k e n widely employed for quantification
of anthocyanins. The required gradient elution with HPLC has an effect on anthocyanin
visible absorbance characteristics due to changes in solvent composition. Therefore.
proper quantification can be very difficult. In MALDI-MS, a group of chemically similar
anthocyanins, such as the monoglycosides, exhibited similar responses, which allowed
for more accurate quantification with proper standard addition methods. Anthocyanins
fragmented in the MALDI-MS ion source with the loss of carbohydrate residues and the
monoglycoside anthocyanins ftagmented in a predictable manner (Chapter 5). In any
single MALDI-MS sample, al1 anthocyanins exhibited a similar percentage fragmentation
(Chapter 5, Table 5-1). In fact, an intemal standard, such as cyanidin 3-glucoside, will
fragment with the same pattern or relative amount as al1 other anthocyanins, and therefore
can be used as a reference for quantification. Further quantitative fragmentation studies
on di- or triglycosides or a mixture of mono-, di-, and triglycoside anthocyanins will be
necessary in order to use MALDI-MS to quantify these anthocyanins in food. MALDI-
MS was rapid and accurate in identification and quantification of anthocyanins with
different masses. Reliable anthocyanin profiles of food samples could be obtained in a
few minutes. The methodology developed should be very useful for monitoring
anthocyanin changes due to breeding, storage, or processing of fruits.
MALDI-MS Anelysis of Flavonol Glycosides. The reason for MALDI-MS
tolerance to contarninants may be the selectivity or preference of a mauix towards
ionizing a particular analyte. Five common matrices, e.g. 4-hydroxy-a-cyano-cinnamic
acid (HCCA), 2' -4' ,6'-trihydroxyacetophenone (THAP), 2-(4-hydroxyp heny1azo)-
benzoic acid ( M A ) , tram-3-indoleacrylic acid (DA), and 25-dihydroxybenzoic acid
(DHB), could ail produce good qudity spectra in the MALDI-MS positive mode for
Bavonol giycoside standards. THAP and IDA were also good matrices for producing

negative ions with flavonol glycosides. However, only THAP worked for crude flavonol
glycoside extracts from teê Hence, selection of the proper matrix can be a key
consideration for MALDI-MS analysis of analytes in food extracts. The flavonol
glycoside ion responses in MALDI-MS positive and negative modes were different. The
negative mode for al1 flavonol glycosides resulted in one [M-H]' ion peak, without
detectable fragmentation. In the positive mode, multiple ion foms, dong with further
fragmentation through loss of glycosidic residues, provided more structural information
for flavonol glycosides. Flavonol glycosides showed sirnilar intensities or responses in
the positive mode, while kaempferol glycosides exhibited much less response than
quercetin glycosides in the negative mode. Although flavonol glycosides fragmented in
the ion source, the mono- and di-glycosides fragmented in the same ratio and the amount
of fragmentation could be determined with a defined MALDI-MS sarnple preparation
(Chapter 6, Wang and Spoms, 2000). Therefore, any flavonol glycoside MALDI-MS
spectnim was able to provide both qualitative and quantitative information on the
flavonol glycosides in food samples.
The applications of MALDI-MS for anthocyanins and flavonol glycosides allow it
to serve as a powerful tool to provide an authentic "fingerprint" for foods. This
fingerprint cm be used to determine differences in fruit varieties and maturity as well as
changes due to storage or processing of fruits. It can also be used for quality control in
functional foods or various herb extracts, for example Ginkgo extracts. which mainly
contain flavonol glycosides (Mauri et al., 1999). Furthet research cm extend the
application of MALDI-MS to the entire flavonoid farnily (isoflavones in soy or soy
products) or compounds with weak chromophores (terpenoids in Ginkgo).
MALDI-MS Quantifkation of Coccidiostats. Lasalocid, monensin, salinom yc i n
and narasin have ionophoric properties (Pressman and Fahim, 1982; Braunius, 1985),
which likely contribute to the ease of formation of coccidiostat alkali adduct ions in
MALDI-MS and the resulting high sensitivity. The MALDI-MS lirnit of detection for
lasalocid, monensin, salinomycin or narasin standards was 25 1,22,24 and 24 hole.
respectively. Roper matrix selection, which was DHB in this case, once again indicated
its importance for proper MALDI-MS quantification. Monensin, salinomycin or narasin
could serve as intemal standards for each other when DHB was used as the matrix.

However, the preparation rnethod of matrix and sarnple could result in the degradation of
analytes, such as was seen with salinomycin and narasin, due to the acidic solvent
environment produced by the high concentration of the DHB mahix. However,
salinomycin and narasin were stable when dned on the MALDI-MS probe after rnixing
with matrix solution. Since a matrix mainly serves to ionize and desorb analytes in the
MALDI-MS, it may be prudent that samples always be rapidly dried on the probe after
the sample and matrix have k e n mixed.
Further Improvement. Most MALDI-MS commercial instruments have been
designed for qualitative purposes instead of for quantification. The numbers of laser shots
and desorption locations were quite often arbitrarily set, and peak heights or intensities
were usually used for quantification. This may add error and lengthen the analysis. With
the progress in instrumentation design, a fully automatic analysis system will likely
improve MALDI-MS analytical speed, accuracy and precision. Currentiy, some
automated machines are commercially available. For example, Bruker's ~ e f l e x ~ ~ III and
~ i f l e x ~ III MALDI-MS systems have an automated sample and data acquiring system,
and 1,536 samples c m be loaded on a single target. An automated MALDI-MS system
allows MALDI-MS to serve not only as a powerful tool for peptide or nucleotide
sequencing or oligosaccharide stmctural studies but aiso as a routine rapid anaiytical
technique for many food analyses.
Braunius, W. W. Ionophorous anticoccidial drugs in coccidiosis control. World's
Poult. Sci. J. 1985,4 1, 198-209.
Karas, M.; Bachmann, D.; Bahr, U.; Hillenkamp, F. Matrix-assisted ultraviolet
laser desorption of non-volatile compounds. Int. J. Mass Spectrom. Ion Processes. 1987,
78,53-68,
Karas, M.; Bachmann, D.; KiUenkamp, F. Influence of the wavelength in high-
irradiance ultraviolet laser desorption mass spectrometry of organic molecules. Anal.
Chem 1985,57,2935-2939.

Karas, M.; Hillenkamp, F. Laser desorption ionization of proteins with molecular
masses exceeding 10 000 daltons. Anal. Chem 1988,60,2299-230 1.
Kamiaier, T.; Roth, S.; Zapp, J.; Harding, M.; Kuhn, R. Quantitative analysis of
malto-oligosaccharides by MALDI-TOF mass spectrometry, capillary electrophoresis and
anion exchange chromatography. Fresenius J. Anal. Chem 1998,36 1.473-478.
Mauri, P.; Migliazza, B.; Pietta, P. Liquid chromatographylelectrospray mass
spectrometry of bioactive terpenoids in Ginkgo biluba L. J. Mass Spectrom. 1999,34.
1361-1367.
Mohr, M. D.; Bornsen, K. O.; Widmer, H. M. Matrix-assisted laser
desorptiodionization mass spectrometry: Irnproved matrix for oligosaccharides. Rapid
Commun. Mass Spectrom. 1995,9,809-8 14.
Pressman, B. C.; Fahim, M. Pharmacology and toxicology of the monovalent
carboxylic ionophores. Annu. Rev. Pharmacol. Toxicol. 1982,7 1,480-484.
Stahl, B.; Linos, A.; Karas, M.; Hillenkarnp, F.; Steup, M. Analysis of fnictans
from higher plants by matrix-assisted laser desorptiodionization mass spectrometry.
Anal. Biochem. 1997,246, 195-204.
Tanaka, K.; Waki, H.; ido, Y.; Akita, S.; Yoshida, Y.; Yoshida, T. Protein and
polyrner analyses up to m/t 100,000 by laser ionization time-of-flight mass spectrometry.
Rapid Commun. Mass Spectrorn 1988,2,15 1 - 153.
Timmermans, J. W.; van Leeuwen, M. B.; Tournois, H.; de Wit, D.; Vliegenthart,
J. F. G. Quantification analysis of the molecular weight distribution of inulin by means of
anion exchange HPLC with pulsed arnperometric detection. J. Carbohydr. Chem. 1994,
13,881-888.
Wang, J.; Jiang, G. S.; Vasanthan, T.; Spoms, P. MALDEMS characterization of
maltooligo/polysaccharides fiom debranched starch amylopectin of corn and barley.
Starch. 1999b, 5 1,243-248.
Wang, J.; Spoms, P. Analysis of anthocyanins in red wine and fniit juice using
MALDI-MS. J. Ag&. Food Chem 1999,47,2009-2015.
Wang, I.; Spoms, P. MALDI-TOF MS analysis of food flavonol glycosides. J.
Agric. Food Chem 2 0 , In press.

Wang, J.; Spoms, P.; Low, N. H. Analysis of food oligosaccharides using
MALDI-MS : Quantification of mictooligosaccharides. J. Agric. Food Chem. 1999a, 47,
1549-1 557.
Wong, K. S.; Jane, J. Quantitative analysis of debranched arnylopectin by
HPAEC-PAD with a postcolumn enzyme reactor. J. Liq. Chromatogr. Relat. Technol.
1997,20,297-3 1 O.

Appendix 1
Experimental design for analysis of fructooligosaccharides using both
HPAEC-PAD and MALDI-MS (Chapter 2)
1 one single sampie extract 1
duplicate averaged I
final value (n=2) * MALDI- MS data
acquisition without standard
(GF4) I
MALDI- MS data
acquisition wiih
standard ( ( 3 4 )
7
-
five replicates'
t one replicate 4 other replicates
r
I 5 replicates averaged I I
fwe rept icates"
5 replicates averaged rn duplicate averaged G final vaiue (n=2) ?l
Note: 'two groups of five ceplicates were managed in the same manner. experimenfs were conducted in the sarne way.

Experimental design for analysis of anthocyanins using both HPLC and
MALDI-MS (Chapter 5)
L Dried and
resolubilized in a solvent of 86%
solvent A and 14% solvent B of HPLC
mobile phase
each taking 70 min.
1 three sarnple averaged I final value (n=3) ?l
replicates taking 20 min.
I 1 five replicates (mm) 1
MALDI- MALDI- MS data MS data
acquisition acquisition without without standard standard
(cyanidin 3- (cyanidin 3- glucoside) glucoside)
I 1
Note: three simples were analyzed in the same manner. experiments were conducted in the rame way. represented one single W I - M S m. The £ir~t replicates from three samples were used to calculate the means of one single MALDEMS run.