food deserts: identifying and overcoming issues in the … · · 2015-06-01food deserts:...
TRANSCRIPT

Food Deserts: Identifying and Overcoming Issues in the Supply Chain
by
Gina Lacagnina
A Thesis Presented in Partial Fulfillment
of the Requirements for the Degree
Master of Science
Approved March 2015 by the
Graduate Supervisory Committee:
Christopher Wharton, Chair
Cristina Barroso
Renee Hughner
ARIZONA STATE UNIVERSITY
May 2015

i
ABSTRACT
Research related to food deserts, areas with limited access to healthy and
affordable food options, has focused primarily on issues of healthy food access, food
quality and pricing, dietary outcomes, and increased risk for chronic diseases among
residents. However, upstream challenges that might play a major role in the creation and
perpetuation of food deserts, namely problems in the supply chain, have been less
considered. In this qualitative study, researchers conducted semi-structured interviews
with local produce supply chain representatives to understand their perspectives on the
barriers to, and potential solutions for, supplying affordable produce to underserved areas
in Phoenix, AZ. Through industry and academic experts, six representatives of the
supply chain were identified and recruited to take part in one-hour interviews. Interviews
were audio-recorded, transcribed, and coded into categories using a general inductive
approach. Using the qualitative analysis software NVIVO to assist in data analysis,
themes and subthemes emerged. Results suggested that considerable barriers exist
among the representatives for supplying fresh, affordable produce in Phoenix-area food
deserts, including minimum delivery requirements beyond the needs of the average small
store, a desire to work with high-volume customers due to transportation and production
costs, and the higher price point of produce for both store owners and consumers.
Conversely, opportunities were identified that could be important in overcoming such
barriers, including, tax or economic incentives that would make distribution into food
deserts financially viable, infrastructural support for the safe handling and storage of
fresh foods at existing retail outlets, and the development of novel distribution
mechanisms for producers such as mobile markets and food hubs. Future research is

ii
needed to determine if these findings are representative of a larger, more diverse sample
of Arizona produce supply chain representatives.

iii
DEDICATION
I would like to thank my partner Ben Backhaus for inspiring me to wholeheartedly pursue
both my academic and creative visions. I would also like to thank my family for their
constant love and encouragement throughout my life.
iv
ACKNOWLEDGMENTS
I have had the privilege of working with intelligent and inspiring researchers on this
project. I would like to express my sincere appreciation to my committee members, Drs.
Renee Hughner and Cristina Barroso, and especially my incredible chair, Dr. Christopher
Wharton. Thank you for your thoughtful feedback, insight, and positive support
throughout my graduate career. I would also like to thank Rick Hall for providing
training and guidance for my research methods.
v
TABLE OF CONTENTS
CHAPTER Page
1 INTRODUCTION ................ ...................................................................................... 1
Statement of the Problem ........................................................................... 1
Background ................................................................................................ 2
Current Research Deficiencies .................................................................. 3
Purpose ....................................................................................................... 5
Delimitations .............................................................................................. 5
Limitations.................................................................................................. 6
2 LITERATURE REVIEW ............ ............................................................................... 7
Dietary Patterns and Chronic Disease Risk ............................................... 7
Health Disparities ....................................................................................... 9
Food Insecurity and Health Outcomes .................................................... 11
Food Environments and Health Outcomes ............................................. 13
Disparities in Healthy Food Access......................................................... 15
Food Deserts: History, Prevalence, and Implicaitons ............................. 16
Cost Comparisons .................................................................................... 21
Variety and Quality Comparisons ........................................................... 23
Fresh Produce Supply Chain and Healthy Food Access ......................... 25
3 METHODOLOGY ................. .................................................................................. 30
Participants ............................................................................................... 30
Interview Design ...................................................................................... 31
Data Analysis ........................................................................................... 33
vi
CHAPTER Page
4 RESULTS .................... ............................................................................................. 35
Barriers ..................................................................................................... 37
Strategies .................................................................................................. 41
Additional Insights ................................................................................... 43
5 DISCUSSION .................. ......................................................................................... 45
Barriers ..................................................................................................... 45
Strategies .................................................................................................. 48
Additional Insights ................................................................................... 50
Future Research ........................................................................................ 52
6 CONCLUSION ............ ............................................................................................ 54
REFERENCES...... ................................................................................................................ 56
APPENDIX
A RECRUITMENT LETTER .................................................................................... 64
B INTERVIEW CONSENT LETTER ...................................................................... 66
C DEMOGRAPHICS SURVEY ............................................................................... 69
D INTERVIEW GUIDE ............................................................................................ 73
E IRB APPROVAL .................................................................................................... 80
1
CHAPTER 1
INTRODUCTION
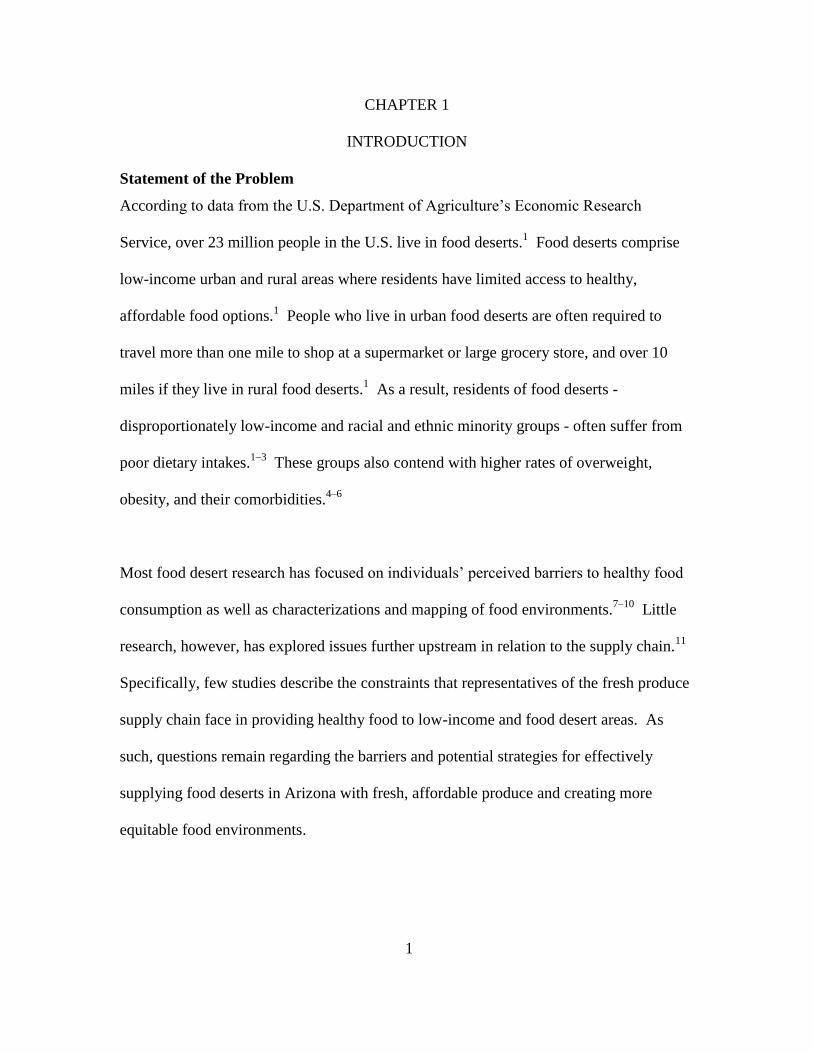
Statement of the Problem
According to data from the U.S. Department of Agriculture’s Economic Research
Service, over 23 million people in the U.S. live in food deserts.1 Food deserts comprise
low-income urban and rural areas where residents have limited access to healthy,
affordable food options.1 People who live in urban food deserts are often required to
travel more than one mile to shop at a supermarket or large grocery store, and over 10
miles if they live in rural food deserts.1 As a result, residents of food deserts -
disproportionately low-income and racial and ethnic minority groups - often suffer from
poor dietary intakes.1–3
These groups also contend with higher rates of overweight,
obesity, and their comorbidities.4–6
Most food desert research has focused on individuals’ perceived barriers to healthy food
consumption as well as characterizations and mapping of food environments.7–10
Little
research, however, has explored issues further upstream in relation to the supply chain.11
Specifically, few studies describe the constraints that representatives of the fresh produce
supply chain face in providing healthy food to low-income and food desert areas. As
such, questions remain regarding the barriers and potential strategies for effectively
supplying food deserts in Arizona with fresh, affordable produce and creating more
equitable food environments.
2
Background
According to a 2010 Arizona Health Survey, more than one-third of Arizonans are
categorized as low-income.12
Of these low-income respondents, 40 percent were also
characterized as food insecure, a condition associated with negative health outcomes
across the lifespan.12,13
The 2014 Arizona State Health Assessment revealed that food
insecurity rates in Arizona exceed national averages, as an estimated 29 percent of all
children and 19 percent of all Arizonans live in a food insecure household, compared to
20 percent of children and 16.1 percent of the U.S. population.14
Among children, food
insecurity has been related to adverse growth and development, behavioral and
psychological issues, and key nutrient deficiencies.13
Among adults, it has been related
to depression, obesity and the development of other chronic diseases, and poor disease
management.13,15,16
Due to the severity of health issues related to food insecurity in both
children and adults, improving this issue is of vital importance for the nation’s public
health.
The potential coexistence of food insecurity and obesity is likely the result of
considerable barriers to healthy food access coupled with easy access to low-cost,
unhealthy fast and convenience foods, among other factors.2,8
The prevalence of food
stores that offer primarily unhealthy items in low-income and minority neighborhoods
has been documented in several studies, and on a national level, low-income zip codes
are reported to have 30 percent more convenience stores than higher income areas.2,17
These stores generally offer relatively inexpensive refined and highly processed foods
and very little, if any, fresh fruits, vegetables, and whole grains. Environmental factors

3
that limit access to healthy foods include relative distance to supermarkets; access to
public or private transportation; and the higher prices, lower variety, and poor quality of
fresh fruits and vegetables found in smaller neighborhood stores.1,9,17–19
Public health advocates and researchers have suggested various strategies for improving
healthy food access in underserved areas. For example, providing state or federal
financial assistance has been suggested as one way to incentivize store operators to
establish businesses in food deserts, or to equip existing stores with technical assistance
to stock and sell healthier food options.20
Healthy corner store programs have been
implemented in various cities across the country, and an emerging body of research exists
evaluating their impact. Researchers have also described the potential importance of
farmers’ markets, farm stands, and other “alternative” retail food outlets in providing
more consistent access to healthy, fresh foods.1,21,22
These supply chain strategies,
bolstering access to healthy food by establishing or improving healthy food distribution
and retail, are potential solutions for increasing fresh produce supply into underserved
communities.
Current Research Deficiencies
Although public health officials and researchers alike have investigated the issue of food
deserts since the early 1990s, the variety of problems that result in food deserts has not
been fully described.11,23
In part, it has been difficult to draw definitive conclusions on
the relationship between physical accessibility to food sources and dietary intake and
health outcomes due to variations in research methodology.8 Studies have most
4
commonly examined access to supermarkets and other retail food sources, racial and
ethnic disparities in healthy food access, socioeconomic status in food deserts, and the
role of the local food environment on dietary intake and health outcomes.8,23,24
A small
amount of qualitative studies have also examined community members’ attitudes and
perceptions towards the variety and quality of foods available in their neighborhoods, and
small store owners’ opinions regarding barriers to selling healthful items in low-income
communities.9,10
Studies examining the relationship between the local food environment and health have
found that it differs by social context. Research shows that access to certain food stores
by location is largely dependent on the socioeconomic status and race or ethnicity of a
community, raising serious social and environmental justice concerns.2,8,9,17,19
Many
experts have used supermarkets as an indicator of healthy food access because of the
variety of fresh foods available at relatively low prices.1 Several studies have found that
supermarkets are more common in predominately white and affluent neighborhoods.2,4,8
In comparison, studies demonstrate that low-income and minority neighborhoods have
greater access to convenience stores and fast-food restaurants.2 As accessibility has been
shown to correspond with dietary habits, these inequalities are detrimental from a public
health perspective. However, a limitation of focusing on select stores in this type of
research is that it does not truly capture the broad food environment.
Research has also provided insights into the perceptions of healthy food access among
community members living in low-income, urban areas. Interviews reveal a concern over
5
the expensive and limited variety of healthy options available in their communities.9 One
study also examined the limitations of supplying corner stores with fresh food from the
perspective of store owners.10
These limitations included lack of physical space and
equipment needed to store perishable healthy items, the perception of low demand for
healthier items, and difficulties negotiating small purchase volumes from suppliers.10
Although studies have explored consumer and retailer perspectives of food desert issues,
research investigating more comprehensive supply chain barriers and strategies for
improving fresh food access, such as from the producer and distributor perspective, is
needed to fully understand strategies in supplying fresh produce to underserved areas.10,25
Purpose
The general purpose of this study was to explore the issues of supplying fresh, affordable
produce to food deserts in Phoenix, Arizona, among representatives of the local produce
supply chain. Semi-structured interviews were conducted with select members of the
fresh produce supply chain to gain insight regarding:
1. The identification of barriers to supplying fresh, affordable produce to food
deserts.
2. The identification of current “success stories” or potential strategies for
supplying fresh, affordable produce to food deserts.
Delimitations
The study included supply chain representatives currently operating in the greater
Phoenix metropolitan area. Participants were at least 18 years of age and represented
various organization sizes.
6
Limitations
Due to the qualitative nature of the study and context of the greater Phoenix metropolitan
area, findings may not apply to other areas of the fresh produce supply chain that were
not explored in this project, as well as other members of the produce supply chain beyond
the scope of this study sample. Due to the recruitment methodology and relatively small
sample size, the sample may not be representative of the larger population and sampling
bias may have occurred. However, this technique is primarily used in exploratory
research and allowed researchers to connect with additional supply chain representatives
given the low response rate. Given the nature of interview research, the context of the
interview as well as the researcher’s presence may have biased participants’ responses.

7
CHAPTER 2
LITERATURE REVIEW
Dietary Patterns and Chronic Disease Risk
Seven out of ten deaths each year are attributed to chronic diseases in the U.S., and
seventy-five percent of health care costs are due to their treatment.26
Although chronic
diseases are the most prevalent and costly of all health issues in the U.S., they are also the
most preventable.26
The Centers for Disease Control and Prevention (CDC) identifies
poor nutrition as one of the foremost preventative risk factors for these illnesses along
with tobacco use, lack of physical activity, and excessive alcohol intake.26
Therefore,
eating a healthy diet is a vital strategy for preventing disease and improving nationwide
health outcomes.
Increased consumption of fruits and vegetables is one of the most common worldwide
government recommendations for optimizing dietary quality.27
High fruit and vegetable
intake significantly impacts overall health by decreasing one’s risk of multiple chronic
diseases and all-cause mortality.27,28
For example, it is estimated that consuming at least
five servings of fruits and vegetables a day could prevent twenty percent of all cases of
cancer, the second leading cause of death in the U.S.26,28
Fruit and vegetable
consumption also plays a role in blood pressure control and in the protection against
coronary heart disease, stroke, cataract formation, chronic obstructive pulmonary disease,
type 2 diabetes and diverticulosis.28,29
A recent study published in the Journal of
Epidemiology & Community Health found that each vegetable portion consumed per day

8
was associated with a sixteen percent reduction in overall mortality risk, while each
portion of fresh fruit consumed was associated with a four percent reduction.27
The protective effects of fruits and vegetables are likely attributed to multiple factors,
including their high density of essential vitamins and minerals, variety of antioxidants
and phytochemical compounds, and fiber content.28
The vitamins and minerals found in
fruits and vegetables are necessary for vital metabolic processes that optimize health.
Antioxidant nutrients such as vitamins C and E, selenium, and zinc help protect DNA and
cell membranes from oxidative stress, and phytochemical compounds are known for their
potential anticarcinogenic effects.28,30
Potassium may help control hypertension by
lowering elevated blood pressure, and some studies suggest that folic acid along with
vitamins B6 and B12 may decrease plasma homocysteine levels, decreasing the risk of
cardiovascular disease and stroke.28
Adequate daily fiber intake, typically found in fruits, vegetables, and other plant-based
foods, also reduces the risk of chronic diseases and provides many additional health
benefits.31
Researchers have found that soluble fiber decreases total cholesterol and low-
density lipoprotein (LDL) cholesterol values.32
High fiber diets have also been shown to
reduce blood pressure, improve glycemic control, and prevent obesity development
through enhanced satiety mechanisms.31
A recent review of epidemiological studies
examining dietary fiber intake and obesity prevention found that consumption of a high-
fiber diet decreased the risk of developing obesity by thirty percent, regardless of gender
and race/ethnicity.31

9
Despite substantial evidence supporting the health benefits of consuming fruits and
vegetables, almost all Americans still consume significantly less than the recommended
daily amounts.33
It is reported that low-income populations consume even smaller
amounts, putting them at higher risk for key nutrient deficiencies and the development of
chronic diseases.33
As such, increasing fruit and vegetable consumption is a national
health priority. Recommendations to increase daily intake can be found in Healthy
People 2020, the Dietary Guidelines for Americans 2020, and MyPlate.
Health Disparities
Differences in food environments and eating patterns across the socioeconomic spectrum
contribute to the significant issue of health disparities in the U.S. The term health
disparities is used to describe variations in health risk factors and outcomes among
different population groups as defined by social, demographic, environmental, and
geographic characteristics.34
These inequalities lead to the disproportionate suffering of
certain populations from chronic diseases and other health conditions.34
They also
account for massive yet preventable medical costs. According to a report by the Joint
Center for Political and Economic Studies, health inequalities cost the U.S. an estimated
$229.4 billion in direct medical care expenditures and over one trillion dollars in indirect
costs related to illness and premature death over a four year period (2003-2006).35
Health disparities between groups are often interrelated and include gender, age, race or
ethnicity, sexual orientation, disability, socioeconomic status, and geographic location.36
Other social determinants of health such as access to clean water and culturally

10
appropriate, nutritious food, safe housing, reliable public transportation, quality
education, and affordable health insurance all influence health and well-being, and are
recognized by the World Health Organization (WHO) as the primary cause of health
disparities.36
Investigating ways to overcome social inequalities is a major focus of
public health research and public policy, as these differences in health are an economic
burden, preventable, and fundamentally unjust.
The prevalence of health disparities in the U.S. is acknowledged in multiple reports.34,37
Rates of obesity and other chronic diseases are disproportionately high in urban minority
groups and among certain races/ethnicities.18,34,37
For example, higher rates of obesity
are seen in African Americans ages twenty years and older compared to Caucasians of
this age group.18
African American men and women of all ages also have the highest
mortality rates of cardiovascular disease.37
Similarly, a 2011 CDC report on health
disparities found that African American men and women who suffer from heart disease
or stroke are much more likely to die compared to Caucasian men and women.34
In a study by Mensah and colleagues examining cardiovascular health and disparities in
the U.S., ischemic heart disease, hypertension, and stroke were found to be inversely
related to educational level, poverty status, and income.38
This report also revealed that
low income populations report fewer healthy days on average and account for increased
rates of preventable hospitalizations.38
According to WHO, the risk of unhealthy
behaviors, morbidity, mortality, poor quality of care and access to healthcare increases as
socioeconomic status decreases.34
As a result of these pervasive disparities, one of the
11
four overarching goals of Healthy People 2020, a nationwide public health agenda,
specifically targets eliminating health disparities, achieving health equity, and improving
the health of all population groups in the U.S. Efforts to eliminate health disparities
include numerous state legislations across the country and federal health reform.
Food Insecurity and Health Outcomes
Economic issues may play a key role in determining risk factors for chronic diseases
related to health disparities, along with other behavioral and mental health issues. Food
insecurity is an economic and social condition characterized by limited or uncertain
access to nutritionally safe, adequate, and acceptable foods obtained in socially
acceptable ways.13
It occurs as a result of inadequate economic resources and affects
millions of households in the U.S.13
USDA data from 2013 revealed that 14.3% or 17.5
million households experienced food insecurity at some time in the year, and 5.6% or 6.8
million households experienced very low food security.39
Although the rates of food
insecurity have not significantly changed since 2012, overall rates have significantly
decreased from 14.9% in 2011 to 14.3% in 2013.39
Higher rates of food insecurity are
reported in households with children, those with a single parent, black and Hispanic
households, and those with incomes below 185% of the poverty threshold.39
Rates of
food insecurity are also higher in urban and rural areas compared to suburban areas.39
Food insecurity has been associated with an increased risk for and prevalence of chronic
diseases in adults.13,16
In one study using part of the National Health and Nutrition
Examination Survey (NHANES) dataset, food insecurity was found to be a risk factor for

12
diabetes, even after adjusting for BMI.40
This relationship is of significance as 25.8
million people in the U.S. have diabetes and its annual costs total $245 billion.41
Although research has not shown a consistent relationship between food insecurity and
obesity in men, there is strong evidence that food insecure women have a higher risk of
being overweight or obese.15
A study by Adams and colleagues examined the relationship between food insecurity and
weight among 8,169 women living in California.15
Data were derived from the 1998 and
1999 California Women’s Health Survey. Results from this study revealed obesity to be
prevalent in 31% of food insecure women compared to 16.2% of those who were food
secure.15
The risk also varied by race/ethnicity, as Asian, African-American, and
Hispanic women reporting food insecurity with hunger had 2.8 times the risk of obesity
compared to white women.15
Another study by Townsend and colleagues similarly found
an association between food insecurity and overweight status in women.42
This study
compared responses from the Continuing Survey of Food Intakes by Individuals (CSFII)
with BMI, and included a sample size of 4537 women and 5004 men. Although results
showed no significant association between food insecurity and overweight status of men,
food insecure women were 30% more likely to be overweight compared to food secure
women.42
These results also suggest an increased risk of obesity-related chronic diseases
among this population.
The effects of food insecurity on health span all ages of the life cycle.13
Research has
shown that children who live in food insecure households may be deficient in key
13
vitamins and minerals, exhibit behavior-related problems, and attain lower educational
achievement.13
In a study examining food insecurity and children’s cognitive,
psychosocial, and academic development using NHANES III data, food insecure children
were more likely to have lower math scores, repeat a grade in school, and have trouble
behaving well with other students.43
In addition to negatively affecting children’s
academic and social behavior, food insecurity has also been shown to impact opinions
towards healthy eating and dietary patterns.44
One study examining eating behaviors and
perceptions among food insecure adolescents reported significant differences in their
eating patterns compared to youth who were food secure.44
These behaviors included
eating fewer breakfasts and family meals per week, eating more meals from fast-food
restaurants, and consuming a higher intake of dietary fat.44
This study also found that
adolescents from food insecure households perceived healthy food as being inconvenient
and unappetizing, and were more likely to have BMIs above the 95th
percentile as
compared to food secure youth, signifying their weight category as obese.44
Food Environments and Health Outcomes
The relationship between health outcomes and the role of food access and availability is
undoubtedly complex. However, a growing body of research indicates that the
neighborhood food environment may impact individual and community-level health by
contributing to food purchasing and consumption decisions.4,45
The neighborhood food
environment is most often measured by tracking the distance from residential areas to
retail food stores and restaurants through Geographic Information Systems (GIS)
technology and comparing this data to socioeconomic and demographic information.46
A
14
noted limitation of this methodology is that it only captures home-to-store or -restaurant
travel, without considering that individuals may access food from other locations such as
work.1 Some studies also include an audit of the specific foods sold in each retail store,
such as the validated Nutrition Environment Measurement Survey (NEMS).47
These
audits may provide additional information on the quality, price, and dedicated shelf space
of certain foods, allowing for a more comprehensive perspective of the food environment
in examination.9,47
Still others have gathered qualitative data and assessed participants’
perceptions towards healthy food access and availability.48
Differences in the neighborhood food environment include potential access and
availability to food destinations that carry fresh and affordable food items as well as
comparative access to unhealthy foods.8 However, a major challenge in this area of study
is the lack of consistency among approaches used to characterize the food environment,
as well as the limited amount of published longitudinal data. For example, the very
definition of neighborhood food environment in regards to geographic boundaries varies
among studies.24,49
Furthermore, since the majority of articles published on the topic are
observational, researchers may establish associations but not causal relationships.
Despite these differences in methodology, there is consistent evidence that neighborhood
variations in food access may subsequently represent one of many environmental factors
that affect dietary intake and risk for chronic diseases.48

15
Disparities in Healthy Food Access
Evidence demonstrates that socioeconomic status (SES) negatively affects individuals’
access to healthful foods.8,23
In a food deserts workshop summary report from the
Institute of Medicine, access to healthful foods is described as food that is both physically
available and economically affordable.50
Availability is typically measured by the type
and density of food stores within a geographic area. This affects the distance residents
must travel from home to store, and the time costs associated with each distance. Many
studies that have measured the local food environment define this geographic region as a
census tract, while others delineate it by the more specific census block.4,49
Census
blocks are the smallest geographic unit designated by the Census Bureau.51
They
typically contain between 600 and 3,000 people.51
Census tracts average 4,000 residents
and are designed to represent a relatively similar population in regards to economic
status, living conditions, and demographics.51
Despite these variations in unit of measurement, the majority of studies examining this
issue indicate that low-income neighborhoods have fewer supermarkets compared to
more affluent neighborhoods. For example, one study found the presence of three times
as many supermarkets in wealthier neighborhoods compared to the lowest wealth
neighborhoods after examining census tracts in four different states.24
Other studies
similarly indicate that residents of lower SES communities must travel a farther distance
to shop at chain supermarkets, which tend to offer a more extensive variety of healthy
food options such as fresh fruits and vegetables, whole grains, and low-fat dairy products
at a cheaper price than small grocery or local convenience stores.8,47
Results from a study
16
by Chung and Meyers suggest that shopping at non-chain grocery stores is significantly
more expensive than shopping at chain grocery stores, and these chain stores are less
accessible to the poor.19
Low-income neighborhoods also have greater access to fast-
food restaurants and stores that primarily carry energy-dense and low nutrient
foods.2,47,52,53
A study that compared 28,050 zip codes to data from the 2000 Census
found that low- and middle- income neighborhoods have 1.25-1.3 times the amount of
fast-food restaurants compared to high-income neighborhoods.53
Along with SES status, the racial/ethnic composition of a community has been shown to
impact healthy food access. One study revealed that Hispanic populations have one-third
the accessibility to chain supermarkets as non-Hispanic populations.53
Studies have also
found that predominately African-American neighborhoods have fewer supermarkets
than predominately white neighborhoods, and residents must travel farther distances to
shop at these stores.24,53
In one study, four times as many supermarkets were found in
primarily white neighborhoods compared to primarily African-American
neighborhoods.24
These results reveal the evident racial disparities that exist in accessing
the variety of healthy food options generally sold at larger food stores.
Food Deserts: History, Prevalence, and Implications
Geographic areas where residents experience physical and economic barriers to healthy
and affordable food access are known as “food deserts.” This phrase emerged from the
United Kingdom in the early 1990s.54
It described the poor access residents of a deprived
urban housing system faced to an affordable food supply supportive of a healthy diet.54

17
At this time, food stores were moving from urban city centers to the edges of town,
leading to larger and fewer stores concentrated outside of the city. This resulted in urban
residents having to travel farther distances to shop for fresh and affordable food, creating
a significant barrier for individuals without access to reliable public or private
transportation. Since then, the term has been used to describe both urban and rural areas.
Researchers have interpreted the phrase food desert in various ways, leading to some
debate about the comparability of studies and the extent of their existence.23
Although
the phrase implies an absence of retail food stores, research more commonly evaluates
variations in neighborhood food environments by socioeconomic status and other
demographic data.2,49,55
In fact, a systematic review of food deserts literature by Beaulac
and colleagues provides robust evidence that the greatest disparities in food access occur
by neighborhood income level and race.55
It also supports the existence of food deserts in
the U.S., while evidence of their existence in other countries was found to be limited.55
The term “food swamp” has also surfaced in the literature, as several food desert
communities have been found to be inundated with energy-dense, low-nutrient foods in
comparison to more healthful options such as fresh fruits and vegetables.56–58
Some
researchers argue that these neighborhoods would be better described as food swamps
since although healthier options may exist, they tend to be more expensive, of limited
variety, and are likely lost amid the sea of energy-dense, “junk” foods found at
widespread convenience stores and fast food restaurants.56,58
However, the term food
desert is more commonly used in academic literature, policy reports, and the public, and
18
is thus referred to throughout this paper.54
Beyond semantics, both phrases speak to the
issue of food inequality disproportionately faced by residents of low-income and minority
neighborhoods.
The development of food deserts in the U.S. is not a naturally occurring incident, but is
rather the result of complex social, economic, and political factors.59
Historically, these
factors gave rise to discriminatory housing policies and practices in the mid-20th
century
and supermarket redlining, each of which is speculated to play an important role in
determining community level access to healthy and affordable food.60
The U.S. federal
government has a history of discriminatory housing policies that can be traced back to the
1930s.61,62
These policies created home ownership opportunities for white communities
while making it difficult for minorities to acquire loans and purchase homes.60,62,63
In
fact, nonwhite families benefited from less than two percent of the $210 billion invested
in government-subsidized housing from 1934 to 1962.61
In regards to location, Federal
Housing Administration (FHA) insurance was often sequestered to new housing
developments on the outskirts of urban areas.63
This led many middle- and higher-
income households to move from urban centers to suburban communities, decreasing the
median income level, property values, and bank investments in inner-cities.60,62
During
this time, almost half of the supermarkets in the three largest U.S. cities closed.23
Many
supermarket retailers shifted to these more affluent neighborhoods due to larger and
cheaper tracts of land, flexible zoning laws, better parking availability for customers, and
an industry perception of less crime.23,59,60
This trend of supermarket relocation from

19
urban to suburban areas is known as ‘supermarket redlining,’ a phenomenon that has
impacted the food choices available to residents of urban neighborhoods.49,60
The USDA, Treasury, and Department of Health and Human Services (HHS) define food
deserts as both low-income and low-access communities.1 Low-income communities are
designated as census tracts with a poverty rate of over 20% or a median family income at
or below 80% of the statewide or metro-area median family income.1 Low-access
communities are identified as urban census tracts where at least 500 people or more than
one-third of the population live over one mile from the nearest supermarket or large
grocery store.1 This distance is extended to 10 miles in rural areas to account for higher
vehicle ownership and lower population density.1 According to the USDA, this
definition was established to create consistency when comparing food deserts nationwide,
as previous studies have utilized diverse methods of measurement and identification.1
Using this definition, a 2009 report from USDA’s Economic Research Service estimated
that 23.5 million people live in food deserts, representing over 8% of the U.S.
population.1 More than half of this population is estimated to be low-income. Although
most Americans travel by car to do their grocery shopping, individuals living in food
deserts without a vehicle likely face even greater difficulties in accessing healthy food, a
situation that is more common among low-income households.1,64
In addition to geographical assessments of local food environments, researchers have also
investigated the extent to which the environment impacts individual and community level
purchasing decisions and eating patterns. Although results have been inconsistent in the

20
literature, a systematic review including 38 studies on the subject found moderate
evidence that food environments influence dietary intake and health outcomes.48
Another
comprehensive review on the topic reached a similar conclusion. This review by Larson
and colleagues included a total of 54 studies conducted in the U.S.8 Researchers found
evidence that better access to supermarkets and decreased access to convenience stores
was associated with healthier eating patterns and lower rates of obesity.8 Several studies
have also discovered that residents with better access to supermarkets report increased
produce intake.65,66
In one study by Morland and colleagues utilizing Atherosclerosis
Risk In Communities (ARIC) data, the presence of nearby supermarkets was associated
with an increased daily intake of fruit and vegetable servings among participants.65
Specifically, each additional supermarket located in the examined census tract correlated
with a 32% increase in fruit and vegetable consumption among African Americans, while
census tracts with at least one or more supermarkets were associated with an 11%
produce increase among white Americans.65
A study by Rose and Richards similarly
found a positive relationship between easy supermarket access and increased household
fruit consumption among a sample of 963 Supplemental Nutrition Assistance Program
(SNAP) participants.66
This association was also seen for household vegetable
consumption but results were not significant.
Improved access to supermarkets has been related with overall improved diet quality
among pregnant women as well as weight status and BMI across the life span.4,67,68
For
example, a study by Powell and colleagues found that greater access to chain
supermarkets was significantly associated with a lower BMI and overweight status in
21
adolescents, while increased availability of convenience stores was significantly
associated with a higher BMI and overweight prevalence.68
These results mirrored a trial
specifically examining supermarket availability and overweight and obesity in adults.4
However, a study out of Boston Children’s Hospital and Harvard University targeting a
population of preschool-age children reached a different conclusion.69
Results revealed
that among 438 overweight and obese children, those who lived less than one mile from a
large supermarket had an average BMI of 0.77 kg/m² higher than those children living
more than two miles from a supermarket.69
Although the previously mentioned review
article relates supermarket access with lower rates of obesity, individual studies across
the lifespan prove to be inconclusive.8
Cost Comparisons
Although dietary recommendations from the government encourage Americans to
consume a balanced diet of fresh fruits and vegetables, low-fat dairy products, whole
grains, and lean meats, these low-energy density and nutrient-rich food choices are often
out of reach for households living in poverty.6 This is unfortunate, as these foods are
indicative of high-quality diets that directly affect individual and population-level health.6
Households with limited food budgets are often at a disadvantage for eating healthy.
Perishable items like the previously mentioned recommendations have a short shelf life
and tend to be much more expensive than energy dense foods. Conversely, energy dense
foods such as refined grains and foods with added sugars and fats have longer shelf lives
and offer more calories at a cheaper price.5 In a focus group study conducted by Wilde
and colleagues, food assistance participants expressed concern about the ability to

22
purchase enough food to avoid feeling hungry on a minimal budget, which may often
include non-perishable and potentially less healthy options. According to Drewnowski
and Spector, poverty and insecurity are associated with low fruit and vegetable
consumption, low total food expenditures, and lower quality diets.5
One explanation as to why inexpensive foods are generally energy dense is due to
advancements in agriculture and food technology which have decreased their energy
cost.5 One study found that the energy cost of fresh produce is about 10 times higher
than that of sugar and vegetable oil production.5 This study also reported that the average
energy cost of sugar rich soft drinks was 30 cents per megajoule (MJ), compared to 143
cents/MJ for orange juice concentrate.5 In addition to the decreased cost of producing
less healthful foods, recent studies report that energy dense foods have been less subject
to inflation within the past two decades, and may have actually decreased in price.70
After adjusting for inflation, the price of soft drinks decreased by 32% between the years
of 1990 and 2007, and fast-food prices decreased by 12%.70
Conversely, the costs of
lower-density foods such as fruits and vegetables have disproportionately increased in
price.70
In multiple studies investigating perceptions of food access among low-income residents,
cost has been identified as a significant barrier to purchasing healthy foods. In one study
by Hendrickson and colleagues, low-income residents of urban and rural communities did
not believe healthy foods were affordable near where they lived, and identified cost, as
well as limited variety and poor quality as primary barriers to shopping in their
23
community.17
This perception was supported by further data gathered from store
inventory audits in these neighborhoods, as numerous food items were found to be more
expensive than the average Thrify Food Plan’s (TFP) market basket price (MBP).17
The
TFP is the cheapest food plan designed by the USDA. It specifies types of foods and
amounts needed for a nutritionally adequate diet. It also determines SNAP benefits. This
finding suggests that residents of high poverty areas may face higher food costs while
shopping in their communities, serving as a major barrier to eating healthy close to home.
Using the TFP guidelines for one week’s grocery costs, another study found that the same
foods are significantly more expensive at convenience stores ($162.47), compared to
supermarkets ($132.64) and grocery stores ($133.39).49
Although these prices are
representative of only one city, they suggest that it is more expensive for residents to
shop for healthy foods at convenience stores compared to large grocery stores and
supermarkets, a statement that has been repeated in multiple studies.19,49
Variety and Quality Comparisons
In addition to cost, the limited variety and poor quality of healthy food options available
for purchase are often identified as barriers to shopping in low-income communities.
These differences were apparent in a study conducted in Tennessee that included 20
interviews with local community members as well as in-store retail food audits of three
towns.9 Over half of the interviewees felt dissatisfaction towards the food stores in their
community, with one participant mentioning that her diet would severely suffer if she did
not have private transportation to travel elsewhere to shop.9 Of the food stores in these
communities, 70% did not sell at least one fresh fruit, and over 80% did not sell at least
24
one fresh vegetable.9 Although a limited variety of fresh produce was available in
several stores, interviewees commented on the poor quality of these items such as the
presence of mold on outdated products. More than one-third of the participants said they
would not shop for fruits and vegetables in their community.9 In comparison to the
limited variety of fresh produce available, alcohol and tobacco were abundant as the most
common items available for purchase in all three communities.9
A focus group and survey study on food access issues also described the variety and
quality concerns of foods found in low-income urban and rural communities in
Minnesota.17
While large supermarkets located outside of the neighborhood boundaries
carried several varieties of fresh fruits and vegetables, stores that carried fresh produce in
urban areas were minimally stocked at one or two pieces on the shelf, and were reported
to be of poor quality.17
In fact, very few stores in the urban areas carried fruits or
vegetables that qualified as “fresh/edible.”17
The quality of produce available plays an
important role in consumers’ purchasing decisions. Participants in urban areas indicated
that they would not eat more fruits and vegetables even if given the opportunity due to
quality issues.17
These responses were not reflected among residents of rural areas, who
identified nearly all of the stores in their communities as carrying fruits and vegetables
that qualified as “fresh/edible.”17
This rating was attributed to stores having the capacity
to implement proper refrigeration techniques which allowed produce to stay fresh for
longer periods of time.17
This study suggests that fresh food availability issues could be
improved through supply side methods such as increasing the variety and quality of
healthy food options through procurement and appropriate storage systems.
25
Fresh Produce Supply Chain and Healthy Food Access
A potentially important method for improving healthy food access in low-income or food
desert areas is through the supply chain. This avenue has been suggested by researchers
and policy makers as a way to combat the lack of affordable and quality nutritious foods
in underserved areas.1,49,71
Working with existing small stores to improve their fresh food
selection and opening new stores to carry these items are two supply side approaches that
may address food desert issues. Farmers’ markets and alternative retail food outlets such
as mobile markets or produce stands have also been recognized by community
stakeholders in food deserts as potential venues to improve access to high-quality fruits
and vegetables.22,25
The fruit and vegetable supply chain comprises multiple entities including producers who
grow and harvest the food, distributors who ship the food to the location where it will be
sold, and food retailers who sell the products directly to consumers. However, each
supply chain entity varies in size and organization, and a single entity may carry multiple
roles. For example, small scale family farms may do their own distribution and retail,
while large industrial farms likely work with high volume shippers. Food retail outlets
include convenience stores, supermarkets, and other grocery stores, as well as alternative
food systems such as farmers’ markets and community supported agriculture programs.71
Although supermarkets typically provide increased fresh food access through
affordability, variety, and often higher quality products, opening new stores in food
desert areas is not necessarily a financially viable solution for these businesses. Deciding

26
specific sites of operation requires factoring in many variables such as projected sales,
labor expenses, and occupancy costs.50
According to an Institute of Medicine report on
food deserts, site-specific decisions may prevent large supermarkets from operating in
urban and rural settings.50
Within the past 20 years, large chain supermarkets have been
more likely to operate in middle and upper class suburban areas, where these businesses
have higher profit margins and sufficient parking space for customers.50
Chain
supermarkets are also more likely to open near existing chain stores for similar reasons of
profit. These trends suggest that large supermarkets may not economically thrive in food
desert areas without financial support. Although the opening of smaller grocery stores
may be a more feasible solution for increasing fresh food access in urban areas, store
owners have identified deterrents to operating in these neighborhoods, such as higher
rates of perceived crime and theft which may compromise their business.17,18,25
Although disparities in supermarket access are prevalent in the literature, researchers
have emphasized the potential importance of various retail infrastructure models in
improving access to healthy foods. For example, a study by Raja and colleagues
examined racial disparities in local food environments in Erie County, New York.49
Researchers found that although supermarkets were absent in neighborhoods of color
compared to predominately white neighborhoods, neighborhoods of color had an
extensive system of small grocery and convenience stores.49
Although these stores
generally carry less healthful food options, this study suggests that with vested
community involvement and support from local governments, these neighborhood stores
have the potential to offer healthy, affordable, and culturally appropriate foods.49
These

27
findings have important implications for current and future strategies intended to address
issues of neighborhood food access. They suggest that efforts may be better focused on
working with existing small stores and alternative outlets to improve their fresh food
selection as opposed to concentrating efforts on bringing in outside chain supermarkets.
They also emphasize the importance of community engagement for long-term
sustainability of fresh food initiatives, as community members have identified mistrust of
corner store owners and government agencies as barriers to selling healthful food items in
low-income areas.25
Suggested solutions for mitigation include open dialogue at
community meetings or forums and the development of partnerships between store
owners and local organizations.25
Challenges of supplying fresh fruits and vegetables to small stores located in food deserts
have been identified in a limited amount of studies from the retailer perspective.10,25
However, issues involving other supply chain members have not been explored in the
literature. A better understanding of how these entities work together may provide
valuable insight as to how best supply communities with fresh food.11
In an interview
study by Gittelsohn and colleagues, barriers specific to stocking healthy food items were
identified among small corner store owners in Baltimore City.10
These barriers included
the physical store layout, having adequate space and the capacity for refrigeration, the
shelf-life and price of food items, low perceived demand for healthier products, the
inability to return unsold items to suppliers, and difficulty negotiating with suppliers due
to small order amounts.10
Corner store owners also emphasized the importance of

28
maintaining a business profit, and expressed that they would be more inclined to carry
healthier foods if the demand for these products increased.10
Researchers have provided potential strategies for alleviating some of these described
challenges. These strategies include enlisting technical support for stores in underserved
areas from local governments and partnering with local food producers to increase the
fresh food supply.49
Technical support might consist of incentives for local store owners
to carry healthier food items, loans or grants for refrigeration equipment to freshly store
these foods, displays for healthy items, nutrition education and cooking demonstrations,
or improved public safety measures to address concerns of crime or theft mentioned in
previous research.25,49
These strategies have been implemented on a larger scale through
the Pennsylvania Fresh Food Financing Initiative (FFFI).59
The FFFI was developed as a
public-private partnership with the purpose of attracting grocery stores to underserved
areas and increasing healthy food access. This financing program attempted to address
some of the supply chain obstacles retailers face when operating in low-income areas.
Food desert research has thus far focused primarily on assessments of individuals,
communities, and geographical areas. However, supply chain strategies are gaining
attention for their potential significance in creating healthier and more equitable food
environments.11
Although research has investigated the challenges of supplying fresh
food to low-income areas among small store operators, these challenges have not been
fully described among other integral members of the fruit and vegetable supply chain.
This type of supply chain analysis has been recognized as a valuable technique for
29
identifying critical needs and planning effective and innovative interventions for creating
healthier communities.11
In addressing this research gap, this study will investigate the
barriers and potential solutions to supplying food deserts with fresh, affordable fruits and
vegetables from various perspectives of the Phoenix produce supply chain.
30
CHAPTER 3
METHODOLOGY
Participants
Researchers partnered with experts and representatives of the Arizona food supply chain,
who provided the team with contacts of potential interviewees involved in food retail,
distribution, and farming in Phoenix, Arizona. With their permission, an introductory
letter was sent to potential interview participants via email to gauge interest in
participation. The letter expressed the research team’s interest in conducting a short
interview with potential participants to gain their perspectives on healthy food access
issues in food deserts. The potential participants were told they would receive a $50
incentive as compensation for their time, and were asked to contact the research team
with any questions or concerns, or to express interest in participation. Potential
participants were given a week to respond, after which a reminder email was sent. All
those who responded were enrolled in the study, and an interview date and time was
scheduled with each participant. Due to low response rates, researchers also utilized
snowball sampling to locate additional supply chain representatives. Following each
interview, participants were asked if they could provide information that would connect
the research team with other members of the same population, a method primarily used in
exploratory research.
The sample consisted of six producers and distributors currently operating in Phoenix,
Arizona. Researchers were unable to recruit participants who primarily represented retail
food outlets. However, two of the six participants described their business as a direct
31
marketing farm operation in which they manage the farming, distribution, and retail
aspects of their business. One representative from a local chain grocery store declined
participation, expressing that the information sought from the interview was sensitive and
needed to be kept confidential due to the competitive nature of their business, despite
assurance that the participant’s name and business name would not be included in the
results. Other potential participants from the retail sector did not return emails or phone
calls. Despite this setback, the research team felt comfortable continuing with the
established sample of producers and distributors, especially as the potential role of these
supply chain entities in healthy food access have not been explored in the literature. This
study was approved by the Arizona State University Institutional Review Board.
Interview Design
Researchers focused on recruitment of participants that represented a variety of
organization sizes within the local produce supply chain. For example, small, midsize,
and large-scale family farms were represented in the sample, and produce distribution
ranged from local to international. The six interviews were conducted in English and
were primarily scheduled to take place at the participant’s worksite to facilitate higher
recruitment rates. However, one interview was conducted at Arizona State University
and another interview was held at an outdoor community space per the requests of the
participants.
A brief demographics survey and semi-structured questionnaire were developed for each
interview group by the research team. The brief demographics survey was created as a

32
tool to quickly gather data used to classify participants within groups. The semi-
structured questionnaire was used as the interview guide. As few studies exist regarding
perceived supply chain issues in supplying healthy foods in food deserts, a novel
questionnaire was developed. The questionnaire was created with input from experts in
the areas of agribusiness and food systems, and was pilot-tested for clarity among
graduate students studying qualitative methods in a research-intensive program.
Following this review, supply chain experts at two universities examined the
questionnaire for content validity. The interview guide consisted of a series of questions
regarding business operations, perceived distribution challenges, and opinions regarding
potential barriers and solutions to supplying produce to underserved areas in Phoenix.
The interview moderator was trained prior to conducting fieldwork. Upon arrival to the
interview, participants read and signed an informed consent letter. This letter assured
participants that their participation would be voluntary, and that they could discontinue
the interview at any point in time with no penalty. It also informed participants that the
interview would be audio-recorded with their permission, and that their responses could
be used in future publications. However, their name and their business’s name would not
be identified to maintain confidentiality. The same researcher was responsible for
moderating and audio-recording all six interviews. Although interviews were guided by
the semi-structured questionnaire, questions were adapted to follow the flow of the
conversation. Participants were encouraged to share their honest thoughts and opinions
in an attempt to evoke a greater understanding of the topics. Immediately following the
33
interview, the researcher summarized major themes discussed as part of the note-taking
process. Interviews averaged fifty minutes in length.
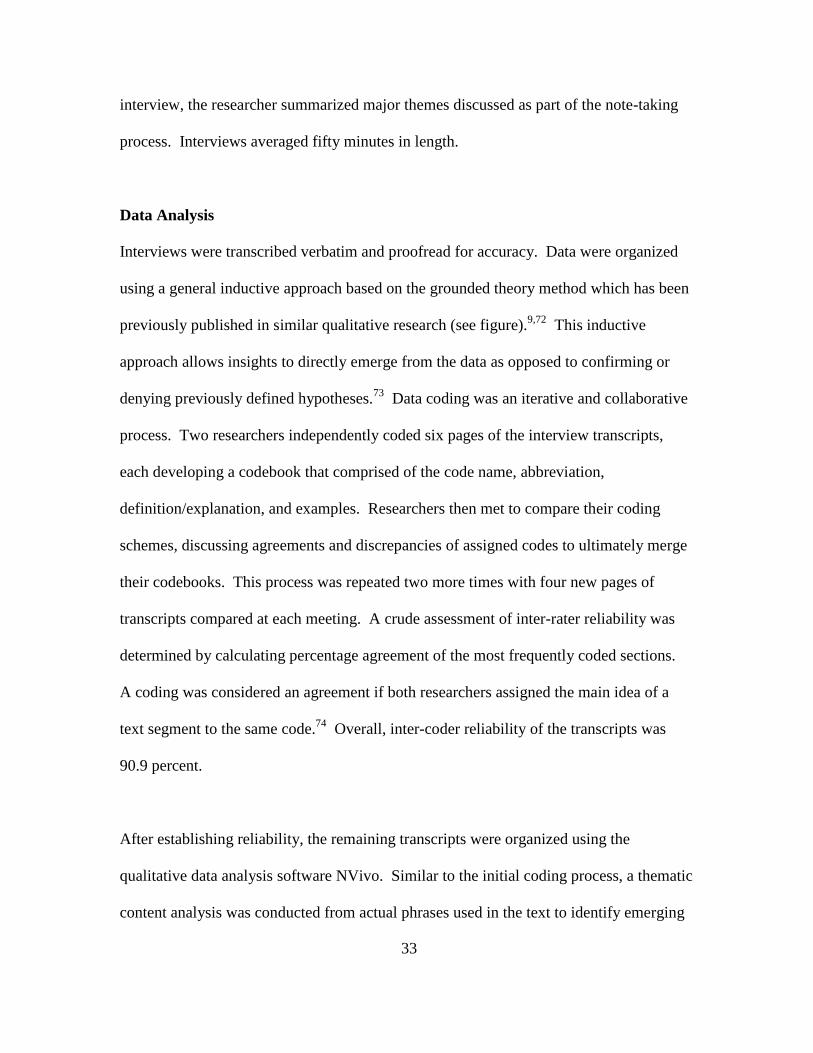
Data Analysis
Interviews were transcribed verbatim and proofread for accuracy. Data were organized
using a general inductive approach based on the grounded theory method which has been
previously published in similar qualitative research (see figure).9,72
This inductive
approach allows insights to directly emerge from the data as opposed to confirming or
denying previously defined hypotheses.73
Data coding was an iterative and collaborative
process. Two researchers independently coded six pages of the interview transcripts,
each developing a codebook that comprised of the code name, abbreviation,
definition/explanation, and examples. Researchers then met to compare their coding
schemes, discussing agreements and discrepancies of assigned codes to ultimately merge
their codebooks. This process was repeated two more times with four new pages of
transcripts compared at each meeting. A crude assessment of inter-rater reliability was
determined by calculating percentage agreement of the most frequently coded sections.
A coding was considered an agreement if both researchers assigned the main idea of a
text segment to the same code.74
Overall, inter-coder reliability of the transcripts was
90.9 percent.
After establishing reliability, the remaining transcripts were organized using the
qualitative data analysis software NVivo. Similar to the initial coding process, a thematic
content analysis was conducted from actual phrases used in the text to identify emerging
34
ideas, patterns, and themes from the data set.73
Subtopics were identified for certain
categories, as well as appropriate quotes that convey fundamental themes.72
The process
resulted in categories that represent the most important themes from the data.
Figure. Description of the General Inductive Approach.

35
CHAPTER 4
RESULTS
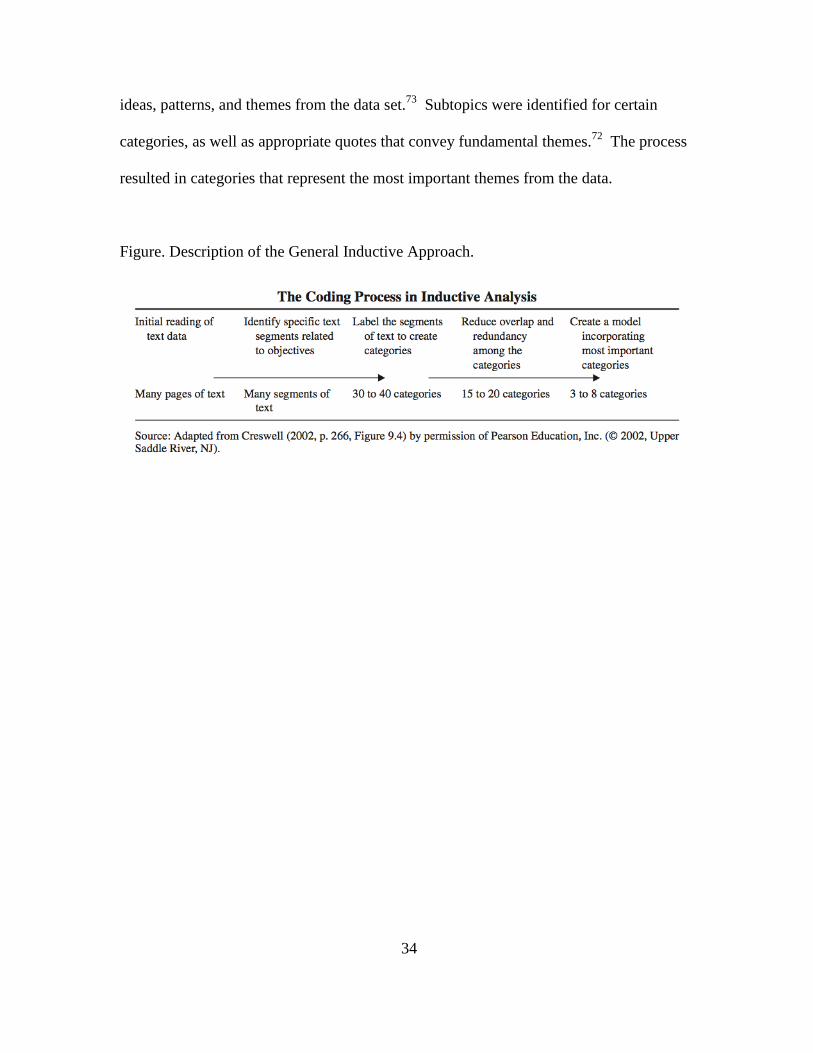
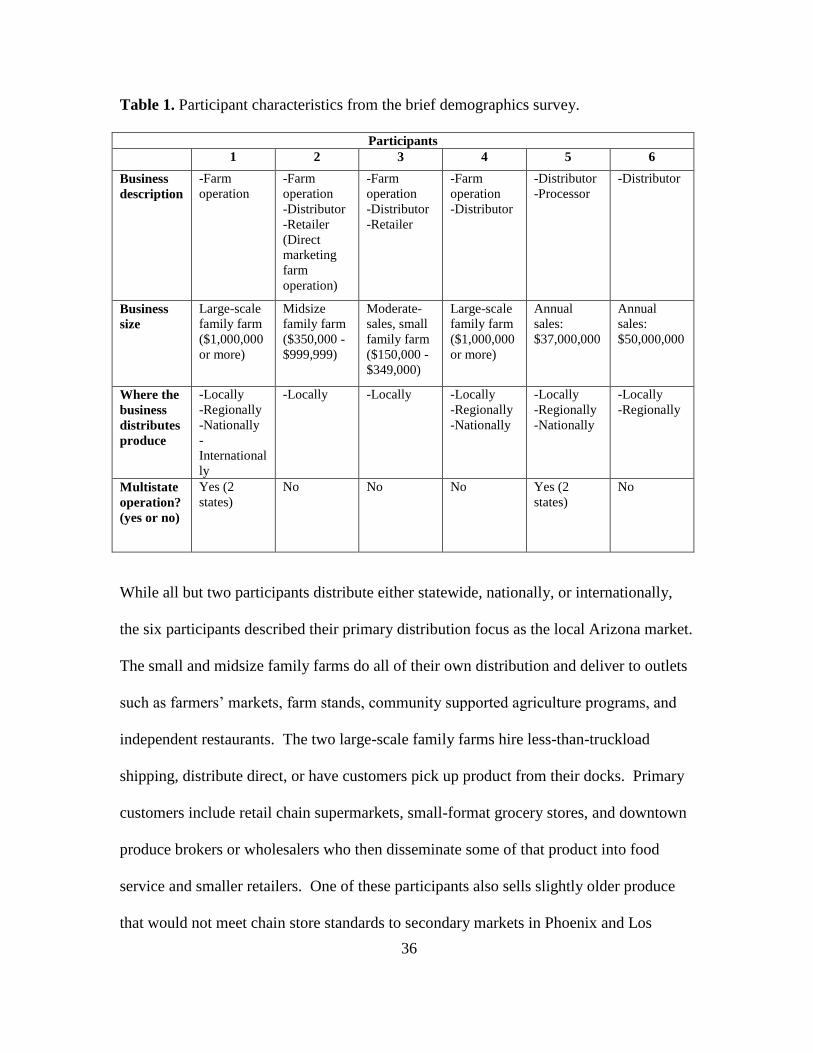
Analysis of the brief demographics survey revealed interview participant characteristics
(Table 1). While two participants described their business as only one focus within the
produce supply chain (such as farm operation, distributor, or retailer), the other four
participants selected multiple descriptors. Results from this sample indicate there is not
necessarily a clear distinction between supply chain entities. Participants included small,
midsize, and large-scale family farms with distribution ranging from local to
international. Two of the six participants operate in more than one state, while the other
four operate solely in Arizona. Participants’ current customers and distribution
mechanisms are included below (Table 1).
Interview participants identified potential barriers and strategies related to supplying
affordable produce to underserved areas in the Phoenix Valley. There was overlap of
major themes and subthemes within the sample. However, the number of references
coded for each theme varied by participant. The findings are organized into three
sections comprising barriers, strategies, and additional insights related to the research
aim. Illustrative quotes are included for each theme. Results are combined for all six
participants, although each quote is designated by supply chain entity.
36
Table 1. Participant characteristics from the brief demographics survey.
Participants
1 2 3 4 5 6
Business
description
-Farm
operation
-Farm
operation
-Distributor
-Retailer
(Direct
marketing
farm
operation)
-Farm
operation
-Distributor
-Retailer
-Farm
operation
-Distributor
-Distributor
-Processor
-Distributor
Business
size
Large-scale
family farm
($1,000,000
or more)
Midsize
family farm
($350,000 -
$999,999)
Moderate-
sales, small
family farm
($150,000 -
$349,000)
Large-scale
family farm
($1,000,000
or more)
Annual
sales:
$37,000,000
Annual
sales:
$50,000,000
Where the
business
distributes
produce
-Locally
-Regionally
-Nationally
-
International
ly
-Locally -Locally -Locally
-Regionally
-Nationally
-Locally
-Regionally
-Nationally
-Locally
-Regionally
Multistate
operation?
(yes or no)
Yes (2
states)
No No No Yes (2
states)
No
While all but two participants distribute either statewide, nationally, or internationally,
the six participants described their primary distribution focus as the local Arizona market.
The small and midsize family farms do all of their own distribution and deliver to outlets
such as farmers’ markets, farm stands, community supported agriculture programs, and
independent restaurants. The two large-scale family farms hire less-than-truckload
shipping, distribute direct, or have customers pick up product from their docks. Primary
customers include retail chain supermarkets, small-format grocery stores, and downtown
produce brokers or wholesalers who then disseminate some of that product into food
service and smaller retailers. One of these participants also sells slightly older produce
that would not meet chain store standards to secondary markets in Phoenix and Los
37
Angeles. The distributor/processor noted delivering product to grocery stores, warehouse
clubs, and other major distributors. These distributors then issue that produce to
customers such as restaurants, hospitals, and hotels. The customer base of the final
distributor included all of Arizona schools, the mess halls for U.S. troops and the Arizona
guard, restaurants, mom and pop stores, and Hispanic markets.
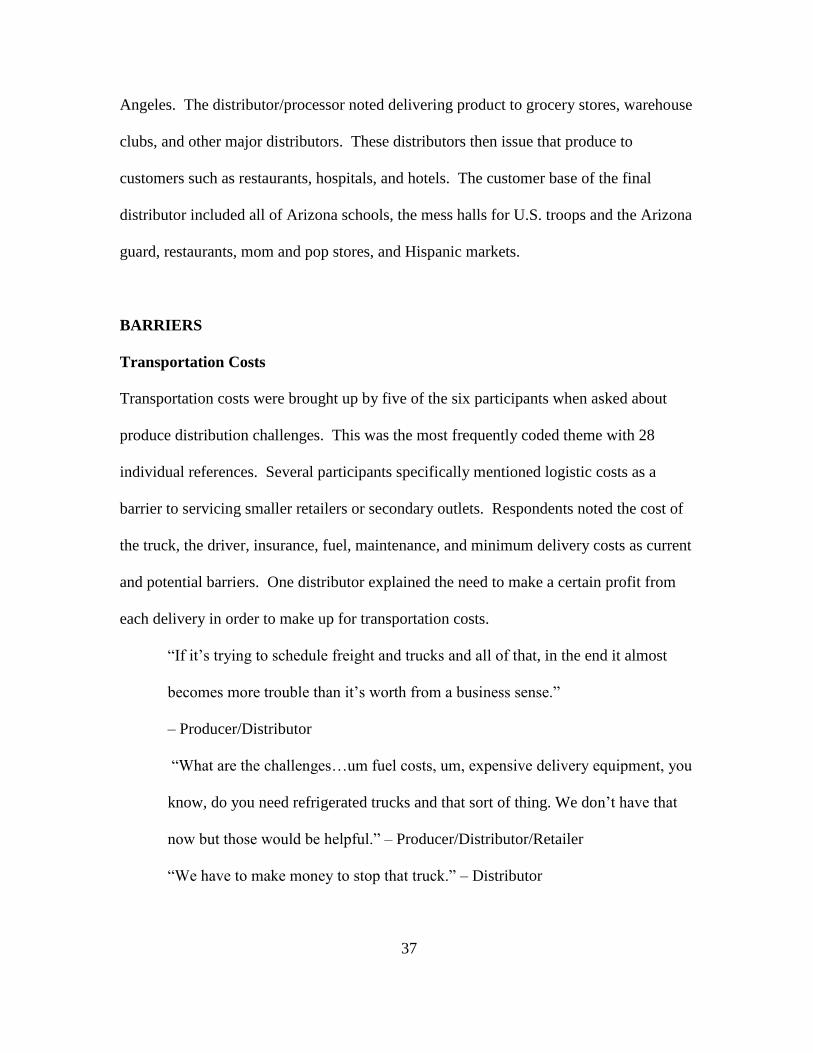
BARRIERS
Transportation Costs
Transportation costs were brought up by five of the six participants when asked about
produce distribution challenges. This was the most frequently coded theme with 28
individual references. Several participants specifically mentioned logistic costs as a
barrier to servicing smaller retailers or secondary outlets. Respondents noted the cost of
the truck, the driver, insurance, fuel, maintenance, and minimum delivery costs as current
and potential barriers. One distributor explained the need to make a certain profit from
each delivery in order to make up for transportation costs.
“If it’s trying to schedule freight and trucks and all of that, in the end it almost
becomes more trouble than it’s worth from a business sense.”
– Producer/Distributor
“What are the challenges…um fuel costs, um, expensive delivery equipment, you
know, do you need refrigerated trucks and that sort of thing. We don’t have that
now but those would be helpful.” – Producer/Distributor/Retailer
“We have to make money to stop that truck.” – Distributor
38
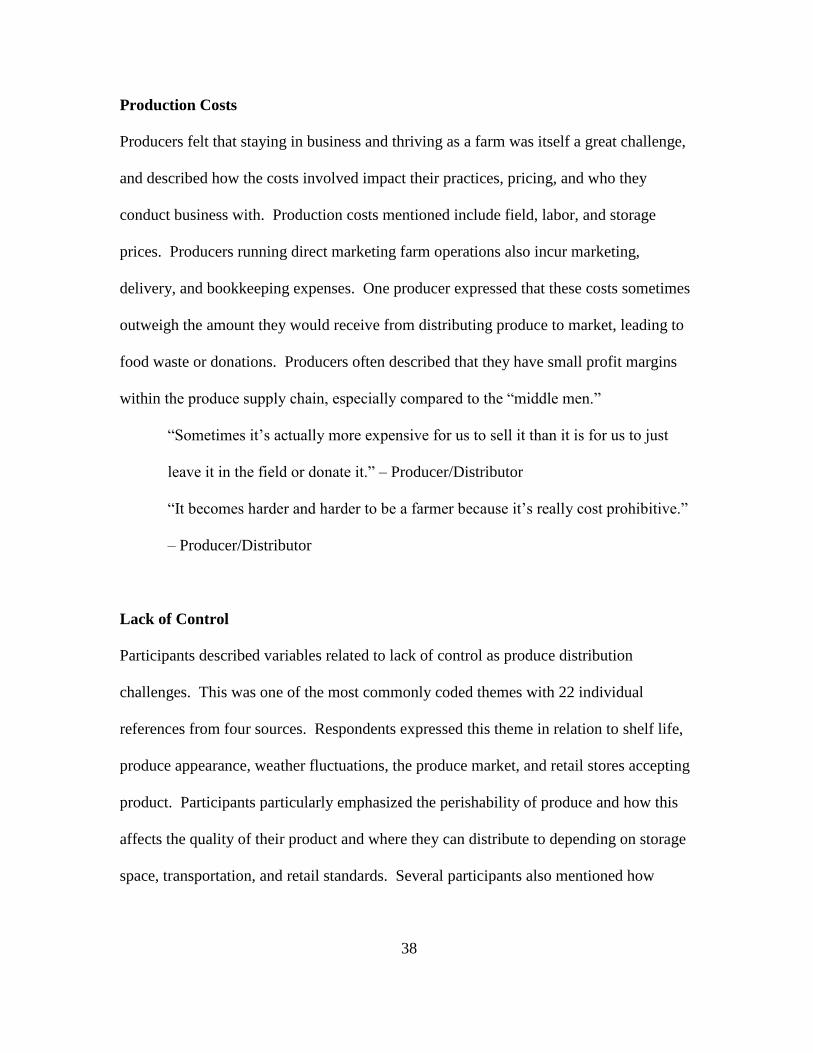
Production Costs
Producers felt that staying in business and thriving as a farm was itself a great challenge,
and described how the costs involved impact their practices, pricing, and who they
conduct business with. Production costs mentioned include field, labor, and storage
prices. Producers running direct marketing farm operations also incur marketing,
delivery, and bookkeeping expenses. One producer expressed that these costs sometimes
outweigh the amount they would receive from distributing produce to market, leading to
food waste or donations. Producers often described that they have small profit margins
within the produce supply chain, especially compared to the “middle men.”
“Sometimes it’s actually more expensive for us to sell it than it is for us to just
leave it in the field or donate it.” – Producer/Distributor
“It becomes harder and harder to be a farmer because it’s really cost prohibitive.”
– Producer/Distributor
Lack of Control
Participants described variables related to lack of control as produce distribution
challenges. This was one of the most commonly coded themes with 22 individual
references from four sources. Respondents expressed this theme in relation to shelf life,
produce appearance, weather fluctuations, the produce market, and retail stores accepting
product. Participants particularly emphasized the perishability of produce and how this
affects the quality of their product and where they can distribute to depending on storage
space, transportation, and retail standards. Several participants also mentioned how
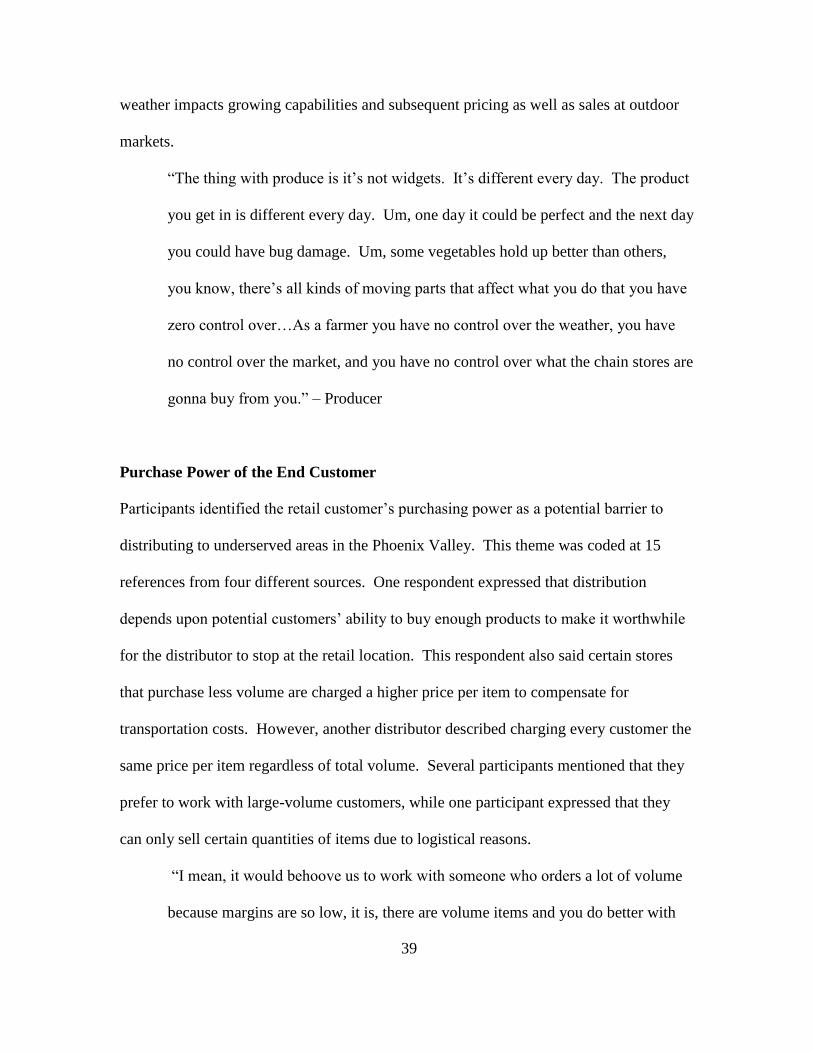
39
weather impacts growing capabilities and subsequent pricing as well as sales at outdoor
markets.
“The thing with produce is it’s not widgets. It’s different every day. The product
you get in is different every day. Um, one day it could be perfect and the next day
you could have bug damage. Um, some vegetables hold up better than others,
you know, there’s all kinds of moving parts that affect what you do that you have
zero control over…As a farmer you have no control over the weather, you have
no control over the market, and you have no control over what the chain stores are
gonna buy from you.” – Producer
Purchase Power of the End Customer
Participants identified the retail customer’s purchasing power as a potential barrier to
distributing to underserved areas in the Phoenix Valley. This theme was coded at 15
references from four different sources. One respondent expressed that distribution
depends upon potential customers’ ability to buy enough products to make it worthwhile
for the distributor to stop at the retail location. This respondent also said certain stores
that purchase less volume are charged a higher price per item to compensate for
transportation costs. However, another distributor described charging every customer the
same price per item regardless of total volume. Several participants mentioned that they
prefer to work with large-volume customers, while one participant expressed that they
can only sell certain quantities of items due to logistical reasons.
“I mean, it would behoove us to work with someone who orders a lot of volume
because margins are so low, it is, there are volume items and you do better with
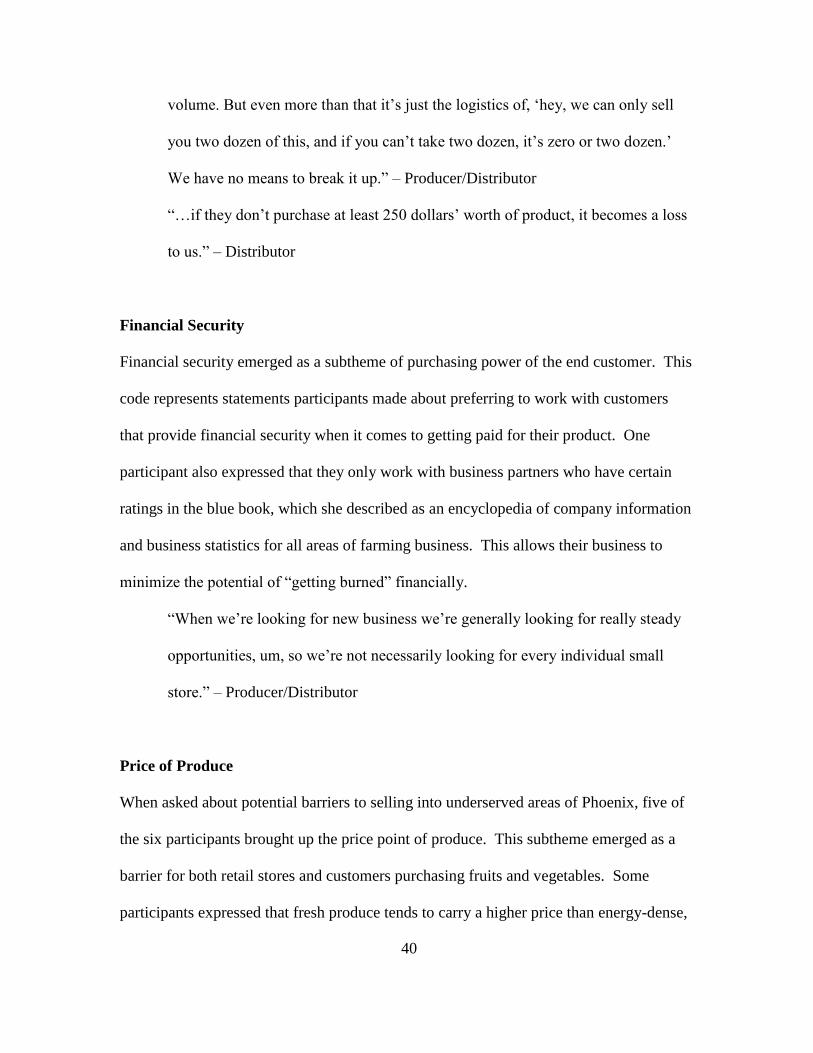
40
volume. But even more than that it’s just the logistics of, ‘hey, we can only sell
you two dozen of this, and if you can’t take two dozen, it’s zero or two dozen.’
We have no means to break it up.” – Producer/Distributor
“…if they don’t purchase at least 250 dollars’ worth of product, it becomes a loss
to us.” – Distributor
Financial Security
Financial security emerged as a subtheme of purchasing power of the end customer. This
code represents statements participants made about preferring to work with customers
that provide financial security when it comes to getting paid for their product. One
participant also expressed that they only work with business partners who have certain
ratings in the blue book, which she described as an encyclopedia of company information
and business statistics for all areas of farming business. This allows their business to
minimize the potential of “getting burned” financially.
“When we’re looking for new business we’re generally looking for really steady
opportunities, um, so we’re not necessarily looking for every individual small
store.” – Producer/Distributor
Price of Produce
When asked about potential barriers to selling into underserved areas of Phoenix, five of
the six participants brought up the price point of produce. This subtheme emerged as a
barrier for both retail stores and customers purchasing fruits and vegetables. Some
participants expressed that fresh produce tends to carry a higher price than energy-dense,
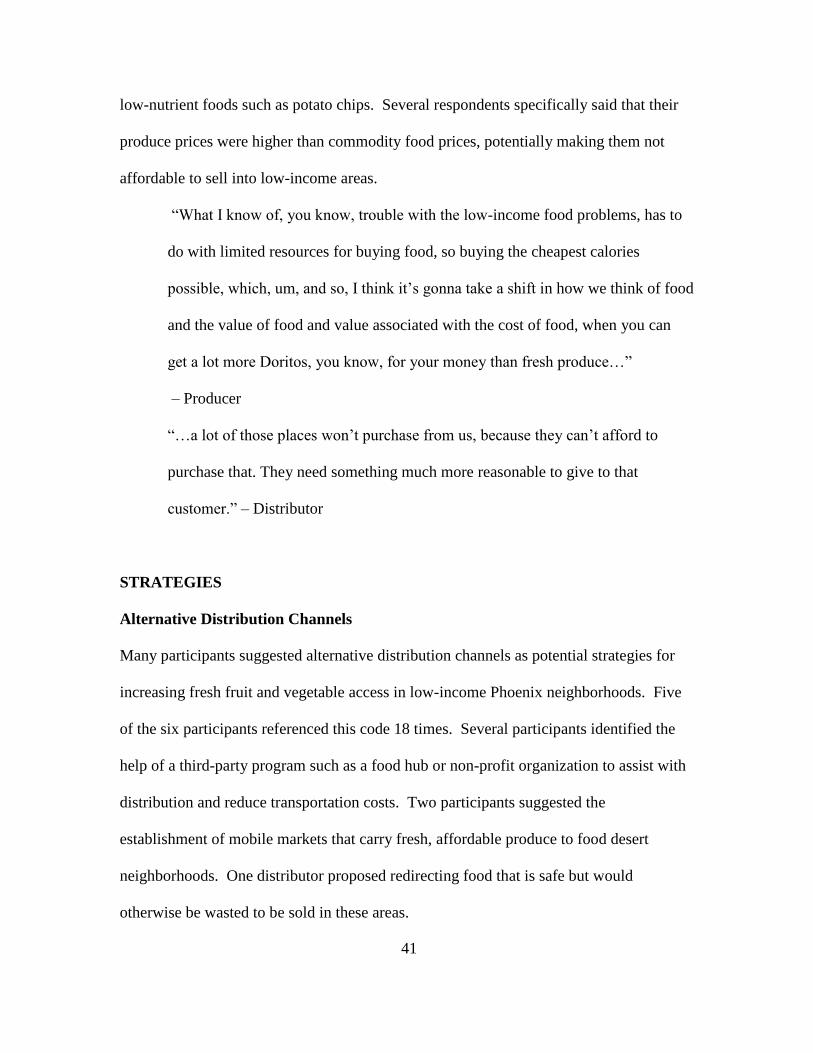
41
low-nutrient foods such as potato chips. Several respondents specifically said that their
produce prices were higher than commodity food prices, potentially making them not
affordable to sell into low-income areas.
“What I know of, you know, trouble with the low-income food problems, has to
do with limited resources for buying food, so buying the cheapest calories
possible, which, um, and so, I think it’s gonna take a shift in how we think of food
and the value of food and value associated with the cost of food, when you can
get a lot more Doritos, you know, for your money than fresh produce…”
– Producer
“…a lot of those places won’t purchase from us, because they can’t afford to
purchase that. They need something much more reasonable to give to that
customer.” – Distributor
STRATEGIES
Alternative Distribution Channels
Many participants suggested alternative distribution channels as potential strategies for
increasing fresh fruit and vegetable access in low-income Phoenix neighborhoods. Five
of the six participants referenced this code 18 times. Several participants identified the
help of a third-party program such as a food hub or non-profit organization to assist with
distribution and reduce transportation costs. Two participants suggested the
establishment of mobile markets that carry fresh, affordable produce to food desert
neighborhoods. One distributor proposed redirecting food that is safe but would
otherwise be wasted to be sold in these areas.

42
“If there was a non-profit involved that helped facilitate, you know, transporting
produce to these areas. Or, um, partnered stores with farms, you know, then yeah,
absolutely, but I think it would take something like a third-party to kind of
facilitate that…” – Producer/Distributor
“…we really need to pull back in and look at some of these smaller format
distribution models like food hubs.” – Producer
Utilize Existing Infrastructure
Two participants suggested utilizing existing infrastructure as a potential strategy for
increasing access to fresh, healthy, and affordable food in low-income neighborhoods.
One participant referenced the concept of equipping corner and convenience stores to
stock and sell healthy items. Another participant felt that Phoenix has plenty of existing
retail infrastructure, and suggested finding out who is already distributing to these areas
and whether they would be interested in supplying produce to existing stores. This
respondent also stressed the importance of providing culturally appropriate items in each
store.
“From a distribution standpoint, I’d have to look at the model and see where those
deserts are in conjunction with our customer base, and find out who would be
willing to look into this as an opportunity to sell more product.” – Distributor
“…you know corner store and convenience stores, the ‘C’ store concepts. I think
that’s a great idea because you’re using an existing system and you’re just
changing it.” – Producer
43
Incentive/Profit
Participants identified the need for tax or economic incentives that would lessen the
financial risk involved with distributing to new stores that may not provide large-volume,
steady business. This theme was coded at 14 references from four different sources. One
participant expressed that it would need to make “business sense” to sell into food desert
areas unless it was a short-term non-profit or community supporting action. Several
participants expressed that they would be interested in distributing to food deserts if there
was funding to provide more efficient equipment, a tax incentive, or even a break even.
However, one respondent mentioned that it is difficult to find that kind of opportunity.
“…as a company too, you’re out there to be profitable. Um, so if there’s a break
even, even to do something like that, that helps the community, then yeah, it’s
something that we could do.” – Distributor
ADDITIONAL INSIGHTS
Food Safety Regulations
Four participants discussed food safety regulations, the costs associated with enforcing
such regulations, and their impact on business partnerships. This theme was coded at 22
individual references. While participants acknowledged the importance of food safety,
several producers emphasized the added expense of implementing food safety programs
and third-party audits required by most chain stores. One large-scale producer felt that
farmers are most impacted by potential financial implications of food safety issues. This
causes them to work with vendors or distributors that can ensure the safe transport and
storage of their product. Two distributors expressed the need for total accountability
44
from the growers they do business with, and acknowledged that this prevents them from
working with some small-scale local farmers.
“…it increases costs by a lot and it increases wariness from a farmer to, you
know, even grow certain things or work with certain things because of concern.”
– Producer/Distributor
“Unless the local farmers can, can get us a third-party audit certificate and show
that they’re HACCP certified, uh, we stay away from that.” – Distributor
Donations
Nearly all respondents shared that they donate excess produce to a network of food banks
and see this as an effective strategy to get produce into low-income areas. Five of the six
participants referenced donating produce to emergency food organizations 17 times. Two
respondents explained that excess product is typically a result of produce appearance not
meeting chain store specifications or greater than expected yields. One producer
mentioned participating in the Arizona Statewide Gleaning Project, which utilizes prison
labor to harvest produce that would have otherwise been wasted. This produce is then
donated to Arizona food banks.
“We have always focused on getting our produce into low-income areas by
donating and participating in the Statewide Gleaning project…Our gleaning
program has allowed us to donate 1.5 – 2 million pounds of produce annually to
food banks to distribute out and get into the hands of people who need access to
fresh produce.” – Producer
“If I don’t know where to go with it, it goes to the food bank.” – Distributor

45
CHAPTER 5
DISCUSSION
Barriers
This study explored produce supply chain representatives’ perspectives on barriers and
strategies for distributing fresh produce to food deserts in Phoenix, Arizona. A limited
amount of previous studies have identified barriers to selling healthful items in food
deserts from the retail perspective, specifically small storeowners. These barriers include
high perceived neighborhood crime, low perceived demand for healthy products,
challenges ordering small quantities from suppliers, limited space and refrigeration, and
concerns about perishability and price.10,75
Although researchers were unable to
interview store owners for this study, study participants organically brought up several of
these barriers, in addition to novel barriers from the produce grower and distributor
perspective that has not been fully represented in the literature.
A previous study identified low-volume orders as a retail barrier to stocking and selling
healthy food options in food deserts.10
Several participants in this study echoed this
supply chain issue from a logistics and profit standpoint. The purchasing power of the
end customer was a common emerging theme of the qualitative data, as distributors noted
that they prefer to work with steady customers who order large volumes of product. One
distributor mentioned that his business ends up losing money if a customer does not
purchase their minimum delivery amount of 250 dollars, while another distributor will
ask certain customers to pick up small orders from his distribution center or even suggest
that the customer purchase the small produce quantity from a local supermarket. A third
46
participant expressed that produce items are generally sold by the dozen, and was
skeptical as to whether or not a small store would be able to move that kind of volume.
Thus it appears that the Phoenix produce distributors represented in this sample see the
transportation and packing logistics of small orders, coupled with the limited profit
margin on low-volume sales, to be deterrents for distributing to food deserts.
As previously noted, transportation cost was the most frequently coded reference of the
interviews. This theme also appeared to be one of the primary supply-side barriers to
produce distribution in Phoenix food deserts. The distributors of the sample emphasized
the many expenses involved with delivering produce on refrigerated semi-trucks (the
most common type of freight used) and the risk of losing money based on the customer’s
purchase size. Participants shared strategies for minimizing this financial risk such as
consolidating orders to be more efficient and working with high volume customers
whenever possible. One of the small-scale growers identified a different challenge – not
having refrigerated trucks or other expensive delivery equipment. However, this
participant similarly noted strategies of combining deliveries on a specific day to
minimize the risk of losing money. Despite the size and reach of participants’ business,
the present data reveal that transportation costs greatly factor into distribution feasibility
and determination of profitable business opportunities.
While transportation costs were emphasized as a barrier for produce shippers, production
costs were understandably highlighted as a barrier from the grower perspective.
According to a policy statement from the American Public Health Association, “food

47
system impacts are unequally distributed, with the greatest costs borne by food producers
and other workers, rural communities, and low-income consumers.”76
Several growers in
this study expressed dissatisfaction at the inequity of the typical produce supply chain
and the prohibitive costs of farming. Participants shared that it is sometimes more
expensive to harvest and sell product than it is to simply till it under the ground or donate
it. This is an interesting insight as it indicates that lack of product is not a supply chain
issue for these particular growers, but that a financial and/or logistical barrier exists
preventing this product from being delivered to market.
Participants connected much of the financial risk involved with growing and distributing
produce to the lack of control inherent in working with a perishable product. A previous
study identified perishability as a barrier to selling produce in food deserts among small
store owners, especially those lacking refrigeration to preserve freshness and extend
shelf-life.10
Growers and distributors in this study also described perishability in relation
to quality and time constraints of moving product, but included added variables such as
the weather, unforeseen bug damage, and number of stops along a distribution route.
One participant who works primarily with chain supermarkets also described the strict
appearance standards these stores have for accepting product as well as the volatility of
produce pricing. Several growers emphasized that margins are generally very tight for
farmers, and thus much of their focus is on keeping their immediate community or
regular customers happy to ensure financial security as opposed to looking for small
opportunities that may or may not be available in food deserts.
48
Previous studies have identified the price point of fresh produce as a purchasing barrier
among small store owners and low-income consumers.10,17,77
Nearly all of the
participants in this study discussed this issue. Several participants mentioned that stores
located in food deserts likely need to purchase low-cost items to provide for their
customers, and these are generally not healthier food choices such as fresh fruits and
vegetables. Additionally, a few participants representing both conventional and certified
organic farming explained that the price point of their produce is higher than commodity
food pricing and would likely not be affordable to sell into food deserts. Despite
acknowledgement of this barrier, one grower mentioned that he simply does not have
room to lower his prices, and described the need for a larger societal shift in the value
associated with food and food prices.
Strategies
While several participants shared that they were unsure as to the best approach for
increasing healthy food access in low-income Phoenix communities, a number of notable
strategies were nonetheless brought up among participants, nearly all of which address
the aforementioned barriers. Of all the emerging themes, alternative distribution methods
appeared to be the most prominent supply chain strategy as evidenced by number of
sources and references in the data. Interview participants identified the use of current
and/or potential distribution channels such as mobile markets, secondary outlets, food
hubs or other third-party programs to help connect local farms with stores and facilitate
transportation.
49
While the majority of strategies that arose in the interviews were future suggestions or
ideas, one participant described a currently utilized distribution approach. This
grower/shipper sometimes diverts excess produce that may not meet chain grocery store
standards to a secondary market that caters to a lower income population. This particular
store will purchase large quantities of product, allowing the storeowner to sell produce at
an affordable price while also making it worthwhile for the participant to get rid of
volume, even if it ends up as a break-even. Among the interview participants, this was
the only identified means of current distribution for profit into low-income Phoenix
communities.
Previous studies have recognized mobile produce distribution systems as innovative
solutions for increasing access to fresh fruits and vegetables in underserved communities,
a strategy also noted by two participants in this study. This distribution approach
requires relatively less resources and time than opening up a new supermarket or small
grocery store, and has been implemented in many cities across the country, including the
recent edition of the ‘Fresh Express’ mobile market in the Phoenix valley.78
However,
questions remain regarding the long-term financial sustainability of such ventures.
Recent research has also highlighted the importance of food hubs for building strong
local and regional food systems.79,80
Several participants in this study identified the food
hub model, which serves to aggregate and distribute produce from small and midsize
local farms, as a potential strategy for increasing distribution to food deserts. Participants
explained that a local food hub would allow farmers to focus on growing as well as assist
in transporting product to markets they may not otherwise have easy access to.
50
Participants suggested two other notable strategies: tax or economic incentives and
utilizing existing retail infrastructure to improve the supply of fresh, affordable, and
culturally appropriate foods in food deserts as opposed to soliciting new retail outlets.
One participant referenced adopting the healthy corner store concept as a potential supply
chain strategy, but then questioned the logistics of distribution to each store. Participants
also emphasized that it must make sense financially to sell into food deserts. While many
participants expressed a desire to be involved in their community, they also identified the
need for a tax or economic incentive, or even the opportunity for a “good break-even” for
any business venture. Previous studies have shown that supplemental nutrition assistance
program (SNAP) based incentives targeting produce purchases have effectively increased
total household spending and consumption of fruits and vegetables. These types of
incentives have been implemented at various mobile markets, farmers’ markets, and
healthy corner store initiatives in food deserts across the country, including the ‘Fresh
Express’ mobile market in Phoenix. Although this type of incentive does not directly
target producers and distributors, unless the produce is sold direct such as at farmers’
markets, it may increase consumer demand for fresh fruits and vegetables. This may then
lead to higher profits for the storeowner and more frequent and/or larger purchases from
produce suppliers.
Additional Insights
Multiple participants in this study brought up food safety regulations and their impact on
overall costs and business decisions as an additional insight on the research topic. This
theme often came up towards the end of the interviews when participants were asked if
51
there was anything else they would like to share or include on the conversation. One
grower described food safety as an “interesting part of the puzzle” in that the added costs
of program implementation and third-party audits, as well as fear of financial
implications for any food safety issue, collectively influence who they sell to. For
example, this participant said their business might not sell to smaller vendors who would
not be able to ensure the safe handling of their product, a potential barrier for distribution
into food deserts. The large-scale distributors of the sample also described not being able
to work with small-scale Arizona growers who may not have their food safety programs
or audits in place due to the need for total accountability of their product.
Previous studies have similarly identified liability, uncertainties, and costs related to food
safety regulations as barriers for distributing local produce into mainstream markets.81,82
Although local Arizona growers may already be following safe handling practices, as
mentioned by a distributor in this study, they are required to document food safety
standards such as GAP (Good Agricultural Practices) and GHP (Good Handling
Practices), as well as hire third-party auditors to verify their practices in order to sell to
many distributors, wholesalers, and retail food buyers. The documentation and
infrastructure required for these standards may be cost-prohibitive for local farms that
already face difficulties simply thriving as a farm, as mentioned by previous researchers
as well as several farmers in this study.81
Two participants identified the potential
importance of food hubs in relation to this issue, as this would allow smaller farmers to
place more focus on growing and meeting food safety standards and less focus on
marketing and distribution. Many food hubs also offer technical assistance and training
52
to farmers to ensure that they meet buyers’ food safety requirements, allowing them to
expand their marketing channels.79
Although only one participant currently sells into a Phoenix food desert, nearly all
participants regularly donate excess produce that would have otherwise been tilled under
the ground or wasted to a large network of local food banks. Participants described
emergency food donations as their primary means of getting fresh food into low-income
communities across the state. Although growers and distributors are able to receive a tax
incentive for this type of donation, one participant described that it is still generally a
financial loss. Overall, participants appeared to be unaware of opportunities to market
into Phoenix food deserts and view donating produce as a successful means of
distribution.
Future Research
Due to the exploratory, qualitative nature of this study, future research is needed to
determine the degree to which the identified supply chain constraints and strategies are in
fact representative of the beliefs and opinions of the larger local supply chain. Future
studies should include a larger sample size to better represent the fresh produce supply
chain, including retailers currently operating within and outside of Phoenix food deserts.
Systematic assessments such as survey-based data collection have the potential to include
a greater number of participants who may not have agreed to be interviewed due to time
limitations or perceived concerns of confidentiality. This type of assessment should be
53
developed to explore nuances of the emergent themes and gain a better understanding of
the potential significance of the research findings.
If the interview themes are substantiated by this survey, hypothesis-driven studies could
then explore topics such as the types of tax or economic incentives that would make
distributing into food deserts financially viable, or whether alternative distribution
channels such as food hubs could alleviate the logistics and transportation disincentives
of distributing to smaller stores primarily found in underserved areas of Phoenix. A case
study evaluation of currently operating alternative distribution systems such as the ‘Fresh
Express’ mobile market could create an evidence base to inform future programs or
policies in the greater Phoenix valley. Studies could also explore whether, for example,
the current retail infrastructure in Phoenix has the capacity to safely store fresh produce,
as well as gauge store owners’ interest in selling produce based on perceived customer
demand.
54
CHAPTER 6
CONCLUSION
This qualitative, exploratory study was designed to better understand the barriers to, and
potential strategies for, distributing fresh produce to low-income food desert communities
in Phoenix, Arizona. Six semi-structured, in-depth interviews were conducted with local
produce supply chain representatives, specifically growers and distributors currently
operating in the Phoenix metropolitan area. Using the general inductive approach, a
thematic content analysis was performed to identify emerging themes, which were then
organized into the categories of barriers, strategies, and additional insights. To the
researchers’ knowledge, few studies to date have examined supply chain issues in
relation to healthy food access in food deserts.
Results indicated that participants perceive numerous obstacles in servicing Phoenix food
deserts. Several growers described the lack of control inherent in working with a
perishable product, production costs, and market volatility as challenges to simply
remaining financially sustainable as a farm. Participants also mentioned the following
distribution barriers: minimum delivery requirements greater than the needs of the typical
small store; an inability to break up case sizes for low-volume orders, transportation
costs; and the higher price point of their produce relative to other food options. In
addition, many participants expressed how new food safety regulations introduce added
costs and uncertainties within farmer-distributor-retailer business partnerships.
55
Conversely, participants suggested multiple strategies for overcoming these barriers and
other issues related to the topic. As financial viability was a common concern among
participants, they commonly suggested the need for a financial incentive or even a “good
break-even” to interest them in new business in these areas. Participants also discussed
alternative distribution/retail channels such as mobile markets and food hubs as potential
strategies for alleviating logistic and transportation costs and improving healthy food
accessibility for food desert residents, among other benefits. As an additional insight,
nearly all participants described currently donating excess produce to local food banks as
their primary means of distributing fresh fruits and vegetables into low-income
communities.
Although future studies with larger, more diverse samples would be necessary to confirm
the representativeness of the emerging themes presented in these results, they nonetheless
begin to tell a story of the challenges some Phoenix produce growers and distributors face
in servicing nearby food deserts, in addition to providing identified strategies to
overcome these barriers. These data serve to guide further research, which may ultimately
better inform policies and programs addressing healthy food access and working towards
a more equitable food system.

56
REFERENCES
1. Economic Research Service. USDA. Access to affordable and nutritious food:
measuring and understanding food deserts and their consequences. 2009. Available
at: http://www.ers.usda.gov/media/242675/ap036_1_.pdf.
2. Hilmers A, Hilmers DC, Dave J. Neighborhood disparities in access to healthy
foods and their effects on environmental justice. Am J Public Health.
2012;102(9):1644–54. doi:10.2105/AJPH.2012.300865.
3. Franco M, Diez Roux AV, Nettleton JA, et al. Availability of healthy foods and
dietary patterns: the Multi-Ethnic Study of Atherosclerosis. Am J Clin Nutr.
2009;89(3):897–904. doi:10.3945/ajcn.2008.26434.
4. Morland K, Diez Roux AV, Wing S. Supermarkets, other food stores, and obesity:
the atherosclerosis risk in communities study. Am J Prev Med. 2006;30(4):333–
339.
5. Drewnowski A, Specter SE. Poverty and obesity: the role of energy density and
energy costs. Am J Clin Nutr. 2004;79(1):6–16.
6. Drewnowski A. Obesity, diets, and social inequalities. Nutr Rev. 2009;67 Suppl
1:S36–9. doi:10.1111/j.1753-4887.2009.00157.x.
7. Hill JO, Peters JC. Environmental contributions to the obesity epidemic. Science.
1998;280(5368):1371–1374. doi:10.1126/science.280.5368.1371.
8. Larson NI, Story MT, Nelson MC. Neighborhood environments: disparities in
access to healthy foods in the U.S. Am J Prev Med. 2009;36(1):74–81.
doi:10.1016/j.amepre.2008.09.025.
9. Freedman DA. Local food environments: they’re all stocked differently. Am J
Community Psychol. 2009;44(3-4):382–93. doi:10.1007/s10464-009-9272-6.
10. Gittelsohn J, Franceschini MCT, Rasooly IR, et al. Understanding the food
environment in a low-income urban setting: implications for food store
interventions. J Hunger Environ Nutr. 2008;2(2-3):33–50.
doi:10.1080/19320240801891438.
11. Hawkes C. Identifying innovative interventions to promote healthy eating using
consumption-oriented food supply chain analysis. J Hunger Environ Nutr.
2009;4(3-4):336–356. doi:10.1080/19320240903321243.
12. Wolfersteig WL, Lewis H, Musgrave T, Johnson T, Wolven T, Marsiglia FF. 2010
Arizona Health Survey: Food, Housing Insecurity and Health. Available at:
57
http://www.arizonahealthsurvey.org/wp-content/uploads/2011/11/AHS-
EconDwntrn-Nov11.pdf. Published November 2011. Accessed February 19, 2015.
13. Holben DH. Position of the American Dietetic Association: food insecurity in the
United States. J Am Diet Assoc. 2010;110(9):1368–1377.
14. Arizona Department of Health Services. Arizona State Health Assessment.
Available at: http://www.azdhs.gov/diro/excellence/documents/az-state-health-
assessment.pdf. Published April 2014. Accessed February 19, 2015.
15. Adams EJ, Grummer-Strawn L, Chavez G. Food insecurity is associated with
increased risk of obesity in California women. J Nutr. 2003;133(4):1070–1074.
16. Dinour LM, Bergen D, Yeh MC. The food insecurity-obesity paradox: a review of
the literature and the role food stamps may play. J Am Diet Assoc.
2007;107(11):1952–61. doi:10.1016/j.jada.2007.08.006.
17. Hendrickson D, Smith C, Eikenberry N. Fruit and vegetable access in four low-
income food deserts communities in Minnesota. Agric Human Values.
2006;23(3):371–383. doi:10.1007/s10460-006-9002-8.
18. Odoms-Young AM, Zenk SN, Karpyn A, Ayala GX, Gittelsohn J. Obesity and the
food environment among minority groups. Curr Obes Rep. 2012;1(3):141–151.
doi:10.1007/s13679-012-0023-x.
19. Chung C, Myers SL. Do the poor pay more for food? An analysis of grocery store
availability and food price disparities. J Consum Aff. 1999;33(2):276–296.
doi:10.1111/j.1745-6606.1999.tb00071.x.
20. Karpyn A, Manon M, Treuhaft S, Giang T, Harries C, McCoubrey K. Policy
solutions to the “grocery gap”. Health Aff (Millwood). 29(3):473–80.
doi:10.1377/hlthaff.2009.0740.
21. Larsen K, Gilliland J. A farmers’ market in a food desert: Evaluating impacts on
the price and availability of healthy food. Health Place. 2009;15(4):1158–1162.
doi: 10.1016/j.healthplace.2009.06.007.
22. Evans AE, Jennings R, Smiley AW, et al. Introduction of farm stands in low-
income communities increases fruit and vegetable among community residents.
Health Place. 2012;18(5):1137–1143. doi: 10.1016/j.healthplace.2012.04.007.
23. Walker RE, Keane CR, Burke JG. Disparities and access to healthy food in the
United States: A review of food deserts literature. Health Place. 2010;16(5):876–
84. doi:10.1016/j.healthplace.2010.04.013.

58
24. Morland K, Wing S, Diez Roux A, Poole C. Neighborhood characteristics
associated with the location of food stores and food service places. Am J Prev
Med. 2002;22(1):23–29.
25. Larson C, Haushalter A, Buck T, Campbell D, Henderson T, Schlundt D.
Development of a community-sensitive strategy to increase availability of fresh
fruits and vegetables in Nashville’s urban food deserts, 2010-2012. Prev Chronic
Dis. 2013;10:E125. doi:10.5888/pcd10.130008.
26. Chronic Diseases and Health Promotion. Centers for Disease Control and
Prevention website. http://www.cdc.gov/chronicdisease/overview/index.htm.
Updated May 9, 2014. Accessed December 3, 2013.
27. Oyebode O, Gordon-Dseagu V, Walker A, Mindell JS. Fruit and vegetable
consumption and all-cause, cancer and CVD mortality: analysis of Health Survey
for England data. J Epidemiol Community Health. 2014;68(9):856–62.
doi:10.1136/jech-2013-203500.
28. Van Duyn MA, Pivonka E. Overview of the health benefits of fruit and vegetable
consumption for the dietetics professional: selected literature. J Am Diet Assoc.
2000;100(12):1511–21. doi:10.1016/S0002-8223(00)00420-X.
29. Ford ES, Mokdad AH. Fruit and vegetable consumption and diabetes mellitus
incidence among U.S. adults. Prev Med. 2001;32(1):33-9.
30. Liu RH. Health benefits of fruit and vegetables are from additive and synergistic
combinations of phytochemicals. Am J Clin Nutr. 2003;78(3):517S–520.
31. Anderson JW, Baird P, Davis RH, et al. Health benefits of dietary fiber. Nutr Rev.
2009;67(4):188–205. doi:10.1111/j.1753-4887.2009.00189.x.
32. Jenkins DJ, Kendall CW, Vuksan V, et al. Soluble fiber intake at a dose approved
by the US Food and Drug Administration for a claim of health benefits: serum
lipid risk factors for cardiovascular disease assessed in a randomized controlled
crossover trial. Am J Clin Nutr. 2002;75(5):834–839.
33. Dong D, Lin BH. Fruit and vegetable consumption by low-income Americans:
would a price reduction make a difference?, ERR-70, U.S. Department of
Agriculture, Economic Research Service. Available at:
http://www.ers.usda.gov/media/185375/err70.pdf. Published January 2009.
Accessed October 23, 2013.
34. Centers for Disease Control and Prevention. CDC Health Disparities and
Inequalities Report - United States, 2013. Available at:
59
http://www.cdc.gov/minorityhealth/CHDIReport.html. Published November 2013.
Accessed October 23, 2013.
35. LaVeist TA, Gaskin DJ, Richard P. The economic burden of health inequalities in
the United States. Joint Center for Political and Economic Studies. Available at:
http://www.healthy.ohio.gov/~/media/HealthyOhio/ASSETS/Files/health
equity/economicburdenofhealthinequalitiesintheunitedstates.ashx. Published
September 2009. Accessed October 23, 2013.
36. U.S. Department of Health and Human Services. Office of Disease Prevention and
Health Promotion. Healthy People 2020. Washington, DC Available at:
http://www.healthypeople.gov/2020. Accessed October 30, 2013.
37. Adler NE, Rehkopf DH. U.S. disparities in health: descriptions, causes, and
mechanisms. Annu Rev Public Health. 2008;29:235–52.
doi:10.1146/annurev.publhealth.29.020907.090852.
38. Mensah GA, Mokdad AH, Ford ES, Greenlund KJ, Croft JB. State of disparities in
cardiovascular health in the U.S. Circulation. 2005;111:1233-1241.
39. Coleman-Jensen A, Gregory C, Singh A. Household Food Security in the United
States in 2013. U.S. Department of Agriculture, Economic Research Service
Report Number 173. Available at:
http://www.ers.usda.gov/media/1565415/err173.pdf. Published September 2014.
Accessed December 5, 2014.
40. Seligman HK, Bindman AB, Vittinghoff E, Kanaya AM, Kushel MB. Food
insecurity is associated with diabetes mellitus: results from the National Health
Examination and Nutrition Examination Survey (NHANES) 1999-2002. J Gen
Intern Med. 2007;22(7):1018–23. doi:10.1007/s11606-007-0192-6.
41. Diabetes Statistics - American Diabetes Association website. Available at:
http://www.diabetes.org/diabetes-basics/statistics/. Published June 10, 2014.
Updated February 19, 2015. Accessed November 27, 2013.
42. Townsend MS, Peerson J, Love B, Achterberg C, Murphy SP. Food insecurity is
positively related to overweight in women. J Nutr. 2001;131(6):1738–1745.
43. Alaimo K, Olson CM, Frongillo Jr EA. Food insufficiency and American school-
aged children’s cognitive, academic, and psychosocial development. Pediatrics.
2001;108(1):44–53.
44. Widome R, Neumark-Sztainer D, Hannan PJ, Haines J, Story M. Eating when
there is not enough to eat: eating behaviors and perceptions of food among food-
60
insecure youths. Am J Public Health. 2009;99(5):822–8.
doi:10.2105/AJPH.2008.139758.
45. Chaloupka FJ, Johnston LD, Brownson RC, et al. Associations between access to
food stores and adolescent body mass index. Am J Prev Med. 2007;33(4):S301–
S307.
46. McKinnon RA, Reedy J, Morrissette MA, Lytle LA, Yaroch AL. Measures of the
food environment: a compilation of the literature, 1990-2007. Am J Prev Med.
2009;36(4 Suppl):S124–33. doi:10.1016/j.amepre.2009.01.012.
47. Glanz K, Sallis JF, Saelens BE, Frank LD. Nutrition environment measures survey
in stores (NEMS-S). Am J Prev Med. 2007;32(4):282–289.
48. Caspi CE, Sorensen G, Subramanian S V, Kawachi I. The local food environment
and diet: a systematic review. Health Place. 2012;18(5):1172–87.
doi:10.1016/j.healthplace.2012.05.006.
49. Raja S, Yadav P. Beyond food deserts: measuring and mapping racial disparities in
neighborhood food environments. J Plan Educ Res. 2008;27(4):469–482.
doi:10.1177/0739456X08317461.
50. Mulligan J, Tsai P, Whitacre PT, eds. The public health effects of food deserts:
workshop summary. National Academies Press. Available at:
http://www.nap.edu/openbook.php?record_id=12623&page=37. Published 2009.
Accessed November 20, 2013.
51. Iceland J, Steinmetz E. The effects of using census block groups instead of census
tracts when examining residential housing patterns. Bur Census. 2003. Available
at:
http://www.census.gov.ezproxy1.lib.asu.edu/housing/patterns/publications/unit_of
_analysis.pdf. Accessed December 5, 2014.
52. Franco M, Diez Roux A V, Glass TA, Caballero B, Brancati FL. Neighborhood
characteristics and availability of healthy foods in Baltimore. Am J Prev Med.
2008;35(6):561–7. doi:10.1016/j.amepre.2008.07.003.
53. Powell LM, Slater S, Mirtcheva D, Bao Y, Chaloupka FJ. Food store availability
and neighborhood characteristics in the United States. Prev Med (Baltim).
2007;44(3):189–195.
54. Cummins S, Macintyre S. “Food deserts”--evidence and assumption in health
policy making. BMJ. 2002;325(7361):436–8.

61
55. Beaulac J, Kristjansson E, Cummins S. A systematic review of food deserts, 1966-
2007. Prev Chronic Dis. 2009;6(3): A105.
56. Rose D, Bodor NJ, Swalm CM, Rice JC, Farley TA, Hutchinson PL. Deserts in
New Orleans? Illustrations of urban food access and implications for policy. Ann
Arbor, MI; 2009. Available at: http://npc.fordschool.umich.edu/news/events/food-
access/rose_et_al.pdf. Accessed November 10, 2014.
57. Fielding JE, Simon PA. Food deserts or food swamps?: comment on “fast food
restaurants and food stores”. Arch Intern Med. 2011;171(13):1171–2.
doi:10.1001/archinternmed.2011.279.
58. Joassart-Marcelli P, Bosco FJ, Delgado E. Southeastern San Diego’s food
landscape: challenges and opportunities. Policy Report. 2014. Department of
Geography, San Dieto State University and Project New Village. Available at:
http://geography.sdsu.edu/Research/Projects/FEP/Docs/Report.pdf. Accessed
November 10, 2014.
59. Giang T, Karpyn A, Laurison HB, Hillier A, Perry RD. Closing the grocery gap in
underserved communities: the creation of the Pennsylvania Fresh Food Financing
Initiative. J Public Health Manag Pract. 14(3):272–9.
doi:10.1097/01.PHH.0000316486.57512.bf.
60. Eisenhauer E. In poor health: Supermarket redlining and urban nutrition.
GeoJournal. 2001;53(2):125–133.
61. RACE - The Power of an Illusion. Go Deeper | PBS. PBS Public Broadcast Serv.
2003. Available at: http://www.pbs.org/race/000_About/002_06_a-godeeper.htm.
Accessed November 24, 2014.
62. Nyden P, Lukehart J, Maly MT, Peterman W. Chapter 1: Neighborhood racial and
ethnic diversity in U.S. cities. Cityscape. 1998;4(2):1–17.
63. Bell J, Standish M. Building healthy communities through equitable food access.
Community Dev Invest Rev. 2009:75–87.
64. Aggarwal A, Cook AJ, Jiao J, et al. Access to supermarkets and fruit and vegetable
consumption. Am J Public Health. 2014;104(5):917–23.
doi:10.2105/AJPH.2013.301763.
65. Morland K, Wing S, Roux AD. The contextual effect of the local food
environment on residents’ diets: the atherosclerosis risk in communities study. Am
J Public Health. 2002;92(11):1761–1768. doi:10.2105/AJPH.92.11.1761.
62
66. Rose D, Richards R. Food store access and household fruit and vegetable use
among participants in the US Food Stamp Program. Public Health Nutr.
2004;7(8):1081–8. doi:10.1079/PHN2004648.
67. Laraia BA, Siega-Riz AM, Kaufman JS, Jones SJ. Proximity of supermarkets is
positively associated with diet quality index for pregnancy. Prev Med (Baltim).
2004;39(5):869–75. doi:10.1016/j.ypmed.2004.03.018.
68. Powell LM, Auld MC, Chaloupka FJ, O’Malley PM, Johnston LD. Associations
between access to food stores and adolescent body mass index. Am J Prev Med.
2007;33(4 Suppl):S301–7. doi:10.1016/j.amepre.2007.07.007.
69. Fiechtner L, Block J, Duncan DT, et al. Proximity to supermarkets associated with
higher body mass index among overweight and obese preschool-age children. Prev
Med (Baltim). 2013;56(3-4):218–21. doi:10.1016/j.ypmed.2012.11.023.
70. Monsivais P, Mclain J, Drewnowski A. The rising disparity in the price of
healthful foods: 2004–2008. Food Policy. 2010;35(6):514–520.
71. Wegener J, Hanning RM. Concepts and measures of “alternative” retail food
outlets: considerations for facilitating access to healthy, local Food. J Hunger
Environ Nutr. 2010;5(2):158–173. doi: 10.1080/19320248.2010.487023.
72. Thomas DR. A general inductive approach for analyzing qualitative evaluation
data. Am J Eval. 2006;27(2):237–246. doi:10.1177/1098214005283748.
73. Glaser BG, Strauss AL. Discovery of Grounded Theory: Strategies for Qualitative
Research. Chicago: Aldine; 1967.
74. Burla L, Knierim B, Barth J, Liewald K, Duetz M, Abel T. From text to codings:
intercoder reliability assessment in qualitative content analysis. Nurs Res.
57(2):113–7. doi:10.1097/01.NNR.0000313482.33917.7d.
75. Larson C, Haushalter A, Buck T, Campbell D, Henderson T, Schlundt D.
Development of a community-sensitive strategy to increase availability of fresh
fruits and vegetables in Nashville’s urban food deserts, 2010-2012. Prev Chronic
Dis. 2013;10:E125. doi:10.5888/pcd10.130008.
76. American Public Health Association. Toward a healthy, sustainable food system.
Policy 200712. 2007.
77. Zepeda L, Reznickova A, Lohr L. Overcoming challenges to effectiveness of
mobile markets in US food deserts. Appetite. 2014;79:58–67.
doi:10.1016/j.appet.2014.03.026.
63
78. Discovery Triangle | Fresh Express. Available at:
http://www.discoverytriangle.org/fresh-express/. Accessed March 10, 2015.
79. Barham J, Tropp D, Enterline K, Farbman J, Fisk J, Kiraly S. Regional Food Hub
Resource Guide (No. 145227). 2012.
80. Blay-Palmer A, Landman K, Knezevic I, Hayhurst R. Constructing resilient,
transformative communities through sustainable “food hubs.” Local Environ.
2013;18(5):521–528. doi:10.1080/13549839.2013.797156.
81. Harris D, Lott M, Lakins V, Bowden B, Kimmons J. Farm to institution: creating
access to healthy local and regional foods. Adv Nutr. 2012;3(3):343–9.
doi:10.3945/an.111.001677.
82. Martinez S, Hand MS, Da Pra M, et al. Local food systems: concepts, impacts, and
issues. 2010. Available at: http://www.ers.usda.gov/publications/err-economic-
research-report/err97.aspx. Accessed March 12, 2015.

64
APPENDIX A
RECRUITMENT LETTER

65
Dear :
My name is Gina Lacagnina and I am a master’s student in the School of Nutrition and
Health Promotion at Arizona State University. I am conducting a research study to better
understand the accessibility of fresh fruits and vegetables in low-income areas of
Phoenix, Arizona from the perspective of local producers, distributors, and retailers. This
study is part of a broader project being conducted by Dr. Christopher Wharton and Dr.
Renee Hughner.
We would love the opportunity to discuss this subject with you in a short interview that
should take no more than one hour of your time, in which you will be compensated with a
$50 gift card. If you are willing to be a part of the study, or have any further questions,
please contact me at [email protected].
Kind regards,
Gina Lacagnina

66
APPENDIX B
INTERVIEW CONSENT LETTER
67
Dear :
I am a graduate student under the direction of Professor Christopher Wharton in the
School of Nutrition and Health Promotion at Arizona State University. I am conducting a
research study to better understand the accessibility of fresh fruits and vegetables in low-
income areas of Phoenix, Arizona from the perspective of local producers, distributors,
and retailers.
I am inviting your participation, which will involve participating in an interview that will
take no more than one hour of your time. You have the right not to answer any question,
and to stop participation at any time. Your participation in this study is voluntary. If you
choose not to participate or to withdraw from the study at any time, there will be no
penalty. You must be 18 years of age or older to participate in the study.
Your responses to the interview will be used to develop a better understanding of the
barriers and possible solutions that exist within the supply chain to providing fresh fruits
and vegetables to low-income areas in Phoenix. You will be compensated with $50 for
your time. There are no foreseeable risks or discomforts to your participation.
We will take every measure to protect your confidentiality. In transcribing and analyzing
data from the interview, neither your name nor organization will be used to identify
participants. The results of this study may be used in reports, presentations, or
publications but your name and your organization’s name will not be revealed to

68
maintain privacy. Instead, participants will be identified by supply chain entity
(producer, distributor, or retailer) and size of business.
I would like to audio record this interview. The interview will not be recorded without
your permission. Please let me know if you do not want the interview to be recorded;
you also can change your mind after the interview starts, just let me know. The tapes will
be destroyed once they are transcribed.
If you have any questions concerning the research study, please contact the research team
at: [email protected] or 602-827-2256. If you have any questions about your
rights as a participant in this research, or if you feel you have been placed at risk, you can
contact the Chair of the Human Subjects Institutional Review Board, through the ASU
Office of Research Integrity and Assurance, at (480) 965-6788. By signing in the space
below, you agree to participate in the study and to have your responses recorded via
audio tape. Your signature below also indicates that you are allowing the researchers to
use your transcribed responses in future presentations or publications of this research.
However, your actual voice and name will not be used in the presentation of this study.
By signing below you are agreeing to be part of the study.
Name:
Signature: Date:

69
APPENDIX C
DEMOGRAPHICS SURVEY
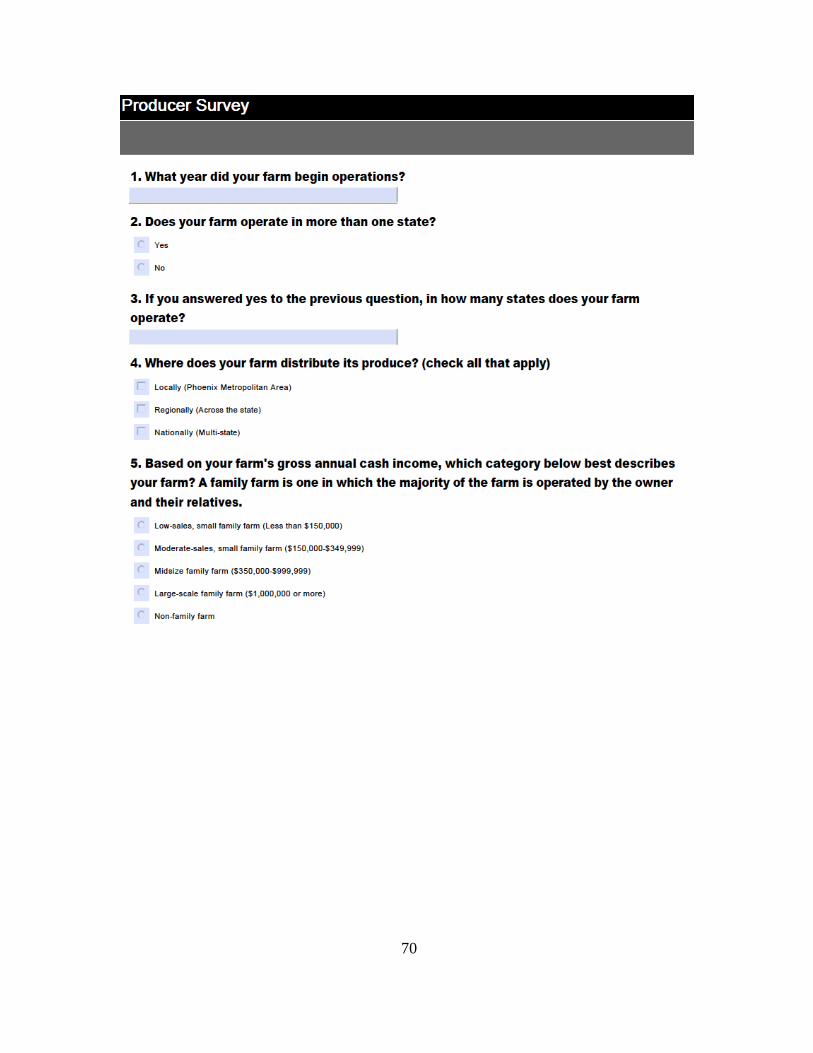
70

71

72

73
APPENDIX D
INTERVIEW GUIDE

74
Interview Guide: Growers
Begin with a question to build rapport.
1. Can you tell me a little bit about the farm?
a. Who are your customers?
b. How would you describe your farm in terms of size and products grown?
2. What are the goals and/or mission of your farm?
3. Where does the produce go after it leaves the farm? How does it get there?
a. Do you work with distributors or do your own distribution?
b. What are the steps involved in the distribution of produce? (What is required –
any processing? Refrigeration? Packaging?)
4. Does your farm use any alternative models to distribute produce (such as farmers
markets/community supported agriculture programs/mobile markets)?
a. What are the positive aspects of using these models?
b. What are the challenges or costs of using these models?
5. What are some of the challenges you face in distributing your produce?
6. What types of retail outlets does your business distribute produce to? (Supermarkets,
small grocery stores, corner stores, etc.)
a. What size retailers do you service?
i. Do you service any smaller, single-store retailers and/or marts?
ii. Are there challenges in servicing small stores compared to large grocery
stores?
7. How has the demand been for your produce in recent years?
a. How are you responding to that?
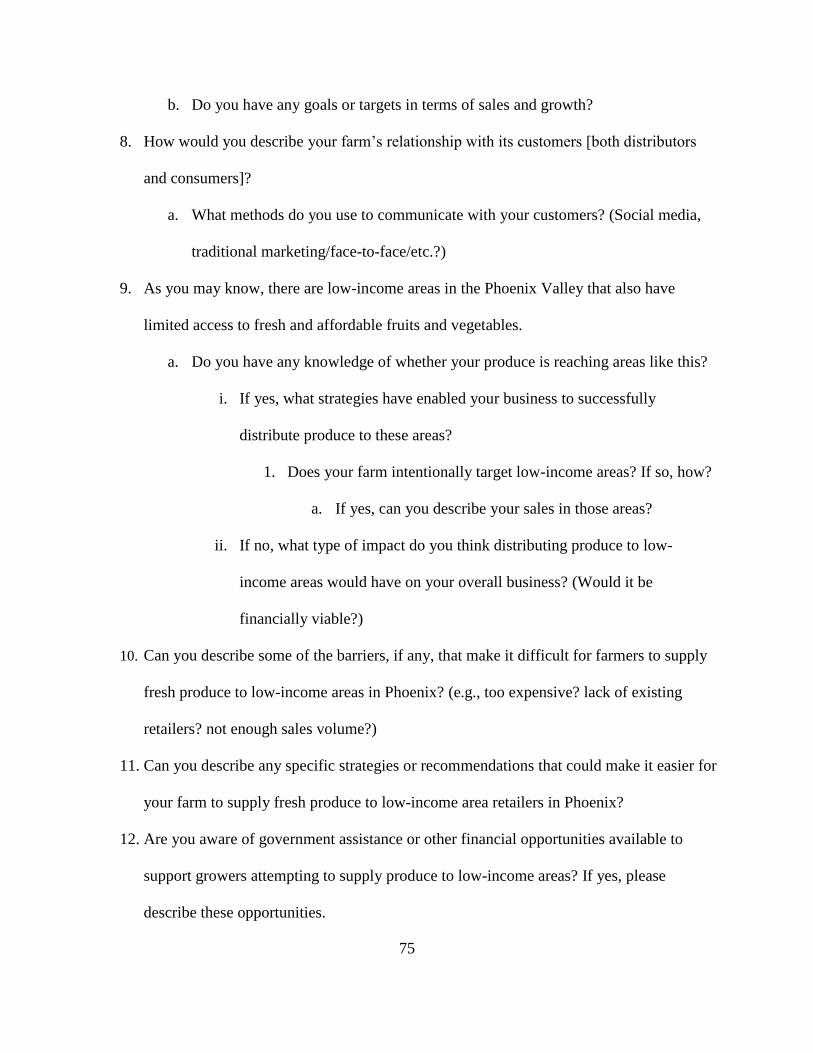
75
b. Do you have any goals or targets in terms of sales and growth?
8. How would you describe your farm’s relationship with its customers [both distributors
and consumers]?
a. What methods do you use to communicate with your customers? (Social media,
traditional marketing/face-to-face/etc.?)
9. As you may know, there are low-income areas in the Phoenix Valley that also have
limited access to fresh and affordable fruits and vegetables.
a. Do you have any knowledge of whether your produce is reaching areas like this?
i. If yes, what strategies have enabled your business to successfully
distribute produce to these areas?
1. Does your farm intentionally target low-income areas? If so, how?
a. If yes, can you describe your sales in those areas?
ii. If no, what type of impact do you think distributing produce to low-
income areas would have on your overall business? (Would it be
financially viable?)
10. Can you describe some of the barriers, if any, that make it difficult for farmers to supply
fresh produce to low-income areas in Phoenix? (e.g., too expensive? lack of existing
retailers? not enough sales volume?)
11. Can you describe any specific strategies or recommendations that could make it easier for
your farm to supply fresh produce to low-income area retailers in Phoenix?
12. Are you aware of government assistance or other financial opportunities available to
support growers attempting to supply produce to low-income areas? If yes, please
describe these opportunities.
76
13. Are there policies in place that you think could be changed to make fruits and vegetables
more accessible to low-income communities? If so, please provide examples.
14. Do you think farmers can play a role in alleviating the lack of fresh fruits and vegetables
in certain low-income areas?
15. Is there anything else you would like to share about your experience as a farmer?

77
Interview Guide: Distributors
Begin with a question to build rapport.
1. Can you tell me a little bit about your company?
a. Who are your customers?
b. How would you describe your business in terms of size and products sold?
2. What are the goals and/or mission of your company?
3. What are the steps involved in the distribution of produce? (e.g., from pick up from
grower to delivery to retailer. What is required – any processing? Refrigeration?
Packaging?)
a. Do these steps, or the functions carried out by distributors, differ by size of
grower and/or size of retailer, and if so, how?
b. Are there challenges in distribution that pertain specifically to produce?
4. What types of retail outlets does your business distribute produce to? (Supermarkets,
small grocery stores, corner stores, etc.)
a. What size retailers do you service?
i. Do you service any smaller, single-store retailers and/or marts?
ii. Are there challenges in servicing small stores compared to large grocery
stores?
5. Do you work with any local farmers to distribute fresh produce?
a. If yes, how long have you been working with local growers? Can you tell me
about your experiences working with local growers?
b. If no, what types of farms do you work with and why?

78
c. If interested, what strategies might make it easier for your organization to work
with local growers?
6. As you may know, there are low-income areas in the Phoenix Valley that also have
limited access to fresh and affordable fruits and vegetables.
a. Do you have any knowledge of whether your business distributes to areas like
this?
i. If yes, what strategies have enabled your business to successfully
distribute produce to these areas?
1. Does your business intentionally target low-income areas? If so,
how? Can you describe your sales in those areas?
ii. If no, what type of impact do you think distributing produce to low-
income areas would have on your overall business? (Would it be
financially viable?)
7. Can you describe some of the barriers, if any, that might make it difficult for your
business to distribute to low-income areas in Phoenix? (e.g., too expensive? lack of
existing retailers? not enough sales volume?)
8. Can you describe any specific strategies or recommendations that could make it easier for
your business to distribute fresh produce to low-income area retailers in Arizona?
9. Are you aware of government assistance or other financial opportunities available to
support distributors attempting to supply produce in low-income areas? If yes, please
describe these opportunities.
10. Are there policies in place that you think could be changed to make fruits and vegetables
more accessible to low-income communities? If so, please provide examples.
79
11. Do you think distributors can play a role in alleviating the lack of fresh fruits and
vegetables in certain low-income areas?
12. Is there anything else you would like to share about your experience as a distributor?

80
APPENDIX E
IRB APPROVAL
81