food and livelihood security of the malaysian paddy farmers
TRANSCRIPT

59
Mohd Rashid Rabu and Mohd Dainuri Mohd Shah
Food and livelihood security of the Malaysian paddy farmers(Bekalan makanan dan jaminan kesejahteraan hidup di kalangan petani padi di Malaysia)
Mohd Rashid Rabu* and Mohd Dainuri Mohd Shah*
Keywords: livelihood food security, paddy farmers, household income
AbstractThe National Food Security Policy aims to increase the National Self Sufficiency Level (SSL) of domestic rice production from 70% in 2010 to 85% by 2015. This will reduce the importation of rice from 30% to 15% by 2015. Malaysia needs to produce around 2.5 million metric tonnes of paddy annually. There are about 300,000 farmers involved in paddy production of which almost 30% are full time farmers. They are the backbone of the industry and determinant of the national food security target. Despite achieving the national food security agenda, it is important to understand the status of the paddy farmers’ livelihood, especially their socioeconomic status in relation to their ability to achieve their minimum living expenditures. This study investigated the farmers’ livelihood status, which was indicated by their monthly households’ income and expenditure compared to national households income and expenditures level. This study revealed that the farmers’ monthly household income in three granary areas were higher than the national poverty income level, but lower than the national households’ income level. The income from paddy activities was not sufficient to support the household monthly expenditure of farmers in Projek Barat Laut Selangor (PBLS) and Muda Agriculture Development Authority (MADA) as they had to get support from other sources of income. On the other hand, the income from paddy activities was sufficient to support household livelihood for farmers in Kemubu Agriculture Development Authority (KADA). The living cost in KADA was relatively low compared to that in PBLS and MADA.
*Economic and Technology Management Research Centre, MARDI Headquarters, Serdang, P.O. Box 12301,50774 Kuala LumpurE-mel: [email protected]©Malaysian Agricultural Research and Development Institute 2013
IntroductionRice is the Malaysian national staple food. Rice is an important commodity in the national food security agenda. Generally, rice industry is cultivated in a small-scale land by traditional farmers. Currently, there are more than 300,000 farmers involved in rice cultivation on 674,928 ha of land areas. Generally, paddy has been cultivated in eight granary areas and mini granary areas throughout the country. Since the country’s
independence, paddy farmers are associated with poverty. For instance, more than 60% of paddy farmers in Muda Agriculture Development Authority (MADA) and Kemubu Agriculture Development Authority (KADA) were living under the poverty line in the 1970s. However, the transformation of paddy industry has changed the farmers’ livelihood. In general, the livelihood of majority of paddy farmers have changed and are
Economic and Technology Management Review, Vol. 8(2013): 59 – 69

60
better-off. However, the paddy farmers are depending on several agriculture activities for their living. Besides being involved in paddy production activities, they are also involved in other agriculture activities such as rubber, cocoa and oil palm industries or are entrepreneurs. The 2008 global food crisis sparked a social unrest in a few Asian countries. Short supply of rice has led to price increase from around USD350/MT to more than USD1,000/MT. The situation became critical as the exporter countries refused to sell their paddy for the interest of their national food security. The global food crisis has led to the transformation of the paddy industry and policy in Malaysia. Most countries strive for sufficient and stable staple food supply within the national production system instead of depending on importation. To increase the local paddy production means to increase the production inputs such as land, infrastructure and work forces. Nevertheless, chief amongst these inputs are farmers. Therefore, the policy has to consider the status of paddy farmers, in particular to meet their livelihood, benchmarked with the national standard of living. The Malaysian government has taken various measures in order to improve the standard of living and income of paddy farmers. These include inputs and price subsidy programmes which have been in place to support and sustain the paddy industry. For instance, the establishment of the irrigation system on nine integrated agriculture development areas was aimed to increase productivity through technical and extension assistance. This resulted in the improvement of farmers’ income; for example, the annual income of farmers in MADA has increased by 15 times from RM1,096 in 1966 to RM15,392 in 2007 (MADA 2008). At the same time, the average production and productivity of farmers has increased significantly from 2.4 metric tonnes/ha in 1970 to 3.9 metric tonnes/ha in 2010. This significant improvement was attributed to the various
factors from cultivation practices, varietal improvement and agronomy practices. Previous study showed that the agriculture sector was unable to sustain the minimum subsistence requirement of a large proportion of the rural population (Jayasuria and Shand 1985). Corner (1981) found that there was a need for the expansion of the off-farm employment as an anti-poverty strategy among paddy farmers in the MADA area. His study was consistent with an FAO report (FAO 1998) in that a farmer has to engage on off-farm activities should he needs to satisfy a minimum subsistence of livelihood. Norsidah (2009) in her investigation on paddy farmers in PBLS found that the involvement of farmers on the off-farm employment was influenced by the socioeconomic factors that includes farmers’ age, gender and number of dependents in the household. She revealed that the older farmers and farmers who have higher number of dependents were found to be involved in off-farm employment. Salam (2010) found that the engagement in the off-farm activities by farmers has led to a negative effect on rice yield, compared to non-engaged farmers. These studies, however, did not specifically indicate whether the off-farm activities will significantly give advantages or disadvantages to farmers. This study aimed to understand the socioeconomic and sustainable income of farmers in the three national granary areas, namely MADA, KADA and Projek Barat Laut Selangor (PBLS) in relation to their standard of living, compared to the national households’ income and expenditure level.
National paddy industryIn 2010, there was a total of 673,745 ha of paddy fields in Malaysia (Table 1), of which more than 50% were planted in eight granary areas in Peninsular Malaysia, 32.3% outside the granary areas and the remaining 10.4% representing the upland paddy, especially in Sabah and Sarawak. Kedah has the biggest paddy fields in Malaysia with

61
Mohd Rashid Rabu and Mohd Dainuri Mohd Shah
Table 1. Total area of paddy, total production, average yields/ha, production value and total imported rice
Item 2005 2006 2007 2008 2009 2010Total paddy area (ha) 440,961 429,805 426,224 426,412 426,031 428,780Total planted area (ha) 666,781 676,074 676,111 656,602 674,928 673,745Total production(‘000 metric tonnes)
2,314 2,187 2,375 2,353 2,511 2,548
Production value(RM’000)
1,272,700 1,421,550 1,543,750 1,764,750 1,883,250 1,911,000
Average yields(kg/ha)
3,471 3,236 3,514 3,584 3,720 3,782
Rice production(‘000 metric tonnes)
1,490 1,407 1,531 1,516 1,620 1,642
Total imported rice(‘000 metric tonnes)
585 843 799 1,093 1,130 935
Source: Annual Report KADA (2011)
an area of 213,193 ha in 2010. The national average yield is about 3.5 t/ha. The average yield in the granary area is 4.2 t/ha, while the average yield of other areas is 3.2 t/ha. Generally, paddy is produced on a small scale of land with an average farm size of 2.5 ha/farmer (Statistics Department 2010). In 2010, there were more than 300,000 farmers involved in paddy cultivation, of which about 40% were fulltime farmers (Man and Sadia 2009). This indicated that majority of the paddy farmers were involved in other economic activities to support their livelihood. According to the World Bank Report, the national paddy industry is inefficient and not productive. The industry was highly subsidized and among the poor sub-sectors in the agriculture sector. The Malaysian government provides many incentives and subsidy programmes to sustain this industry and help the paddy farmers. For example, MARDI generated many viable technologies that produced high yield and quality varieties, improved agronomy practices and production systems and postharvest handling management. The Department of Agriculture (DOA) takes the lead in the distribution of production inputs, and the Farmers
Organization Authority (FOA) provides financial assistant to farmers. Despite undertaking production issues, the government also established the Paddy and Rice Marketing Board to support the post production activities that includes milling and marketing of rice. The board was privatized in 1997 to strengthen their role and named Beras Nasional or BERNAS. BERNAS is also mandated to import and warehousing, distributing and marketing of rice in Malaysia. Generally, the Malaysian rice production was not cost efficient compared to other countries such as Vietnam and Thailand. According to the world rice price published by FAO in Table 2, the selected global rice price is lower than that of the local cost of production. For example, the price of high-quality Thai white fragrance rice in the international market was USD565/metric tonne (RM1,808), which is lower than that of the cost of production of local paddy. The international price of rice was lower than the average production costs in Malaysia. A study by MARDI in 2008 revealed that the average production cost in Malaysia was RM1,518 – RM3,079 in granary areas. Furthermore, the productivity/
62
farm size is relatively low. The average total productivities of the major granary areas are 1.56 in MADA; 1.80 in KADA and 1.92 in PBLS while the overall total productivity (TP) was 1.76. According to a study by MARDI in 2008, there is a stagnant level of land productivity in KADA and declining land productivity in MADA (MARDI 2010). The increase in production costs and stagnancy of productivity will reduce the farmer’s income and at the same time will affect the farmers’ livelihood and living standard.
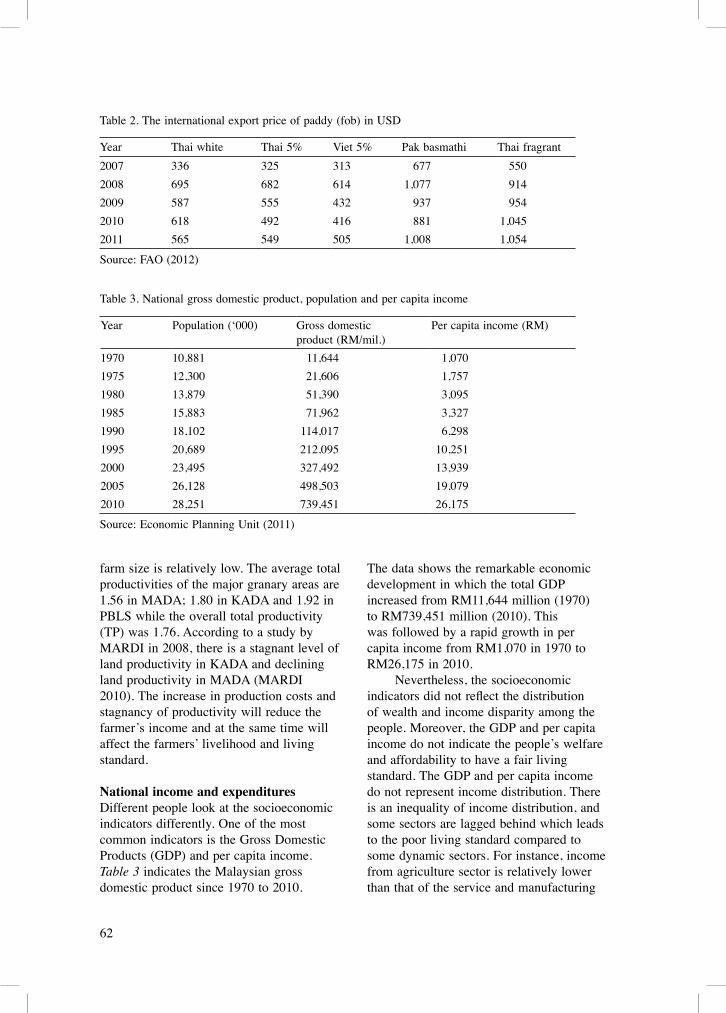
National income and expendituresDifferent people look at the socioeconomic indicators differently. One of the most common indicators is the Gross Domestic Products (GDP) and per capita income. Table 3 indicates the Malaysian gross domestic product since 1970 to 2010.
The data shows the remarkable economic development in which the total GDP increased from RM11,644 million (1970) to RM739,451 million (2010). This was followed by a rapid growth in per capita income from RM1,070 in 1970 to RM26,175 in 2010. Nevertheless, the socioeconomic indicators did not reflect the distribution of wealth and income disparity among the people. Moreover, the GDP and per capita income do not indicate the people’s welfare and affordability to have a fair living standard. The GDP and per capita income do not represent income distribution. There is an inequality of income distribution, and some sectors are lagged behind which leads to the poor living standard compared to some dynamic sectors. For instance, income from agriculture sector is relatively lower than that of the service and manufacturing
Table 2. The international export price of paddy (fob) in USD
Year Thai white Thai 5% Viet 5% Pak basmathi Thai fragrant2007 336 325 313 677 5502008 695 682 614 1,077 9142009 587 555 432 937 9542010 618 492 416 881 1,0452011 565 549 505 1,008 1,054
Source: FAO (2012)
Table 3. National gross domestic product, population and per capita income
Year Population (‘000) Gross domesticproduct (RM/mil.)
Per capita income (RM)
1970 10,881 11,644 1,0701975 12,300 21,606 1,7571980 13,879 51,390 3,0951985 15,883 71,962 3,3271990 18,102 114,017 6,2981995 20,689 212,095 10,2512000 23,495 327,492 13,9392005 26,128 498,503 19,0792010 28,251 739,451 26,175
Source: Economic Planning Unit (2011)

63
Mohd Rashid Rabu and Mohd Dainuri Mohd Shah
sectors. Although the absolute poverty level in Malaysia has been reduced to below 3%, nevertheless, the relative urban and rural households’ income distribution reflected the incidence of income inequality.
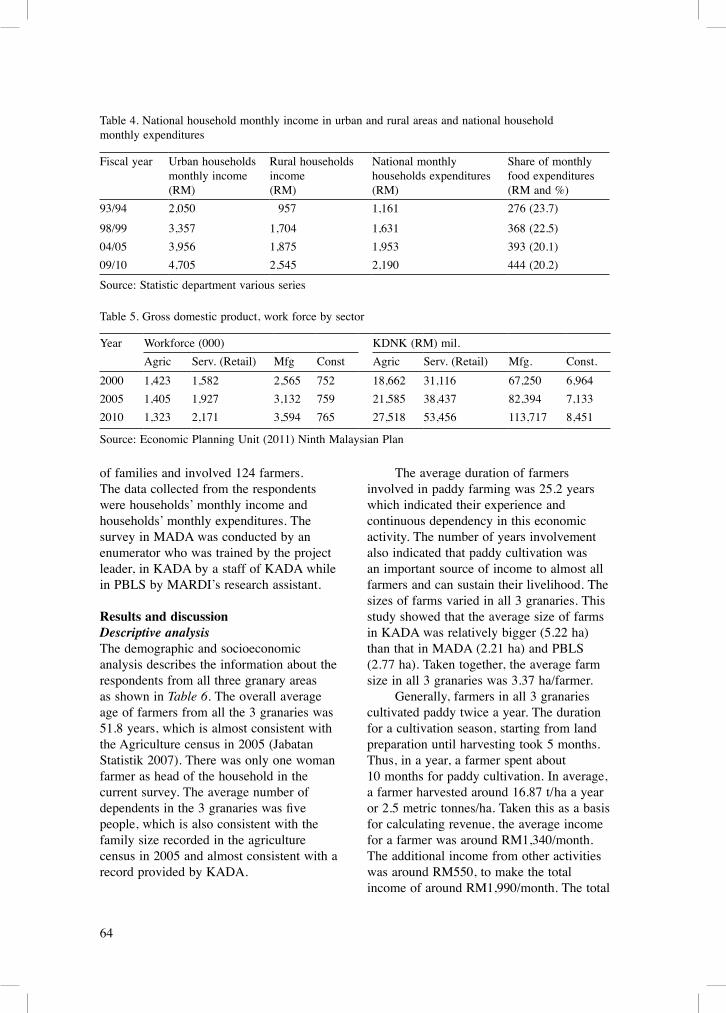
Households income and expenditure status Generally, the household income of the people in Malaysia had increased tremendously in the urban and rural areas. Nevertheless, the urban population received higher improvement compared to the rural one. Figure 1 indicates the household income of the urban population increased from RM264 in 1970 to RM4,025 in 2009. At the same time, the income of the rural people had increased from RM160 in 1970 to only RM2,545 in 2009, about half of the income of the urban population. This indicates the income disparity between urban and rural people. Meanwhile, Table 4 indicates the national households monthly expenditure continued to increase from RM1,161 in 93/94 to RM2,190 in 09/10. In summary, the rural households are vulnerable to the risk of the economic downturn and crisis, in particular, the
increasing living cost and the declining of agriculture commodity prices. The lower income offered by the agriculture activities has resulted in lower supply of labour force. Table 5 indicates the declining number of workforce in the agriculture sector from 1.4 million in 2000 to 1.3 million in 2010. Contrarily, there was an increase in number of work force in more dynamic sectors such as service and retailing (from 1.5 million in 2000 to 2.1 million in 2010) and the manufacturing sector work force (from 2.5 million in 2000 to 3.5 million in 2010).
MethodologyThe data used for this study were collected from both secondary and primary sources that includes government statistical reports, previous studies and a survey conducted in 3 granary areas in Peninsular Malaysia. The data were analysed in order to determine the status of the paddy farmers’ living standard and well being compared to the national households’ per capita income and expenditures. Surveys were conducted in 3 granary areas of MADA, KADA and PBLS 2012. The respondents were the heads
Figure 1. National household monthly income (RM)
0
500
1000
1500
2000
2500
3000
3500
4000
4500
200920072004200219991997199519921989198719841979197619741970
64
Table 4. National household monthly income in urban and rural areas and national household monthly expenditures
Fiscal year Urban households monthly income (RM)
Rural householdsincome(RM)
National monthly households expenditures(RM)
Share of monthly food expenditures (RM and %)
93/94 2,050 957 1,161 276 (23.7)
98/99 3,357 1,704 1,631 368 (22.5)04/05 3,956 1,875 1,953 393 (20.1)09/10 4,705 2,545 2,190 444 (20.2)
Source: Statistic department various series
Table 5. Gross domestic product, work force by sector
Year Workforce (000) KDNK (RM) mil.Agric Serv. (Retail) Mfg Const Agric Serv. (Retail) Mfg. Const.
2000 1,423 1,582 2,565 752 18,662 31,116 67,250 6,9642005 1,405 1,927 3,132 759 21,585 38,437 82,394 7,1332010 1,323 2,171 3,594 765 27,518 53,456 113,717 8,451
Source: Economic Planning Unit (2011) Ninth Malaysian Plan
of families and involved 124 farmers. The data collected from the respondents were households’ monthly income and households’ monthly expenditures. The survey in MADA was conducted by an enumerator who was trained by the project leader, in KADA by a staff of KADA while in PBLS by MARDI’s research assistant.
Results and discussionDescriptive analysisThe demographic and socioeconomic analysis describes the information about the respondents from all three granary areas as shown in Table 6. The overall average age of farmers from all the 3 granaries was 51.8 years, which is almost consistent with the Agriculture census in 2005 (Jabatan Statistik 2007). There was only one woman farmer as head of the household in the current survey. The average number of dependents in the 3 granaries was five people, which is also consistent with the family size recorded in the agriculture census in 2005 and almost consistent with a record provided by KADA.
The average duration of farmers involved in paddy farming was 25.2 years which indicated their experience and continuous dependency in this economic activity. The number of years involvement also indicated that paddy cultivation was an important source of income to almost all farmers and can sustain their livelihood. The sizes of farms varied in all 3 granaries. This study showed that the average size of farms in KADA was relatively bigger (5.22 ha) than that in MADA (2.21 ha) and PBLS (2.77 ha). Taken together, the average farm size in all 3 granaries was 3.37 ha/farmer. Generally, farmers in all 3 granaries cultivated paddy twice a year. The duration for a cultivation season, starting from land preparation until harvesting took 5 months. Thus, in a year, a farmer spent about 10 months for paddy cultivation. In average, a farmer harvested around 16.87 t/ ha a year or 2.5 metric tonnes/ha. Taken this as a basis for calculating revenue, the average income for a farmer was around RM1,340/month. The additional income from other activities was around RM550, to make the total income of around RM1,990/month. The total

65
Mohd Rashid Rabu and Mohd Dainuri Mohd Shah
Table 6. Summary of farmers’ demographic information
Age Total N Average Min Max SDPBLS 40 50.03 35 78 9.88MADA 43 50.0 26 73 10.26KADA 40 52.5 20 76 13.5Overall 123 51.8 20 78 11.3Gender Total N Male FemalePBLS 40 40 0MADA 43 43 0KADA 40 39 1Overall 123 122 1No. of dependents Average Min Max SDPBLS 5.53 1 9 1.85MADA 4.84 1 5 1.31KADA 5.10 1 9 1.23Overall 5.15 1 9 1.53No. of years in agriculture activities
Average Min Max SD
PBLS 27.6 5 60 13.49MADA 23.4 3 50 14.03KADA 24.5 3 46 12.68Overall 25.2 2 60 13.4Farm size (ha) Average Min Max SDPBLS 2.77 1 9.1 1.54MADA 2.21 1 10 1.72KADA 5.22 1 12.1 2.83Overall 3.37 1 12.1 2.46Yields (MT/year) Average Min Max SDPBLS 18.4 5.0 75.9 12.22MADA 11.9 1.5 56.0 10.96KADA 20.5 1.2 78.2 18.13Overall 16.87 1.2 78.2 14.43Income from paddy Average
(RM/month)Min (RM) Max (RM) SD
PBLS 1,401 500 7,000 1,110.2MADA 1,267 250 7,000 1,214.27KADA 1,358 350 3,000 723.62Overall 1,342 250 7,000 1,046.98
(cont.)

66
Other source of income
Average(RM/month)
Min (RM) Max (RM) SD
PBLS 600 260 764 160.3MADA 300 180 539 130.7KADA 350 170 450 140.6Overall 551 170 764 143.86Householdsexpenditure for food
Average(RM/month)
Min (RM) Max (RM) SD
PBLS 625.5 120.0 2,000 317.2MADA 590.4 250.0 1,500 277.2KADA 578.7 100.0 1,200 286.8Overall 598.1 100.0 2,000 292.2
Table 6 (cont.)
income was higher than that of the national poverty level that is RM750/month.
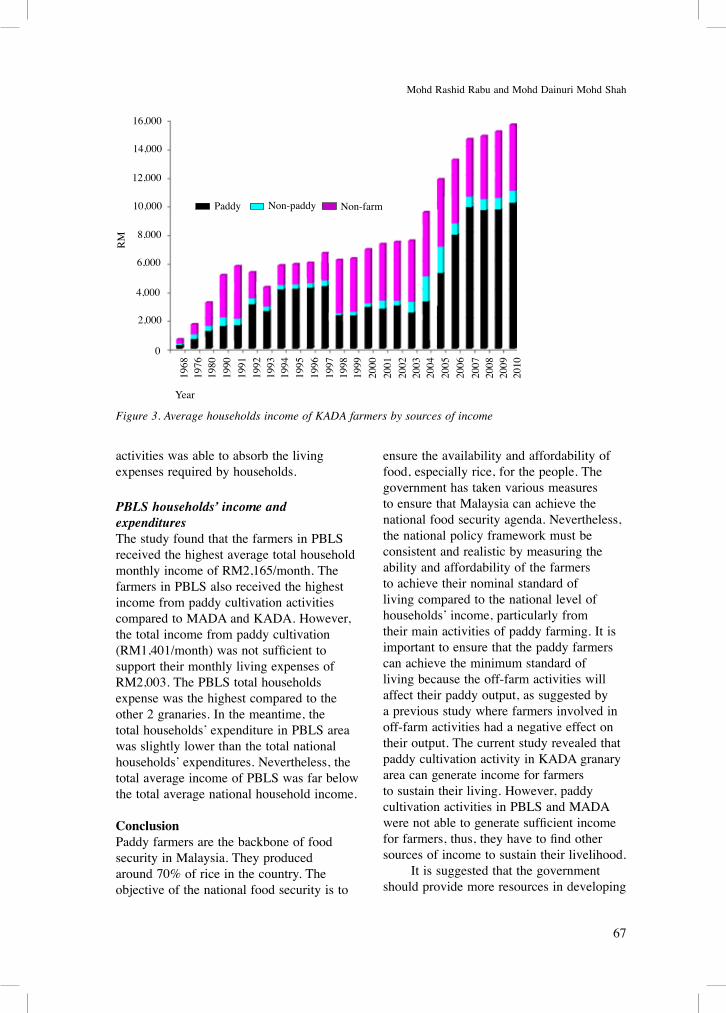
KADA households income and distributionThe data provided by KADA indicated that there was a progressive increase in the total income of the KADA farmers since 1968. The total annual income of KADA farmers had improved from RM647 in 1968 to RM15,674 in 2010 (Figure 3). Generally, there were 3 sources of income for farmers in KADA – from cultivation of paddy, non-paddy agriculture activities and off-farm economic activities such as working as a driver, shop assistant and other activities. The changing structure of source of the income started in 2005 where income from paddy cultivation was more than that of the off-farm (Figure 3). The income from paddy cultivation increased from 44.8% in 2005 to 65.2% in 2010 (KADA 2012), which indicated the significant contribution to farmers’ livelihood. Nevertheless, the total monthly income of paddy farmers was still far below the annual national household income level which is RM48,300 a year or RM4,025/month in 2010. This study found that the average monthly income of a farmer in KADA was RM1,708/month of which income from paddy contributes around RM1,340/month
(Figure 2). However, the total expenditure of farmers in KADA was RM1,140 which indicated that the paddy income can support the KADA farmers’ livelihood.
MADA households income and distributionThis study found that the paddy farmers in MADA area received an average income of RM1,806/month, of which RM1,267/month comes from paddy cultivation. The study also showed that the average monthly expenses for food, utilities, transportation, education and health was RM1,575/month. Thus, this study indicated that the income for paddy cultivation in MADA was unable to cover farmers monthly expenses. However, the income from other economic
Figure 2. Total household monthly income, household expenditures and income from paddy
Total incomeExpendituresPaddy
4,5004,0003,5003,0002,500
PBLS MADA KADA National
2,0001,500
1,000500
0
RM
67
Mohd Rashid Rabu and Mohd Dainuri Mohd Shah
Figure 3. Average households income of KADA farmers by sources of income
activities was able to absorb the living expenses required by households.
PBLS households’ income and expendituresThe study found that the farmers in PBLS received the highest average total household monthly income of RM2,165/month. The farmers in PBLS also received the highest income from paddy cultivation activities compared to MADA and KADA. However, the total income from paddy cultivation (RM1,401/month) was not sufficient to support their monthly living expenses of RM2,003. The PBLS total households expense was the highest compared to the other 2 granaries. In the meantime, the total households’ expenditure in PBLS area was slightly lower than the total national households’ expenditures. Nevertheless, the total average income of PBLS was far below the total average national household income.
ConclusionPaddy farmers are the backbone of food security in Malaysia. They produced around 70% of rice in the country. The objective of the national food security is to
ensure the availability and affordability of food, especially rice, for the people. The government has taken various measures to ensure that Malaysia can achieve the national food security agenda. Nevertheless, the national policy framework must be consistent and realistic by measuring the ability and affordability of the farmers to achieve their nominal standard of living compared to the national level of households’ income, particularly from their main activities of paddy farming. It is important to ensure that the paddy farmers can achieve the minimum standard of living because the off-farm activities will affect their paddy output, as suggested by a previous study where farmers involved in off-farm activities had a negative effect on their output. The current study revealed that paddy cultivation activity in KADA granary area can generate income for farmers to sustain their living. However, paddy cultivation activities in PBLS and MADA were not able to generate sufficient income for farmers, thus, they have to find other sources of income to sustain their livelihood. It is suggested that the government should provide more resources in developing
1968
1976
1980
1990
1991
1992
1993
1994
1995
1996
1997
1998
1999
2000
2001
2002
2003
2004
2005
2006
2007
2008
2009
2010
Year
RM
0
2,000
4,000
6,000
8,000
10,000
12,000
14,000
16,000
Non-farmNon-paddyPaddy

68
the areas so that the cost of inputs and living cost is low. The study revealed that in terms of cost of living, KADA offers the best location because the production cost is still low and the productivity and technical efficiency is still not optimized based on a previous study by MARDI. In addition, it is important to consider the balance between the farm’s income improvement and the low living costs which will enable farmers to have a comfortable living standard and can stimulate their interest to remain in the farm and agriculture sector. Thus, it is important for the government to ensure that the national agenda of food security can be realised in the near future.
BibliographyAlam, M., Chamhuri. S, Wahid, M., Molla, R.I.,
and Mohd Ekhwan, T. (2010). Socioeconomic profile of farmers in Malaysia: study on integrated agricultural development area in North-West Selangor. Agricultural Economics and Rural Development 7(2): 249 – 260
Alam, M., Chamsuri, S., Basri. T. and Mohd Ekhwan, T. (2011).The relationships between the socio-economic profile of farmers and paddy productivity in North-West Selangor, Malaysia. Asia-Pacific Development Journal 8(1): 161 – 173
Anon. (2005). Banci pertanian 2005, Jabatan Perangkaan, Malaysia, Putrajaya
–––– (2007). Laporan bancian perbelanjaan isi rumah pelbagai siri. Jabatan Statistik Malaysia, Putrajaya
Corner, L. (1981). The impact of rural outmigration: labour supply and cultivation techniques in a double cropped paddy area, West Malaysia. PhD thesis, Macquarie University, Sydney
DOS (2005). Banci Pertanian, 2005. Jabatan Perangkaan, Malaysia, Putrajaya
EPU (1976). Third Malaysian Plan (1976 – 1980). Prime Minister’s Department. Kuala Lumpur
–––– (2011). Ninth Malaysian Plan 2006 – 2010, Prime Minister’s Department, Putrajaya
FAO (1998). Rural non-farm income in developing countries. The state of food and agriculture. Rome: FAO
–––– (2012). FAO rice price. Retrieved on 12 February from http:www.fao.org/…/rice-publication/the-fao-rice-price-update/en
Jayasuriya, S.K. and Shand, R.T. (1985). Technical change and labour absorption in Asian agriculture: some recent trends. World Development 14(3): 415 – 428
KADA (2012). Laporan Tahunan, Lembaga Kemajauan Pertanian Kemubu
MADA (2008). Laporan Tahunan, Lembaga Kemajuan Pertanian Muda. Retrieved on 15 March 2013 from http: www.mada.gov.my
MARDI (2010). Produktiviti dan kecekapan sektor pertanian dan industri pemprosesan makanan terpilih (2009/2010). Serdang: MARDI
Norsidah, M. (2009). Off-farm employment participation among paddy farmers in The Muda Agriculture Development Authority and Kemasin Semarak Granary Areas of Malaysia. Pertanika Journal of Social Science and Humanities 17(1): 1 – 16
Norsidah, M. and Sadiya, S.I. (2009). Off-farm employment participation among paddy farmers in the MUDA Agricultural Development Authority and Kemasin Semerak Granary areas of Malaysia. Asia-Pacific Development Journal 16(2): 141 – 153
Pio Lopez, G. (2007). Economic reforms for paddy sub-sector. Retrieved on 25 June from http:// biz.the com.my/news/story.asp?file
Siti Hadijah, C.H. and Roslan. A.H. (2011). Does farmer’s diversification into non-farm employment reduce their likelihood of poverty? Evidence from Malaysia. Journal of Business and Policy Research 6(1): 145 – 155

69
Mohd Rashid Rabu and Mohd Dainuri Mohd Shah
AbstrakDasar Jaminan Makanan Negara menyasarkan untuk meningkatkan tahap sara diri pengeluaran beras negara daripada 70% pada tahun 2010 kepada 85% menjelang tahun 2015. Ini dijangka akan dapat mengurangkan import beras negara daripada 30% kepada 15% menjelang tahun 2015. Untuk mencapai sasaran berkenaan, Malaysia perlu mengeluarkan sejumlah 2.50 juta tan metrik padi setahun. Kini terdapat hampir sejumlah 300,000 petani padi dan 40% daripadanya ialah petani padi sepenuh masa. Mereka merupakan tulang belakang bagi mencapai sasaran jaminan bekalan makanan negara. Di sebalik langkah untuk mencapai sasaran jaminan bekalan makanan negara, status tahap sara diri petani padi dan hubungannya dengan kedudukan sosioekonomi dan keupayaan petani untuk mencapai perbelanjaan seimbang isi rumah melalui aktiviti utama ekonomi perlu dikenal pasti. Kajian ini mengkaji status tahap sara diri petani melalui petunjuk pendapatan bulanan isi rumah dan perbelanjaan bulanan isi rumah berbanding dengan pendapatan dan perbelanjaan bulanan isi rumah kebangsaan. Kajian mendapati pendapatan bulanan isi rumah petani di tiga kawasan jelapang padi utama negara iaitu Projek Barat Laut Selangor (PBLS), Lembaga Kemajuan Pertanian Muda (MADA) dan Lembaga Kemajuan Pertanian Kemubu (KADA) melebihi aras kemiskinan negara, namun bawah aras pendapatan bulanan isi rumah kebangsaan. Pendapatan daripada aktiviti penanaman padi tidak dapat menampung keperluan perbelanjaan bulanan isi rumah petani di kawasan PBLS dan MADA. Namun begitu, petani padi di kawasan KADA berada dalam keadaan lebih selesa kerana pendapatan daripada aktiviti penanaman padi mampu menampung keperluan perbelanjaan bulanan isi rumah. Kos sara hidup di kawasan KADA secara relatifnya lebih rendah berbanding dengan dua kawasan lain. Petani di PBLS dan MADA memerlukan pendapatan tambahan daripada aktiviti bukan padi. KADA menyediakan ruang kehidupan yang lebih selesa kepada petani dari segi pendapatan dan perbelanjaan sara hidup. Selain itu, kos pengeluaran yang rendah menjadikan kawasan KADA berpontensi dibangunkan secara lebih intensif sebagai sumber bekalan beras negara.