fomc 20061025 blue book 20061019
TRANSCRIPT

Content last modified 02/09/2012.
Prefatory Note The attached document represents the most complete and accurate version available based on original files from the FOMC Secretariat at the Board of Governors of the Federal Reserve System. Please note that some material may have been redacted from this document if that material was received on a confidential basis. Redacted material is indicated by occasional gaps in the text or by gray boxes around non-text content. All redacted passages are exempt from disclosure under applicable provisions of the Freedom of Information Act.

CLASS I FOMC - RESTRICTED CONTROLLED (FR)
OCTOBER 19, 2006
MONETARY POLICY ALTERNATIVES
PREPARED FOR THE FEDERAL OPEN MARKET COMMITTEE BY THE STAFF OF THE BOARD OF GOVERNORS OF THE FEDERAL RESERVE SYSTEM

Class I FOMC - Restricted Controlled (FR) October 19, 2006
MONETARY POLICY ALTERNATIVES
Recent Developments
(1) The FOMC’s decision at its September meeting to leave the federal funds
rate target unchanged at 5¼ percent was largely anticipated by financial market
participants. Similarly, the wording of the accompanying statement roughly matched
the market consensus, leaving the expected path of interest rates little changed in
response. 1 Over the intermeeting period, investors remained virtually certain that the
federal funds rate target would hold steady for the remainder of this year.
Expectations for policy further ahead, though, moved as much as 30 basis points
lower early in the period in response to a few data releases with a weakish cast. In
recent weeks, however, those declines were rolled back in the wake of speeches by
FOMC members and the minutes of the September meeting—which were reportedly
read as emphasizing the risks to inflation—as well as stronger-than-expected
economic data. The market response to these releases was probably heightened by
the monetary policy communications. Futures quotes currently indicate that investors
expect about 50 basis points of easing during 2007, about what had been anticipated
before the September meeting (Chart 1). Respondents to the Desk’s survey of
primary dealers also expect the FOMC to ease policy during 2007, although by
somewhat less than implied by futures market quotes. Investors became a bit more
confident in their expectations about monetary policy in that the implied probability
distribution for the federal funds rate from options on Eurodollar futures contracts
maturing in about six months narrowed further, with about 20 percent probability
1 The effective federal funds rate averaged near its intended level over the intermeeting period. The Desk purchased $1½ billion of Treasury coupon securities in the market and redeemed $3¾ billion of coupon securities. The volume of outstanding long-term RPs increased by $2 billion.
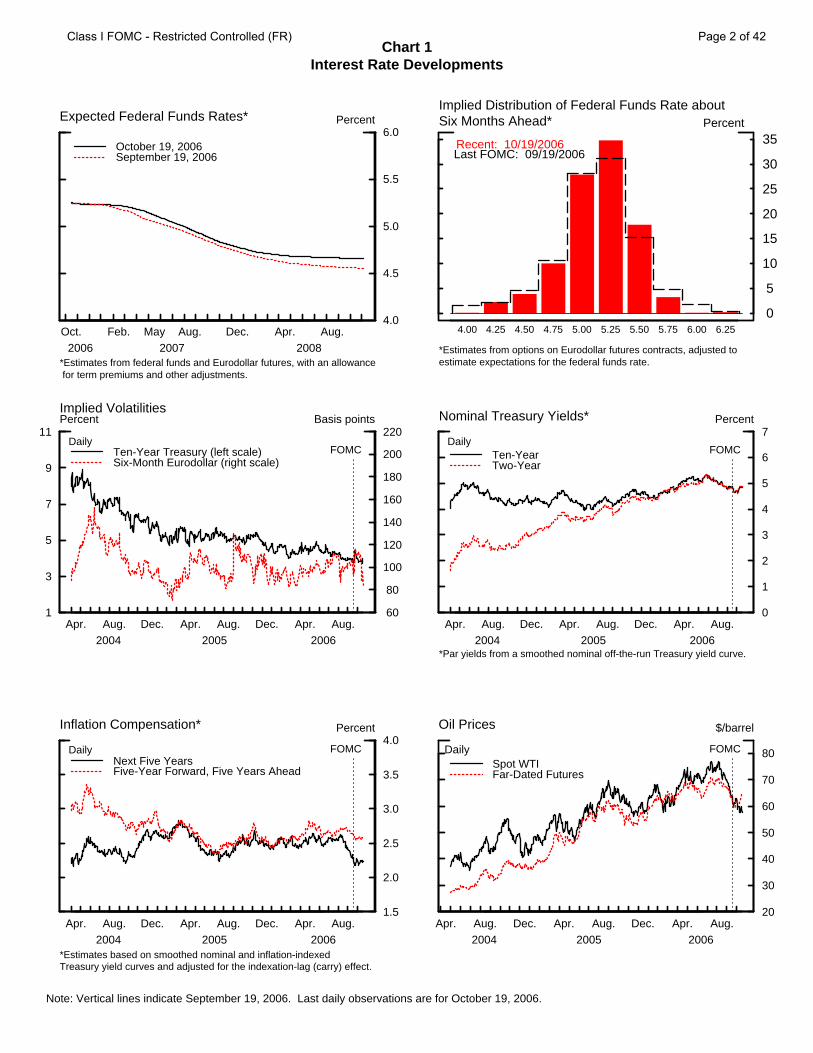
Chart 1Interest Rate Developments
Note: Vertical lines indicate September 19, 2006. Last daily observations are for October 19, 2006.
Oct. Feb. May Aug. Dec. Apr. Aug.2006 2007 2008
4.0
4.5
5.0
5.5
6.0Percent
October 19, 2006September 19, 2006
Expected Federal Funds Rates*
*Estimates from federal funds and Eurodollar futures, with an allowance for term premiums and other adjustments.
Implied Distribution of Federal Funds Rate about Six Months Ahead*
4.00 4.25 4.50 4.75 5.00 5.25 5.50 5.75 6.00 6.25
Recent: 10/19/2006 Last FOMC: 09/19/2006
0
5
10
15
20
25
30
35Percent
*Estimates from options on Eurodollar futures contracts, adjusted to estimate expectations for the federal funds rate.
1
3
5
7
9
11
Apr. Aug. Dec. Apr. Aug. Dec. Apr. Aug.2004 2005 2006
60
80
100
120
140
160
180
200
220Percent Basis points
Ten-Year Treasury (left scale)Six-Month Eurodollar (right scale)
Implied Volatilities
DailyFOMC
Apr. Aug. Dec. Apr. Aug. Dec. Apr. Aug.2004 2005 2006
0
1
2
3
4
5
6
7Percent
Ten-YearTwo-Year
Nominal Treasury Yields*
Daily
*Par yields from a smoothed nominal off-the-run Treasury yield curve.
FOMC
Apr. Aug. Dec. Apr. Aug. Dec. Apr. Aug.2004 2005 2006
1.5
2.0
2.5
3.0
3.5
4.0Percent
Next Five YearsFive-Year Forward, Five Years Ahead
Inflation Compensation*
Daily
*Estimates based on smoothed nominal and inflation-indexedTreasury yield curves and adjusted for the indexation-lag (carry) effect.
FOMC
Apr. Aug. Dec. Apr. Aug. Dec. Apr. Aug.2004 2005 2006
20
30
40
50
60
70
80
$/barrel
Spot WTIFar-Dated Futures
Daily FOMC
Oil Prices
Class I FOMC - Restricted Controlled (FR) Page 2 of 42
weight now being placed on tightening and 45 percent being placed on easing by then.
Forward-looking implied volatilities derived from longer-term interest rate derivatives
also remain near historical lows (see box on following page).
(2) Yields on nominal and inflation-indexed Treasury coupon securities rose
slightly, on net, over the intermeeting period. Inflation compensation for next year
declined modestly, likely reflecting a further fall in spot energy prices, but was largely
unchanged at longer maturities. Survey data pointed to a decline in household short-
term inflation expectations. Trading conditions in the Treasury securities market
remained healthy despite reports of substantial liquidations of short positions in
Treasury issues by some large hedge funds (Chart 2). Similarly, the winding down of
Amaranth, a hedge fund that posted losses in excess of $6 billion in energy trading
and that had positions in several other markets, left no discernible imprint on the
functioning of markets.
(3) Broad equity indexes rose 4 to 5 percent over the intermeeting period.
Investor optimism was reportedly buoyed by a relative paucity of profit warnings
ahead of scheduled third-quarter earnings announcements and, in the event, by
aggregate earnings news that has thus far outstripped expectations with about one-
fifth of the S&P 500 firms having reported; analysts’ estimates now suggest that
earnings for the third quarter will come in 15 percent above the levels of a year ago.
The drop in oil prices may also have supported share values. Equity implied
volatilities remain near historical lows. Spreads of investment-grade corporate bond
yields over those on comparable Treasury securities held steady, while those on
speculative-grade corporate bonds narrowed a little. Corporate credit quality
remained solid, with expected and realized bond default rates staying very low.
(4) The trade-weighted index of the dollar versus major foreign currencies rose
about 1 percent on balance over the intermeeting period, with the gains spread evenly
Class I FOMC - Restricted Controlled (FR) Page 3 of 42
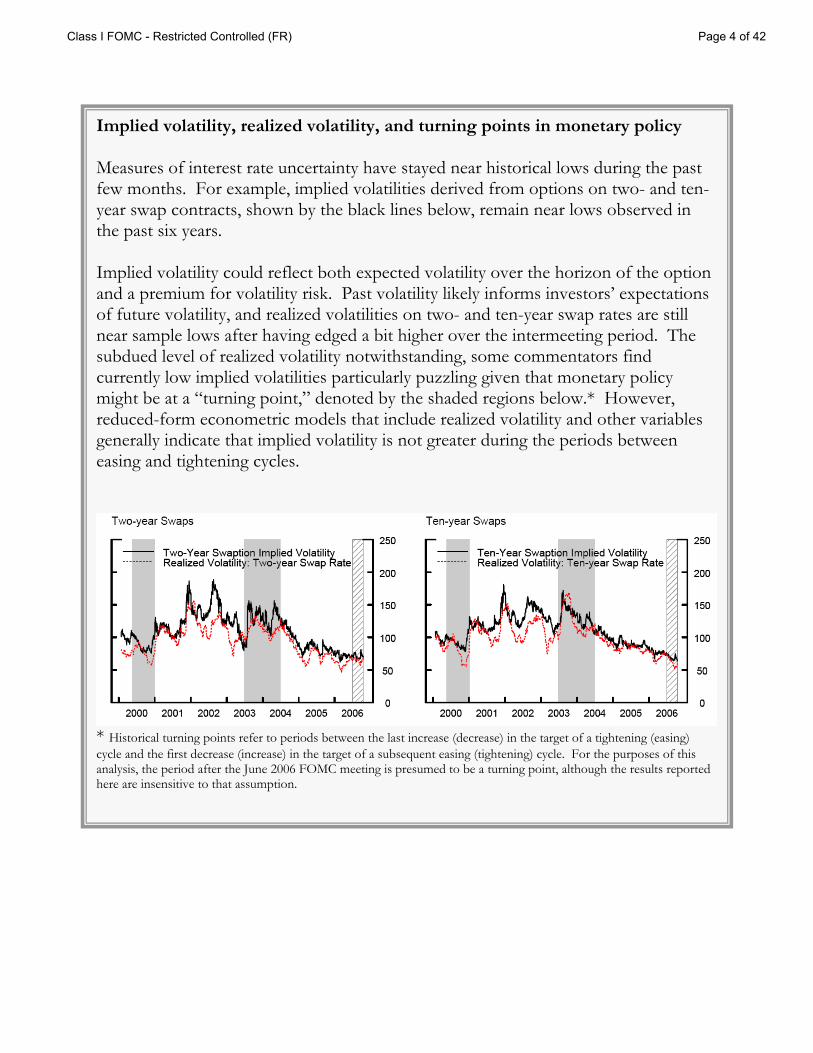
Implied volatility, realized volatility, and turning points in monetary policy Measures of interest rate uncertainty have stayed near historical lows during the past few months. For example, implied volatilities derived from options on two- and ten-year swap contracts, shown by the black lines below, remain near lows observed in the past six years. Implied volatility could reflect both expected volatility over the horizon of the option and a premium for volatility risk. Past volatility likely informs investors’ expectations of future volatility, and realized volatilities on two- and ten-year swap rates are still near sample lows after having edged a bit higher over the intermeeting period. The subdued level of realized volatility notwithstanding, some commentators find currently low implied volatilities particularly puzzling given that monetary policy might be at a “turning point,” denoted by the shaded regions below.* However, reduced-form econometric models that include realized volatility and other variables generally indicate that implied volatility is not greater during the periods between easing and tightening cycles.
* Historical turning points refer to periods between the last increase (decrease) in the target of a tightening (easing) cycle and the first decrease (increase) in the target of a subsequent easing (tightening) cycle. For the purposes of this analysis, the period after the June 2006 FOMC meeting is presumed to be a turning point, although the results reported here are insensitive to that assumption.
Class I FOMC - Restricted Controlled (FR) Page 4 of 42

Chart 2Asset Market Developments
Note: Vertical lines indicate September 19, 2006. Last daily observations are for October 19, 2006.
Jan. Mar. May July Sept.2006
0
50
100
150
200
250
300Billions
Daily Total Trading Volume in Two-, Five-, and Ten-year Treasury On-the-Run Notes
Source. BrokerTec Interdealer Market Data. Total interdealer market volume estimated from ICAP volume and market share.
Apr. Sept. Feb. July Dec. May Oct.2004 2005 2006
90
100
110
120
130
140Index(12/31/03=100)
WilshireFOMC
Stock Prices
Daily
1989 1992 1995 1998 2001 2004-30
-20
-10
0
10
20
30
S&P 500 EPSNIPA, economicprofits before tax
Quarterly*
Corporate Earnings Growth Percent
*Change from four quarters earlier. Source. I/B/E/S for S&P 500 EPS.
pQ3
Q2
Apr. Aug. Dec. Apr. Aug. Dec. Apr. Aug.2004 2005 2006
0
10
20
30
40Percent
S&P 500Nasdaq
Implied Volatilities
DailyFOMC
80
120
160
200
240
280
Apr. Sept. Feb. July Dec. May Oct.2004 2005 2006
0
125
250
375
500
625
750
Basis points Basis points
Ten-Year BBB (left scale)Five-Year High-Yield (right scale)
FOMC
Corporate Bond Spreads*
Daily
*Measured relative to an estimated off-the-run Treasury yield curve.
0
1
2
3
4
5
6
1990 1993 1996 1999 2002 2005
0.0
0.5
1.0
1.5
2.0
2.5Percent of Outstandings Percent of Liabilities
Bond Default Rates(left scale)*Expected Year-Ahead Defaults (right scale)**
Corporate Default Rates
Monthly
*6-month moving average, from Moody’s Investors Service.**Firm-level estimates of default weighted by firm liabilities as a percentof total liabilities, excluding defaulted firms. Source. Moody’s KMV.
Class I FOMC - Restricted Controlled (FR) Page 5 of 42

against most currencies (Chart 3).2 Both nominal and real yields on long-term
government bonds in foreign industrial countries moved roughly in tandem with
those on comparable U.S. securities. Major foreign stock markets also recorded gains
similar to those in the United States. On October 5, the European Central Bank
raised its main policy rate 25 basis points, the fifth such increase in the present round
of tightening.
(5) The dollar was down slightly over the intermeeting period against an index
of currencies of our other important trading partners, led by declines of 2 and
1 percent against the Brazilian real and the Mexican peso, respectively. Stock prices in
most Latin American and Asian markets recorded solid gains over the period. Prices
of Thai financial assets dropped after the September 19th coup, but they ended the
period higher on balance. More recently, South Korean equity prices fell somewhat
on news of the nuclear test in North Korea and have since only partially recovered.
(6) Domestic nonfinancial sector debt is estimated to have expanded at an
annual rate of 6½ percent in the third quarter, in line with the second-quarter pace, as
a pickup in government debt growth was likely offset by a moderation in business and
household debt growth (Chart 4). Consumer credit slowed noticeably over the
summer, and mortgage debt growth is anticipated to have dropped further in the third
quarter, owing largely to an expected further deceleration in house prices. In the
business sector, growth in C&I loans weakened substantially in September but was
quite strong for the third quarter as a whole. Bank lending to businesses through
commercial real estate loans slowed during August and September, a pattern
consistent with results from the October Senior Loan Officer Opinion Survey, which
indicated a weakening of demand and a tightening of credit standards for such loans.
2
Class I FOMC - Restricted Controlled (FR) Page 6 of 42
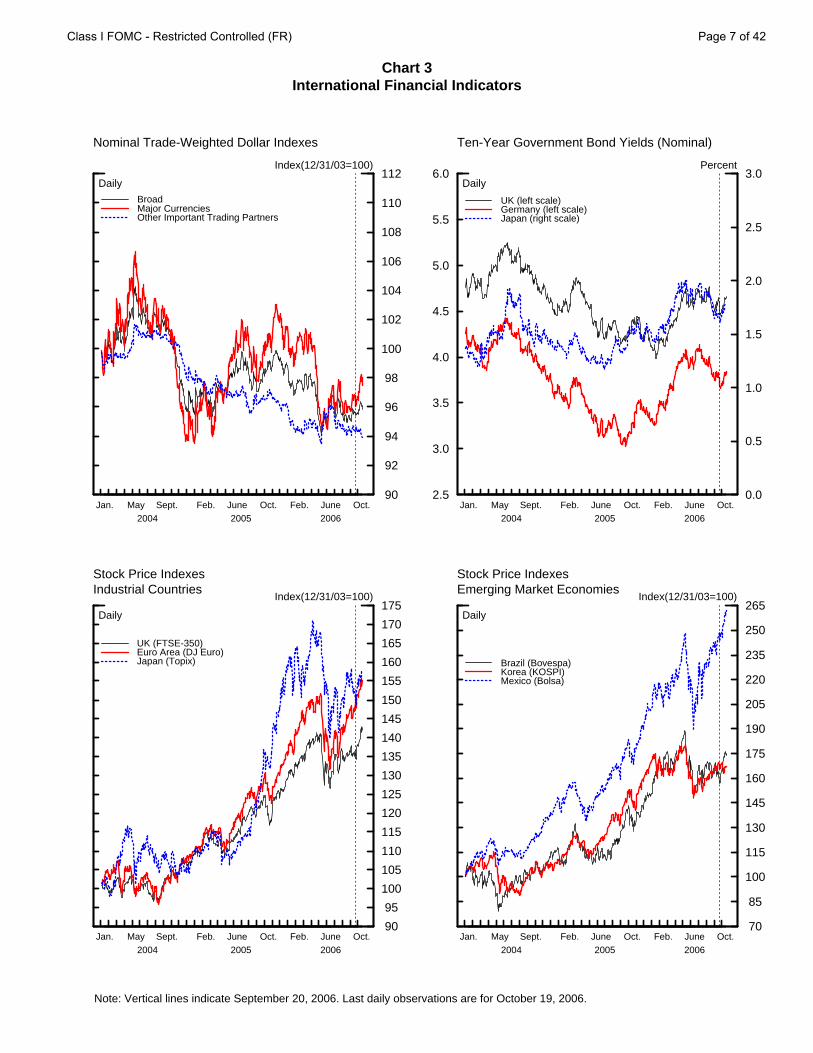
Chart 3International Financial Indicators
Note: Vertical lines indicate September 20, 2006. Last daily observations are for October 19, 2006.
Jan. May Sept. Feb. June Oct. Feb. June Oct.2004 2005 2006
90
92
94
96
98
100
102
104
106
108
110
112
BroadMajor CurrenciesOther Important Trading Partners
Nominal Trade-Weighted Dollar Indexes
Daily
Index(12/31/03=100)
2.5
3.0
3.5
4.0
4.5
5.0
5.5
6.0
Jan. May Sept. Feb. June Oct. Feb. June Oct.2004 2005 2006
0.0
0.5
1.0
1.5
2.0
2.5
3.0
UK (left scale)Germany (left scale)Japan (right scale)
Ten-Year Government Bond Yields (Nominal)
Daily
Percent
Jan. May Sept. Feb. June Oct. Feb. June Oct.2004 2005 2006
90
95
100
105
110
115
120
125
130
135
140
145
150
155
160
165
170
175
UK (FTSE-350)Euro Area (DJ Euro)Japan (Topix)
Stock Price IndexesIndustrial Countries
Daily
Index(12/31/03=100)
Jan. May Sept. Feb. June Oct. Feb. June Oct.2004 2005 2006
70
85
100
115
130
145
160
175
190
205
220
235
250
265
Brazil (Bovespa)Korea (KOSPI)Mexico (Bolsa)
Stock Price IndexesEmerging Market Economies
Daily
Index(12/31/03=100)
Class I FOMC - Restricted Controlled (FR) Page 7 of 42
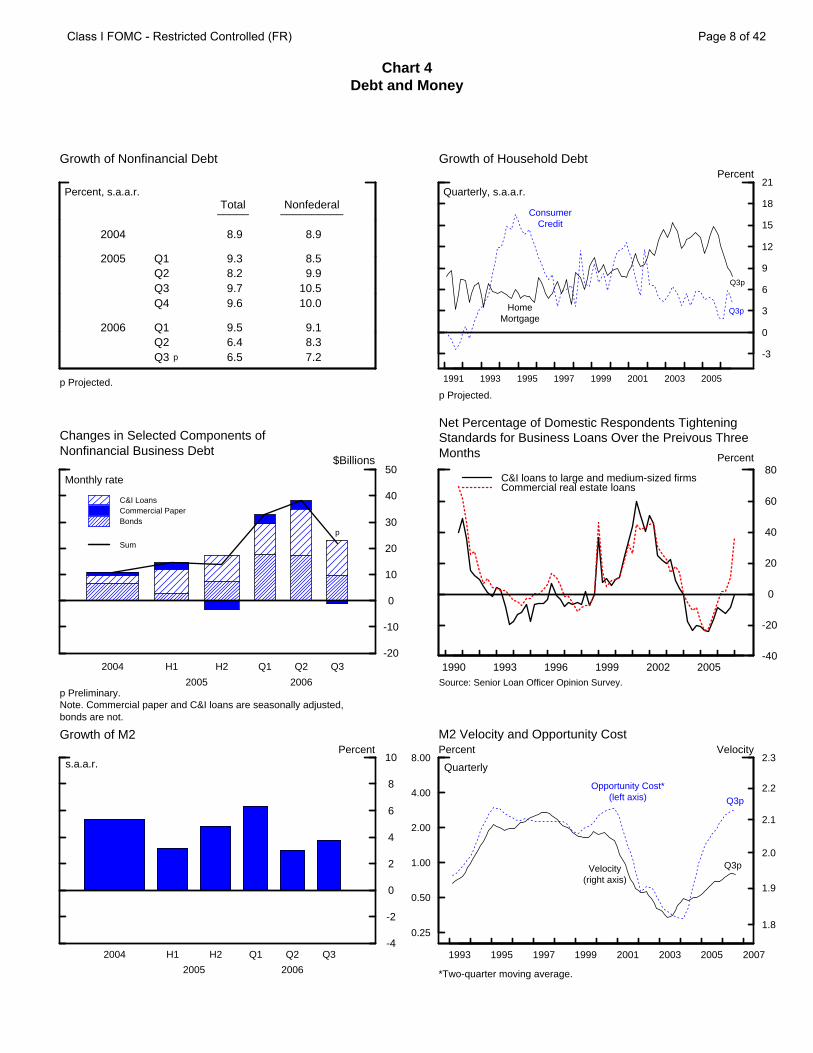
Chart 4Debt and Money
Growth of Nonfinancial Debt
Percent, s.a.a.r.
2004
2005
2006
Q1Q2Q3Q4
Q1Q2Q3 p
Total_____
8.9
9.38.29.79.6
9.56.46.5
Nonfederal__________
8.9
8.59.9
10.510.0
9.18.37.2
p Projected. 1991 1993 1995 1997 1999 2001 2003 2005
-3
0
3
6
9
12
15
18
21
Growth of Household DebtPercent
Quarterly, s.a.a.r.
p Projected.
Q3p
Q3p
ConsumerCredit
HomeMortgage
-20
-10
0
10
20
30
40
50
C&I LoansCommercial PaperBonds
Sum
Changes in Selected Components ofNonfinancial Business Debt
$Billions
2004 H1 H2 Q1 Q2 Q3
2005 2006
Monthly rate
Note. Commercial paper and C&I loans are seasonally adjusted,bonds are not.
p
p Preliminary.
1990 1993 1996 1999 2002 2005-40
-20
0
20
40
60
80Percent
C&I loans to large and medium-sized firmsCommercial real estate loans
Net Percentage of Domestic Respondents TighteningStandards for Business Loans Over the Preivous ThreeMonths
Source: Senior Loan Officer Opinion Survey.
-4
-2
0
2
4
6
8
10
Growth of M2
s.a.a.r.Percent
2004 H1 H2 Q1 Q2 Q3
2005 2006
0.25
0.50
1.00
2.00
4.00
8.00
1993 1995 1997 1999 2001 2003 2005 2007
1.8
1.9
2.0
2.1
2.2
2.3
M2 Velocity and Opportunity CostVelocityPercent
Quarterly
Opportunity Cost*(left axis)
Velocity(right axis)
*Two-quarter moving average.
Q3p
Q3p
Class I FOMC - Restricted Controlled (FR) Page 8 of 42

(7) M2 grew modestly in the third quarter, evidencing the lagged effects of
prior increases in opportunity costs and slow growth in nominal spending. Strong
advances in small time deposits and retail money funds offset a runoff in liquid
deposits. The stock of currency was about flat, owing to continuing weak overseas
demand for U.S. banknotes.
Class I FOMC - Restricted Controlled (FR) Page 9 of 42
Medium-Term Strategies
(8) Over the intermeeting period, incoming data on economic activity and
inflation were mostly consistent with the staff’s September projection. Accordingly,
the latest Greenbook forecast continues to point to below-trend economic growth
and gradually ebbing core inflation. As in September, the forecast is predicated on an
assumption that the Committee maintains the current stance of policy through mid-
2008 and then eases slightly. Long-term Treasury yields follow a path similar to that
projected in September, that is, rising marginally as investors come to realize that
policy is unlikely to be eased next year. Stock prices once again are anticipated to
increase at about a 6½ percent annual rate, but from a level that is about 3½ percent
higher than anticipated in the previous forecast. The foreign exchange value of the
dollar is again assumed to depreciate gradually. Given recent developments in energy
markets, oil prices in the near term are assumed to be about $5 per barrel lower than
in the September projection, but that difference largely unwinds over the next two
years. Against this backdrop, real GDP growth is expected to slow to around a
1½ percent annual rate in the second half of this year, just a touch softer than in the
September Greenbook. Thereafter, economic growth picks up gradually to about a
2½ percent pace in 2008, which brings it up to the staff’s estimate of the expansion of
potential GDP. The sluggish performance over the next few quarters pushes the
unemployment rate up to a little above 5 percent. The flattening out of energy and
other commodity prices, combined with an expected deceleration in import prices and
slight cooling in product and labor markets, nudges core PCE inflation down from an
annual rate of around 2¼ percent in the second half of 2006 to close to 2 percent by
the end of the forecast period. Headline PCE inflation is projected to slow to an
annual rate of less than 1 percent in the second half of this year, reflecting the recent
sharp declines in consumer energy prices, but to rebound to 2.7 percent in 2007 and
2.1 percent in 2008.
Class I FOMC - Restricted Controlled (FR) Page 10 of 42
(9) To shed light on the economic outlook and policy strategies at a longer
horizon, the FRB/US model was used to construct an illustrative extension of the
Greenbook forecast beyond 2008 based on a set of medium-term assumptions
together with some judgmental adjustments. Important influences on the inflation
outlook include trend multifactor productivity growth of about 1¾ percent per year,
approximately flat energy prices, and a pickup in real dollar depreciation to an average
rate of 3 percent per year. Based on these assumptions, the unemployment rate
would need to be a bit above the staff’s assumed long-run NAIRU of 5 percent to
keep the core PCE inflation rate stable. The illustrative extension also assumes that
the unified federal budget deficit rises gradually from just under 2 percent of GDP in
2008 to a little over 2½ percent by 2012 and that the assumed pace of dollar
depreciation and steady growth abroad are sufficient to stabilize the current account
deficit at just below 8 percent of GDP. Further assuming that both term and risk
premiums on bonds gradually move back to their historical norms, the real funds rate
would need to decline to around 2 percent to keep output expanding along its
potential path.
(10) The value of the equilibrium real federal funds rate (r*) is subject to
substantial uncertainty, which can be seen in the range of different estimates reported
in Chart 5. The Greenbook-consistent measure of short-run r*—the value that would
close the output gap over the next twelve quarters—has remained around 2½ to
2¾ percent since the June Bluebook, reflecting the relatively small revisions since the
start of the summer in the staff’s assessment of the strength of aggregate demand
relative to potential output. This judgmental estimate currently lies just above the
range of the three model-based measures of short-run r*. Model-based estimates of
the medium-run value of r*—the real rate consistent with output at potential at a
horizon of about seven years, on the assumption that monetary policy acts to close
Class I FOMC - Restricted Controlled (FR) Page 11 of 42
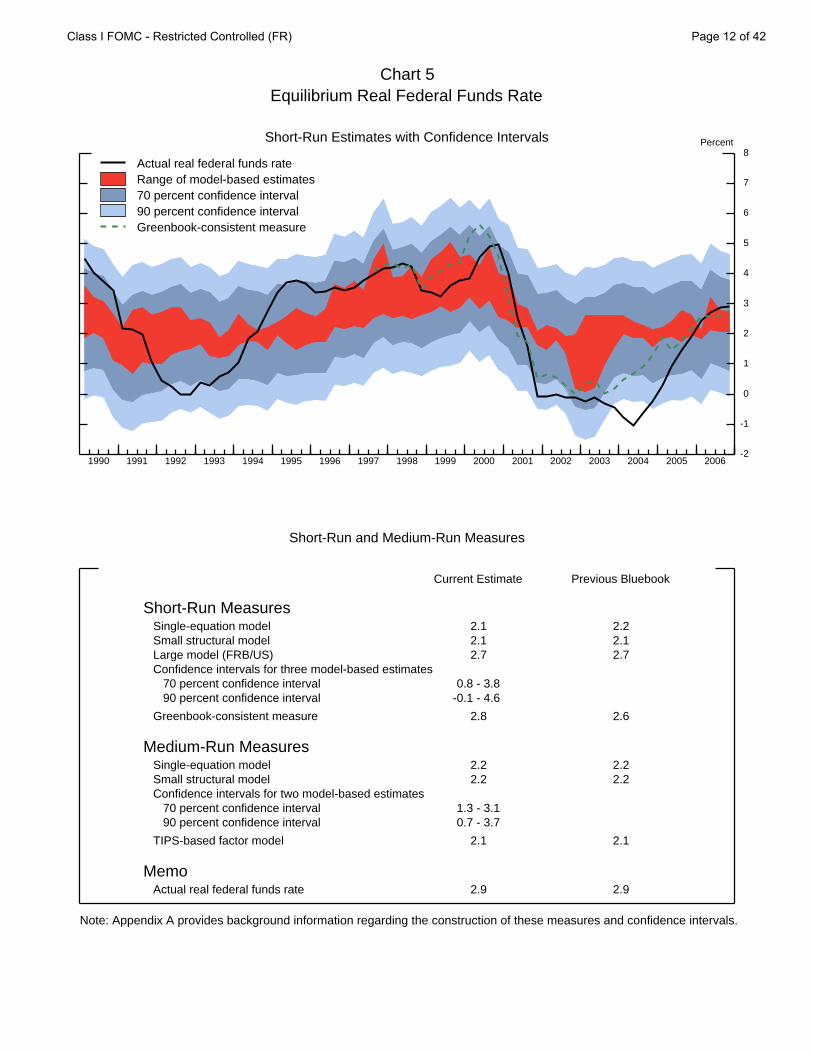
Chart 5Equilibrium Real Federal Funds Rate
1990 1991 1992 1993 1994 1995 1996 1997 1998 1999 2000 2001 2002 2003 2004 2005 2006
-2
-1
0
1
2
3
4
5
6
7
8Percent
Note: Appendix A provides background information regarding the construction of these measures and confidence intervals.
Short-Run Estimates with Confidence Intervals
Short-Run and Medium-Run Measures
Actual real federal funds rateRange of model-based estimates70 percent confidence interval90 percent confidence intervalGreenbook-consistent measure
Current Estimate Previous Bluebook
Short-Run Measures Single-equation model 2.1 2.2 Small structural model 2.1 2.1 Large model (FRB/US) 2.7 2.7 Confidence intervals for three model-based estimates 70 percent confidence interval (0.8 - 3.8( 90 percent confidence interval -0.1 - 4.6(
Greenbook-consistent measure 2.8 2.6
Medium-Run Measures Single-equation model 2.2 2.2 Small structural model 2.2 2.2 Confidence intervals for two model-based estimates 70 percent confidence interval (1.3 - 3.1( 90 percent confidence interval (0.7 - 3.7(
TIPS-based factor model 2.1 2.1
Memo Actual real federal funds rate 2.9 2.9
Class I FOMC - Restricted Controlled (FR) Page 12 of 42

the output gap over the next several years and keep it closed thereafter—are also close
to the value implicit in the illustrative Greenbook extension.
(11) Medium-term implications of alternative monetary policy strategies
can be assessed using optimal control simulations of the FRB/US model. In these
simulations, policymakers and participants in financial markets are assumed to
understand fully the forces shaping the economic outlook (as summarized by the
extended Greenbook projection), whereas households and firms form their
expectations using more limited information. The optimal path of policy balances
three stabilization objectives: keeping core PCE inflation close to a specified goal;
keeping unemployment close to the long-run NAIRU; and avoiding sharp changes in
the nominal federal funds rate. The optimal policy and associated macroeconomic
outcomes depend on the level of the inflation goal and the weights assigned to the
stabilization objectives; these paths also reflect both the structure of the FRB/US
model and the specific assumptions embedded in the extended Greenbook outlook.
(12) The first set of simulations, shown in Chart 6, explores the implications of
alternative goals for core PCE inflation, assuming that policymakers place equal
weights on the three stabilization objectives. With an inflation goal of 2 percent
(denoted by the solid lines), the optimal control simulation prescribes a nominal funds
rate of about 5¼ percent through the end of next year followed by a gradual decline
to about 4¼ percent by the end of the decade. Unemployment remains a bit above
the long-run NAIRU of 5 percent and core inflation remains slightly above the
2 percent goal through 2012, reflecting the balancing of the inflation and employment
objectives in an environment in which steady dollar depreciation is generating
persistent upward pressure on domestic inflation. With an inflation goal of
1½ percent (the dashed lines), the optimal policy prescribes a funds rate path that
rises to nearly 6 percent next year before declining to about 3½ percent by 2012. In
this case, the unemployment rate peaks at about 5½ percent later this decade while
Class I FOMC - Restricted Controlled (FR) Page 13 of 42
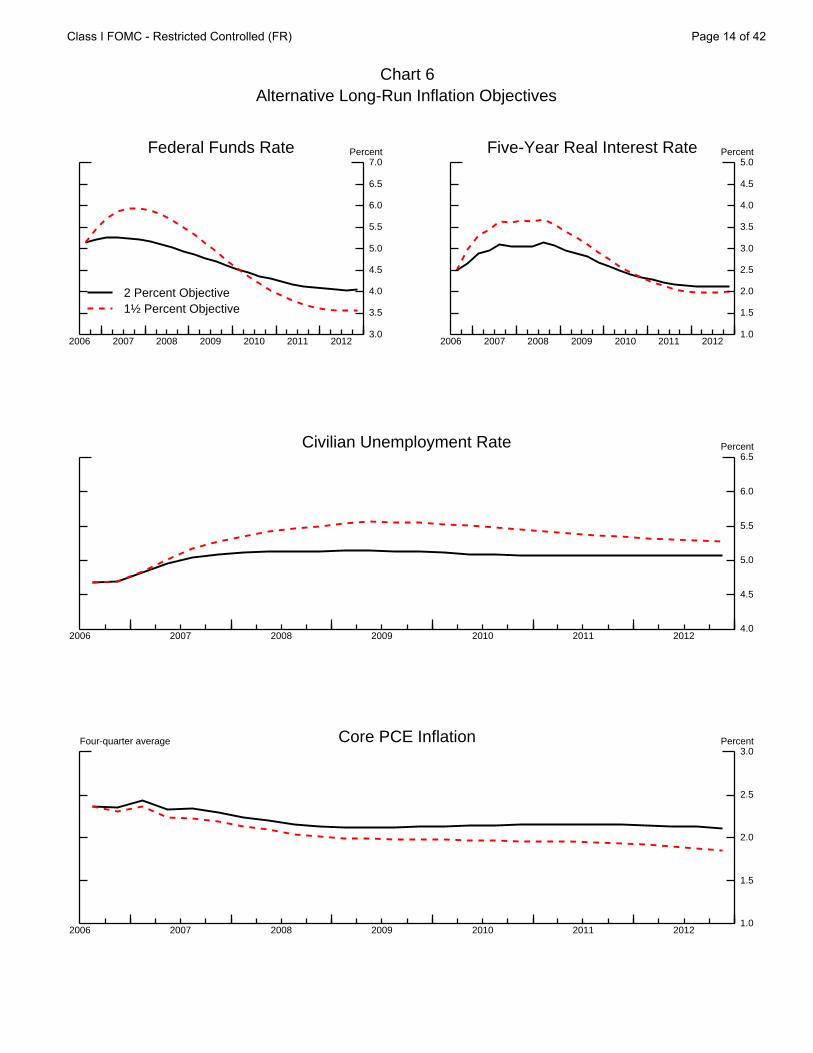
Chart 6Alternative Long-Run Inflation Objectives
2006 2007 2008 2009 2010 2011 2012
3.0
3.5
4.0
4.5
5.0
5.5
6.0
6.5
7.0Percent
2 Percent Objective1½ Percent Objective
Federal Funds Rate
2006 2007 2008 2009 2010 2011 2012
1.0
1.5
2.0
2.5
3.0
3.5
4.0
4.5
5.0Percent
Five-Year Real Interest Rate
2006 2007 2008 2009 2010 2011 2012
4.0
4.5
5.0
5.5
6.0
6.5Percent
Civilian Unemployment Rate
2006 2007 2008 2009 2010 2011 2012
Four-quarter average
1.0
1.5
2.0
2.5
3.0Percent
Core PCE Inflation
Class I FOMC - Restricted Controlled (FR) Page 14 of 42
core inflation declines gradually towards its goal. The slow pace of disinflation is
importantly shaped by the high output costs associated with lowering long-run
inflation expectations in FRB/US and by the relative weights that policymakers are
assumed to place on their inflation and unemployment objectives.
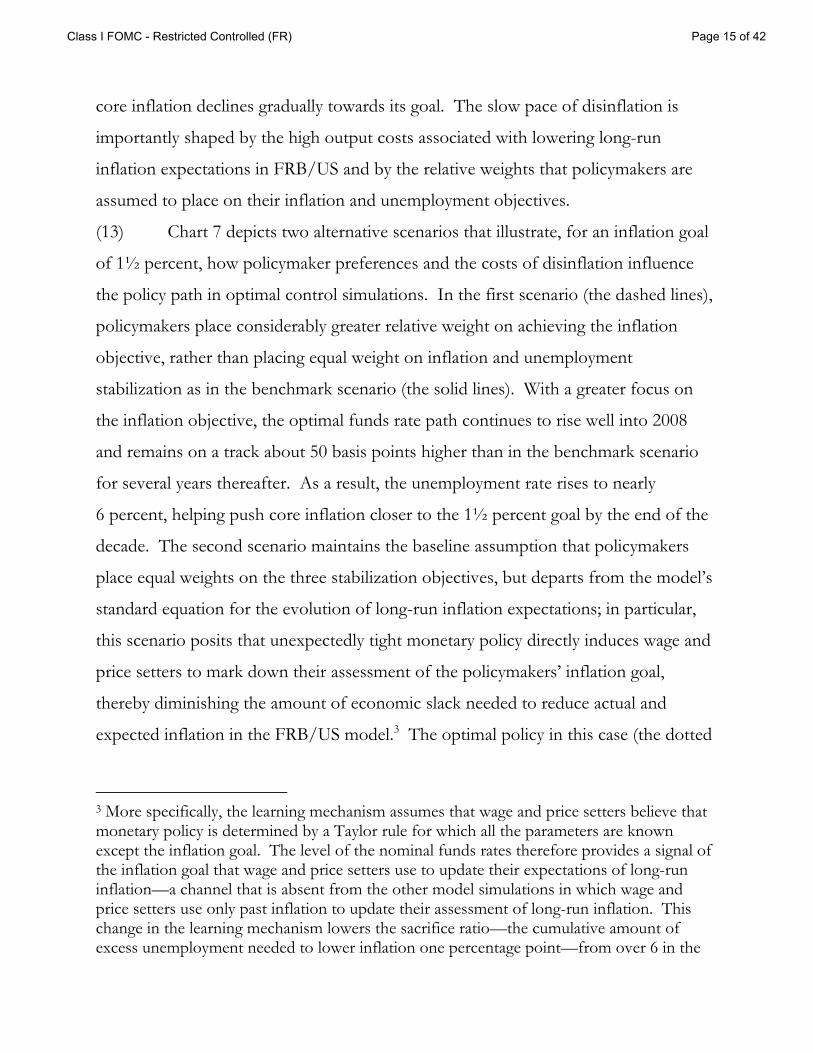
(13) Chart 7 depicts two alternative scenarios that illustrate, for an inflation goal
of 1½ percent, how policymaker preferences and the costs of disinflation influence
the policy path in optimal control simulations. In the first scenario (the dashed lines),
policymakers place considerably greater relative weight on achieving the inflation
objective, rather than placing equal weight on inflation and unemployment
stabilization as in the benchmark scenario (the solid lines). With a greater focus on
the inflation objective, the optimal funds rate path continues to rise well into 2008
and remains on a track about 50 basis points higher than in the benchmark scenario
for several years thereafter. As a result, the unemployment rate rises to nearly
6 percent, helping push core inflation closer to the 1½ percent goal by the end of the
decade. The second scenario maintains the baseline assumption that policymakers
place equal weights on the three stabilization objectives, but departs from the model’s
standard equation for the evolution of long-run inflation expectations; in particular,
this scenario posits that unexpectedly tight monetary policy directly induces wage and
price setters to mark down their assessment of the policymakers’ inflation goal,
thereby diminishing the amount of economic slack needed to reduce actual and
expected inflation in the FRB/US model.3 The optimal policy in this case (the dotted
3 More specifically, the learning mechanism assumes that wage and price setters believe that monetary policy is determined by a Taylor rule for which all the parameters are known except the inflation goal. The level of the nominal funds rates therefore provides a signal of the inflation goal that wage and price setters use to update their expectations of long-run inflation—a channel that is absent from the other model simulations in which wage and price setters use only past inflation to update their assessment of long-run inflation. This change in the learning mechanism lowers the sacrifice ratio—the cumulative amount of excess unemployment needed to lower inflation one percentage point—from over 6 in the
Class I FOMC - Restricted Controlled (FR) Page 15 of 42
Chart 7Optimal Policy with a 1½ Percent Inflation Objective
2006 2007 2008 2009 2010 2011 2012
3.0
3.5
4.0
4.5
5.0
5.5
6.0
6.5
7.0Percent
Equal weightsMore weight on inflationWith learning
Federal Funds Rate
2006 2007 2008 2009 2010 2011 2012
1.0
1.5
2.0
2.5
3.0
3.5
4.0
4.5
5.0Percent
Five-Year Real Interest Rate
2006 2007 2008 2009 2010 2011 2012
4.0
4.5
5.0
5.5
6.0
6.5Percent
Civilian Unemployment Rate
2006 2007 2008 2009 2010 2011 2012
Four-quarter average
1.0
1.5
2.0
2.5
3.0Percent
Core PCE Inflation
Class I FOMC - Restricted Controlled (FR) Page 16 of 42
lines) prescribes a near-term rise in the funds rate to about 6¼ percent by mid-2007,
with subsequent policy easing as long-term inflation expectations converge to the
inflation goal. The more favorable policy tradeoff is readily apparent in this scenario:
Core inflation descends more quickly towards the 1½ percent goal even though the
unemployment rate is only modestly higher than the long-run NAIRU.
(14) These optimal control policies prescribe broadly similar and relatively stable
funds rate paths over the next two years, in part because all of the simulations are
premised on the same set of assumptions regarding the medium-term outlook. The
upper portion of Chart 8 provides some information on the extent of uncertainty
about the future course of monetary policy. The left panel depicts confidence
intervals for the range of federal funds rate outcomes implied by stochastic
simulations of the FRB/US model, assuming that monetary policy is well-
characterized by an estimated outcome-based rule and that the shocks hitting the
economy are typical of the experience over the past two decades. In the absence of
any shocks, the outcome-based rule (denoted by the dashed line) prescribes a funds
rate path that remains between 5¼ and 5½ percent through mid-2007 and then
declines gradually to about 5 percent. The stochastic simulations indicate a 70 percent
probability that the prescriptions of the outcome-based rule will fall in the range of
4 to 6½ percent during 2007. By comparison, confidence intervals implied by options
prices on federal funds and Eurodollar futures contracts (right panel) point to
noticeably less uncertainty in financial markets regarding the prospective path of
policy over the next two years.
(15) While optimal control analysis necessitates the use of a macroeconomic
model such as FRB/US, simple policy rules based on a limited set of variables can
serve as benchmarks for monetary policy strategy, and the near-term prescriptions of
baseline case to less than 2, comparable to estimates of the sacrifice ratio for the disinflation of the early 1980s.
Class I FOMC - Restricted Controlled (FR) Page 17 of 42
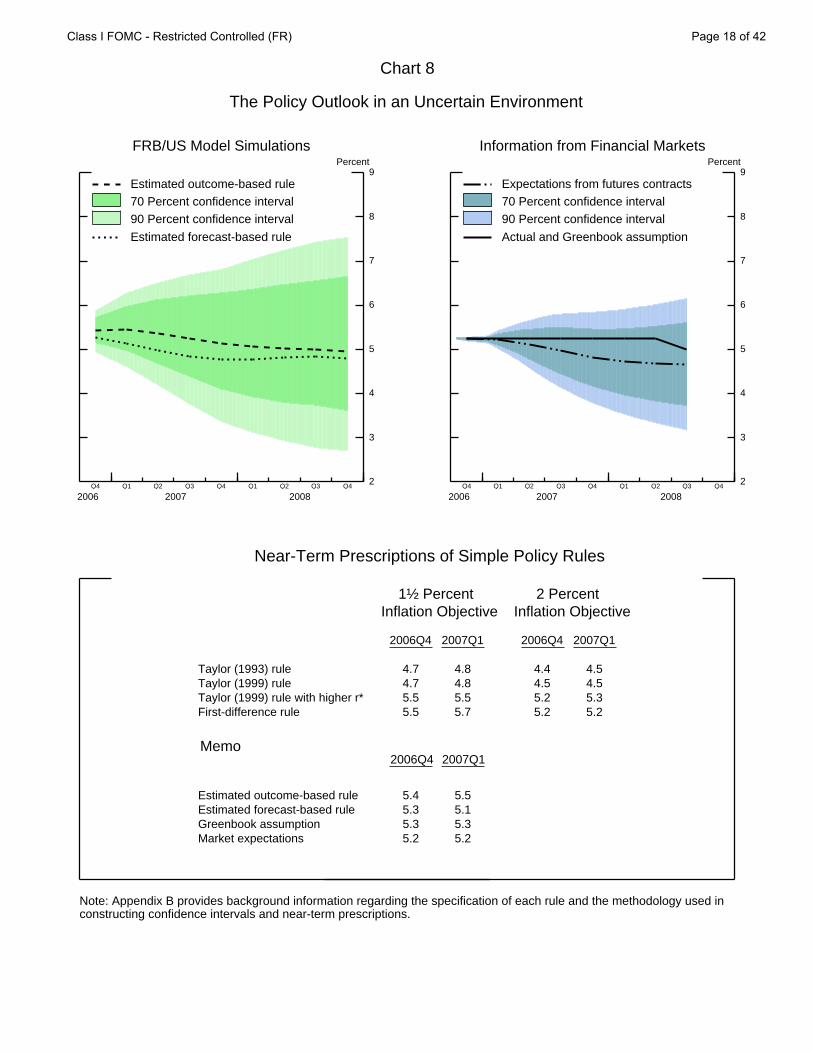
Chart 8
The Policy Outlook in an Uncertain Environment
Q4 Q1 Q2 Q3 Q4 Q1 Q2 Q3 Q42007 2008
2
3
4
5
6
7
8
9Percent
Note: Appendix B provides background information regarding the specification of each rule and the methodology used inconstructing confidence intervals and near-term prescriptions.
Estimated outcome-based rule
70 Percent confidence interval
90 Percent confidence interval
Estimated forecast-based rule
2006 2007 2008
FRB/US Model Simulations
Q4 Q1 Q2 Q3 Q4 Q1 Q2 Q3 Q42007 2008
2
3
4
5
6
7
8
9Percent
Expectations from futures contracts
70 Percent confidence interval
90 Percent confidence interval
Actual and Greenbook assumption
2006Q4 2007Q1
1½ PercentInflation Objective
2 PercentInflation Objective
Memo
Near-Term Prescriptions of Simple Policy Rules
2006 2007 2008
Information from Financial Markets
2006Q4 2007Q1 2006Q4 2007Q1
Taylor (1993) rule 4.7 4.8 4.4 4.5Taylor (1999) rule 4.7 4.8 4.5 4.5Taylor (1999) rule with higher r* 5.5 5.5 5.2 5.3First-difference rule 5.5 5.7 5.2 5.2
Estimated outcome-based rule 5.4 5.5 Estimated forecast-based rule 5.3 5.1 Greenbook assumption 5.3 5.3 Market expectations 5.2 5.2
Class I FOMC - Restricted Controlled (FR) Page 18 of 42
such rules can be obtained without specifying any particular model. As shown in the
lower portion of Chart 8, the rules proposed by Taylor (1993, 1999) prescribe a funds
rate of about 4½ to 4¾ percent, depending on the inflation objective (either 2 or
1½ percent). A higher funds rate of 5¼ to 5½ percent is prescribed by a variant of
the Taylor (1999) rule—introduced in the August Bluebook—that incorporates a
value of r* that is 75 basis points higher than in the original rule. Finally, with an
inflation objective of 1½ percent, the first-difference rule—whose prescriptions do
not depend on the level of the output gap or any particular value of the equilibrium
real interest rate—calls for a distinct upward tilt to the path of policy, with the funds
rate rising to 5¾ percent by the first quarter of next year; in contrast, with a 2 percent
inflation goal, the first-difference rule is consistent with holding the funds rate at its
current level.
Class I FOMC - Restricted Controlled (FR) Page 19 of 42
Short-Run Policy Alternatives
(16) This Bluebook presents three formal policy alternatives for the Committee’s
consideration, associated with the draft statements in Table 1. Under Alternatives A
and B, the Committee would again leave the stance of monetary policy unchanged at
this meeting; Alternative A would indicate that the Committee has no clear view as to
the likely future direction of policy, whereas Alternative B would repeat the statement
from September that further policy tightening may prove necessary. Under
Alternative C, the Committee would increase the target rate 25 basis points at this
meeting and continue to stress upside risks to inflation. In all three, the Committee
would acknowledge that economic growth appears to have slowed further in the third
quarter, but the characterization of growth going forward varies across the
alternatives.
(17) If the Committee judges that the news since its decision to hold the funds
target unchanged in September has not significantly altered the outlook for inflation
and activity, it might be attracted to Alternative B. A combination of below-trend
growth and an edging lower in core inflation, as in the staff forecast, may be viewed as
the best attainable outcome. With the real federal funds rate around the upper end of
the range of model-based estimates of its equilibrium value as noted earlier, the
Committee might judge the current stance of policy as broadly consistent with
achieving this result. Moreover, from a risk-management perspective, modest policy
restraint may be viewed as appropriately weighing the competing risks to inflation and
economic growth. The possibility that inflation expectations could begin to drift
higher and the tightness of the labor market, as evidenced by data on labor
compensation and reports of difficulties in filing certain positions, may both be
viewed as pointing to upside risks to costs and prices in the Greenbook projection.
Despite those upside inflation risks, the Committee may want to refrain from
tightening in light of the downside risks to economic growth, including the possibility
Class I FOMC - Restricted Controlled (FR) Page 20 of 42
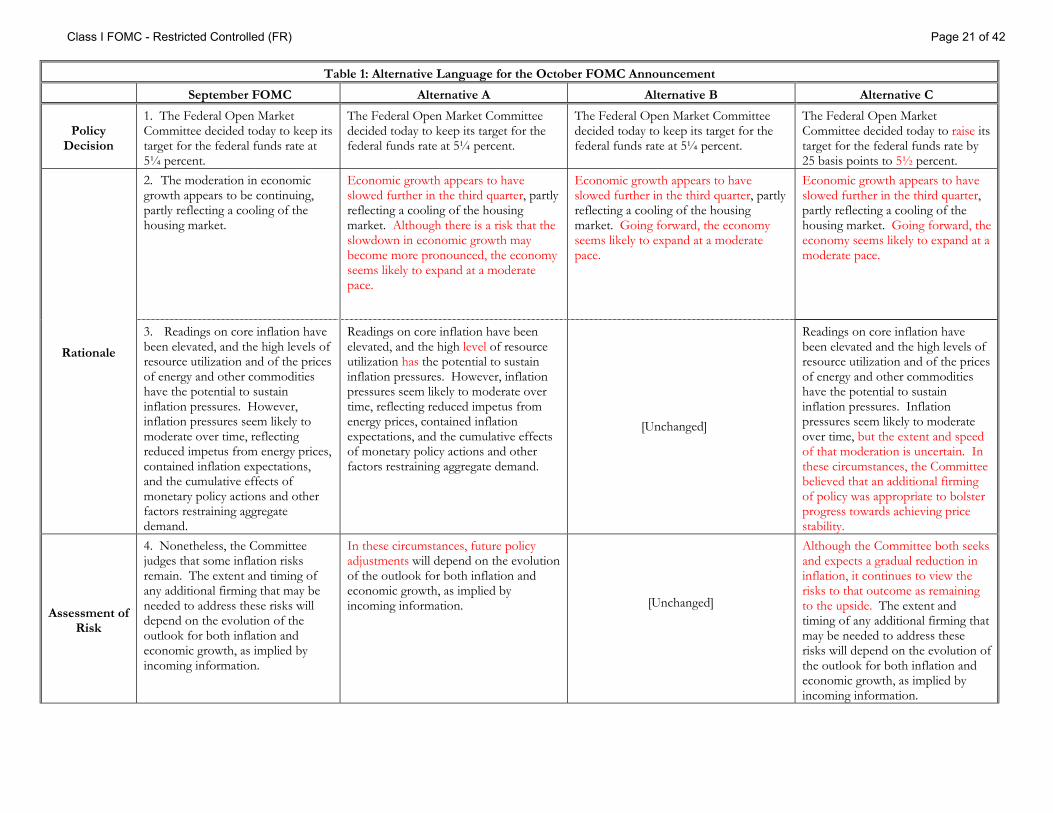
Table 1: Alternative Language for the October FOMC Announcement
September FOMC Alternative A Alternative B Alternative C
Policy Decision
1. The Federal Open Market Committee decided today to keep its target for the federal funds rate at 5¼ percent.
The Federal Open Market Committee decided today to keep its target for the federal funds rate at 5¼ percent.
The Federal Open Market Committee decided today to keep its target for the federal funds rate at 5¼ percent.
The Federal Open Market Committee decided today to raise its target for the federal funds rate by 25 basis points to 5½ percent.
2. The moderation in economic growth appears to be continuing, partly reflecting a cooling of the housing market.
Economic growth appears to have slowed further in the third quarter, partly reflecting a cooling of the housing market. Although there is a risk that the slowdown in economic growth may become more pronounced, the economy seems likely to expand at a moderate pace.
Economic growth appears to have slowed further in the third quarter, partly reflecting a cooling of the housing market. Going forward, the economy seems likely to expand at a moderate pace.
Economic growth appears to have slowed further in the third quarter, partly reflecting a cooling of the housing market. Going forward, the economy seems likely to expand at a moderate pace.
Rationale
3. Readings on core inflation have been elevated, and the high levels of resource utilization and of the prices of energy and other commodities have the potential to sustain inflation pressures. However, inflation pressures seem likely to moderate over time, reflecting reduced impetus from energy prices, contained inflation expectations, and the cumulative effects of monetary policy actions and other factors restraining aggregate demand.
Readings on core inflation have been elevated, and the high level of resource utilization has the potential to sustain inflation pressures. However, inflation pressures seem likely to moderate over time, reflecting reduced impetus from energy prices, contained inflation expectations, and the cumulative effects of monetary policy actions and other factors restraining aggregate demand.
[Unchanged]
Readings on core inflation have been elevated and the high levels of resource utilization and of the prices of energy and other commodities have the potential to sustain inflation pressures. Inflation pressures seem likely to moderate over time, but the extent and speed of that moderation is uncertain. In these circumstances, the Committee believed that an additional firming of policy was appropriate to bolster progress towards achieving price stability.
Assessment of Risk
4. Nonetheless, the Committee judges that some inflation risks remain. The extent and timing of any additional firming that may be needed to address these risks will depend on the evolution of the outlook for both inflation and economic growth, as implied by incoming information.
In these circumstances, future policy adjustments will depend on the evolution of the outlook for both inflation and economic growth, as implied by incoming information.
[Unchanged]
Although the Committee both seeks and expects a gradual reduction in inflation, it continues to view the risks to that outcome as remaining to the upside. The extent and timing of any additional firming that may be needed to address these risks will depend on the evolution of the outlook for both inflation and economic growth, as implied by incoming information.
Class I FOMC - Restricted Controlled (FR) Page 21 of 42
that the housing market could continue to deteriorate. Holding the federal funds rate
unchanged would permit additional information bearing on the prospects for growth
and inflation to accumulate before making a move in either direction.
(18) With little news since the September FOMC meeting, the Committee could
essentially repeat its previous statement, but acknowledge softness in the economy in
the third quarter. If the Committee wished to include an explicit assessment of the
prospects for growth, it could also include an additional sentence in row 2 noting that
“Going forward, the economy seems likely to expand at a moderate pace.”
(19) Money market futures and options indicate that investors remain confident
that the Committee will maintain the federal funds rate at 5¼ percent at this meeting.
Moreover, the Desk’s survey of primary dealers indicates that the accompanying
statement is expected to replicate broadly the September announcement. The release
of a statement along the lines of alternative B, therefore, would not prove a surprise,
and the market reaction would likely be limited.
(20) In recent statements, the risk assessment has pointed to upside risks to
inflation and the possible need to firm policy further. However, market participants
appear to attach greater likelihood to policy easing than tightening. To protest that
view and to underscore its commitment to reduce inflation, the Committee might
choose to modify its words to note that “Although the Committee both seeks and
expects a gradual reduction in inflation, it continues to view the risks to that outcome
as remaining to the upside.” The variation in wording might also be seen as having
the advantage of eliminating repetition, which in the past has led to market
participants viewing certain phrases as heavily freighted with meaning. If modifying
the statement along these lines was successful in increasing investors’ perception of
the upside risks to inflation, near-term policy expectations might back up somewhat
and short-term Treasury yields rise. In this case, the value of the dollar on foreign
exchange markets would likely edge higher, and stock prices could fall.
Class I FOMC - Restricted Controlled (FR) Page 22 of 42

(21) In contrast, the Committee might now be more concerned about the
downside risks to growth, perhaps in part as a result of the sharp slowing estimated
for the third quarter. If so, Alternative A might find some support. In this
alternative, the stance of policy would be maintained at this meeting, and the
statement would indicate that the outlook was such that the Committee did not have a
clear view as to the likely future direction of policy. The Committee might judge that
there is a material probability that growth could prove weaker than in the staff
forecast, perhaps reflecting a more pronounced housing market adjustment with more
extensive effects on the rest of the economy, along the lines of the “Housing
correction with spillovers” scenario described in the Greenbook. Moreover, if the
Committee, like the staff, saw only sluggish near-term growth in activity and
employment, it might be concerned that any additional adverse shocks to demand
could have a disproportionate impact on the economy. Maintaining the federal funds
rate at 5¼ percent for some time would be broadly consistent with the Committee’s
past behavior as captured in the estimated policy rules presented earlier. Further, as
noted in the medium-term policy strategies, the optimal policy path associated with
pursuit of a 2 percent inflation objective has the federal funds rate remaining near
current levels for the next year or so, before moving gradually lower thereafter.
(22) In order to point out the downside risks to growth, the statement
accompanying Alternative A could note that “there is a risk that the slowdown in
economic growth may become more pronounced.” To simplify the statement, the
Committee might want to remove from the discussion of inflation the reference to
the high levels “of the prices of energy and other commodities.” Indeed, the
Committee might see some merit in this simplification for the other alternatives as
well. Given the competing risks to inflation and growth, the risk assessment might
simply state that “In these circumstances, future policy adjustments will depend on
Class I FOMC - Restricted Controlled (FR) Page 23 of 42

the evolution of the outlook for inflation and economic growth, as implied by
incoming information.”
(23) Although market participants expect the current target for the federal funds
rate to be maintained at this meeting, they do not expect a statement that explicitly
identifies risks to growth as well as to inflation and suggests the Committee is no
longer predisposed towards policy firming. Market participants are likely to interpret
such a statement as implying that the Committee might ease rates sooner than they
had previously thought—and perhaps by even more than the half point reduction
already built in for 2007. As a result, near-term policy expectations would probably
move lower and shorter-term Treasury yields decline. The value of the dollar on
foreign exchange markets would likely edge lower and stock prices rally. The
implications for long-term yields would depend on whether the statement caused
investors to adjust their views about the Committee’s longer-term inflation intentions
or the appropriate path for the real interest rate.
(24) If the Committee expected higher inflation than the staff, or if it thought
the Greenbook forecast was broadly plausible but viewed inflation as remaining
unacceptably high, it might wish to raise the target federal funds rate to 5½ percent at
this meeting, as in Alternative C. This alternative might be favored if the factors
underlying the increase in core inflation in the first half of this year were viewed as
likely to be more persistent than envisaged in the staff’s projection, perhaps reflecting
an increase in inflation expectations as illustrated in the “Higher expected inflation”
simulation presented in the Greenbook. In that regard, the Committee may be
concerned that the current level of inflation expectations is already somewhat higher
than the objectives cited by a number of policymakers. (The box on the following
page discusses various measures of inflation expectations.) Even if the Committee
shares the staff’s view that inflation is likely to decline gradually over the forecast, it
may view the pace of that decline, in which core PCE inflation is projected to remain
Class I FOMC - Restricted Controlled (FR) Page 24 of 42
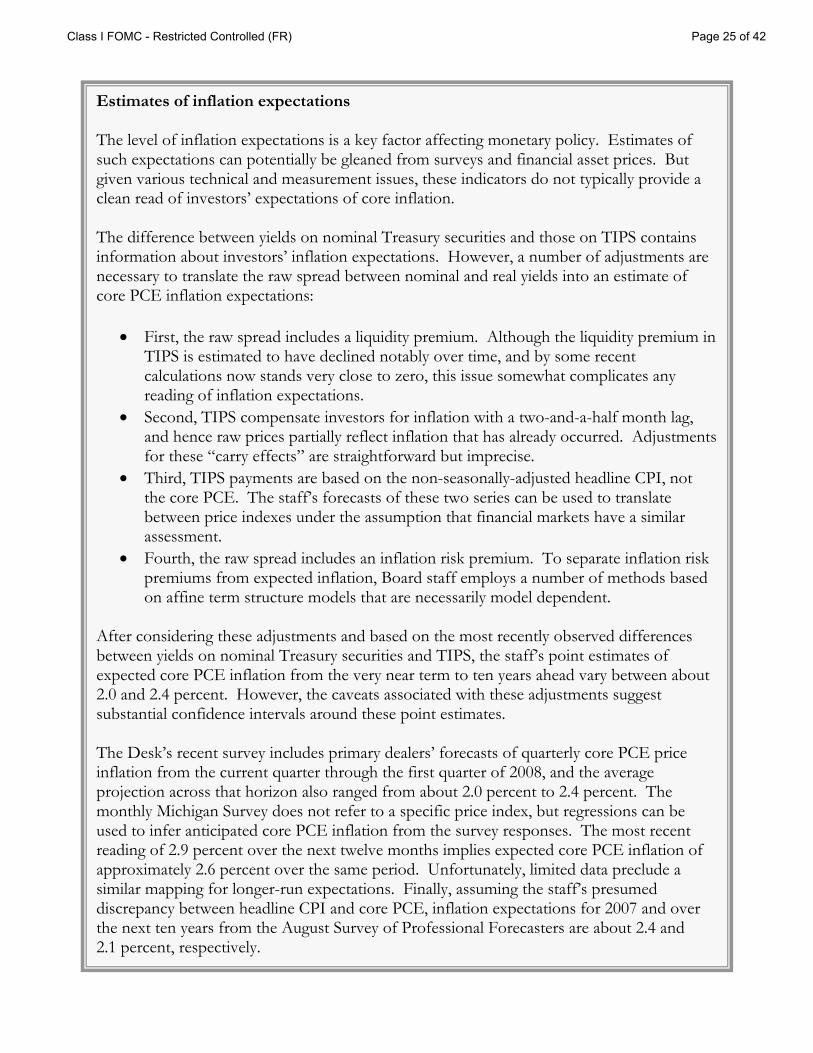
fall Estimates of inflation expectations The level of inflation expectations is a key factor affecting monetary policy. Estimates of such expectations can potentially be gleaned from surveys and financial asset prices. But given various technical and measurement issues, these indicators do not typically provide a clean read of investors’ expectations of core inflation. The difference between yields on nominal Treasury securities and those on TIPS contains information about investors’ inflation expectations. However, a number of adjustments are necessary to translate the raw spread between nominal and real yields into an estimate of core PCE inflation expectations:
• First, the raw spread includes a liquidity premium. Although the liquidity premium in TIPS is estimated to have declined notably over time, and by some recent calculations now stands very close to zero, this issue somewhat complicates any reading of inflation expectations.
• Second, TIPS compensate investors for inflation with a two-and-a-half month lag, and hence raw prices partially reflect inflation that has already occurred. Adjustments for these “carry effects” are straightforward but imprecise.
• Third, TIPS payments are based on the non-seasonally-adjusted headline CPI, not the core PCE. The staff’s forecasts of these two series can be used to translate between price indexes under the assumption that financial markets have a similar assessment.
• Fourth, the raw spread includes an inflation risk premium. To separate inflation risk premiums from expected inflation, Board staff employs a number of methods based on affine term structure models that are necessarily model dependent.
After considering these adjustments and based on the most recently observed differences between yields on nominal Treasury securities and TIPS, the staff’s point estimates of expected core PCE inflation from the very near term to ten years ahead vary between about 2.0 and 2.4 percent. However, the caveats associated with these adjustments suggest substantial confidence intervals around these point estimates. The Desk’s recent survey includes primary dealers’ forecasts of quarterly core PCE price inflation from the current quarter through the first quarter of 2008, and the average projection across that horizon also ranged from about 2.0 percent to 2.4 percent. The monthly Michigan Survey does not refer to a specific price index, but regressions can be used to infer anticipated core PCE inflation from the survey responses. The most recent reading of 2.9 percent over the next twelve months implies expected core PCE inflation of approximately 2.6 percent over the same period. Unfortunately, limited data preclude a similar mapping for longer-run expectations. Finally, assuming the staff’s presumed discrepancy between headline CPI and core PCE, inflation expectations for 2007 and over the next ten years from the August Survey of Professional Forecasters are about 2.4 and 2.1 percent, respectively.
Class I FOMC - Restricted Controlled (FR) Page 25 of 42
above 2 percent beyond 2008, as unacceptably slow. In the medium-term strategies
presented earlier, for example, bringing inflation below 2 percent in the next few years
involves raising the federal funds rate to about 6 percent over the next several
quarters.
(25) In the statement accompanying Alternative C, the discussion of growth
could be identical to that proposed for Alternative B. However, in the second half of
the inflation paragraph, rather than listing the various factors contributing to the
expected moderation in inflation, the Committee could posit that “Inflation pressures
seem likely to moderate over time, but the extent and speed of that moderation is
uncertain.” The discussion of inflation could conclude by stating that “In these
circumstances, the Committee believed that an additional firming of policy was
appropriate to bolster progress towards achieving price stability.” If, despite the
firming in policy, the Committee continued to be predominantly concerned with
inflation risks, it presumably would want to leave the risk assessment tilted as was
proposed for Alternative B. However, that sentiment could perhaps be conveyed
more strongly to market participants by adopting the language in paragraph 20 earlier
in this Bluebook noting that the Committee “both seeks and expects a gradual
reduction in inflation.”
(26) The tightening of policy envisaged under Alternative C would catch market
participants unawares. Investors would revise up sharply their expectations for the
path of policy over the next year or so. Short- and medium-term nominal and real
rates would rise markedly. Nominal long-term yields would probably decline if
market participants concluded that the FOMC was seeking a steeper decline in
inflation or had a lower objective for inflation than they previously thought. With real
rates higher, the foreign exchange value of the dollar would likely rise, and equity
prices would probably decline, perhaps sharply.
Class I FOMC - Restricted Controlled (FR) Page 26 of 42

Money and Debt Forecasts
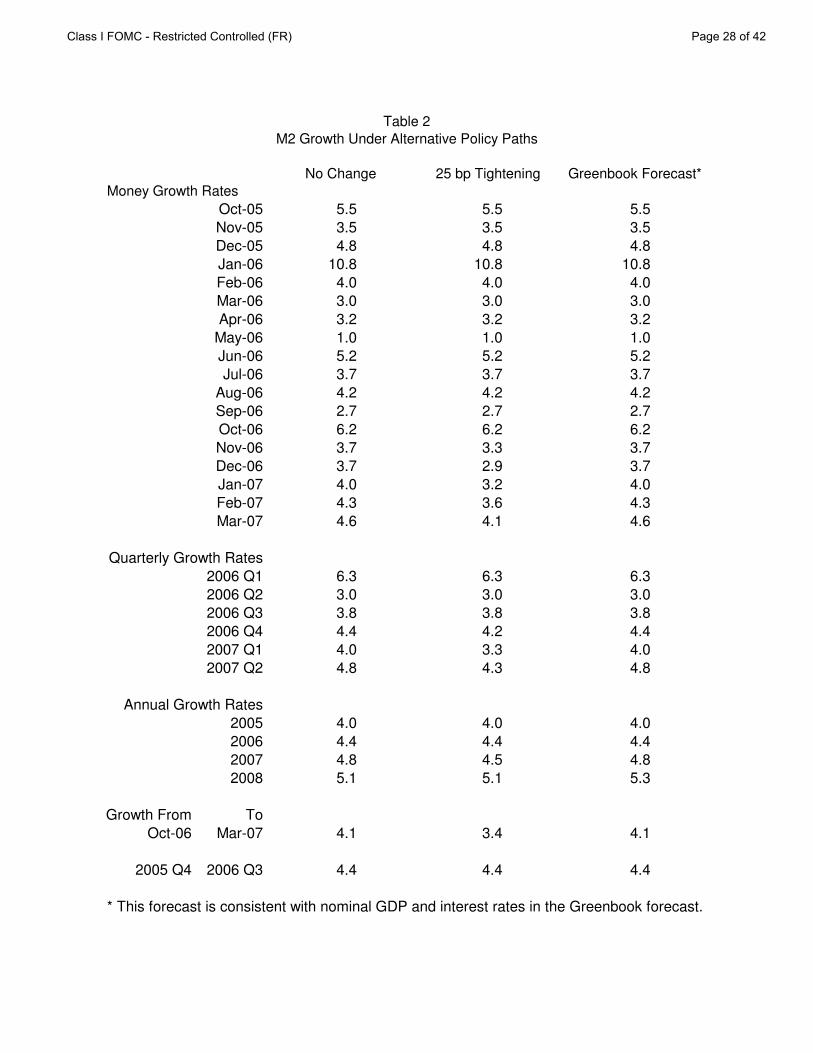
(27) Under the Greenbook forecast, M2 is projected to expand at around a
4 percent annual rate in the second half of 2006, reflecting moderate growth in
nominal income and the restraining effects of past policy tightening. However, as
opportunity costs gradually decline given the assumed path of the federal funds rate,
M2 growth picks up to around a 5 percent annual rate in 2007 and 2008.
(28) Growth of domestic nonfinancial sector debt is expected to slow to an
annual rate of around 6¼ percent on average over the forecast horizon, down from
growth of 9½ percent in 2005. The growth of home mortgage debt is expected to
step down considerably, reflecting both a deceleration in house prices and declining
residential investment. Business debt growth remains moderate over the forecast
period, as profits flatten out and firms draw on their accumulated cash to finance
growing investment spending. With the budget deficit projected to widen some over
the next two years, federal government debt is forecast to expand 6 percent in 2007
and 2008, up from the 4½ percent increase expected in 2006.
Class I FOMC - Restricted Controlled (FR) Page 27 of 42
No Change 25 bp Tightening Greenbook Forecast*
Oct-05 5.5 5.5 5.5
Nov-05 3.5 3.5 3.5
Dec-05 4.8 4.8 4.8
Jan-06 10.8 10.8 10.8
Feb-06 4.0 4.0 4.0
Mar-06 3.0 3.0 3.0
Apr-06 3.2 3.2 3.2
May-06 1.0 1.0 1.0
Jun-06 5.2 5.2 5.2
Jul-06 3.7 3.7 3.7
Aug-06 4.2 4.2 4.2
Sep-06 2.7 2.7 2.7
Oct-06 6.2 6.2 6.2
Nov-06 3.7 3.3 3.7
Dec-06 3.7 2.9 3.7
Jan-07 4.0 3.2 4.0
Feb-07 4.3 3.6 4.3
Mar-07 4.6 4.1 4.6
Quarterly Growth Rates
2006 Q1 6.3 6.3 6.3
2006 Q2 3.0 3.0 3.0
2006 Q3 3.8 3.8 3.8
2006 Q4 4.4 4.2 4.4
2007 Q1 4.0 3.3 4.0
2007 Q2 4.8 4.3 4.8
Annual Growth Rates
2005 4.0 4.0 4.0
2006 4.4 4.4 4.4
2007 4.8 4.5 4.8
2008 5.1 5.1 5.3
Growth From To
Oct-06 Mar-07 4.1 3.4 4.1
2005 Q4 2006 Q3 4.4 4.4 4.4
* This forecast is consistent with nominal GDP and interest rates in the Greenbook forecast.
Table 2
M2 Growth Under Alternative Policy Paths
Money Growth Rates
Class I FOMC - Restricted Controlled (FR) Page 28 of 42
Directive and Balance of Risks Statement
(29) Draft language for the directive and draft risk assessments identical to those
presented in Table 1 are provided below.
Directive Wording The Federal Open Market Committee seeks monetary and financial
conditions that will foster price stability and promote sustainable growth
in output. To further its long-run objectives, the Committee in the
immediate future seeks conditions in reserve markets consistent with
maintaining/INCREASING/REDUCING the federal funds rate at/TO
an average of around ________ 5¼ percent.
Risk Assessments
A. In these circumstances, future policy adjustments will depend on the
evolution of the outlook for inflation and economic growth, as implied
by incoming information.
B. Nonetheless, the Committee judges that some inflation risks remain.
The extent and timing of any additional firming that may be needed to
address these risks will depend on the evolution of the outlook for both
inflation and economic growth, as implied by incoming information.
C. Although the Committee both seeks and expects a gradual reduction in
inflation, it continues to view the risks to that outcome as remaining to
the upside. The extent and timing of any additional firming that may be
needed to address these risks will depend on the evolution of the
outlook for both inflation and economic growth, as implied by incoming
information.
Class I FOMC - Restricted Controlled (FR) Page 29 of 42
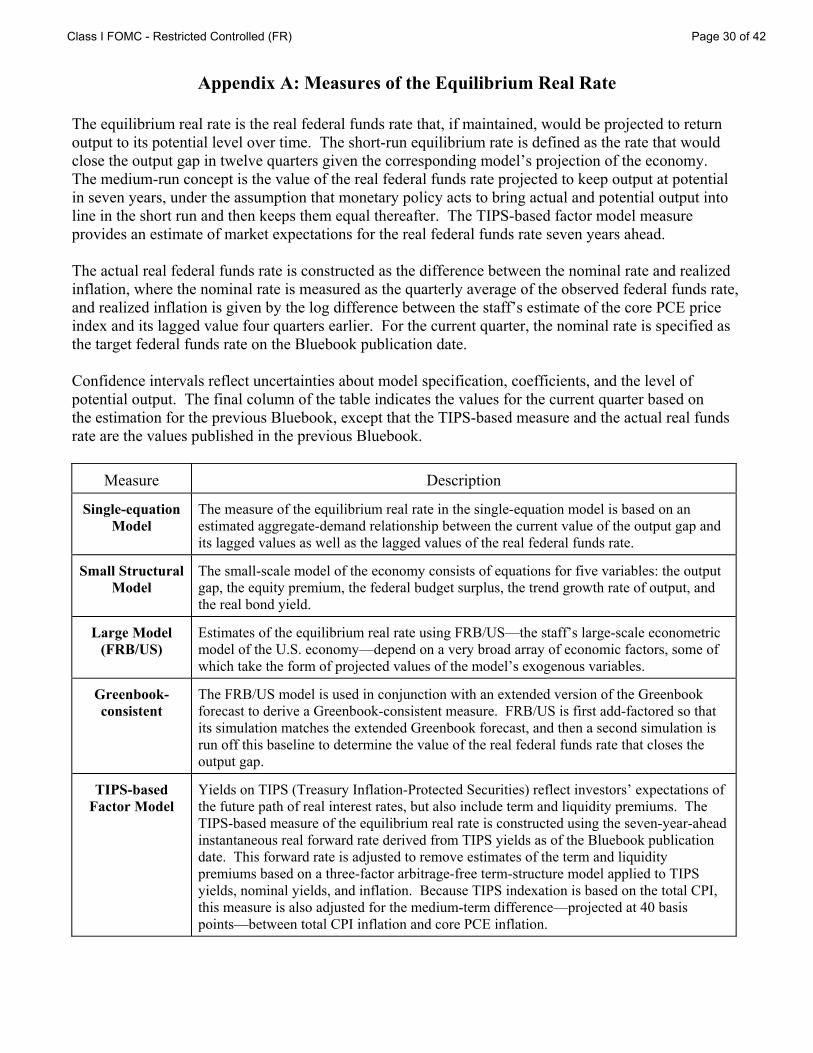
Appendix A: Measures of the Equilibrium Real Rate
The equilibrium real rate is the real federal funds rate that, if maintained, would be projected to return output to its potential level over time. The short-run equilibrium rate is defined as the rate that would close the output gap in twelve quarters given the corresponding model’s projection of the economy. The medium-run concept is the value of the real federal funds rate projected to keep output at potential in seven years, under the assumption that monetary policy acts to bring actual and potential output into line in the short run and then keeps them equal thereafter. The TIPS-based factor model measure provides an estimate of market expectations for the real federal funds rate seven years ahead. The actual real federal funds rate is constructed as the difference between the nominal rate and realized inflation, where the nominal rate is measured as the quarterly average of the observed federal funds rate, and realized inflation is given by the log difference between the staff’s estimate of the core PCE price index and its lagged value four quarters earlier. For the current quarter, the nominal rate is specified as the target federal funds rate on the Bluebook publication date. Confidence intervals reflect uncertainties about model specification, coefficients, and the level of potential output. The final column of the table indicates the values for the current quarter based on the estimation for the previous Bluebook, except that the TIPS-based measure and the actual real funds rate are the values published in the previous Bluebook.
Measure Description
Single-equation Model
The measure of the equilibrium real rate in the single-equation model is based on an estimated aggregate-demand relationship between the current value of the output gap and its lagged values as well as the lagged values of the real federal funds rate.
Small Structural Model
The small-scale model of the economy consists of equations for five variables: the output gap, the equity premium, the federal budget surplus, the trend growth rate of output, and the real bond yield.
Large Model (FRB/US)
Estimates of the equilibrium real rate using FRB/US—the staff’s large-scale econometric model of the U.S. economy—depend on a very broad array of economic factors, some of which take the form of projected values of the model’s exogenous variables.
Greenbook-consistent
The FRB/US model is used in conjunction with an extended version of the Greenbook forecast to derive a Greenbook-consistent measure. FRB/US is first add-factored so that its simulation matches the extended Greenbook forecast, and then a second simulation is run off this baseline to determine the value of the real federal funds rate that closes the output gap.
TIPS-based Factor Model
Yields on TIPS (Treasury Inflation-Protected Securities) reflect investors’ expectations of the future path of real interest rates, but also include term and liquidity premiums. The TIPS-based measure of the equilibrium real rate is constructed using the seven-year-ahead instantaneous real forward rate derived from TIPS yields as of the Bluebook publication date. This forward rate is adjusted to remove estimates of the term and liquidity premiums based on a three-factor arbitrage-free term-structure model applied to TIPS yields, nominal yields, and inflation. Because TIPS indexation is based on the total CPI, this measure is also adjusted for the medium-term difference—projected at 40 basis points—between total CPI inflation and core PCE inflation.
Class I FOMC - Restricted Controlled (FR) Page 30 of 42

Appendix B: Analysis of Policy Paths and Confidence Intervals Rule Specifications: For the following rules, it denotes the federal funds rate for quarter t, while the explanatory variables include the staff’s projection of trailing four-quarter core PCE inflation (πt), inflation two and three quarters ahead (πt+2|t and πt+3|t), the output gap in the current period and one quarter ahead ( *
t ty y− and *1| 1|t t t ty y+ +− ), and the three-quarter-ahead forecast of annual average GDP
growth relative to potential ( 4 4 *3| 3|t t t ty y+ +Δ − Δ ), and *π denotes an assumed value of policymakers’
long-run inflation objective. The outcome-based and forecast-based rules were estimated using real-time data over the sample 1988:1-2005:4; each specification was chosen using the Bayesian information criterion. Each rule incorporates a 75 basis point shift in the intercept, specified as a sequence of 25 basis point increments during the first three quarters of 1998. The first two simple rules were proposed by Taylor (1993, 1999), while the third is a variant of the Taylor (1999) rule—introduced in the August Bluebook—with a higher value of r*. The prescriptions of the first-difference rule do not depend on assumptions regarding r* or the level of the output gap; see Orphanides (2003).
Outcome-based rule it = 1.17it-1–0.37it-2+0.20[1.04 + 1.76 πt + 3.32( *t ty y− ) – 2.37( *
1 1t ty y− −− )]
Forecast-based rule it = 1.16it-1–0.36it-2+0.20[0.89+ 1.74 πt+2|t+2.32( *1| 1|t t t ty y+ +− )–1.40( *
1 1t ty y− −− )]
Taylor (1993) rule it = 2 + πt + 0.5(πt – *π ) + 0.5( *t ty y− )
Taylor (1999) rule it = 2 + πt + 0.5(πt – *π ) + ( *t ty y− )
Taylor (1999) rule with higher r*
it = 2.75 + πt + 0.5(πt – *π ) + ( *t ty y− )
First-difference rule it = it-1 + 0.5(πt+3|t – *π ) + 0.5( 4 4 *3| 3|t t t ty y+ +Δ − Δ )
FRB/US Model Simulations: Prescriptions from the two empirical rules are computed using dynamic simulations of the FRB/US model, implemented as though the rule is followed starting at this FOMC meeting. This quarter’s prescription is a weighted average of the actual value of the federal funds rate thus far this quarter and the value obtained from the FRB/US model simulations using the timing of this meeting within the quarter to determine the weights. Confidence intervals are based on stochastic simulations of the FRB/US model with shocks drawn from the estimated residuals over 1986-2004. Information from Financial Markets: The expected funds rate path is based on federal funds and Eurodollar futures quotes. The confidence intervals for this path are obtained from prices of at-the-money options contracts that are traded on the Chicago Mercantile Exchange. Near-Term Prescriptions of Simple Policy Rules: These prescriptions are calculated using Greenbook projections for inflation and the output gap. The first-difference rule’s one-quarter-ahead prescription is computed using that rule’s prescription for the current quarter. References: Taylor, John B. (1993) “Discretion versus policy rules in practice,” Carnegie-Rochester Conference Series on Public Policy, vol. 39 (December), pp. 195-214. ————— (1999). “A Historical Analysis of Monetary Policy Rules,” in John B. Taylor, ed., Monetary Policy Rules. The University of Chicago Press, pp. 319-341. Orphanides, Athanasios (2003). “Historical Monetary Policy Analysis and the Taylor Rule,” Journal of Monetary Economics, vol. 50 (July), pp. 983-1022.
Class I FOMC - Restricted Controlled (FR) Page 31 of 42

Short-term Long-term
Federalfunds
Treasury billssecondary market
CDssecondary
market
Comm.paper Off-the-run Treasury yields Indexed yields Moody’s
Baa
MunicipalBondBuyer
Conventional homemortgages
primary market
4-week 3-month 6-month 3-month 1-month 2-year 5-year 10-year 20-year 5-year 10-year Fixed-rate ARM
1 2 3 4 5 6 7 8 9 10 11 12 13 14 15 16
4.30 4.01 4.08 4.37 4.49 4.30 4.52 4.59 4.79 5.04 2.11 2.22 6.48 5.24 6.37 5.222.19 1.86 2.31 2.63 2.50 2.24 3.11 3.58 3.97 4.28 0.98 1.50 5.64 4.72 5.53 4.10
5.34 5.20 5.13 5.33 5.50 5.30 5.32 5.20 5.32 5.45 2.60 2.68 6.94 5.31 6.80 5.834.22 3.91 4.17 4.37 4.50 4.22 4.34 4.28 4.42 4.59 1.82 1.94 6.17 4.76 6.10 5.15
3.78 3.49 3.79 4.13 4.13 3.84 4.31 4.34 4.56 4.77 1.69 1.94 6.30 5.13 6.07 4.864.00 3.91 3.97 4.30 4.31 4.01 4.44 4.46 4.66 4.85 1.96 2.09 6.39 5.22 6.33 5.144.16 3.67 3.98 4.33 4.45 4.23 4.43 4.39 4.57 4.76 2.07 2.15 6.32 5.18 6.27 5.17
4.29 4.10 4.34 4.47 4.56 4.36 4.42 4.35 4.50 4.67 1.92 2.03 6.24 5.11 6.15 5.174.49 4.38 4.54 4.69 4.72 4.47 4.69 4.60 4.66 4.75 1.97 2.06 6.27 5.12 6.25 5.344.59 4.55 4.63 4.79 4.88 4.61 4.77 4.72 4.82 4.93 2.08 2.21 6.41 5.10 6.32 5.424.79 4.60 4.72 4.90 5.03 4.80 4.92 4.90 5.07 5.24 2.25 2.41 6.68 5.19 6.51 5.624.94 4.69 4.84 5.01 5.15 4.95 5.00 4.98 5.19 5.36 2.26 2.45 6.75 5.24 6.60 5.634.99 4.71 4.92 5.18 5.35 5.12 5.15 5.04 5.18 5.30 2.41 2.54 6.78 5.24 6.68 5.715.24 4.89 5.08 5.27 5.46 5.24 5.15 5.02 5.15 5.26 2.43 2.52 6.76 5.21 6.76 5.795.25 5.17 5.09 5.17 5.38 5.22 4.93 4.79 4.94 5.09 2.24 2.32 6.59 4.98 6.52 5.645.25 4.76 4.93 5.08 5.34 5.21 4.78 4.64 4.80 4.94 2.35 2.35 6.43 4.82 6.40 5.56
5.23 5.16 5.10 5.19 5.37 5.22 4.95 4.81 4.97 5.12 2.24 2.33 6.61 4.97 6.52 5.655.25 5.17 5.10 5.17 5.36 5.21 4.89 4.73 4.88 5.04 2.23 2.27 6.53 4.93 6.48 5.605.26 5.15 5.06 5.14 5.35 5.20 4.84 4.70 4.85 4.99 2.27 2.29 6.50 4.91 6.44 5.595.24 4.89 4.97 5.12 5.34 5.21 4.82 4.71 4.88 5.02 2.33 2.36 6.52 4.88 6.47 5.635.24 4.78 4.93 5.11 5.35 5.20 4.84 4.71 4.87 5.00 2.39 2.39 6.49 4.85 6.43 5.605.24 4.72 4.94 5.07 5.34 5.20 4.78 4.63 4.79 4.92 2.40 2.37 6.40 4.79 6.40 5.545.29 4.61 4.88 5.01 5.32 5.22 4.69 4.53 4.68 4.82 2.29 2.29 6.32 4.77 6.31 5.475.28 4.73 4.92 5.02 5.32 5.19 4.68 4.54 4.70 4.85 2.35 2.33 6.36 4.77 6.30 5.465.24 4.88 5.03 5.11 5.33 5.20 4.87 4.72 4.85 5.00 2.51 2.47 6.50 4.76 6.37 5.56 -- 5.03 5.09 5.15 5.33 5.21 4.87 4.72 4.85 5.00 2.54 2.48 -- -- 6.36 5.57
5.25 4.70 4.91 5.02 5.33 5.22 4.68 4.54 4.69 4.84 2.35 2.32 6.34 -- -- --5.23 4.77 4.93 5.00 5.32 5.21 4.62 4.48 4.65 4.80 2.32 2.30 6.31 -- -- --5.23 4.80 4.94 5.03 5.31 5.20 4.67 4.53 4.69 4.85 2.34 2.32 6.35 -- -- --5.22 4.74 4.94 5.05 5.33 5.10 4.76 4.63 4.78 4.93 2.43 2.39 6.43 -- -- --5.22 -- -- -- -- -- -- -- -- -- -- -- -- -- -- --5.28 4.78 5.00 5.09 5.32 5.21 4.83 4.69 4.83 4.97 2.48 2.44 6.47 -- -- --5.25 4.90 5.02 5.10 5.32 5.20 4.87 4.72 4.86 5.00 2.52 2.48 6.51 -- -- --5.25 4.93 5.06 5.13 5.33 5.19 4.87 4.72 4.85 5.00 2.51 2.48 6.50 -- -- --5.21 4.92 5.05 5.13 5.33 5.20 4.89 4.74 4.88 5.03 2.54 2.49 6.53 -- -- --5.28 5.00 5.09 5.15 5.32 5.22 4.88 4.73 4.86 5.01 2.52 2.47 6.50 -- -- --5.21 5.06 5.09 5.15 5.32 5.19 4.86 4.71 4.85 5.00 2.53 2.48 6.49 -- -- --5.23 5.05 5.09 5.14 5.33 -- 4.86 4.70 4.84 4.98 2.56 2.49 6.47 -- -- --5.24 5.02 5.10 5.16 5.33 -- 4.88 4.73 4.86 5.00 2.58 2.52 -- -- -- --
Appendix C Table 1
Selected Interest Rates(Percent)
NOTE: Weekly data for columns 1 through 13 are week-ending averages. Columns 2 through 4 are on a coupon equivalent basis. Data in column 6 are interpolated from data on certain commercial paper trades settled by theDepository Trust Company. Column 14 is the Bond Buyer revenue index, which is a 1-day quote for Thursday. Column 15 is the average contract rate on new commitments for fixed-rate mortgages (FRMs) with 80 percentloan-to-value ratios at major institutional lenders. Column 16 is the average initial contract rate on new commitments for 1-year, adjustable-rate mortgages (ARMs) at major institutional lenders offering both FRMs andARMs with the same number of discount points.
p - preliminary data
Oct Nov Dec Jan Feb Mar Apr May Jun Jul Aug Sep
Aug Aug Sep Sep Sep Sep Sep Oct Oct Oct
Oct Oct Oct Oct Oct Oct Oct Oct Oct Oct Oct Oct Oct
050505
060606060606060606
1825
18
152229
61320
34569
1011121316171819
06060606060606060606
06060606060606060606060606
05 -- High-- Low
06 -- High-- Low
Monthly
Weekly
Daily
p
MFMA
Class I FOMC - Restricted Controlled (FR) Page 32 of 42

Appendix C Table 2Money Aggregates
Seasonally Adjusted
NontransactionsComponents in M2
M1 M2
1 2 3
Period
Annual growth rates (%):
Annually (Q4 to Q4)2003 7.4 5.6 5.12004 5.4 5.3 5.32005 0.3 4.0 5.1
Quarterly (average)2005-Q4 -0.1 5.0 6.42006-Q1 2.2 6.3 7.4
Q2 0.9 3.0 3.5Q3 p -4.7 3.8 5.9
Monthly2005-Sep. -3.8 5.5 7.9
Oct. 1.7 5.5 6.5Nov. 0.7 3.5 4.2Dec. -5.8 4.8 7.6
2006-Jan. 10.3 10.8 10.9Feb. -4.1 4.0 6.1Mar. 7.9 3.0 1.7Apr. 1.8 3.2 3.6May 5.5 1.0 -0.1June -19.6 5.2 11.6July 2.6 3.7 4.0Aug. -2.8 4.2 5.9Sep. p -10.9 2.7 6.2
Levels ($billions):
Monthly2006-May 1393.1 6787.8 5394.7
June 1370.4 6817.3 5447.0July 1373.4 6838.6 5465.2Aug. 1370.2 6862.3 5492.0Sep. p 1357.8 6878.0 5520.2
Weekly2006-Sep. 4 1388.9 6891.0 5502.1
11 1351.0 6860.0 5509.018 1345.3 6881.1 5535.825 1360.2 6889.5 5529.3
Oct. 2p 1367.7 6903.2 5535.59p 1378.6 6934.0 5555.4
p preliminar y
Class I FOMC - Restricted Controlled (FR) Page 33 of 42
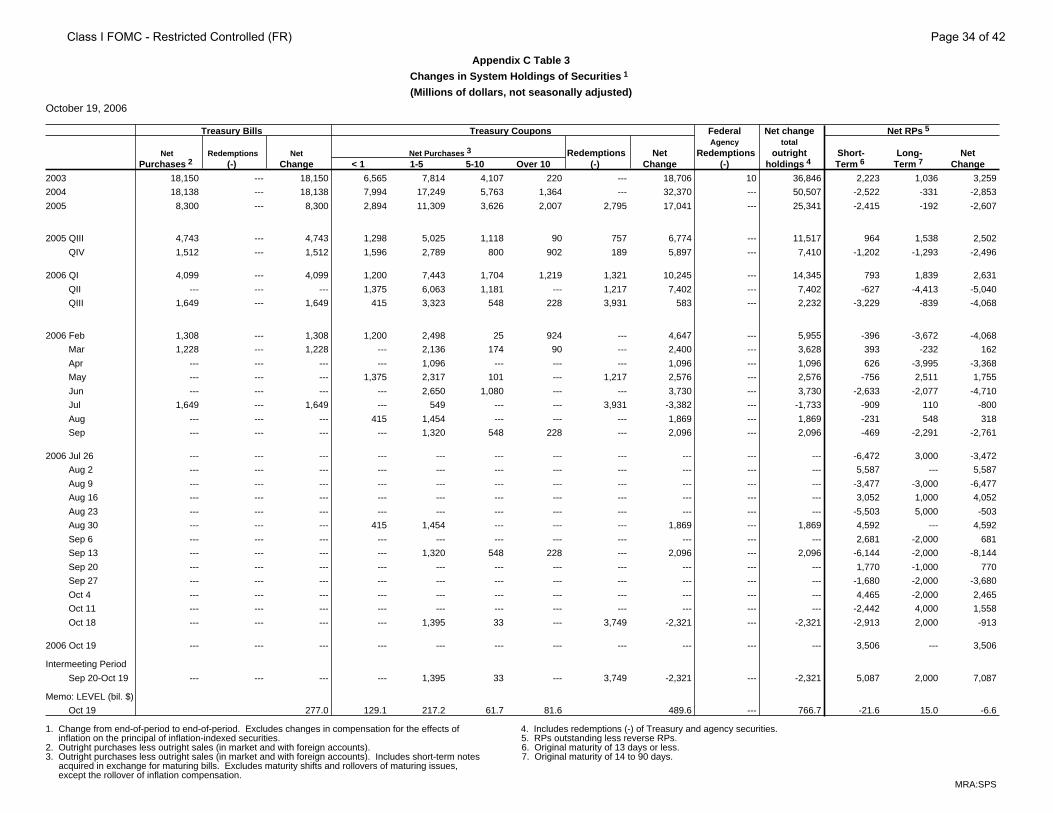
Appendix C Table 3
Changes in System Holdings of Securities 1
(Millions of dollars, not seasonally adjusted)
October 19, 2006
Treasury Bills Treasury Coupons Federal Net change Net RPs 5
Agency totalNet Redemptions Net Net Purchases 3 Redemptions Net Redemptions outright Short- Long- Net
Purchases 2 (-) Change < 1 1-5 5-10 Over 10 (-) Change (-) holdings 4 Term 6 Term 7 Change
2003 18,150 --- 18,150 6,565 7,814 4,107 220 --- 18,706 10 36,846 2,223 1,036 3,259
2004 18,138 --- 18,138 7,994 17,249 5,763 1,364 --- 32,370 --- 50,507 -2,522 -331 -2,853
2005 8,300 --- 8,300 2,894 11,309 3,626 2,007 2,795 17,041 --- 25,341 -2,415 -192 -2,607
2005 QIII 4,743 --- 4,743 1,298 5,025 1,118 90 757 6,774 --- 11,517 964 1,538 2,502
QIV 1,512 --- 1,512 1,596 2,789 800 902 189 5,897 --- 7,410 -1,202 -1,293 -2,496
2006 QI 4,099 --- 4,099 1,200 7,443 1,704 1,219 1,321 10,245 --- 14,345 793 1,839 2,631
QII --- --- --- 1,375 6,063 1,181 --- 1,217 7,402 --- 7,402 -627 -4,413 -5,040
QIII 1,649 --- 1,649 415 3,323 548 228 3,931 583 --- 2,232 -3,229 -839 -4,068
2006 Feb 1,308 --- 1,308 1,200 2,498 25 924 --- 4,647 --- 5,955 -396 -3,672 -4,068
Mar 1,228 --- 1,228 --- 2,136 174 90 --- 2,400 --- 3,628 393 -232 162
Apr --- --- --- --- 1,096 --- --- --- 1,096 --- 1,096 626 -3,995 -3,368
May --- --- --- 1,375 2,317 101 --- 1,217 2,576 --- 2,576 -756 2,511 1,755
Jun --- --- --- --- 2,650 1,080 --- --- 3,730 --- 3,730 -2,633 -2,077 -4,710
Jul 1,649 --- 1,649 --- 549 --- --- 3,931 -3,382 --- -1,733 -909 110 -800
Aug --- --- --- 415 1,454 --- --- --- 1,869 --- 1,869 -231 548 318
Sep --- --- --- --- 1,320 548 228 --- 2,096 --- 2,096 -469 -2,291 -2,761
2006 Jul 26 --- --- --- --- --- --- --- --- --- --- --- -6,472 3,000 -3,472
Aug 2 --- --- --- --- --- --- --- --- --- --- --- 5,587 --- 5,587
Aug 9 --- --- --- --- --- --- --- --- --- --- --- -3,477 -3,000 -6,477
Aug 16 --- --- --- --- --- --- --- --- --- --- --- 3,052 1,000 4,052
Aug 23 --- --- --- --- --- --- --- --- --- --- --- -5,503 5,000 -503
Aug 30 --- --- --- 415 1,454 --- --- --- 1,869 --- 1,869 4,592 --- 4,592
Sep 6 --- --- --- --- --- --- --- --- --- --- --- 2,681 -2,000 681
Sep 13 --- --- --- --- 1,320 548 228 --- 2,096 --- 2,096 -6,144 -2,000 -8,144
Sep 20 --- --- --- --- --- --- --- --- --- --- --- 1,770 -1,000 770
Sep 27 --- --- --- --- --- --- --- --- --- --- --- -1,680 -2,000 -3,680
Oct 4 --- --- --- --- --- --- --- --- --- --- --- 4,465 -2,000 2,465
Oct 11 --- --- --- --- --- --- --- --- --- --- --- -2,442 4,000 1,558
Oct 18 --- --- --- --- 1,395 33 --- 3,749 -2,321 --- -2,321 -2,913 2,000 -913
2006 Oct 19 --- --- --- --- --- --- --- --- --- --- --- 3,506 --- 3,506
Intermeeting Period
Sep 20-Oct 19 --- --- --- --- 1,395 33 --- 3,749 -2,321 --- -2,321 5,087 2,000 7,087
Memo: LEVEL (bil. $)
Oct 19 277.0 129.1 217.2 61.7 81.6 489.6 --- 766.7 -21.6 15.0 -6.6
1. Change from end-of-period to end-of-period. Excludes changes in compensation for the effects of 4. Includes redemptions (-) of Treasury and agency securities. inflation on the principal of inflation-indexed securities. 5. RPs outstanding less reverse RPs.2. Outright purchases less outright sales (in market and with foreign accounts). 6. Original maturity of 13 days or less.3. Outright purchases less outright sales (in market and with foreign accounts). Includes short-term notes 7. Original maturity of 14 to 90 days. acquired in exchange for maturing bills. Excludes maturity shifts and rollovers of maturing issues, except the rollover of inflation compensation.
MRA:SPS
Class I FOMC - Restricted Controlled (FR) Page 34 of 42
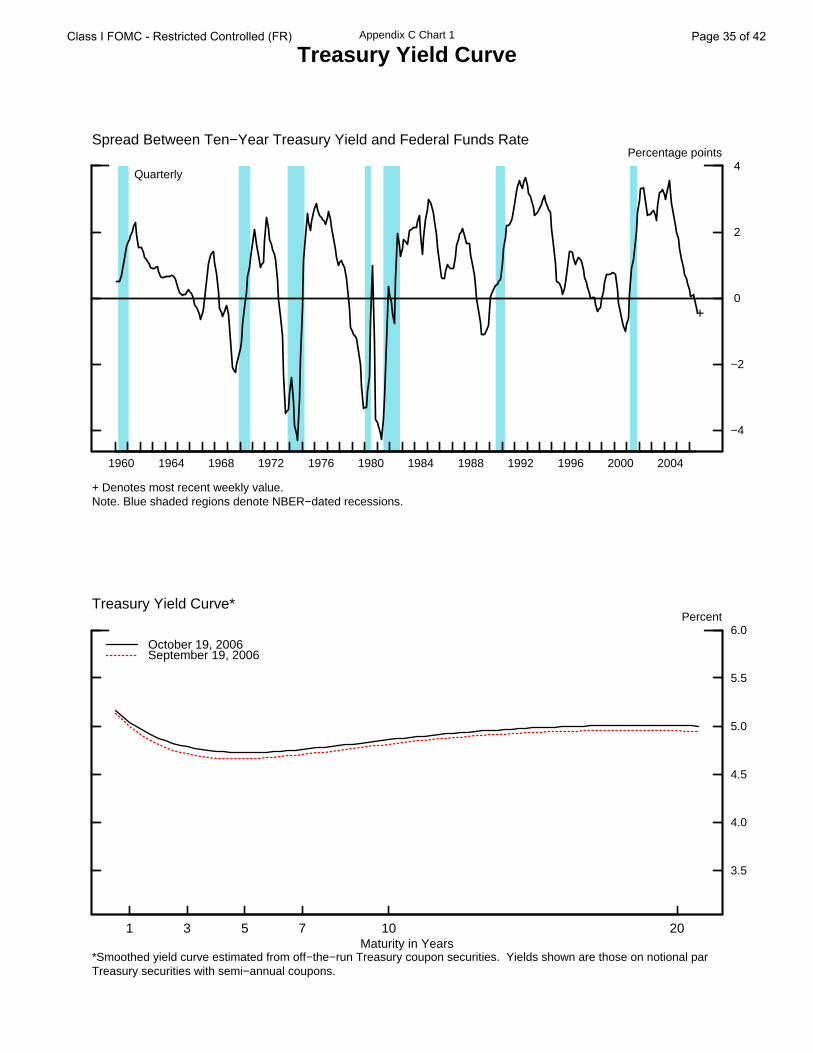
Appendix C Chart 1
Treasury Yield Curve
1960 1964 1968 1972 1976 1980 1984 1988 1992 1996 2000 2004
−4
−2
0
2
4Percentage points
+ Denotes most recent weekly value.Note. Blue shaded regions denote NBER−dated recessions.
+
Spread Between Ten−Year Treasury Yield and Federal Funds Rate
Quarterly
1 3 5 7 10 20
3.5
4.0
4.5
5.0
5.5
6.0Percent
October 19, 2006 September 19, 2006
Treasury Yield Curve*
Maturity in Years*Smoothed yield curve estimated from off−the−run Treasury coupon securities. Yields shown are those on notional par Treasury securities with semi−annual coupons.
Class I FOMC - Restricted Controlled (FR) Page 35 of 42

Appendix C Chart 2
Dollar Exchange Rate Indexes
1973 1976 1979 1982 1985 1988 1991 1994 1997 2000 2003 2006
80
90
100
110
120
130
140
150
Ratio scaleMarch 1973=100
+ Denotes most recent weekly value.
+
Nominal
Major Currencies
Monthly
1973 1976 1979 1982 1985 1988 1991 1994 1997 2000 2003 2006
80
90
100
110
120
130
140
Ratio scaleMarch 1973=100
Real
MajorCurrencies
Broad
Other Important
Monthly
Note. The major currencies index is the trade−weighted average of currencies of the euro area, Canada, Japan, the U.K., Switzerland, Australia, and Sweden. The other important trading partners index is the trade−weighted average of currencies of 19 other important trading partners. The Broad index is the trade−weighted average of currencies of all important trading partners. Real indexes have been adjusted for relative changes in U.S. and foreign consumer prices. Blue shaded regions denote NBER−dated recessions.
Class I FOMC - Restricted Controlled (FR) Page 36 of 42

Appendix C Chart 3
Stock Indexes
0
5
10
15
20
25
30
35
40
45Ratio
+
1960 1964 1968 1972 1976 1980 1984 1988 1992 1996 2000 2004
125
250
500
1000
1500
2000
Ratio scale1941−43=10
* Based on trailing four−quarter earnings.+ Denotes most recent weekly value.
+
Nominal
Monthly
P/E Ratio*
S&P 500
1960 1964 1968 1972 1976 1980 1984 1988 1992 1996 2000 2004
20
40
60
80
100
120
140160
Ratio scale1941−43=10
* Deflated by the CPI.+ Denotes most recent weekly value.Note. Blue shaded regions denote NBER−dated recessions.
+
Real
Monthly
S&P 500*
Class I FOMC - Restricted Controlled (FR) Page 37 of 42
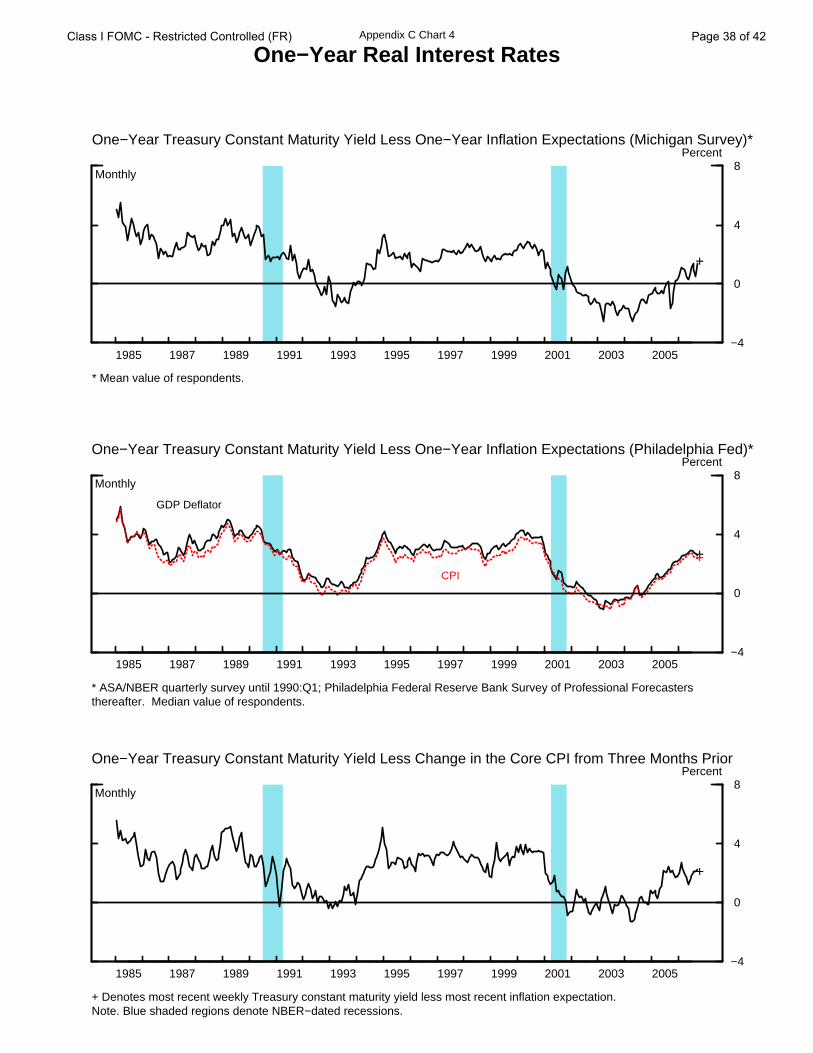
Appendix C Chart 4
One−Year Real Interest Rates
1985 1987 1989 1991 1993 1995 1997 1999 2001 2003 2005−4
0
4
8Percent
* Mean value of respondents.
+
Monthly
One−Year Treasury Constant Maturity Yield Less One−Year Inflation Expectations (Michigan Survey)*
1985 1987 1989 1991 1993 1995 1997 1999 2001 2003 2005−4
0
4
8Percent
* ASA/NBER quarterly survey until 1990:Q1; Philadelphia Federal Reserve Bank Survey of Professional Forecastersthereafter. Median value of respondents.
++
GDP Deflator
CPI
Monthly
One−Year Treasury Constant Maturity Yield Less One−Year Inflation Expectations (Philadelphia Fed)*
1985 1987 1989 1991 1993 1995 1997 1999 2001 2003 2005−4
0
4
8Percent
+ Denotes most recent weekly Treasury constant maturity yield less most recent inflation expectation.Note. Blue shaded regions denote NBER−dated recessions.
+
Monthly
One−Year Treasury Constant Maturity Yield Less Change in the Core CPI from Three Months Prior
Class I FOMC - Restricted Controlled (FR) Page 38 of 42
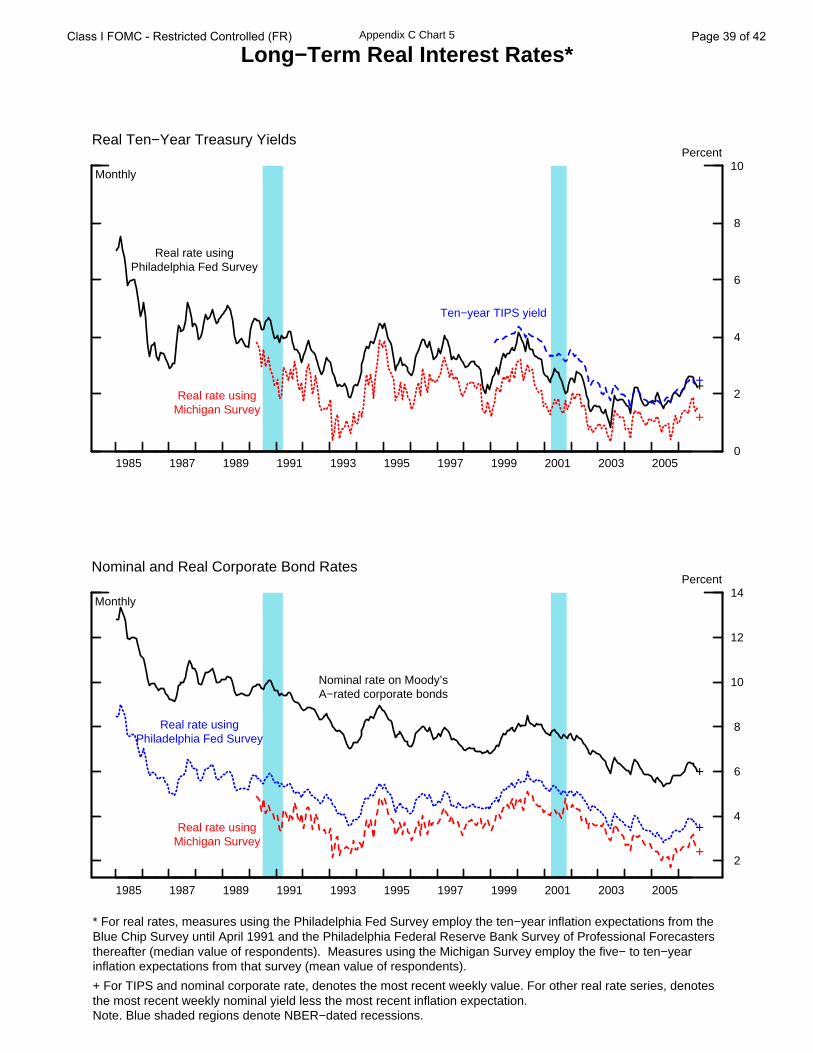
Appendix C Chart 5
Long−Term Real Interest Rates*
1985 1987 1989 1991 1993 1995 1997 1999 2001 2003 2005 0
2
4
6
8
10Percent
+
+
+
Monthly
Real Ten−Year Treasury Yields
Real rate usingPhiladelphia Fed Survey
Real rate usingMichigan Survey
Ten−year TIPS yield
1985 1987 1989 1991 1993 1995 1997 1999 2001 2003 2005
2
4
6
8
10
12
14Percent
+
+
+
Nominal and Real Corporate Bond Rates
Monthly
Nominal rate on Moody’sA−rated corporate bonds
Real rate usingPhiladelphia Fed Survey
Real rate usingMichigan Survey
* For real rates, measures using the Philadelphia Fed Survey employ the ten−year inflation expectations from the Blue Chip Survey until April 1991 and the Philadelphia Federal Reserve Bank Survey of Professional Forecasters thereafter (median value of respondents). Measures using the Michigan Survey employ the five− to ten−year inflation expectations from that survey (mean value of respondents).
+ For TIPS and nominal corporate rate, denotes the most recent weekly value. For other real rate series, denotes the most recent weekly nominal yield less the most recent inflation expectation. Note. Blue shaded regions denote NBER−dated recessions.
Class I FOMC - Restricted Controlled (FR) Page 39 of 42

Appendix C Chart 6
Commodity Price Measures
1985 1987 1989 1991 1993 1995 1997 1999 2001 2003 2005
80
100
120
140
160
180200
Ratio scale, index (1980=100)Journal of Commerce Index
Weekly
TotalMetals
1985 1987 1989 1991 1993 1995 1997 1999 2001 2003 2005
250
300
350
400
450Ratio scale, index (1967=100)
CRB Spot Industrials
Weekly
1985 1987 1989 1991 1993 1995 1997 1999 2001 2003 2005
200
250
300
350
400
450Ratio scale, index (1967=100)
Note. Blue shaded regions denote NBER−dated recessions.
CRB Futures
Weekly
Class I FOMC - Restricted Controlled (FR) Page 40 of 42

Appendix C Chart 7
Growth of M2
1960 1963 1966 1969 1972 1975 1978 1981 1984 1987 1990 1993 1996 1999 2002 2005 2008 0
2
4
6
8
10
12
14Percent
1960 1963 1966 1969 1972 1975 1978 1981 1984 1987 1990 1993 1996 1999 2002 2005 2008 0
2
4
6
8
10
12
14Percent
Nominal M2
Quarterly
1960 1963 1966 1969 1972 1975 1978 1981 1984 1987 1990 1993 1996 1999 2002 2005 2008
−5
0
5
10Percent
1960 1963 1966 1969 1972 1975 1978 1981 1984 1987 1990 1993 1996 1999 2002 2005 2008
−5
0
5
10Percent
Real M2
Quarterly
Note. Four−quarter moving average. Blue shaded regions denote NBER−dated recessions. Gray areas denote projection period. Real M2 is deflated by CPI.
Class I FOMC - Restricted Controlled (FR) Page 41 of 42
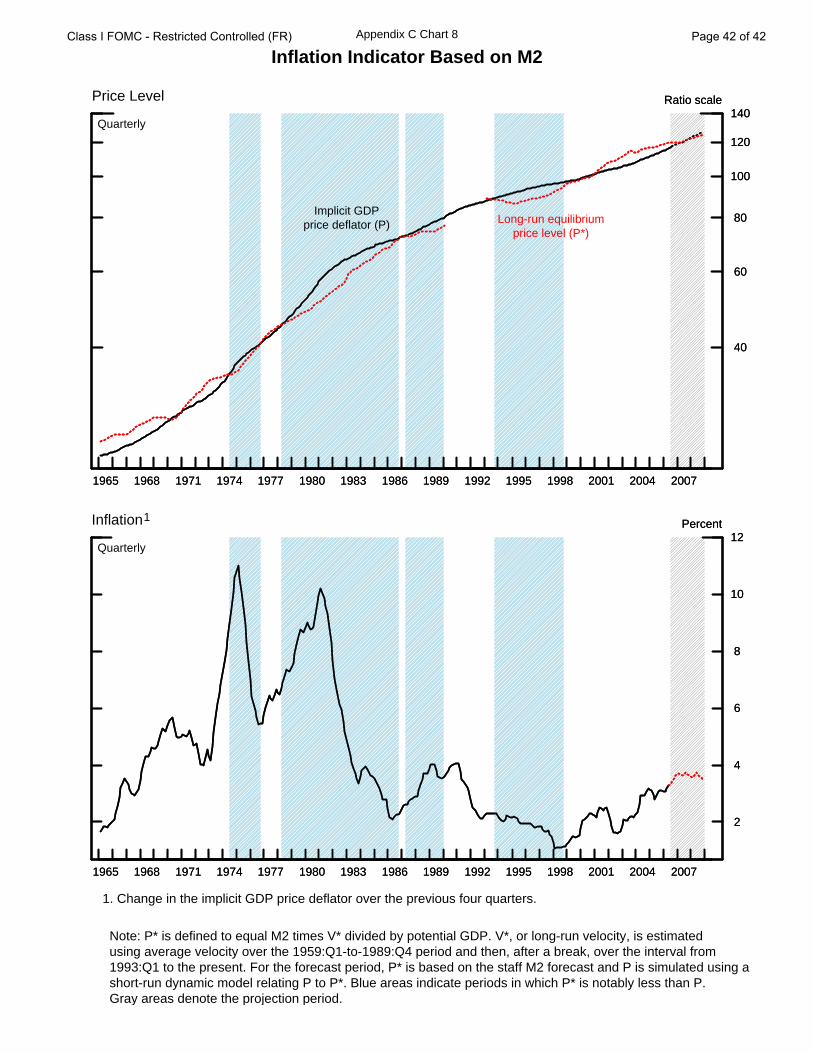
Appendix C Chart 8
Inflation Indicator Based on M2
Note: P* is defined to equal M2 times V* divided by potential GDP. V*, or long-run velocity, is estimatedusing average velocity over the 1959:Q1-to-1989:Q4 period and then, after a break, over the interval from1993:Q1 to the present. For the forecast period, P* is based on the staff M2 forecast and P is simulated using ashort-run dynamic model relating P to P*. Blue areas indicate periods in which P* is notably less than P.Gray areas denote the projection period.
1965 1968 1971 1974 1977 1980 1983 1986 1989 1992 1995 1998 2001 2004 2007
40
60
80
100
120
140Ratio scalePrice Level
Quarterly
Implicit GDPprice deflator (P) Long-run equilibrium
price level (P*)
1965 1968 1971 1974 1977 1980 1983 1986 1989 1992 1995 1998 2001 2004 2007
40
60
80
100
120
140Ratio scale
1965 1968 1971 1974 1977 1980 1983 1986 1989 1992 1995 1998 2001 2004 2007
2
4
6
8
10
12PercentInflation 1
Quarterly
1965 1968 1971 1974 1977 1980 1983 1986 1989 1992 1995 1998 2001 2004 2007
2
4
6
8
10
12Percent
1. Change in the implicit GDP price deflator over the previous four quarters.
Class I FOMC - Restricted Controlled (FR) Page 42 of 42