fomc 20060328 blue book 20060323
TRANSCRIPT
Content last modified 02/09/2012.
Prefatory Note The attached document represents the most complete and accurate version available based on original files from the FOMC Secretariat at the Board of Governors of the Federal Reserve System. Please note that some material may have been redacted from this document if that material was received on a confidential basis. Redacted material is indicated by occasional gaps in the text or by gray boxes around non-text content. All redacted passages are exempt from disclosure under applicable provisions of the Freedom of Information Act.
CLASS I FOMC - RESTRICTED CONTROLLED (FR)
MARCH 23, 2006
MONETARY POLICY ALTERNATIVES
PREPARED FOR THE FEDERAL OPEN MARKET COMMITTEE BY THE STAFF OF THE BOARD OF GOVERNORS OF THE FEDERAL RESERVE SYSTEM

Class I FOMC - Restricted Controlled (FR) March 23, 2006
MONETARY POLICY ALTERNATIVES
Recent Developments
(1) Investors had largely anticipated the FOMC’s decision at the January
meeting to raise the federal funds rate target 25 basis points to 4½ percent, to remove
the word “measured” from the statement, and to indicate that some further policy
firming may be needed.1 However, the Committee’s characterization of the economic
outlook was somewhat more upbeat than investors reportedly had expected, and
short-term interest rates edged up. The Chairman’s semiannual monetary policy
testimony in mid-February and the minutes of the January meeting evidently
contained no significant surprises, leaving little imprint on financial market prices.
With economic data, on net, a touch stronger than market participants had
anticipated, the global economic outlook prompting monetary policy tightening
abroad, and no indication from Federal Reserve officials of an imminent end to this
policy tightening cycle, expectations for the path of policy moved higher. Money
market futures rates for the end of this year and beyond increased around 25 to 30
basis points, on balance, over the intermeeting period (Chart 1). Option-implied
uncertainty about short-term interest rates edged lower. Futures quotes, as well as
responses to the Desk’s dealer survey, suggest that market participants now almost
fully expect a 25 basis point hike in the funds rate at the upcoming meeting, place
significant odds on another such increase in May, and attach some probability to a
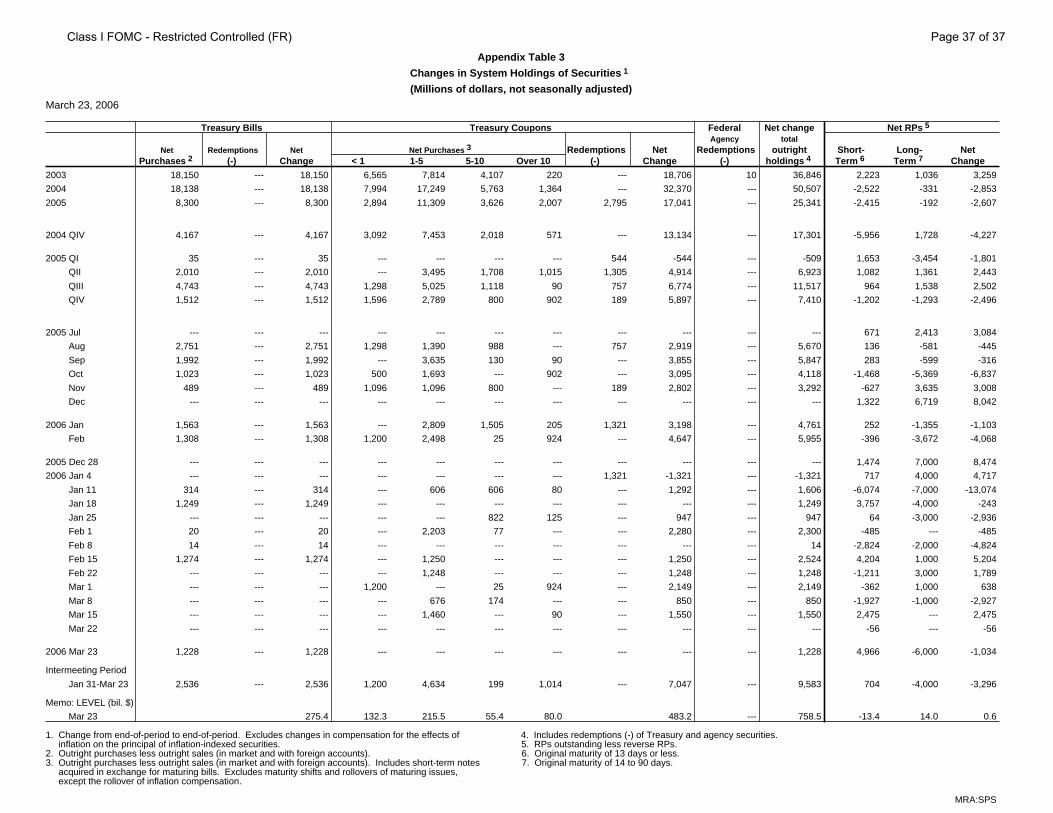
third move in June. The market-based expected path of the funds rate now plateaus 1 The Desk purchased $7.0 billion of Treasury coupon securities in the market and $2.5 billion of Treasury bills, $64 million of which were from foreign customers. The volume of outstanding long-term RPs decreased $4 billion, to $14 billion. Late in the intermeeting period, the funds rate traded firm to the target despite the sizable provision of reserves by the Desk, as reserve managers once again shifted their demand to earlier in the maintenance period given the widespread anticipation of policy firming by the Committee.
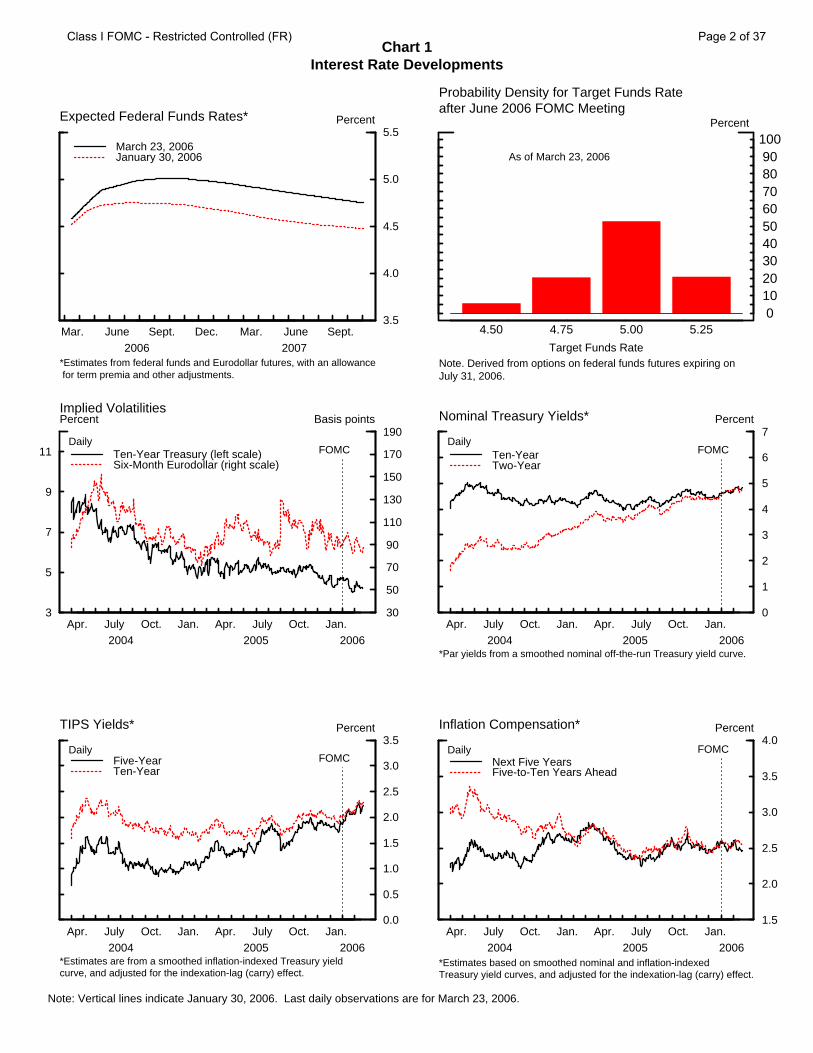
Chart 1Interest Rate Developments
Note: Vertical lines indicate January 30, 2006. Last daily observations are for March 23, 2006.
Mar. June Sept. Dec. Mar. June Sept.2006 2007
3.5
4.0
4.5
5.0
5.5Percent
March 23, 2006January 30, 2006
Expected Federal Funds Rates*
*Estimates from federal funds and Eurodollar futures, with an allowance for term premia and other adjustments.
Probability Density for Target Funds Rateafter June 2006 FOMC Meeting
4.50 4.75 5.00 5.250
102030405060708090
100Percent
Target Funds Rate
As of March 23, 2006
Note. Derived from options on federal funds futures expiring onJuly 31, 2006.
3
5
7
9
11
Apr. July Oct. Jan. Apr. July Oct. Jan.2004 2005 2006
30
50
70
90
110
130
150
170
190Percent Basis points
Ten-Year Treasury (left scale)Six-Month Eurodollar (right scale)
Implied Volatilities
DailyFOMC
Apr. July Oct. Jan. Apr. July Oct. Jan.2004 2005 2006
0
1
2
3
4
5
6
7Percent
Ten-YearTwo-Year
Nominal Treasury Yields*
Daily
*Par yields from a smoothed nominal off-the-run Treasury yield curve.
FOMC
Apr. July Oct. Jan. Apr. July Oct. Jan.2004 2005 2006
0.0
0.5
1.0
1.5
2.0
2.5
3.0
3.5Percent
Five-YearTen-Year
TIPS Yields*
DailyFOMC
*Estimates are from a smoothed inflation-indexed Treasury yieldcurve, and adjusted for the indexation-lag (carry) effect.
Apr. July Oct. Jan. Apr. July Oct. Jan.2004 2005 2006
1.5
2.0
2.5
3.0
3.5
4.0Percent
Next Five YearsFive-to-Ten Years Ahead
Inflation Compensation*
Daily
*Estimates based on smoothed nominal and inflation-indexedTreasury yield curves, and adjusted for the indexation-lag (carry) effect.
FOMC
Class I FOMC - Restricted Controlled (FR) Page 2 of 37
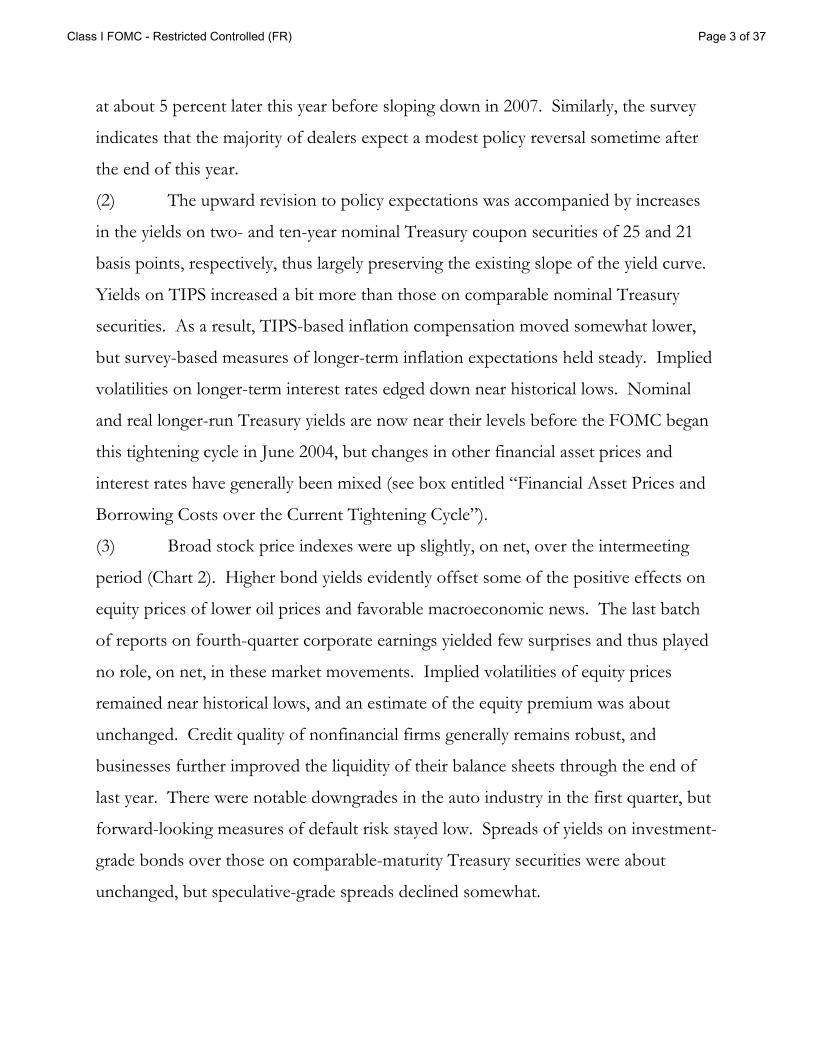
at about 5 percent later this year before sloping down in 2007. Similarly, the survey
indicates that the majority of dealers expect a modest policy reversal sometime after
the end of this year.
(2) The upward revision to policy expectations was accompanied by increases
in the yields on two- and ten-year nominal Treasury coupon securities of 25 and 21
basis points, respectively, thus largely preserving the existing slope of the yield curve.
Yields on TIPS increased a bit more than those on comparable nominal Treasury
securities. As a result, TIPS-based inflation compensation moved somewhat lower,
but survey-based measures of longer-term inflation expectations held steady. Implied
volatilities on longer-term interest rates edged down near historical lows. Nominal
and real longer-run Treasury yields are now near their levels before the FOMC began
this tightening cycle in June 2004, but changes in other financial asset prices and
interest rates have generally been mixed (see box entitled “Financial Asset Prices and
Borrowing Costs over the Current Tightening Cycle”).
(3) Broad stock price indexes were up slightly, on net, over the intermeeting
period (Chart 2). Higher bond yields evidently offset some of the positive effects on
equity prices of lower oil prices and favorable macroeconomic news. The last batch
of reports on fourth-quarter corporate earnings yielded few surprises and thus played
no role, on net, in these market movements. Implied volatilities of equity prices
remained near historical lows, and an estimate of the equity premium was about
unchanged. Credit quality of nonfinancial firms generally remains robust, and
businesses further improved the liquidity of their balance sheets through the end of
last year. There were notable downgrades in the auto industry in the first quarter, but
forward-looking measures of default risk stayed low. Spreads of yields on investment-
grade bonds over those on comparable-maturity Treasury securities were about
unchanged, but speculative-grade spreads declined somewhat.
Class I FOMC - Restricted Controlled (FR) Page 3 of 37

Financial Asset Prices and Borrowing Costs over the Current Tightening Cycle The FOMC has increased the target funds rate 3½ percentage points since the inception of tightening at the June 2004 meeting, but changes in financial conditions have been mixed. As noted in the lower left panel, policy firming over the first year of the tightening cycle played out about as investors expected just before the June 2004 meeting. Over the past few meetings, however, the FOMC has delivered a firmer stance of policy than had been anticipated. As indicated in the table to the right, yields on two-year nominal Treasury securities have increased almost 2 percentage points since the onset of policy tightening. However, reflecting substantial declines in distant forward rates, ten-year yields are about unchanged on net. Long-term indexed Treasury yields are also unchanged, implying little change in inflation compensation at that horizon. Yields on investment-grade corporate bonds have moved about in line with those on comparable-maturity Treasury securities, leaving their spreads largely unchanged. Speculative-grade yields have declined 15 basis points, and spreads have fallen almost 1 percentage point. EMBI+ spreads have narrowed almost 3 percentage points, implying a substantial decline in the yields on such instruments. In addition, the Wilshire 5000 has advanced around 18 percent, and the nominal exchange value of the dollar against a broad index of currencies has depreciated 4 percent since the Committee began raising rates. Some measures of borrowing costs for households and businesses have increased notably since the June 2004 FOMC. At the shorter end of the maturity spectrum, average rates on automobile loans have increased about 50 basis points, and those on home equity lines of credit have risen almost 3 percentage points. The rate on thirty-year fixed-rate mortgages, in contrast, has risen about 10 basis points. The reported average rate on commercial and industrial loans has increased almost 3½ percentage points.
Class I FOMC - Restricted Controlled (FR) Page 4 of 37

Chart 2Asset Market Developments
Note: Vertical lines indicate January 30, 2006. Last daily observations are for March 23, 2006.
Apr. Aug. Dec. Apr. Aug. Dec.2004 2005 2006
80
90
100
110
120
130Index(12/31/03=100)
WilshireNasdaq
FOMC
Stock Prices
Daily
Apr. July Oct. Jan. Apr. July Oct. Jan.2004 2005 2006
0
10
20
30
40Percent
S&P 500Nasdaq
Implied Volatilities
DailyFOMC
0
2
4
6
8
10
12
1988 1992 1996 2000 2004
12-Month Forward Trend E/P Ratio
Real Long-Term Treasury Yield*
+
+
*Perpetuity Treasury yield minus Philadelphia Fed 10-year expected inflation.Note. + Denotes the latest observation using daily interest rates and stock prices and latest earnings data from I/B/E/S.
Equity Valuation
Monthly
Percent
0
2
4
6
8
10
12
1989 1991 1993 1995 1997 1999 2001 2003 2005-30
-20
-10
0
10
20
30
S&P 500 EPSNIPA, economicprofits before tax
Quarterly*
Corporate Earnings Growth Percent
*Change from four quarters earlier. Source. I/B/E/S for S&P 500 EPS.
Q4
Q3
0.0
0.5
1.0
1.5
2.0
1999 2000 2001 2002 2003 2004 20050
1
2
3
4
5
6
7
8Percent of Liabilities Percent of Outstandings
Expected Defaults* (left scale)Bond Default Rate** (right scale)
Expected Defaults of Nonfinancial Companiesand Corporate Bond Default Rate
Monthly
*Firm-level estimates of year-ahead defaults from KMV corporation, weightedby firm liabilities as a percent of total liabilities, excluding defaulted firms.**Six-month moving average, from Moody’s Investors Service
Feb
80
120
160
200
240
280
Apr. Aug. Dec. Apr. Aug. Dec.2004 2005 2006
0
125
250
375
500
625
750
Basis points Basis points
Ten-Year BBB (left scale)Five-Year High-Yield (right scale)
FOMC
Corporate Bond Spreads*
Daily
*Measured relative to an estimated off-the-run Treasury yield curve.
Class I FOMC - Restricted Controlled (FR) Page 5 of 37
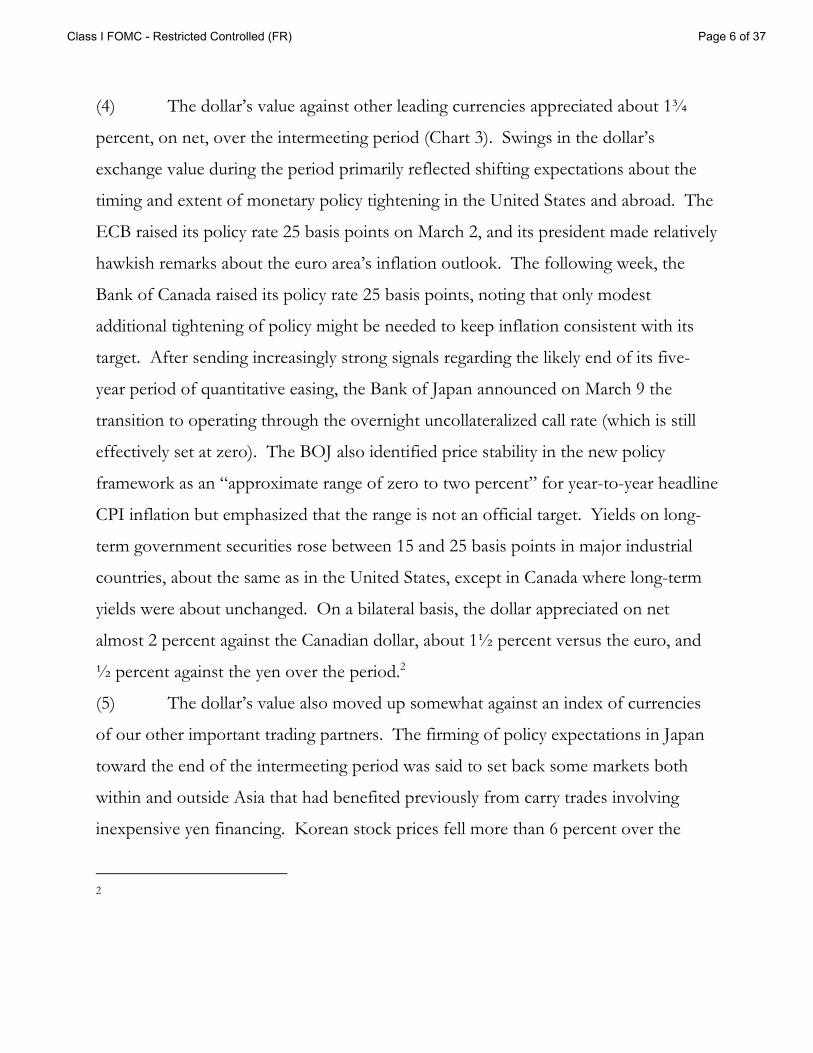
(4) The dollar’s value against other leading currencies appreciated about 1¾
percent, on net, over the intermeeting period (Chart 3). Swings in the dollar’s
exchange value during the period primarily reflected shifting expectations about the
timing and extent of monetary policy tightening in the United States and abroad. The
ECB raised its policy rate 25 basis points on March 2, and its president made relatively
hawkish remarks about the euro area’s inflation outlook. The following week, the
Bank of Canada raised its policy rate 25 basis points, noting that only modest
additional tightening of policy might be needed to keep inflation consistent with its
target. After sending increasingly strong signals regarding the likely end of its five-
year period of quantitative easing, the Bank of Japan announced on March 9 the
transition to operating through the overnight uncollateralized call rate (which is still
effectively set at zero). The BOJ also identified price stability in the new policy
framework as an “approximate range of zero to two percent” for year-to-year headline
CPI inflation but emphasized that the range is not an official target. Yields on long-
term government securities rose between 15 and 25 basis points in major industrial
countries, about the same as in the United States, except in Canada where long-term
yields were about unchanged. On a bilateral basis, the dollar appreciated on net
almost 2 percent against the Canadian dollar, about 1½ percent versus the euro, and
½ percent against the yen over the period.2
(5) The dollar’s value also moved up somewhat against an index of currencies
of our other important trading partners. The firming of policy expectations in Japan
toward the end of the intermeeting period was said to set back some markets both
within and outside Asia that had benefited previously from carry trades involving
inexpensive yen financing. Korean stock prices fell more than 6 percent over the
2
Class I FOMC - Restricted Controlled (FR) Page 6 of 37
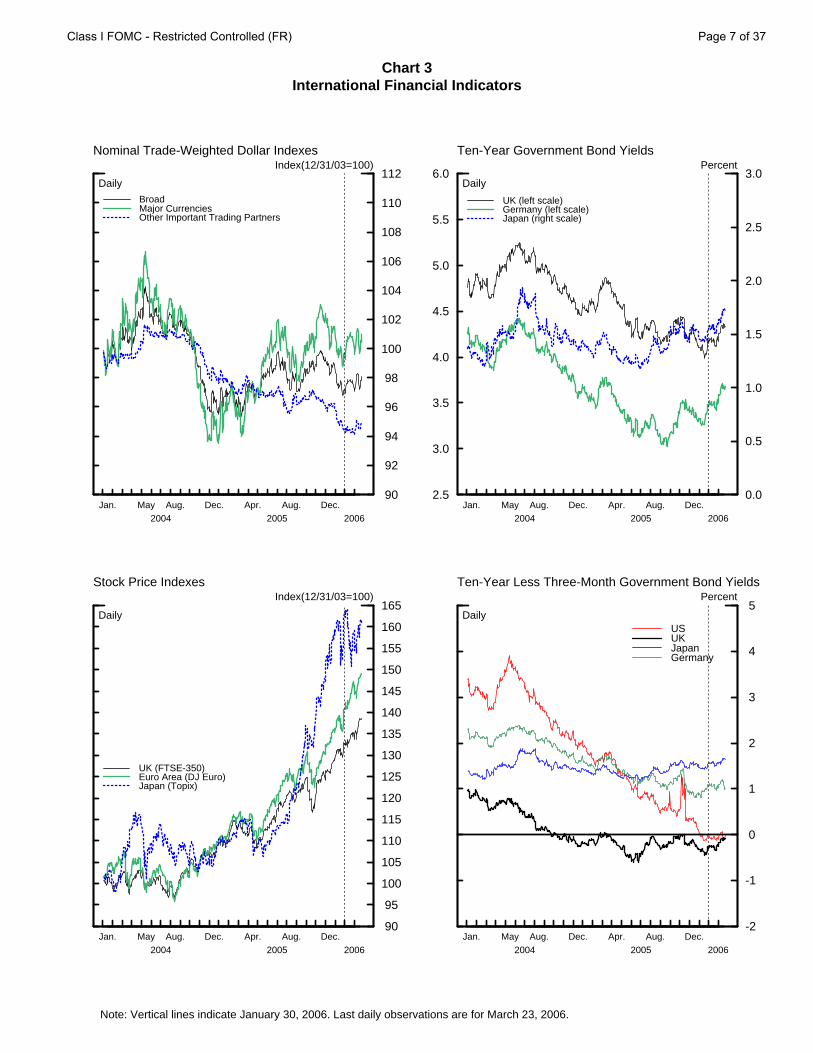
Chart 3International Financial Indicators
Note: Vertical lines indicate January 30, 2006. Last daily observations are for March 23, 2006.
Jan. May Aug. Dec. Apr. Aug. Dec.2004 2005 2006
90
92
94
96
98
100
102
104
106
108
110
112
BroadMajor CurrenciesOther Important Trading Partners
Nominal Trade-Weighted Dollar Indexes
Daily
Index(12/31/03=100)
2.5
3.0
3.5
4.0
4.5
5.0
5.5
6.0
Jan. May Aug. Dec. Apr. Aug. Dec.2004 2005 2006
0.0
0.5
1.0
1.5
2.0
2.5
3.0
UK (left scale)Germany (left scale)Japan (right scale)
Ten-Year Government Bond Yields
Daily
Percent
Jan. May Aug. Dec. Apr. Aug. Dec.2004 2005 2006
90
95
100
105
110
115
120
125
130
135
140
145
150
155
160
165
UK (FTSE-350)Euro Area (DJ Euro)Japan (Topix)
Stock Price Indexes
Daily
Index(12/31/03=100)
Jan. May Aug. Dec. Apr. Aug. Dec.2004 2005 2006
-2
-1
0
1
2
3
4
5
USUKJapanGermany
Ten-Year Less Three-Month Government Bond Yields
Daily
Percent
Class I FOMC - Restricted Controlled (FR) Page 7 of 37

intermeeting period. The dollar gained almost 4 percent against the Mexican peso.
On balance, the Brazilian real rose 2½ percent against the dollar, and Brazil’s EMBI+
spread reached a historical low in late February. With prospects for inflation
improving, the Brazilian central bank cut its policy rate 75 basis points in early March.
(6) Gross issuance of U.S. corporate bonds, growth in commercial paper, and
expansion of business loans at commercial banks have recently moderated (Chart 4).
The Survey of Terms of Business Lending suggests that spreads on commercial and
industrial loans remain narrow. Household mortgage borrowing is projected to slow
somewhat this quarter in response to increased mortgage interest rates. Consumer
credit is expected to rebound some in the current quarter after contracting last fall
because of elevated charge-offs related to the spike in bankruptcy filings. Federal
debt is projected to accelerate this quarter. Although federal debt hit its statutory
limit on February 16, financial market effects appeared minimal, and the Congress
voted to raise the ceiling to nearly $9 trillion on March 16. In sum, domestic
nonfinancial sector debt is expected to moderate only a bit in the current quarter from
its 9½ percent pace in the fourth quarter.
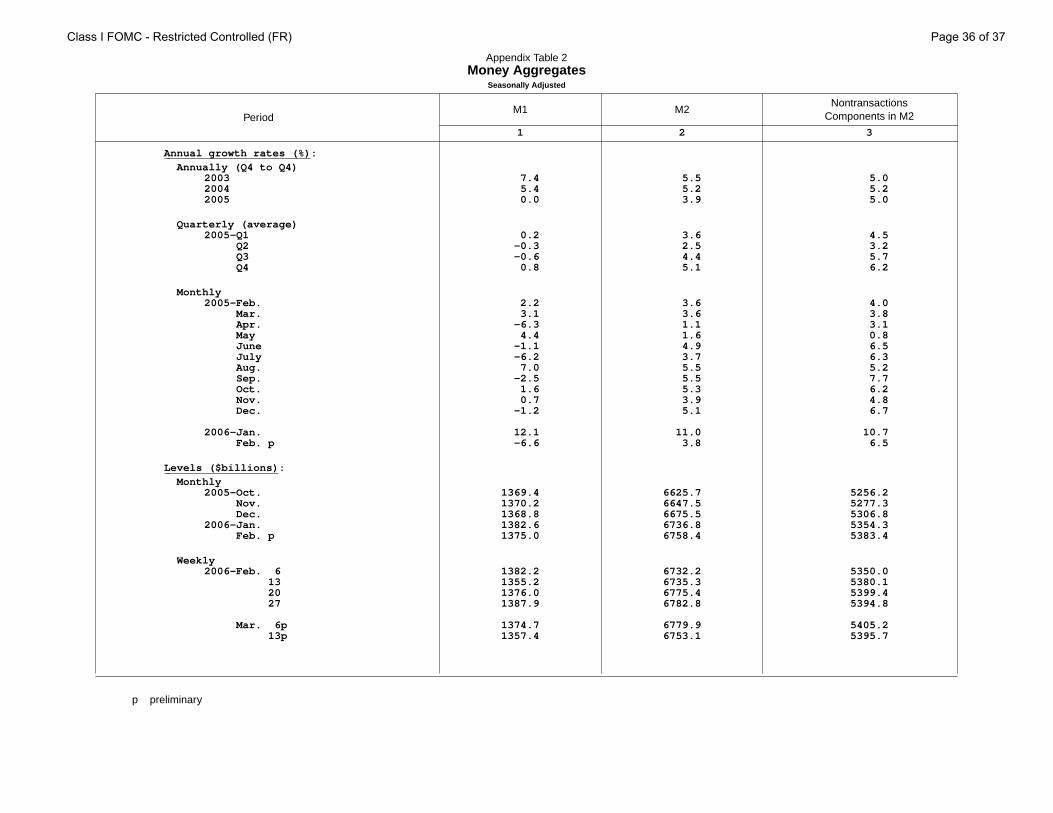
(7) On average, M2 grew briskly in January and February. Liquid deposits
expanded moderately, while currency, small time deposits, and retail money funds
advanced strongly. Further increases in offering rates supported increases in small
time deposits and money funds. Nonetheless, M2 is expected to grow less rapidly
than nominal GDP in the current quarter, reflecting the continuing effects of rising
opportunity costs on money demand.
Class I FOMC - Restricted Controlled (FR) Page 8 of 37
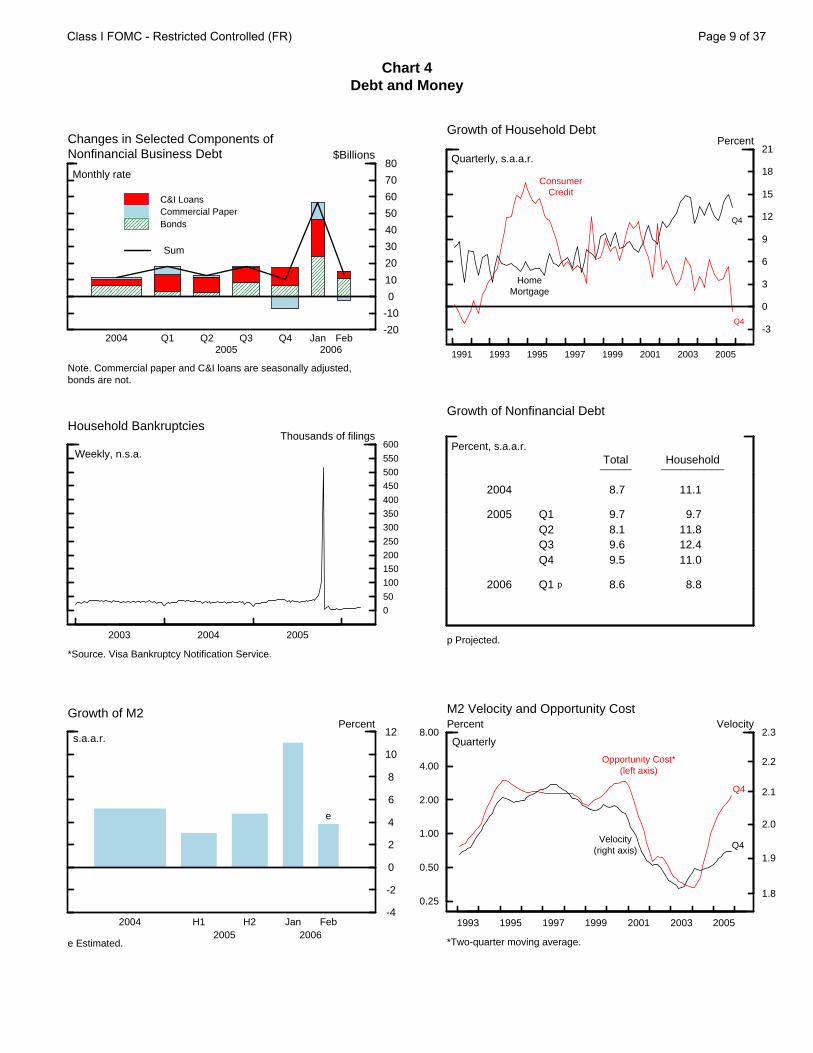
Chart 4Debt and Money
-20
-10
0
10
20
30
40
50
60
70
80
C&I LoansCommercial PaperBonds
Sum
Changes in Selected Components ofNonfinancial Business Debt $Billions
2004 Q1 Q2 Q3 Q4 Jan Feb2005 2006
Monthly rate
Note. Commercial paper and C&I loans are seasonally adjusted,bonds are not.
1991 1993 1995 1997 1999 2001 2003 2005
-3
0
3
6
9
12
15
18
21
Growth of Household DebtPercent
Quarterly, s.a.a.r.
Q4
Q4
ConsumerCredit
HomeMortgage
2003 2004 2005
0
50
100
150
200
250
300
350
400
450
500
550
600
Household BankruptciesThousands of filings
Weekly, n.s.a.
*Source. Visa Bankruptcy Notification Service.
Growth of Nonfinancial Debt
Percent, s.a.a.r.
2004
2005
2006
Q1Q2Q3Q4
Q1 p
Total_____
8.7
9.78.19.69.5
8.6
Household__________
11.1
9.711.812.411.0
8.8
p Projected.
-4
-2
0
2
4
6
8
10
12
Growth of M2
s.a.a.r.Percent
e
e Estimated.
2004 H1 H2 Jan Feb2005 2006
0.25
0.50
1.00
2.00
4.00
8.00
1993 1995 1997 1999 2001 2003 2005
1.8
1.9
2.0
2.1
2.2
2.3
M2 Velocity and Opportunity CostVelocityPercent
Quarterly
Opportunity Cost*(left axis)
Velocity(right axis)
*Two-quarter moving average.
Q4
Q4
Class I FOMC - Restricted Controlled (FR) Page 9 of 37
Economic Outlook
(8) The expansion of real GDP reported in the fourth quarter of 2005 was
somewhat below the projection in the January Greenbook, but incoming data on
spending indicate that this shortfall has been made up in the current quarter. With a
bit more momentum to aggregate demand and a slightly lower path for potential
output than in the last Greenbook, the staff now assumes that the federal funds rate
will rise to 5 percent later this spring and edge back to 4¾ percent after mid-year
2007―quite close to the trajectory implied by futures quotes. Given the close
alignment of the staff policy assumption with market expectations, longer-term
interest rates are projected to remain around their current levels. Equity prices are
expected to rise at a rate sufficient to generate risk-adjusted returns comparable to
those on fixed-income investments, the foreign exchange value of the dollar is
assumed to depreciate modestly, and spot oil prices are projected to move somewhat
higher. In addition, house price appreciation is expected to slow markedly. Against
this backdrop, and taking into account the temporary boost to spending from
hurricane-related rebuilding, real GDP is projected to expand 3¾ percent over 2006,
but to slow to a 3 percent pace next year. The level of output is now estimated to be
close to potential and is anticipated to remain so over the projection period. The
unemployment rate is forecast to edge up a bit over coming quarters but to stay just
under 5 percent―the staff estimate of the NAIRU. Total and core PCE inflation are
both expected to be a little above 2 percent this year and then to drop just below 2
percent next year.
Class I FOMC - Restricted Controlled (FR) Page 10 of 37

Policy Alternatives
(9) This Bluebook presents three alternatives for the Committee’s consideration
(see Table 1). Under Alternatives B and C, the federal funds rate target would be
raised 25 basis points at this meeting and the risk assessment would remain
asymmetric. Alternative A envisions leaving the funds rate target unchanged and
switching to an assessment that the risks to the Committee’s objectives are balanced at
the current level of the funds rate. The statements under all three alternatives would
continue to emphasize that future policy action will depend on incoming economic
data, although the wording of Alternative A makes that more explicit. As usual, the
Committee could consider combining the policy action and draft language from more
than one alternative or view some of the language options as possibilities for the
future.
(10) If the Committee agrees with the staff forecast and views the outcomes in
this projection to be acceptable, then it may wish to raise the target rate a quarter
point at this meeting and signal the possibility of some subsequent tightening, as in
Alternative B. The Committee may believe that it has already brought the real
federal funds rate near its equilibrium level, a perception consistent with the range of
staff estimates shown in Chart 5. But the Committee may also believe that inflation is
running in the upper end of the range consistent with price stability, thereby making a
higher real funds rate desirable. If the Committee shared the staff assessment that
resource slack had been about eliminated, then it might want to be especially vigilant
concerning the risks to inflation from upside surprises in aggregate demand. More
generally, if members view the current configuration of market expectations for policy
and its consequences for asset prices as appropriate given the economic outlook, then
they may wish to confirm these expectations by choosing this alternative.
(11) The rationale paragraph of Alternative B begins by observing that the
economy appears to have bounced back from the deceleration in the fourth quarter of
Class I FOMC - Restricted Controlled (FR) Page 11 of 37
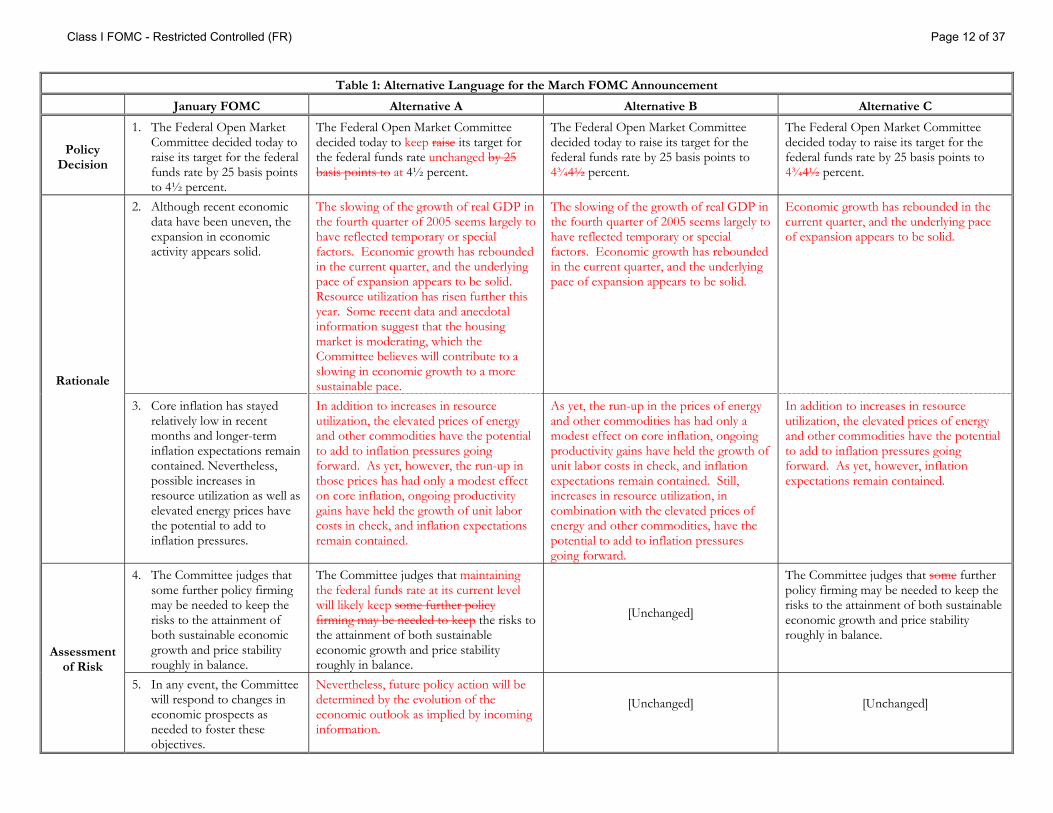
Table 1: Alternative Language for the March FOMC Announcement
January FOMC Alternative A Alternative B Alternative C
Policy Decision
1. The Federal Open Market Committee decided today to raise its target for the federal funds rate by 25 basis points to 4½ percent.
The Federal Open Market Committee decided today to keep raise its target for the federal funds rate unchanged by 25 basis points to at 4½ percent.
The Federal Open Market Committee decided today to raise its target for the federal funds rate by 25 basis points to 4¾4½ percent.
The Federal Open Market Committee decided today to raise its target for the federal funds rate by 25 basis points to 4¾4½ percent.
2. Although recent economic data have been uneven, the expansion in economic activity appears solid.
The slowing of the growth of real GDP in the fourth quarter of 2005 seems largely to have reflected temporary or special factors. Economic growth has rebounded in the current quarter, and the underlying pace of expansion appears to be solid. Resource utilization has risen further this year. Some recent data and anecdotal information suggest that the housing market is moderating, which the Committee believes will contribute to a slowing in economic growth to a more sustainable pace.
The slowing of the growth of real GDP in the fourth quarter of 2005 seems largely to have reflected temporary or special factors. Economic growth has rebounded in the current quarter, and the underlying pace of expansion appears to be solid.
Economic growth has rebounded in the current quarter, and the underlying pace of expansion appears to be solid.
Rationale
3. Core inflation has stayed relatively low in recent months and longer-term inflation expectations remain contained. Nevertheless, possible increases in resource utilization as well as elevated energy prices have the potential to add to inflation pressures.
In addition to increases in resource utilization, the elevated prices of energy and other commodities have the potential to add to inflation pressures going forward. As yet, however, the run-up in those prices has had only a modest effect on core inflation, ongoing productivity gains have held the growth of unit labor costs in check, and inflation expectations remain contained.
As yet, the run-up in the prices of energy and other commodities has had only a modest effect on core inflation, ongoing productivity gains have held the growth of unit labor costs in check, and inflation expectations remain contained. Still, increases in resource utilization, in combination with the elevated prices of energy and other commodities, have the potential to add to inflation pressures going forward.
In addition to increases in resource utilization, the elevated prices of energy and other commodities have the potential to add to inflation pressures going forward. As yet, however, inflation expectations remain contained.
4. The Committee judges that some further policy firming may be needed to keep the risks to the attainment of both sustainable economic growth and price stability roughly in balance.
The Committee judges that maintaining the federal funds rate at its current level will likely keep some further policy firming may be needed to keep the risks to the attainment of both sustainable economic growth and price stability roughly in balance.
[Unchanged]
The Committee judges that some further policy firming may be needed to keep the risks to the attainment of both sustainable economic growth and price stability roughly in balance.
Assessment of Risk
5. In any event, the Committee will respond to changes in economic prospects as needed to foster these objectives.
Nevertheless, future policy action will be determined by the evolution of the economic outlook as implied by incoming information.
[Unchanged]
[Unchanged]
Class I FOMC - Restricted Controlled (FR) Page 12 of 37

Chart 5Equilibrium Real Federal Funds Rate
1990 1991 1992 1993 1994 1995 1996 1997 1998 1999 2000 2001 2002 2003 2004 2005 2006 2007 2008
-2
-1
0
1
2
3
4
5
6
7
8Percent
25 b.p. TighteningCurrent Rate
Notes: Confidence intervals reflect uncertainties about model specification, coefficients, and the level of potential output.The final column indicates the values for the current quarter based on the estimation for the previous Bluebook, exceptthat the TIPS-consistent measure and the actual real funds rate are the values published in the previous Bluebook.
Short-Run Estimates with Confidence Intervals
Short-Run and Medium-Run Measures
Actual real federal funds rateRange of model-based estimates70 percent confidence interval90 percent confidence intervalGreenbook-consistent measure
Current Estimate Previous Bluebook
Short-Run Measures Single-equation model 1.9 1.9 Small structural model 2.3 2.3 Large model (FRB/US) 3.1 3.5 Confidence intervals for three model-based estimates 70 percent confidence interval (0.9 - 3.9( 90 percent confidence interval -0.1 - 4.8(
Greenbook-consistent measure 2.8 2.5
Medium-Run Measures Single-equation model 2.2 2.1 Small structural model 2.4 2.5 Confidence intervals for two model-based estimates 70 percent confidence interval (1.4 - 3.2( 90 percent confidence interval (0.7 - 3.7(
TIPS-based factor model 2.1 2.1
Memo Actual real federal funds rate 2.74 2.51
Class I FOMC - Restricted Controlled (FR) Page 13 of 37

Equilibrium Real Rate Chart: Explanatory Notes The equilibrium real rate is the real federal funds rate that, if maintained, would be projected to return output to its potential level over time. For the first three measures listed below, the short-run equilibrium rate is defined as the rate that would close the output gap in twelve quarters given the corresponding model’s projection of the economy. For the first two measures, the medium-run concept is the value of the real federal funds rate projected to keep output at potential in seven years under the assumption that monetary policy acts to bring actual and potential output into line in the short run and then keeps them equal thereafter. The TIPS-based factor model measure provides an estimate of market expectations for the real federal funds rate seven years ahead. The actual real federal funds rate is constructed as the difference between the nominal rate and realized inflation, where the nominal rate is measured as the quarterly average of the observed federal funds rate, and realized inflation is given by the log difference between the staff’s estimate of the core PCE price index and its lagged value four quarters earlier. For the current quarter, the nominal rate is specified as the target federal funds rate on the Bluebook publication date.
Measure Description
Single-equation Model
The measure of the equilibrium real rate in the single-equation model is based on an estimated aggregate-demand relationship between the current value of the output gap and its lagged values as well as the lagged values of the real federal funds rate. In light of this model’s simple structure, the short-run measure of the equilibrium real rate depends only on the recent position of output relative to potential, and the medium-run measure is virtually constant.
Small Structural Model
The small-scale model of the economy consists of equations for five variables: the output gap, the equity premium, the federal budget surplus, the trend growth rate of output, and the real bond yield. Unlike the estimates from the single-equation model, values of the equilibrium real rate also depend directly on conditions associated with output growth, fiscal policy, and capital markets.
Large Model (FRB/US)
Estimates of the equilibrium real rate using FRB/US—the staff’s large-scale econometric model of the U.S. economy—depend on a very broad array of economic factors, some of which take the form of projected values of the model’s exogenous variables. These projections make use of several simple forecasting rules which are appropriate for the three-year horizon relevant for the short-run concept but are less sensible over longer horizons. Thus, we report only the short-run measure for the FRB/US model.
Greenbook-consistent
Measures of the equilibrium real rate cannot be directly obtained from the Greenbook forecast, because the Greenbook is not based on a formal model. Rather, we use the FRB/US model in conjunction with an extended version of the Greenbook forecast to derive a Greenbook-consistent measure. FRB/US is first add-factored so that its simulation matches the extended Greenbook forecast, and then a second simulation is run off this baseline to determine the value of the real federal funds rate that closes the output gap. The medium-run concept of the equilibrium real rate is not computed because it requires a relatively long extension of the Greenbook forecast.
TIPS-based Factor Model
Yields on TIPS (Treasury Inflation-Protected Securities) reflect investors’ expectations of the future path of real interest rates, but also include term and liquidity premiums. The TIPS-based measure of the equilibrium real rate is constructed using the seven-year-ahead instantaneous real forward rate derived from TIPS yields as of the Bluebook publication date. This forward rate is adjusted to remove estimates of the term and liquidity premiums based on a three-factor arbitrage-free term-structure model applied to TIPS yields, nominal yields, and inflation. Because TIPS indexation is based on the total CPI, this measure is also adjusted for the medium-term difference—projected at 40 basis points—between total CPI inflation and core PCE inflation.
Class I FOMC - Restricted Controlled (FR) Page 14 of 37

last year. The discussion of inflation risks in Alternative B is similar to that employed
in the last statement, but goes into a little more detail. It is cautiously optimistic in its
assessment of inflation pressures: Inflation expectations remain contained, the pass-
through of cost pressures has been limited, and productivity gains have kept unit
labor costs in check. The statement nonetheless acknowledges that elevated prices of
energy and other commodities and increases in resource utilization have the potential
to add to inflationary pressures in the future. The reference to “possible increases” in
resource utilization employed in the last two announcements is changed to
“increases” in resource utilization, in response to the robust spending and labor
market data received over the intermeeting period. The retention from the January
statement of the indication that “some further policy firming may be needed” to keep
the risks to the Committee’s objectives balanced provides the Committee with
considerable flexibility regarding subsequent policy decisions. However, if members
wanted to signal that the end of the tightening cycle was likely very close, then they
might prefer to state instead that “some modest additional policy firming may be
needed.”
(12) Investors are virtually certain of a 25-basis-point rate hike at this meeting
and place quite high odds on another such move in May. Selection of Alternative B
would probably confirm those expectations, sparking only a limited market reaction.
Short-term interest rates would likely change little immediately after the
announcement. Market participants of late seem to be looking to policymakers for
clues as to when the tightening cycle will end. Expectations of a rate hike at the May
meeting will probably increase over the course of the upcoming intermeeting period
in the absence of guidance from policymakers.
(13) Although the Committee has raised rates 3½ percentage points since June
2004, the ten-year Treasury yield is almost unchanged on net over this period, as are
high-grade corporate yields, while yields on more-speculative issues have fallen. To
Class I FOMC - Restricted Controlled (FR) Page 15 of 37

the extent that the Committee views the flat yield curve and narrow risk spreads as
evidence of an optimistic perception of and greater tolerance for risk on the part of
investors, then it may believe that financial conditions remain accommodative. Given
the judgment that resource slack is limited, members may want to tighten these
conditions somewhat, so as not to risk allowing the economy to overheat. If so,
members may not be content with simply validating existing expectations for
monetary policy tightening, as in Alternative B, preferring instead to hint at a firmer
path of policy by adopting a more hawkish rationale paragraph, as in Alternative C.
Members may be inclined to this course of action if they are particularly worried
about inflation risks, perhaps because of the possibility that increases in labor and
intermediate material costs could put additional upward pressure on prices, as
discussed in an alternative simulation in the Greenbook, or if they have doubts that
the housing market will in fact cool as much as in the staff forecast, given that
aggregate house price data have so far shown only a slight slowdown in the pace of
appreciation.
(14) The rationale paragraph in Alternative C does not directly refer to the
slowing of growth in the fourth quarter of last year, observing only that economic
growth has now rebounded to a solid pace. The discussion of inflation risks does not
reference the limited pass-through of cost pressures or ongoing productivity gains, as
in Alternative B, and instead simply concludes that “As yet, however, inflation
expectations remain contained.” This might be read as a signal that the Committee is
worried that inflation expectations could soon become unmoored. In addition, the
modifier “some” limiting the extent of additional tightening in the January statement
has been dropped, suggesting that more substantial tightening could be in store.
(15) With its more hawkish rationale paragraph and balance of risks language,
the adoption of Alternative C would cause short-term interest rates to firm. Longer-
term interest rates might increase, especially if investors were to interpret the
Class I FOMC - Restricted Controlled (FR) Page 16 of 37
announcement as signaling that inflation is a greater threat than they had previously
believed. It seems likely that equity markets would sell off, and the foreign exchange
value of the dollar would appreciate.
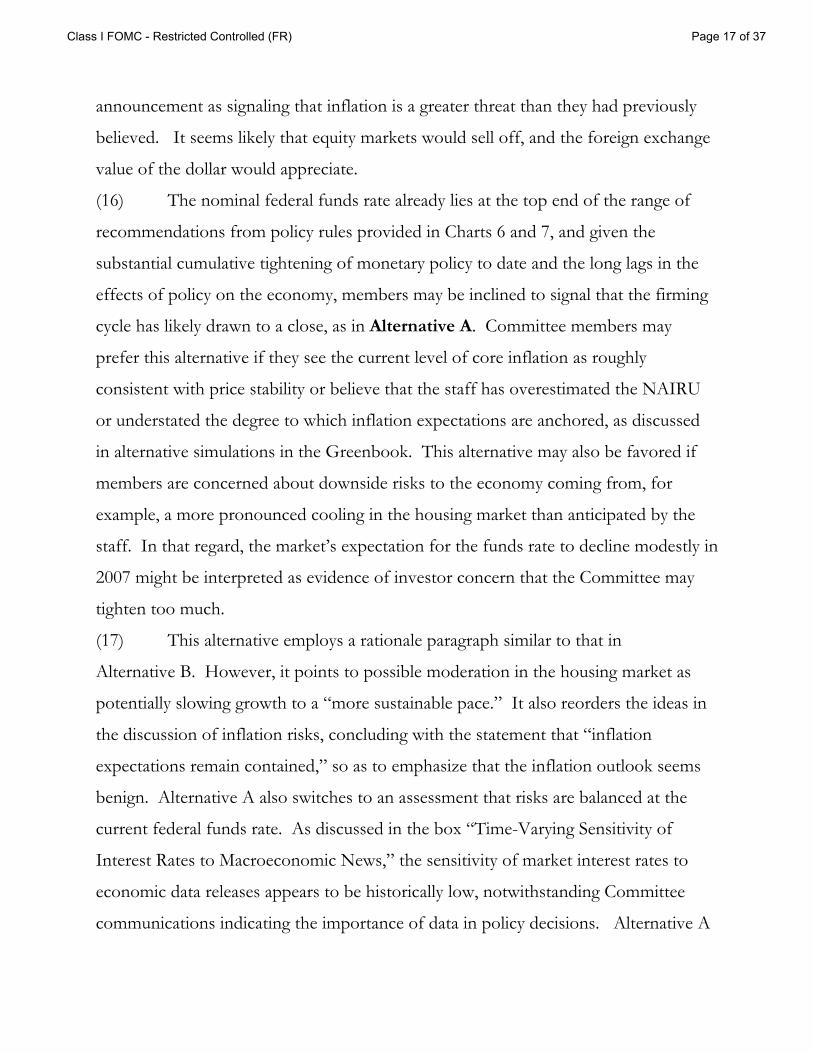
(16) The nominal federal funds rate already lies at the top end of the range of
recommendations from policy rules provided in Charts 6 and 7, and given the
substantial cumulative tightening of monetary policy to date and the long lags in the
effects of policy on the economy, members may be inclined to signal that the firming
cycle has likely drawn to a close, as in Alternative A. Committee members may
prefer this alternative if they see the current level of core inflation as roughly
consistent with price stability or believe that the staff has overestimated the NAIRU
or understated the degree to which inflation expectations are anchored, as discussed
in alternative simulations in the Greenbook. This alternative may also be favored if
members are concerned about downside risks to the economy coming from, for
example, a more pronounced cooling in the housing market than anticipated by the
staff. In that regard, the market’s expectation for the funds rate to decline modestly in
2007 might be interpreted as evidence of investor concern that the Committee may
tighten too much.
(17) This alternative employs a rationale paragraph similar to that in
Alternative B. However, it points to possible moderation in the housing market as
potentially slowing growth to a “more sustainable pace.” It also reorders the ideas in
the discussion of inflation risks, concluding with the statement that “inflation
expectations remain contained,” so as to emphasize that the inflation outlook seems
benign. Alternative A also switches to an assessment that risks are balanced at the
current federal funds rate. As discussed in the box “Time-Varying Sensitivity of
Interest Rates to Macroeconomic News,” the sensitivity of market interest rates to
economic data releases appears to be historically low, notwithstanding Committee
communications indicating the importance of data in policy decisions. Alternative A
Class I FOMC - Restricted Controlled (FR) Page 17 of 37

Chart 6Information from Estimated Policy Rules and Financial Markets
2005 2006 2007
1
2
3
4
5
6
7
8Percent
Actual and Greenbook assumptionOutcome-based rule 70 percent confidence interval 90 percent confidence intervalForecast-based rule
Estimated Policy Rules
2005 2006 2007
1
2
3
4
5
6
7
8Percent
Actual and Greenbook assumptionMarket-based expectations 70 percent confidence interval 90 percent confidence interval
Market Expectations
2006 2007
Q1 Q2 Q3 Q4 Q1 Q2 Q3 Q4
Estimated Policy Rules Outcome-based policy rule 4.3 4.5 4.6 4.7 4.7 4.8 4.7 4.6 70 percent confidence interval Lower bound 4.3 4.2 4.1 3.9 3.8 3.7 3.6 3.4 Upper bound 4.3 4.8 5.2 5.6 5.9 6.1 6.2 6.2 90 percent confidence interval Lower bound 4.3 4.0 3.6 3.4 3.2 3.0 2.8 2.6 Upper bound 4.3 5.0 5.5 6.0 6.4 6.7 6.9 6.9
Forecast-based policy rule 4.3 4.6 4.8 4.8 4.7 4.7 4.5 4.4
Market Expectations Expected funds rate path 4.5 4.9 5.0 5.0 4.9 4.9 4.8 4.7 70 percent confidence interval Lower bound 4.4 4.8 4.8 4.6 4.4 4.2 4.1 3.9 Upper bound 4.5 4.9 5.2 5.4 5.5 5.5 5.6 5.6 90 percent confidence interval Lower bound 4.4 4.7 4.6 4.4 4.1 3.9 3.7 3.5 Upper bound 4.5 5.0 5.4 5.6 5.8 6.0 6.1 6.2
Memo Greenbook assumption 4.4 4.9 5.0 5.0 5.0 5.0 4.8 4.8
Class I FOMC - Restricted Controlled (FR) Page 18 of 37

Chart 7Policy Paths under Alternative Inflation Objectives
2005 2006 2007
1
2
3
4
5
6
7
8Percent
Actual and Greenbook assumptionBaseline Taylor ruleAggressive Taylor ruleFirst-difference rule
1½ Percent Inflation Objective
2005 2006 2007
1
2
3
4
5
6
7
8Percent
2 Percent Inflation Objective
2006 2007
Q1 Q2 Q3 Q4 Q1 Q2 Q3 Q4
Simple Policy Rules Baseline Taylor rule 1½ percent inflation objective 3.9 4.1 4.5 4.6 4.7 4.6 4.5 4.4 2 percent inflation objective 3.6 3.8 4.3 4.4 4.6 4.5 4.4 4.3 Aggressive Taylor rule 1½ percent inflation objective 3.8 4.1 4.6 4.7 4.9 4.8 4.6 4.5 2 percent inflation objective 3.6 3.8 4.4 4.6 4.8 4.7 4.6 4.4 First-difference rule 1½ percent inflation objective 4.5 4.7 4.9 5.1 5.2 5.3 5.4 5.4 2 percent inflation objective 4.3 4.5 4.6 4.6 4.6 4.6 4.6 4.6
Memo Greenbook assumption 4.4 4.9 5.0 5.0 5.0 5.0 4.8 4.8
Class I FOMC - Restricted Controlled (FR) Page 19 of 37
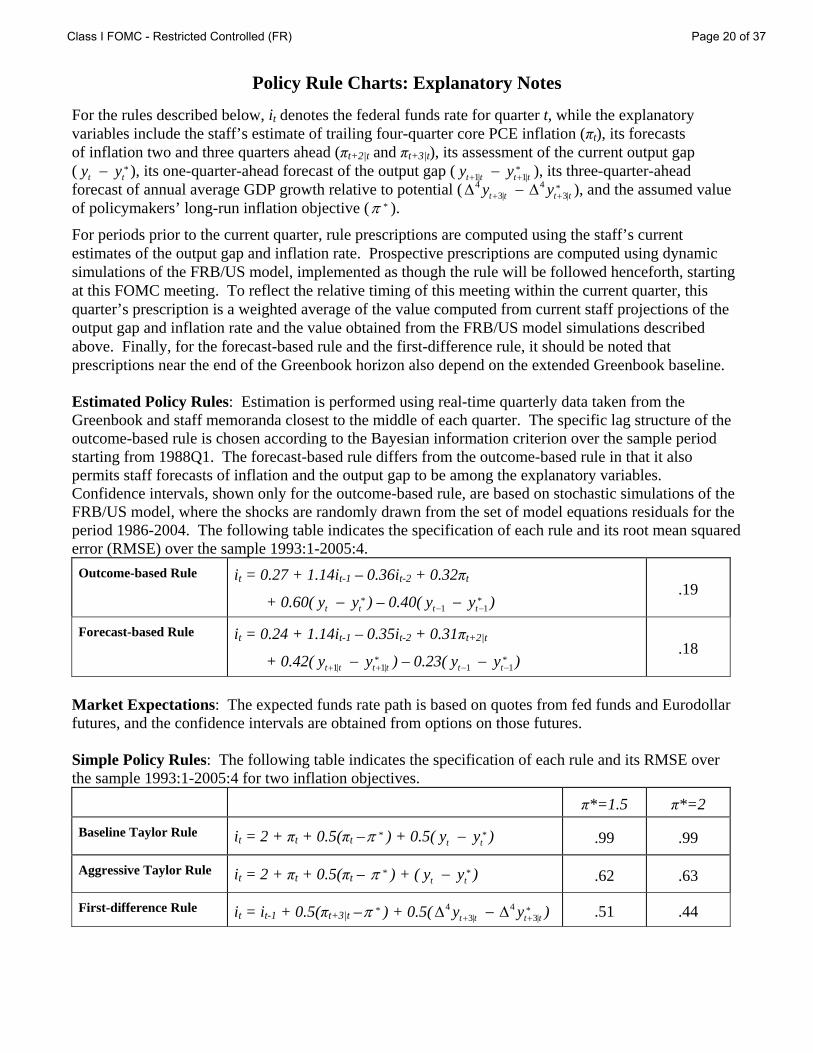
Policy Rule Charts: Explanatory Notes
For the rules described below, it denotes the federal funds rate for quarter t, while the explanatory variables include the staff’s estimate of trailing four-quarter core PCE inflation (πt), its forecasts of inflation two and three quarters ahead (πt+2|t and πt+3|t), its assessment of the current output gap ( t ), its one-quarter-ahead forecast of the output gap (*
ty y− *1| 1|t t t ty y+ +− ), its three-quarter-ahead
forecast of annual average GDP growth relative to potential ( 4 4 *3| 3|t t t ty y+ +Δ − Δ ), and the assumed value
f policymakers’ long-run inflation objective (o *π ). For periods prior to the current quarter, rule prescriptions are computed using the staff’s current estimates of the output gap and inflation rate. Prospective prescriptions are computed using dynamic simulations of the FRB/US model, implemented as though the rule will be followed henceforth, starting at this FOMC meeting. To reflect the relative timing of this meeting within the current quarter, this quarter’s prescription is a weighted average of the value computed from current staff projections of the output gap and inflation rate and the value obtained from the FRB/US model simulations described above. Finally, for the forecast-based rule and the first-difference rule, it should be noted that prescriptions near the end of the Greenbook horizon also depend on the extended Greenbook baseline. Estimated Policy Rules: Estimation is performed using real-time quarterly data taken from the Greenbook and staff memoranda closest to the middle of each quarter. The specific lag structure of the outcome-based rule is chosen according to the Bayesian information criterion over the sample period starting from 1988Q1. The forecast-based rule differs from the outcome-based rule in that it also permits staff forecasts of inflation and the output gap to be among the explanatory variables. Confidence intervals, shown only for the outcome-based rule, are based on stochastic simulations of the FRB/US model, where the shocks are randomly drawn from the set of model equations residuals for the period 1986-2004. The following table indicates the specification of each rule and its root mean squared error (RMSE) over the sample 1993:1-2005:4. Outcome-based Rule
it = 0.27 + 1.14it-1 – 0.36it-2 + 0.32πt
+ 0.60( *ty yt− ) – 0.40( *
1 1t ty y− −− ) .19
Forecast-based Rule
it = 0.24 + 1.14it-1 – 0.35it-2 + 0.31πt+2|t
+ 0.42( *1| 1|t t t ty y+ +− ) – 0.23( *
1 1t ty y− −− ) .18
Market Expectations: The expected funds rate path is based on quotes from fed funds and Eurodollar futures, and the confidence intervals are obtained from options on those futures. Simple Policy Rules: The following table indicates the specification of each rule and its RMSE over the sample 1993:1-2005:4 for two inflation objectives. π*=1.5 π*=2
Baseline Taylor Rule it = 2 + πt + 0.5(πt – *π ) + 0.5( *t ty y− ) .99 .99
Aggressive Taylor Rule it = 2 + πt + 0.5(πt – *π ) + ( *t ty y− ) .62 .63
First-difference Rule it = it-1 + 0.5(πt+3|t – *π ) + 0.5( 4 4 *3| 3|t t t ty y+ +Δ − Δ ) .51 .44
Class I FOMC - Restricted Controlled (FR) Page 20 of 37

Time-varying Sensitivity of Interest Rates to Macroeconomic News
The response of U.S. Treasury yields to new information is unlikely to be constant over time. One statistical approach to capture variation is to augment a regression of two-year yields on economic-data surprises with a common time-varying coefficient. This yields a sensitivity index, for which a value of one is neutral and values above one indicate that the market is more sensitive than average to the news contained in economic-data releases. The sensitivity index, plotted in the figure below, has moved in a wide range over the last fifteen years.
The estimated sensitivity was higher on average during the first half of the 1990s than in subsequent years, although one marked exception was the year prior to the start of the current tightening cycle. Sensitivity peaked at nearly twice its average level in the spring of 2005 when market participants awaited the shift in the economic outlook that would trigger the onset of policy tightening. The sensitivity then unwound abruptly when the measured-pace language was introduced and policy tightening began and is now at an historically low level. All this has occurred despite the message in recent FOMC minutes indicating that “the future path for the funds rate would depend increasingly on economic developments.”
Class I FOMC - Restricted Controlled (FR) Page 21 of 37
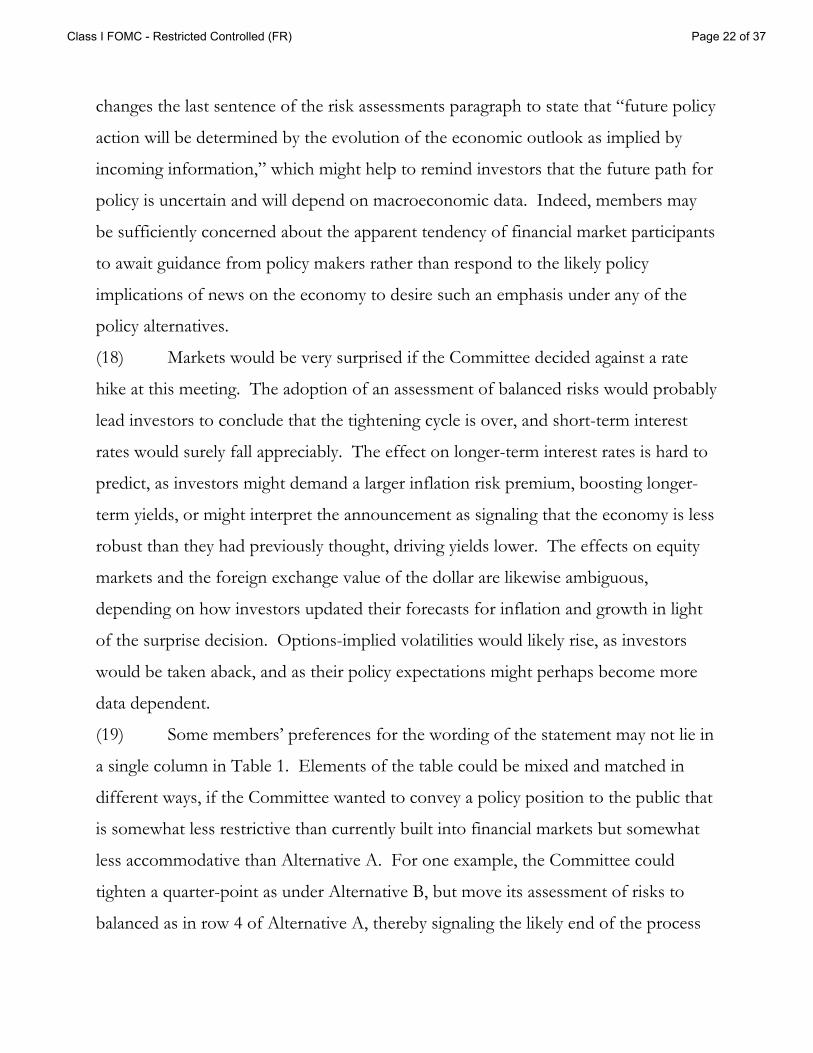
changes the last sentence of the risk assessments paragraph to state that “future policy
action will be determined by the evolution of the economic outlook as implied by
incoming information,” which might help to remind investors that the future path for
policy is uncertain and will depend on macroeconomic data. Indeed, members may
be sufficiently concerned about the apparent tendency of financial market participants
to await guidance from policy makers rather than respond to the likely policy
implications of news on the economy to desire such an emphasis under any of the
policy alternatives.
(18) Markets would be very surprised if the Committee decided against a rate
hike at this meeting. The adoption of an assessment of balanced risks would probably
lead investors to conclude that the tightening cycle is over, and short-term interest
rates would surely fall appreciably. The effect on longer-term interest rates is hard to
predict, as investors might demand a larger inflation risk premium, boosting longer-
term yields, or might interpret the announcement as signaling that the economy is less
robust than they had previously thought, driving yields lower. The effects on equity
markets and the foreign exchange value of the dollar are likewise ambiguous,
depending on how investors updated their forecasts for inflation and growth in light
of the surprise decision. Options-implied volatilities would likely rise, as investors
would be taken aback, and as their policy expectations might perhaps become more
data dependent.
(19) Some members’ preferences for the wording of the statement may not lie in
a single column in Table 1. Elements of the table could be mixed and matched in
different ways, if the Committee wanted to convey a policy position to the public that
is somewhat less restrictive than currently built into financial markets but somewhat
less accommodative than Alternative A. For one example, the Committee could
tighten a quarter-point as under Alternative B, but move its assessment of risks to
balanced as in row 4 of Alternative A, thereby signaling the likely end of the process
Class I FOMC - Restricted Controlled (FR) Page 22 of 37

of tightening. For another, the Committee could leave the funds rate unchanged, as
under Alternative A, but keep the risk assessment tilted toward the likelihood of
additional firming, as in Alternative B, which market participants would likely
interpret as indicating a probable pause in, rather than an end to, the tightening cycle.
The choice between these two alternatives rests mainly on the conviction with which
the outlook is held. If members are fairly confident that one more firming step at this
meeting is sufficient to position the economy on a sustainable growth track with an
acceptable inflation rate, then they may want to declare a definitive end to the current
cycle of tightening, as in the firming with symmetric risks alternative. If, instead,
members want to accumulate more information bearing on the outlook before acting,
and they also believe that such information is more likely than not to trigger future
policy tightening, then the alternative of no-action with asymmetric risks would find
some appeal.
Money and Debt Forecasts
(20) Under the Greenbook forecast, M2 is projected to expand about 5 percent
this year, slower than nominal GDP, as a result of the lagged effects of rising
opportunity costs. In 2007, M2 is expected to grow about 5½ percent, roughly in line
with nominal GDP, as the effects of interest rates on money demand wane. Although
profits are high and businesses are flush with cash, greater capital expenditures, robust
equity repurchases and merger and acquisition activity are projected to buoy business
debt, which is forecast to grow 6¾ percent this year and 6½ percent next year. The
projected cooling of the housing market leads to a deceleration in mortgage debt.
Largely as a result of this, the growth of overall domestic nonfinancial sector debt is
forecast to step down to 7½ percent this year and to 6½ percent in 2007.
Class I FOMC - Restricted Controlled (FR) Page 23 of 37
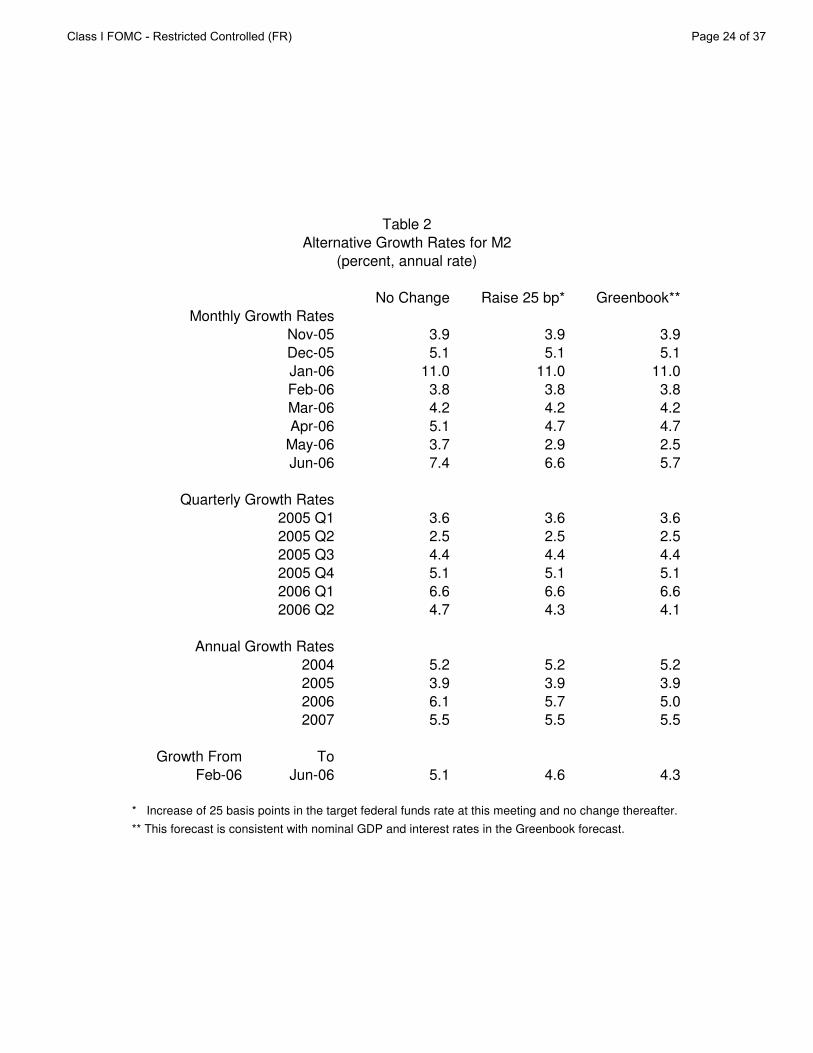
No Change Raise 25 bp* Greenbook**
Monthly Growth Rates
Nov-05 3.9 3.9 3.9
Dec-05 5.1 5.1 5.1
Jan-06 11.0 11.0 11.0
Feb-06 3.8 3.8 3.8
Mar-06 4.2 4.2 4.2
Apr-06 5.1 4.7 4.7
May-06 3.7 2.9 2.5
Jun-06 7.4 6.6 5.7
Quarterly Growth Rates
2005 Q1 3.6 3.6 3.6
2005 Q2 2.5 2.5 2.5
2005 Q3 4.4 4.4 4.4
2005 Q4 5.1 5.1 5.1
2006 Q1 6.6 6.6 6.6
2006 Q2 4.7 4.3 4.1
Annual Growth Rates
2004 5.2 5.2 5.2
2005 3.9 3.9 3.9
2006 6.1 5.7 5.0
2007 5.5 5.5 5.5
Growth From To
Feb-06 Jun-06 5.1 4.6 4.3
* Increase of 25 basis points in the target federal funds rate at this meeting and no change thereafter.
** This forecast is consistent with nominal GDP and interest rates in the Greenbook forecast.
Table 2
Alternative Growth Rates for M2
(percent, annual rate)
Class I FOMC - Restricted Controlled (FR) Page 24 of 37

Directive and Balance of Risks Statement
(21) Draft language for the directive and draft risk assessments identical to those
presented in Table 1 are provided below.
Directive Wording
The Federal Open Market Committee seeks monetary and financial
conditions that will foster price stability and promote sustainable growth
in output. To further its long-run objectives, the Committee in the
immediate future seeks conditions in reserve markets consistent with
MAINTAINING/increasing/REDUCING the federal funds rate
AT/to an average of around ____________ 4½percent.
Risk Assessments
A. The Committee judges that maintaining the federal funds rate at its
current level will likely keep the risks to the attainment of both
sustainable economic growth and price stability roughly in balance.
Nevertheless, future policy action will be determined by the
evolution of the economic outlook as implied by incoming
information.
B. The Committee judges that some further policy firming may be
needed to keep the risks to the attainment of both sustainable
economic growth and price stability roughly in balance. In any
event, the Committee will respond to changes in economic
prospects as needed to foster these objectives.
C. The Committee judges that further policy firming may be needed to
keep the risks to the attainment of both sustainable economic
growth and price stability roughly in balance. In any event, the
Class I FOMC - Restricted Controlled (FR) Page 25 of 37

Committee will respond to changes in economic prospects as
needed to foster these objectives.
Class I FOMC - Restricted Controlled (FR) Page 26 of 37
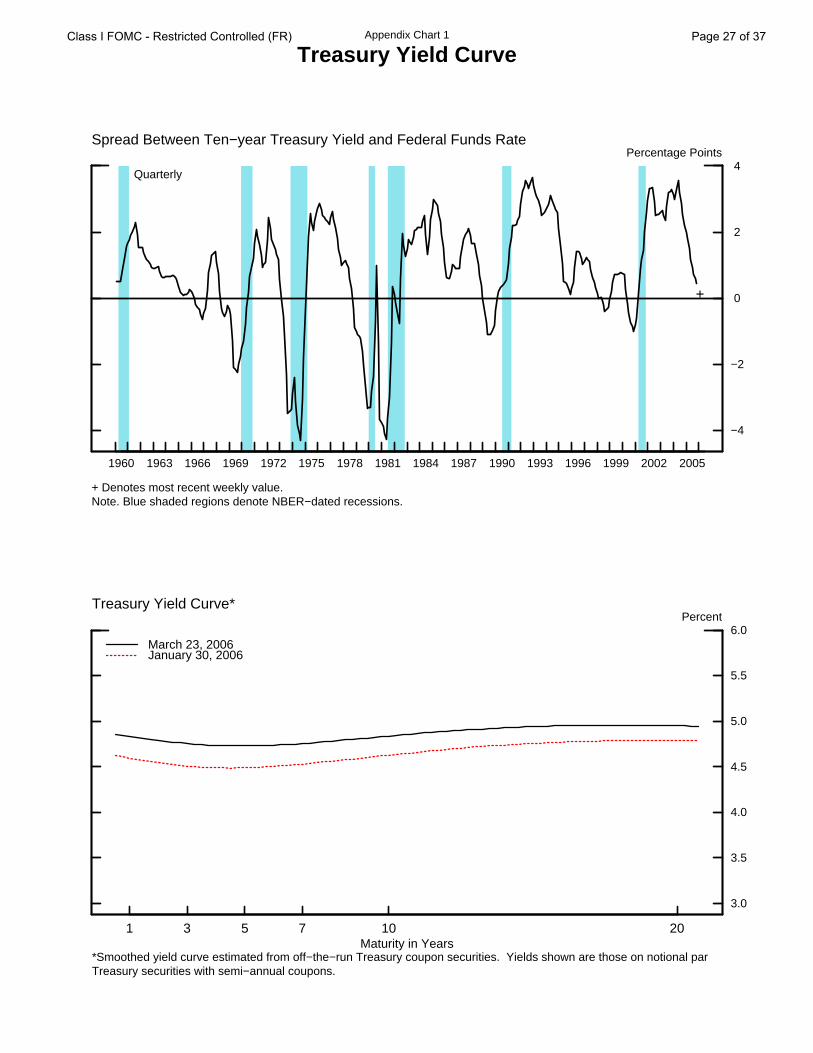
Appendix Chart 1
Treasury Yield Curve
1960 1963 1966 1969 1972 1975 1978 1981 1984 1987 1990 1993 1996 1999 2002 2005
−4
−2
0
2
4Percentage Points
+ Denotes most recent weekly value.Note. Blue shaded regions denote NBER−dated recessions.
+
Spread Between Ten−year Treasury Yield and Federal Funds Rate
Quarterly
1 3 5 7 10 20
3.0
3.5
4.0
4.5
5.0
5.5
6.0Percent
March 23, 2006 January 30, 2006
Treasury Yield Curve*
Maturity in Years*Smoothed yield curve estimated from off−the−run Treasury coupon securities. Yields shown are those on notional par Treasury securities with semi−annual coupons.
Class I FOMC - Restricted Controlled (FR) Page 27 of 37

Appendix Chart 2
Dollar Exchange Rate Indexes
1973 1976 1979 1982 1985 1988 1991 1994 1997 2000 2003 2006
80
90
100
110
120
130
140
150
Ratio ScaleMarch 1973=100
+ Denotes most recent weekly value.
+
Nominal
Major Currencies
Monthly
1973 1976 1979 1982 1985 1988 1991 1994 1997 2000 2003 2006
80
90
100
110
120
130
140
Ratio ScaleMarch 1973=100
Real
MajorCurrencies
Broad
Other Important
Monthly
Note. The major currencies index is the trade−weighted average of currencies of the Euro area, Canada, Japan, the U.K., Switzerland, Australia, and Sweden. The other important trading partners index is the trade−weighted average of currencies of 19 other important trading partners. The Broad index is the trade−weighted average of currencies of all important trading partners. Real indexes have been adjusted for relative changes in U.S. and foreign consumer prices. Blue shaded regions denote NBER−dated recessions.
Class I FOMC - Restricted Controlled (FR) Page 28 of 37
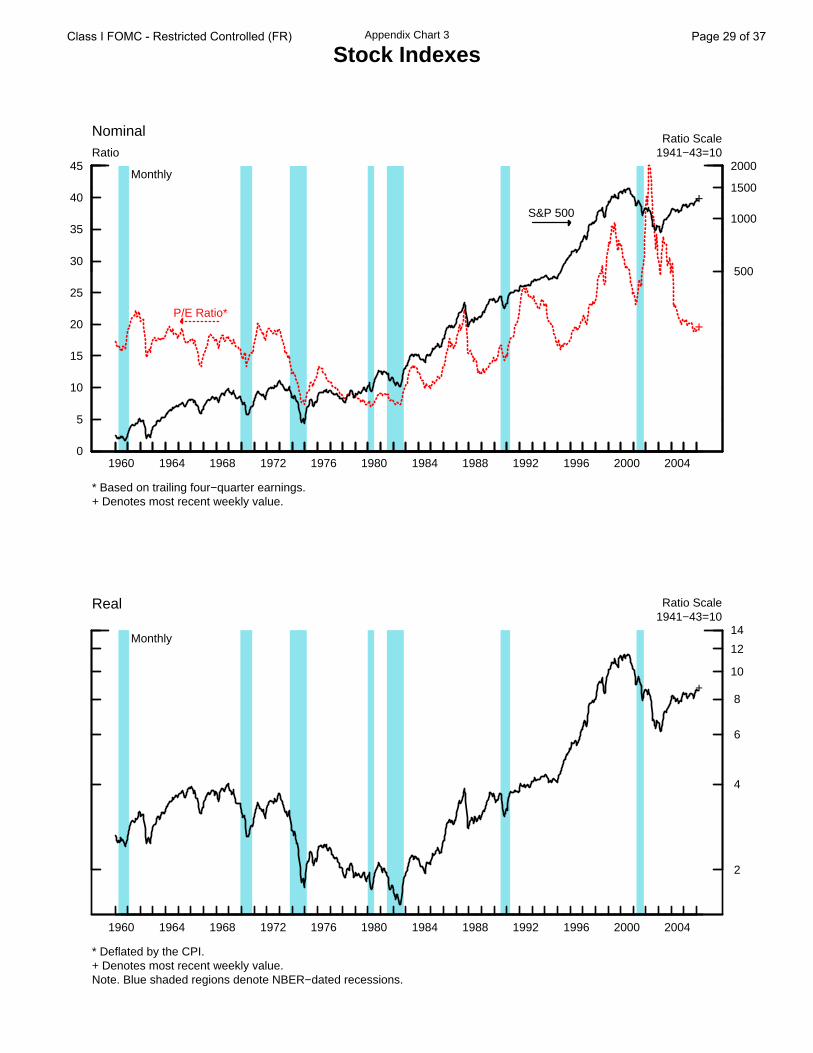
Appendix Chart 3
Stock Indexes
0
5
10
15
20
25
30
35
40
45Ratio
+
1960 1964 1968 1972 1976 1980 1984 1988 1992 1996 2000 2004
500
1000
1500
2000
Ratio Scale1941−43=10
* Based on trailing four−quarter earnings.+ Denotes most recent weekly value.
+
Nominal
Monthly
P/E Ratio*
S&P 500
1960 1964 1968 1972 1976 1980 1984 1988 1992 1996 2000 2004
2
4
6
8
10
12
14
Ratio Scale1941−43=10
* Deflated by the CPI.+ Denotes most recent weekly value.Note. Blue shaded regions denote NBER−dated recessions.
+
Real
Monthly
Class I FOMC - Restricted Controlled (FR) Page 29 of 37
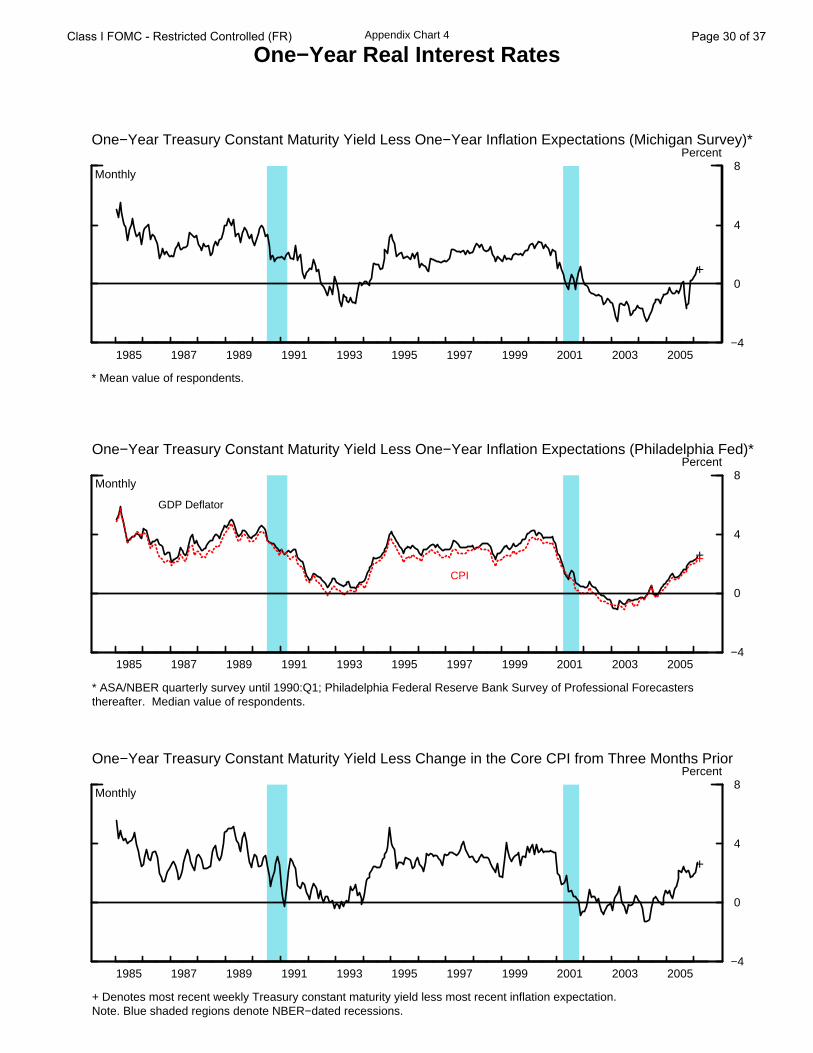
Appendix Chart 4
One−Year Real Interest Rates
1985 1987 1989 1991 1993 1995 1997 1999 2001 2003 2005−4
0
4
8Percent
* Mean value of respondents.
+
Monthly
One−Year Treasury Constant Maturity Yield Less One−Year Inflation Expectations (Michigan Survey)*
1985 1987 1989 1991 1993 1995 1997 1999 2001 2003 2005−4
0
4
8Percent
* ASA/NBER quarterly survey until 1990:Q1; Philadelphia Federal Reserve Bank Survey of Professional Forecastersthereafter. Median value of respondents.
++
GDP Deflator
CPI
Monthly
One−Year Treasury Constant Maturity Yield Less One−Year Inflation Expectations (Philadelphia Fed)*
1985 1987 1989 1991 1993 1995 1997 1999 2001 2003 2005−4
0
4
8Percent
+ Denotes most recent weekly Treasury constant maturity yield less most recent inflation expectation.Note. Blue shaded regions denote NBER−dated recessions.
+
Monthly
One−Year Treasury Constant Maturity Yield Less Change in the Core CPI from Three Months Prior
Class I FOMC - Restricted Controlled (FR) Page 30 of 37

Appendix Chart 5
Long−Term Real Interest Rates*
1985 1987 1989 1991 1993 1995 1997 1999 2001 2003 2005 0
2
4
6
8
10Percent
+
+
+
Monthly
Real Ten−Year Treasury Yields
Real rate usingPhiladelphia Fed Survey
Real rate usingMichigan Survey
Ten−year TIPS yield
1985 1987 1989 1991 1993 1995 1997 1999 2001 2003 2005
2
4
6
8
10
12
14Percent
+
++
Nominal and Real Corporate Bond Rates
Monthly
Nominal rate on Moody’sA−rated corporate bonds
Real rate usingPhiladelphia Fed Survey
Real rate usingMichigan Survey
* For real rates, measures using the Philadelphia Fed Survey employ the ten−year inflation expectations from the Blue Chip Survey until April 1991 and the Philadelphia Federal Reserve Bank Survey of Professional Forecasters thereafter (median value of respondents). Measures using the Michigan Survey employ the five− to ten−year inflation expectations from that survey (mean value of respondents).
+ For TIPS and nominal corporate rate, denotes the most recent weekly value. For other real rate series, denotes the most recent weekly nominal yield less the most recent inflation expectation. Note. Blue shaded regions denote NBER−dated recessions.
Class I FOMC - Restricted Controlled (FR) Page 31 of 37
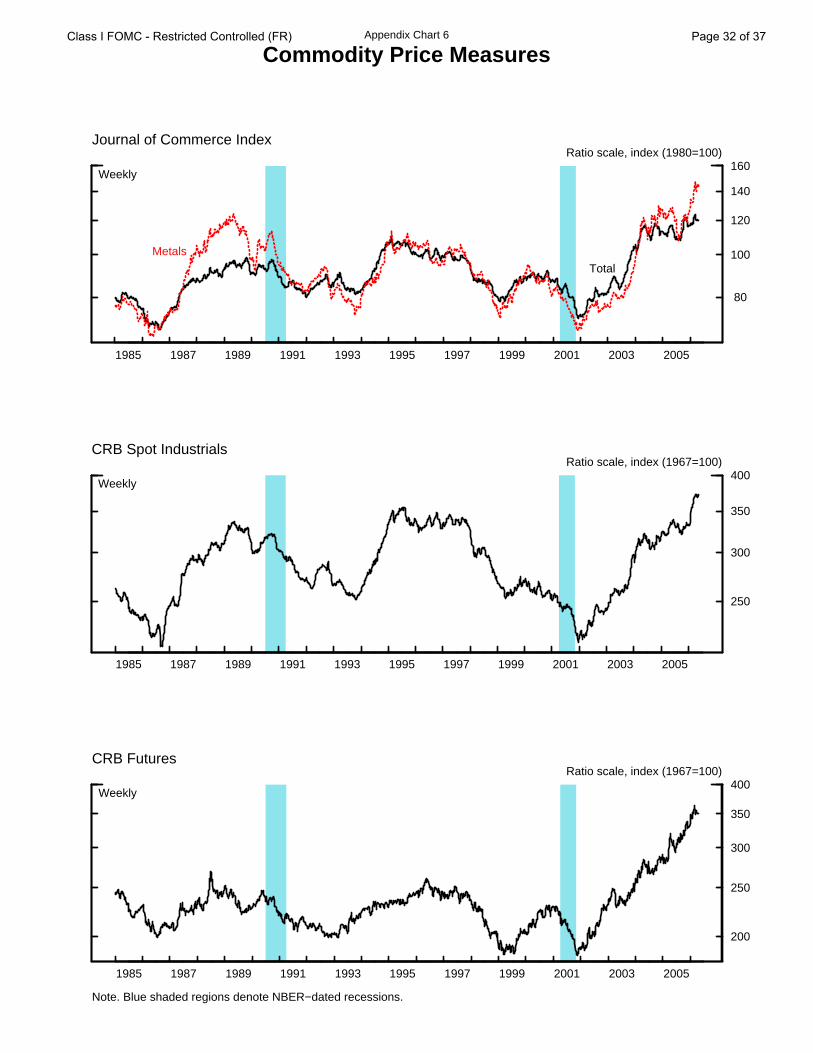
Appendix Chart 6
Commodity Price Measures
1985 1987 1989 1991 1993 1995 1997 1999 2001 2003 2005
80
100
120
140
160Ratio scale, index (1980=100)
Journal of Commerce Index
Weekly
Total
Metals
1985 1987 1989 1991 1993 1995 1997 1999 2001 2003 2005
250
300
350
400Ratio scale, index (1967=100)
CRB Spot Industrials
Weekly
1985 1987 1989 1991 1993 1995 1997 1999 2001 2003 2005
200
250
300
350
400Ratio scale, index (1967=100)
Note. Blue shaded regions denote NBER−dated recessions.
CRB Futures
Weekly
Class I FOMC - Restricted Controlled (FR) Page 32 of 37
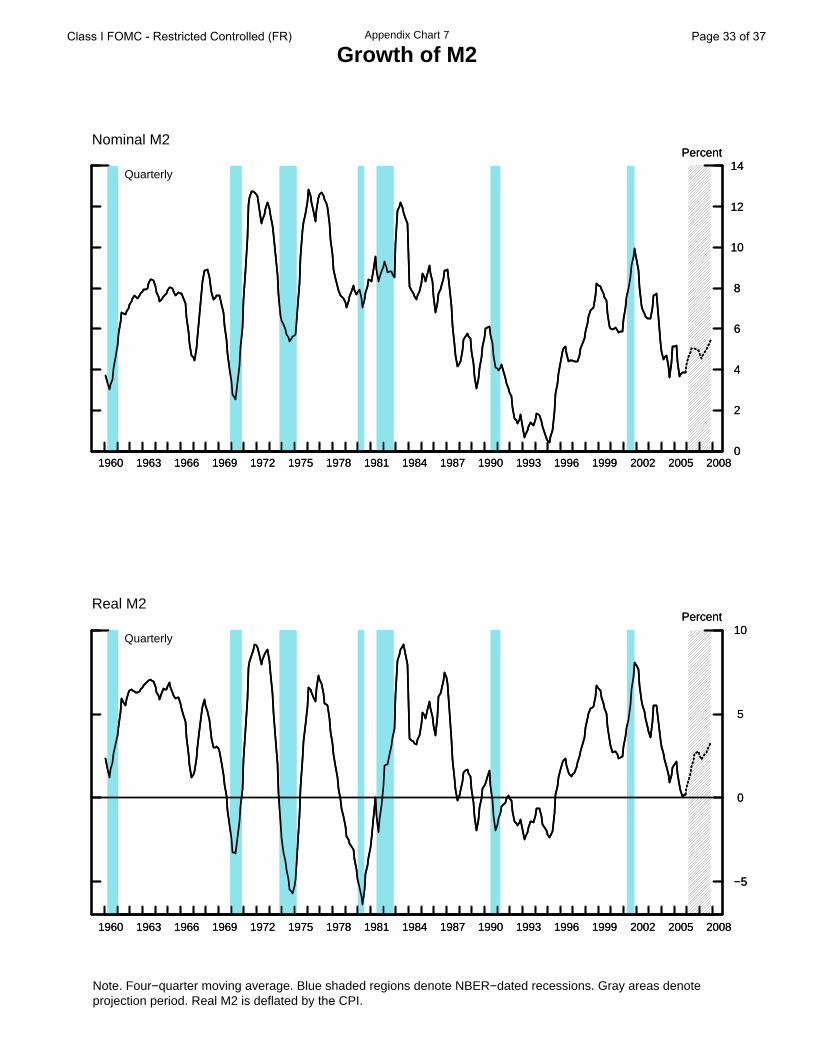
Appendix Chart 7
Growth of M2
1960 1963 1966 1969 1972 1975 1978 1981 1984 1987 1990 1993 1996 1999 2002 2005 2008 0
2
4
6
8
10
12
14Percent
1960 1963 1966 1969 1972 1975 1978 1981 1984 1987 1990 1993 1996 1999 2002 2005 2008 0
2
4
6
8
10
12
14Percent
Nominal M2
Quarterly
1960 1963 1966 1969 1972 1975 1978 1981 1984 1987 1990 1993 1996 1999 2002 2005 2008
−5
0
5
10Percent
1960 1963 1966 1969 1972 1975 1978 1981 1984 1987 1990 1993 1996 1999 2002 2005 2008
−5
0
5
10Percent
Real M2
Quarterly
Note. Four−quarter moving average. Blue shaded regions denote NBER−dated recessions. Gray areas denote projection period. Real M2 is deflated by the CPI.
Class I FOMC - Restricted Controlled (FR) Page 33 of 37
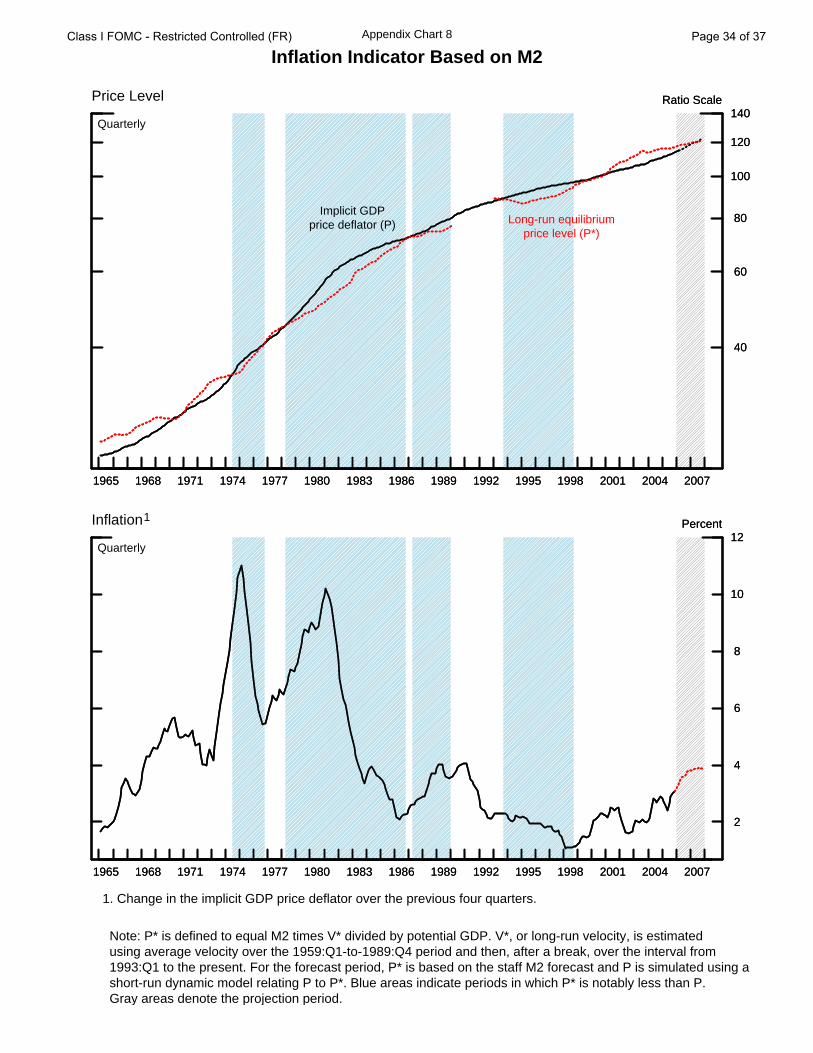
Appendix Chart 8
Inflation Indicator Based on M2
Note: P* is defined to equal M2 times V* divided by potential GDP. V*, or long-run velocity, is estimatedusing average velocity over the 1959:Q1-to-1989:Q4 period and then, after a break, over the interval from1993:Q1 to the present. For the forecast period, P* is based on the staff M2 forecast and P is simulated using ashort-run dynamic model relating P to P*. Blue areas indicate periods in which P* is notably less than P.Gray areas denote the projection period.
1965 1968 1971 1974 1977 1980 1983 1986 1989 1992 1995 1998 2001 2004 2007
40
60
80
100
120
140Ratio ScalePrice Level
Quarterly
Implicit GDPprice deflator (P) Long-run equilibrium
price level (P*)
1965 1968 1971 1974 1977 1980 1983 1986 1989 1992 1995 1998 2001 2004 2007
40
60
80
100
120
140Ratio Scale
1965 1968 1971 1974 1977 1980 1983 1986 1989 1992 1995 1998 2001 2004 2007
2
4
6
8
10
12PercentInflation 1
Quarterly
1965 1968 1971 1974 1977 1980 1983 1986 1989 1992 1995 1998 2001 2004 2007
2
4
6
8
10
12Percent
1. Change in the implicit GDP price deflator over the previous four quarters.
Class I FOMC - Restricted Controlled (FR) Page 34 of 37
Short-term Long-term
Federalfunds
Treasury billssecondary market
CDssecondary
market
Comm.paper Off-the-run Treasury yields Indexed yields Moody’s
Baa
MunicipalBondBuyer
Conventional homemortgages
primary market
4-week 3-month 6-month 3-month 1-month 2-year 5-year 10-year 20-year 5-year 10-year Fixed-rate ARM
1 2 3 4 5 6 7 8 9 10 11 12 13 14 15 16
4.30 4.01 4.08 4.37 4.49 4.30 4.52 4.59 4.79 5.04 2.11 2.22 6.48 5.24 6.37 5.222.19 1.86 2.31 2.63 2.50 2.24 3.11 3.58 3.97 4.28 0.98 1.50 5.64 4.72 5.53 4.10
4.62 4.67 4.69 4.83 4.91 4.71 4.83 4.78 4.87 4.97 2.14 2.25 6.46 5.17 6.37 5.454.22 3.91 4.17 4.37 4.50 4.22 4.34 4.28 4.42 4.59 1.82 1.94 6.17 5.04 6.10 5.15
2.63 2.64 2.80 3.09 2.97 2.67 3.74 4.15 4.59 4.92 1.27 1.77 6.06 5.01 5.93 4.232.79 2.63 2.84 3.14 3.09 2.84 3.67 3.99 4.42 4.78 1.21 1.69 6.05 4.93 5.86 4.253.00 2.62 2.90 3.17 3.22 2.97 3.65 3.84 4.22 4.59 1.25 1.65 6.01 4.83 5.72 4.233.04 2.82 3.03 3.22 3.38 3.11 3.65 3.76 4.07 4.38 1.37 1.67 5.86 4.77 5.58 4.243.26 3.09 3.29 3.53 3.57 3.27 3.90 3.98 4.25 4.50 1.64 1.88 5.95 4.85 5.70 4.403.50 3.33 3.52 3.78 3.77 3.47 4.06 4.12 4.34 4.56 1.69 1.89 5.96 4.90 5.82 4.553.62 3.21 3.50 3.80 3.87 3.64 3.96 4.01 4.28 4.55 1.40 1.70 6.03 4.94 5.77 4.513.78 3.49 3.79 4.13 4.13 3.84 4.31 4.34 4.56 4.77 1.69 1.94 6.30 5.13 6.07 4.864.00 3.91 3.97 4.30 4.31 4.01 4.44 4.46 4.66 4.85 1.96 2.09 6.39 5.22 6.33 5.144.16 3.67 3.98 4.33 4.45 4.23 4.43 4.39 4.57 4.76 2.07 2.15 6.32 5.18 6.27 5.17
4.29 4.10 4.34 4.47 4.56 4.36 4.42 4.35 4.50 4.67 1.92 2.03 6.24 5.11 6.15 5.174.49 4.38 4.54 4.69 4.72 4.47 4.69 4.60 4.66 4.75 1.97 2.06 6.27 5.12 6.25 5.34
4.28 3.99 4.37 4.47 4.57 4.36 4.38 4.30 4.44 4.61 1.85 1.96 6.19 5.08 6.10 5.184.31 4.13 4.43 4.53 4.60 4.44 4.46 4.40 4.55 4.71 1.91 2.03 6.26 5.15 6.12 5.204.46 4.30 4.46 4.61 4.65 4.46 4.59 4.52 4.63 4.76 1.93 2.03 6.31 5.17 6.23 5.334.50 4.33 4.51 4.68 4.69 4.46 4.67 4.58 4.65 4.74 1.98 2.06 6.28 5.14 6.24 5.344.48 4.39 4.55 4.70 4.72 4.46 4.71 4.62 4.69 4.78 2.03 2.10 6.30 5.14 6.28 5.364.49 4.43 4.58 4.72 4.76 4.50 4.73 4.62 4.65 4.72 1.94 2.04 6.23 5.04 6.26 5.324.50 4.45 4.62 4.75 4.80 4.47 4.74 4.66 4.71 4.78 1.92 2.05 6.27 5.07 6.24 5.344.51 4.44 4.60 4.77 4.84 4.53 4.80 4.76 4.85 4.93 2.08 2.20 6.41 5.11 6.37 5.454.52 4.48 4.61 4.80 4.89 4.62 4.73 4.68 4.80 4.92 2.05 2.18 6.41 5.08 6.34 5.37 -- 4.64 4.68 4.81 4.91 4.68 4.74 4.68 4.80 4.92 2.09 2.22 -- -- 6.32 5.41
4.51 4.47 4.60 4.77 4.84 4.50 4.81 4.76 4.85 4.92 2.04 2.17 6.41 -- -- --4.51 4.45 4.58 4.77 4.85 4.56 4.79 4.75 4.84 4.92 2.10 2.22 6.41 -- -- --4.51 4.44 4.59 4.77 4.85 4.52 4.80 4.75 4.84 4.92 2.11 2.22 6.41 -- -- --4.51 4.44 4.61 4.78 4.87 -- 4.81 4.77 4.86 4.95 2.13 2.24 6.43 -- -- --4.52 4.43 4.61 4.83 4.87 4.61 4.83 4.78 4.87 4.97 2.14 2.25 6.46 -- -- --4.51 4.49 4.59 4.80 4.88 4.63 4.74 4.69 4.80 4.91 2.05 2.17 6.39 -- -- --4.47 4.50 4.63 4.81 4.88 4.59 4.75 4.70 4.83 4.95 2.06 2.20 6.43 -- -- --4.55 4.49 4.61 4.77 4.90 4.63 4.66 4.60 4.75 4.88 1.97 2.14 6.37 -- -- --4.60 4.49 4.63 4.78 4.90 4.63 4.68 4.63 4.78 4.91 2.01 2.17 6.38 -- -- --4.55 4.55 4.67 4.79 4.90 4.63 4.68 4.62 4.76 4.89 2.03 2.18 6.36 -- -- --4.54 4.67 4.69 4.82 4.90 4.70 4.75 4.69 4.81 4.93 2.12 2.25 6.41 -- -- --4.58 4.67 4.69 4.81 4.91 4.71 4.76 4.69 4.80 4.92 2.12 2.24 6.39 -- -- --4.62 4.66 4.67 4.81 4.91 -- 4.79 4.73 4.84 4.95 2.14 2.24 -- -- -- --
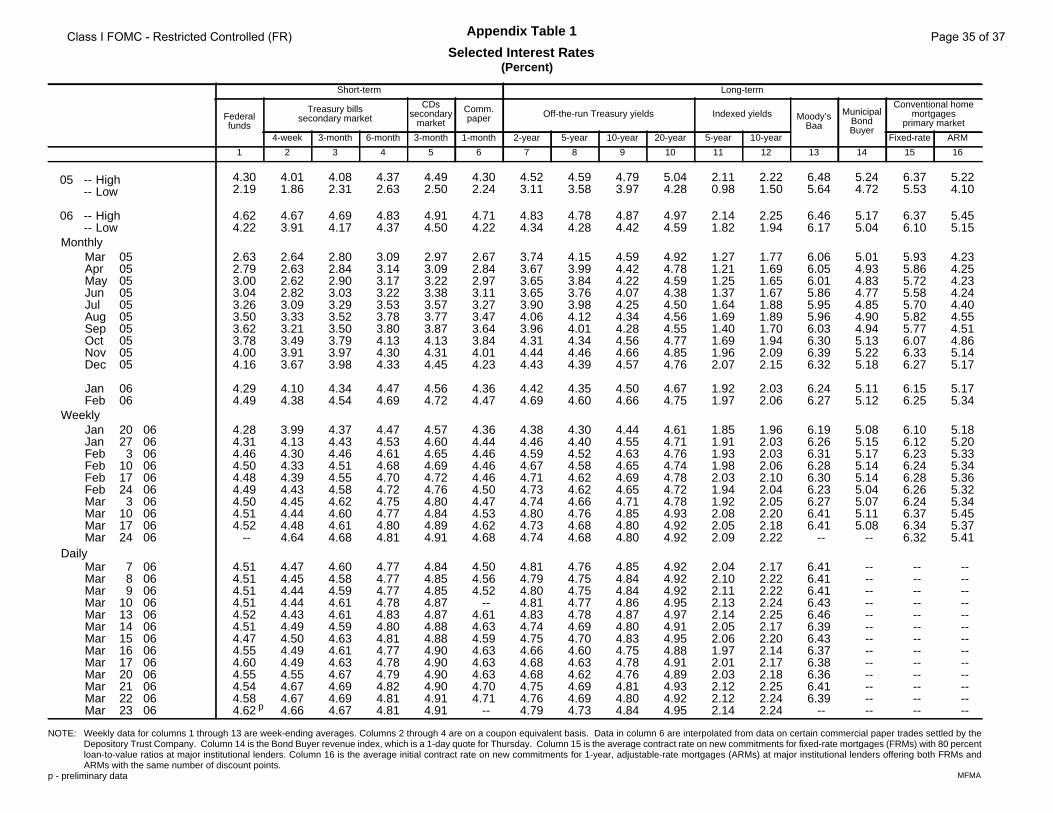
Appendix Table 1
Selected Interest Rates(Percent)
NOTE: Weekly data for columns 1 through 13 are week-ending averages. Columns 2 through 4 are on a coupon equivalent basis. Data in column 6 are interpolated from data on certain commercial paper trades settled by theDepository Trust Company. Column 14 is the Bond Buyer revenue index, which is a 1-day quote for Thursday. Column 15 is the average contract rate on new commitments for fixed-rate mortgages (FRMs) with 80 percentloan-to-value ratios at major institutional lenders. Column 16 is the average initial contract rate on new commitments for 1-year, adjustable-rate mortgages (ARMs) at major institutional lenders offering both FRMs andARMs with the same number of discount points.
p - preliminary data
Mar Apr May Jun Jul Aug Sep Oct Nov Dec Jan Feb
Jan Jan Feb Feb Feb Feb Mar Mar Mar Mar
Mar Mar Mar Mar Mar Mar Mar Mar Mar Mar Mar Mar Mar
05050505050505050505
0606
2027
3101724
3101724
789
10131415161720212223
06060606060606060606
06060606060606060606060606
05 -- High-- Low
06 -- High-- Low
Monthly
Weekly
Daily
p
MFMA
Class I FOMC - Restricted Controlled (FR) Page 35 of 37
Appendix Table 2Money Aggregates
Seasonally Adjusted
NontransactionsComponents in M2
M1 M2
1 2 3
Period
Annual growth rates (%):
Annually (Q4 to Q4)2003 7.4 5.5 5.02004 5.4 5.2 5.22005 0.0 3.9 5.0
Quarterly (average)2005-Q1 0.2 3.6 4.5
Q2 -0.3 2.5 3.2Q3 -0.6 4.4 5.7Q4 0.8 5.1 6.2
Monthly2005-Feb. 2.2 3.6 4.0
Mar. 3.1 3.6 3.8Apr. -6.3 1.1 3.1May 4.4 1.6 0.8June -1.1 4.9 6.5July -6.2 3.7 6.3Aug. 7.0 5.5 5.2Sep. -2.5 5.5 7.7Oct. 1.6 5.3 6.2Nov. 0.7 3.9 4.8Dec. -1.2 5.1 6.7
2006-Jan. 12.1 11.0 10.7Feb. p -6.6 3.8 6.5
Levels ($billions):
Monthly2005-Oct. 1369.4 6625.7 5256.2
Nov. 1370.2 6647.5 5277.3Dec. 1368.8 6675.5 5306.8
2006-Jan. 1382.6 6736.8 5354.3Feb. p 1375.0 6758.4 5383.4
Weekly2006-Feb. 6 1382.2 6732.2 5350.0
13 1355.2 6735.3 5380.120 1376.0 6775.4 5399.427 1387.9 6782.8 5394.8
Mar. 6p 1374.7 6779.9 5405.213p 1357.4 6753.1 5395.7
p preliminar y
Class I FOMC - Restricted Controlled (FR) Page 36 of 37
Appendix Table 3
Changes in System Holdings of Securities 1
(Millions of dollars, not seasonally adjusted)
March 23, 2006
Treasury Bills Treasury Coupons Federal Net change Net RPs 5
Agency totalNet Redemptions Net Net Purchases 3 Redemptions Net Redemptions outright Short- Long- Net
Purchases 2 (-) Change < 1 1-5 5-10 Over 10 (-) Change (-) holdings 4 Term 6 Term 7 Change
2003 18,150 --- 18,150 6,565 7,814 4,107 220 --- 18,706 10 36,846 2,223 1,036 3,259
2004 18,138 --- 18,138 7,994 17,249 5,763 1,364 --- 32,370 --- 50,507 -2,522 -331 -2,853
2005 8,300 --- 8,300 2,894 11,309 3,626 2,007 2,795 17,041 --- 25,341 -2,415 -192 -2,607
2004 QIV 4,167 --- 4,167 3,092 7,453 2,018 571 --- 13,134 --- 17,301 -5,956 1,728 -4,227
2005 QI 35 --- 35 --- --- --- --- 544 -544 --- -509 1,653 -3,454 -1,801
QII 2,010 --- 2,010 --- 3,495 1,708 1,015 1,305 4,914 --- 6,923 1,082 1,361 2,443
QIII 4,743 --- 4,743 1,298 5,025 1,118 90 757 6,774 --- 11,517 964 1,538 2,502
QIV 1,512 --- 1,512 1,596 2,789 800 902 189 5,897 --- 7,410 -1,202 -1,293 -2,496
2005 Jul --- --- --- --- --- --- --- --- --- --- --- 671 2,413 3,084
Aug 2,751 --- 2,751 1,298 1,390 988 --- 757 2,919 --- 5,670 136 -581 -445
Sep 1,992 --- 1,992 --- 3,635 130 90 --- 3,855 --- 5,847 283 -599 -316
Oct 1,023 --- 1,023 500 1,693 --- 902 --- 3,095 --- 4,118 -1,468 -5,369 -6,837
Nov 489 --- 489 1,096 1,096 800 --- 189 2,802 --- 3,292 -627 3,635 3,008
Dec --- --- --- --- --- --- --- --- --- --- --- 1,322 6,719 8,042
2006 Jan 1,563 --- 1,563 --- 2,809 1,505 205 1,321 3,198 --- 4,761 252 -1,355 -1,103
Feb 1,308 --- 1,308 1,200 2,498 25 924 --- 4,647 --- 5,955 -396 -3,672 -4,068
2005 Dec 28 --- --- --- --- --- --- --- --- --- --- --- 1,474 7,000 8,474
2006 Jan 4 --- --- --- --- --- --- --- 1,321 -1,321 --- -1,321 717 4,000 4,717
Jan 11 314 --- 314 --- 606 606 80 --- 1,292 --- 1,606 -6,074 -7,000 -13,074
Jan 18 1,249 --- 1,249 --- --- --- --- --- --- --- 1,249 3,757 -4,000 -243
Jan 25 --- --- --- --- --- 822 125 --- 947 --- 947 64 -3,000 -2,936
Feb 1 20 --- 20 --- 2,203 77 --- --- 2,280 --- 2,300 -485 --- -485
Feb 8 14 --- 14 --- --- --- --- --- --- --- 14 -2,824 -2,000 -4,824
Feb 15 1,274 --- 1,274 --- 1,250 --- --- --- 1,250 --- 2,524 4,204 1,000 5,204
Feb 22 --- --- --- --- 1,248 --- --- --- 1,248 --- 1,248 -1,211 3,000 1,789
Mar 1 --- --- --- 1,200 --- 25 924 --- 2,149 --- 2,149 -362 1,000 638
Mar 8 --- --- --- --- 676 174 --- --- 850 --- 850 -1,927 -1,000 -2,927
Mar 15 --- --- --- --- 1,460 --- 90 --- 1,550 --- 1,550 2,475 --- 2,475
Mar 22 --- --- --- --- --- --- --- --- --- --- --- -56 --- -56
2006 Mar 23 1,228 --- 1,228 --- --- --- --- --- --- --- 1,228 4,966 -6,000 -1,034
Intermeeting Period
Jan 31-Mar 23 2,536 --- 2,536 1,200 4,634 199 1,014 --- 7,047 --- 9,583 704 -4,000 -3,296
Memo: LEVEL (bil. $)
Mar 23 275.4 132.3 215.5 55.4 80.0 483.2 --- 758.5 -13.4 14.0 0.6
1. Change from end-of-period to end-of-period. Excludes changes in compensation for the effects of 4. Includes redemptions (-) of Treasury and agency securities. inflation on the principal of inflation-indexed securities. 5. RPs outstanding less reverse RPs.2. Outright purchases less outright sales (in market and with foreign accounts). 6. Original maturity of 13 days or less.3. Outright purchases less outright sales (in market and with foreign accounts). Includes short-term notes 7. Original maturity of 14 to 90 days. acquired in exchange for maturing bills. Excludes maturity shifts and rollovers of maturing issues, except the rollover of inflation compensation.
MRA:SPS
Class I FOMC - Restricted Controlled (FR) Page 37 of 37