following electroenzymatic hydrogen production by rotating
TRANSCRIPT

doi.org/10.26434/chemrxiv.13602869.v1
Following Electroenzymatic Hydrogen Production by Rotating Ring DiskElectrochemistry and Mass SpectrometryJaloliddin Khushvakov, Robin Nussbaum, Cécile Cadoux, Jifu Duan, Sven T. Stripp, Ross Milton
Submitted date: 18/01/2021 • Posted date: 19/01/2021Licence: CC BY-NC-ND 4.0Citation information: Khushvakov, Jaloliddin; Nussbaum, Robin; Cadoux, Cécile; Duan, Jifu; Stripp, Sven T.;Milton, Ross (2021): Following Electroenzymatic Hydrogen Production by Rotating Ring Disk Electrochemistryand Mass Spectrometry. ChemRxiv. Preprint. https://doi.org/10.26434/chemrxiv.13602869.v1
We report on two new approaches to study H2-producing metalloenzymes using electrochemistry and massspectrometry, where H+ reduction is driven by hydrogenase within an electrochemically active polymer (redoxpolymer). Researchers have established electrochemical approaches to utilize the H2-processingmetalloenzyme hydrogenase at electrode surfaces. However, it is more-than-often the case that hydrogenaseelectrodes are employed for H2 oxidation. There is significant interest in using renewable electrical energy todrive low-potential reductive reactions such as H2 evolution and N2 fixation, particularly with metalloenzymes.However, much work is required to understand metalloenzymes.The use of rotating ring disk electrochemistrywith hydrogenase is innovative in that it provides a live method to quantify the H2 being produced by theenzyme. This method will be valuable in determining product distributions for such enzymes in real-time, atelectrode surfaces.There is also significant interest in utilizing isotopes of enzymatic substrates whenperforming electrochemistry, since the rate of the reaction corresponds to the current at the electrode.However, researchers of electroenzymatic H+ reduction have yet to utilize online mass spectrometry toanalyze the products of hydron reduction. We report on the ability to follow and differentiate the formation ofH2, HD and D2 in real-time, permitting the calculation of apparent kinetic isotope effects. This approach will bevaluable to characterizing rate-limiting steps involving H+, as well as for other gas-processingmetalloenzymes.
File list (3)
download fileview on ChemRxiv170121 MS file.pdf (1.13 MiB)
download fileview on ChemRxivTOC.png (212.99 KiB)
download fileview on ChemRxiv170121 Supporting information.pdf (1.82 MiB)

Following electroenzymatic hydrogen production by rotating ring 1
disk electrochemistry and mass spectrometry 2
Jaloliddin Khushvakov,a† Robin Nussbaum,a† Cécile Cadoux,a Jifu Duan,b Sven T. Strippc and 3
Ross D. Miltona* 4
a Department of Inorganic and Analytical Chemistry, University of Geneva, Sciences II, Quai 5
Ernest-Ansermet 30, 1211 Geneva 4, Switzerland. 6
b Faculty of Biology and Biotechnology, Photobiotechnology, Ruhr-Universität Bochum, 7
Universitätsstrasse 150, 44801 Bochum, Germany. 8
c Department of Physics, Bioinorganic Chemistry, Freie Universität Berlin, 10623 Berlin, 9
Germany. 10
* Email: [email protected] 11
12
† These authors contributed equally to this work. 13

Abstract 14
Gas-processing metalloenzymes are of interest to new future biotechnologies and bioinspired 15
technologies. Of particular importance are hydrogenases and nitrogenases, which both produce 16
molecular hydrogen (H2) from proton (H+) reduction. Here, we report on the use of rotating 17
ring disk electrochemistry (RRDE) and mass spectrometry (MS) to follow the production of 18
H2 and isotopes produced from deuteron (D+) reduction (HD and D2) using a model hydrogen-19
evolving metalloenzyme [FeFe]-hydrogenase from Clostridium pasteurianum. This facilitates 20
enzymology studies independent of non-innocent chemical reductants. We anticipate that these 21
approaches will be of value in resolving the catalytic mechanisms of H2-producing 22
metalloenzymes and the design of bioinspired catalysts for H2 production and N2 fixation. 23
24
Keywords 25
Enzymatic electrochemistry; [FeFe]; Hydrogen; Hydrogenases; Kinetic isotope effect; 26
Metalloenzymes. 27

Introduction 28
Due to ever-increasing environmental awareness, there is considerable interest to develop 29
efficient electrocatalysts to produce renewable fuels (such as molecular hydrogen, H2) or to 30
supplement/delocalize global industrial processes (such as the production of ammonia fertilizer 31
from molecular nitrogen, N2).1 Gas-processing metalloenzymes are attractive for new 32
electrochemical biotechnologies and provide inspiration for the design of new catalysts due to 33
desirable catalytic properties such as high selectivity, the use of non-precious and abundant 34
metals in their catalytic cores.2 Further, their optimal catalytic activities are often found under 35
mild conditions (ambient temperature and pressure, near-neutral pH). Two particular enzymes 36
of interest are hydrogenases and nitrogenases. Hydrogenases are iron- and sulfur-dependent 37
metalloenzymes that are found in all kingdoms of life, which catalyze the reversible reduction 38
of protons (2H+) to H2 (E0’ = −0.414 V vs. SHE).3 Nitrogenases are also iron- and sulfur-39
dependent metalloenzymes that are found in select archaea and bacteria, which catalyze the 40
fixation of N2 to NH3 (E0’ = +0.274 V vs. SHE),4 as well as the reduction of H+ to H2.5 The 41
production of one equivalent of H2 per N2 reduced is thought to be necessary in order to activate 42
the catalytic cofactor of nitrogenase for N2 fixation.6 Thus, there is considerable interest to 43
understand how nitrogenase evolves H2 for activation as well as how nitrogenase can 44
theoretically divert up to 75% of its electrons toward N2 fixation over H+ reduction in aqueous 45
media, a reaction that plagues abiotic N2−reducing catalytic systems.6–8 46
While hydrogenases and nitrogenases exchange reducing equivalents with small 47
metalloproteins such as ferredoxins or flavodoxins in vivo, electrodes have been employed to 48
drive the artificial reduction of H+ and N2 by these enzymes in vitro.9–13 Such an approach is 49
attractive not only for new biotechnologies, but also for mechanistic interrogation of their 50
complex catalytic mechanisms where electron transfer to these gas-processing metalloenzymes 51
can be controlled. Here, we demonstrate the use of rotating ring disk electrochemistry (RRDE) 52

as a technique to follow the production of H2 from [FeFe]-hydrogenase from Clostridium 53
pasteurianum (CpI) wired to a carbon electrode surface within a redox polymer (Figure 1). 54
Second, we investigated electroenzymatic hydron reduction by CpI in a 50%/50% H/D 55
buffered electrolyte. We demonstrate the use of online mass spectrometry (MS) to follow H2, 56
molecular deuterium (D2) and deuterium hydride (HD) production by an enzyme electrode for 57
the first time, enabling kinetic isotope effect (KIE) studies. These “online” methods provide 58
approaches that can be translated to interrogate other metalloenzymes that produce H2, as well 59
as characterizing catalytic biases for substrate reduction, i.e., N2 vs. H+ reduction by 60
nitrogenase. 61
62
Figure 1. The [FeFe]-hydrogenase from C. pasteurianum (CpI) is immobilized within a cobaltocene-containing redox polymer (Cc-BPEI) at the surface of a rotating carbon electrode. The electroenzymatically generated H2 gas is detected by electrocatalytic oxidation at a rotating Pt ring electrode.

Results 63
While standard [FeFe]-hydrogenases are particularly active in the H+ reduction reaction 64
direction,14 different hydrogenases have previously been reported to undergo H+ reduction 65
when entrapped within a bis(cyclopentadienyl)cobalt(II)-grafted redox polymer at electrode 66
surfaces.15 This “cobaltocene” mediator has a reduction potential (E0) of −0.91 V vs. SHE and 67
is well-suited to facilitate electron transfer to hydrogenase for H+ reduction (E0’ = −0.414 V 68
vs. SHE).16 We employed branched poly(ethylenimine)-grafted cobaltocene as the redox 69
polymer (Cc-BPEI)17 alongside CpI,18 which can be recombinantly expressed in Escherichia 70
coli and activated in vivo and in vitro (Figure S1).18–21 In the first step, we investigated the 71
activity of CpI and integrity of the “H-cluster” active site cofactor by ATR FTIR spectroscopy. 72
The CO and CN– ligands of the H-cluster absorb strongly in the frequency regime between 73
2150 – 1750 cm-1 and do not overlap with the absorbance bands of liquid water and protein. 74
Absolute spectra of hydrated sample (0.5 mM CpI or 0.5 mM CpI + 2 mg/mL Cc-BPEI) suggest 75
no degradation of the H-cluster (Figure S2). To probe the reactivity of the hydrogenase within 76
the polymer, we recorded ATR FTIR difference spectra triggering the reduction of CpI by 77
changing the atmosphere above the sample from 100% N2 to 90% N2 and 10% H2. Figure 2a 78
depicts the decrease of the oxidized state Hox (negative bands) over the increase of one-79
electron reduced states (Hred´ and Hred) and two-electron reduced states (Hhyd and Hsred). 80
This is the typical behavior of pure [FeFe]-hydrogenase at near-neutral pH (Figure S3), as 81
reported earlier.22–24 Following the reduction and auto-oxidation of CpI in time-resolved 82
experiments further confirms the unperturbed activity of enzyme within the Cc-BPEI polymer 83

(Figure 2b and Figure S3). Recent 84
work shows that [FeFe]-hydrogenases 85
can even be reconstituted within redox 86
polymers.25 87
Next, the ability to 88
electrochemically follow H2 produced 89
by a CpI + Cc-BPEI-functionalized 90
electrode was investigated by rotating 91
ring disk electrochemistry (RRDE). 92
While Pt electrodes efficiently reduce 93
H+ and oxidize H2 and RRDE can 94
therefore be employed to follow H2 95
production at Pt ring electrodes,26,27 this 96
technique has not yet been utilized to 97
study mechanisms of H2-producing 98
metalloenzymes. Figure 3a presents a 99
cyclic voltammogram for Cc-mediated 100
H+ reduction by CpI, where a reductive 101
catalytic “wave” commencing at around <−0.4 V vs. SHE was observed representing 102
electroenzymatic H+ reduction to H2 at a glassy carbon (GC) disk electrode. A significant H2 103
oxidative catalytic “wave” was not observed due to (i) the absence of H2 in the glovebox (and 104
electrochemical cell) environment, and (ii) the reductive bias imparted by the low reduction 105
potential of the Cc-BPEI redox polymer. Simultaneously, the neighboring Pt ring electrode was 106
poised at a potential sufficiently positive for electrocatalytic H2 oxidation (i.e., 0 V vs. SHE) 107
(Figure S4). In order to confirm that the disk reductive currents and the ring oxidative currents 108
Figure 2. Integrity of the H-cluster and activity of CpI probed by ATR FTIR spectroscopy. (a) The figure depicts H2 – N2 difference spectra of CpI + 2 mg mL−1 Cc-BPEI. Negative bands represent the H-cluster states that prevail under N2, positive bands are assigned to states accumulated under 10% H2. The observed pattern is virtually identical to pure CpI. (b) Following the time-dependent evolution of states under N2 and 10% H2 further confirms the unperturbed activity of CpI within the Cc-BPEI polymer.

did indeed correspond to 109
electroenzymatic H2 turnover, a control 110
experiment was performed where we 111
exploited the extreme sensitivity of 112
[FeFe]-hydrogenases to O2.28 By taking 113
a CpI-modified electrode and 114
deactivating the enzyme by rotating the 115
electrode in an O2-containing 116
electrolyte solution, the reductive (GC 117
disk) and oxidative (Pt ring) 118
electrocatalytic currents were almost 119
entirely abolished (Figure S5). 120
RRDEs have associated 121
collection efficiencies (CEs) 122
corresponding to the quantity of species 123
produced at the disk that is 124
subsequently detected at the ring; this 125
value is specified to be 24.9% for the 126
RRDE used in this study (further 127
information in the Supporting 128
Information). The CE of this setup was 129
first confirmed using the ferrocyanide/ferricyanide couple and found to be around 27% 130
between rotation rates of 500 – 2500 rpm. For the detection of H2 produced by CpI we observed 131
the CE to reach up to 23% (Figure 3b, Figure S6 and Figure S7). Interestingly, the CE was 132
typically found to decrease with increasing rotation rates (Figure 3b), which was attributed to 133
Figure 3. (a) Cyclic voltammogram for electroenzymatic H2 production (black line) and its subsequent detection by the Pt ring of a RRDE (red line). The scan rate of the CpI-functionalized GC working electrode was 10 mV s−1. The potential of the Pt ring electrode was fixed at 0 V vs. SHE during the experiment, although the current is plotted vs. the potential applied at the GC electrode. The RRDE was rotated at 1000 rpm in an argon-filled glovebox. Electrolyte = 0.5 M phosphate buffer, pH 6.5. (b) A comparison of collection efficiencies obtained for H2 detection (black line) vs. ferricyanide reduction (red line) as a function of rotation rate. Data collected from 2x amperometric i-t experiments. For H2 collection efficiency, the CpI-functionalized disk electrode was poised at −0.8 V and the Pt ring electrode was poised at 0 V vs. SHE. Electrolyte = 0.5 M phosphate buffer, pH 6.5. Ferricyanide generation was performed at a disk electrode poised at +0.8 V and ferricyanide reduction was performed at a Pt ring electrode poised at +0.1 V vs. SHE. Electrolyte = 0.1 M KCl containing 2 mM ferrocyanide.

the relatively low solubility of H2 in 134
aqueous solution and increasingly poor 135
H2 adsorption at high rotation rates. 136
Further, subsequent electrochemical 137
cleaning of the Pt ring surface 138
(Supporting Information) after 139
performing hydrogenase experiments in 140
phosphate buffer revealed a sharp 141
oxidative peak that disappeared after 142
the first scan (Figure S8). We 143
hypothesize that this peak could result 144
from the oxidative stripping of an 145
unknown species that inhibits H2 146
adsorption. Further, high phosphate 147
concentrations were found to 148
significantly impact O2 reduction on Pt 149
electrodes (Figure S9), while the CE of 150
the ferrocyanide/ferricyanide couple by 151
RRDE was not significantly impacted. 152
We next evaluated the KIE for 153
hydron reduction by CpI within the Cc-BPEI redox polymer. Initially, the RRDE approach was 154
employed where a significant decrease in the magnitude of the reductive current (diminished 155
H2 production) was observed in different fractions of D2O-based electrolyte (Figure 4a). In the 156
case where electron transfer to CpI is rate-determining, a change in the electrocatalytic current 157
Figure 4. (a) RRDE cyclic voltammograms for electroenzymatic hydron reduction (black line) with varying ratios of H/D, and subsequent product detection (red line). The scan rate of the CpI-functionalized glassy carbon working electrode was 10 mV s−1. The potential of the Pt ring electrode was fixed at 0 V vs. SHE during the experiment. The RRDE was rotated at 1000 rpm in an argon-filled glovebox. Electrolyte = 0.5 M phosphate buffer, pH/pD = 6.5. (b) Amperometric i-t curve demonstrating the sharp decrease in hydron reductive current upon the introduction of 50% D (final) to the electrolyte. Buffer hydron composition and electrode rotation rates are given above the traces. The glassy carbon working electrode was poised at −0.6 V vs. SHE. Electrolyte = 0.5 M phosphate buffer, pH/pD = 6.5.

(which is proportional to the rate 158
constant) would not be expected and 159
KIE = 𝑖"#$/𝑖"#$ = 1. However, the 160
significant decrease in the rate (𝑘 ∝ 𝑖) 161
of hydron reduction indicates that 162
KIE ≠ 1 and we hypothesized that the 163
rate-determining step for hydron 164
reduction could be associated with (i) 165
one or more hydrons, (ii) product 166
release (i.e., H2/D2/HD)29 and/or (iii) 167
hydron mass transport (either in the 168
bulk, within the redox polymer film or 169
within CpI). Amperometric i-t was 170
subsequently employed to confirm 171
whether bulk mass transport was rate-172
limiting (Figure 4b). We found that 173
the titration of an equivalent D2O-174
based phosphate buffer electrolyte (to 175
a final H:D ratio of 1:1) immediately 176
resulted in a decrease in the magnitude of the reductive current by approximately 37%. 177
Increasing the rotation rate of the electrode from 1000 – 3000 rpm did not significantly recover 178
the reductive catalytic current, indicating that bulk mass-transport was not rate-limiting. 179
Further, the subsequent addition of H2O-based phosphate buffer electrode (with a final H:D 180
ratio of 3:1) resulted in an increase in the magnitude of the reductive current, demonstrating 181
that this effect is reversible. 182
Figure 5. (a) Electrolytic evolution of H2 (black line), HD (red line) and D2 (blue line) following the application of −0.6 V vs. SHE at a CpI-functionalized carbon paper electrode for 3600 s in 1:1 H:D buffer. Each product was followed simultaneously (in the same run) by mass spectrometry (m/z = 2, 3 and 4). Uncalibrated gas quantities are given as baseline corrected changes in ppm. Following electrolysis and in between standard injections, the electrochemical cell was flushed with argon gas (black dashed line) to displace H2/HD/D2 from the reaction headspace. Electrolyte = 0.5 M phosphate buffer, pH/pD = 6.5. The injection of individual or mixed gas standards demonstrates the differentiation of these products in the same experiment. (b) Calibrated quantities of H2 (black), HD (red), D2 (blue) and the sum (magenta) produced during 3600 s of bulk electrolysis (from (a)). The x-axis was corrected to the start of bulk electrolysis.

Upon performing 183
electroenzymatic hydron reduction with 184
CpI in a mixed H/D buffer the expected 185
gaseous products would be H2, D2 and 186
HD. While we have shown that RRDE is 187
effective in observing the H2 produced 188
by enzyme electrodes, differentiating 189
between H2, D2 and HD at a Pt ring 190
electrode was not expected to be facile. 191
To this end, we utilized an online 192
residual gas analyzer to differentiate 193
between H2, D2 and HD. A carbon paper 194
electrode functionalized with CpI and 195
the Cc-BPEI redox polymer was 196
introduced to an electrolyte comprised 197
of 50% deuterated phosphate buffer electrolyte. Bulk electrolysis was performed at −0.6 V vs. 198
SHE while simultaneously and continuously following the formation of products (H2, D2 and 199
HD) in the headspace of the vial with m/z values of 2, 3 and 4 (Figure 5, Figures S10 and 200
S11). As demonstrated in Figure 5a, it was possible to repeatedly flush the electrochemical 201
cell and make subsequent injections of gas standards for calibration, where H2, D2 and HD can 202
either be followed together or individually. After calibration of the cell (Figure 5b), the 203
observed product distribution was found to be approximately 0.44:0.42:0.14 for H2:HD:D2 at 204
steady-state (Figure 6a). Here, we assume that hydrons are sequentially delivered to the H-205
cluster active site of CpI,30 arriving at possible pathways for product formation of: 206
Pathway 1: [FeFe] -𝐇/0⎯2[FeFe]"
-𝐇/0⎯2 [FeFe] + 𝐇𝟐 207
Figure 6. (a) Observed product distribution during electrolysis for 3600 s using a CpI-functionalized carbon paper electrode in 1:1 H:D phosphate buffer, pH 6.5. (b) Calculated kinetic isotope effect (KIE) of the CpI-functionalized electrode, based on the observed fraction of each product in (A).

Pathway 2: [FeFe] -𝐇/0⎯2[FeFe]"
-𝐃/0⎯2 [FeFe] + 𝐇𝐃 208
Pathway 3: [FeFe] -𝐃/0⎯2 [FeFe]6
-𝐇/0⎯2 [FeFe] + 𝐇𝐃 209
Pathway 4: [FeFe] -𝐃/0⎯2 [FeFe]6
-𝐃/0⎯2 [FeFe] +𝐃𝟐 210
211
The probabilities (𝑝) of producing H2, HD (pathways 2 and 3 combined) or D2 can be 212
then expressed as a function of a KIE and the mole fractions (𝑓9), as outlined in the Supporting 213
Information.31 As shown in Figure 6b, the KIEs for the overall CpI electrode as calculated for 214
the observed product distribution are ~2 (for H2), ~2.3 (for HD) and ~1.7 (for D2). Figure S11 215
reports the amperometric i-t trace and observed product distribution for a control CpI carbon 216
paper electrode that was prepared under oxic conditions in order to render the enzyme inactive; 217
significantly diminished catalytic currents (x20 fold) and products (x17 fold) were observed, 218
consistent with active CpI being necessary for the observed production of H2, HD and D2. 219
220
Conclusions 221
We report on the use of RRDE and MS as two different approaches to interrogate H2 production 222
by gas-processing metalloenzymes at electrode surfaces. The [FeFe]-hydrogenase CpI was 223
used as a “model” metalloenzyme and a cobaltocene-based redox polymer was used to 224
immobilize the enzyme and mediate electrons for H+ reduction. The Pt ring electrode of an 225
RRDE was shown to be effective at monitoring real-time H2 production. Further, online MS 226
was employed to follow the production of H2 and isotopes (HD, D2) that are produced by 227
hydron reduction at the gas-processing metalloenzyme electrode in a mixed H/D buffer 228
electrolyte. The combination of these techniques will be important to interrogating 229
metalloenzyme mechanisms, notably independent of non-innocent chemical reductants such as 230
dithionite or europium compounds. Future work will seek to identify the origin of the observed 231

KIE for CpI under these conditions. Moreover, this technique will also be employed to 232
investigate other H2-producing metalloenzymes for which H+ reduction is of mechanistic 233
importance, such as nitrogenase. 234
Acknowledgements 235
We thank Alexandre Jolly and Darren Martin for assistance with mass spectrometry and 236
enzymatic activity assays. We thank the James Swartz (Stanford University) for sharing the 237
E. coli strain used for CpI expression. We thank Thomas Happe for sharing the sample of CpI 238
used for the ATR FTIR experiments. RDM thanks the COMAD of the University of Geneva, 239
the Ernest Boninchi Foundation, the Academic Society of Geneva and the Ernst and Lucie 240
Schmidheiny Foundation for support. STS acknowledges funding by the Deutsche 241
Forschungsgemeinschaft through priority program 1927 (grant agreement 1554/5-1). 242
References 243
(1) Holade, Y.; Servat, K.; Tingry, S.; Napporn, T. W.; Remita, H.; Cornu, D.; Kokoh, K. 244
B. Advances in Electrocatalysis for Energy Conversion and Synthesis of Organic 245
Molecules. ChemPhysChem, 2017, 18 (19), 2573–2605. 246
(2) Jenner, L. P.; Butt, J. N. Electrochemistry of Surface-Confined Enzymes: Inspiration, 247
Insight and Opportunity for Sustainable Biotechnology. Current Opinion in 248
Electrochemistry, 2018, 8, 81–88. 249
(3) Lubitz, W.; Ogata, H.; Rüdiger, O.; Reijerse, E. Hydrogenases. Chem. Rev., 2014, 114 250
(8), 4081–4148. 251
(4) Guo, W.; Zhang, K.; Liang, Z.; Zou, R.; Xu, Q. Electrochemical Nitrogen Fixation and 252
Utilization: Theories, Advanced Catalyst Materials and System Design. Chemical 253
Society Reviews, 2019, 48 (24), 5658–5716. 254

(5) Foster, S. L.; Bakovic, S. I. P.; Duda, R. D.; Maheshwari, S.; Milton, R. D.; Minteer, 255
S. D.; Janik, M. J.; Renner, J. N.; Greenlee, L. F. Catalysts for Nitrogen Reduction to 256
Ammonia. Nature Catalysis, 2018, 1 (7), 490–500. 257
(6) Rohde, M.; Sippel, D.; Trncik, C.; Andrade, S. L. A.; Einsle, O. The Critical E4 State 258
of Nitrogenase Catalysis. Biochemistry, 2018, 57 (38), 5497–5504. 259
(7) Rutledge, H. L.; Tezcan, F. A. Electron Transfer in Nitrogenase. Chemical Reviews, 260
2020, 120 (12), 5158–5193. 261
(8) Seefeldt, L. C.; Hoffman, B. M.; Peters, J. W.; Raugei, S.; Beratan, D. N.; Antony, E.; 262
Dean, D. R. Energy Transduction in Nitrogenase. Accounts of Chemical Research, 263
2018, 51 (9), 2179–2186. 264
(9) Milton, R. D.; Minteer, S. D. Nitrogenase Bioelectrochemistry for Synthesis 265
Applications. Accounts of Chemical Research, 2019, 52 (12), 3351–3360. 266
(10) Poudel, S.; Colman, D. R.; Fixen, K. R.; Ledbetter, R. N.; Zheng, Y.; Pence, N.; 267
Seefeldt, L. C.; Peters, J. W.; Harwood, C. S.; Boyd, E. S. Electron Transfer to 268
Nitrogenase in Different Genomic and Metabolic Backgrounds. Journal of 269
Bacteriology, 2018, 200 (10). 270
(11) Chen, J. G.; Crooks, R. M.; Seefeldt, L. C.; Bren, K. L.; Bullock, R. M.; Darensbourg, 271
M. Y.; Holland, P. L.; Hoffman, B.; Janik, M. J.; Jones, A. K.; Kanatzidis, M. G.; 272
King, P.; Lancaster, K. M.; Lymar, S. V; Pfromm, P.; Schneider, W. F.; Schrock, R. R. 273
Beyond Fossil Fuel–Driven Nitrogen Transformations. Science, 2018, 360 (6391), 274
eaar6611. 275
(12) Gorton, L.; Meredith, M. T.; Minteer, S. D. S. D. D.; Hu, Y. J.; Lee, C. W. C.; Ribbe, 276
M. W.; Hoffman, B. M. B. M.; Lukoyanov, D.; Yang, Z. Y.; Dean, D. R. D. R.; et al. 277
Nitrilotriacetic Acid Degradation under Microbial Fuel Cell Environment. Biosens. 278
Bioelectron., 2010, 5 (1), 241–248. 279

(13) Cadoux, C.; Milton, R. D. Recent Enzymatic Electrochemistry for Reductive 280
Reactions. ChemElectroChem, 2020, 7 (9), 1974–1986. 281
(14) Land, H.; Senger, M.; Berggren, G.; Stripp, S. T. Current State of [FeFe]-Hydrogenase 282
Research: Biodiversity and Spectroscopic Investigations. ACS Catalysis, 2020, 10 283
(13), 7069–7086. 284
(15) Ruth, J. C.; Milton, R. D.; Gu, W.; Spormann, A. M. Enhanced Electrosynthetic 285
Hydrogen Evolution by Hydrogenases Embedded in a Redox-Active Hydrogel. 286
Chemistry - A European Journal, 2020, 26 (32), 7323–7329. 287
(16) Khanova, L. A.; Topolev, V. V.; Krishtalik, L. I. Effect of the Aqueous-Organic 288
Solvent Structure on the Cobalticenium-Cobaltocene Redox Potential: The Redox 289
Couple as a Basis for Determination of the Single Ion Transfer Energies. Chemical 290
Physics, 2006, 326 (1), 33–42. 291
(17) Tapia, C.; Milton, R. D.; Pankratova, G.; Minteer, S. D.; Åkerlund, H. E.; Leech, D.; 292
De Lacey, A. L.; Pita, M.; Gorton, L. Wiring of Photosystem I and Hydrogenase on an 293
Electrode for Photoelectrochemical H2 Production by Using Redox Polymers for 294
Relatively Positive Onset Potential. ChemElectroChem, 2017, 4 (1), 90–95. 295
(18) Kuchenreuther, J. M.; Grady-Smith, C. S.; Bingham, A. S.; George, S. J.; Cramer, S. 296
P.; Swartz, J. R. High-Yield Expression of Heterologous [FeFe] Hydrogenases in 297
Escherichia Coli. PLoS ONE, 2010, 5 (11), e15491. 298
(19) Posewitz, M. C.; King, P. W.; Smolinski, S. L.; Zhang, L.; Seibert, M.; Ghirardi, M. L. 299
Discovery of Two Novel Radical S-Adenosylmethionine Proteins Required for the 300
Assembly of an Active [Fe] Hydrogenase. Journal of Biological Chemistry, 2004, 279 301
(24), 25711–25720. 302
(20) Berggren, G.; Adamska, A.; Lambertz, C.; Simmons, T. R.; Esselborn, J.; Atta, M.; 303
Gambarelli, S.; Mouesca, J. M.; Reijerse, E.; Lubitz, W.; Happe, T.; Artero, V.; 304
Fontecave, M. Biomimetic Assembly and Activation of [FeFe]-Hydrogenases. Nature, 305
2013, 499 (7456), 66–69. 306
(21) Esselborn, J.; Lambertz, C.; Adamska-Venkatesh, A.; Simmons, T.; Berggren, G.; 307
Noth, J.; Siebel, J.; Hemschemeier, A.; Artero, V.; Reijerse, E.; Fontecave, M.; Lubitz, 308
W.; Happe, T. Spontaneous Activation of [FeFe]-Hydrogenases by an Inorganic [2Fe] 309
Active Site Mimic. Nature Chemical Biology, 2013, 9 (10), 607–609. 310
(22) Senger, M.; Mebs, S.; Duan, J.; Wittkamp, F.; Apfel, U. P.; Heberle, J.; Haumann, M.; 311
Stripp, S. T. Stepwise Isotope Editing of [FeFe]-Hydrogenases Exposes Cofactor 312
Dynamics. Proceedings of the National Academy of Sciences of the United States of 313
America, 2016, 113 (30), 8454–8459. 314
(23) Winkler, M.; Senger, M.; Duan, J.; Esselborn, J.; Wittkamp, F.; Hofmann, E.; Apfel, 315
U. P.; Stripp, S. T.; Happe, T. Accumulating the Hydride State in the Catalytic Cycle 316
of [FeFe]-Hydrogenases. Nature Communications, 2017, 8 (1), 1–7. 317
(24) Duan, J.; Mebs, S.; Laun, K.; Wittkamp, F.; Heberle, J.; Happe, T.; Hofmann, E.; 318
Apfel, U. P.; Winkler, M.; Senger, M.; Haumann, M.; Stripp, S. T. Geometry of the 319
Catalytic Active Site in [FeFe]-Hydrogenase Is Determined by Hydrogen Bonding and 320
Proton Transfer. ACS Catalysis, 2019, 9 (10), 9140–9149. 321
(25) Felbek, C.; Hardt, S.; Papini, C.; Pramanik, D.; Artero, V.; Fontecave, M.; Fourmond, 322
V.; Plumere, N.; Léger, C. Artificial Maturation of [FeFe] Hydrogenase in a Redox 323
Polymer Film. Chemical Communications, 2021, accepted (DOI: 324
10.1039/D0CC08168J). 325
(26) Goyal, A.; Marcandalli, G.; Mints, V. A.; Koper, M. T. M. Competition between CO2 326
Reduction and Hydrogen Evolution on a Gold Electrode under Well-Defined Mass 327
Transport Conditions. Journal of the American Chemical Society, 2020, 142 (9), 4154–328
4161. 329

(27) Ahmed, M. E.; Dey, S.; Darensbourg, M. Y.; Dey, A. Oxygen-Tolerant H2 Production 330
by [FeFe]-H2ase Active Site Mimics Aided by Second Sphere Proton Shuttle. Journal 331
of the American Chemical Society, 2018, 140 (39), 12457–12468. 332
(28) Stripp, S. T.; Goldet, G.; Brandmayr, C.; Sanganas, O.; Vincent, K. A.; Haumann, M.; 333
Armstrong, F. A.; Happe, T. How Oxygen Attacks [FeFe] Hydrogenases from 334
Photosynthetic Organisms. Proceedings of the National Academy of Sciences of the 335
United States of America, 2009, 106 (41), 17331–17336. 336
(29) Sanchez, M. L. K.; Sommer, C.; Reijerse, E.; Birrell, J. A.; Lubitz, W.; Dyer, R. B. 337
Investigating the Kinetic Competency of CrHydA1 [FeFe] Hydrogenase Intermediate 338
States via Time-Resolved Infrared Spectroscopy. Journal of the American Chemical 339
Society, 2019, 141 (40), 16064–16070. 340
(30) Senger, M.; Eichmann, V.; Laun, K.; Duan, J.; Wittkamp, F.; Knör, G.; Apfel, U. P.; 341
Happe, T.; Winkler, M.; Heberle, J.; Stripp, S. T. How [FeFe]-Hydrogenase Facilitates 342
Bidirectional Proton Transfer. Journal of the American Chemical Society, 2019, 141 343
(43), 17394–17403. 344
(31) Qiu, Y.; Ren, H.; Edwards, M. A.; Gao, R.; Barman, K.; White, H. S. Electrochemical 345
Generation of Individual Nanobubbles Comprising H2, D2, and HD. Langmuir, 2020, 346
36 (22), 6073–6078. 347
348

download fileview on ChemRxiv170121 MS file.pdf (1.13 MiB)

download fileview on ChemRxivTOC.png (212.99 KiB)

Following electroenzymatic hydrogen production by rotating ring disk 1
electrochemistry and mass spectrometry 2
Jaloliddin Khushvakov,a† Robin Nussbaum,a† Cécile Cadoux,a Jifu Duan,b Sven T. Strippc and 3
Ross D. Miltona* 4
a Department of Inorganic and Analytical Chemistry, University of Geneva, Sciences II, Quai 5
Ernest-Ansermet 30, 1211 Geneva 4, Switzerland. 6
b Faculty of Biology and Biotechnology, Photobiotechnology, Ruhr-Universität Bochum, 7
Universitätsstrasse 150, 44801 Bochum, Germany. 8
c Department of Physics, Freie Universität Berlin, 10623 Berlin, Germany. 9
* Email: [email protected] 10
11
† These authors contributed equally to this work. 12
13
14

Supporting Information 15
Materials and methods 16
General 17
Unless stated otherwise, all chemicals were purchased from Sigma Aldrich, Inc. (Switzerland) 18
and used as received. 1-(2,5-dioxopyrrolidinylcarboxy)-cobaltoceniumhexafluorophosphate 19
(Cc-NHS) was purchased from MCAT (Germany) and used as received. Hydrogen (H2, 20
product = 769088), deuterium hydride (HD, product = 488690) and deuterium (D2, product = 21
361860) were purchased from Sigma Aldrich, Inc. and used for calibration. [FeFe]-22
hydrogenase purification was performed inside of a glovebox filled with ~97:3% N2/H2, at 23
ambient temperature (Coy Laboratory Products Inc., USA). All electrochemical and mass 24
spectrometry experiments were performed in an Ar-filled glovebox (Jacomex, France). All gas 25
and liquid transfers, when not inside of a glovebox, were performed using gas-tight syringes 26
and septum-sealed vials. 27
28
[FeFe]-hydrogenase “CpI” preparation 29
Strep-tagged [FeFe]-hydrogenase “CpI” from Clostridium pasteurianum was recombinantly 30
expressed in Escherichia coli and purified as previously detailed, although a “StrepTactin XT” 31
column was used (Sigma, 1 mL column volume) and CpI was eluted using 50 mM biotin 32
(Figure S1).1,2 Purified enzyme was flash-frozen and stored in liquid nitrogen until use. The 33
specific H2-oxidation activity of CpI was determined to be 17.1 ± 3.3 µmol min−1 mg−1 protein, 34
in pH 9 glycine-NaOH buffer (50 mM) at 28 ºC and under 100% H2 using methylviologen 35
(1 mM) as the electron acceptor (e = 12,700 cm−1 M−1 at 606 nm). 36

37
38
Electrochemistry and mass spectrometry 39
All electrochemical and mass spectrometry experiments were performed inside of an Ar-filled 40
glovebox (Jacomex, France) at ambient temperature. Rotating ring-disk electrochemistry was 41
performed using a Metrohm-Autolab system (product = AUT.RRDE, Switzerland) equipped 42
with a 5 mm glassy carbon disk and a Pt ring electrode (375 µm gap, 24.9% collection 43
efficiency). A Metrohm-Dropsense µStat 400 bipotentiostat/galvanostat was used for the cyclic 44
voltammetry and amperometric experiments. For RRDE experiments, a cell equipped with a 45
Luggin capillary and a fritted counter electrode compartment was purchased from Adams & 46
Chittenden Scientific Glass (product = 957219, USA). A saturated Ag/AgCl electrode was used 47
as the reference electrode and platinum wire was used as the counter electrode. Potentials were 48
applied vs. the saturated Ag/AgCl(satd.) reference electrode and converted to the standard 49
hydrogen electrode (SHE) by: ESHE = EAg/AgCl + 0.197 (V).3 All buffer electrolytes were 50
prepared aerobically and transferred into the anoxic chamber at least 2 days prior to 51
experiments (to allow for O2 exchange with Ar). The GC/Pt RRDE with a 0.05 µm alumina 52
slurry prior to use or functionalization with the hydrogenase/redox polymer mix (below). 53
Figure S1. SDS-PAGE (4-12% acrylamide) of strep-tagged CpI. Lane 1 = protein markers (kDa), lane 2 = purified CpI, ~1 µg of protein.

Immediately before use, the Pt ring electrode was electrochemically cleaned by cyclic 54
voltammetry (in phosphate buffer electrolyte, pH 6.5, 0.5 M) between −0.4 to 1 V vs. 55
Ag/AgCl(satd.) (scan rate = 250 mV s−1, 5 scans, rotation rate = 1000 rpm). Phosphate buffer 56
electrolyte (pH 6.5, 0.5 M) was used as the electrolyte for the electrochemical experiments. For 57
kinetic isotope effect (KIE) experiments requiring deuterated phosphate buffer electrolyte, 58
dibasic potassium phosphate was dissolved in D2O and the pD was adjusted with the addition 59
of sodium deuteroxide (NaOD, Sigma Aldrich). The pD was determined using a standard pH 60
glass electrode and the following correction for the activity of D: pD = “pH” + 0.41.4 Non-61
PTFE-treated Toray carbon paper was purchased from Fisher Scientific (Switzerland). Carbon 62
paper electrodes were prepared by cutting a strip of 0.5 cm × 3 cm Toray carbon paper and 63
wax-coating the center of the strip to yield two exposed ends; one to clip to the potentiostat 64
lead and the other (with an exposed geometric area of ~0.25 cm2) for CpI/Cc-BPEI 65
functionalization (below). While mass transport was controlled by electrode rotation in the 66
RRDE experiments, a stirrer bar and magnetic stirrer plate were used in the case of experiments 67
employing carbon paper electrodes. 68
The production of H2, HD and D2 was followed using a residual gas analyzer (HPR-20 69
R&D, HIDEN Analytical, UK) equipped with an unheated capillary inlet. The inlet was passed 70
through an air-tight feedthrough into the Ar-filled glovebox for product analysis. 71
Electrochemical MS experiments were performed using a custom-built electrochemical cell 72
(Adams & Chittenden, USA) with a “pear-shape” design and a total volume of 58 mL. 73
Phosphate buffer electrolyte (10 mL) was added to the cell and electrodes were connected via 74
gas-tight fittings; butyl stoppers (Chemglass Life Sciences, CLS420914) were cored to house 75
the reference electrode, counter electrode (coiled platinum wire in a Vycor-tipped glass tube, 76
OD = 8 mm) and working electrode (connected to a titanium wire). The inlet tubing of the MS 77
was also fed through a butyl stopper in addition to a vent tube (to counter the vacuum pulled 78

by the MS). The probabilities (𝑝) of producing H2, HD (pathways 2 and 3 combined) or D2 can 79
be expressed as:5 80
𝑝𝐇𝟐 =𝐊𝐈𝐄)+,)
((𝐊𝐈𝐄)+,/+0)) and 𝐊𝐈𝐄 =
+012𝐇𝟐+,3+,12𝐇𝟐
81
𝑝𝐇𝐃 =5(678)+0+,((678)+,/+0))
and 𝐊𝐈𝐄 =93+0)+,)(52𝐇𝐃3:)32𝐇𝐃+0+,/+0+,
+,)2𝐇𝐃 82
𝑝𝐃𝟐 =+0)
((678)+,/+0)) and 𝐊𝐈𝐄 =
+0;<
9=𝐃𝟐3:>
+, 83
where 𝑓@ represents the mole fractions of H and D in the reaction (0.5 for both, when performed 84
in 50% deuterated buffer). 85
86
CpI [FeFe]-hydrogenase electrode preparation 87
Cobaltocene-functionalized branched poly(ethylenimine) (Cc-BPEI) was prepared by 88
dissolving 60 mg of BPEI (average Mn ~60000, 50 wt. % in H2, Sigma product = 181978) 89
alongside 6.3 µmol of Cc-NHS in 200 µL of dimethylsulfoxide, with 19 µmol of N,N,N’,N’-90
tetramethyl-O-(1H-benzotriazol-1-yl)uranium hexafluorophosphate (HBTU) and 11 µmol of 91
N,N-diethyethanamine (triethylamine) and stirring the reaction mixture for 48h at room 92
temperature. After, the 7.5 mL of H2O was added to the reaction mixture and the polymer was 93
concentrated over a 10,000 kDa molecular weight cut-off centrifugal filtration membrane to a 94
volume of ~2 mL. The polymer was dried by lyophilization and strong vacuum, and stored at 95
a concentration of 30 mg mL−1 in milliQ water. 96
CpI/Cc-BPEI electrodes were prepared by mixing 21 µL of Cc-BPEI (stock 97
concentration of 2 mg mL−1) with 6 µL of CpI (stock concentration of 2 mg mL−1) and 3 µL of 98
a fresh 10% v/v solution of poly(ethyleneglycol) diglycidyl ether (Mn = 500, Sigma product = 99
475696) prepared in milliQ water. After mixing, 6 µL of this mixture was applied to a freshly 100
polished GC RRDE electrode (0.196 cm2) or to a carbon paper electrode (geometric area of 101

0.25 cm2) and left to dry for 2 h. Prior to testing, each RRDE electrode was equilibrated by 102
performing cyclic voltammetry in phosphate buffer electrolyte (pH 6.5, 0.5 M) between −0.5 103
to −1.0 V vs. Ag/AgCl(satd.) for 5 cycles with the electrode rotating at 1000 rpm. All 104
electrochemical analyses were conducted within an Ar-filled glovebox. 105
Control electrodes were prepared using deactivated CpI. Since CpI is sensitive to 106
deactivation by O2, control electrodes for Figure S10 were prepared in the same manner as 107
above except the electrodes were prepared outside of the glovebox and left to dry on the bench, 108
before being cycled into the glovebox for analysis. In Figure S5 we also demonstrated that 109
active CpI/Cc-BPEI electrodes can be rapidly deactivated within the Ar-filled glovebox by 110
rotating a prepared RRDE in an oxic phosphate buffer electrolyte for 10 minutes. Subsequent 111
analysis by cyclic voltammetry in an anoxic equivalent phosphate buffer electrolyte revealed a 112
significant decrease in the magnitude of the reductive current confirming CpI deactivation by 113
O2. 114
115
ATR FTIR spectroscopy 116
Equipped with a mercury cadmium telluride (MCT) detector and a triple-reflection ZnSe/Si 117
crystal ATR cell (Smith Detection, USA), the FTIR spectrometer (Tensor27, Bruker, 118
Germany) was placed in an anaerobic chamber (Coy Laboratory Products). Infrared spectra 119
were recorded with 80 kHz scanning velocity at a spectral resolution of 2 cm−1. Under these 120
conditions, the time-resolution of data acquisition is in the range of seconds (i.e., five 121
interferometer scans in forward/backward direction). ATR FTIR measurements were 122
performed at 25°C and on sample films (0.5 mM CpI or 0.5 mM CpI + 2 mg mL−1 Cc-BPEI) 123
derived by controlled dehydration and rehydration as reported earlier.6 A constant gas stream 124
of 1.5 L min-1 was adjusted with digital mass flow controllers (SmartTrak, Sierra, USA) 125
passing through a wash bottle containing 150 mL buffer solution (100 mM Tris/HCl, pH 8). 126

The resulting aerosol was fed to the sample film on the ATR crystal. The oxidized H-cluster 127
state Hox was enriched in the films under a constant stream of N2 aerosol for 30 minutes before 128
10% H2 was added to the N2 stream via a separate flow controller. After 90 s, H2 was removed 129
from the gas stream. 130
131
References 132
(1) Kuchenreuther, J. M.; Grady-Smith, C. S.; Bingham, A. S.; George, S. J.; Cramer, S. 133
P.; Swartz, J. R. High-Yield Expression of Heterologous [FeFe] Hydrogenases in 134
Escherichia Coli. PLoS ONE, 2010, 5 (11), e15491. 135
(2) Ruth, J. C.; Milton, R. D.; Gu, W.; Spormann, A. M. Enhanced Electrosynthetic 136
Hydrogen Evolution by Hydrogenases Embedded in a Redox-Active Hydrogel. 137
Chemistry - A European Journal, 2020, 26 (32), 7323–7329. 138
(3) Bard, A. J.; Faulkner, L. Introduction and Overview to Electrode Processes. In 139
Electrochemical Methods: Fundamentals and Applications; Swain, E., Ed.; John 140
Wiley & Sons: New Jersey, 2001; pp 3–4. 141
(4) Glasoe, P. K.; Long, F. A. Use of Glass Electrodes to Measure Acidities in Deuterium 142
Oxide. Journal of Physical Chemistry. American Chemical Society 1960, pp 188–190. 143
(5) Qiu, Y.; Ren, H.; Edwards, M. A.; Gao, R.; Barman, K.; White, H. S. Electrochemical 144
Generation of Individual Nanobubbles Comprising H2, D2, and HD. Langmuir, 2020, 145
36 (22), 6073–6078. 146
(6) Senger, M.; Mebs, S.; Duan, J.; Wittkamp, F.; Apfel, U. P.; Heberle, J.; Haumann, M.; 147
Stripp, S. T. Stepwise Isotope Editing of [FeFe]-Hydrogenases Exposes Cofactor 148
Dynamics. Proceedings of the National Academy of Sciences of the United States of 149
America, 2016, 113 (30), 8454–8459. 150
151

Supporting Figures
152
Figure S2. Absolute spectra. Overlay of the FTIR spectra of (a) CpI and (b) CpI + Cc-BPEI under N2 (black) and 10% H2 (red). The insets shows the energy regime of the CO/CN ligands of the H-cluster. Blue traces depict H2 – N2 difference spectra (unscaled, compare Figure S3). The hydration level is the same in both samples, but CpI + Cc-BPEI forms a more homogenous film, which causer the slightly higher signal intensity in panel (b).

153
Figure S3. Direct comparison. (a) Overlay of the H2 - N2 difference spectrum of CpI + Cc-BPEI (black/dotted, as discussed in the main script) and pure CpI (red/solid). The spectra are virtually identical and differ only for a slightly stronger decrease of Hox, as depicted in the double difference spectrum (inset, blue). (b) Overlay of the temoral evolution of Hox under N2 and H2 for CpI + Cc-BPEI (black/dotted, as discussed in the main script) and pure CpI (red/solid). Neither reduction (decrease of Hox under H2) nor auto-oxidation (slow increase of Hox under N2) is signifcantly affected.

Figure S4. Cyclic voltammograms shwoing H2 detection on the Pt ring of a RRDE (red lines), in the absence (red dashed line) or presence (red solid line) of electrocatalytic H2 generation at the GC disk electrode. The scan rate at the GC disk electrode was 50 mV s−1 and the RRDE was rotated at 3000 rpm. Electrolyte = anoxic phosphate buffer electrode, 0.5 M, pH 6.5. The black lines report the current of the GC disk electrode when poised at 0 V vs. SHE (black dashed line, minimal H+ reduction) or −1 V vs. SHE (black solid line, electrocatalytic H+ reduction). The inset presents a zoom where the oxidation of electrogenerated H2 at the Pt ring can be observed above potentials of ~ −0.3 V vs. SHE. H+ reduction on the Pt ring is observed with an approximate onset potential of −0.26 V vs. SHE under these conditions.

Figure S5. RRDE Cyclic voltammograms of electroenzymatic H2 production by CpI/Cc-BPEI at a GC disk and coupled H2 detection at a Pt ring electrode (amperometric i-t). The solid lines present the experiments performed with active CpI. After performing this scan, the electrode was rotated in oxic (O2-containing) phosphate buffer electrolyte for 10 minutes (1000 rpm) prior to rinsing and subsequent analysis in the original anoxic phosphate buffer electrode (dashed lines). The decrease in the magnitude of the reductive current at the disk electrode (and the concurent decrease in the current for H2 oxidation at the Pt ring electrode) are consistent with loss of CpI activity upon exposure to O2. GC scan rate = 10 mV s−1. RRDE rotated at 1000 rpm. The Pt ring electrode was poised at 0 V vs. SHE. The experiment was performed inside an Ar-filled glovebox, in phosphate buffer electrolyte (0.5 M, pH 6.5).

Figure S6. (A) RRDE Cyclic voltammogram of ferrocyanide oxidation (GC disk, black line) and subsequent ferricyanide reduction (Pt ring, red line, amperometric i-t, poised at +0.1 V vs. SHE). The scan rate of the GC disk electrode was 50 mV s−1 and the RRDE was rotated at 1000 rpm. (B) Double amperometric i-t traces of ferrocyanide oxidation (GC disk, black trace) and subsequent ferricyanide reduction (Pt ring, red trace), used to determine collection efficiencies of the RRDE. Ferrocyanide oxidation (ferricyanide generation) was performed by applying +0.8 V vs. SHE at the GC disk electrode, whereas ferricyanide detection (reduction) was perfomed by applying +0.1 V vs. SHE at the Pt ring electrode. Electrolyte solution = 0.1 M KCl containing 2 mM ferrocyanide.
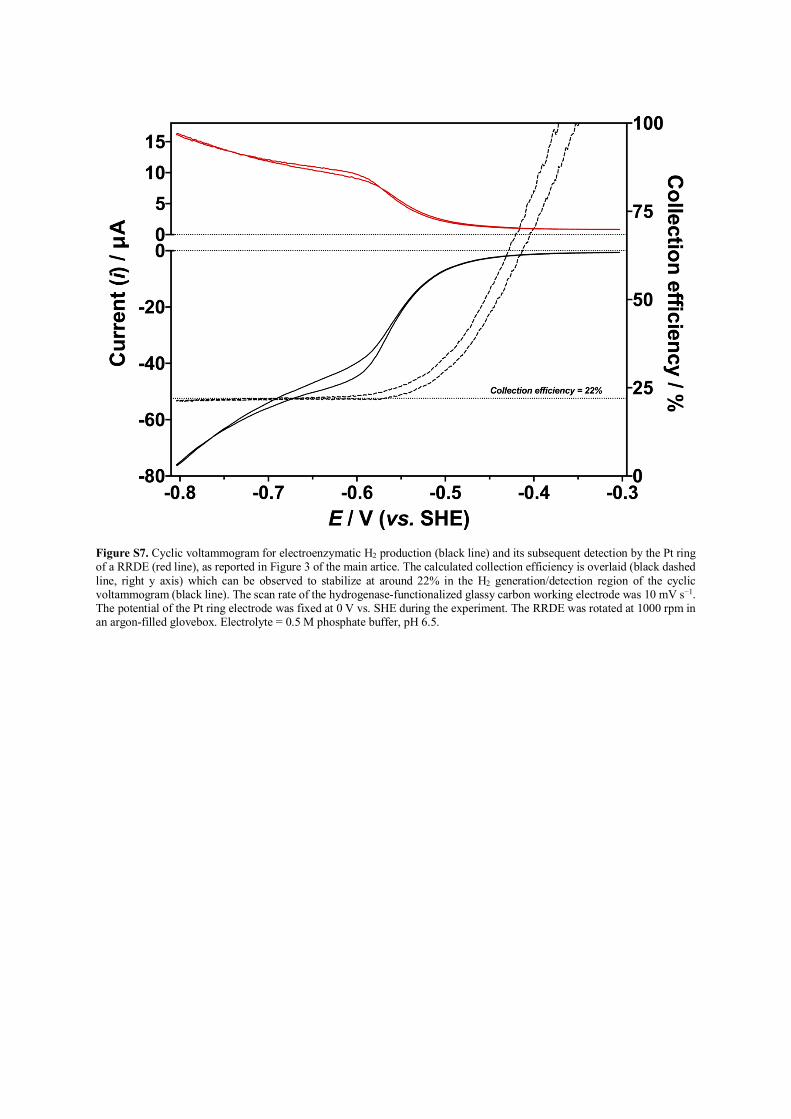
Figure S7. Cyclic voltammogram for electroenzymatic H2 production (black line) and its subsequent detection by the Pt ring of a RRDE (red line), as reported in Figure 3 of the main artice. The calculated collection efficiency is overlaid (black dashed line, right y axis) which can be observed to stabilize at around 22% in the H2 generation/detection region of the cyclic voltammogram (black line). The scan rate of the hydrogenase-functionalized glassy carbon working electrode was 10 mV s−1. The potential of the Pt ring electrode was fixed at 0 V vs. SHE during the experiment. The RRDE was rotated at 1000 rpm in an argon-filled glovebox. Electrolyte = 0.5 M phosphate buffer, pH 6.5.

154
Figure S8. Cyclic voltammogram of electrochemical cleaning of the Pt ring RRDE electrode; the first (black line) and second (red line) cycles are shown, where a large oxidative current can be observed in the first scan at around +0.55 V vs. SHE after performing RRDE experiments for H2 detection at the Pt ring (poised at 0 V vs. SHE). The electrode was rotated at 1000 rpm in phosphate buffer electrolyte (0.5 M, pH 6.5). Scan rate = 250 mV s−1.

Figure S9. Cyclic voltammograms indicating the impact of high phosphate buffer electrolyte concentration on O2 electrocatalytic reduction on a Pt electrode. In 0.1 M phosphate buffer electrolyte (black lines), the purging of a stirred N2-saturated solution (black dashed line) with air results in a reductive catalytic wave at potentials more negative than approximately 0.5 V vs. SHE (black solid line). In contrast, performing the same experiment in 1.5 M phosphate buffer electroyte (red lines) significantly decreases the magnitude of the reductive catalytic current upon introducing air purging to a stirred N2-saturated solution (dashed to solid red lines). Scan rate = 50 mV s−1, electrode = 3 mm Pt disk electrode, pH = 7.

Figure S10. Amperometric i-t trace for electroenzymatic H2 generation by a CpI/Cc-BPEI carbon paper electrode. The electrode was poised at −0.6 V vs. SHE and the solution was agitated by gentle stirring with a magnetic stirrer bar. Performed in phosphate buffer electrolyte (0.5 M, pH 6.5). At 750 s, an equal volume of deuterated phopshat buffer electrolyte was introduced, bringing the H:D ratio to 1:1 (pH/pD = 6.5). Increased stirring at 1050 s did not significantly increase the magnitude of the reductive current, indicating that bulk mass transport is not rate-limiting.

Figure S11. (A) Amperometric i-t trace for electroenzymatic H2 generation by active (solid line) or deactivated (dashed line) CpI/Cc-BPEI carbon paper electrodes, during the mass spectrometry experiment performed in Figure 5 of the main article. The working electrode was poised at −0.6 V vs. SHE. The control electrode with deactivated CpI was prepared outside of the Ar-filled glovebox and cycled inside after drying. (B) Calibrated H2 (black), HD (red) and D2 (blue) quantities produced during bulk electrolysis (Figure 5b of the main article), showing the quantities of H2, HD and D2 produced by the deactivated CpI control electrodes (dashed lines). The theoretical quantities of the sum of the gases is shown as black dotted lines, alongside the experimentally determined sums of the gases from each experiment (purple solid and dashed lines). All experiments were performed in phosphate buffer electrolyte (0.5 M, pH 6.5) and the solution was agitated by stirring.

download fileview on ChemRxiv170121 Supporting information.pdf (1.82 MiB)