folie 1 contrail modeling with eulag overview of past, present and future projects simon...
TRANSCRIPT

Folie 1
Contrail modeling with EULAGOverview of past, present and future projects
Simon UnterstraßerDLR Oberpfaffenhofen

Presentation Simon Unterstrasser
Folie 2
Structure of the talk
Motivation & basic information on contrails
Vortex phase simulations
Dispersion phase simulations

Presentation Simon Unterstrasser
Folie 3
Structure of the talk
Motivation & basic information on contrails
Vortex phase simulations
Dispersion phase simulations

Presentation Simon Unterstrasser
Folie 4
Motivation
Supersaturation is a common feature in the upper troposphere, i.e. relative humidity RH_i > 100%
Natural cirrus formation mostly, if relative humidity above 140% Contrail can form and persist in areas where natural cirrus does
not form
→ Additional cloud coverage by contrails
Coverage and climate impact of line-shaped contrails can be determined with suitable accuracy
Coverage and climate impact contrail-cirrus might be several times higher
Can hardly be discriminated from naturally formed cirrus

Presentation Simon Unterstrasser
Folie 5
Georgia 13 October 2004 NASA

Presentation Simon Unterstrasser
Folie 6
Motivation
Lee et al., 2009
Aviation currently contributes 2 - 8% to total climate change radiative forcing

Presentation Simon Unterstrasser
Folie 7
Motivation – Quantify climate impact
For both pathways, more knowledge on the evolution of a single contrail or contrail cluster is needed
EULAG helps!
Remote sensing with satellites Global climate models
Nils Simon Burkhardt

Presentation Simon Unterstrasser
Folie 8
Motivation – Temporal evolution of a Contrail (1/4)
The contrail evolution can be divided into 3 temporal phases:
Vortex Phase
DispersionPhase
5 - 10s2 - 4
minutes Minutes to hours
JetPhase

Presentation Simon Unterstrasser
Folie 9
Motivation – Temporal evolution of a Contrail:Jet Phase (2/4)
The jet phase covers the first 5 - 10s The hot exhaust mixes with the cold
ambient air. Within 1s ice crystals form A counterrotating vortex pair emerges
from the initial vorticity distribution along the wings
Emissions (incl. the emitted water vapour and the ice crystals) are mostly trapped inside the vortices
Vortex Phase
DispersionPhase
JetPhase

Presentation Simon Unterstrasser
Folie 10
Motivation – Temporal evolution of a Contrail: Vortex Phase (3/4)
Vortex phase (2 - 4min): Main feature is the descent of the vortex pair → crystal loss due to adiabatic warming
Vortex decay by Crow instability
DispersionPhase
JetPhase
Vortex Phase

Presentation Simon Unterstrasser
Folie 11
Motivation – Temporal evolution of a Contrail: Vortex Phase (3/4)
DispersionPhase
JetPhase
Vortex Phase

Presentation Simon Unterstrasser
Folie 12
Motivation – Temporal evolution of a Contrail: Dispersion Phase (4/4)
Dispersion phase (minutes to hours): spreading of contrails by turbulent mixing and vertical wind shear
Atmospheric conditions Sedimentation and radiation
become important
JetPhase
Vortex Phase
DispersionPhase

Presentation Simon Unterstrasser
Folie 13
Structure of the talk
Motivation & basic information on contrails
Vortex phase simulations
Dispersion phase simulations

Presentation Simon Unterstrasser
Folie 14
LCM Microphysics
Lagrangian ice crystal tracking
Microphysical processes are solved for all ice crystals individually
Better analysis methods (history of ice crystals)
Better physical treatment of sublimation process
Sölch, 2009
Simulations of the vortex phase – Numerical setup (1/2)
EULAG Solves the momentum and
continuity equation MPDATA advection algorithm TKE-closure Smolarkiewicz & Margolin,
1997
Bulk Microphysics Solves equation for
ice mass concentration and crystal number concentration
Bulk approach assuming lognormal size distribution in each gridbox
Spichtinger&Gierens,2009
CC-Tool Assures a realistic vortex
decay in a 2D-model, Unterstrasser et al.,2008

Presentation Simon Unterstrasser
Folie 15
Resolution: dx = dz = 1m , dt = 0.02s
Domain: Lx = 256m, Lz = 500m, T = 160s
Nr. of processor: 32 or 64
Wall clock time: 30 min to 2h
Simulations of the vortex phase – Numerical setup (2/2)

Presentation Simon Unterstrasser
Folie 16
Simulations of the vortex phase – Major features
Three major features of the contrail evolution during the vortex phase
Vertical expansion
Spatial heterogeneity in ice distribution
Ice crystal loss
Presentation Simon Unterstrasser
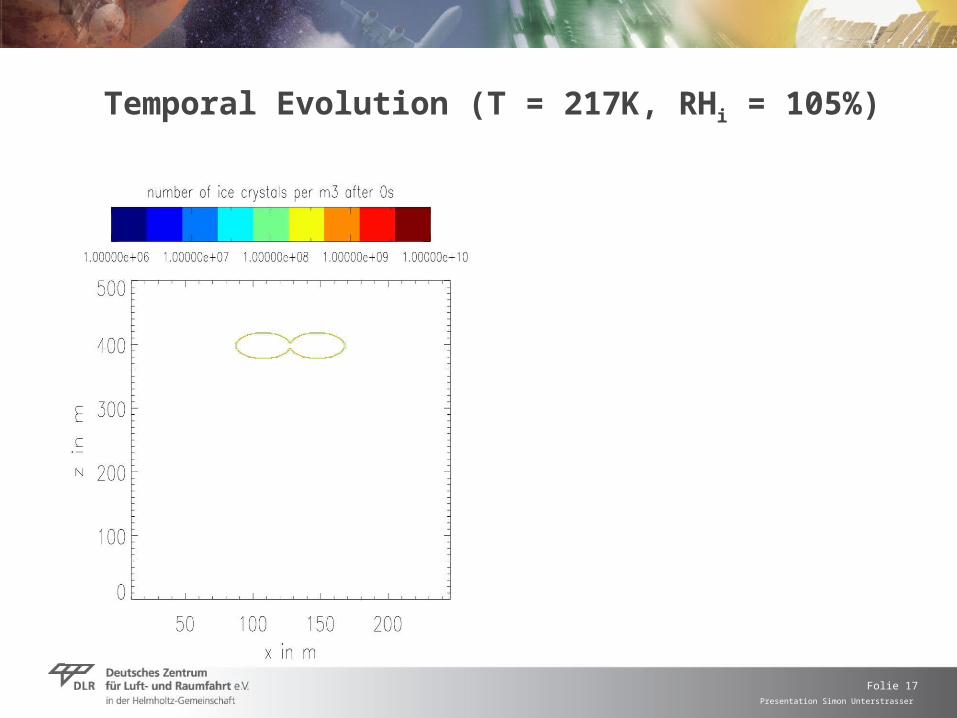
Folie 17
Temporal Evolution (T = 217K, RHi = 105%)

Presentation Simon Unterstrasser
Folie 18
Temporal Evolution (T = 217K, RHi = 105%)

Presentation Simon Unterstrasser
Folie 19
Temporal Evolution (T = 217K, RHi = 105%)

Presentation Simon Unterstrasser
Folie 20
Temporal Evolution (T = 217K, RHi = 105%)

Presentation Simon Unterstrasser
Folie 21
Temporal Evolution (T = 217K, RHi = 105%)

Presentation Simon Unterstrasser
Folie 22
Temporal Evolution (T = 217K, RHi = 105%)

Presentation Simon Unterstrasser
Folie 23
Temporal Evolution (T = 217K, RHi = 105%)

Presentation Simon Unterstrasser
Folie 25
2D-code with adjusted vortex decay
Simulations of the vortex phase – 2D approach
Emphasis on microphysics Extensive parameter studies were carried out

Presentation Simon Unterstrasser
Folie 26
Simulations of the vortex phase – Microphysical evolution, especially crystal loss (1/2)Fraction of surviving ice crystals fn depending on relative humidity Rhi
Unterstrasser & Sölch, in review, ACP 2010
Rhi in %
fn
Primary Wake
fn
Rhi in %
Secondary Wake
fn fn

Presentation Simon Unterstrasser
Folie 28
Simulations of the vortex phase – Microphysical evolution, especially crystal loss (2/2)
Number of surviving ice
crystals fn
Relative humidity RHi
Temperature TAircraft type: Γ0, b0,
water vapor emission, EIsoot
Stability NBV
Eddy dissipation rate ε
Initial ice crystal size distribution
Engine/wing
configuration

Presentation Simon Unterstrasser
Folie 29
Simulations of the vortex phase – Setup of 3D simulations (1/2)
Collaboration with I. Sölch, I. Hennemann, T. Misaka
Include initial turbulent fluctuations and analytical vortex definition Microphysical approach: Lagrangian treatment of individual ice
crystals. Each ice crystal stores its microphysical properties and subgrid-position.Much more precise than bulk microphysical models.Critical issues: memory-consuming, load-imbalancing, large amount of data
Use 256 x 400 x 500 (spanwise, flight direction, vertical) = 52e6 grid points
Ongoing

Presentation Simon Unterstrasser
Folie 30
Simulations of the vortex phase – Setup of 3D simulations (2/2)
Resolution: dx = dy = dz = 1m , dt = 0.02s
Domain: Lx = 256m Ly = 400m Lz = 500m T = 200s - 300s
Nr. of processor: 320
Wall clock time: 35 hours One typical simulation runs >10e4 CPUh
1.5Gb oder 3Gb memory per core, 96Gb memory/node
Serial post-processing simulation, memory consumption reduced by declaring less arrays
Ongoing
Collaboration with I. Sölch, I. Hennemann, T. Misaka

Presentation Simon Unterstrasser
Folie 31
First results
Evaluation of vortex cores with a newly developed tracking algorithm(I. Hennemann, PhD 2009)
A319 in a calm, neutral atmosphere Ongoing

Presentation Simon Unterstrasser
Folie 32
Simulations of the vortex phase – Analysis of 3D simulations
Now better representation of dynamics than in 2D model
Plan: compare wake vortex evolution with two other numerical models (LESTUF and MGLET)
Investigate descent speed, core radius, circulation, time of vortex linking, final vertical displacement
Entrainment of moist air into the vortex system, detrainment of ice crystals out of it
Advantage: EULAG only code coupled with microphysics to study contrails.
Ongoing
Collaboration with I. Sölch, I. Hennemann, T. Misaka

Presentation Simon Unterstrasser
Folie 33
Structure of the talk
Motivation & basic information on contrails
Vortex phase simulations
Dispersion phase simulations

Presentation Simon Unterstrasser
Folie 34
Simulations of the dispersion phase – Numerical setup (1/2)
EULAG Solves the momentum and
continuity equation MPDATA advection algorithm TKE-closure Smolarkiewicz & Margolin,
1997
Bulk Microphysics Solves equation for
ice mass concentration and crystal number concentration
Bulk approach assuming lognormal size distribution in each gridbox
Spichtinger&Gierens,20091D radiation routine
• Solar and thermal spectrum• Atmosperic constituents and
water/ice clouds• Fu & Liou, 1996, …

Presentation Simon Unterstrasser
Folie 35
One simulation run is divided in two subsequent sub-simulations with different resolutions and domains
Resolution: dx1 = dz1 = 5m, dt1 = 1 - 2s, later dx2 = 10 - 20m, dz2 = 10m, dt2 = 5 - 10s
Domain: Lx2 = 30km, Lz2 = 2km, Ttotal = 2 - 6h
Nr. of processor: 32 or 64
Wall clock time: 30 min to 2h
Simulations of the dispersion phase – Numerical setup (2/2)

Presentation Simon Unterstrasser
Folie 36
Simulations of the dispersion phase – Example (T = 217K, Rhi = 130%, s = 0.006s-1)

Presentation Simon Unterstrasser
Folie 37
Simulations of the dispersion phase – Example (T = 217K, Rhi = 130%, s = 0.006s-1)

Presentation Simon Unterstrasser
Folie 38
Simulations of the dispersion phase – Example (T = 217K, Rhi = 130%, s = 0.006s-1)

Presentation Simon Unterstrasser
Folie 39
Simulations of the dispersion phase – Example (T = 217K, Rhi = 130%, s = 0.006s-1)

Presentation Simon Unterstrasser
Folie 40
Simulations of the dispersion phase – Example (T = 217K, Rhi = 130%, s = 0.006s-1)

Presentation Simon Unterstrasser
Folie 41
Simulations of the dispersion phase – Example (T = 217K, Rhi = 130%, s = 0.006s-1)

Presentation Simon Unterstrasser
Folie 42
Simulations of the dispersion phase – Example (T = 217K, Rhi = 130%, s = 0.006s-1)

Presentation Simon Unterstrasser
Folie 43
Simulations of the dispersion phase – Example (T = 217K, Rhi = 130%, s = 0.006s-1)

Presentation Simon Unterstrasser
Folie 44
Simulations of the dispersion phase – Example (T = 217K, Rhi = 130%, s = 0.006s-1)

Presentation Simon Unterstrasser
Folie 45
Simulations of the dispersion phase – Example (T = 217K, Rhi = 130%, s = 0.006s-1)

Presentation Simon Unterstrasser
Folie 46
Simulations of the dispersion phase – Example (T = 217K, Rhi = 130%, s = 0.006s-1)

Presentation Simon Unterstrasser
Folie 47
Simulations of the dispersion phase – Example (T = 217K, Rhi = 130%, s = 0.006s-1)

Presentation Simon Unterstrasser
Folie 48
Investigate the impact of ambient parameters like relative humidity, temperature, vertical wind shear and stability on the contrail-to-cirrus transition
So far: Individual contrails mainly in steady atmosphere Some cases with steady synoptic uplift (not explicitly resolved)
External forcing on temperature equation
Simulations of the dispersion phase
dee wdt
dT
dt
Td 0
~
Impact of radiation on contrail evolution Study microphysical and initialisation uncertainties

Presentation Simon Unterstrasser
Folie 49
Status: So far idealized studies, now efforts towards more realism. Within a 3-year project (funded by the German Science
foundation) the existing contrail-to-cirrus model setup will be improved in several aspects.
Simulations of the dispersion phase – Plans for the near future

Presentation Simon Unterstrasser
Folie 50
Simulations of the dispersion phase – Plans for the near future
Goals: Interaction of several (or many) contrails and formation of
contrail clusters, study saturation effects in areas of heavy air traffic
Consideration of synoptic evolution Coupling with real data (NWP output or analysis data) Competition of contrails and naturally forming cirrus Follow the whole life cycle of contrail clusters over days on
regional scale (Lx~O(100km))

Presentation Simon Unterstrasser
Folie 51
Modifications (1/2): Switch to 3 dimensions Flexible initialization of contrails in time and space
- depends on ambient conditions and aircraft type - allow for possible use of real aircraft flight data
Inclusion of synoptic evolution - idealized via cooling rate - Better: coupling with real data advection of LES-domain with mean wind? Relaxation of which variables? wind only, moisture field
Simulations of the dispersion phase – Plans for the near future

Presentation Simon Unterstrasser
Folie 52
Modifications (2/2): Increase horizontal scales (100km x 100km) and vertical scale
(~5km) → massively parallel - 3D domain decomposition desirable - is it possible at all to have 2000 x 2000 x 200 grid points? - adapt microphysics and online-analysis tools for massively parallel application
Simulations of the dispersion phase – Plans for the near future

Presentation Simon Unterstrasser
Folie 53
Acknowledgement
Piotr and the EULAG developers P. Spichtinger for the bulk microphysics code, I. Sölch for the
LCM code Andreas Dörnbrack for introduction to and assistance with
EULAG DKRZ and ECMWF for computer resources
Questions?
Comments?
Ideas?
Recommendations?

Presentation Simon Unterstrasser
Folie 54
References Contrail studies using EULAG
Unterstrasser, S. und I. Sölch: Study of contrail microphysics in the vortex phase with a Lagrangian particle tracking model, Atmospheric Chemistry and Physics, in review
Unterstrasser, S. und K. Gierens: Numerical simulations of contrail-to-cirrus transition - Part 1: An extensive parametric study, Atmospheric Chemistry and Physics, 10, 2017-2036, 2010
Unterstrasser, S. und K. Gierens: Numerical simulations of contrail-to-cirrus transition - Part 2: Impact of initial ice crystal number, radiation, stratification, secondary nucleation and layer depth, Atmospheric Chemistry and Physics, 10, 2037-2051, 2010
Kärcher, B., U. Burkhardt, S. Unterstrasser und P. Minnis: Factors controlling contrail cirrus optical depth, Atmospheric Chemistry and Physics, 9, 6229-6254, 2009
Unterstrasser, S., K. Gierens und P. Spichtinger: The evolution of contrail microphysics in thevortex phase, Meteorologische Zeitschrift, 17, 145-156, 2008