fol 26. no. 1,3-27 thirty categorization results in search ... · 1968,1970; rosch, 1973,1975;...
TRANSCRIPT

Journal of Experimental Psychology:Learning, Memory, and Cognition2000, \fol 26. No. 1,3-27
Copyright 2000 by the American Psychological Association, Die.0278-7393/D0/$5.00 DOI: 10.1037//0278-7393.26.1.3
Thirty Categorization Results in Search of a Model
J. David Smith and John Paul MindaState University of New York at Buffalo
One category structure dominated in the shift toward exemplar-based theories of categoriza-tion. Given the theoretical burden on this category structure, the authors reanalyzed 30 of itsuses over 20 years in 8 articles. The authors suggest 4 conclusions, (a) This category structuremay encourage exemplar-memorization processes because of its poor structure, the learningdifficulties it causes, and its small, memorizable exemplar sets. Its results may only generalizenarrowly, (b) Exemplar models have an advantage in fitting these 30 data sets only becausethey reproduce a performance advantage for training items. Other models tit equally well ifgranted this capacity, (c) A simpler exemplar process than assumed by exemplar modelssuffices to explain these data sets, (d) An important qualitative result predicted by exemplartheory is not found overall and possibly should not even be expected. The authors concludethat the data produced by this category structure do not clearly support exemplar theory.
Categorizing objects into psychological equivalenceclasses is a basic cognitive task. Historically, some descrip-tions of categorization were prototype-based—humans weresupposed to average their exemplar experience into acategory prototype, compare new items to it, and accept thenew items as category members if similar enough (Homa,1984; Homa, Rhoads, & Chambliss, 1979; Homa, Sterling,& Trepel, 1981; Mervis & Rosch, 1981; Posner & Keele,1968,1970; Rosch, 1973,1975; Rosch & Mervis, 1975).
However, 20 years ago some evidence began to suggestthat prototype theory might not account completely forhumans' categorization processes. In influential articles,Medin and his colleagues argued that prototypes are aninsufficient organizing principle for categories, that proto-type models sometimes offer poor descriptions of humans'categorization performance, and that humans learn catego-ries that would be unlearnable if categorization depended onprototypes (Medin, Dewey, & Murphy, 1983; Medin &Schaffer, 1978; Medin & Schwanenflugel, 1981; Medin &Smith, 1981).
Thus, Medin and his coworkers proposed instead thatexemplar-based processes underlie categorization and thatexemplar-based models of categorization describe categori-zation performance better. These models assume that storedmemories of the specific exemplars encountered in trainingform the representational core of a category. These modelsassume that these stored memories become the comparative-reference standard for categories, so that new tokens areplaced into the category with the most similar storedexemplars. By making these assumptions, Medin's exemplar
J. David Smith, Department of Psychology and Center forCognitive Science, State University of New York at Buffalo; JohnPaul Minda, Department of Psychology, State University of NewYork at Buffalo.
Correspondence concerning this article should be addressed to J.David Smith, Department of Psychology, Park Hall, State Univer-sity of New York, Buffalo, New York 14260. Electronic mail maybe sent to [email protected].
model—the context model—granted participants exemplar-based strategies that were powerful enough to master poorlystructured categories and to learn exceptional items withincategories. Nosofsky generalized the context model in aseries of articles, and it has had a profound influence oncategorization theory and research (Lamberts, 1994, 1995;Medin, 1975; Medin et al., 1983; Medin & Schaffer, 1978;Medin & Smith, 1981; Medin, Altom, & Murphy, 1984;Nosofsky, 1984,1987; Palmeri & Nosofsky, 1995; Smith &Minda, 1998; Smith, Murray, & Minda, 1997).
One category structure dominated the science that moti-vated the shift toward exemplar-based descriptions of catego-rization. Table 1 shows this category structure. It containsfive A exemplars and four B exemplars that are used intraining. For this reason, we refer to it as the 5-4 categorystructure. Seven additional items are reserved for measuringtransfer performance. The logical structure shown in Table 1has been instantiated by using geometric designs, Brunswickfaces, yearbook photographs, and line-drawn rocketships.This stimulus set was featured in the article that introducedthe context model to human psychology (Medin & Schaffer,1978) following Medin's (1975) important comparativemonograph. It dominated the early papers and findings thatfavored exemplar-based categorization (Medin et al., 1984;Medin et al., 1983; Medin & Smith, 1981). It was crucial inNosofsky's (1992) critique of prototype models and in hisfurther explorations of the context model (Nosofsky,Kruschke, & McKinley, 1992; Nosofsky, Palmeri, & McKin-ley, 1994; Palmeri & Nosofsky, 1995).
Given the critical role this category structure has played inasserting exemplar theory in the categorization literature, itis important to interpret carefully the results it yields and tobe certain that the assumptions of exemplar theory arewarranted and necessary regarding it. In that way, one mayestablish whether the 5-4 category structure bears well theburden of supporting exemplar theory, or whether thatburden should be placed on other category structures andcategory tasks that have seemed to show exemplar theory'sworth.

SMITH AND MINDA
Table 1the 5-4 Category Structure
Type andstimulus
Category AAlA2A3A4A5
Categoiy BB6B7B8B9
Transfer (T)T10Ti lT12T13T14T15T16
Dl
11110
1000
1110000
Dimension (D)
D2
10011
1100
0010101
D3
11101
0100
0011010
D4
00111
0010
1010110
Accordingly, the present article revisits the large body ofdata on the 5-4 category structure, including 30 data setsreported in eight articles (Lamberts, 1995; Medin et al.,1984; Medin et al., 1983; Medin & Schaffer, 1978; Medin &Smith, 1981; Nosofsky et al., 1992; Nosofsky et al., 1994;Palmeri & Nosofsky, 1995). These 30 data sets representessentially all the results using this category structure,making this a comprehensive survey and a deliberatelynonselective one. Using this comprehensive set of resultswith the most influential category structure in the literature,we ask whether these data encourage the general assumptionthat humans categorize by using systematic exemplar-to-exemplar comparisons based in specific exemplar traces thatform the representational cores of categories.
To do so, we explore the fits of many models that havebeen used in the literature, and consider the reasons thatsome fail to fit the 5-4 data whereas others succeed. Weexplore the convergences among the successful models tosee if they have implications for interpreting performance inthe 5-4 category task. We consider the present status of theprimary result within the 5-4 data that has suggested thatexemplar theory's assumptions are qualitatively correct—not just quantitatively better. Finally, we consider the placeof the 5-4 category task and related tasks in the larger spaceof category structures and categorization phenomena.
Method
Category Structure, Stimuli, and Data Sets
Category structure. Table 1 shows the category structure usedto collect the 30 5-4 data sets. The stimuli are derived from thecategory prototypes 1 1 1 1 and 0 0 0 0. Category A has fourexemplars that share three features with the Category A prototypeand one exemplar that shares two features. Thus, Category Anas noexceptional exemplars (sharing more features in common with theopposing prototype) but has one ambiguous exemplar (sharing
features equally with both prototypes). Category A exemplars sharean average of 2.8 features out of 4 with their prototype; they sharean average of 2.4 features with each other (including their perfectself-identities). The features in Category A are .70 predictive ofcategory membership on average. This means that a rule based onany one feature would work only about 70% of the time.
The Category B exemplars share 2, 2, 3, and 4 features,respectively, with their prototype. Thus Category B also has noexceptional exemplars, but half its exemplars are ambiguous.Category B exemplars also share an average of 2.8 features out of 4with their prototype and 2.4 features with each other (includingtheir perfect self-identities). The features in Category B are .69predictive of category membership on average.
Across categories, the four features are .77, .55, .77, and .66predictive of category membership. No feature is perfectly diagnos-tic, but all four carry at least minimal information. The seconddimension does carry minimal information, for it can only catego-rize correctly five of the nine training exemplars. An adaptiveparticipant might learn to ignore this confusing stimulus dimen-sion and allocate more attention to Dimension 4 (with .66predictiveness) and especially to Dimensions 1 and 3 (with .77productiveness).
To derive an overall index of within-category coherence andbetween-catcgory differentiation, one can divide within-categorysimilarity by between-category similarity to find the structural ratio(Homa et al., 1979, pp. 13-14; Smith et al., 1997). Given that theexemplars share 2.4 features with each other within category(including their self-identities) and 1.6 features across categories,one can calculate that the structural ratio for this category structureis quite low—1.5. A structural ratio of 1.0 would imply nodifferentiation—that is, a complete overlap of the categories inmultidimensional perceptual space. Structural ratios as high as 3.0are easy to arrange.
This low index of category differentiation correctly reflects thatthe individual features are only 70% diagnostic, that exemplars arenearly as similar across categories (sharing 1.6 features) as withincategories (sharing 1.9 features if one excludes self-identities), andthat three of the nine items are ambiguous because they sharefeatures equally with both prototypes. Thus the two categorieswithin themselves are poor assemblages with a weak familyresemblance, and they are poorly differentiated from each other.There were constructive methodological reasons for creatingcategories like these. Still, the fact of poor differentiation mayconstrain the interpretation of the results they produce, We discussthis problem and the psychological impact of poor categorystructure below.
However, the 5-4 categories shown in Table 1 do have thecharacteristic of being linearly separable (LS). LS categories arethose that can be partitioned by a linear discriminant function, andfor which one can simply sum the evidence offered separately byeach feature of an item and use that sum to decide correctlycategory membership. For LS categories, there is a way to allocatelimited attention across the four dimensions that lets one categorizeaccurately all the training exemplars. For example, if one allocated40%, 0%, 40%, and 20% of one's attention to Dimensions 1, 2, 3,and 4, respectively, the evidence favoring a Category A responsewould be, for training items Al to B9 as shown in Table 1, 0.80,0.80,1.00,0.60,0.60T 0.40,0.40,0.20, and 0.00. That this evidencebase is greater than 0.50 for the five Category A exemplars and lessthan 0.50 for the four Category B exemplars, signifies that thisattentional allocation would correctly categorize all the stimuli.The fact of linear separability bears on what follows because itmeans that a prototype-based strategy applied appropriately couldcategorize correctly all the training exemplars. That is, thiscategory structure does not force participants to desert a prototype-

THIRTY CATEGORIZATION RESULTS
based approach and adopt an exemplar-based approach instead. Itleaves both strategies viable.
Stimuli. The 5-4 category structure has been instantiated in avariety of specific stimulus domains—geometric forms (Medin etal., 1984; Medin & Schaffer, 1978; Nosofsky et al., 1992);Brunswick faces (Lamberts, 1995; Medin & Schaffer, 1978; Medin& Smith, 1981); yearbook photos (Medin et al., 1983); andline-drawn rocketships (Nosofsky et al., 1994; Palmeri & Nosof-sky, 1995).
Data sets. Appendix A describes various aspects of the 30 datasets (source, experimental or training condition, stimulus materials,and so forth). Appendix 8 provides a resource for modelers in thisarea by summarizing the 30 performance profiles. All 30 profilesare reported as Category A response probabilities in the stimulusorder of Table 1 (Al to T16). Authors in the original sourcesadopted a variety of reporting techniques and stimulus orders.
Formal Modeling Procedures
The context model In evaluating the exemplar model, wefocused on the context model originated by Medin (1975; see alsoMedin et al., 1983; Medin & Schaffer, 1978; Medin & Smith, 1981)and generalized by Nosofsky (1984, 1987). In the context model,the to-be-classified item in the 5-4 category structure is comparedto the five A exemplars (including itself if it is an A) and to the fourB exemplars (including itself if it is a B), yielding the overallsimilarity of the item to Category A exemplars and Category Bexemplars. Dividing overall A similarity by the sum of overall Aand B similarity essentially yields the probability of a Category Aresponse.
We calculated the similarity between the to-be-categorized itemand any exemplar in three steps as follows. First, we compared thevalues (1 or 0) of the item and the exemplar along all fourdimensions. Matching features made a contribution of 0.0 to theoverall psychological distance between the stimuli; mismatchingfeatures contributed to overall psychological distance in accor-dance with the attentional weight their dimension carried. In thepresent model, each dimensional weight ranged from 0.0 to 1.0,and the four weights were constrained to sum to 1.0.
Second, this raw psychological distance between item andexemplar was scaled using a sensitivity parameter that could varyfrom 0.0 to 20.0. Larger sensitivity values magnify psychologicalspace, increasing the differentiation among stimuli, increasingoverall performance, and increasing the value the context modelplaces on exact identity between the item and an exemplar.Formally, then, the scaled psychological distance between theto-be-classified item i and exemplary is given by
(1)
where xik and xik are the values of the item and exemplar ondimension k, wk is the attentional weight granted dimension k, and cis the sensitivity parameter.
Third, we calculated the similarity t^ between the item andexemplar by taking i ^ = e~\ with dy the scaled psychologicaldistance between the stimuli.
We repeated these three steps to calculate the psychologicalsimilarity between a to-be-categorized item and each A and Bexemplar. Then, summing across the Category A and Category Bexemplars, we calculated the total similarity of the item toCategory A and to Category B members. These quantities can beused to produce directly the probability of a Category A response
(RA) for stimulus i ($) by taking
j*CA
2 1# + 2 Vq(2)
This equation means that one sums up the similarity the to-be-categorized item has to each member of the A category and dividesthis by the similarity the to-be-categorized item has to all themembers of both the A and B categories. Repeating this process foreach of the 16 items, one would derive the performance profilepredicted by the model. However, for reasons we describe later, weadded an additional guessing-rate parameter to the context modelas follows. We assumed that some proportion of the time partici-pants simply guessed A or B haphazardly and that otherwiseparticipants used exemplar-based categorization in the way justdescribed. Others have proceeded similarly in granting the contextmodel a guessing parameter (Lamberts, 1994, 1995; Smith &Minda, 1998). With that parameter added, the context model hadsix parameters (five free parameters)—four dimensional weightsconstrained to sum to 1.0, a sensitivity parameter, and a guessingparameter
To find the best-fitting parameter settings of the context model,we seeded the space with a single parameter configuration andcalculated predicted categorization probabilities for the 16 stimuliaccording to that configuration. The measure of fit was the sum ofthe squared deviations between the 16 predicted probabilities andthe 16 observed categorization probabilities of some study'sperformance profile. We minimized this measure during an analysisby using a fine-grained hill-climbing algorithm that constantlyaltered slightly the provisional best-fitting parameter settings andchose the new settings if they produced a better fit (i.e., a smallersum of squared deviations between predicted and observed perfor-mance). To ensure that local minima were not a serious problem inthe present parameter spaces, we repeated this procedure byseeding the space with four more quite different configurations ofthe exemplar model and hiU-climbing from there. The varianceamong the five fits tended to be very small, indicating that theminima we found were close to global ones.
The additive prototype model. We followed the influentialresearch of Medin and his colleagues (Medin & Schaffer, 1978;Medin & Smith, 1981) by evaluating the simple additive prototypemodel that has been so prominent. That is, we supposed that eachto-be-categorized item would be compared to the category proto-type along the four stimulus dimensions and that matching featureswould simply add to prototype similarity in the amount of theirdimension's weight. In the simplest case, the item's prototypesimilarity could be taken to be the probability of a correctcategorization and its complement, the probability of an error.However, we added an additional guessing parameter to theprototype model as we did for the context model and for everymodel considered in this article. Thus we assumed that someportion of the time participants simply guessed A or B haphazardlyand used additive prototype-based similarity otherwise (see alsoMedin & Smith, 1981). The guessing parameter is especiallyimportant for modeling participants' sometimes poor performancegiven the poorly differentiated 5-4 category structure. Without it,for example, the category prototypes (Stimuli B9 and T12), whichof course have perfect prototype similarity, would be predicted tobe categorized perfectly. With the guessing parameter added, theadditive prototype model had five parameters (four tree param-eters)—one guessing parameter and four dimensional weightsconstrained to sum to 1.0. For the additive prototype model, and for

SMITH AND MINDA
all the models described below, we hill-climbed, found best-fittingconfigurations, and avoided local minima by using the proceduresalready described for the context model.
The multiplicative prototype model. The additive prototypemodel is at an inherent fitting disadvantage because its additivesimilarity calculations are so simple. It lacks any capacity to allowpsychological similarity to decrease exponentially (not linearly)with increasing distance between stimuli. It lacks any sensitivityparameter that might be appropriate for capturing knowledge gainsand performance improvements during learning. This is particu-larly important when considering the 30 5-4 data sets becauseresearchers have often only considered mature, task-final perfor-mance. Consequently, the prototype model's failures might notalways be due to participants* reliance on exemplar-based pro-cesses instead of prototype-based processes. They might some-times be due to the less delicate and sensitive nature of theprototype model's calculations.
Accordingly, Nosofsky (1987, 1992) described a prototypemodel that incorporated exponentially decreasing similarity func-tions and a sensitivity parameter. In this prototype model, increasedsensitivity exaggerates the closeness of category members to theirown prototype relative to the opposing prototype, strengthens theevidence base supporting a correct categorization, and increases theestimated percentage correct.
In the multiplicative prototype model, the to-be-classified itemin the present tasks would be compared only to the A and Bprototypes to yield the overall similarity of the item to Category Aand Category B. We calculated the similarity between the to-be-categorized item and a prototype in three steps as described for thecontext model. First, we determined the psychological distancebetween the item and prototype by summing the weights of themismatching features between the two. We then scaled this rawpsychological distance between item and prototype by using asensitivity parameter that could vary from 0.0 to 20.0. Formally,then, the scaled psychological distance between the to-be-classifieditem i and the prototype was given by
(3)
Here, xfl and Pk are the values of the to-be-classified item and theprototype on dimension k, wk is the attentional weight granteddimension k, and c is the freely estimated sensitivity parameter.Third, we calculated the similarity r\iP between the item andprototype by taking f\iP — *r*p, with d#> representing the scaledpsychological distance between the stimuli.
Dividing Category A similarity by the sum of Category A andCategory B similarity, one could essentially derive the multiplica-tive prototype model's predicted probability of a Category Aresponse for stimulus i by taking
• H I P .
(4)
except that once again we added a guessing parameter to the model.Thus the multiplicative prototype model had six parameters—aguessing parameter, a sensitivity parameter, and four dimensionalweights constrained to sum to 1.0.
The gamma model. Research has recently suggested that exemplarprocessing, as originally conceived by exemplar theorists andinstantiated in 20 years of exemplar models, may be insufficient toexplain what individual participants are doing (Ashby & Gott,1988; Maddox & Ashby, 1993; Smith & Minda, 1998). Therefore,researchers have occasionally modified the standard context model
profoundly by adding on the gamma parameter (Maddox & Ashby,1993; McKinley & Nosofsky, 1995). Gamma intervenes by allowingthe quantities in me choice rule to be raised to whatever power bestrecovers participants1 actual performance profiles. That is, whereas thechoice rule that long served category models was
2*Hy
2 "H*+ 2(5)
the augmented version is
*4(6)
In this article we address the gamma model only briefly. Weshow that it represents no fitting advantage over the standardcontext model in fitting the 30 5-4 performance profiles matrepresent the aggregate performance profiles for whole groups.Probably the reason the gamma model offers no fit advantage is thataggregating performance systematically washes out the categoriza-tion idiosyncrasies of the individual participants and createshomogeneous performance profiles that the standard context model(without gamma) fits comfortably (Maddox & Ashby, 1993; Smith& Minda, 1998; Smith etal., 1997). The gamma parameter appearsto be necessary if one wishes to model individual performanceprofiles instead, and this is why gamma was invented. In fact, onepossible reason the context model seemed so apt early on is that itwas often used to model the aggregate performances that suited itbest (Smith & Minda, 1998). Smith and Minda discussed othertheoretical concerns about gamma.
With the guessing parameter added, the gamma model had sevenparameters—a guessing parameter, a gamma parameter, a sensitiv-ity parameter, and four dimensional weights constrained to sum to1.0.
The multiplicative prototype model (twin sensitivities). Oneinstructive approach to allowing a prototype model to cope with the5-4 data sets is to grant the possibility that participants process old,training items more easily or more fluently than they do new,transfer items. Intuitively, this might mean that practice lets theprototype-comparison processes run more smoothly, or the proto-type-based algorithm be applied more skillfully, for old items thanfor new ones. It might mean that practice creates strongerconnections between old items and their prototypes, whereas newitems are less strongly connected to their prototype. This globalold-new processing difference can be incorporated into a prototypemodel by assuming that participants respond to old items with ahigher level of sensitivity and to new items with a lower level ofsensitivity. Formally, one accomplishes mis by simply granting themodel two parameters, co and cn, that apply to old items and newitems in the distance equation of the prototype model as follows:
Old items: diP =
New items: 2 **kt - **i
(7)
(8)

THIRTY CATEGORIZATION RESULTS
In all other respects, this model is identical to the multiplicativeprototype model (i.e., it has the identical distance-to-similaritytransformation and choice rule).
With the guessing parameter added, this model had sevenparameters—a guessing parameter, two sensitivity parameters andfour dimensional weights constrained to sum to 1.0.
Prototypes combined with exemplar memorization: A mixturemodel. Another instructive approach to allowing a prototypemodel to cope with the 5-4 data is to grant the possibility thatparticipants partially memorize the old, training exemplars after allthe practice with them. This possibility can be explored by using amodel that mixes prototype-based processing and exemplar memo-rization. The mixture model evaluated here received some earlyattention (Medin et al., 1983; Medin & Smith, 1981). It assumesthat participants base their classification decisions either on thesimple, additive similarity of a given stimulus to the prototype (inwhich case they will strictly obey typicality gradients), on randomguesses (in which case they will place stimuli into Categories A orB haphazardly), or on the recognition of memorized specificexemplars (in which case they will definitely categorize the itemcorrectly). The key aspect of fitting data using the mixture model isto estimate the balance among these three processes that bestaccounts for any performance profile.
Note mat the mixture model's exemplar process is simplememorization—that is, individual training exemplars are stored,self-retrieved, and self-boosted toward correct categorization. In asense, each old item is compared only to itself in the exemplarprocess that aids a correct categorization decision. This process isquite different from the context model's exemplar process. Thecontext model assumes that a to-be-categorized item is comparedto all the training items of both categories on the way to acategorization decision. In fact, the context model's systematicexemplar-to-exemplar comparison processes have seemed implau-sible to some (for a discussion, see Palmeri & Nosofsky, 1995, p.548), making it useful to see whether other kinds of exemplarprocesses suffice, too.
The mixture model evaluated in the present article contained fivefree parameters—a guessing parameter, an exemplar-memorizationparameter, and a prototype-processing parameter constrained tosum to 1.0, and four dimensional weights also constrained to sumto 1.0.
Results
Model 1: The Trouble With Prototypes
Figure 1A shows the crucial phenomenon—the failure ofa simple prototype model to capture performance on the 5-4category structure. To create this figure, we first averaged the30 observed performances on each of 16 stimuli into thecomposite observed performance profile that is shown inFigure 1A and in all succeeding similar figures as the solidline. The performance profiles are given here and throughoutin the stimulus order shown in Table 1 and in AppendixB—that is, Stimuli 1 to 5, 6 to 9, and 10 to 16 refer,respectively, to the Category A training exemplars, theCategory B training exemplars, and the new, transfer itemsnot seen in training. Categorization performances are giventhroughout as proportions of Category A responses. Cat-egory B's training exemplars appropriately elicit low rates ofCategory A responses because they are mostly called Bs.
Next, we modeled each individual data set using theadditive prototype model that figured so heavily in the earlydemonstrations of the prototype model's failure and the
exemplar model's superiority (Medin et al., 1983; Medin &Schaffer, 1978; Medin & Smith, 1981). For every data set,we found the best-fitting configuration of the prototypemodel, and this best-fitting configuration implied a predictedprofile of 16 response proportions. Averaging the 30 pre-dicted profiles produced the composite predicted profileshown by the dotted line in Figure 1A. (Succeeding similarfigures contain composite predicted profiles that were pro-duced and are displayed in the same way.) In this way, if theindividual best-fitting profiles fit their individual observedprofiles well, the predicted and observed composites willalso fit well. But, as the individual best-fitting profiles fitless well, the predicted and observed composites may beginto diverge in a consistent way that can be interpretedmeaningfully.
This divergence is clearly shown in Figure 1A. Theadditive prototype model fails to recover the data well. Oneuseful measure of fit is the average absolute deviation(AAD), which summarizes how much on average thepredicted response proportions diverge from the observedresponse proportions for each of the 16 stimuli in the task.On average, in fitting the 30 data sets, the prototype modelerred by .091 per stimulus. A second useful measure of fit isthe sum of the squared deviations (SSD) of predictedresponse proportions from observed response proportions.On average, in fitting the 30 data sets, the SSD over 16stimuli was .224 for the additive prototype model. A thirduseful measure of fit is the percentage of variation in theobserved profile that was accounted for by variation in thepredicted profile (PVA). On average, in fitting the 30 datasets, the additive prototype model accounted for 83.8% ofthe variance in each study's observed performance profile.Table 2 provides these fit measures for the models consid-ered in the present article. These fit measures for the pureprototype model are only moderately good, and the readershould note this carefully. In the present article, we focus onthe relation of the 30 data sets to exemplar theory. As we doso, one must not forget that pure prototype models deservedefinite criticism, for they behave poorly according to thesecriteria of fit.
Beyond the quantitative criteria of fit, the character of theprototype model's failure is also clear. The observed andpredicted profiles diverge in a theoretically suggestive way.Time after time (i.e., data set after data set), the prototypemodel predicts that participants will do less well man theydo on the Category A and B training items (Stimuli 1-5 and6-9, respectively). Remember that for the Category B itemsthe low observed Category A response rates as graphedimply high rates of correct B responses—higher man theprototype model can predict. In contrast, the prototypemodel predicts participants* performance on the transferitems (Stimuli 10-16) well. To confirm this, we calculated fitmeasures separately for the old and new items and found thatthe prototype model erred two or three times as much inpredicting old-item performance as it did in predictingnew-item performance, because it cannot handle the levelsof old-item performance that participants actually show.Something about those old, familiar traces leads to theirgood performance and that something cannot be simple

8 SMITH AND MINDA
A. Additive Prototype Model Table2Measures of Fit
1 I I I I I l i l t F T i l l1 2 3 4 5 6 7 8 9 1 0 11 1 2 13 14 15 16
Stimulus
B. Multiplicative Prototype Model
I i i i i n r r i i i i1 2 3 4 5 6 7 8 9 10 11 12 13 14 15 16
Stimulus
Model
Additive prototypeMultiplicative prototypeContextAdditive exemplarFixed low sensitivityGammaTwin sensitivityMixture
AAD
0.0910.0690.O470.1440.1490.0450.0430.046
SSD
0.2240.1370.0620.4900.5290.0550.0540.052
PVA
0.8380.8900.9410.6640.6370.9440.9460.944
i i r r i i r i i i i i i i1 2 3 4 5 6 7 8 9 10 11 12 13 14 15 16
Stimulus
Note. AAD = average absolute deviation; SSD = sum of squareddeviations; PVA = percentage of variance accounted for.
resemblance to the prototype. Remember that we areillustrating this effect with only one category structure.However, we believe that this effect would also occur withmany other category structures and transfer sets that havebeen used in the literature.
The prototype model's problem springs from its cognitivepsychology (i.e., the processes and representations it as-sumes). By assuming that all items (old and new) arereferred to the category prototypes, it assumes that all itemswill equivalently obey the typicality gradients in the task. Ithas no way to treat training exemplars specially by accord-ing them any processing fluency or performance advantage.Clearly, the model with the right cognitive psychology (i.e.,with the right assumed processes and representations to fithuman psychology and human performance) will have away to reproduce the observed old-item advantage.
Model 2: A Sophisticated PrototypeModel Cannot Help
The sophisticated multiplicative prototype model has thesame problematic cognitive psychology. Table 2 shows thatincluding multiplicative similarity computations and a sensi-tivity parameter did help this model fit seemingly better thanthe additive prototype model. But this improvement iscosmetic, as one sees on examining the character of themultiplicative prototype model's fit (Figure IB). Rememberthat the additive prototype model fit old-item performancepoorly, but new-item performance well. Here the availabilityof the sensitivity parameter lets the multiplicative prototypemodel reach somewhat higher and lower to predict goodperformance on Category A and Category B training exem-plars, respectively. But it also starts to miss the transfer items
Figure 1 (left). A: The composite observed performance profileproduced by averaging the 30 data sets (solid line). Stimuli 1-5,6-9, and 10-16 denote the training exemplars of Category A, thetraining exemplars of Category B, and the transfer items, respec-tively. Also shown is the average of the best-fitting predictedperformance profiles found when the 30 data sets were fitindividually using the additive prototype model (dotted line). B:The same observed profile shown with the composite predictedprofile of the multiplicative prototype model. C: The same ob-served profile shown with the composite predicted profile of thecontext model.

THIRTY CATEGORIZATION RESULTS
more by overreaching them (i.e., by predicting they will beperformed more extremely in both directions than they are).To confirm this, we calculated fit measures separately for theold and new items and found that the multiplicative proto-type model erred about the same amount in predictingperformance on both. The multiplicative prototype modelspreads its error evenly over the training and transfer items.Still, the fundamental problem of a prototype psychologyremains. Whatever sensitivity this model assumes, it treatsall stimuli with that sensitivity. It can no more treat old andnew items differentially than can the additive prototypemodel. It can split the difference between the old and newitems, but it cannot predict that difference. The appropriatemodel must be able to.
Model 3: The Solution Provided by the Context Model
The solution Medin and his coworkers found to thisproblem was to assume that the primary representationsunderlying Categories A and B were the old, trainingexemplars themselves, rather than prototypes that had beenabstracted from them (Medin & Schaffer, 1978). By makingthis theoretical choice, Medin introduced the importantpossibilities that categorization can be based on exemplarstorage, not prototype abstraction, and on item-exemplarcomparisons, not item-prototype comparisons. The categori-zation literature has not been the same since.
Figure 1C shows why. The context model predicts wellevery general aspect of performance—performance on bothcategories' training exemplars, performance on transferitems, the oloV-new performance gap, and so forth. Table 2shows that in all quantitative respects the context model dida better job fitting the 30 data sets than did either prototypemodel. Indeed, for all three fit indices, the context model fitsignificantly better than did the additive prototype model:t(29) = 6.48, p < .05, for AAD; t(29) = 4.98, p < .05, forSSD; and t(29) = -5.45, p < .05, for PVA.1
Nosofsky (1992) carried out a survey similar to the one inthe present article. He compared the success of variousmodels in fitting some of the 5-4 data sets that wereavailable then. He also included the additive prototypemodel, the multiplicative prototype model, and the contextmodel. He also found both prototype models wanting bycriteria of fit. To this point, his smaller survey of theliterature converges with ours. In particular, the readershould note the context model's excellent indices of fit. Foras we focus on the relation of these 30 data sets to exemplartheory, one must not forget how well the exemplar modelperforms in fitting them.
One reason the context model fits these data patterns sowell is that it assumes that the old training exemplars arestored in memory as the representational cores of the twocategories. On their reappearance as stimuli in the transferphase of the experiment, they naturally trigger themselvesin memory and receive by virtue of this identity match astrong pull or resonance from self-retrieval that causes themto be categorized highly accurately. The transfer itemsreceive only the weaker pull exerted by training items ofboth categories that they may be similar to but neveridentical to. As a consequence, their performance disadvan-tage is predicted.
In fact, one can show intuitively that the context model,by positing exemplar storage and exemplar-to-exemplarcomparisons, will be able to produce the required old-newperformance advantage. The probability of a Category Aresponse for a transfer item is closely related to the summedsimilarity of the to-be-categorized item to the A exemplarsdivided by the summed similarity of the to-be-categorizeditem to the exemplars of both categories. Thus, the probabil-ity of a Category A response for transfer Stimulus i is closelyrelated to the following quantity:
(SimiA1 + SimfA2 + SimlA3 + SimlA4 + SimjA5)/
([Sinvxi + Sim/A2 + SimlA3 + SimlA4 + SimlA5] (9)
[SimlB6 + Simm7
SimiB9]).
In contrast, when calculating the Category A responseprobability for a Category A training item, one of theseimperfect similarities will always be replaced by a perfect-match identity. This will increase the numerator of thedecision rule proportionally more than the denominator andwill predict higher performance for old items than for newones. How much higher is a decision and a calculation thatthe context model makes finely as it fits an observedperformance profile.
The central point, though, is the success of the contextmodel in predicting the old-new performance gap thatprototype models in principle cannot predict. This success infitting an early group of data sets brought exemplar theoryinto sharp focus in the literature and brought prototypetheory into disfavor. Figure 1C shows that this success isgenerally repeated across the 30 data sets. This success hasbeen repeated using other category structures, too.
Yet the context model makes several important assump-tions to reproduce the performance differential betweentraining and transfer items. It assumes, as other exemplarmodels do, that specific exemplar traces (not prototypes)form the representational cores of categories. It assumes, asother exemplar models do, that token-exemplar compari-sons, not token-prototype comparisons, are the basis ofcategory decisions. It even assumes that humans compare ato-be-categorized item to all the stored members of relevantcategories in reaching a categorization decision. This assump-
1 To ensure that our fitting procedures were stable acrossdifferent minimization criteria, we also fit all eight models to all 30data sets using log-likelihood as the criterion for goodness of fit,not the sum of the squared deviations (SSD). The resulting bestfitting solutions were practically identical in the two cases. Forexample, for the context model fitting the 30 data sets, the 480predicted performance levels (16 stimuli x 30 data sets) found bythe SSD minimization criterion and by the log-likelihood minimiza-tion criterion correlated at .999. For the additive prototype model,this correlation was .998. The best fitting parameter estimatesfound by the two minimization criteria correlated extremely highly,too. Given this close correspondence, we emphasize the SSDminimization criterion in this article because it is more intuitive,because it was generally used by others in modeling the 5-4performance profiles, and because it is even discernible in thegraphs comparing observed and predicted performance.

10 SMITH AND MINDA
tion, that humans categorize a new dog by comparing it to allthe specific dogs they know, has not seemed natural toeveryone (see Palmeri & Nosofsky, 1995, for discussion).
The context model also assumes that the subjectivepsychological space within which a category task is repre-sented and performed can be expanded through a wide rangeof magnification factors. This magnification is the role of thesensitivity parameter c. Higher sensitivities magnify psycho-logical space by increasing the differentiation among stimuli.The context model also assumes that psychological similar-ity decays exponentially as featural mismatches accumulatebetween stimuli. This means that even the first featuralmismatch can create a large dissimilarity between stimuli.This means that the context model can emphasize stronglyan exact match between stimuli, especially when its sensitiv-ity parameter is set at a high level.
As we show now, this whole package of assumptions—exemplar representations, systematic exemplar-to-exemplarcomparison processes, exponentially decaying similarity,and the magnification factor expanding psychologicalspace—operates synergistically in allowing the contextmodel to fit successfully the data from the 30 5-4 perfor-mance profiles. All these assumptions are needed.
Model 4: Exemplar Processes Alone Do NotWork—An Additive Exemplar Model
Assuming exemplar representations and systematic exem-plar-to-exemplar comparisons is not enough to account forthe 5-4 performance profiles. To show this, we fit a simple,additive exemplar model to the 30 data sets. This model isthe twin of the additive prototype model, with the same lackof exponential similarity decay and the same lack of asensitivity parameter. The models only differ in their assump-tions about the representational cores of categories andabout the comparison processes that underlie categorizationdecisions. Figure 2A shows that this exemplar model fitsthese data poorly, and Table 2 summarizes its poor fitindices. It falls far short of what the full-fledged contextmodel accomplishes. It even falls short of what the additiveprototype model accomplishes (Figure 1A). It is generallyacknowledged that exemplar processes are not the solesource of the answer the full context model provides (Medin& Schaffer, 1978; Nosofsky, 1992).
Figure 2 (right). A: The composite observed performance profileproduced by averaging the 30 data sets (solid line). Also shown isthe average of the best-fitting predicted performance profiles foundwhen the 30 data sets were fit individually using an additiveexemplar model (dotted line). B: The same observed profile shownwith the composite predicted profile of the context model inlow-sensitivity configurations. To make this predicted profile, wefit each of the 30 data sets with 21 versions of the context model inwhich sensitivity was held at low levels (from 1.0 to 3.0 inclu-sively, in steps of .10). The predicted profile shown is the averageof these 630 individual predicted profiles. C: The same observedprofile shown with the composite predicted profile of the gammamodel.
Additive Exemplar Model
i i i i i i i i \ \ \ i I i i1 2 3 4 5 6 7 8 9 10 11 12 13 14 15 16
Stimulus
B. Context Model: Fixed Low Sensitivity
I I I I I T I I I I I I I I I1 2 3 4 5 6 7 8 9 10 11 12 13 14 15 16
Stimulus
C.
i i i i i i9 10 11 12 13 14 15 16
Stimulus

THIRTY CATEGORIZATION RESULTS 11
Model 5: The Context Model Denied MagnificationPower—Fixed Low Sensitivity
Even combining exemplar representations with exponen-tially decaying similarity is not enough to account for the5-4 performance profiles. The context model must haveextremely high sensitivities—that is, it must be allowed tomagnify psychological space enormously. Remember thathigher sensitivities magnify psychological space by increas-ing the psychological differentiation among stimuli in anuneven way that places more emphasis on exact identitybetween a to-be-categorized item and an old exemplar. Toshow the context modePs dependence on high sensitivitiesin fitting the 30 data sets, we examined its performancewhen sensitivity was kept low. To do so, noting that thesensitivity parameter's full range goes from zero to infinity,we fit each of the 30 data sets with 21 versions of the contextmodel that had sensitivity fixed at all values from 1.0 to 3.0,in steps of .10.
Figure 2B shows the predictions of the context modelaveraged over 21 levels of sensitivity as it tried to fit the 30data sets. It fits these data very poorly, and Table 2 confirmsthis fact. It is obvious that the context model needs theflexibility to choose much higher powers of magnificationfor psychological space to account for these performanceprofiles and probably others, too. In fact, over the 30 datasets, the unconstrained context model estimated sensitivityto be 8.19 (SD = 2.79). As we consider now the meaning ofhigh sensitivity and its role in fitting 5-4 data, remember thatthis high sensitivity value was estimated only for the 30 5-4data sets, that other category structures have produced lowersensitivity estimates in the literature (Nosofsky, 1986,1987,1988; McKinley & Nosofsky, 1996), and that in these casesthe implications of high sensitivity might apply less strongly.
To explain the meaning of high sensitivity in the contextmodel, Figure 3 shows the relationship between sharedfeatures and psychological similarity for two stimuli whenthe exemplar-comparison system has 8.2 sensitivity. Whereasidentical stimuli share 100% similarity, the expansion ofpsychological space caused by high sensitivity leaves eventwo items that share all but one feature with only 13%similarity instead. In this psychological space, only exactidentity produces strong similarity. The meaning of highsensitivity can also be illustrated by using the 30 5-4 datasets. To do so, we fixed the dimensional weights in thecontext model at the values obtained on average when thecontext model fit the 30 data sets. We fixed sensitivity at 8.2.Under the context model's description, same-category exem-plars in the 5-4 task are only 5% similar to each other.
This makes one wonder how, if the context model'sdescription is right, participants glue objects that are 95%dissimilar into categories, or whether they even do. Givennine such disparate stimuli, all distant neighbors in psycho-logical space, participants might just pursue an exemplar-memorization strategy that attaches the correct A or B labelto each unique exemplar. Old items would then be catego-rized just by being recognized, not by being systematicallycompared to all the training items. Notice that categorizationby exemplar recognition would involve 100% similarity, not5% similarity. By the context model's own description ofprocessing in the 5-4 task, exemplar-memorization events
Exemplar-to-Exemplar Similarity
0 1 2
Number of Shared Features
Figure 3. The relationship between similarity and the number ofshared features between exemplars when we set the contextmodel's sensitivity parameter at 8.2, assumed that attention wasdistributed homogeneously, and calculated similarity between twofour-dimensional exemplars.
have 20 times the impact on the system that exemplar-comparison events have.
In fact, in the original experiments that motivated exem-plar theory, Medin and his coworkers considered the possi-bility that participants might adopt just such an exemplar-memorization approach (Medin & Schwanenflugel, 1981, p.365). If so, the categorization task would degenerate into anidentification task in which participants would rotely associ-ate whole instances and their labels but would have no senseof organized categories as they applied the labels. Below, weconsider further the important effects and implications ofhigh sensitivity in the context model.
In any case, Model 5 joins Model 4 in showing thatexemplar processing alone is insufficient to give a model theflexibility it needs to fit the 5-4 data sets well. Instead, thecontext model needs to be granted all of its assumptions—exemplar storage, systematic exemplar-to-exemplar compari-sons, exponential similarity decay, and the extreme magnifi-cation of psychological space. These assumptions changetraditional thought about the representations and processesunderlying humans1 categorization, and this is why it isimportant to keep evaluating those assumptions.
In fact, it is useful to keep in mind that the comparisonbetween the context model and the prototype model was nothistorically only about one contrast (exemplar-based cat-egory representations for the context model; prototype-based representations for the prototype model). Rather, thecomparison was about multiple contrasts (exemplar storage,systematic exemplar-to-exemplar comparisons, the magnifi-cation of psychological space, exponentially decaying simi-larity for the context model, prototype storage, item-prototype comparisons, additive similarity, and linearlydecaying similarity for the prototype model). Although theterm exemplar theory is ubiquitous now, it selectively
12 SMITH AND MINDA
emphasizes some of the context model's assumptions andnot others, and therefore it potentially misleads. In particu-lar, we have just seen that the extreme magnificationrequired by the context model to fit the 30 5-4 data setscould speak against the exemplar-comparison processes ofthe context model and for a simpler exemplar-memorizationprocess. This recommends the consideration of alternativeexemplar processes in category research, and we return tothis issue beiow.
Model 6: The Gamma Model—Too Much Firepowerfor the Job
The standard context model sometimes fits group perfor-mance when it fails to fit individual performances (Ashby &Gott, 1988; Maddox & Ashby, 1993; Smith et al., 1997).This failure has implications for theory in categorizationresearch (Smith & Minda, 1998), and it has led the contextmodel to be augmented by the gamma parameter (Maddox& Ashby, 1993; McKinley & Nosofsky, 1995). Here,because the 30 data sets do represent composite groupperformances, it seemed likely that gamma would not berequired. In fact, the gamma model fit the 30 data sets justlike the standard context model does—quantitatively (Table2) and qualitatively (compare Figures 1C and 2C). Theaverage best-fitting gamma over the 30 data sets was only1.75, underscoring the minimal requirement for it.
Model 7: Prototypes, But Extra Old-ItemSensitivity—A Twin-Sensitivity Model
Even without gamma, the context model makes fourassumptions to capture the 5-4 performance profiles. Wenow ask whether these assumptions are necessary to de-scribe the 5-4 performances or whether there is a viable setof assumptions that preserves prototypes as the representa-tional cores of categories. Models 7 and 8 address thesequestions.
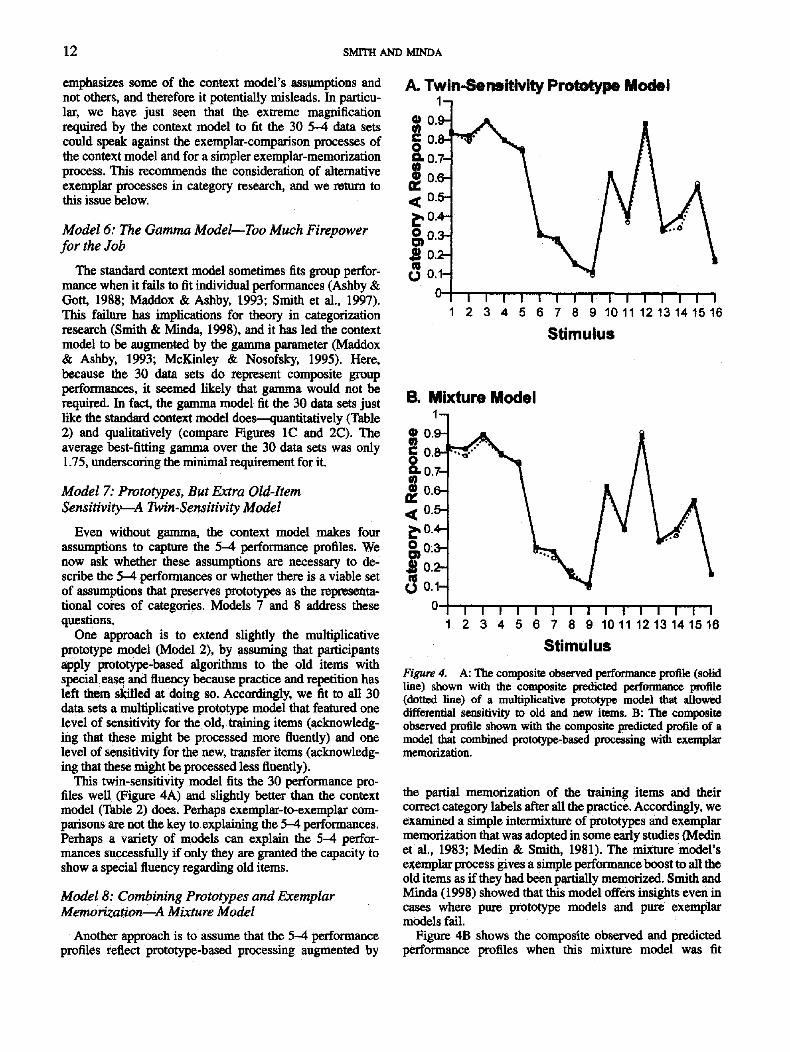
One approach is to extend slightly the multiplicativeprototype model (Model 2), by assuming that participantsapply prototype-based algorithms to the old items withspecial ease and fluency because practice and repetition hasleft mem skilled at doing so. Accordingly, we fit to all 30data sets a multiplicative prototype model that featured onelevel of sensitivity for the old, training items (acknowledg-ing that these might be processed more fluently) and onelevel of sensitivity for the new, transfer items (acknowledg-ing that these might be processed less fluently).
This twin-sensitivity model fits the 30 performance pro-files well (Figure 4A) and slightly better than the contextmodel (Table 2) does. Perhaps exemplar-to-exemplar com-parisons are not the key to explaining the 5-4 performances.Perhaps a variety of models can explain the 5-4 perfor-mances successfully if only they are granted the capacity toshow a special fluency regarding old items.
Model 8: Combining Prototypes and ExemplarMemorization—A Mixture Model
Another approach is to assume that the 5^4 performanceprofiles reflect prototype-based processing augmented by
A. Twin-Sensitivity Prototype Model
I 1 I 1 I I I I I I I I I I I1 2 3 4 5 6 7 8 9 10 11 12 13 14 15 16
Stimulus
1 I I I I T I I I I I I I I I1 2 3 4 5 6 7 8 9 10 11 12 13 14 15 16
Stimulus
Figure 4. A: The composite observed performance profile (solidline) shown with the composite predicted performance profile(dotted line) of a multiplicative prototype model that alloweddifferential sensitivity to old and new items. B: The compositeobserved profile shown with the composite predicted profile of amodel that combined prototype-based processing with exemplarmemorization.
the partial memorization of the training items and theircorrect category labels after all the practice. Accordingly, weexamined a simple intermixture of prototypes and exemplarmemorization that was adopted in some early studies (Medinet al., 1983; Medin & Smith, 1981). The mixture model'sexemplar process gives a simple performance boost to all theold items as if they had been partially memorized. Smith andMinda (1998) showed that this model offers insights even incases where pure prototype models and pure exemplarmodels fail.
Figure 4B shows the composite observed and predictedperformance profiles when this mixture model was fit

THIRTY CATEGORIZATION RESULTS 13
individually to all 30 data sets. It also fits the data well andslightly better than the context model does (Table 2).
Which Data Sets Should Be Modeled Comparatively?
In the preparation of this article, a reviewer raised aconcern about which, if not all, of the 5-4 data sets it wasappropriate for us to include in our analyses, and aboutwhich, if not all, of the 5-4 data sets the exemplar modelmight be expected to fit successfully. This concern hasimplications for interpreting the 5-4 data and for theory inthe field.
The reviewer's concern was that the exemplar modelcannot be fairly expected to fit comfortably the dataproduced when participants are operating under a deadline(as in Lamberts, 1995), or the data produced at earlier stagesof learning (as in Nosofsky et al., 1992), or the dataproduced under rule-plus-exception instructions (as in theconditions of Medin & Smith, 1981, and Palmeri & Nosof-sky, 1995, that encouraged participants to use one feature asa rule to categorize the stimuli and to memorize theexceptions to that rule), or the data produced under prototype-based instructions (as in the conditions of Medin & Smith,1981, that encouraged participants to develop a general ideaabout the categories). If not, then it might not be appropriatefor us to compare the fit of the exemplar model to the fit ofother models regarding these data sets.
Before addressing this concern, we point out that theoreti-cal implications would attend the need to exclude data sets toisolate the situations that the exemplar model describes well.This need would suggest that the exemplar model may nothandle well different deadline conditions (Lamberts, 1995),different stages of learning (Nosofsky et al., 1992), ordifferent instructional sets (Medin & Smith, 1981; Medin etal., 1983; Medin et al., 1984; Palmeri & Nosofsky, 1995).This would narrow exemplar theory's influence within thecategorization literature, leaving it applicable only to someof the possible experimental paradigms. This would narrowexemplar theory's influence in the study of real-worldcategorization, which naturally features different deadlineconditions, stages of learning, and instructional sets. In bothrespects, the need to restrict data would limit the comprehen-siveness of exemplar theory, require additional theories tohandle additional data, and recommend a broader theory thatcould span procedural and temporal variations.
So it seemed important to address the concern aboutwhich data sets count. To do so, we temporarily excludedfrom consideration the three deadline conditions of Lam-berts (1995), the early stages of learning from Nosofsky etal. (1992), the seven conditions that used prototype-basedinstructions, and the two conditions that used rule-plus-exception conditions. We also excluded the data set thatsampled exemplars from an infinite pool without replace-ment, because this left the old items presented at transferperceptually different from the old items presented duringtraining. At the same time, we addressed the additionalconcern that we had somehow weighted some articles in theliterature artificially heavily, for example, by includingmultiple data sets from them. In total, 18 of the 30 datasets—3,4, 5,6,11,12,14,15,17,18,19,20, 21, 22,25, 27,
28, and 29—were set aside, leaving only the 12 that mostheavily favored exemplar processing because they featuredhighly repetitive training on the same nine exemplars andbecause they assessed performance at task's end whenspecific exemplar traces most dominate categorization (Smith& Minda, 1998). Just as before, we averaged the 12observed profiles into a composite observed profile and the12 best-fitting profiles of each model into a compositepredicted profile. Figure 5 duplicates Figure 1, but with just12 data sets included, showing the relationship betweenobserved and predicted performance for the additive proto-type model, the multiplicative prototype model, and theexemplar model. Figure 6 duplicates Figure 4, but with just12 data sets included, showing the relationship betweenobserved and predicted performance for the twin-sensitivityprototype model and the mixture model.
All the analyses based on the exclusive group of 12 datasets are identical to those based on the inclusive group of 30.The two observed profiles are nearly identical. The additiveprototype model fails just as before. The multiplicativeprototype model fails again by trying to split the differencebetween performance on the old and new items. Theexemplar model, the twin-sensitivity prototype model, andthe mixture model all fit well again. In fact, all the fits andmisfits are so similar to those based on 30 data sets thatcareful scrutiny is required to see the differences.
In our view, it is instructive and constructive that the 12data sets that most favor exemplar theory behave identicallyto the 30 data sets that sample the conditions of categoriza-tion more broadly. This means that the 30 data sets do form acoherent body of data. This means that one can treat the datainclusively and work toward an overall description of them.
Interpreting Performance in the 5-4 Task
To work toward this overall description, we now considerthe convergences among the three equivalently successfulmodels in this article—the mixture model, the twin-sensitivity model, and the exemplar model—to see if theseconvergences have implications for interpreting perfor-mance in the 5-4 task. In this section, we show that the 5-4data pose one principal empirical, formal, and psychologicalproblem—the performance advantage of old, training itemsover new, transfer items. We show that each successfulmodel includes a mechanism that grants old items thissimple, global performance boost, but that these mecha-nisms rest on different representational and processingassumptions. The mixture model assumes prototype-basedprocessing supplemented by partial old-item memorization.The twin-sensitivity model assumes prototype-assimilationprocesses of greater fluency and skill for the old items. Theexemplar model assumes categories that are prototypelesscollections of instances and assumes that to-be-classifieditems are systematically compared to the stored exemplartraces that form the two categories. That these differentmechanisms describe equally well 5-4 data has an importantimplication. It means that interpreting the 5-4 data sets doesnot require the purely exemplar-based representations andthe systematic exemplar-to-exemplar comparison processesof exemplar theory. It means that the 30 5-4 data sets do not

14 SMITH AND MINDA
A. Additive Prototype Model (12)
i i i i n i r i i i i i i1 2 3 4 5 6 7 8 9 10 11 12 13 14 15 16
Stimulus
B. Multiplicative Prototype Model (12)
C.
1 I I I I I I i ! T T i l l !1 2 3 4 5 6 7 8 9 1 0 1 1 12 13 14 15 16
Stimulus
Context Model (12)•4 ^
i i i i i i i7 8 9 10 11 12 13 14 15 16
Stimulus
selectively support the assumptions of exemplar theory.Because this section raises controversial issues, we stressthat it does not represent a criticism of exemplar theory perse. Indeed, exemplar theory remains one of the severalpossible formal descriptions of performance in the 5-4 task.Rather, this section shows only that the body of data thatmost strongly motivated exemplar theory does not particu-larly do so. But other successes of exemplar theory mightsustain it even without the support of these 30 results.
The six panels of Figure 7 allow these points to be madedirectly. Consider first Figure 7A. It shows the failure of themixture model when we capped the exemplar-memorizationparameter at 0.0 and denied the model any special way tocope with the practice effect on old items. (This constrainedversion of the mixture model is formally identical to Model1, the additive prototype model.) This unsuccessful modelfits new-item performance (Stimuli 10-16) but undershootsold-item performance (Stimuli 1-9). Reaching up to fitold-item performance is the principal fitting problem regard-ing the 5-4 data sets. So this model needs a way toselectively target old-item performance and raise i t Theexemplar-memorization parameter provides this (Figure7B). Over 30 data sets its average value was .50 when themixture model was unconstrained.
Formally, this parameter simply acknowledges a practiceeffect by selectively increasing old-item performance. Thisselective increase is clear in the graphs and it is guaranteedbecause the parameter only applies to the old items.Psychologically, this parameter might reflect that partici-pants partially memorize old items and use recognition-based categorization processes to supplement prototype-based categorization processes. So this model does see a rolein categorization for exemplar representations, but its assump-tions still differ profoundly from the assumptions of exem-plar theory and the context model. The mixture model stillgrounds categories in prototypes. Prototype-based process-ing still governs categorization much of the time. Themixture model does not assume, as exemplar theory does,that categories are prototypeless collections of instances.Nor does it assume, as the context model does, thatsystematic exemplar-to-exemplar comparison processes un-derlie categorization. Instead, the mixture model just embod-ies the intuitive idea that people know generally what dogsare, but know specifically their own dogs best.
Consider next Figure 7C. It shows the failure of thetwin-sensitivity prototype model when we capped sensitiv-ity at a level that let the model fit new-item performancewell (We chose this level of sensitivity, 1.5, to let theconstrained twin-sensitivity model fit new-item performanceexactly as well as the constrained mixture model did.) This
Figure 5 (left). A: The composite observed performance profileproduced by averaging a restricted set of 12 of the 5-4 data sets(solid line). Also shown is the average of the best-fitting predictedperformance profiles found when the 12 data sets were fitindividually using the additive prototype model (dotted line). B:The same observed profile shown with the composite predictedprofile of the multiplicative prototype model. C: The same ob-served profile shown with the composite predicted profile of thecontext model.

THIRTY CATEGORIZATION RESULTS 15
A. Twin-Sensitivity Prototype Model (12)1-1
i i i i i i i i i i i i i i i1 2 3 4 5 6 7 8 9 10 11 12 13 14 15 16
Stimulus
B. Mixture Model (12)
i i I i i \i rn n i i1 2 3 4 5 6 7 8 9 10 1112 13 14 15 16
Stimulus
Figure 6. A: The composite observed performance profile pro-duced by averaging a restricted set of 12 of the 5-4 data sets (solidline) shown with the composite predicted performance profile(dotted line) of the twin-sensitivity prototype model. B: The sameobserved profile shown with the composite predicted profile of themixture model.
cap let us examine the behavior of the twin-sensitivity modelwhen it is denied any special way to cope with the principalformal problem posed by the 5^4 data sets—the practiceeffect on old items. This unsuccessful model fits new-itemperformance but undershoots old-item performance. It tooneeds a way to selectively target old-item performance andraise it. The old-item sensitivity parameter provides this(Figure 7D). Over the 30 data sets, its average value was7.09 when the twin-sensitivity model was unconstrained.
Formally, this parameter just selectively increases old-item performance. This selective increase is clear in thegraphs, and it is guaranteed because this parameter appliesonly to the old items. Psychologically, this parameter might
mean that practice increases the skill with which old itemsare assimilated to their appropriate prototype, leading tohigher levels of performance on them, whereas the newitems are assimilated to prototypes less skillfully, leading tolower levels of performance on them. It seems intuitive thatoften-repeated comparisons to a prototype would run offmore smoothly than first-time comparisons to a prototype.But once again this model grounds categories in prototypesand categorization in prototype-based processes. All compari-sons are made to the prototype, some are just made morefluently. This model clearly does not assume, as exemplartheory does, that categories are prototypeless collections ofinstances or that systematic exemplar-to-exemplar compari-son processes underlie categorization.
There are important similarities between the mixturemodel and the twin-sensitivity model. Both acknowledgethat the old exemplars have a special status as to-be-categorized items. (They must, because the old-item perfor-mance advantage is the main empirical fact of the 5-4 datasets.) Now one can attribute this processing advantage (as inthe twin-sensitivity model) to fluency, priming, the strengthof connection to the prototype* or the ease and skill ofassimilation to it. Or one can attribute this processingadvantage (as in the mixture model) to the item's familiarity,memorization, or explicit recognition. But because there areclose connections in the psychological literature betweenthese two sets of variables, one can choose whether tohighlight or downplay the processing distinction betweenthe models. One principled distinction could be that under amemorization interpretation, the exemplars would be storedwith their category labels, so that self-retrieval directlysupported a correct categorization decision that could supple-ment other categorization strategies. In contrast, under afluency interpretation, the well-practiced old exemplarswould be processed fluently through to a connection with aprototype that itself had a category label—here the exem-plars would not be stored with their category labels. For us,though, the critical point is that both models are similar foracknowledging prototype representations and prototype-based comparisons, for restricting the effect of any exemplarprocess to the old items only, and for contrasting sharplywith the purely exemplar-based representations of exemplartheory and the systematic and comprehensive exemplar-to-exemplar comparisons of the context model.
Finally, consider Figure 7E. It shows the failure of theexemplar model when it is granted only the sensitivity thatlets it fit new-item performance well. (We chose this level ofsensitivity, 4.0, to let the constrained context model fitnew-item performance exactly as well as the constrainedmixture model and constrained twin-sensitivity model did.)This cap allowed us to examine the behavior of the exemplarmodel when it is denied any special way to cope with thepractice effect on old items. It fits new-item performance butundershoots old-item performance—just as the other modelsdo. It also needs an extra adjustment to selectively targetold-item performance and raise i t High values of thesensitivity parameter provide this (see Figure 7F). Over the30 data sets, its average value was 8.19 when the contextmodel was unconstrained.
One can see from Figures 7E and 7F that the success ofthe exemplar model is not assured by its exemplar represen-

A. Mixture Model <S=0)1-1
i i i i i i i r i i i i i i1 2 3 4 5 6 7 8 9 101112 13 14 15 16
Stimulus
B. Mixture Model (unconstrained)1-1
i i i i i i i i i i i I i1 2 3 4 5 6 7 8 9 10 11 12 13 14 15 16
Stimulus
C. Twin-Sensitivity Prototype Model (c<=1.5)1-1
D. Twin-Sensitivity Prototype Model (unconstrained)
\ i i i i i n i i r i i i i2 3 4 5 6 7 8 9 10 11 12 13 14 15 16
Stimulus
i i i i i\ i i r r I i i1 2 3 4 5 6 7 8 9 1011 12 13 14 15 16
Stimulus
E Context Model (c<=4.0)1-1
F. Context Model (unconstrained)
I i i I i i i i 1 r r i i1 2 3 4 5 6 7 8 9 10 11 12 13 14 15 16
Stimulus
i i i i i i r i i i i i i1 2 3 4 5 6 7 8 9 10 11 12 13 14 15 16
Stimulus
Figure 7. A: The composite observed performance profile from the 30 data sets (solid line) shownwith the composite predicted performance profile of the mixture model (dotted line) when the valueof the exemplar-memorization parameter (S) was constrained to be 0.0. B: The same observed profileshown with the composite predicted profile of the mixture model when the value of theexemplar-memorization parameter was unconstrained. C: The same observed profile shown with thecomposite predicted performance profile of the twin-sensitivity prototype model when weconstrained both of its sensitivity parameters to be less than or equal to 1.5. D: The same observedprofile shown with the composite predicted performance profile of the twin-sensitivity protototypemodel when the value of both sensitivity parameters was unconstrained. E: The same observedprofile shown with the composite predicted performance profile of the context model when weconstrained the value of its sensitivity parameter to be less than or equal to 4.0. F: ITie same observedprofile shown with the composite predicted performance profile of the context model when the valueof its sensitivity parameter was unconstrained.

THIRTY CATEGORIZATION RESULTS 17
tations or its systematic exemplar-to-exemplar comparisons.Rather, its success is assured by the formal mechanics ofhigh sensitivity. High sensitivity just selectively increasesold-item performance. This selective increase is clear in thegraphs, and one can also show formally that increases insensitivity beyond 4.0 (in the case of 5-4 performances) actnearly exclusively to raise old-item performance. In essence,the context model has a second sensitivity that applies onlyto old items, just as the twin-sensitivity model does. Inessence, the context model has an old-item parameter, just asthe mixture model does.
Taken together, the six graphs of Figure 7 show thatperformance in the 5-4 task, whether on the new, transferitems or the old, training items, really has no particularrepresentational or process implications. All three models,whether they assume prototype or exemplar representations,explain new-item performance equivalently well and easily.All three confront the selective training boost to old itemsand incorporate a mechanism that reproduces that boost. Butthe boost—whether it is modeled in a way that is groundedin prototypes or exemplars, and whether it is attributed tomemorization, skilled prototype assimilation, or high sensi-tivity—only acknowledges that participants perform betteron old items. It does not confirm the purely exemplar-basedcategories of exemplar theory. It does not confirm thesystematic exemplar-to-exemplar comparisons of the con-text model. In fact, those exemplar representations andexemplar processes are demonstrably as insufficient (Figure7E) as are the assumptions of the prototype models (Figures7A and 7C) unless they are supplemented (Figure 7F) by thesame old-item boost that the prototype models need (Figures7B and 7D). In all three cases, the boost is the thing; theunderlying representation and process remains undeter-mined and unknown. Therefore, one sees that the 30 5-4data sets, when described by formal models, are silent on thematter of whether categories are represented in a way that isbased on prototypes or in a way that is based on exemplars.As a result, these 30 data sets cannot be judged to selectivelysupport exemplar theory. To the contrary, assuming pro-totoype-based representational cores is still perfectly appro-priate regarding the 30 5-4 performance profiles, if only oneassumes that participants also memorize or gain fluency withthe training items.
In fact, one might even prefer the prototype-based descrip-tion, because both memorization and practiced skill groundthe old-item advantage in intuitive psychological processes.All of us know that we memorize things and get better withrepetition and practice. In contrast, the exemplar model'sglobal sensitivity parameter is less grounded in intuitivepsychological processes like these. In fact, high sensitivityin the exemplar model is even potentially misleadingregarding the 5-4 data sets because it seems to apply to allthe items but really applies selectively to the old items—justas an old-exemplar parameter does. Maybe the simplestinterpretation of the 5-4 performances is that somethingchanges in the processing of the old items to grant them theirperformance advantage. Saying that old items becomepracticed or memorized addresses this possibility moreclearly than does saying that sensitivity increases globallyfrom four to eight.
But even stopping short of any preference for a prototype-based description, one sees that the profound theoreticalshift from prototype-based to exemplar-based representa-tions that the 5-4 category structure motivated was notnecessary to explain these data. Furthermore, regarding the30 5-4 performance profiles, one need not assume thesystematic exemplar-to-exemplar comparisons that the con-text model does, in which a to-be-categorized item iscompared systematically to all the Category A exemplarsand to all the Category B exemplars, and then placed into thecategory with the more similar stored exemplar traces. Asimpler exemplar process suffices—old-item fluency ormemorization or recognition. That is, it is sufficient to saythat old items simply self-retrieve and boost their ownperformance. There is no reason to say that any item is evercompared to many exemplars in the processing that pro-duces a categorization decision. In fact, even the contextmodel's description makes it clear that exemplar-memoriza-tion events have 20 times the impact on the system thatexemplar-comparison events do. Even the context model'sdescription makes it seem implausible that participantswould try to scrape together the 5% similarities of exemplarcomparisons when they could use instead the 100% similari-ties of self-retrieval.
If the good fit of the exemplar model in these 30 cases isjust about a practice effect, if it is just about memorization orold-item fluency, then it would be useful for theory to say so.For then the good fit is not about systematic exemplar-to-exemplar comparisons, and the context model's descriptionof humans' processing in the 5-4 task is incorrect. There areimportant psychological differences between these twoprocess interpretations. For example, the memorizationinterpretation leaves open the theoretical possibility thatcategories are grounded in prototypes. Put another way, thesimpler exemplar process avoids making unnecessary repre-sentational commitments about the cores of categories. Thecontext model's exemplar process makes representationalcommitments that are unnecessary regarding the 5-4 data.
This discussion raises a theoretical concern about exem-plar theory. The concern is that higher and higher sensitivityin the context model can quietly change its fundamentalcharacter from one that features exemplar-to-exemplar com-parisons to one that features exemplar memorization. Highsensitivity can stretch psychological space until the exem-plars become such distant neighbors that of course they donot contribute to each other's categorization, but only totheir own. It is well recognized that high sensitivity stretchespsychological space and tightens the circle of exemplargeneralization so that fewer exemplars contribute to process-ing (e.g., Kruschke, 1992; Lamberts, 1994). It is insuffi-ciently recognized that the quantitative stretch of highsensitivity may finally change the exemplar model's qualita-tive character—turning an exemplar-generalization modelinto an exemplar-memorization model.
However, as we raise this concern, we also note that thereare limits on its present extension. We do not know howbroadly the idea of prototypes combined with exemplarmemorization will be applicable, because here we areexploring only one category structure, albeit an importantone, and 30 influential data sets within the literature. The
18 SMITH AND MINDA
context model has had significant successes regarding othercategory structures, too. Regarding one of these successes,Smith and Mioda (1998) showed that the idea of prototypescombined with old-item fluency has utility in describingperformance on the class of nonlinearly separable categorystructures that had seemed to favor the context model.Minda and Smith (1999) showed that the idea of prototypescombined with the simpler exemplar process described datafrom many different category structures mat varied widely instructural ratio, in stimulus complexity, and in category size.Even so, future research must still establish how far this ideaextends.
We also point out that our claims about simplicity andcomplexity are only about the exemplar processes in themixture model and in the context model. Exemplar memori-zation is simpler than the systematic exemplar-to-exemplarcomparisons assumed by the context model In fact, anemphasis on old-item fluency could help exemplar theorytemper its most controversial assumption (that all exemplarsare remembered and used in category decisions). However,viewed more broadly, the mixture model's description ofprocessing in a category task is not simpler than the contextmodel's description. Formally, the mixture model and thecontext model have the same number of free parameters; thetwin-sensitivity model has one more. Psychologically, themixture and twin-sensitivity models could even be viewedas being more complex than the context model because theyboth invoke prototypes and a simple exemplar process,whereas the context model uses a single representationalsystem more complexly. Future research will have toestablish whether and when it is useful to include bothprototypes and simple exemplar processes in an overalltheory of category learning. For example, in Smith andMinda (1998) there appeared to be an interesting psychologi-cal transition during category learning—from prototype-based processing to prototype-based processing combinedwith memorization or fluency—that a purely exemplar-based model could not emulate and could never in principleilluminate.
The A2 Advantage
Is there an A2 advantage? One result from the 5-4category structure deserves special attention, because itmight provide crucial support for exemplar theory and forthe context model's systematic exemplar-to-exemplar com-parisons (Medin et al., 1984; Medin & Schaffer, 1978;Medin & Smith, 1981; Nosofsky, 1992; Nosofsky et al.,1992; Nosofsky et ai., 1994). So we now consider therelative performance of participants on Stimuli Al (1 1 1 0)and A2 (1 0 1 0). This stimulus pair is important because Alseems more prototypical than A2. It is more similar to theCategory A prototype ( 1 1 1 1 ) than is A2, which sharesfeatures equally with both prototypes. In fact, Al is identicalto A2 except for its additional prototypical feature inDimension 2. This is why prototype models generallypredict an Al performance advantage in the 5^4 task.
However, because of Media's careful choice of the otherstimuli, the context model predicts a performance advantage
for Stimulus A2. This is why. Stimulus A2 (10 10) is highlysimilar (3 features shared) to two other Category A exem-plars (Al, 1110; A3,1011) and no Category B exemplars.If participants really do make the systematic exemplar-to-exemplar comparisons assumed by exemplar theory, A2 willseem to be a strong Category A exemplar and will seldom bemiscategorized into Category B. Stimulus Al (1 1 1 0) ishighly similar to only one other Category A exemplar (A2,1 0 10) but two Category B exemplars (B6, 1 1 0 0 ; B7,0 1 1 0). If participants really do make the systematicexemplar-to-exemplar comparisons assumed by exemplartheory, Al will seem to be a weak Category A exemplar andwill often be miscategorized into Category B. l i e con-straints involved in contrasting prototype-based and exem-plar-based similarity explain the 5-4 category structure'spoor differentiation and ambiguous items.
To illustrate this prediction of the context model, wefound the average Al and A2 performances of 2,500simulated samples of 16 exemplar-based processors (Figure8A). Appendix C contains the details of this simulation. Onaverage, samples of exemplar-based processors show an 8%A2 advantage. They lie above the line of equal performanceonAl andA2.
In contrast, Figure 8B shows the 30 existing A1-A2results. The overall result from the 30 data sets seems to bethat there are Al advantages and A2 advantages that arescattered around equivalent A1-A2 performance. In fact,real participants have shown no overall performance advan-tage on A2. Al and A2 were performed equivalently over the30 data sets (83.0% correct for Al, SD = 0.106; 81.8%correct for A2, SD = 0.128).
Which data sets should show an A2 advantage? Butwhich data sets can fairly be included in a search for A2advantages? Echoing the concern raised earlier, if exemplartheory cannot be expected to describe the data producedunder deadline conditions, early in learning, or underprototype-based or rule-plus-exception instructions, thenone might not expect A2 advantages under those conditions.In fact, the concern is especially serious here, because the A2advantage has been so critical in motivating exemplar theoryand has offered the main demonstration that exemplartheory's predictions are qualitatively correct, not just quanti-tatively better.
Accordingly, we first excluded 10 of the performanceprofiles that might have been produced under instructionalsets that were less than ideal for fostering pure exemplarprocessing (e.g., specific instructions to use a prototype-based or rule-based strategy). On this basis, we set aside 4aiasets 4, 5,6,11,12,14,15, 17,18, and 25. Al and A2 werestill performed statistically equivalently (80.8% for Al,SD = 0.117;82.3%forA2,SZ> = 0.128), r(19) = -0.57,/u.
Next, we excluded eight data sets that related to earlystages of learning, to deadline conditions, or that might havecaused us to weight individual articles too heavily (forexample, by including multiple data sets from them). On thisbasis, we set aside data sets 3,19,20,21,22,27,28, and 29.Al and A2 were still performed statistically equivalently(82.3% for Al, SD = 0.095; 80.5% for A2, SD = 0.135),

THIRTY CATEGORIZATION RESULTS 19
A.
CM
1-1
(0 0.8-
| o . 6 H
C
o0) 0.4-
u«J 0.2-1
0)
I I I I I0 0.2 0.4 0.6 0.8 1
Performance on Stimulus A1
B.
CM<(0 0.8-j33
'43 0.6-(0
oCO 0 .4 -O
re0.2-
8.I
0.6I
0.80 0.2 0.4
Performance on Stimulus A1
Figw/ie 8. A: The A1-A2 performances of 2,500 simulatedsamples each containing 16 configurations of the context model(gray dots). See Appendix C for details. B: The observed A1-A2performances from the 30 data sets (black dots).
To address both concerns simultaneously, we excluded all18 data sets and focused on the 12 remaining, just as we didin the remodeling that led to Figures 5 and 6. On this basis,we set aside data sets 3,4,5,6,11? 12,14,15,17,18,19,20,21, 22, 25, 27, 28, and 29. Al and A2 were still performedstatistically equivalently (78.2% for A1, SD = 0.097; 80.3%focA2,SD = 0.140), t(ll) = -0.67, ns.
We point out again that theoretical implications wouldattend the need to exclude existing data to show the effectthat exemplar theory predicts. This need would narrow thescope of exemplar theory—in its research applications, in itsreal-world applications, and in its comprehensiveness inboth spheres. However, the A2 analyses on 12 and 30 datasets suggest identical conclusions. The earlier modeling on12 and 30 data sets suggested identical conclusions. Accord-ingly, it seems possible to treat the 5-4 data inclusively andto try to explain them broadly. Equivalent performance onAl and A2 is part of that broader data pattern.
This equivalence is important because the A2 result haslong been claimed to provide strong and definite support forthe systematic exemplar-to-exemplar comparisons assumedby exemplar theory. But the result is not consistent, robust,present overall, or even present within the 12 data sets thatshould most favor exemplar theory. We do not rule out thatfurther research will occasionally find the A2 advantage. Itwill. We do not rule out that further research could establishthe conditions that produce the A2 advantage robustly andconsistently. It may. This section only considers the presentstatus of the result. At present, the A2 advantage shouldprobably not be granted a place in the lore of the literature,and exemplar theory should be defended on other grounds.For example, one can rightly note that Al and A2 are only 2of the 16 stimuli in the 5-4 task and that overall the exemplarmodel does an excellent job of fitting the 5-4 data sets. Here,though, die problem of the previous section arises again—other models with different psychologies behind them fit aswell. The A2 advantage was so crucial theoretically becauseit qualitatively favored exemplar theory's assumptions alone.Letting that result go for the present is empirically correctbut has important theoretical implications.
Interpreting A2 advantages. Given the importance ofthis issue, we consider specifically the six data sets that haveshown clear A2 advantages and show that these data setscreate theoretical tensions and fit uncomfortably even withinexemplar theory's own framework.
Research using die context model has emphasized thatparticipants attend adaptively to die different features in atask and that the dimensional weights of the context modelreflect their attentional strategies (Nosofsky, 1984, 1986,1991; Nosofsky et al., 1994). In fact, Nosofsky (1987)demonstrated this in an elegant analysis using six differentcategory structures. Nosofsky (1984) also showed this usinga 5-4 data set (Data Set 6 in this article). Lamberts (1995)also showed this using his 5-4 data (Data Set 30 in thisarticle). It is important if participants "distribute attentionamong the component dimensions in a way that tends tooptimize performance" (Nosofsky, 1984, p. 109). It isimportant if the context model successfully describes thestretching and shrinking of psychological space that under-lies these attentional shifts.
Figure 9A shows optimal attention in die 5-4 task, asestimated by Lamberts (1995) and Nosofsky (1984). Itmakes sense that participants should focus their attention onDimensions 1 and 3, for these features have die highestdiagnosticities (.77) and offer the best information forsolving the 5-4 category set. It makes sense that participants

20 SMITH AND MINDA
A. Optimal Weights0.4-1
0.3-1
LU0.2-
Lamberts(1995)
Nosofsky(1984)
0.1 -
2 3Dimension
B. Additive Prototype Model0.4-1
£ 0.3-
III 0.2-
O)
0.1 -
Dimension
C. Context Model0.4-1
£ 0.3-
lil 0.2-
O)
0.1 -
Dimension
Figure 9. A. The dimensional weights of the context model thatoptimize performance in the 5-4 task, as reported by Lamberts(1995) and Nosofsky (1984). B. The prototype model's averagedimensional weights as it fit the data from the six 5-4 data sets thatshowed A2 advantages larger than 10%. C. The context model'saverage dimensional weights as it fit exactly (he same data.
should ignore Dimension 2, for this feature has the lowestdiagnosttcity (.55) and offers almost useless information forsolving the 5-4 category set.
But adaptive attention has a crucial performance implica-tion. If Dimension 2 is ignored, Stimuli Al (1 1 1 0) and A2
( 1 0 1 0 ) become functionally or formally equivalentbecause they are identical in all other respects. Accordingly,adaptive attention produces equivalent Al and A2 perfor-mance—that is—no A2 advantage.
This makes it clear why A2 advantages fit uncomfortablywithin the literature on exemplar theory. The literaturemakes one expect adaptive attention and no A2 advantages,but there they are. The A2 advantages go against theliterature's claims of adaptive attention, but there they are.Without judging how to resolve this tension, we point outthat A2 advantages create the tension and, instead of cleanlysupporting exemplar theory and the context model, raisedefinite questions.
In particular, one wonders how participants are attendingwhen they show occasional A2 advantages. Figure 9B showsthe average dimensional weights offered by the prototypemodel as it fit the six data sets that showed an A2 advantagethat was greater than 10%. Figure 9C shows the averagedimensional weights offered by the exemplar model as it fitexactly the same data. These figures underscore the theoreti-cal trouble that A2 advantages cause. If one accepts exem-plar theory's expectation of adaptive attention, one disbe-lieves the exemplar model's attentional description (Figure9C) and believes instead the prototype model's attentionaldescription (Figure 9B). If one accepts that A2 advantagesare the real and critical result, then one accepts the mal-adaptive attentional policy (Figure 9C) but places a pro-blematic result amidst the exemplar model's most elegantdemonstrations.
Figures 9B and 9C also raise an interesting possibilityabout future research in this area. The attentional descrip-tions offered by the exemplar and prototype models for thevery same data differ in striking ways. One of thesedescriptions is probably wrong, and this offers a possibleway to ask whether prototypes or exemplars ground perfor-mance in the 5-4 task.
Specialized Commitments of the 5-4Category Structure
In the final section of this article, we suggest that the 5-4category structure samples only one of the interestingregions in the universe of category tasks. It is a specializedstructure that for three reasons might favor a particular classof information-processing strategies.
Poor category differentiation. We have already dis-cussed that the 5-4 category structure contains features thatare poorly diagnostic of category membership, families ofexemplars that have a weak family-resemblance, and catego-ries that overlap substantially in multidimensional percep-tual space. Figure 10A shows the relatively impoverishedstructure offered by the 5-4 task. The figure summarizes asystematic search through die space of category structuresbased on binary features to illustrate the range of categorydifferentiation that is available to category researchers.Appendix C describes this simulation. The star marks thespot of the 5-4 category structure in this structural-ratiospace. The 5-4 task presents to participants a categorizationproblem with nearly the minimum structure within catego-

THIRTY CATEGORIZATION RESULTS 21
A.
I(0O
"5.•szs2
5I1
120-
100-
80-
60-
40-
20-
Structural Ratio (Additive)
B.
250-
20O-S2CO
a«150-LU
to
0 1 2 3 4 5 6 7
Number of Dimensions
Figure 10. A: The range of category differentiation potentiallyoffered by four-dimensional category structures (dark gray dots),six-dimensional category structures (medium gray dots), andeight-dimensional category structures (light gray dots). See Appen-dix C for details. The star shows the position of the 5-4 categorystructure in this larger space of category differentiation. B: Anillustration of the range of exemplar availability offered bycategory structures made from stimuli of different dimensionalities.The star shows the position of the 5-4 category structure in thislarger space of category sizes.
ries and differentiation between categories. This is true notonly of the 5-4 category structure but also of many relatedcategory structures that have been used in the literature.
This impoverished structure could lead participants tofocus on one dimension that categorizes most of the stimuli(it probably would not be Dimension 2) and to try tomemorize the exceptions created by that focus. Poor struc-ture could lead them to try to memorize all nine trainingexemplars because strategies based in family resemblance(whether grounded in exemplars or prototypes) will workpoorly. Thus, even though the impoverished category struc-tures exemplified by the 5-4 category structure representone theoretically interesting kind of category structure, theyare not theoretically neutral: They may encourage someinformation-processing strategies and defeat others. Thus,even if the strategies elicited by the 5-4 task are partiallybased in exemplar memorization, these strategies must begeneralized carefully and narrowly—perhaps only to otherpoorly differentiated category structures.
Accordingly, we hope that existing research will becomplemented by research on regions of structural-ratiospace that contain categories with stronger family resem-blance within categories and more differentiation betweencategories (Smith & Minda, 1998). In pursuing this goal, itmay be useful for researchers to study stimulus spaces ofhigher dimensionalities (Smith & Minda, 1998; Smith et al.,1997). Figure 10A shows that four-dimensional stimuligenerally constrain the researcher to focus on poorly differ-entiated category structures, whereas six- or eight-dimen-sional stimuli let die researcher sample other regions of thelarge space of possible category tasks.
Poor learnability. Poor differentiation may well have apsychological impact on participants. The 5-4 categorystructure is difficult to learn; participants often fail to reachthe preset learning criterion. For example, in Medin andSchaffer (1978, Experiments 2 and 3) only 33 of 64participants ever achieved one errorless run through die ninetraining stimuli. In Medin and Smith (1981), only 36 of 96participants ever achieved one errorless run. In contrast,participants in other studies have met a criterion of 36errorless trials (Hartley & Homa, 1981), 70 trials (Homa etal., 1981), or even 90 trials (Homa et al., 1979). The 5-4category structure presents to participants a very difficultcategorization problem.
This difficulty could also encourage special categorizationstrategies, possibly even exemplar-memorization strategiesonce again. If so, it is interesting that participants have thesestrategies available and turn to them when the categorygoing gets tough. But even if they do, it is important torealize that these strategies may only generalize to equallydifficult tasks that provide equally constant error messages.
Small exemplar sets. The 5-4 category structure is alsospecialized because it has only 9 training exemplars. Indeed,its whole stimulus set contains only 16 stimuli because justfour binary features are used. (This is why the 5-4 task has 7transfer items.) As one increases the dimensionality of thestimuli to six dimensions, to eight dimensions, and on, thesize of the available stimulus population and the size of thepossible categories grow exponentially, too. Figure 10B
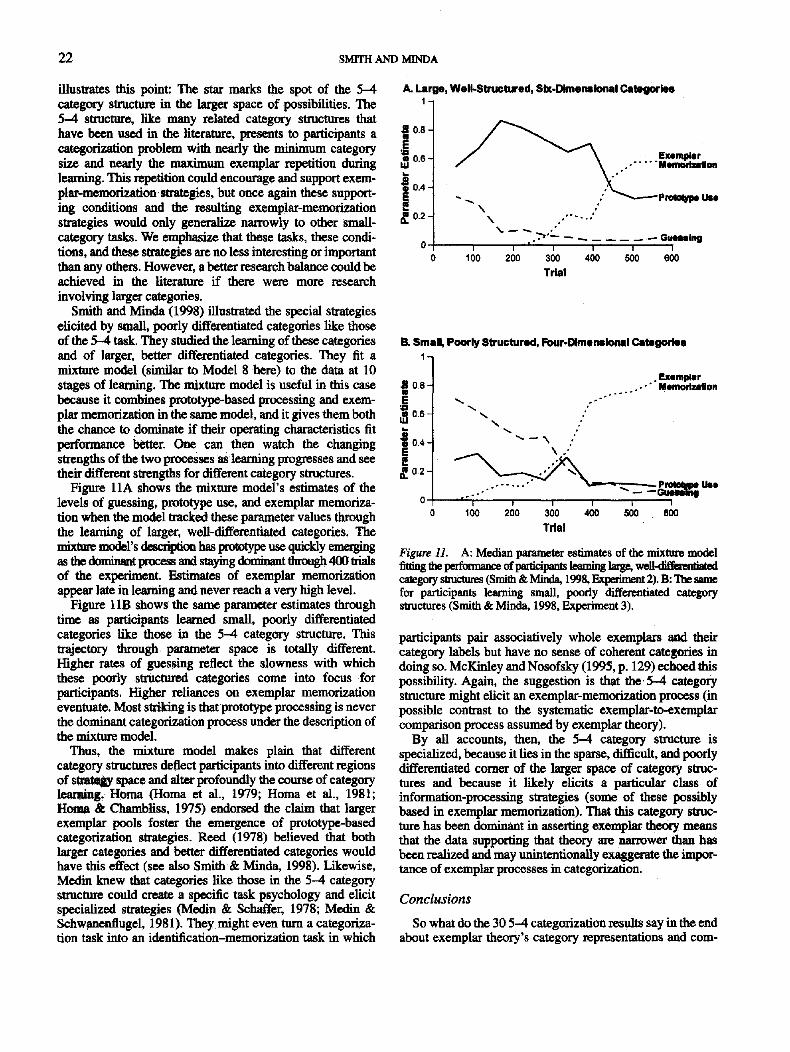
22 SMITH AND MINDA
illustrates this point: The star marks the spot of the 5-4category structure in the larger space of possibilities. Hie5-4 structure, like many related category structures thathave been used in the literature, presents to participants acategorization problem with nearly the minimum categorysize and nearly the maximum exemplar repetition duringlearning. This repetition could encourage and support exem-plar-memorization strategies, but once again these support-ing conditions and the resulting exemplar-memorizationstrategies would only generalize narrowly to other small-category tasks. We emphasize that these tasks, these condi-tions, and these strategies are no less interesting or importantthan any others. However, a better research balance could beachieved in the literature if there were more researchinvolving larger categories.
Smith and Minda (1998) illustrated the special strategieselicited by small, poorly differentiated categories like thoseof the 5-4 task. They studied the learning of these categoriesand of larger, better differentiated categories. They fit amixture model (similar to Model S here) to the data at 10stages of learning. The mixture model is useful in this casebecause it combines prototype-based processing and exem-plar memorization in the same model, and it gives them boththe chance to dominate if their operating characteristics fitperformance better. One can then watch the changingstrengths of the two processes as learning progresses and seetheir different strengths for different category structures.
Figure 11A shows the mixture model's estimates of thelevels of guessing, prototype use, and exemplar memoriza-tion when the model tracked these parameter values throughthe learning of larger, well-differentiated categories. Themixture model's description has prototype use quickly emergingas the dominant process and staying dominant through 400 trialsof the experiment. Estimates of exemplar memorizationappear late in learning and never reach a very high level.
Figure I IB shows the same parameter estimates throughtime as participants learned small, poorly differentiatedcategories like those in the 5-4 category structure. Thistrajectory through parameter space is totally different.Higher rates of guessing reflect the slowness witih whichthese poorly structured categories come into focus forparticipants. Higher reliances on exemplar memorizationeventuate. Most striking is thatprototype processing is neverthe dominant categorization process under the description ofthe mixture model.
Thus, the mixture model makes plain that differentcategory structures deflect participants into different regionsof strategy space and alter profoundly the course of categorylearning. Homa (Homa et al., 1979; Homa et al., 1981;Horaa & Chambliss, 1975) endorsed the claim that largerexemplar pools foster the emergence of prototype-basedcategorization strategies. Reed (1978) believed that bothlarger categories and better differentiated categories wouldhave this effect (see also Smith & Minda, 1998). Likewise,Medin knew that categories like those in the 5-4 categorystructure could create a specific task psychology and elicitspecialized strategies (Medin & Schaffer, 1978; Medin &Schwanenflugel, 1981). They might even turn a categoriza-tion task into an identification-memorization task in which
A. Large, Well-Structured, Sbc-Dtmensiona.1 Categories
B 0.8-
•J0.6H
I °-4~£0.2-
ExamplarMemorization
Prototype Ut»
Gucuing
100 200 300
Trial400 500 600
B. Small, Poorly Structured, Four-Dime r» tonal Categories
0.8-. Exemplar
. ' - ' Memorization
"5 0.4-
£0.2-
0-|c
1
100r
200
— \\
i
300
" \
400i
500
— PrototVMU**—Guamna
600
Trial
Figure 11. A: Median parameter estimates of the mixture modelfitting the performance of participants Learning large, well-differentiatedcategory structures (Smith & Minda, 1998, Experiment 2). B: The samefor participants learning small, poorly differentiated categorystructures (Smith & Minda, 1998, Experiment 3).
participants pair associatively whole exemplars and theircategory labels but have no sense of coherent categories indoing so. McKinley and Nosofsky (1995, p. 129) echoed thispossibility. Again, the suggestion is that the 5-4 categorystructure might elicit an exemplar-memorization process (inpossible contrast to the systematic exemplar-to-exemplarcomparison process assumed by exemplar theory).
By all accounts, then, the 5-4 category structure isspecialized, because it lies in the sparse, difficult, and poorlydifferentiated corner of the larger space of category struc-tures and because it likely elicits a particular class ofinformation-processing strategies (some of these possiblybased in exemplar memorization). That this category struc-ture has been dominant in asserting exemplar theory meansthat the data supporting that theory are narrower than hasbeen realized and may unintentionally exaggerate the impor-tance of exemplar processes in categorization.
Conclusions
So what do the 30 5-4 categorization results say in the endabout exemplar theory's category representations and com-

THIRTY CATEGORIZATION RESULTS 23
parison processes? The formal problem facing all the modelsis to explain the old-item practice effect in the 5-4 data. Thisproblem exists apart from how intuitive that practice effectis. The only advantage the context model has in fitting the 30data sets, compared with the simplest prototype model, isthat it accommodates this practice effect. However, severalmodels, making different process and representationalassumptions, accommodate this practice effect, too. Thusone need not assume the prototypeless category represen-tations of exemplar theory to explain the 5-4 data. Proto-types combined with a practice effect suffices. One neednot assume the systematic exemplar-to-exemplar compari-sons of the context model. A simpler process—exemplarmemorization—suffices.
This equivalence of prototype and exemplar representa-tions, and of simple and complex exemplar processes,explains the critical importance of the A2 result to exemplartheory. For this result could qualitatively favor exemplarrepresentations and a complex exemplar process. But the A2advantage is neither present overall nor in the data sets thatshould most support exemplar theory.
In the end, it is clear that the 5—4 data sets do not offerunambiguous support for exemplar theory. This raisestheoretical concern because the 5-4 category structure wasso prominent in fostering exemplar theory and because the5^4 categories represent so well the difficult, sparse, andpoorly differentiated category structures that should mostfavor exemplar theory. If questions about exemplar theoryarise here, then questions arise even more definitely aboutexemplar theory's breadth and extension.
Unfortunately, one cannot presently judge that breadthand extension. For the literature has focused sharply oncategories like the 5-4 structure that are sparse, undifferenti-ated, and difficult. It will be constructive in the future tocomplement this research with research on more learnableand larger categories. This research could test the extensionof exemplar theory, prototype theory, and other theories. Itcould suggest a broader theory of human categorization thatemphasizes the richness and range of humans' approaches tocategory tasks (Homa, 1984; Reed, 1978; Smith & Minda,1998). This research could even double back in the end andfinally help these 30 categorization results in their search fora model.
References
Ashby, F. G., & Gott, R. E. (1988). Decision rules in the perceptionand categorization of multidimensional stimuli. Journal ofExperimental Psychology: Learning, Memory, and Cognition,14, 33-53.
Hartley, J., & Homa, D. (1981). Abstraction of stylistic concepts.Journal of Experimental Psychology: Learning, Memory, andCognition, 7, 33-46.
Homa, D. (1984). On the nature of categories. The Psychology ofLearning and Motivation, 18,49-94.
Homa, D., & Chambliss, D. (1975). The relative contributions ofcommon and distinctive information on the abstraction fromill-defined categories. Journal of Experimental Psychology:Human Learning and Memory, 1, 351-359.
Homa, D., Rhoads, D., & Chambliss, D. (1979). Evolution of
conceptual structure. Journal of Experimental Psychology: Hu-man Learning and Memory, 5, 11-23.
Homa, D., Sterling, S., & Trepel, L. (1981). Limitations ofexemplar-based generalization and the abstraction of categoricalinformation. Journal of Experimental Psychology: Human Learn-ing and Memory, 7, 418-439. ,
Kmschke, J. K. (1992). ALCOVE: An exemplar-based connection-ist model of category learning. Psychological Review, 99,22-44.
Lamberts, K. (1994). Flexible tuning of similarity in exemplar-based categorization. Journal of Experimental Psychology:Learning, Memory, and Cognition, 20,1003-1021.
Lamberts, K. (1995). Categorization under time pressure. Journalof Experimental Psychology: General, 124, 161-180.
Maddox, W. T., & Ashby, G. (1993). Comparing decision boundand exemplar models of categorization. Perception & Psycho-physics, 53,49-70.
McKinley, S. C , & Nosofsky, R. M. (1995). Investigations ofexemplar and decision bound models in large, ill-defined cat-egory structures. Journal of Experimental Psychology: HumanPerception and Performance, 21, 128-148.
McKinley, S. G, & Nosofsky, R. M. (1996). Selective attention andthe formation of linear decision boundaries. Journal of Experi-mental Psychology: Human Perception and Performance, 22,294-317.
Medin, D. L. (1975). A theory of context in discrimination learning.In G. H. Bower (Ed.), The psychology of learning and motivation(Vol. 9, pp. 269-315). New York: Academic Press.
Medin, D. L., Altom, M. W., & Murphy, T. D. (1984). Given versusinduced category representations: Use of prototype and exem-plar information in classification. Journal of ExperimentalPsychology: Learning, Memory, and Cognition, 10, 333-352.
Medin, D. L., Dewey, G. I., & Murphy, T. D. (1983). Relationshipsbetween item and category learning: Evidence that abstraction isnot automatic. Journal of Experimental Psychology: Learning,Memory, and Cognition, 9, 607-625.
Medin, D. L., & Schaffer, M. M. (1978). Context theory ofclassification learning. Psychological Review, 85, 207-238.
Medin, D. L., & Schwanenflugel, R J. (1981). Linear separability inclassification learning. Journal of Experimental Psychology:Human Learning and Memory, 7, 355-368.
Medin, D. L., & Smith, E. E. (1981). Strategies and classificationlearning. Journal of Experimental Psychology: Human Learningand Memory, 7, 241-253.
Mervis, C. B., & Rosen, E. (1981). Categorization of naturalobjects. Annual Review of Psychology, 32, 89-115.
Minda, J. P., & Smith, J. D. (1999). Prototypes in categorylearning. Manuscript submitted for publication.
Nosofsky, R. M. (1984). Choice, similarity, and the context theoryof classification. Journal of Experimental Psychology: Learning,Memory, and Cognition, 10, 104-114.
Nosofsky, R. M. (1986). Attention, similarity, and the identification-categorization relationship. Journal of Experimental Psychol-ogy: General, 115, 39-57.
Nosofsky, R. M. (1987). Attention and learning processes in theidentification and categorization of integral stimuli. Journal ofExperimental Psychology: Learning, Memory, and Cognition,13, 87-108.
Nosofsky, R. M. (1988). Similarity, frequency, and categoryrepresentations. Journal of Experimental Psychology: Learning,Memory, and Cognition, 14, 54—65.
Nosofsky, R. M. (1991). Tests of an exemplar model for relatingperceptual classification and recognition memory. Journal ofExperimental Psychology: Human Perception and Performance,17, 3-27.
Nosofsky, R. M. (1992). Exemplars, prototypes, and similarity

24 SMITH AND MINDA
rules. In A. F. Healy, S. M. Kosslyn, & R. M. Shiffrin (Eds.),From learning theory to connectionist theory: Essays in honor ofWilliam K. Estes (pp. 149-167). Hillsdale, NJ: Erlbaum.
Nosofcky, R. M , Kruschke, J. K., & McKinley, S. C. (1992).Combining exemplar-based category representations and connec-tion ist learning rules. Journal of Experimental Psychology:Learning, Memory, and Cognition, 18, 211-233.
Nosofsky, R. M., Palmeri, T. J., & McKinley, S. K. (1994).Rule-plus-exception model of classification learning. Psychologi-cal Review, 101,55-79.
Palmeri, T. J., & Nosofsky, R. M. (1995). Recognition memory forexceptions to the category rule. Journal of Experimental Psychol-ogy: Learning, Memory, and Cognition, 21, 548-568.
Posner, M. I., & Keele, S. W. (1968). On the genesis of abstractideas. Journal of Experimental Psychology, 77, 353-363.
Posner, M. I., & Keele, S. W. (1970). Retention of abstract ideas.Journal of Experimental Psychology, 83, 304-308.
Reed, S. K. (1978). Category vs. item learning: Implications forcategorization models. Memory & Cognition, 6, 612-621.
Rosen, B. (1973). On the internal structure of perceptual andsemantic categories. In T. E. Moore (Ed.), Cognitive develop-ment and the acquisition of language (pp. 111-144). New York:Academic Press.
Rosch, E. (1975). Cognitive reference points. Cognitive Psychol-ogy, 7, 192-238.
Rosch, E., & Mervis, C. B. (1975). Family resemblances: Studiesin the internal structure of categories. Cognitive Psychology, 7,573-605.
Smith, J. D., & Minda, J. P. (1998). Prototypes in the mist: Theearly epochs of category learning. Journal of ExperimentalPsychology: Learning, Memory, and Cognition, 24, 1411-1430.
Smith, J. D., Murray, M. I , & Minda, J. P. (1997). Straight talkabout linear separability. Journal of Experimental Psychology:Learning, Memory, and Cognition, 23,659-680.

THIRTY CATEGORIZATION RESULTS 25
I
iillilllllilll
en cacf lc f lcncQuwbia > c f l t f l c f l c f l t & " g £ U U U y U U O Q
gI
« —c ^ S 15 ̂ S
(197
8)
M%o
en
edi
981)
-S'3en
c
edi
[198
3M
urph
y 1
u
Qc*
edi
S
1984
)
fEa
s

26 SMITH AND MINDA
Appendix B
Category A Response Probabilities for 16 Stimuli
Dataset
123456789
101112131415161718192021222324252627282930
1110
0.780.970.970.890.770.810.690.660.680.730.950.880.730.940.890.730.880.780.840.530.930.970.930.770.940.810.850.850.850.90
Category Atraining stimuli
1010
0.880.970.970.940.970.750.770.470.610.880.880.800.840.750.730.840.670.600.920.780.901.001.000.781.000.840.760.770.720.75
1011
0.810.920.920.940.980.950.920.560.740.950.980.950.890.910.890.840.810.840.930.750.951.001.000.830.970.860.850.940.960.97
1101
0.880.810.810.720.700.770.500.500.770.770.940.810.750.910.730.810.860.750.910.820.850.951.000.640.980.700.620.770.860.95
0111
0.810.720.720.780.600.800.770.310.350.730.920.840.700.860.700.730.880.750.780.700.600.880.930.610.920.720.720.720.770.90
1100
0.160.330.330.270.550.420.360.470.680.250.280.310.250.310.300.220.340.210.130.350.050.180.000.390.130.320.500.430.350.23
Category Btraining stimuli
0110
0.160.280.280.300.280.300.480.470.350.200.230.340.310.340.190.380.250.220.210.350.250.100.150.410.060.310.510.330.290.20
0001
0.120.030.030.090.170.250.220.310.160.230.080.160.190.090.170.220.090.280.080.200.070.030.000.210.020.200.270.200.210.19
0000
0.030.050.050.050.130.110.090.410.360.060.050.020.160.060.020.170.110.120.110.250.120.000.050.150.020.110.210.110.080.04
1001
0.590.720.720.450.730.620.590.580.720.620.610.750.550.500.670.420.500.750.640.620.650.620.650.560.940.630.530.580.620.59
1000
0.310.560.560.200.650.310.410.550.660.500.280.340.410.090.340.470.170.230.450.530.420.420.420.410.690.380.460.340.240.23
Transfer stimuli
1111
0.940.980.980.880.870.890.870.690.760.860.980.940.800.920.920.770.950.860.830.700.820.900.900.820.940.850.890.990.990.99
0010
0.340.230.230.580.220.340.490.410.160.340.140.200.470.310.270.480.270.230.480.450.450.550.450.400.030.340.370.280.290.33
0101
0.500.270.270.080.280.310.300.520.310.420.360.420.390.550.420.520.440.340.560.750.400.500.600.320.140.320.430.370.500.43
0011
0.620.390.390.750.520.620.570.500.350.590.610.670.610.500.560.580.550.590.560.530.450.650.620.530.320.590.570.580.590.60
0100
0.160.090.090.120.120.200.200.310.320.060.090.060.220.160.050.340.140.170.180.230.170.200.120.200.080.190.270.170.110.14
Appendix C
Details of Simulations
The Context Model's Prediction of an A2 AdvantageThis simulation's goal was to create samples of 16 participants
who obeyed the assumptions of the context model and to use thesesamples to show the range of A1-A2 performance profiles that themodel predicts. To build each simulated group, we chose first aninitial random configuration of the context model (i.e., a randomlychosen sensitivity and guessing rate and a random set of attentionalweights that summed to 1.0). Then, we created 15 other simulatedperformers by treating the initial parameter setting as the mean of aGaussian distribution with standard deviations of 5.0 for sensitiv-ity, 0.10 for guessing, and 0.20 for the attentional weights, and bychoosing 15 other configurations (each with its own sensitivity,guessing rate, and attentional weights summing to 1.0) in a waythat obeyed the probability-density functions around these means.
This ensured that each simulated sample contained 16 simulatedperformers who had a kind of family resemblance to theirperformance strategy because they shared roughly equivalentlevels of guessing and sensitivity, and because they shared a similarattentional strategy.
Structural-Ratio Space
This simulation's goal was to illustrate the range of categorystructure that is attainable using binary features as in the 5-4 task.To be fair to current ideas about similarity, and to the modelsconsidered in this article, we calculated the measure of categorystructure (structural ratio) additively and multiplicatively. Wecalculated the structural ratio using the similarity of exemplars toexemplars, both within-category (including exemplar sclf-identi-

THIRTY CATEGORIZATION RESULTS 27
ties) and between-category. In eveiy case we assumed homoge-neous attention across the dimensions in the task. We constructedcategories using four, six, or eight binary dimensions, and withfour, seven, or nine exemplars, respectively. Category memberswere always derived from the nominal category prototypes ofl l l l a n d O 0 0 0 , l l l l l l a n d 0 0 0 0 0 0 , o r l l l l l l l l a n d0 0 0 0 0 0 0 0 .
Searching these structural-ratio spaces exhaustively is not fea-sible; for example, the eight-dimensional space contains about 1019
Category A sets. Searching these spaces by choosing categorystructures randomly is misleading because chance will not producethe well- and poorly structured categories that a researcher mightconstruct. Thus we chose to search structural-ratio space systemati-cally, but to sample only a limited number of representativecategory tasks from each region of the space.
To conduct this search, we varied the typicality of the exemplarsincluded in categories. For example, the stimuli 1 1 1 1 , 1 1 1 0 ,1 1 0 1, and 0 1 1 1 are typical stimuli: Their inclusion willgenerally produce higher structural ratios for a category task. Thestimuli 1 0 1 0,0 0 1 1,1 0 0 1, and 1 1 0 0 are less typical stimuli:Their inclusion will generally produce lower structural ratios for acategory task. By marrying the different levels of typicality intocategory tasks, by using different mixes, and by sampling allpossible mixes, we made the search systematic but kept it limited,because a given mix will produce about the same structural ratioeven if the specific stimuli change.
To illustrate our technique for the case of eight dimensions, wedivided the eight-dimensional stimuli into high-typicality items(those with 8 or 7 prototypical features), mid-typicality items
(those with 6 prototypical features), and low-typicality items (thosewith 5 or 4 prototypical features). Then we generated 54 selectionprocedures—8 10,8 0 1,7 2 0 , . . . , and 0 0 9—that specified howmany items at each level of typicality would be included in eachcategory. The first of these (8 1 0) included eight high-typicalityitems and one mid-typicality item to produce categories with highstructural ratios. The last of these (0 0 9) included nine low-typicality items to produce categories with low structural ratios. Weexamined 20 stimulus sets for each mix, for a total of 1,080stimulus sets that illustrated the range of structure available ineight-dimensional tasks.
Similarly, we divided the six-dimensional stimuli into high-typicality items (with 6 or 5 prototypical features), mid-typicalityitems (with 4 prototypical features), and low-typicality items (with3 prototypical features), generated 35 selection procedures—6 10,6 0 1 , 5 2 0 , 5 1 1 , 5 0 2, . . . , a n d 0 0 7—that specified the mix ofdifferent typicalities, and examined 30 stimulus sets for each mixfor a total of 1,050 stimulus sets.
Similarly, we divided the four-dimensional stimuli into high-typicality items (with 4 or 3 prototypical features) and low-typicality items (with 2 prototypical features). We then generatedthree selection procedures—3 1,2 2,1 3—that specified the mix ofdifferent typicalities and examined 400 stimulus sets for each mixfor a total of 1,200 stimulus sets.
Received May 18,1998Revision received April 8,1999
Accepted April 22,1999
Low Publication Prices for APA Members and Affiliates
Keeping you up-to-date. All APA Fellows, Members, Associates, and Student Affiliatesreceive—as part of their annual dues—subscriptions to the American Psychologist andAPA Monitor. High School Teacher and International Affiliates receive subscriptions tothe APA Monitor, and they may subscribe to the American Psychologist at a significantlyreduced rate. In addition, all Members and Student Affiliates are eligible for savings of upto 60% (plus a journal credit) on all other APA journals, as well as significant discounts onsubscriptions from cooperating societies and publishers (e.g., the American Association forCounseling and Development, Academic Press, and Human Sciences Press).
Essential resources. APA members and affiliates receive special rates for purchases ofAPA books, including the Publication Manual of the American Psychological Association,and on dozens of new topical books each year.
Other benefits of membership. Membership in APA also provides eligibility forcompetitive insurance plans, continuing education programs, reduced APA convention fees,and specialty divisions.
More information. Write to American Psychological Association, Membership Services,750 First Street, NE, Washington, DC 20002-4242.