fog: grease to energy - california water environment ... · fog: grease to energy robert a....
TRANSCRIPT

Santa Ana River Basin SectionSanta Ana River Basin SectionCALIFORNIA WATER ENVIRONMENT ASSOCIATION
Air, Water & Energy Sustainability for , gy yWastewater Treatment Plants
FOG: Grease to EnergyFOG: Grease to Energy
Robert A. Gillette, P.E., BCEEJune 11, 2009
rc1104mrwpca.ppt

Overview
1. The FOG Sewer Problem
2. Research
3. Design Considerations
4 Installations4. Installations
5. Questions?Q
Filename.ppt

Two-Phase Di ti
Two-Phase Di ti
FOG Sewer Problem
FOG Sewer ProblemDigestion OverviewDigestion Overview
rc301nwea.ppt

FOG Problem
State and Fede al p sh to eliminate 1. State and Federal push to eliminate sanitary sewer overflows
2 Grease plugging causes overflows2. Grease plugging causes overflows3. Grease cleaning costs us all
R it f th 4. Remove it from the sewers
Filename.ppt

Two-Phase Di ti
Two-Phase Di ti
How to get FOG Out of your Sewers
How to get FOG Out of your Sewers
Digestion OverviewDigestion Overview
yy
rc301nwea.ppt

The FOG Problem - Education
Fl e s1. Flyers2. Restaurant Training and
Maintenance SheetsMaintenance Sheets3. Best Management Practices
Filename.ppt

Volatile Solids Loading Rate
Filename.ppt
Filename.ppt

Help Your Restaurantswith BMP’s and Charts
Filename.ppt

FOG Problem – Education Alone is not Enoughis not Enough
Implement an O dinance1. Implement an Ordinance2. Provide them with Design
Standards for Grease TrapsStandards for Grease Traps3. Require documentation of
compliancecompliance4. Develop a Data Base
Filename.ppt

Two-Phase Di ti
Two-Phase Di ti ResearchResearchDigestion OverviewDigestion Overview
rc301nwea.ppt
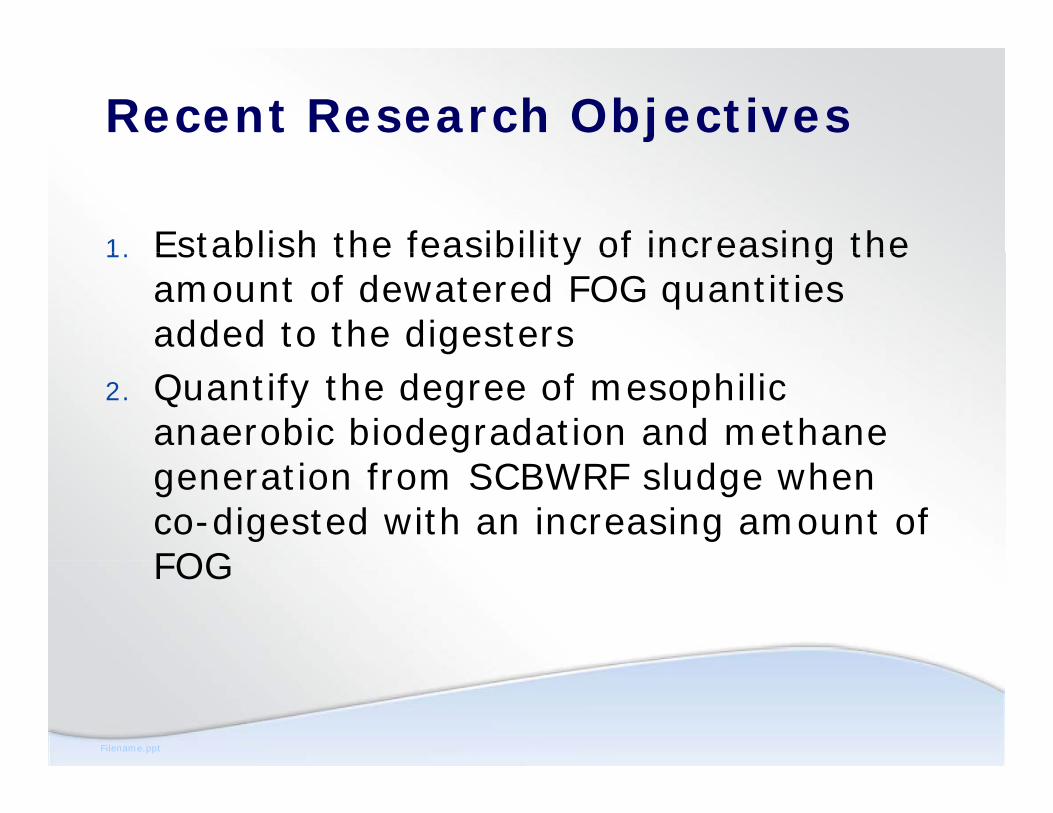
Recent Research Objectives
1 Establish the feasibility of increasing the 1. Establish the feasibility of increasing the amount of dewatered FOG quantities added to the digesters
2. Quantify the degree of mesophilic anaerobic biodegradation and methane generation from SCBWRF sludge when co-digested with an increasing amount of FOGFOG
Filename.ppt

Approach
1.Perform parallel laboratory-scale batch e o pa a e abo ato y sca e batcdigestion of sludge without FOG and with increasing amounts of FOG
Ph 1 E i ti G T h i bi l d a. Phase 1 – Existing Ga. Tech microbial seed culture not acclimated to FOG
b. Phase 2 – Using seed culture acclimated to gFOG during phase 1
2.Perform parallel semi-continuous feed laboratory scale digestion of sludge with laboratory-scale digestion of sludge with and without FOGa. Phase 3 – Using seed culture acclimated to
Filename.ppt
gFOG during phase 2

Reactor VS LoadingSample
VS Loading, % of Total Total VS Load, kg/m3
(% FOG VS)PS Mix TWAS Cake FOGP FOGL
1. Seed Blank − − − − − −
2. PS 100% − − − − 3.0
3. TWAS − 100% − − − 3.0
4. Cake − − 100% − − 3.0
5 FOG 100% 2 395. FOGP − − − 100% − 2.39
6. FOGL − − − − 100% 3.0
7. PS + TWAS 39% 61% − − − 3.0
8. PS + TWAS + C 28% 44% 29% − − 3.0
9. PS + TWAS + FOGP 28% 53% − 14% − 3.48 (14%)
10. PS + TWAS + FOGL 31% 49% − − 20% 3.75 (20%)
11. PS+ TWAS+ 0.5 FOGP+ 0.5 FOGL 32% 51% − 7% 10% 3.62 (17%)
12 PS + TWAS + FOG + FOG 27% 43% 11% 18% 4 23 (29%)12. PS + TWAS + FOGP + FOGL 27% 43% − 11% 18% 4.23 (29%)
13. PS + TWAS + C + FOGP 24% 38% 25% 14% − 3.48 (14%)
14. PS + TWAS + C + FOGL 22% 35% 23% − 20% 3.75 (20%)
15. PS+WAS+C +0.5FOGP +0.5FOGL 23% 36% 24% 7% 10% 3.62 (17%)
Filename.ppt
16. PS + TWAS + C + FOGP + FOGL 20% 31% 20% 11% 18% 4.23 (29%)
1 kg/m3 = 0.0625 lb/ft3
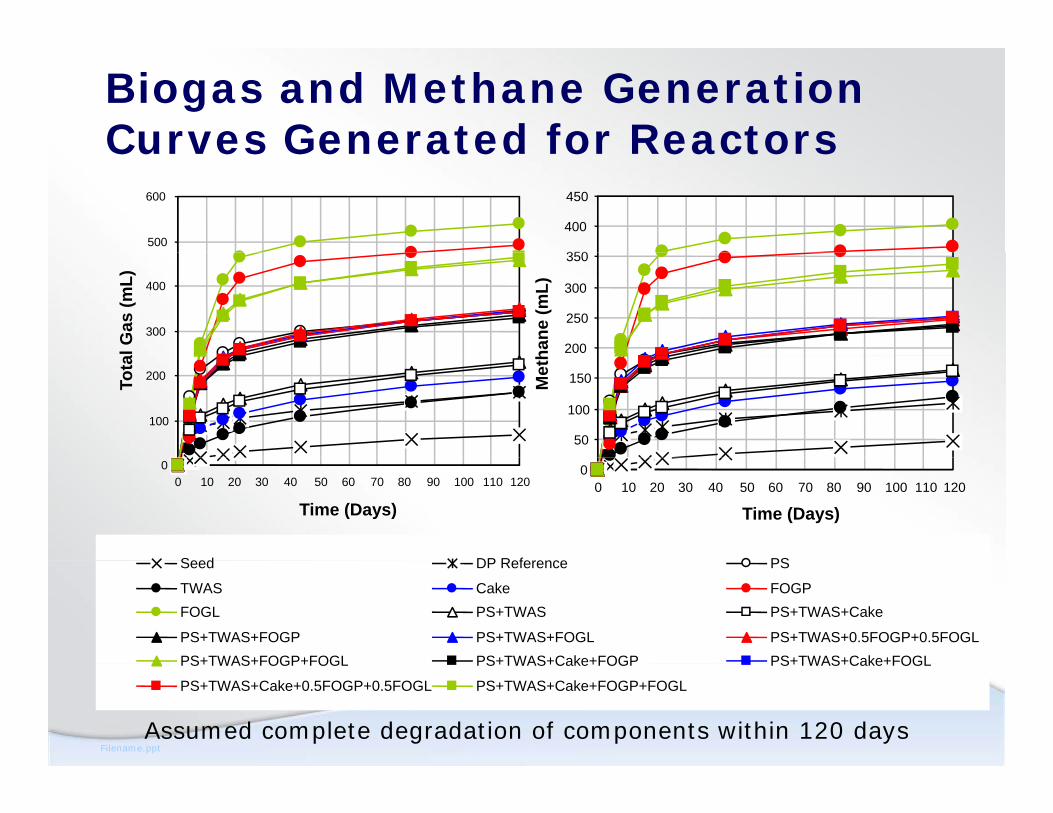
Biogas and Methane Generation Curves Generated for ReactorsCurves Generated for Reactors
500
600
350
400
450
300
400
l Gas
(mL)
200
250
300
350
hane
(mL)
100
200Tota
50
100
150Met
h
00 10 20 30 40 50 60 70 80 90 100 110 120
Time (Days)
00 10 20 30 40 50 60 70 80 90 100 110 120
Time (Days)
Seed DP Reference PSSeed DP Reference PS
TWAS Cake FOGPFOGL PS+TWAS PS+TWAS+Cake
PS+TWAS+FOGP PS+TWAS+FOGL PS+TWAS+0.5FOGP+0.5FOGLPS+TWAS+FOGP+FOGL PS+TWAS+Cake+FOGP PS+TWAS+Cake+FOGL
Filename.ppt
PS+TWAS+FOGP+FOGL PS+TWAS+Cake+FOGP PS+TWAS+Cake+FOGL
PS+TWAS+Cake+0.5FOGP+0.5FOGL PS+TWAS+Cake+FOGP+FOGL
Assumed complete degradation of components within 120 days

The Methane Production of the Components Was CalculatedComponents Was Calculated
SampleReactor
Seed PS TWAS Cake FOGP FOGL
Biogas produced, mL @ 35oC 68.0 342.3 164.0 198.0 490.0 539.5
Methane produced, mL @ 35oC 45.9 237.0 118.6 146.4 367.6 402.4
Methane, % 67.5 69.2 72.3 73.9 75.0 74.6
Biogas produced, L @ STP/kg component VS addedd 680 248 335 1,324 1,177
Methane, L @ STP/kg component VS addedd 470 179 247 993 878
Normalized methane, L @ STP/kg component VS addedd 2.6 1.00 1.4 5.5 4.9
Methane L @ STP/kg component VS destroyedd 830 767 928 1 404 1 121Methane, L @ STP/kg component VS destroyedd 830 767 928 1,404 1,121
Normalized methane, L @ STP/kg component VS destroyedd 1.1 1.00 1.2 1.8 1.5
Biogas produced, L @ STP/kg component TS addedd 536 163 217 1,278 897
Methane L @ STP/kg component TS addedd 370 118 160 958 669Methane, L @ STP/kg component TS added 370 118 160 958 669
Normalized methane, L @ STP/kg component TS addedd 3.1 1.0 1.4 8.1 5.7
Methane yield for FOG samples compared to the TWAS sample was
Filename.ppt
Methane yield for FOG samples compared to the TWAS sample was about 5 times higher on a VS basis and was about 8 times higher on
a TS basis for FOGP

FOG and Sludge Destruction
0.9
1.0
0.7
0.8
D D
estro
yed
PSTWAS
0 4
0.5
0.6
grad
able
CO TWAS
CakeFOGPFOGLk = 0.20 1/d
0.2
0.3
0.4
actio
n of
Deg k = 0.15 1/d
k = 0.10 1/dk = 0.05 1/dk = 0.04 1/dk = 0.03 1/d
0.0
0.1
0 10 20 30 40 50 60 70 80 90 100 110 120
Fra
k = 0.02 1/d
Filename.ppt
Time (Days)

Detention Time
Total VFATotal VFA
3000 3500 4000
VFA (m
Control
FOG
VFA
m
10001500 2000 2500 (
gCOD/L)
FOGmg
COD
0 500
1000
0 5 10 15 20 25 30
D
/
l
0 5 10 15 20 25 30Time (days)
Filename.ppt

FOG Research General Findings
1. Rates of Destruction: FOGL ~ FOGP ~ PS > TWAS
2. Following an initial period of 3 to 5 days, FOG degradation followed approximately first-order degradation followed approximately first-order kinetics with a rate constant in the range of 0.10 to 0.1590% FOG d t ti h d ithi 18 d 3. 90% FOG destruction reached within ~ 18 days batch digestion
4. TWAS: The first 25% destruction was fast (~ S e st 5% dest uct o as ast (0.10 1/d), then very slow (~ 0.02 1/d), indicating a very large refractory fraction (significant aerobic digestion occurs during high-SRT aeration
Filename.ppt
aerobic digestion occurs during high SRT aeration at high mixed liquor temperature)

Two-Phase Di ti
Two-Phase Di ti
Design Considerations
Design Considerations
Digestion OverviewDigestion Overview
rc301nwea.ppt

Design Considerations
1 Volume of grease per day1. Volume of grease per daya. Grease holding tank sizeb. VS loading of digesterg g
2. Percent grease/water in truck load
3 Grease conversion to digester gas3. Grease conversion to digester gasa. Cubic-feet (cf) per pound (lb) VS feedb. BTU content of gasb. BTU content of gas
Filename.ppt

Design Considerations
1 Digester mixing requirements – fear of 1. Digester mixing requirements fear of grease collection at top of digester
2. Grease holding tank mixing (chopper G ease o d g ta g (c oppepump)
3. Heating may not be requiredg y q4. FOG metering into digester5. Odor5. Odor
Filename.ppt

Design Considerations
1 Capital cost1. Capital cost2. How to get it built3 Intake screen or grinder3. Intake screen or grinder4. Two access manways5 Liquid decanting?5. Liquid decanting?6. Hauler rinse system7 Overfill alarms7. Overfill alarms
Filename.ppt

Two-Phase Di ti
Two-Phase Di ti
InstallationsInstallationsDigestion OverviewDigestion Overview
rc301nwea.ppt

Pinellas County FLPinellas County FLPinellas County, FLPinellas County, FL
Filename.ppt

Pinellas - Polymer FOG Dewatering
FOG is Received and FOG is Received and Dewatered at the County Solids Waste FOGFacility Using Polymer Addition and Overnight
FOG Dewatering
ScreenContainers
and Overnight Gravity Drainage
Dewatered FOGDewatered FOG Transportation
Container
Filename.ppt
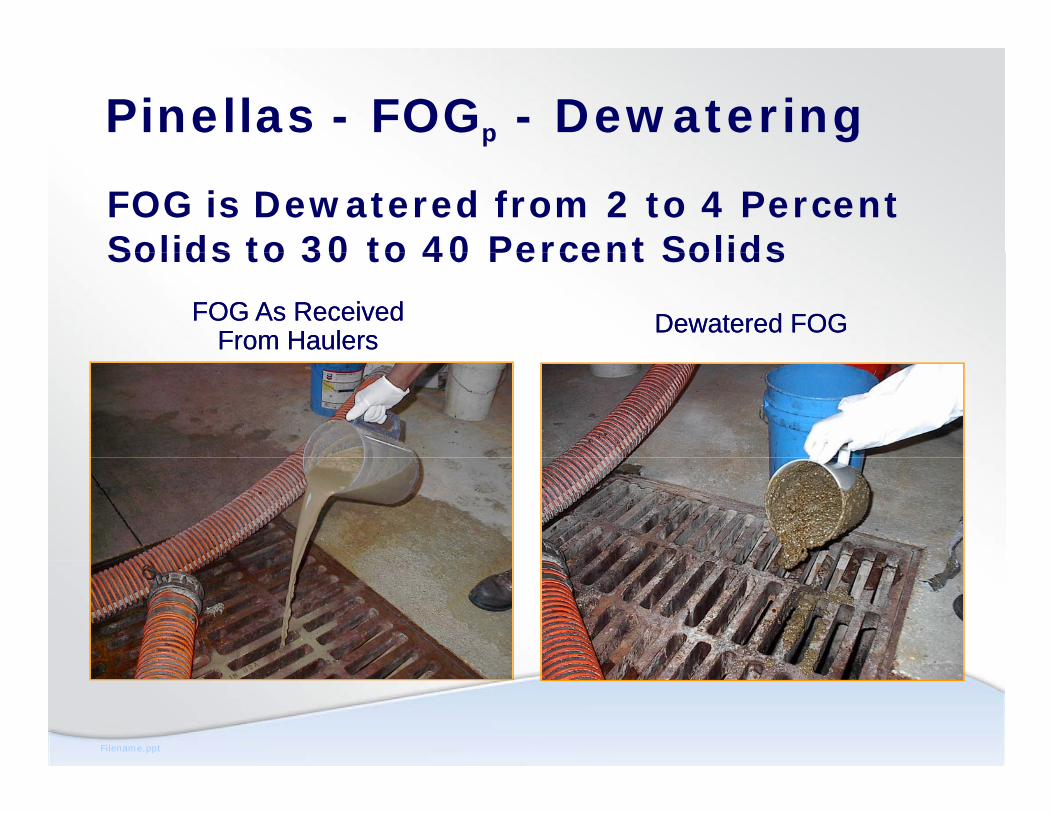
Pinellas - FOGp - Dewatering
FOG is Dewatered from 2 to 4 Percent Solids to 30 to 40 Percent SolidsSolids to 30 to 40 Percent Solids
FOG As Received FOG As Received From HaulersFrom Haulers Dewatered FOGDewatered FOG
Filename.ppt

Pinellas - FOGp – Polymer Dewatering
FOGFOG Dewatering
ScreenContainers
Dewatered FOGDewatered FOG Transportation
Container
Filename.ppt

Pinellas - FOGp – Polymer Dewatering
FOGFOG Dewatering
ScreenContainers
Dewatered FOGDewatered FOG Transportation
Container
Filename.ppt

Pinellas - FOGp Receiving System1. Desire to reduce NG purchase for dryer2. Need to get rid of FOG
FOGFOG Dewatering
ScreenContainers
Dewatered FOGDewatered FOG Transportation
Container
Filename.ppt

Pinellas - FOGp Receiving
Filename.ppt

Pinellas - FOGp - Off Loading
Filename.ppt

Pinellas - FOGp - Unloading
Filename.ppt
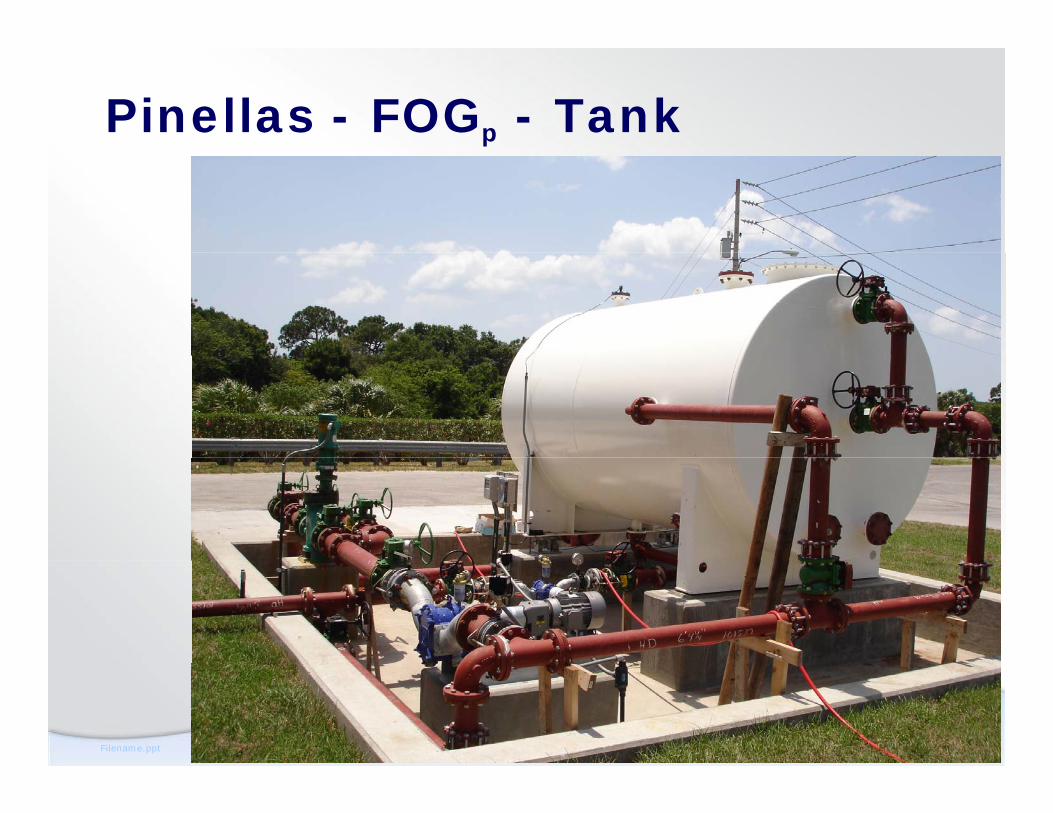
Pinellas - FOGp - Tank
Filename.ppt

Pinellas - FOGp- Pumps & Piping
Filename.ppt

Pinellas - FOGp - Feed Pump
Filename.ppt

Pinellas - FOGp- Needed Heater
Filename.ppt

Pinellas - FOGp - Heat Tracing
Filename.ppt

Pinellas - FOGp - Odor Control
Filename.ppt
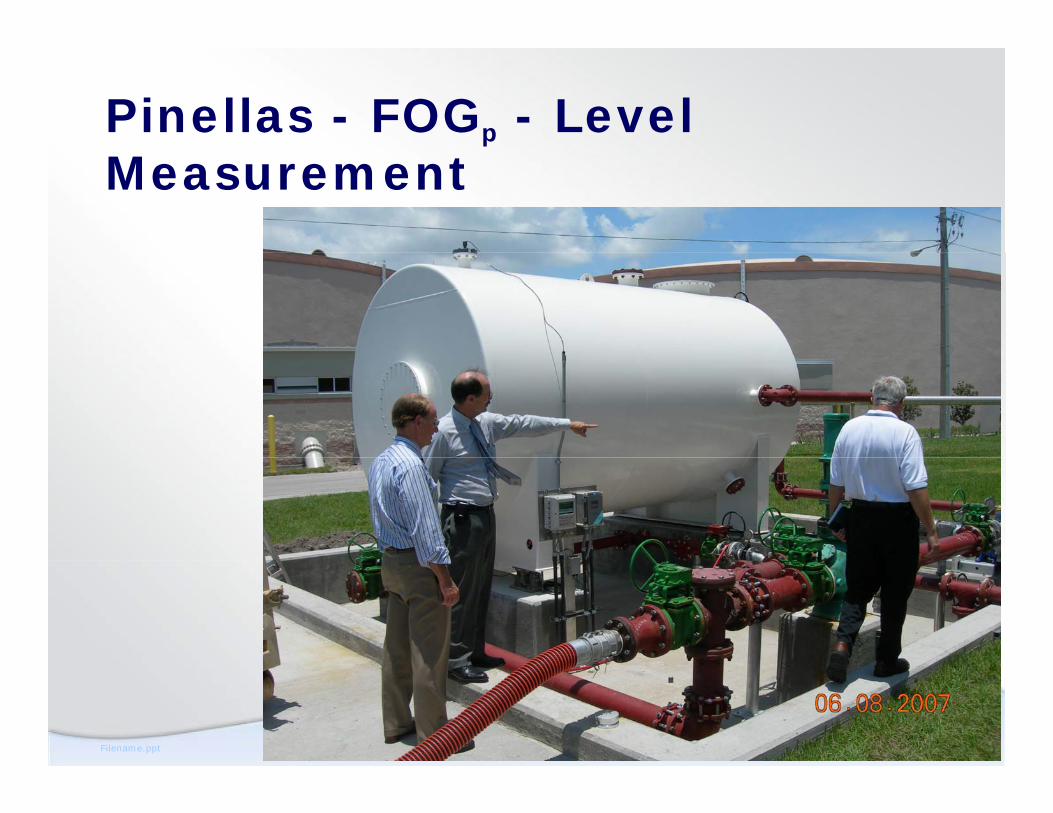
Pinellas - FOGp - Level Measurement
Filename.ppt

Pinellas - FOGp - Gas Metering
Filename.ppt

Pinellas - FOGp - Tank & Controls
Filename.ppt

Pinellas – FOGL - Dewatering
Filename.ppt

Pinellas - FOGL - Dewatering
Filename.ppt

Pinellas - FOGL - Cake
Filename.ppt

Pinellas - FOGL - Cake
Filename.ppt

Watsonville CAWatsonville CAWatsonville, CAWatsonville, CA
Filename.ppt

Watsonville, CA
Project Purpose:j p1. Increase digester
gas production2. Accept grease
hauler truck loads –restaurant grease traps and other sourcessources
Filename.ppt
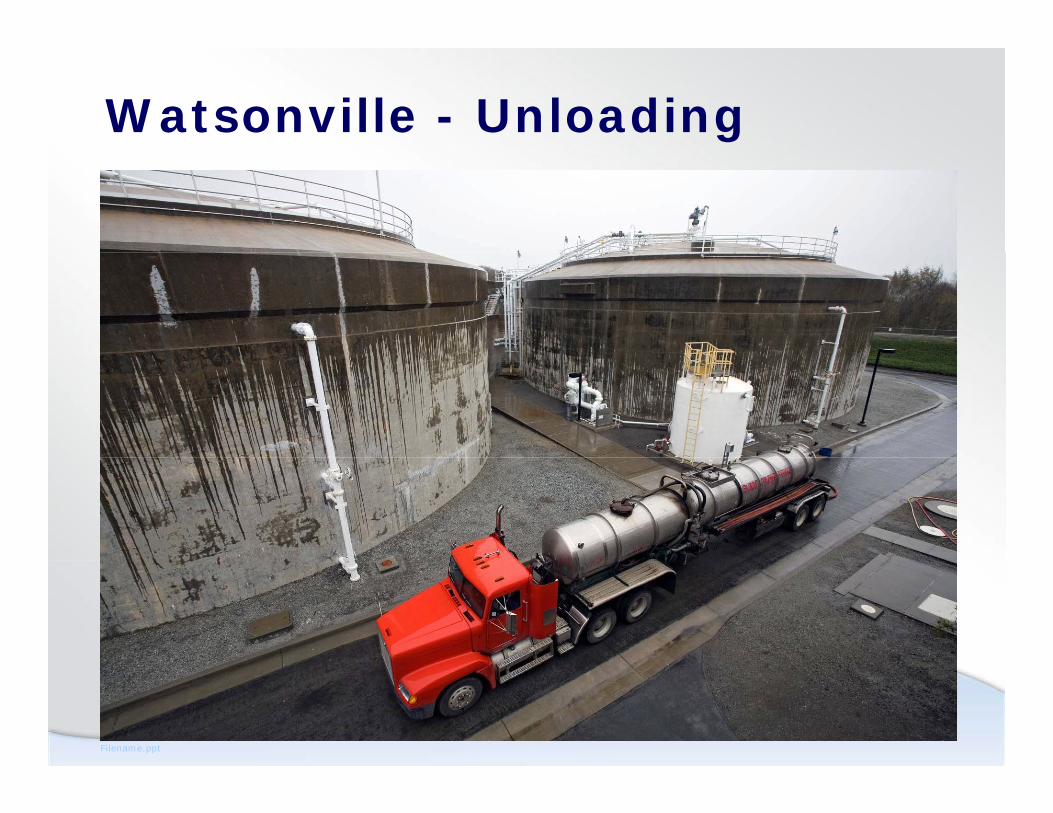
Watsonville - Unloading
Filename.ppt

Watsonville - Receiving Tank
Filename.ppt

Watsonville – Cost Savings
Grease Natural Gas Total Year
Grease Revenue
Natural Gas Savings
Total Savings
2002 $0 $0 $0
2003 $34,000 $61,000 $95,000$ , $ , $ ,
2004 $69,000 $118,000 $187,000
2006 $85,000 $145,000 $230,000
2006 $59,000 $129,000 $188,000
Filename.ppt
Totals $247,000 $453,000 $700,000

Millbrae CAMillbrae CAMillbrae, CAMillbrae, CA
Filename.ppt

Millbrae, CA
1 City decided 1. City decided to work with Chevron
2. Total Energy recoverya. Receivingb. Digestion
C ic. Cogeneration
Filename.ppt

Milbrae, CA -Millbrae – Off Site Unloading
Filename.ppt
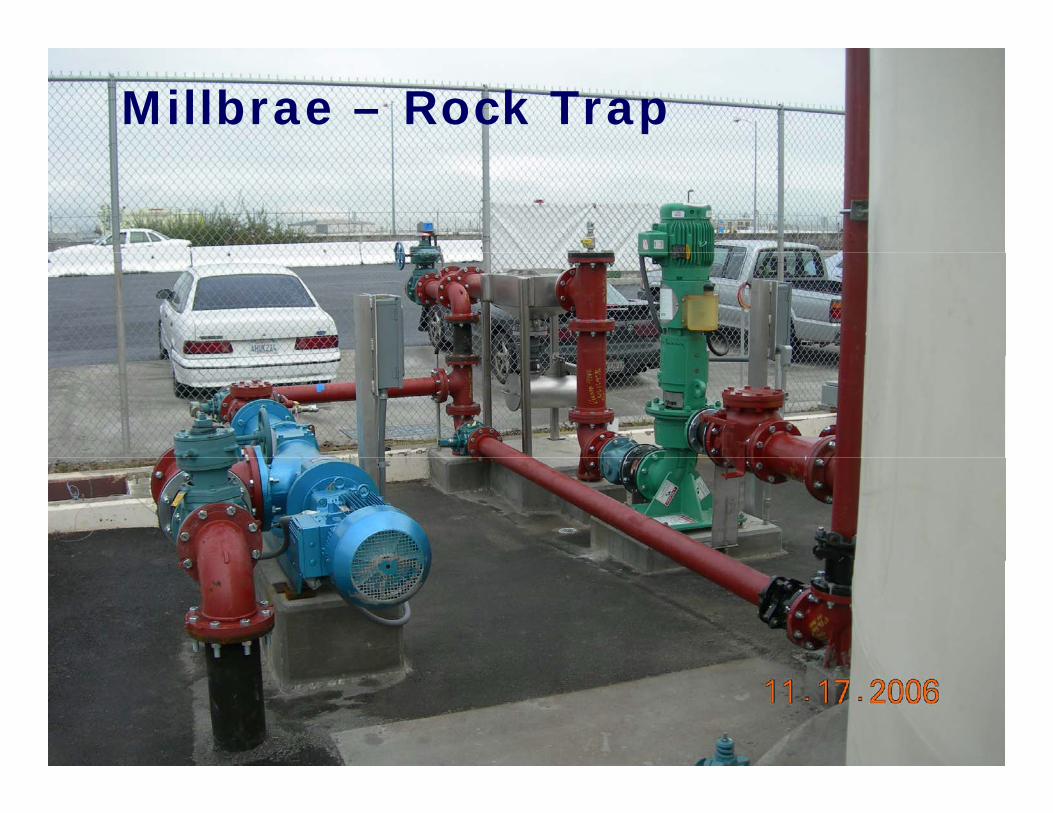
Milbrae, CA -Millbrae – Rock Trap
Filename.ppt

Milbrae, CA -Millbrae - Grinder
Filename.ppt

Milbrae, CA -Millbrae - Odor Control
Filename.ppt

Volatile Solids Loading RateMillbrae – Level Measurement
Filename.ppt

Milbrae, CA -Millbrae – Gas System y
Filename.ppt

Millbrae –Turbine
Filename.ppt

F CAF CAFresno, CAFresno, CA
Filename.ppt

Fresno - FOG - Receiving
1 Plan for large loadings – 3 – 15,000 tanks1. Plan for large loadings 3 15,000 tanks2. Off load from both sides simultaneously ,
up to 3 trucks at a time.up to 3 t uc s at a t e3. Mix with primary sludge in tanks so they
can continue with current sludge feed gsystem
4. Pump mixing
Filename.ppt

Fresno - FOG - Receiving
Filename.ppt

Fresno - FOG - Receiving
Filename.ppt

Fresno - FOG - Receiving
Filename.ppt