fog-cloud computing trac model affecting the occurrence of
TRANSCRIPT
Fog-Cloud Computing Tra�c Model Affecting theOccurrence of Latency on the Ubiquitous SensorNetworkChonnikan Sangmek
Prince of Songkla UniversityNathaphon Boonnam ( [email protected] )
Prince of Songkla University https://orcid.org/0000-0002-0625-4576
Research Article
Keywords: Ubiquitous Sensor Network, Fog-Cloud Computing, Tra�c Model,Latency, Packet
Posted Date: September 20th, 2021
DOI: https://doi.org/10.21203/rs.3.rs-594357/v1
License: This work is licensed under a Creative Commons Attribution 4.0 International License. Read Full License
Sangmek and Boonnam
RESEARCH
Fog-Cloud Computing Traffic Model Affectingthe Occurrence of Latency on the UbiquitousSensor NetworkChonnikan Sangmek1 and Nathaphon Boonnam2*
*Correspondence:
[email protected] Faculty of Science and Industrial
Technology, Prince of Songkla
University, Surat Thani Campus,
Surat Thani, Thailand
Full list of author information is
available at the end of the article
Abstract
The fog-cloud computing traffic model overviews working elements in forming
fog-cloud computing with three main layers: Ubiquitous Sensor Networks, Fog
Computing, and Cloud Computing. We present a possible method of data
transmission that focuses on either measuring or manipulating or both in the
system divided into 7 USNs and using latency measurement to demonstrate
transmission efficiency. This paper considers the latency test into four prominent
cases: internet connection, traffic model, number of devices, and packet by
equipment used for testing consisting of microcontroller board, sensor, actuator,
and uses fog node two types: pocket Wi-Fi and router. In the latency test, we
found that the factor causing the higher latency in the system was the packet
size. The main factor consists of the different characteristics of working, fog
nodes, and the number of connected devices. Therefore, the packet has
correlated directly with the latency depending on the size of the packet increases.
The resulting latency is the main factor affecting the work of the system.
Keywords: Ubiquitous Sensor Network; Fog-Cloud Computing; Traffic Model;
Latency; Packet
Indroduction
At present, the technology has been applied in diverse forms to improve productivity
and labor reduction. One of the critical technologies playing a role for a future
network is an Internet of Things (IoT) [4], which has the Ubiquitous Sensor Network
(USN) as one of the general IoT components [3]. The type of USNs is always the
most concerned part of users. When researchers selected the USNs type, it does not
fit the system control requirements as it may cause problems. USNs are essential
to controlling, measuring, and storing data in the system. The majority of the
mechanism for the control system is the microcontroller board. One uses as an
intermediary to controlling the sensor or actuator for measuring and manipulating.
When the sensor or actuator has worked together with the microcontroller board
representing the characteristic of USNs, there have different kinds of measuring
and manipulating in wireless type. We divided 7 USNs from the working of three
communication protocols consisting of CoAP, MQTT, and RxTx; it has presented
in the form of architecture design [6]. Latency is a problem occurring with data
transmission performance in each USNs by things that affect the system’s operation,
such as latency of command for controlling, sending, receiving, and storing data.
They harm productivity that requires automatic control. In addition, performance
Sangmek and Boonnam Page 2 of 13
evaluation of latency in the data transmission is the thing that tells us to factors
affecting the operation of the system.
The concept of this paper has focused on the latency that occurs in measuring,
manipulating, or data transmission in each USNs of the fog-cloud computing traf-
fic model. The characteristics of working are the main factor effect with the occur
latency in the USNs. The latency test has a method to test data transmission from
the literature review by using USNs according to the actual use in the trial. The
latency test divides into four prominent cases: internet connection, traffic model,
number of devices, and packet. The forecasting of these working patterns may be
a factor in the high latency in each USNs which may cause problems in the au-
tomatic controls system. This paper is focused on presenting the factors affecting
latency and improved the fog-cloud computing traffic model for an extension of the
research on [6]. We studied many related works for ubiquitous sensor networks, fog-
cloud computing traffic model, a factor associated with the latency, and currently
presenting the improved fog-cloud computing architecture design of USNs. The la-
tency test of the traffic model had used two types of fog node connections: a mobile
pocket Wi-Fi and a router via testing four cases consisting of the latency test of
internet connection, traffic model, the number of devices, and a packet. Finally, we
concluded the factors affecting the occur latency in the representation of our traffic
model.
Related Works
Andrey K and Andrey P (2011) described the internet of things as a future network
concept. There is no clear IoT definition today. However, IoT includes the Ubiqui-
tous Sensor Network (USN) and Web of Things (WoT). Essential USN applications
include building automation, industrial automation, logistics, transportation, body,
intrabody sensor nodes and RFIDs, military, agriculture, environment data, and
related applications. The USN is one of the general IoT components. The IoT bases
on the USN because IoT composes of a tremendously huge number of nodes [5].
So they studied the USN traffic models well. ITU-T identified that USNs describe
networks of intelligent sensor nodes that could be deployed ”anywhere, anytime, by
anyone and anything.” The technology has tremendous potential as it could gen-
erate applications such as a wide range of civilian and military fields, environment
and habitat monitoring, real-time healthcare, landmine detection, and intelligent
transport systems. The USN identifies a layer of equipment that collects interest
data [2].
Josef H et al. (2016) tested the packets between the station nodes that were inter-
connected using a wireless network to determine latency. It depends on the size of
data with data transmission between the device and the internet service provider.
The test had the measurement of latency repeated 100 times for each time mea-
surement 200 packets. They had explained that the measure of latency in wireless
networks depends on the size of the transmitted data by parameters of wireless net-
works. Commonly measured parameters are throughput, latency, available capacity,
capacity, signal to noise ratio, and received signal level. Latency is an important
performance parameter of wireless networks defined as the elapsed time. The source
node sends a message to receive a message on the destination node expressed in mil-
liseconds, including delays within the transmission protocol and holds on devices’
Sangmek and Boonnam Page 3 of 13
working. However, the latency did not affect the quality of the transmitted data.
On the other hand, high latency can significantly affect the quality of work with
a data connection to the network because of the latency causing a longer response
time interval.
Sabin B et al. (2017) tested the latency of devices that prioritized and non-
prioritized the number of 100 nodes. They found that the system that improved
the latency by prioritized has more reliability than the non-prioritized scheme, and
the number of nodes increased the higher latency. The internet of things networks
had used a vast number of sensor or actuator nodes for different monitoring and
sensing purposes [13]. In real-world IoT applications, they planned to applied net-
work simulator tools to analyze the performance of the proposed scheme having
corresponded [15].
Sucharitha V et al. (2019) identified that the fog topology is one thing that miti-
gates the scope for congestion in the network and reduces the negative impacts on
the response time due to the increase in the size of the topology when the addition
of more devices. They sustainably postulate that the fog-based model was desirable
for adoption because it supported effective scalability with reduced latency and
better response time. Data storage from sensor devices imports into cloud services
having number increasing steadily. It made the data transmission or data manage-
ment respond the sake on the Internet of Things (IoT) that may be a delay in
handling the data sending to the cloud service [14]. Cloud computing collaborating
with fog computing, which is between the device on the edge network with the cloud
center, offers a more efficient solution to deal with these limitations. Fog computing
is architecture geographically distributed computing with the various devices in the
different edge network connecting ubiquitously to provide flexible management for
computing, communications, and storage [14]. The most foremost characteristic of
fog computing is the extension of the cloud service to the edge network and the
connection from the users to the cloud.
Chonnikan S and Nathaphon B (2019) presented a ubiquitous sensor network that
can occur from the sensor or actuator at least one device connects with a microcon-
troller board. They explained the details of the situation with the microcontroller
board to define the fog-cloud computing traffic model in wireless type to measure,
manipulate, or work together. They had divided the traffic model for transmission
data of microcontroller board into 7 USNs in the form architecture design [6]. There
have many examples to create USN fog-cloud traffic model and expanding USNs
[7],[10],[12]. The traffic model was a structure in each step for creating a suitable
system into USNs in wireless type data transmission via the cloud service. When
they had built a wireless sensor network in a ubiquitous sensor network, it was
required to use the fog computing layer as an intermediary to transmission data
and a microcontrollers board [1]. They found the results from a latency test of each
traffic model having the factor that affected the system consisting of the different
working requirements in the traffic model and many connections devices keeping
high latency.
Therefore, in this paper, we offer the fog-cloud computing traffic model that new
improvement from [6]. This study will support users for noticing the working and
components of USNs in an easy-to-understand format and use USNs suitable ac-
cording to the requirement of the system for measuring and manipulating. We
Sangmek and Boonnam Page 4 of 13
divided the testing of latency in wireless networks affecting the speed of data trans-
mission from the related work above consisting of different working, the number of
nodes increased, network connection, and size of the sent data or packet (see also
[6],[9],[13],[15]). We realize the factors related to latency on the ubiquitous sensor
network having details in the next section.
Fog-Cloud Computing Traffic Model
This section is an improvement of the fog-cloud computing traffic model from [6].
The improved traffic model has a format that is easier to understand than the old
version and helps users know the working and components of USNs. We present
the usage of microcontroller boards in the wireless types to send data from the
ubiquitous sensor network layer via the fog computing layer for storing data to
the cloud computing layer in the form of possible USNs. The fog computing and
cloud computing layers had to work simultaneously to distribute the internet signal
to send data to store and display data into the cloud computing layer. It had
the operation essentially three components of the system: the ubiquitous sensor
network, fog computing, and cloud computing for measuring and manipulating by
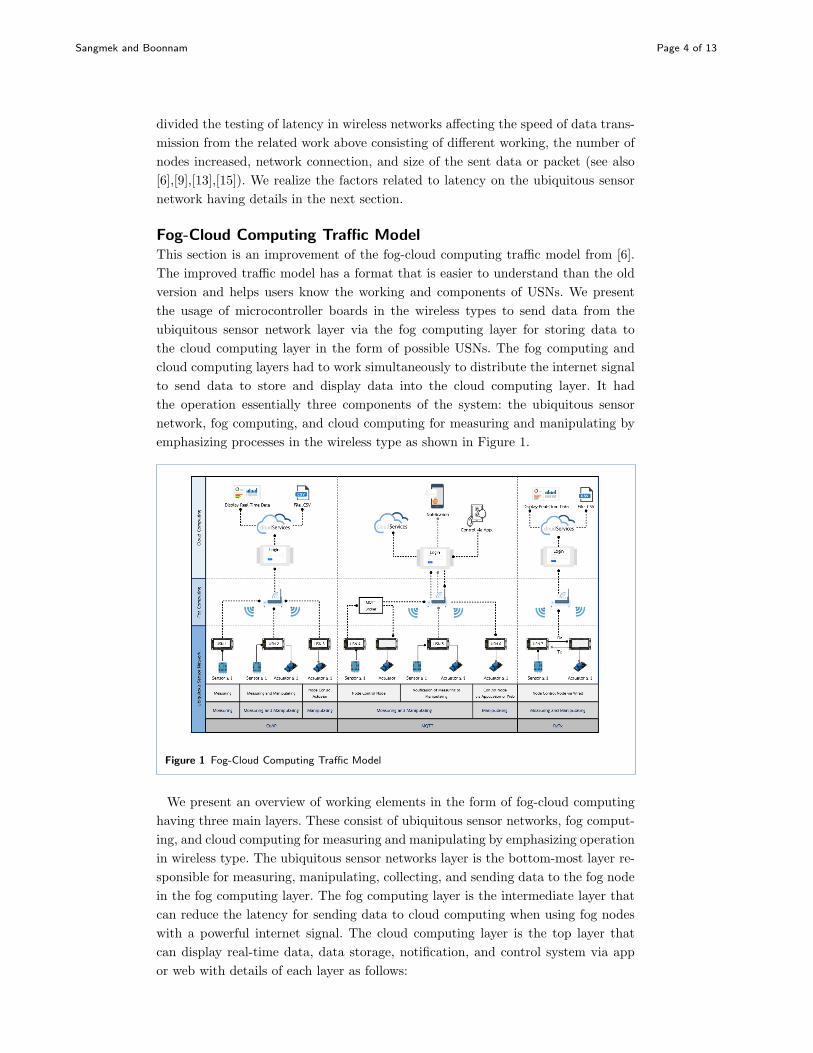
emphasizing processes in the wireless type as shown in Figure 1.
Figure 1 Fog-Cloud Computing Traffic Model
We present an overview of working elements in the form of fog-cloud computing
having three main layers. These consist of ubiquitous sensor networks, fog comput-
ing, and cloud computing for measuring and manipulating by emphasizing operation
in wireless type. The ubiquitous sensor networks layer is the bottom-most layer re-
sponsible for measuring, manipulating, collecting, and sending data to the fog node
in the fog computing layer. The fog computing layer is the intermediate layer that
can reduce the latency for sending data to cloud computing when using fog nodes
with a powerful internet signal. The cloud computing layer is the top layer that
can display real-time data, data storage, notification, and control system via app
or web with details of each layer as follows:
Sangmek and Boonnam Page 5 of 13
USN Layer
There was a demonstration of possible usage models for measuring or manipulat-
ing controlled by the board microcontroller in a wireless type. The usability of all
proposed based on consideration from applying the scenario happened to present
in the traffic model dividing into 7 USNs. Three usability types consisted of CoAP,
MQTT, and RxTx, which control seven traffic models from practical applications.
USN 1 to 7 represents the node or board microcontroller, and ≥ represents the
number of user devices that may be one or more than one device, such as sensor ≥
one and actuator ≥ one, respectively.
1 CoAP consists of 3 USNs: USN 1 was a measurement that used sensor devices
for only store data; USN 2 was measurement and manipulation that used a
sensor device for measuring and sensor values for controlling the actuator;
USN 3 was manipulating using the values received from the analysis or custom
values to control the actuator.
2 MQTT consists of 3 USNs: USN 4 was a manipulation that used a micro-
controller board for transmitted data receiving from sensor devices to data
storage and transceiving data into MQTT broker as an intermediary control
the actuator to operate according to the measured values from the sensor
device or according to custom values; USN 5 was measurement and manip-
ulation that installed a sensor device or actuator to work together with the
microcontroller board for notification through the application or web; USN 6
was manipulation the system that used controlling the microcontroller board
through the application or web.
3 RxTx consists of 1 USN: USN 7 was manipulation to connect type wired
between microcontroller boards via RxTx channel to control the actuator in
the system.
Fog Computing Layer
According to the USN layer’s actual use, the application layer has three operations
types: CoAP, MQTT, and RxTx. The network layer focused on using connections
from the board microcontroller via Wi-Fi signal; therefore, the connection type was
wireless for connecting to the fog node in the form of a router. It distributed the
Wi-Fi signal to devices used to measure or manipulate and transmit data into the
cloud computing layer.
Cloud Computing Layer
We presented the deployment models in the cloud computing layer in a private
cloud used only for organizations or personal. The user permanently accesses the
system data to manage and use the system. We focused on PaaS services, free
platforms that users can use privately, or set access rights for relevant people. The
system brings the data stored in the form of a .csv file or the other formats to use
in the analysis for managing the system and use the real-time display via the free
platform service. Without wasting time creating your platform and using the service
via platforms for displaying real-time data, the user may create the applications or
web as appropriate for use.
The above details are part of the characteristics of the improved fog-cloud com-
puting traffic model in the USN’s layer. It is an improvement picture from research
Sangmek and Boonnam Page 6 of 13
presented in 2019 [6] to show the correct attributes according to the actual use and
to make it easier for users to understand the operation.
The Latency Test of Ubiquitous Sensor Networks
We evaluated the data transmission efficiency for each USN to find conclusions
from a literature review about latency tests stating that latency is an important
performance parameter for wireless networks [9]. It is a factor that directly affects
or not because other additional factors may affect the data transmission efficiency.
This paper focused on the four factors mentioned in the Related Works section with
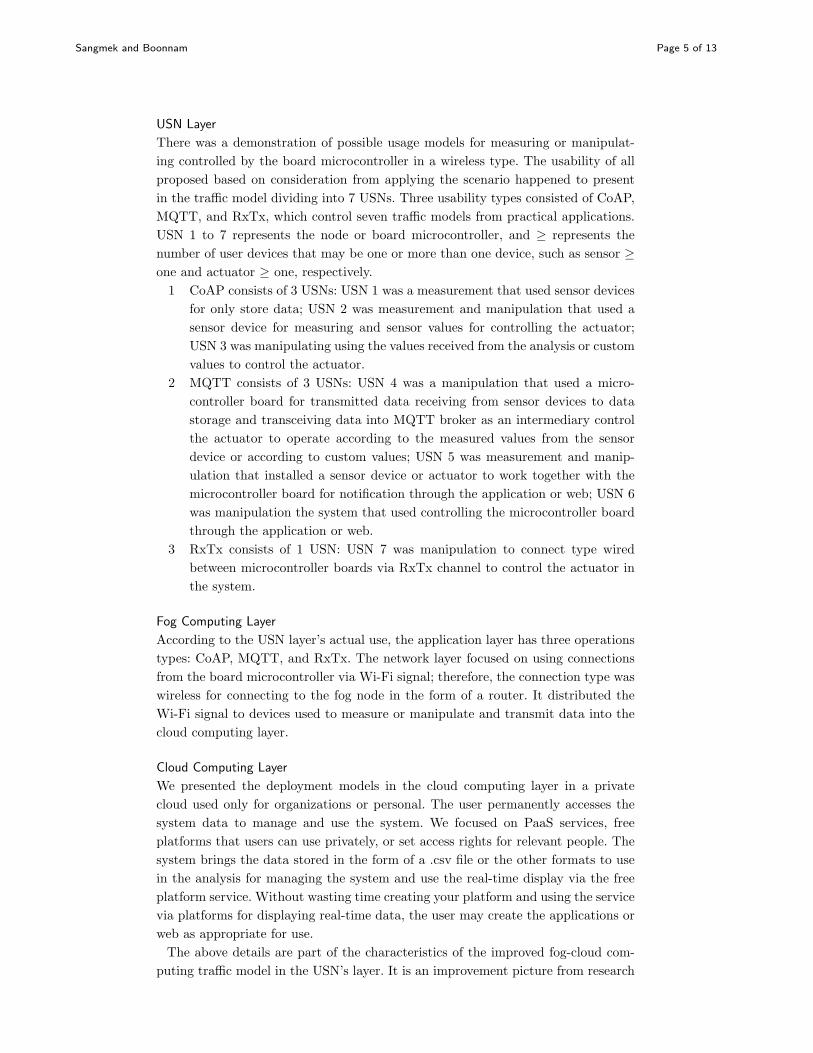
the actual situation as shown in Figure 2.
Figure 2 Implementation in Different Situations with Device
The latency test had used the Arduino IDE program to set the command program
for testing and run the command program to the ESP8266 board. It is the main
board for working and transmitting data received from the sensor and actuators
Sangmek and Boonnam Page 7 of 13
according to the characteristics work of each USNs and used the cloud services
that are available for free [11]. Five platforms were available for free consisting of
Ubidots, ThingSpeak™, Xively, Plotly, and Timbits. When we considered in suitable
cloud service, ThingSpeak™ was selected because we can use it for real-time data
visualization, store data in .csv file format, and available for free. In addition, as
the notification, we used LINE Notify and Blynk applications for sending message
and control USN, respectively.
This paper has differed from [6] as we used two types of fog node connections con-
sisting of pocket Wi-Fi and a router. In the previous article, we only used pocket
Wi-Fi to connect to the microcontroller board. There are 4 cases of data transmis-
sion efficiency testing, consisting of (1) the latency test of internet connection, (2)
the latency test of traffic model, (3) the latency test of the number of devices, and
(4) the latency test of a packet. The test results on all four topics, we are aware
of the problems and factors affecting the occurrence of high latency for each usage
form which can be summarized as follows:
The Latency of Internet Connection
The latency test of an internet connection is a test to compare the efficiency of the
nodes divided into two sets of work differences, including the node disconnecting
with the sensor or actuator and the node connected to the sensor or actuator. There
were three types for testing:
1 The node is connected to the fog node to send data into the cloud service.
2 The node had connected to the fog node but no store data.
3 The node has no connection to the internet but uses the display through the
serial monitor of Arduino IDE.
There are details for the test results as follows.
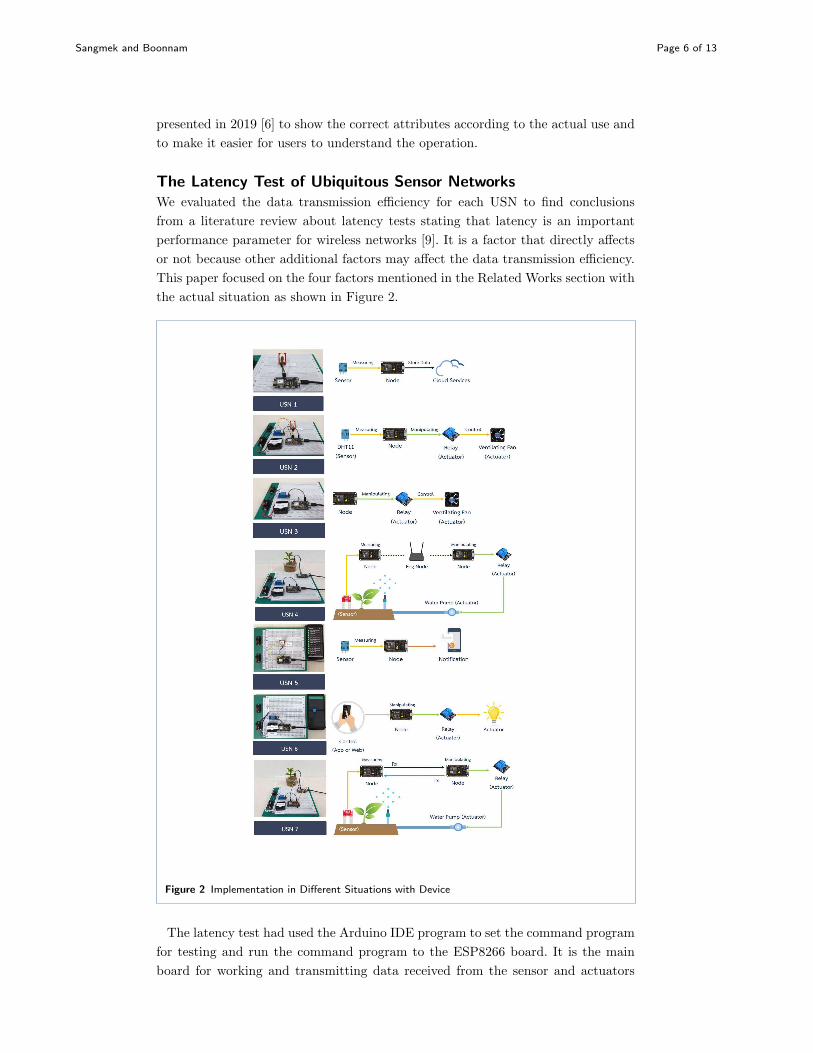
Send Data to Cloud Service
The internet connection with pocket Wi-Fi had the latency in the range 2,010-2,150
ms., which is higher than connecting with a router in the range 2,010-2,050 ms. The
nodes connected to sensors have a higher latency than the otherwise ones, as shown
in Figure 3.
Figure 3 The Latency of Send Data to Cloud Service via Pocket Wi-Fi and Router
Sangmek and Boonnam Page 8 of 13
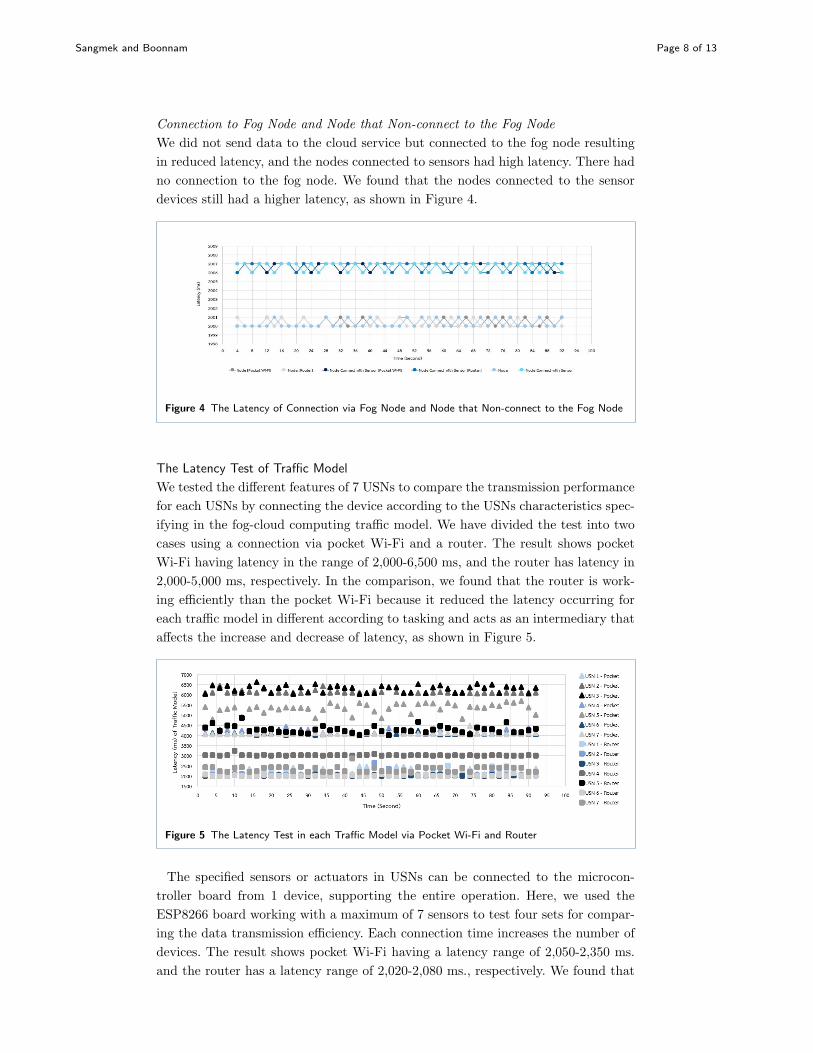
Connection to Fog Node and Node that Non-connect to the Fog Node
We did not send data to the cloud service but connected to the fog node resulting
in reduced latency, and the nodes connected to sensors had high latency. There had
no connection to the fog node. We found that the nodes connected to the sensor
devices still had a higher latency, as shown in Figure 4.
Figure 4 The Latency of Connection via Fog Node and Node that Non-connect to the Fog Node
The Latency Test of Traffic Model
We tested the different features of 7 USNs to compare the transmission performance
for each USNs by connecting the device according to the USNs characteristics spec-
ifying in the fog-cloud computing traffic model. We have divided the test into two
cases using a connection via pocket Wi-Fi and a router. The result shows pocket
Wi-Fi having latency in the range of 2,000-6,500 ms, and the router has latency in
2,000-5,000 ms, respectively. In the comparison, we found that the router is work-
ing efficiently than the pocket Wi-Fi because it reduced the latency occurring for
each traffic model in different according to tasking and acts as an intermediary that
affects the increase and decrease of latency, as shown in Figure 5.
Figure 5 The Latency Test in each Traffic Model via Pocket Wi-Fi and Router
The specified sensors or actuators in USNs can be connected to the microcon-
troller board from 1 device, supporting the entire operation. Here, we used the
ESP8266 board working with a maximum of 7 sensors to test four sets for compar-
ing the data transmission efficiency. Each connection time increases the number of
devices. The result shows pocket Wi-Fi having a latency range of 2,050-2,350 ms.
and the router has a latency range of 2,020-2,080 ms., respectively. We found that
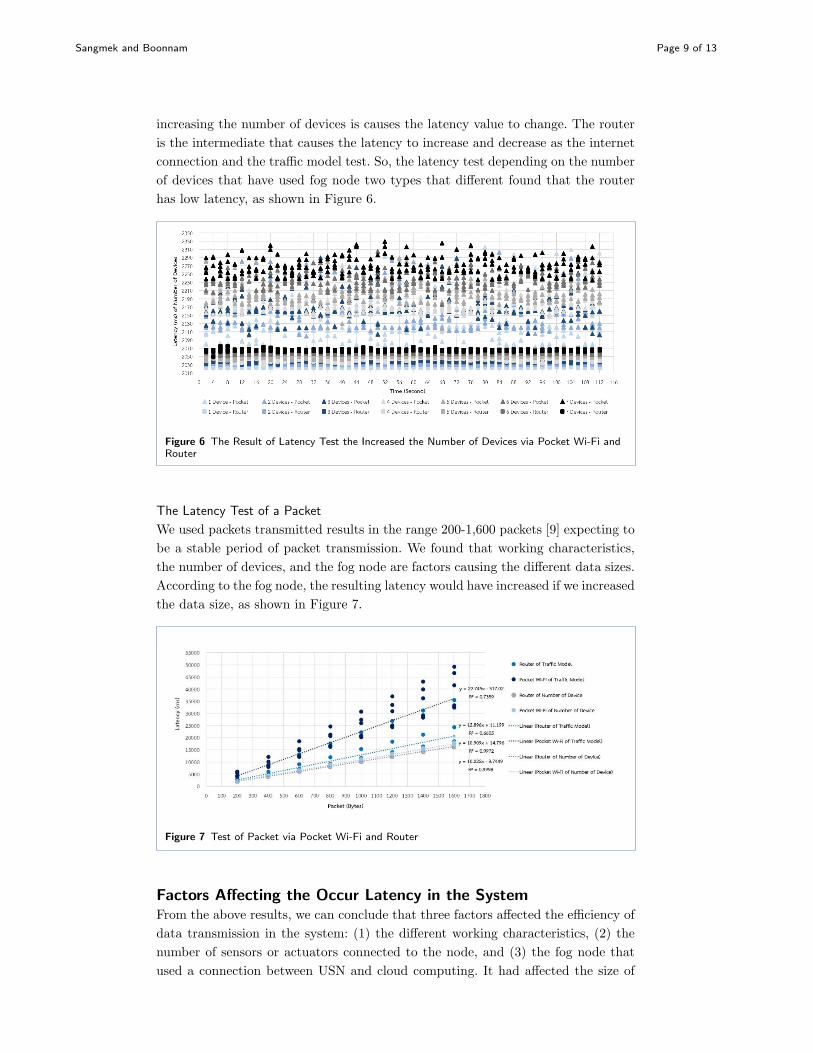
Sangmek and Boonnam Page 9 of 13
increasing the number of devices is causes the latency value to change. The router
is the intermediate that causes the latency to increase and decrease as the internet
connection and the traffic model test. So, the latency test depending on the number
of devices that have used fog node two types that different found that the router
has low latency, as shown in Figure 6.
Figure 6 The Result of Latency Test the Increased the Number of Devices via Pocket Wi-Fi andRouter
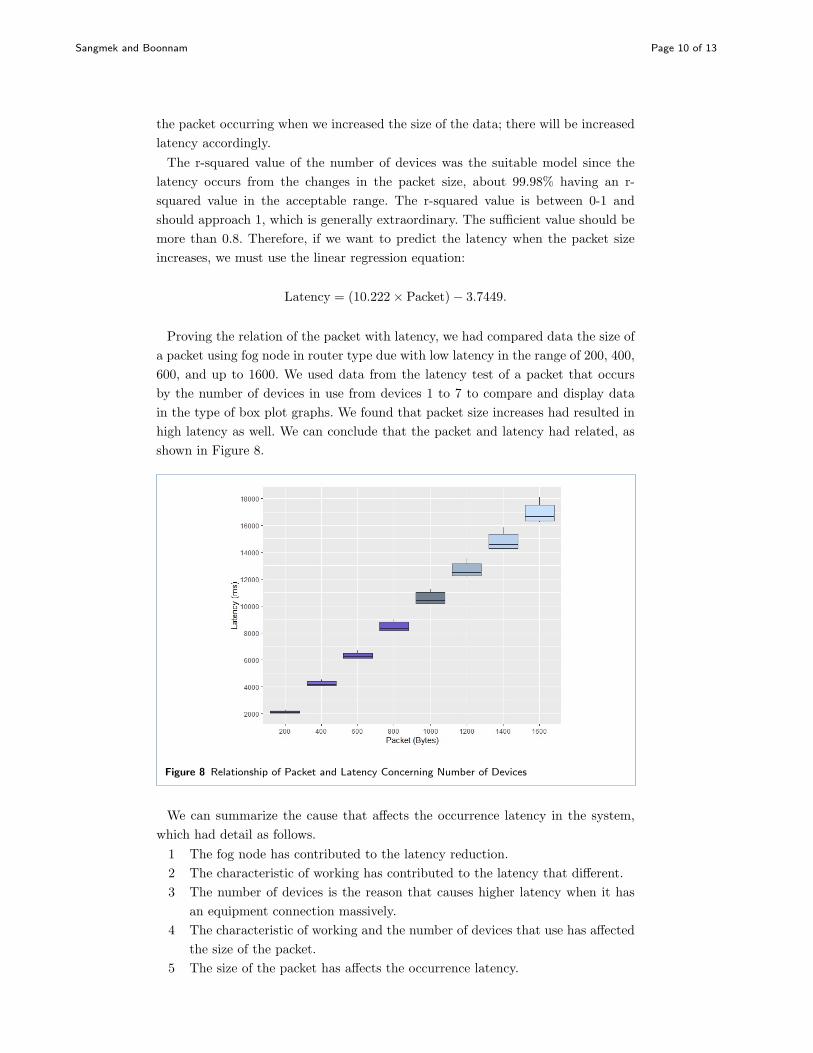
The Latency Test of a Packet
We used packets transmitted results in the range 200-1,600 packets [9] expecting to
be a stable period of packet transmission. We found that working characteristics,
the number of devices, and the fog node are factors causing the different data sizes.
According to the fog node, the resulting latency would have increased if we increased
the data size, as shown in Figure 7.
Figure 7 Test of Packet via Pocket Wi-Fi and Router
Factors Affecting the Occur Latency in the System
From the above results, we can conclude that three factors affected the efficiency of
data transmission in the system: (1) the different working characteristics, (2) the
number of sensors or actuators connected to the node, and (3) the fog node that
used a connection between USN and cloud computing. It had affected the size of
Sangmek and Boonnam Page 10 of 13
the packet occurring when we increased the size of the data; there will be increased
latency accordingly.
The r-squared value of the number of devices was the suitable model since the
latency occurs from the changes in the packet size, about 99.98% having an r-
squared value in the acceptable range. The r-squared value is between 0-1 and
should approach 1, which is generally extraordinary. The sufficient value should be
more than 0.8. Therefore, if we want to predict the latency when the packet size
increases, we must use the linear regression equation:
Latency = (10.222× Packet)− 3.7449.
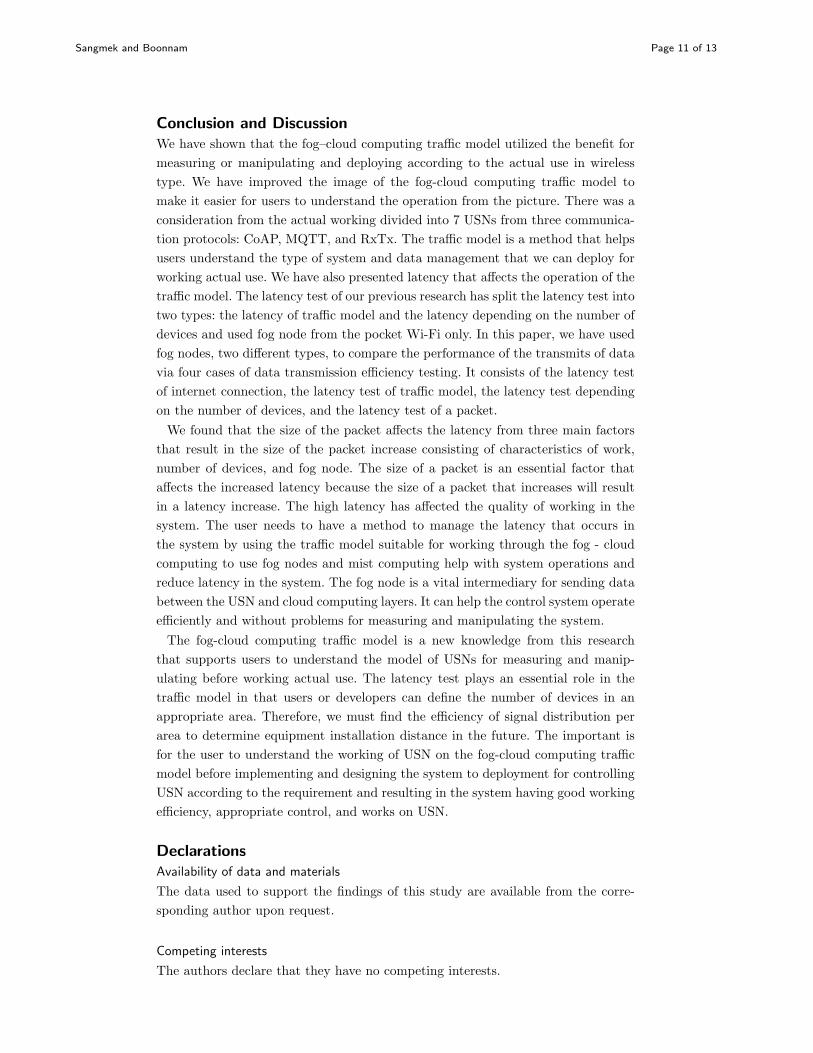
Proving the relation of the packet with latency, we had compared data the size of
a packet using fog node in router type due with low latency in the range of 200, 400,
600, and up to 1600. We used data from the latency test of a packet that occurs
by the number of devices in use from devices 1 to 7 to compare and display data
in the type of box plot graphs. We found that packet size increases had resulted in
high latency as well. We can conclude that the packet and latency had related, as
shown in Figure 8.
Figure 8 Relationship of Packet and Latency Concerning Number of Devices
We can summarize the cause that affects the occurrence latency in the system,
which had detail as follows.
1 The fog node has contributed to the latency reduction.
2 The characteristic of working has contributed to the latency that different.
3 The number of devices is the reason that causes higher latency when it has
an equipment connection massively.
4 The characteristic of working and the number of devices that use has affected
the size of the packet.
5 The size of the packet has affects the occurrence latency.
Sangmek and Boonnam Page 11 of 13
Conclusion and Discussion
We have shown that the fog–cloud computing traffic model utilized the benefit for
measuring or manipulating and deploying according to the actual use in wireless
type. We have improved the image of the fog-cloud computing traffic model to
make it easier for users to understand the operation from the picture. There was a
consideration from the actual working divided into 7 USNs from three communica-
tion protocols: CoAP, MQTT, and RxTx. The traffic model is a method that helps
users understand the type of system and data management that we can deploy for
working actual use. We have also presented latency that affects the operation of the
traffic model. The latency test of our previous research has split the latency test into
two types: the latency of traffic model and the latency depending on the number of
devices and used fog node from the pocket Wi-Fi only. In this paper, we have used
fog nodes, two different types, to compare the performance of the transmits of data
via four cases of data transmission efficiency testing. It consists of the latency test
of internet connection, the latency test of traffic model, the latency test depending
on the number of devices, and the latency test of a packet.
We found that the size of the packet affects the latency from three main factors
that result in the size of the packet increase consisting of characteristics of work,
number of devices, and fog node. The size of a packet is an essential factor that
affects the increased latency because the size of a packet that increases will result
in a latency increase. The high latency has affected the quality of working in the
system. The user needs to have a method to manage the latency that occurs in
the system by using the traffic model suitable for working through the fog - cloud
computing to use fog nodes and mist computing help with system operations and
reduce latency in the system. The fog node is a vital intermediary for sending data
between the USN and cloud computing layers. It can help the control system operate
efficiently and without problems for measuring and manipulating the system.
The fog-cloud computing traffic model is a new knowledge from this research
that supports users to understand the model of USNs for measuring and manip-
ulating before working actual use. The latency test plays an essential role in the
traffic model in that users or developers can define the number of devices in an
appropriate area. Therefore, we must find the efficiency of signal distribution per
area to determine equipment installation distance in the future. The important is
for the user to understand the working of USN on the fog-cloud computing traffic
model before implementing and designing the system to deployment for controlling
USN according to the requirement and resulting in the system having good working
efficiency, appropriate control, and works on USN.
Declarations
Availability of data and materials
The data used to support the findings of this study are available from the corre-
sponding author upon request.
Competing interests
The authors declare that they have no competing interests.
Sangmek and Boonnam Page 12 of 13
Funding
Not applicable
Authors’ contributions
This paper is completed under the supervision of author NB. CS wrote the paper
and is responsible for the test and the architecture design. The grammar of the paper
was reviewed and modified by NB. Finally, NB gives some modification suggestions.
All authors have read and approved the final manuscript.
Acknowledgements
The authors would like to thank all anonymous reviewers for their invaluable com-
ments and Prince of Songkla University, Surat Thani Campus, for supporting this
work.
Authors’ information
Nathaphon Boonnam is an Sc.D. assistant professor in the Faculty of Science and
Industrial Technology at Prince of Songkla University, Surat Thani Campus. His
research interests are differential geometry, internet of things, wireless sensor net-
works, data science, and active learning researches.
Chonnikan Sangmek is a Master’s student in the Faculty of Science and Industrial
Technology at Prince of Songkla University, Surat Thani Campus. Her research
interests are internet of things, wireless sensor networks, and fog-cloud computing.
Author details1 Faculty of Science and Industrial Technology, Prince of Songkla University, Surat Thani Campus, Surat Thani,
Thailand. 2 Faculty of Science and Industrial Technology, Prince of Songkla University, Surat Thani Campus, Surat
Thani, Thailand.
References
1. Afandi A, Muhammad Faris R, Abbes A (2017). Throughput, Latency and Cost Comparisons of Microcontroller
– based Implementations of Wireless Sensor Network (WSN) in High Jump Sports. AIP Conference
Proceedings, pp 1–9.
2. Alfredo J.P, Sherali Z, Nafaa J (2017) Investigating Security for Ubiquitous Sensor Networks. Procedia
computer science, pp 737–744.
3. Anastasia V, Andrey K (2012) Ubiquitous Sensor Networks Traffic Models for Medical and Tracking
Applications. Springer-Verlag Berlin Heidelberg, pp 338–346.
4. Andrey K, Andrey P (2011) Ubiquitous Sensor Networks Traffic Models for Telemetry Applications. Smart
Spaces and Next Generation Wired/Wireless Networking, pp 287–294.
5. Antonio I, Christian F, Jin M, Giacomo M (2010) The Internet of Things. IEEE Wireless Communications, pp
8–9.
6. Chonnikan S, Nathaphon B (2019) Fog - Cloud Computing Traffic Model and Performance Evaluation for
Ubiquitous Sensor Network Infrastructure. IEEE 2019 23rd International Computer Science and Engineering
Conference (ICSEC 2019), Phuket, Thailand, 30 October – 1 November 2019, pp 213–218.
7. Francisco Javier F.P, Juan Manuel G.C, Mario N.H, Jeronimo M.P, Jose M.M (2016) Developing Ubiquitous
Sensor Network Platform Using Internet of Things: Application in Precision Agriculture. MDPI journal sensor,
pp 1–20.
8. International Telecommunication Union (2008) Ubiquitous Sensor Network (USN). ITU-T Technology Watch
Report, pp 1–15.
9. Josef H, Tomas S, Filip H (2016) Analysis of the wireless communication latency and its dependency on a data
size. 17th IEEE International Symposium on Computational Intelligence and Informatics, CINTI 2016,
Budapest, Hungary, 17–19 November 2016, pp 145–150.
10. Limei P, Ahmad RD, Pin-Han H (2018) Toward integrated Cloud-Fog networks for efficient IoT provisioning:
Key challenges and solutions. Future Generation Computer Systems, pp 1–8.
11. Mahammad SM, Viswanathan P (2017) A Survey: Smart Agriculture IoT with Cloud Computing. 2017
International conference on Microelectronic Devices, Circuits and Systems (ICMDCS), pp 1–7.
12. Pengfei H, Sahraoui D, Huansheng N, Tie Q (2017) Survey on fog computing: architecture, key technologies,
applications and open issues. Journal of Network and Computer Applications, pp 27–42.
13. Sabin B, Shree Krishna S, Xianbin W (2017) Latency Minimization in Wireless IoT Using Prioritized Channel
Access and Data Aggregation. Department of Electrical and Computer Engineering, Western University,
London, Ontario, Canada, pp 1–6.
Sangmek and Boonnam Page 13 of 13
14. Shanhe Y, Zijiang H, Zhengrui Q, Qun L (2015) Fog Computing: Platform and Applications. IEEE Workshop
on Hot Topics in Web Systems and Technologies, pp 73–78.
15. Sucharitha V, Prakash P, Ganesh Neelakanta I (2019) AgriFog- A Fog Computing based IoT for Smart
Agriculture. International Journal of Recent Technology and Engineering (IJRTE), 7 (6), pp 210–217.