focusing on what matters - aliaxis
TRANSCRIPT
Focusing on what matters
Aliaxis SA – Consolidated Annual Report 2020
2Aliaxis SA – Consolidated Annual Report 2020
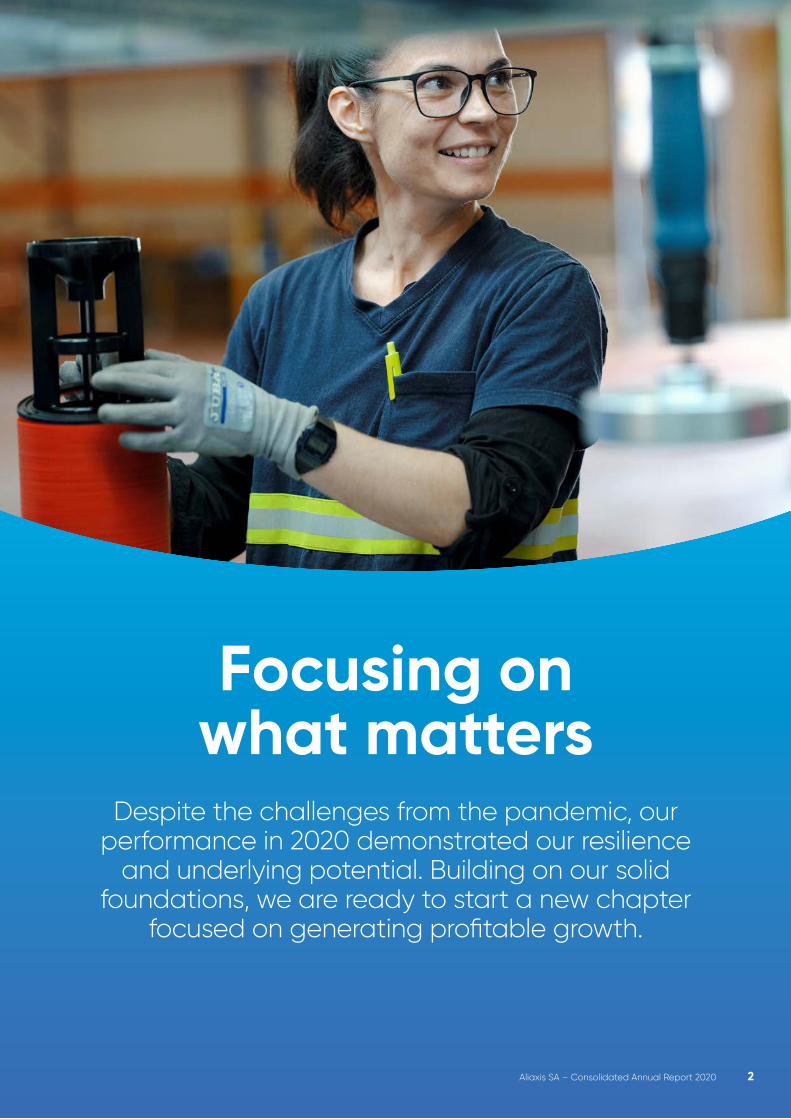
Focusing on what matters
Despite the challenges from the pandemic, our performance in 2020 demonstrated our resilience
and underlying potential. Building on our solid foundations, we are ready to start a new chapter
focused on generating profitable growth.
3Aliaxis SA – Consolidated Annual Report 2020
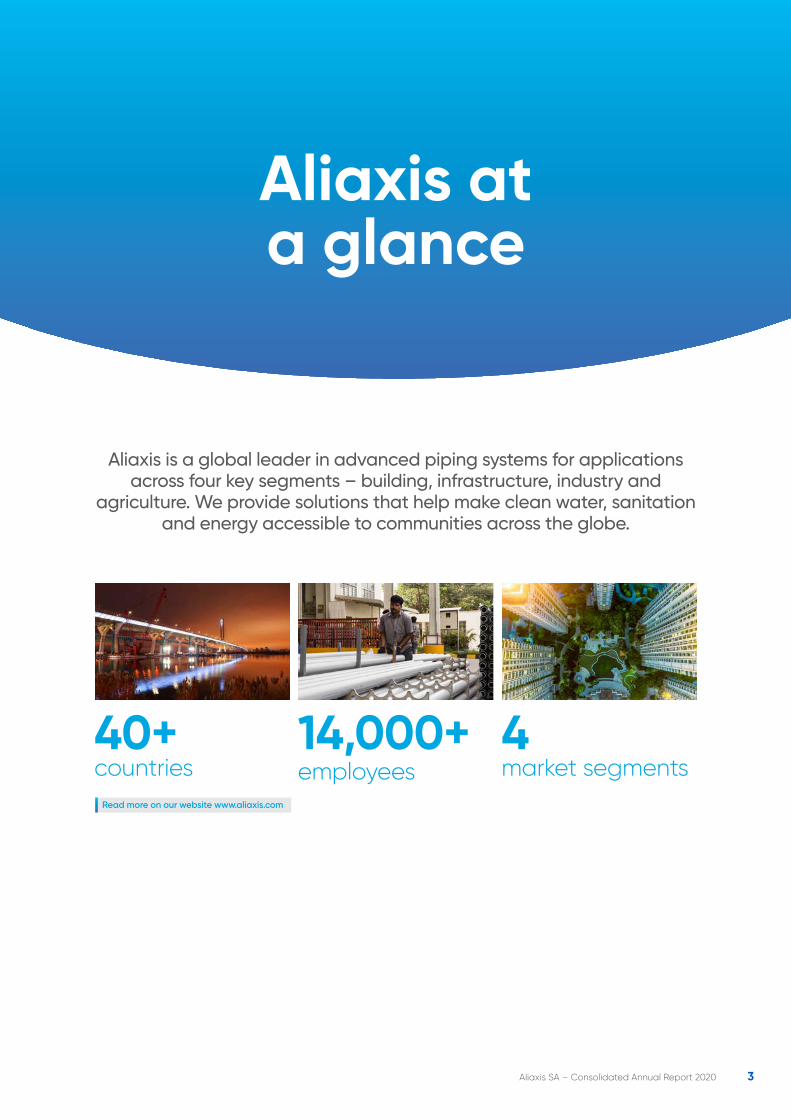
Aliaxis is a global leader in advanced piping systems for applications across four key segments – building, infrastructure, industry and
agriculture. We provide solutions that help make clean water, sanitation and energy accessible to communities across the globe.
40+ countries
14,000+employees
4 market segments
Read more on our website www.aliaxis.com
Aliaxis at a glance
4Aliaxis SA – Consolidated Annual Report 2020
Part 1: Focusing on what matters in 2020
1. Introduction 5
2. 2020 highlights 6
3. Preparing for growth – Message to shareholders 10
4. Going the extra mile for customers 13
5. Taking the next step in sustainability 17
6. Our performance Americas APAC EMEA India
24262931 33
Part 2: Directors’ Report and Financial Statements
1. Corporate governance Global leadership team Composition of the Board of Directors Board of Directors and Committees of the Board Strategy Committee Audit Committee Appointment and Remuneration Committee
37373738383838
2. Directors’ report Trading review Financial review Our people Our innovations Sustainability Risks and uncertainties Use of derivative financial instruments Subsequent events Outlook for 2021 Dividend Statutory appointments
393940424243444445454545
3. Financial Statements Consolidated Financial Statements Notes to the Consolidated Financial Statements Auditor’s Report Non-consolidated accounts, profit distribution and statutory appointments
464754119124
4. Glossary 127
5. Key figures 128
Table of contents
5Aliaxis SA – Consolidated Annual Report 2020
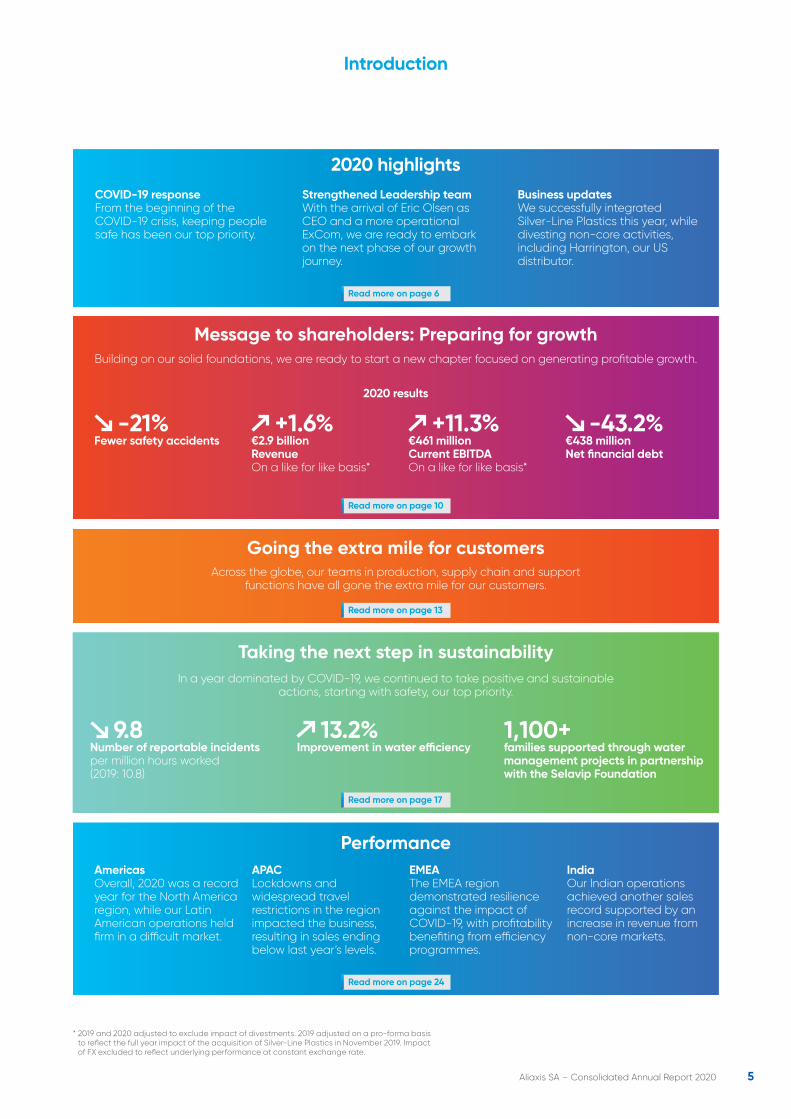
2020 highlights
Building on our solid foundations, we are ready to start a new chapter focused on generating profitable growth.
2020 results
-21%Fewer safety accidents
+1.6% €2.9 billionRevenueOn a like for like basis*
+11.3% €461 millionCurrent EBITDAOn a like for like basis*
-43.2%€438 millionNet financial debt
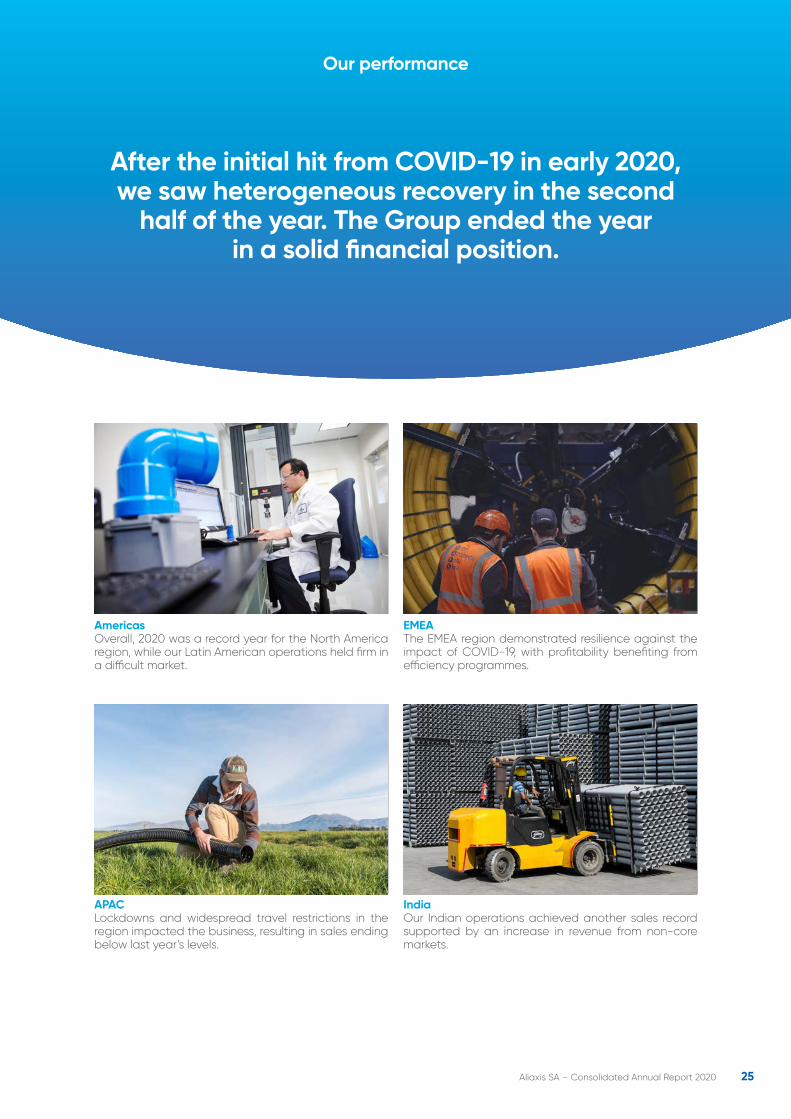
AmericasOverall, 2020 was a record year for the North America region, while our Latin American operations held firm in a difficult market.
APACLockdowns and widespread travel restrictions in the region impacted the business, resulting in sales ending below last year’s levels.
EMEAThe EMEA region demonstrated resilience against the impact of COVID-19, with profitability benefiting from efficiency programmes.
IndiaOur Indian operations achieved another sales record supported by an increase in revenue from non-core markets.
9.8Number of reportable incidents per million hours worked(2019: 10.8)
13.2%Improvement in water efficiency
1,100+families supported through water management projects in partnership with the Selavip Foundation
Message to shareholders: Preparing for growth
* 2019 and 2020 adjusted to exclude impact of divestments. 2019 adjusted on a pro-forma basis to reflect the full year impact of the acquisition of Silver-Line Plastics in November 2019. Impact of FX excluded to reflect underlying performance at constant exchange rate.
Across the globe, our teams in production, supply chain and support functions have all gone the extra mile for our customers.
Going the extra mile for customers
In a year dominated by COVID-19, we continued to take positive and sustainable actions, starting with safety, our top priority.
Taking the next step in sustainability
Performance
Read more on page 24
Read more on page 17
Read more on page 13
Read more on page 10
Read more on page 6
Introduction
COVID-19 response From the beginning of the COVID-19 crisis, keeping people safe has been our top priority.
Strengthened Leadership teamWith the arrival of Eric Olsen as CEO and a more operational ExCom, we are ready to embark on the next phase of our growth journey.
Business updatesWe successfully integrated Silver-Line Plastics this year, while divesting non-core activities, including Harrington, our US distributor.
6Aliaxis SA – Consolidated Annual Report 2020
2020 Highlights
7Aliaxis SA – Consolidated Annual Report 2020
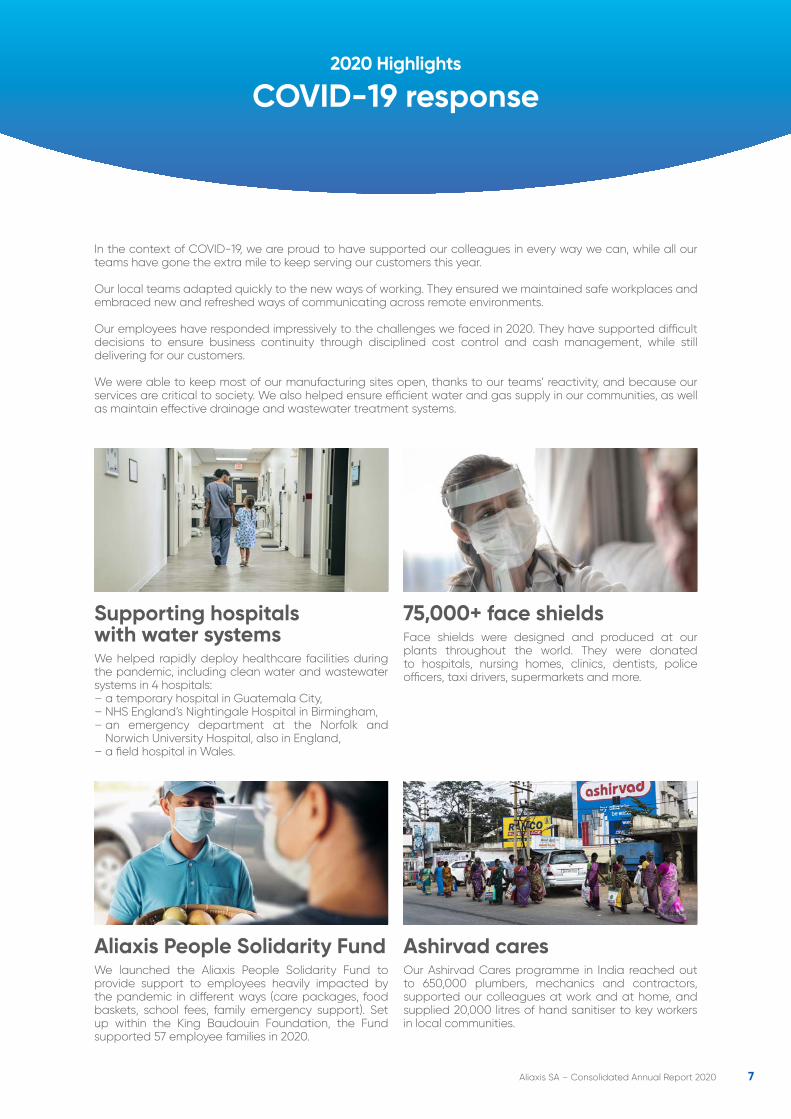
75,000+ face shields Face shields were designed and produced at our plants throughout the world. They were donated to hospitals, nursing homes, clinics, dentists, police officers, taxi drivers, supermarkets and more.
Ashirvad caresOur Ashirvad Cares programme in India reached out to 650,000 plumbers, mechanics and contractors, supported our colleagues at work and at home, and supplied 20,000 litres of hand sanitiser to key workers in local communities.
Supporting hospitals with water systemsWe helped rapidly deploy healthcare facilities during the pandemic, including clean water and wastewater systems in 4 hospitals:– a temporary hospital in Guatemala City, – NHS England’s Nightingale Hospital in Birmingham, – an emergency department at the Norfolk and
Norwich University Hospital, also in England,– a field hospital in Wales.
Aliaxis People Solidarity FundWe launched the Aliaxis People Solidarity Fund to provide support to employees heavily impacted by the pandemic in different ways (care packages, food baskets, school fees, family emergency support). Set up within the King Baudouin Foundation, the Fund supported 57 employee families in 2020.
COVID-19 response
In the context of COVID-19, we are proud to have supported our colleagues in every way we can, while all our teams have gone the extra mile to keep serving our customers this year.
Our local teams adapted quickly to the new ways of working. They ensured we maintained safe workplaces and embraced new and refreshed ways of communicating across remote environments.
Our employees have responded impressively to the challenges we faced in 2020. They have supported difficult decisions to ensure business continuity through disciplined cost control and cash management, while still delivering for our customers.
We were able to keep most of our manufacturing sites open, thanks to our teams’ reactivity, and because our services are critical to society. We also helped ensure efficient water and gas supply in our communities, as well as maintain effective drainage and wastewater treatment systems.
2020 Highlights

8Aliaxis SA – Consolidated Annual Report 2020
Our proximity to the end-customer, and the empowerment of line management are critical success factors for Aliaxis. To simplify our way of working and build a more agile team, Eric Olsen integrated our four Divisional CEOs, managing the Americas, APAC, EMEA, and India, into the ExCom.
A more operational ExCom
Welcome to Eric OlsenOlivier van der Rest, Chairman of Aliaxis, announced the appointment of Eric Olsen as CEO, who started on October 1, 2020: “Eric is a world class leader with a proven track record of delivering transformation and growth. He shares our vision and will lead the Company as we embark on the next phase of the Group transformation.”
Alongside our CEO and our Divisional CEOs, the ExCom brings together the heads of our key functional teams. These are the Chief Financial Officer, the Chief HR and CR Officer, the Chief Growth Officer and the Chief Operations and Supply Chain Officer.
Strengthened leadership team2020 Highlights
9Aliaxis SA – Consolidated Annual Report 2020
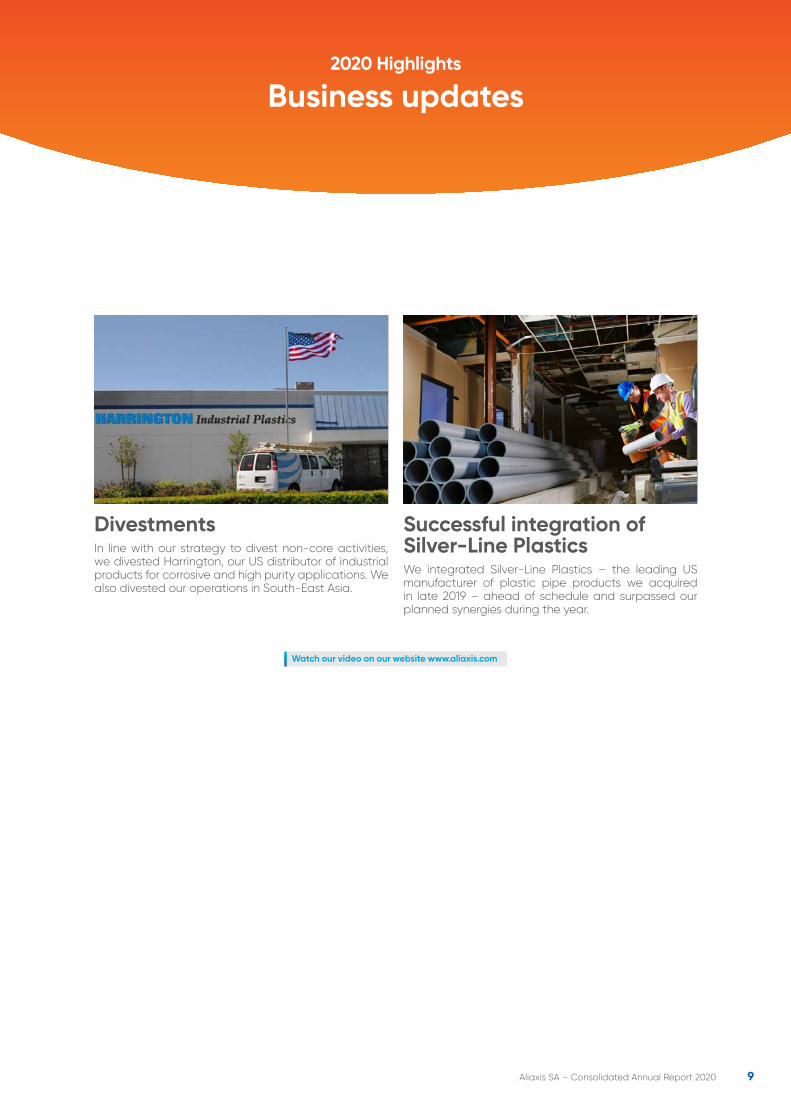
Successful integration of Silver-Line PlasticsWe integrated Silver-Line Plastics – the leading US manufacturer of plastic pipe products we acquired in late 2019 – ahead of schedule and surpassed our planned synergies during the year.
Divestments In line with our strategy to divest non-core activities, we divested Harrington, our US distributor of industrial products for corrosive and high purity applications. We also divested our operations in South-East Asia.
Watch our video on our website www.aliaxis.com
Business updates2020 Highlights

10Aliaxis SA – Consolidated Annual Report 2020
Preparing for growth
11Aliaxis SA – Consolidated Annual Report 2020
Message to our shareholders
“Despite the challenges from the pandemic, our performance in 2020 demonstrated our
resilience and underlying potential. Building on our solid foundations, we are ready to start a new chapter focused on
generating profitable growth.”
12Aliaxis SA – Consolidated Annual Report 2020
Addressing some of the world’s great challengesOur business is built to help tackle some of the world’s great challenges. That starts with water scarcity and water management and extends to rapid urbanisation and climate change. We are here to create sustainable, innovative solutions for water, fluids and energy that meet the evolving needs of our customers every day.
Protecting people and our businessIn the context of COVID-19, we are proud to have supported our colleagues in every way we can, while all our teams have gone the extra mile to keep serving our customers this year.
New protocols and ways of working were efficiently introduced, safeguarding both our teams and operations. We also reached out to our people and kept close to our customers to help them through the individual challenges they faced as a result of the pandemic.
We would like to take this opportunity to thank all our colleagues for their professionalism and dedication this year. They worked hard for the benefit of all our stakeholders. Thanks to them, we achieved solid results in 2020.
Delivering a solid performanceRevenue for the year was €2,9 billion, a decrease of 6.7% but an increase of 1.6% on a like-for-like basis*, thanks to the second half rebound. Our current EBITDA of €461 million represents an increase of 4.8% and of 11.3% on a like-for-like basis*. Net profit was up 8.2% to €199 million, including gains from divestments, and net financial debt was €437 million at year-end, down €333 million vs 2019.
Overall, these results were affected by contrasting dynamics in our different geographies. All regions were impacted by the pandemic shock in the first half. Europe, Australia and New Zealand were slower to recover in the second half. However, the Americas and India showed accelerating growth over the second half.
Stepping up for growthOur resilience demonstrated the underlying strength of the Aliaxis business model. We can build on that solid base to continue to improve our performance.
The challenge now is to step up and accelerate profitable growth.
As Chairman and CEO, we are both determined to capitalise on the opportunities in our market, via internal and external growth. We want to take Aliaxis to the next level as a high performing and growing organisation.
Safety, our top prioritySafety is our most fundamental objective. There have been improvements this year, such as better ‘near misses’ reporting, further implementation of our global standards, and a reduced number of incidents. However, we have still much to do.
We are committed to push ourselves to proactively identify risks throughout Aliaxis, to protect the health and safety of our people over the long term.
Providing sustainable solutionsThe drive for innovative technology is core to the way we manage our business. This has enabled our teams to provide more sustainable solutions for our customers and even the wider community. By opening our new research hub in Bangalore, India, we have increased our capacity and speed to solve more complex problems.
Moving from products to full solutions must become an important part of our growth story. We aim to go the extra mile to provide world-class customer service. Setting priorities for 2021In 2021, we are refocusing on our key priorities: safety, sustainability, customers, growth and operational excellence. In other words, that means safety as our top priority, making a positive impact on society, ensuring customers come first, improving our cost effectiveness, and launching Aliaxis on a growth trajectory.
Of course, challenges lie ahead, but so do tremendous opportunities, and we are excited to lead the business at this crucial moment. Now, more than ever, our teams offer specific, sustainable solutions for water management and many other critical challenges that our customers and communities face.
We see real potential for profitable growth for Aliaxis, while making a meaningful and positive contribution to society. Working closely together, we are confident we can unleash that potential.
Olivier van der Rest Eric OlsenChairman Chief Executive Officer
* 2019 and 2020 adjusted to exclude impact of divestments. 2019 adjusted on a pro-forma basis to reflect the full year impact of the acquisition of Silver-Line Plastics in November 2019. Impact of FX excluded to reflect underlying performance at constant exchange rate.
Message to our shareholders

13Aliaxis SA – Consolidated Annual Report 2020
Going the extra mile for customers
14Aliaxis SA – Consolidated Annual Report 2020
Across production, our supply chain and support functions, whether in Costa Rica, India or New Zealand, our employees have gone the extra mile to keep serving our customers. With volatile demand throughout the year in many markets, our manufacturing and supply chain teams had to carefully manage stock levels and prioritise available materials to meet our customers’ requirements.
Building digital customer relationshipsIn 2020, we have changed the way we work and expanded digital communications to engage with customers.
In Spain, for example, we made particularly good use of digital channels to maintain close relationships with our customers. We even used these digital channels to grow our business by reaching out to a broader range of our customers.
In France, we built a whole new sales and customer service platform, making use of state-of-the-art digital tools to provide customers with up-to-date information.
Similar efforts across the Group ensured that our teams were not only able to support their existing customers during the COVID-19 crisis, but also managed to build new digital relationships with customers.
Aliaxis teams were fully mobilised to develop and supply the products,
services and innovations our customers needed in a challenging time.
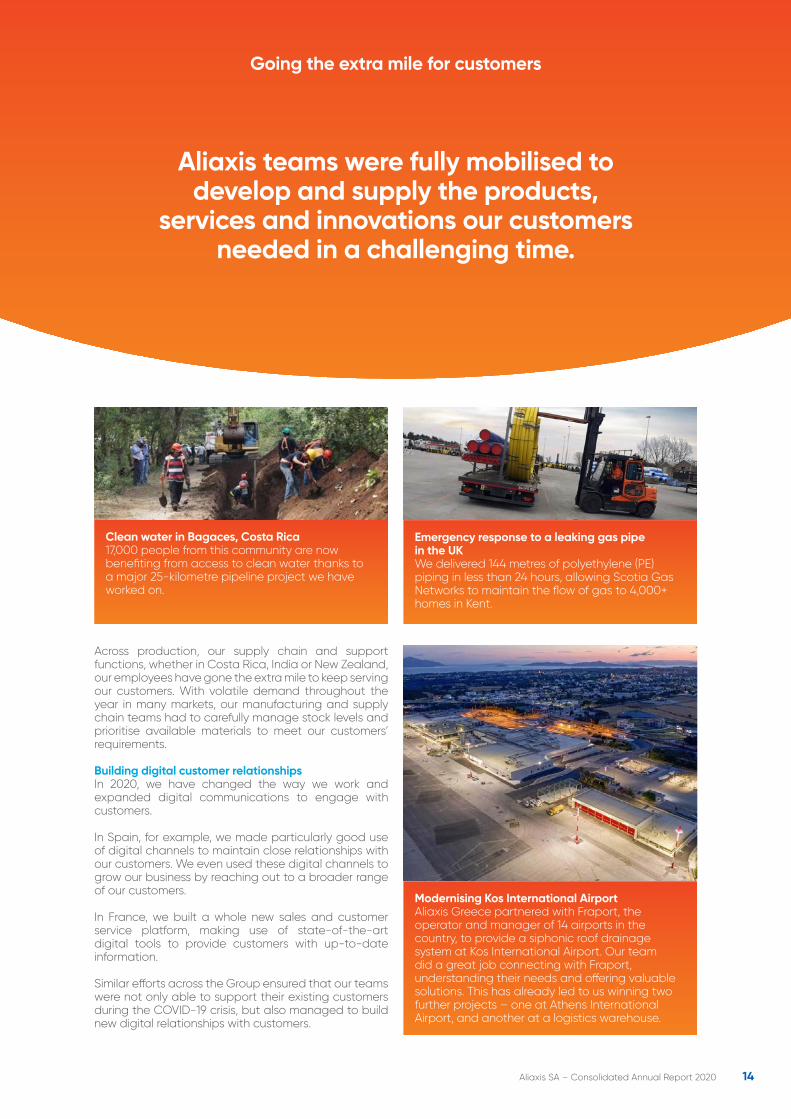
Modernising Kos International AirportAliaxis Greece partnered with Fraport, the operator and manager of 14 airports in the country, to provide a siphonic roof drainage system at Kos International Airport. Our team did a great job connecting with Fraport, understanding their needs and offering valuable solutions. This has already led to us winning two further projects – one at Athens International Airport, and another at a logistics warehouse.
Going the extra mile for customers
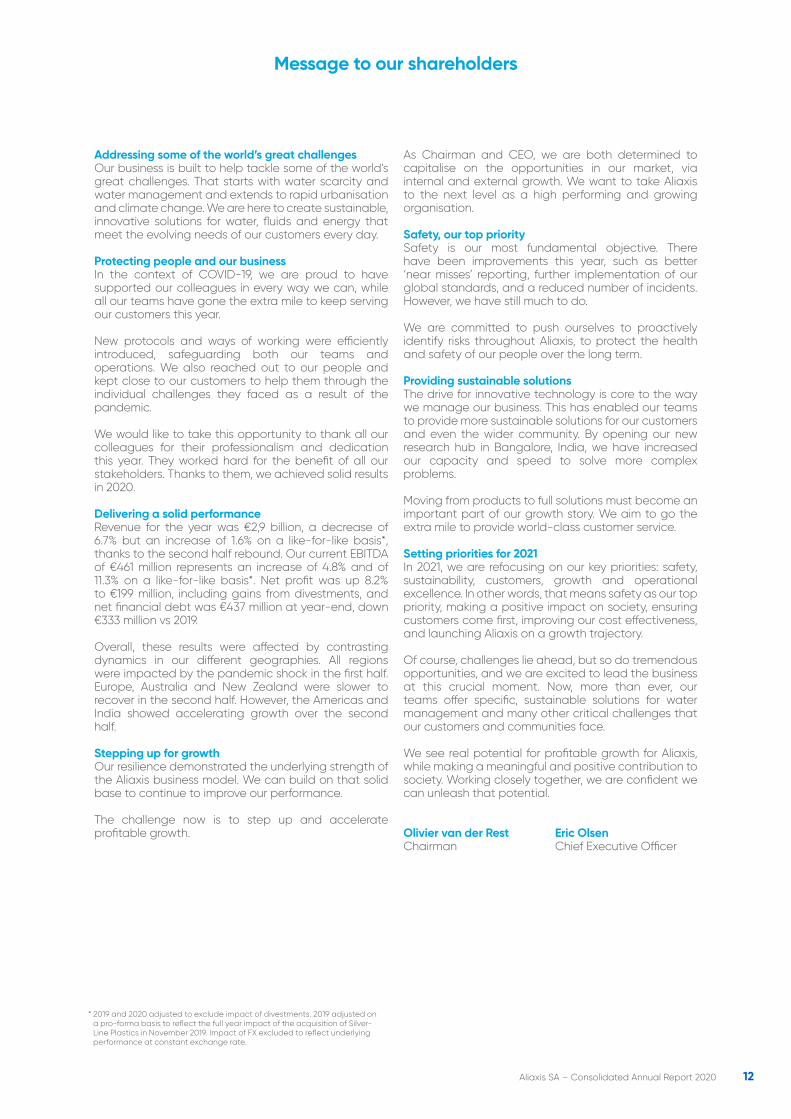
Clean water in Bagaces, Costa Rica 17,000 people from this community are now benefiting from access to clean water thanks to a major 25-kilometre pipeline project we have worked on.
Emergency response to a leaking gas pipe in the UK We delivered 144 metres of polyethylene (PE) piping in less than 24 hours, allowing Scotia Gas Networks to maintain the flow of gas to 4,000+ homes in Kent.
15Aliaxis SA – Consolidated Annual Report 2020
Innovating to meet customers’ needs We have a very disciplined approach to innovation that starts with our customers. We capture the voice of customers in many ways. Regular interactions, visiting their sites to see how products are used, and an annual global customer survey (Net Promoter Score), all help us to understand their requirements and expectations.
Building on their valuable input, we develop systems and solutions that are lighter, more efficient and sustainable, that can benefit the whole community.
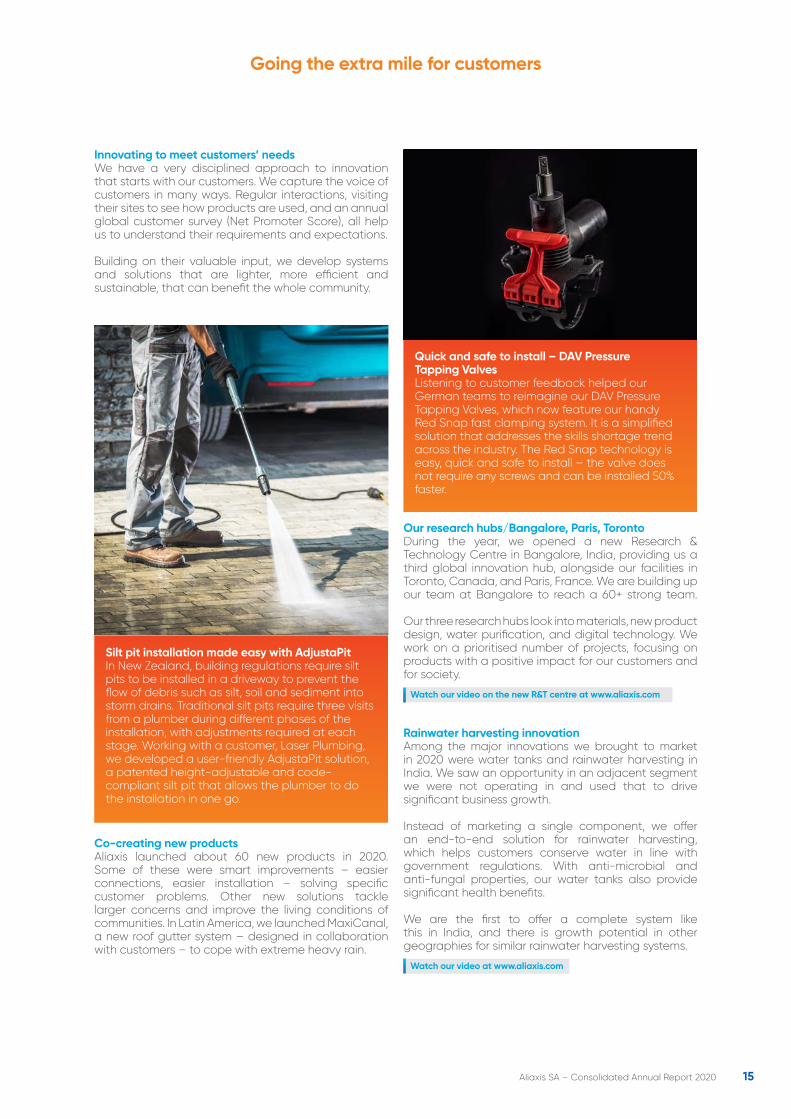
Quick and safe to install – DAV Pressure Tapping Valves Listening to customer feedback helped our German teams to reimagine our DAV Pressure Tapping Valves, which now feature our handy Red Snap fast clamping system. It is a simplified solution that addresses the skills shortage trend across the industry. The Red Snap technology is easy, quick and safe to install – the valve does not require any screws and can be installed 50% faster.
Silt pit installation made easy with AdjustaPitIn New Zealand, building regulations require silt pits to be installed in a driveway to prevent the flow of debris such as silt, soil and sediment into storm drains. Traditional silt pits require three visits from a plumber during different phases of the installation, with adjustments required at each stage. Working with a customer, Laser Plumbing, we developed a user-friendly AdjustaPit solution, a patented height-adjustable and code-compliant silt pit that allows the plumber to do the installation in one go.
Co-creating new products Aliaxis launched about 60 new products in 2020. Some of these were smart improvements – easier connections, easier installation – solving specific customer problems. Other new solutions tackle larger concerns and improve the living conditions of communities. In Latin America, we launched MaxiCanal, a new roof gutter system – designed in collaboration with customers – to cope with extreme heavy rain.
Our research hubs/Bangalore, Paris, TorontoDuring the year, we opened a new Research & Technology Centre in Bangalore, India, providing us a third global innovation hub, alongside our facilities in Toronto, Canada, and Paris, France. We are building up our team at Bangalore to reach a 60+ strong team. Our three research hubs look into materials, new product design, water purification, and digital technology. We work on a prioritised number of projects, focusing on products with a positive impact for our customers and for society.
Watch our video on the new R&T centre at www.aliaxis.com
Rainwater harvesting innovationAmong the major innovations we brought to market in 2020 were water tanks and rainwater harvesting in India. We saw an opportunity in an adjacent segment we were not operating in and used that to drive significant business growth.
Instead of marketing a single component, we offer an end-to-end solution for rainwater harvesting, which helps customers conserve water in line with government regulations. With anti-microbial and anti-fungal properties, our water tanks also provide significant health benefits.
We are the first to offer a complete system like this in India, and there is growth potential in other geographies for similar rainwater harvesting systems.
Watch our video at www.aliaxis.com
Going the extra mile for customers
16Aliaxis SA – Consolidated Annual Report 2020
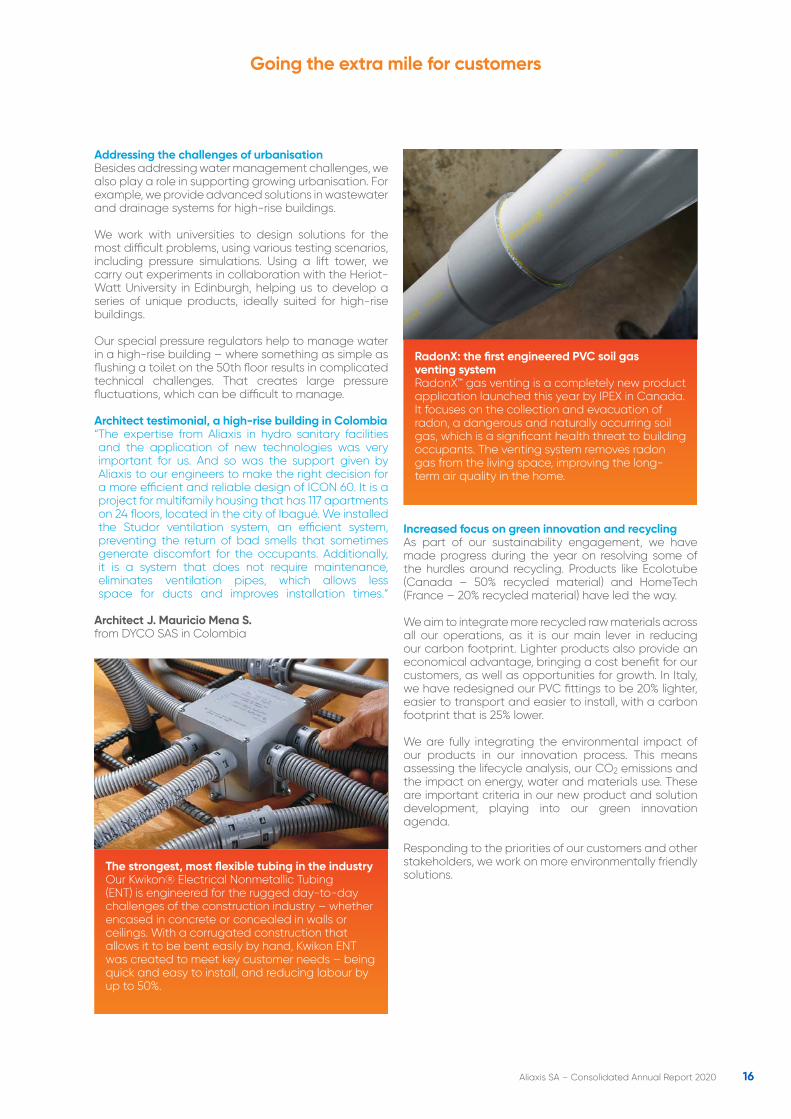
RadonX: the first engineered PVC soil gas venting system RadonX™ gas venting is a completely new product application launched this year by IPEX in Canada. It focuses on the collection and evacuation of radon, a dangerous and naturally occurring soil gas, which is a significant health threat to building occupants. The venting system removes radon gas from the living space, improving the long-term air quality in the home.
Addressing the challenges of urbanisation Besides addressing water management challenges, we also play a role in supporting growing urbanisation. For example, we provide advanced solutions in wastewater and drainage systems for high-rise buildings.
We work with universities to design solutions for the most difficult problems, using various testing scenarios, including pressure simulations. Using a lift tower, we carry out experiments in collaboration with the Heriot-Watt University in Edinburgh, helping us to develop a series of unique products, ideally suited for high-rise buildings.
Our special pressure regulators help to manage water in a high-rise building – where something as simple as flushing a toilet on the 50th floor results in complicated technical challenges. That creates large pressure fluctuations, which can be difficult to manage.
Architect testimonial, a high-rise building in Colombia“ The expertise from Aliaxis in hydro sanitary facilities and the application of new technologies was very important for us. And so was the support given by Aliaxis to our engineers to make the right decision for a more efficient and reliable design of ICON 60. It is a project for multifamily housing that has 117 apartments on 24 floors, located in the city of Ibagué. We installed the Studor ventilation system, an efficient system, preventing the return of bad smells that sometimes generate discomfort for the occupants. Additionally, it is a system that does not require maintenance, eliminates ventilation pipes, which allows less space for ducts and improves installation times.”
Architect J. Mauricio Mena S. from DYCO SAS in Colombia
Increased focus on green innovation and recycling As part of our sustainability engagement, we have made progress during the year on resolving some of the hurdles around recycling. Products like Ecolotube (Canada – 50% recycled material) and HomeTech (France – 20% recycled material) have led the way.
We aim to integrate more recycled raw materials across all our operations, as it is our main lever in reducing our carbon footprint. Lighter products also provide an economical advantage, bringing a cost benefit for our customers, as well as opportunities for growth. In Italy, we have redesigned our PVC fittings to be 20% lighter, easier to transport and easier to install, with a carbon footprint that is 25% lower.
We are fully integrating the environmental impact of our products in our innovation process. This means assessing the lifecycle analysis, our CO2 emissions and the impact on energy, water and materials use. These are important criteria in our new product and solution development, playing into our green innovation agenda.
Responding to the priorities of our customers and other stakeholders, we work on more environmentally friendly solutions.
The strongest, most flexible tubing in the industry Our Kwikon® Electrical Nonmetallic Tubing (ENT) is engineered for the rugged day-to-day challenges of the construction industry – whether encased in concrete or concealed in walls or ceilings. With a corrugated construction that allows it to be bent easily by hand, Kwikon ENT was created to meet key customer needs – being quick and easy to install, and reducing labour by up to 50%.
Going the extra mile for customers
17Aliaxis SA – Consolidated Annual Report 2020
Taking the next step
in sustainbility
18Aliaxis SA – Consolidated Annual Report 2020
Doing business responsibly and sustainablyOur approach to sustainability is founded on ethical business practices, and a strong commitment to people and the planet.
In 2020, we developed a sustainability framework, based on a materiality analysis to identify where we can make the biggest impact. It defines three main axes for enhancing our sustainable performance over the coming years:
Aliaxis wants to make a positive difference in the world. Caring for our people and
customers, engaging with our communities, we develop sustainable solutions for our
business and society.
1.Safety is our top priority, central to our robust internal business practices
2.High impact areas linked to our core business, such as circular economy, green innovation and recycling
3.Our commitment to provide solutions for sustainable water management
A dedicated council (involving both the ExCom in full and internal experts) has been established to oversee the implementation of the framework.
Read more on our website: aliaxis.com/we-are-aliaxis/sustainability/
Taking the next step in sustainability
19Aliaxis SA – Consolidated Annual Report 2020
Health and Safety, our top priorityIn 2020, we focused on keeping our people safe, both from incidents at work and from COVID-19 contamination.
The COVID-19 pandemic significantly affected Aliaxis’ operations in many ways: government-mandated lockdowns, travel restrictions, and most importantly ensuring employee health and safety, while maintaining operational commitments to meet our customers’ needs.
A Group crisis team and local crisis management teams were activated to provide a global integrated response. To our knowledge, we had no contamination in the workplace. However, since the outbreak of the pandemic hundreds of colleagues around the world where infected and sadly 5 of them passed away. Via the Aliaxis People Solidarity Fund, we provided support to employees heavily impacted by the pandemic.
At Aliaxis we strive for an injury-free work environment and safety is our top priority. Our leading indicator is the reportable incident rate per million hours worked. In 2020, there were 21% fewer accidents versus 2019, North America being the region which improved most with a decrease of 28%.
-21% Reportable incidents375 in 2020 vs 473 in 2019
9.8Number of reportable incidents Per million hours worked2019: 10.8
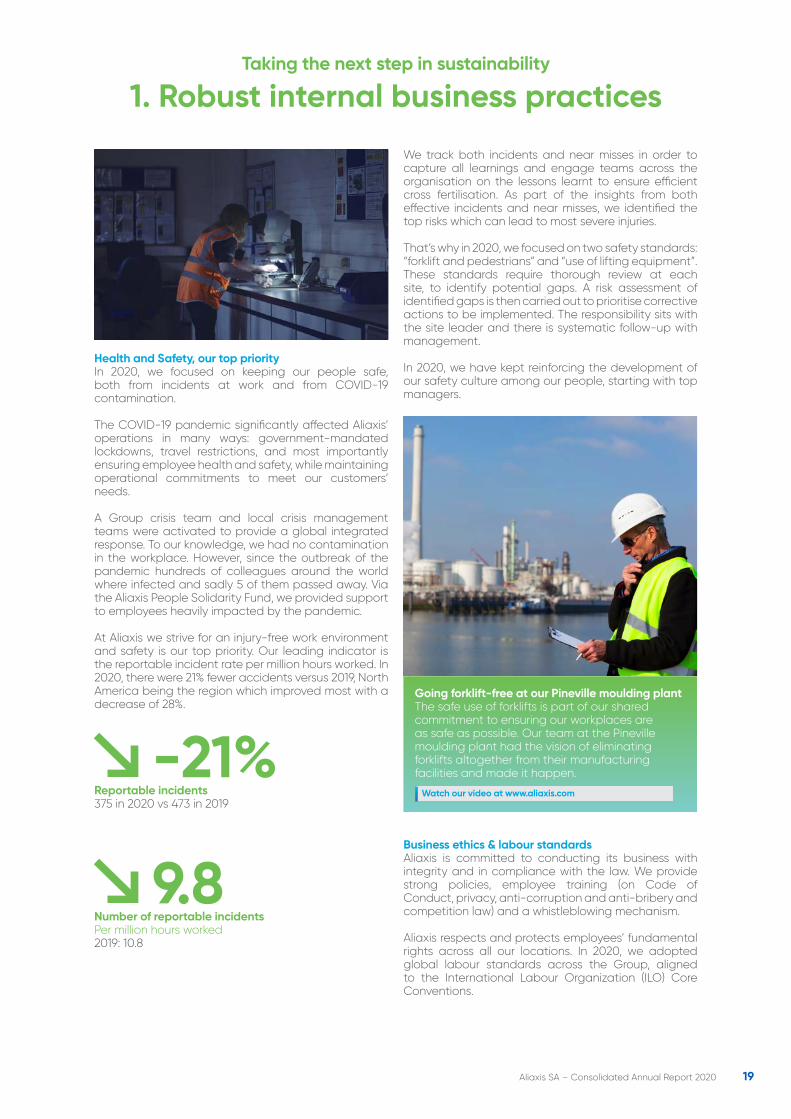
Going forklift-free at our Pineville moulding plantThe safe use of forklifts is part of our shared commitment to ensuring our workplaces are as safe as possible. Our team at the Pineville moulding plant had the vision of eliminating forklifts altogether from their manufacturing facilities and made it happen.
Watch our video at www.aliaxis.com
Business ethics & labour standardsAliaxis is committed to conducting its business with integrity and in compliance with the law. We provide strong policies, employee training (on Code of Conduct, privacy, anti-corruption and anti-bribery and competition law) and a whistleblowing mechanism. Aliaxis respects and protects employees’ fundamental rights across all our locations. In 2020, we adopted global labour standards across the Group, aligned to the International Labour Organization (ILO) Core Conventions.
We track both incidents and near misses in order to capture all learnings and engage teams across the organisation on the lessons learnt to ensure efficient cross fertilisation. As part of the insights from both effective incidents and near misses, we identified the top risks which can lead to most severe injuries.
That’s why in 2020, we focused on two safety standards: “forklift and pedestrians” and “use of lifting equipment”. These standards require thorough review at each site, to identify potential gaps. A risk assessment of identified gaps is then carried out to prioritise corrective actions to be implemented. The responsibility sits with the site leader and there is systematic follow-up with management.
In 2020, we have kept reinforcing the development of our safety culture among our people, starting with top managers.
1. Robust internal business practicesTaking the next step in sustainability
20Aliaxis SA – Consolidated Annual Report 2020
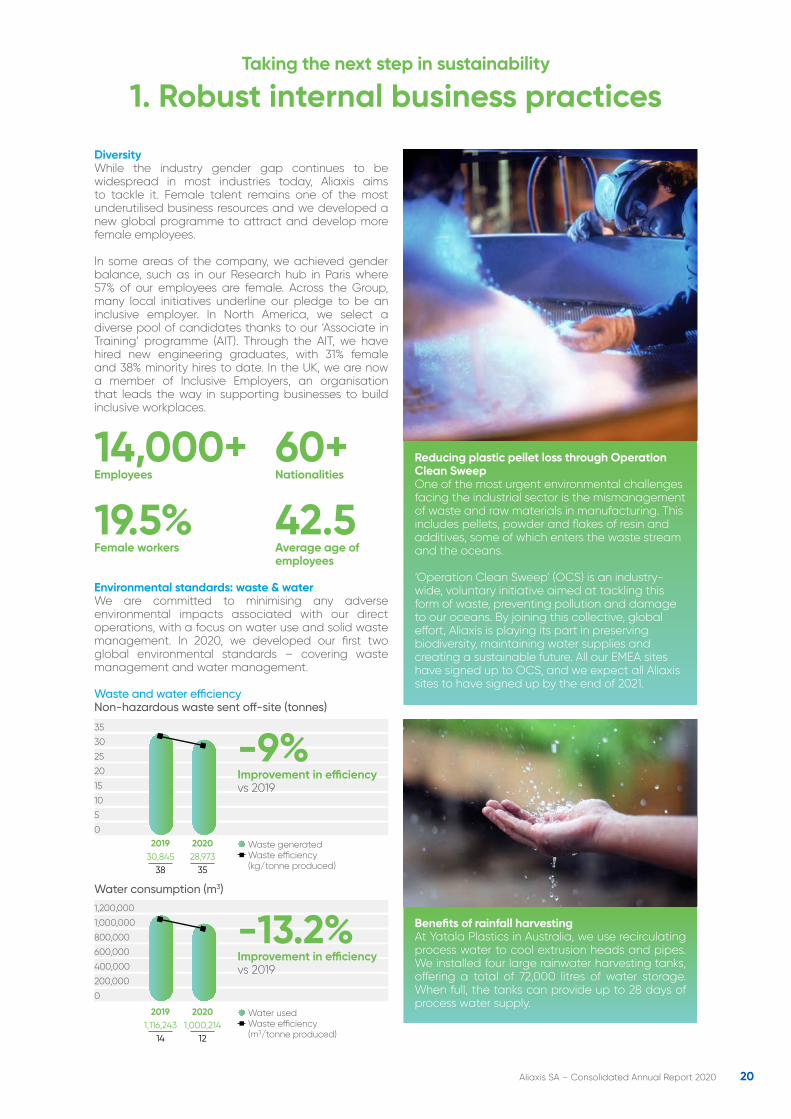
DiversityWhile the industry gender gap continues to be widespread in most industries today, Aliaxis aims to tackle it. Female talent remains one of the most underutilised business resources and we developed a new global programme to attract and develop more female employees.
In some areas of the company, we achieved gender balance, such as in our Research hub in Paris where 57% of our employees are female. Across the Group, many local initiatives underline our pledge to be an inclusive employer. In North America, we select a diverse pool of candidates thanks to our ‘Associate in Training’ programme (AIT). Through the AIT, we have hired new engineering graduates, with 31% female and 38% minority hires to date. In the UK, we are now a member of Inclusive Employers, an organisation that leads the way in supporting businesses to build inclusive workplaces.
14,000+ 60+ Employees Nationalities
19.5% 42.5Female workers Average age of employees
Environmental standards: waste & waterWe are committed to minimising any adverse environmental impacts associated with our direct operations, with a focus on water use and solid waste management. In 2020, we developed our first two global environmental standards – covering waste management and water management.
Waste and water efficiency Non-hazardous waste sent off-site (tonnes)
Going forklift-free at our Pineville moulding plantThe safe use of forklifts is part of our shared commitment to ensuring our workplaces are as safe as possible. Our team at the Pineville moulding plant had the vision of eliminating forklifts altogether from their manufacturing facilities and made it happen.
Reducing plastic pellet loss through Operation Clean SweepOne of the most urgent environmental challenges facing the industrial sector is the mismanagement of waste and raw materials in manufacturing. This includes pellets, powder and flakes of resin and additives, some of which enters the waste stream and the oceans. ‘Operation Clean Sweep’ (OCS) is an industry-wide, voluntary initiative aimed at tackling this form of waste, preventing pollution and damage to our oceans. By joining this collective, global effort, Aliaxis is playing its part in preserving biodiversity, maintaining water supplies and creating a sustainable future. All our EMEA sites have signed up to OCS, and we expect all Aliaxis sites to have signed up by the end of 2021.
Benefits of rainfall harvestingAt Yatala Plastics in Australia, we use recirculating process water to cool extrusion heads and pipes. We installed four large rainwater harvesting tanks, offering a total of 72,000 litres of water storage. When full, the tanks can provide up to 28 days of process water supply.
35
30
25
20
15
10
5
0
-9% Improvement in efficiencyvs 2019
Waste generatedWaste efficiency (kg/tonne produced)
201930,84538
202028,97335
1,200,000
1,000,000
800,000
600,000
400,000
200,000
0
Water usedWaste efficiency (m3/tonne produced)
20191,116,243
14
20201,000,214
12
-13.2% Improvement in efficiencyvs 2019
Water consumption (m3)
1. Robust internal business practicesTaking the next step in sustainability
21Aliaxis SA – Consolidated Annual Report 2020
Our product development and research portfolios include innovations designed to reduce the weight of products, conserve materials, protect the environment and increase product lifetime. For example, RadonX is a solution available in North America, which removes dangerous gas. And in Italy, our lighter products have a measurable benefit in terms of reducing CO2 emissions.
We also identified a partner (VITO – an independent Belgian research organisation specialising in cleantech and sustainable development) to help us build a lifecycle assessment approach into our innovation process.
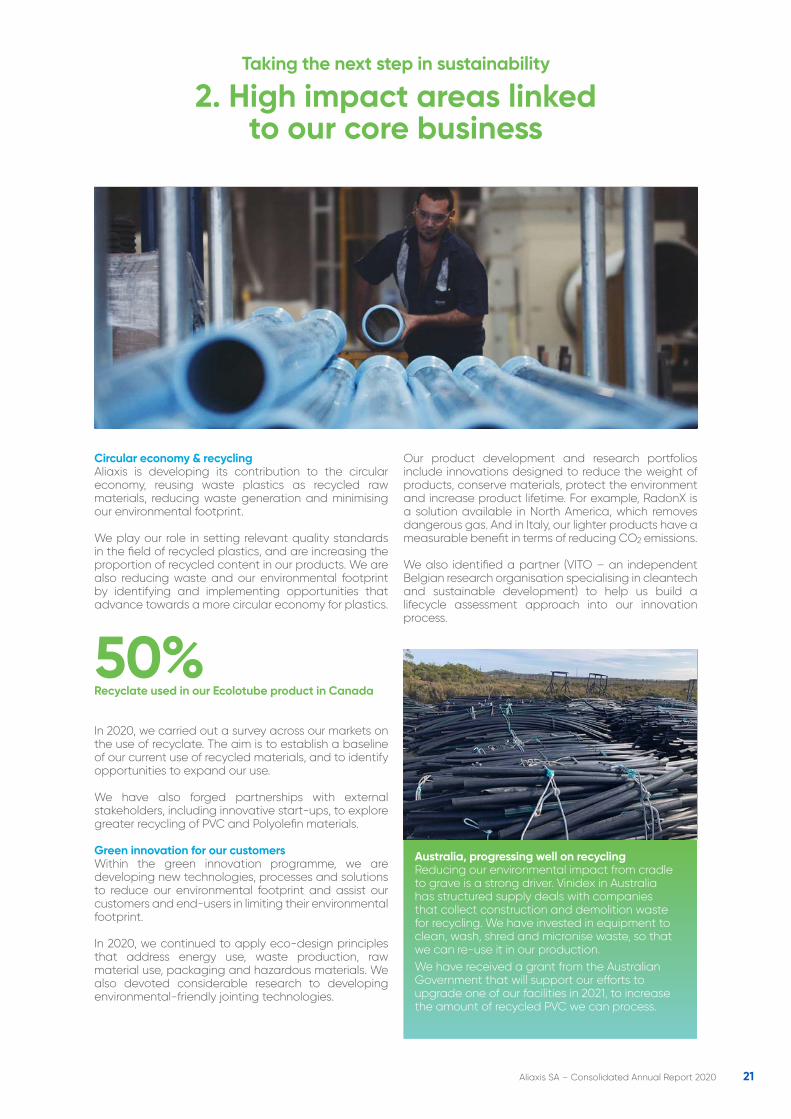
Australia, progressing well on recycling Reducing our environmental impact from cradle to grave is a strong driver. Vinidex in Australia has structured supply deals with companies that collect construction and demolition waste for recycling. We have invested in equipment to clean, wash, shred and micronise waste, so that we can re-use it in our production. We have received a grant from the Australian Government that will support our efforts to upgrade one of our facilities in 2021, to increase the amount of recycled PVC we can process.
Circular economy & recyclingAliaxis is developing its contribution to the circular economy, reusing waste plastics as recycled raw materials, reducing waste generation and minimising our environmental footprint.
We play our role in setting relevant quality standards in the field of recycled plastics, and are increasing the proportion of recycled content in our products. We are also reducing waste and our environmental footprint by identifying and implementing opportunities that advance towards a more circular economy for plastics.
50% Recyclate used in our Ecolotube product in Canada
In 2020, we carried out a survey across our markets on the use of recyclate. The aim is to establish a baseline of our current use of recycled materials, and to identify opportunities to expand our use.
We have also forged partnerships with external stakeholders, including innovative start-ups, to explore greater recycling of PVC and Polyolefin materials.
Green innovation for our customersWithin the green innovation programme, we are developing new technologies, processes and solutions to reduce our environmental footprint and assist our customers and end-users in limiting their environmental footprint.
In 2020, we continued to apply eco-design principles that address energy use, waste production, raw material use, packaging and hazardous materials. We also devoted considerable research to developing environmental-friendly jointing technologies.
2. High impact areas linked to our core business
Taking the next step in sustainability
22Aliaxis SA – Consolidated Annual Report 2020
800,000
700,000
600,000
500,000
400,000
300,000
200,000
100,0002019711,587888
2020692,854837
-5.7% Energy efficiencyvs 2019
Energy use (MWh)Energy efficiency (kwh/tonne produced)
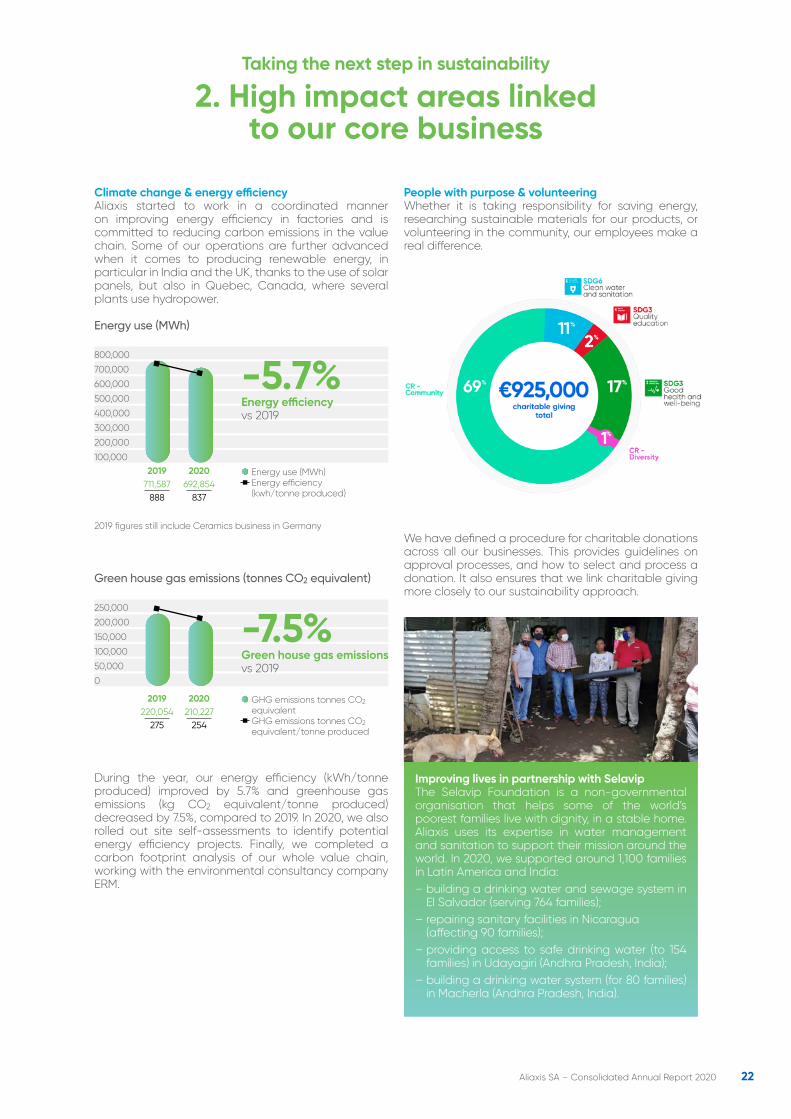
Improving lives in partnership with SelavipThe Selavip Foundation is a non-governmental organisation that helps some of the world’s poorest families live with dignity, in a stable home. Aliaxis uses its expertise in water management and sanitation to support their mission around the world. In 2020, we supported around 1,100 families in Latin America and India:– building a drinking water and sewage system in
El Salvador (serving 764 families); – repairing sanitary facilities in Nicaragua
(affecting 90 families); – providing access to safe drinking water (to 154
families) in Udayagiri (Andhra Pradesh, India); – building a drinking water system (for 80 families)
in Macherla (Andhra Pradesh, India).
250,000
200,000
150,000
100,000
50,000
0
2019220,054
275
2020210,227254
-7.5% Green house gas emissionsvs 2019
GHG emissions tonnes CO2 equivalentGHG emissions tonnes CO2 equivalent/tonne produced
2. High impact areas linked to our core business
Taking the next step in sustainability
Climate change & energy efficiencyAliaxis started to work in a coordinated manner on improving energy efficiency in factories and is committed to reducing carbon emissions in the value chain. Some of our operations are further advanced when it comes to producing renewable energy, in particular in India and the UK, thanks to the use of solar panels, but also in Quebec, Canada, where several plants use hydropower.
Energy use (MWh)
2019 figures still include Ceramics business in Germany
Green house gas emissions (tonnes CO2 equivalent)
During the year, our energy efficiency (kWh/tonne produced) improved by 5.7% and greenhouse gas emissions (kg CO2 equivalent/tonne produced) decreased by 7.5%, compared to 2019. In 2020, we also rolled out site self-assessments to identify potential energy efficiency projects. Finally, we completed a carbon footprint analysis of our whole value chain, working with the environmental consultancy company ERM.
People with purpose & volunteeringWhether it is taking responsibility for saving energy, researching sustainable materials for our products, or volunteering in the community, our employees make a real difference.
We have defined a procedure for charitable donations across all our businesses. This provides guidelines on approval processes, and how to select and process a donation. It also ensures that we link charitable giving more closely to our sustainability approach.
23Aliaxis SA – Consolidated Annual Report 2020
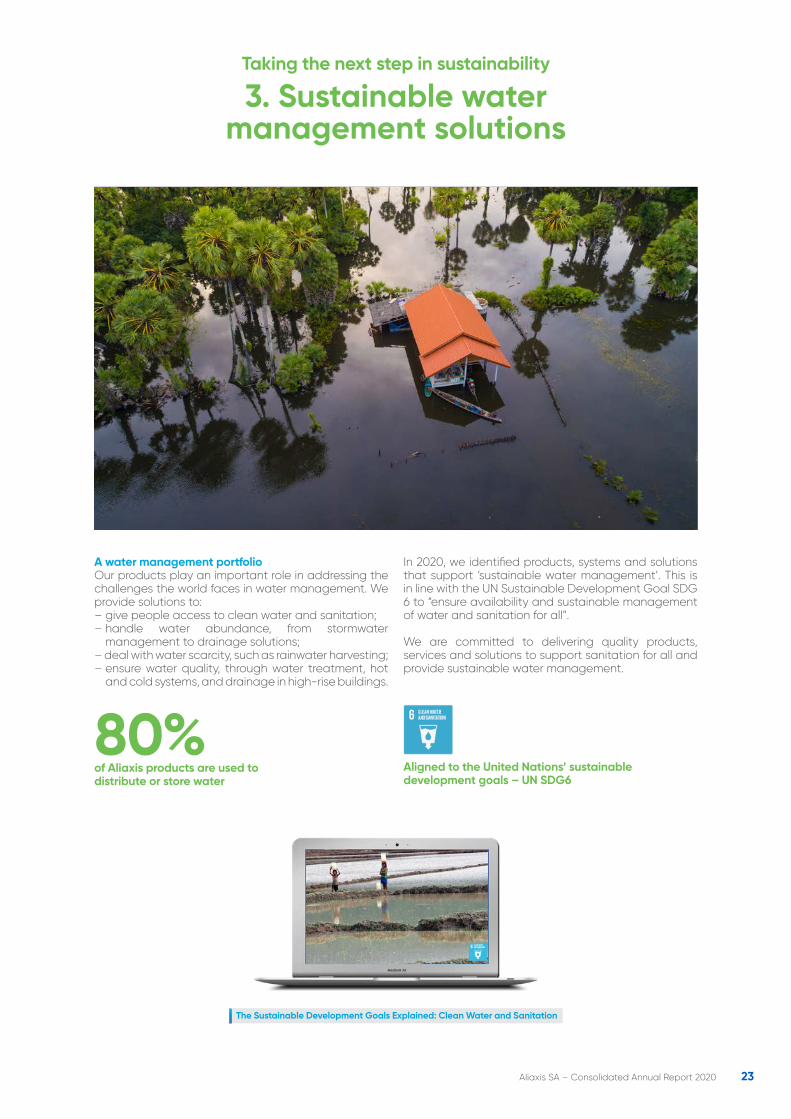
A water management portfolioOur products play an important role in addressing the challenges the world faces in water management. We provide solutions to:– give people access to clean water and sanitation;– handle water abundance, from stormwater
management to drainage solutions;– deal with water scarcity, such as rainwater harvesting;– ensure water quality, through water treatment, hot
and cold systems, and drainage in high-rise buildings.
80% of Aliaxis products are used to distribute or store water
In 2020, we identified products, systems and solutions that support ‘sustainable water management’. This is in line with the UN Sustainable Development Goal SDG 6 to “ensure availability and sustainable management of water and sanitation for all”.
We are committed to delivering quality products, services and solutions to support sanitation for all and provide sustainable water management.
The Sustainable Development Goals Explained: Clean Water and Sanitation
Aligned to the United Nations’ sustainable development goals – UN SDG6
3. Sustainable water management solutions
Taking the next step in sustainability
24Aliaxis SA – Consolidated Annual Report 2020
Our performance
25Aliaxis SA – Consolidated Annual Report 2020
AmericasOverall, 2020 was a record year for the North America region, while our Latin American operations held firm in a difficult market.
APACLockdowns and widespread travel restrictions in the region impacted the business, resulting in sales ending below last year’s levels.
EMEAThe EMEA region demonstrated resilience against the impact of COVID-19, with profitability benefiting from efficiency programmes.
IndiaOur Indian operations achieved another sales record supported by an increase in revenue from non-core markets.
After the initial hit from COVID-19 in early 2020, we saw heterogeneous recovery in the second
half of the year. The Group ended the year in a solid financial position.
Our performance
26Aliaxis SA – Consolidated Annual Report 2020
We continued to invest in customer and end-user driven innovation to further differentiate Aliaxis North America from its competitors, and we successfully integrated Silver-Line Plastics in our organisation.
In Latin America, we ventured into new channels in specific countries and segments, while focusing on markets with potential for sustainable, profitable growth.
We launched improvement initiatives to help us drive value in our manufacturing plants, in our supply chain, and for our customers, while ensuring we enforced all relevant measures to prevent COVID-19 virus spread.
North AmericaMarket overview Strong start to the yearWe saw favourable market conditions across North America at the start of the year. Canada entered 2020 with growth in the real estate market, residential investment and household consumption. There was strong demand in the USA from both housing and non-residential construction starts, with low unemployment driving consumer confidence and spending.
HeadwindsCOVID-related containment measures resulted in housing and non-residential construction starts falling in the USA, though the economy remained resilient in the first half.
Hurricanes and severe weather during the year caused significant disruption to our raw material supply in the USA’s Gulf Coast area. Two of the four major PVC resin producers had to declare force majeure, exacerbating the tight PVC pipe and fittings supply situation, which was already suffering due to COVID-related production slowdowns.
There was a dual impact on the Canadian economy, as alongside COVID-19, the global demand for oil plummeted. This led to a sudden, deep contraction in economic activity and rising unemployment in the country. Total construction starts fell, with demand for new buildings down sharply.
Recovery in the second half of the yearIn Canada, the slowdown in construction eased in the second half of the year, with a rise in total building permits issued. There was an increase in housing starts and business fixed investment in the USA, leading to a strong second half in our markets.
Strategy and performance Robust demand and sales After significant disruptions to construction activity across North America, sales and production in both Canada and the USA recovered in the third quarter, and remained buoyant for the rest of the year.
While our businesses continued to operate as an essential service, the pandemic impacted everyone and changed the way we live and work.
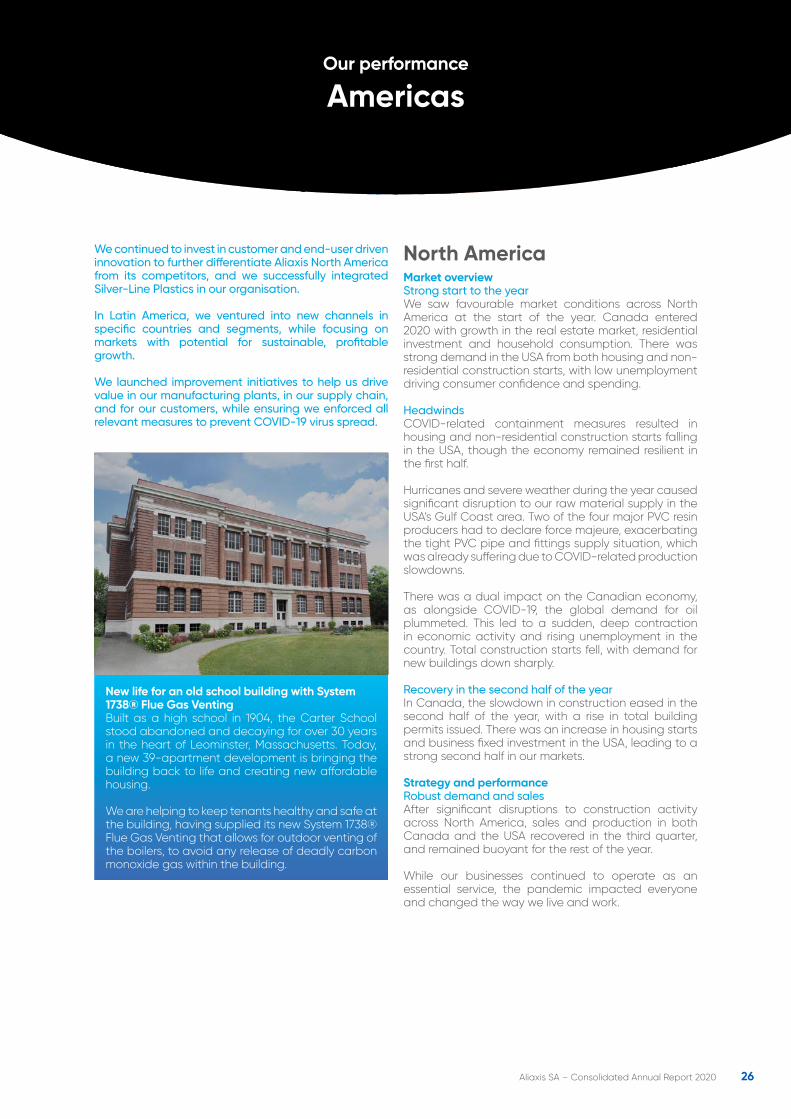
New life for an old school building with System 1738® Flue Gas VentingBuilt as a high school in 1904, the Carter School stood abandoned and decaying for over 30 years in the heart of Leominster, Massachusetts. Today, a new 39-apartment development is bringing the building back to life and creating new affordable housing.
We are helping to keep tenants healthy and safe at the building, having supplied its new System 1738® Flue Gas Venting that allows for outdoor venting of the boilers, to avoid any release of deadly carbon monoxide gas within the building.
AmericasOur performance
27Aliaxis SA – Consolidated Annual Report 2020
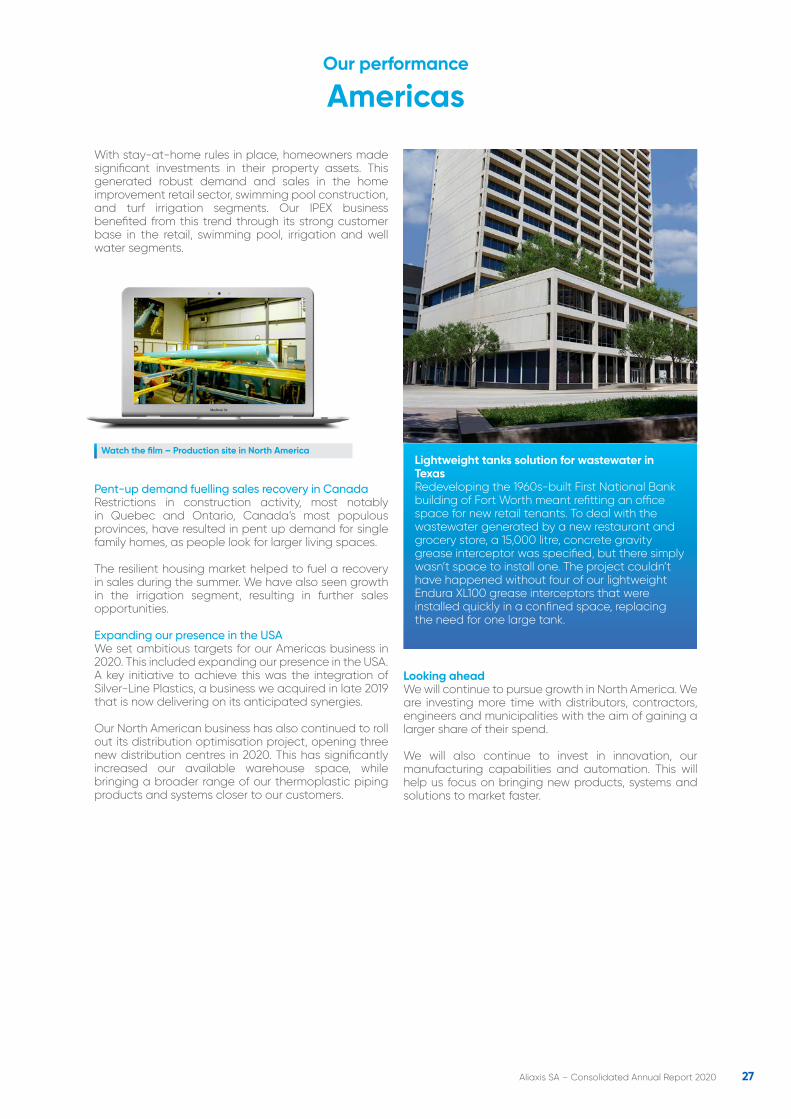
Lightweight tanks solution for wastewater in Texas Redeveloping the 1960s-built First National Bank building of Fort Worth meant refitting an office space for new retail tenants. To deal with the wastewater generated by a new restaurant and grocery store, a 15,000 litre, concrete gravity grease interceptor was specified, but there simply wasn’t space to install one. The project couldn’t have happened without four of our lightweight Endura XL100 grease interceptors that were installed quickly in a confined space, replacing the need for one large tank.
AmericasOur performance
Looking aheadWe will continue to pursue growth in North America. We are investing more time with distributors, contractors, engineers and municipalities with the aim of gaining a larger share of their spend.
We will also continue to invest in innovation, our manufacturing capabilities and automation. This will help us focus on bringing new products, systems and solutions to market faster.
With stay-at-home rules in place, homeowners made significant investments in their property assets. This generated robust demand and sales in the home improvement retail sector, swimming pool construction, and turf irrigation segments. Our IPEX business benefited from this trend through its strong customer base in the retail, swimming pool, irrigation and well water segments.
Watch the film – Production site in North America
Pent-up demand fuelling sales recovery in CanadaRestrictions in construction activity, most notably in Quebec and Ontario, Canada’s most populous provinces, have resulted in pent up demand for single family homes, as people look for larger living spaces.
The resilient housing market helped to fuel a recovery in sales during the summer. We have also seen growth in the irrigation segment, resulting in further sales opportunities.
Expanding our presence in the USAWe set ambitious targets for our Americas business in 2020. This included expanding our presence in the USA. A key initiative to achieve this was the integration of Silver-Line Plastics, a business we acquired in late 2019 that is now delivering on its anticipated synergies.
Our North American business has also continued to roll out its distribution optimisation project, opening three new distribution centres in 2020. This has significantly increased our available warehouse space, while bringing a broader range of our thermoplastic piping products and systems closer to our customers.
28Aliaxis SA – Consolidated Annual Report 2020
Opportunities for market share gains A number of our plants and warehouses in Latin America were closed for weeks and some for months. However, our resilient response enabled us to restart and achieve a rapid sales recovery across most markets. Some of our competitors needed more time to re-activate their businesses after the initial lockdown, providing us with opportunities.
Looking ahead We are targeting further growth in key markets across Latin America, while focusing on key concerns in the region, such as a difficult economic and political environment in certain countries or expected higher resin prices.
With significant potential for further disruption due to COVID-19, we will apply the lessons learned in 2020 against a likely backdrop of low to medium growth in general economic activity across the region.
Latin AmericaMarket overview Healthy demand impacted by COVID-19At the start of the year, demand was healthy in most of our Latin American markets, especially Guatemala, Peru, Chile and Uruguay. Private investment in South America was also up in both building construction and irrigation projects.
However, the impact of COVID-19 prevention measures was felt across Latin America, resulting in a steep drop in demand lasting several months. Many businesses had to close due to lockdowns, leading to delays in payments for goods and services.
The second half of the year saw a steady recovery in demand in the building construction segment in Latin America and, to a lesser extent, public investment in infrastructure.
Strategy and performance Growth in key markets We continued to focus on markets with the greatest potential for sustainable, profitable growth. Our local team also smoothly completed the last phase of our footprint rationalisation by exiting Mexico.
While demand was impacted across the region due to lower levels of building and infrastructure construction in the pandemic, we maintained strong customer engagement. This helped us win back an important DIY customer in Chile, representing a significant part of our sales in the country.
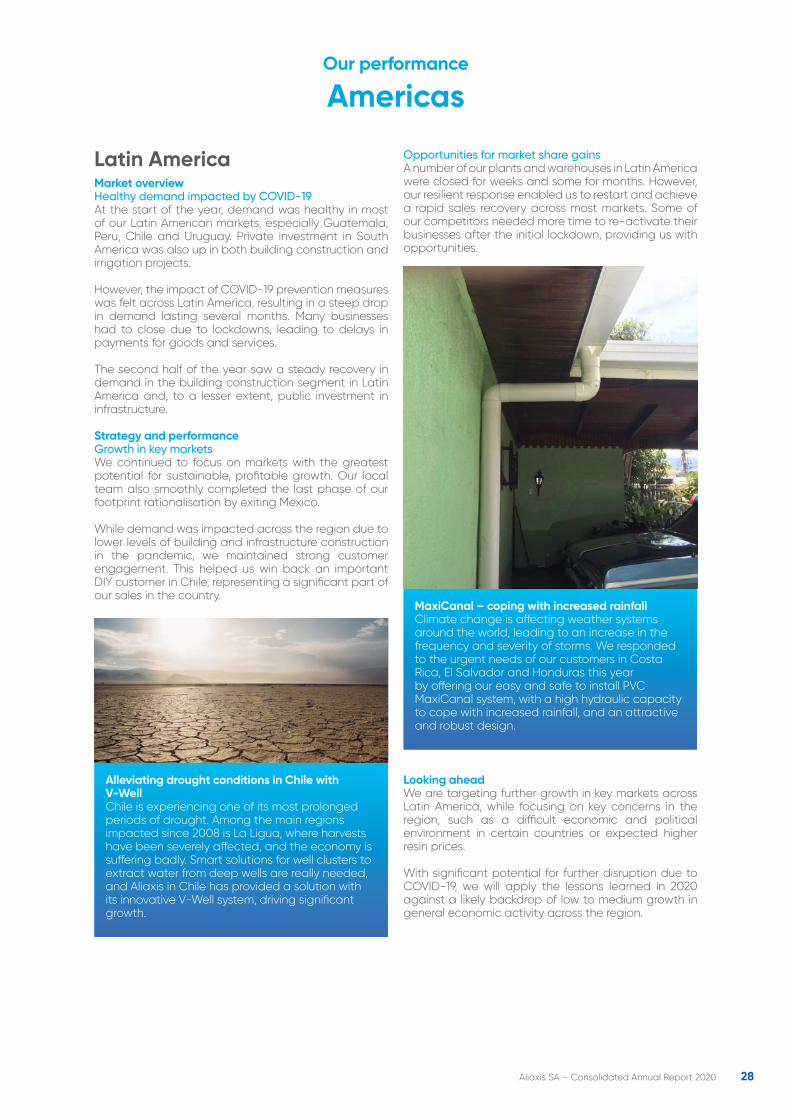
MaxiCanal – coping with increased rainfallClimate change is affecting weather systems around the world, leading to an increase in the frequency and severity of storms. We responded to the urgent needs of our customers in Costa Rica, El Salvador and Honduras this year by offering our easy and safe to install PVC MaxiCanal system, with a high hydraulic capacity to cope with increased rainfall, and an attractive and robust design.
Americas
Alleviating drought conditions in Chile with V-WellChile is experiencing one of its most prolonged periods of drought. Among the main regions impacted since 2008 is La Ligua, where harvests have been severely affected, and the economy is suffering badly. Smart solutions for well clusters to extract water from deep wells are really needed, and Aliaxis in Chile has provided a solution with its innovative V-Well system, driving significant growth.
Our performance
29Aliaxis SA – Consolidated Annual Report 2020
APAC
In Australia and New Zealand, we laid the foundations for future growth. This included strengthening our customer facing teams to focus on our key segments in the region – building, infrastructure and agriculture – and extending our operational excellence programme across the region.
We have significantly improved our ability to supply sustainable pipe products through our recycling and product lifecycle programme. We also divested our businesses in South-East Asia (in Malaysia and Singapore), in line with our strategy to focus on core growth markets.
Market overview Market volatility due to COVID-19The year has been characterised by rapidly changing market demand and volatility in activity by segment in our APAC markets, associated with the impacts of COVID-19.
Government support and low interest rates drove an upturn in demand within the building segment during the second half of the year. In contrast, infrastructure has been impacted by low business confidence and lighter than expected government stimulus. The agriculture segment had a mixed performance due to adverse weather conditions in key geographies.
From contraction to recovery in Australia The COVID-19 pandemic led to a severe contraction in economic activity in Australia during March. An aggressive approach to virus containment resulted in a series of strict regional lockdowns across the year, impacting local business confidence and market activity.
Economic conditions recovered slowly as containment measures were eased in May, and government fiscal policies provided much needed support to the Australian economy.
Resilient economy in New Zealand Although the New Zealand economy was significantly impacted by a four-week nationwide lockdown in April, the balance of the year saw a resilient economic response as the building market rebounded from the early uncertainty.
The New Zealand Government’s COVID-19 stimulus programme prioritised employees and impacted businesses with reduced focus on major infrastructure in 2020. As a result, fewer major infrastructure projects went ahead in the year. However, a higher dairy pay-out improved confidence among farmers, encouraging them to invest in new farm water management systems.
Low interest rates also helped boost residential new builds, although restrictions on migration due to the pandemic have hampered efforts to accelerate building demand overall.
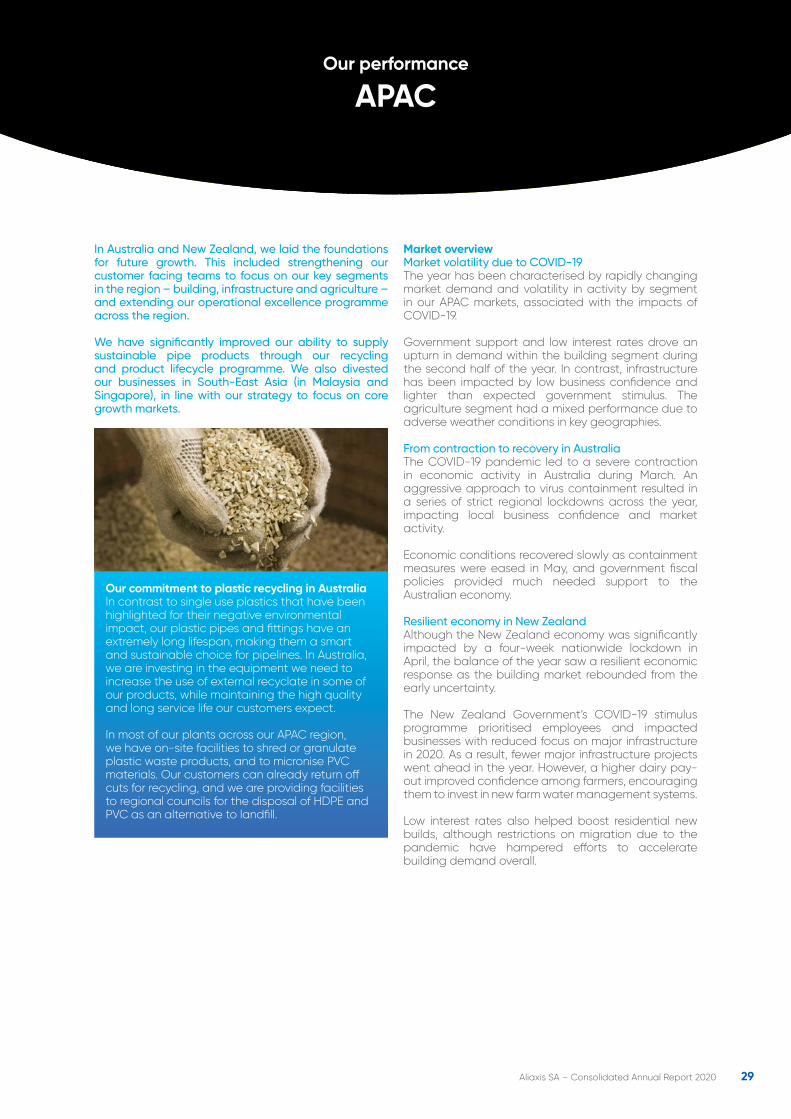
Our commitment to plastic recycling in AustraliaIn contrast to single use plastics that have been highlighted for their negative environmental impact, our plastic pipes and fittings have an extremely long lifespan, making them a smart and sustainable choice for pipelines. In Australia, we are investing in the equipment we need to increase the use of external recyclate in some of our products, while maintaining the high quality and long service life our customers expect.
In most of our plants across our APAC region, we have on-site facilities to shred or granulate plastic waste products, and to micronise PVC materials. Our customers can already return off cuts for recycling, and we are providing facilities to regional councils for the disposal of HDPE and PVC as an alternative to landfill.
Our performance
30Aliaxis SA – Consolidated Annual Report 2020
Strategy and performance Focus on our competitive position The COVID-19 pandemic has dominated activity in a volatile year. The safety of our employees has been paramount, and they have responded both rapidly and impressively to the challenges.
Market conditions and low-cost imports have increased the need for a strong focus on our competitive position this year. Delivering added value for our customers through reliable supply, quality and differentiated products has proven crucial.
The highly competitive Australian market has driven some changes in our market landscape in 2020, with a reduction in competitor footprints in some segments. Our teams have responded well to support key customers and increase our capacity in the building segment to meet customer needs.
Global shortages in PVC resin, combined with freight imbalances in Asia, have required extremely close management of the supply chain. With an increased emphasis on our sales and operations processes, our supply chain has been well managed, and our local teams maintained continuity of supply for our key customers.
Recognised for product and service excellenceDespite the volatile market, our businesses across the Division have had some great successes with new products and innovations during the year. Our Australian teams were recognised for product and service excellence, winning both the Nutrien/CRT supplier of the year and the Think Water supplier of the year awards.
RX Plastics performed strongly in its export markets, in particular via K-Line North America, achieving an impressive sales increase compared to last year.
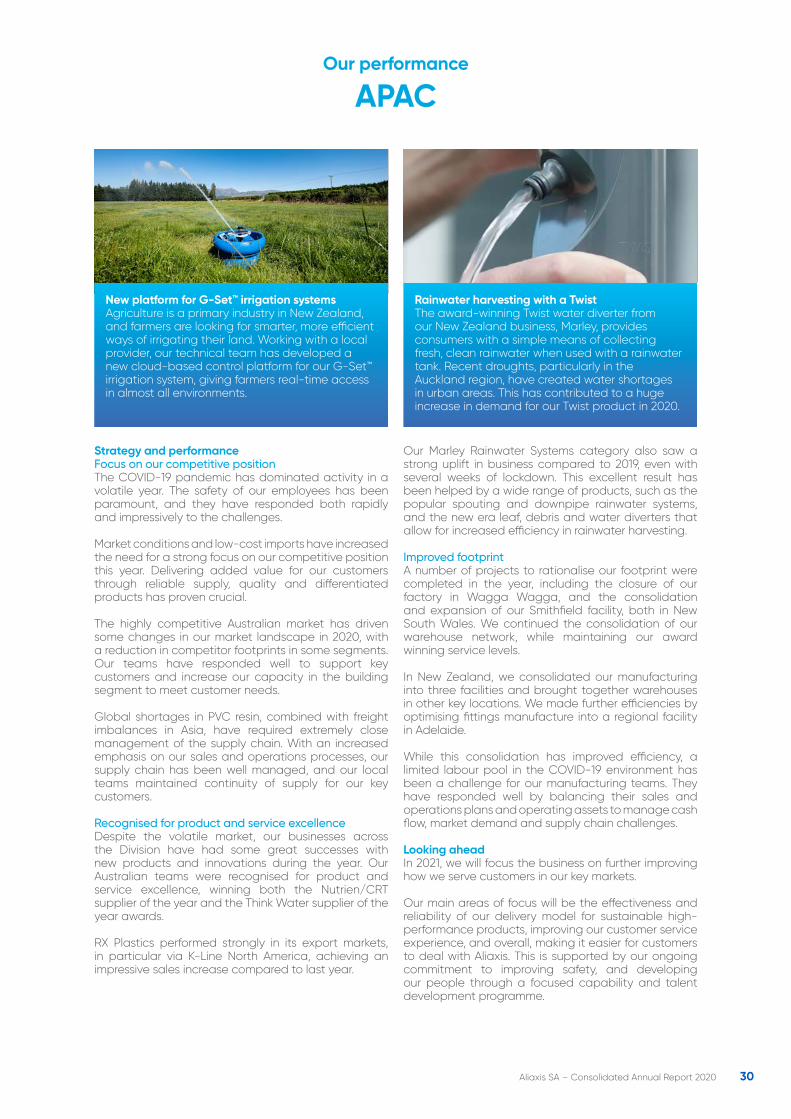
Rainwater harvesting with a TwistThe award-winning Twist water diverter from our New Zealand business, Marley, provides consumers with a simple means of collecting fresh, clean rainwater when used with a rainwater tank. Recent droughts, particularly in the Auckland region, have created water shortages in urban areas. This has contributed to a huge increase in demand for our Twist product in 2020.
APAC
Our Marley Rainwater Systems category also saw a strong uplift in business compared to 2019, even with several weeks of lockdown. This excellent result has been helped by a wide range of products, such as the popular spouting and downpipe rainwater systems, and the new era leaf, debris and water diverters that allow for increased efficiency in rainwater harvesting.
Improved footprint A number of projects to rationalise our footprint were completed in the year, including the closure of our factory in Wagga Wagga, and the consolidation and expansion of our Smithfield facility, both in New South Wales. We continued the consolidation of our warehouse network, while maintaining our award winning service levels.
In New Zealand, we consolidated our manufacturing into three facilities and brought together warehouses in other key locations. We made further efficiencies by optimising fittings manufacture into a regional facility in Adelaide.
While this consolidation has improved efficiency, a limited labour pool in the COVID-19 environment has been a challenge for our manufacturing teams. They have responded well by balancing their sales and operations plans and operating assets to manage cash flow, market demand and supply chain challenges.
Looking aheadIn 2021, we will focus the business on further improving how we serve customers in our key markets.
Our main areas of focus will be the effectiveness and reliability of our delivery model for sustainable high-performance products, improving our customer service experience, and overall, making it easier for customers to deal with Aliaxis. This is supported by our ongoing commitment to improving safety, and developing our people through a focused capability and talent development programme.
New platform for G-Set™ irrigation systemsAgriculture is a primary industry in New Zealand, and farmers are looking for smarter, more efficient ways of irrigating their land. Working with a local provider, our technical team has developed a new cloud-based control platform for our G-Set™ irrigation system, giving farmers real-time access in almost all environments.
Our performance
31Aliaxis SA – Consolidated Annual Report 2020
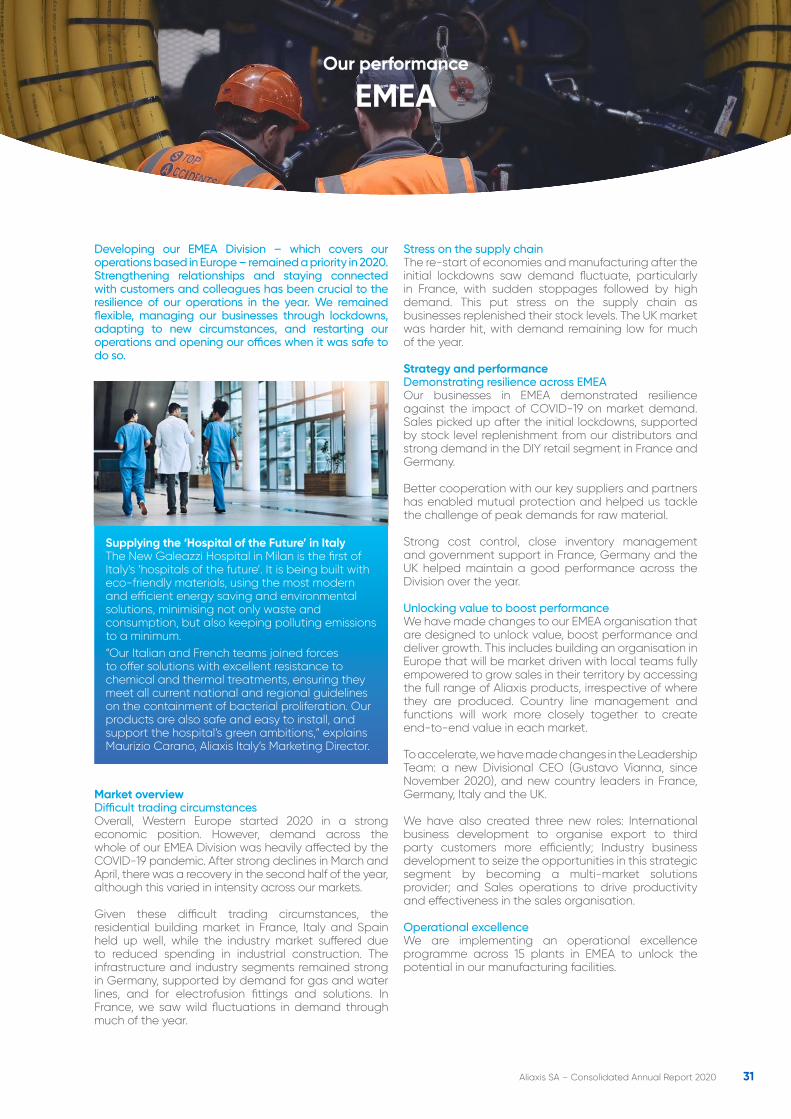
Supplying the ‘Hospital of the Future’ in ItalyThe New Galeazzi Hospital in Milan is the first of Italy’s ‘hospitals of the future’. It is being built with eco-friendly materials, using the most modern and efficient energy saving and environmental solutions, minimising not only waste and consumption, but also keeping polluting emissions to a minimum.“Our Italian and French teams joined forces to offer solutions with excellent resistance to chemical and thermal treatments, ensuring they meet all current national and regional guidelines on the containment of bacterial proliferation. Our products are also safe and easy to install, and support the hospital’s green ambitions,” explains Maurizio Carano, Aliaxis Italy’s Marketing Director.
EMEAOur performance
Developing our EMEA Division – which covers our operations based in Europe – remained a priority in 2020. Strengthening relationships and staying connected with customers and colleagues has been crucial to the resilience of our operations in the year. We remained flexible, managing our businesses through lockdowns, adapting to new circumstances, and restarting our operations and opening our offices when it was safe to do so.
Market overview Difficult trading circumstancesOverall, Western Europe started 2020 in a strong economic position. However, demand across the whole of our EMEA Division was heavily affected by the COVID-19 pandemic. After strong declines in March and April, there was a recovery in the second half of the year, although this varied in intensity across our markets.
Given these difficult trading circumstances, the residential building market in France, Italy and Spain held up well, while the industry market suffered due to reduced spending in industrial construction. The infrastructure and industry segments remained strong in Germany, supported by demand for gas and water lines, and for electrofusion fittings and solutions. In France, we saw wild fluctuations in demand through much of the year.
Stress on the supply chain The re-start of economies and manufacturing after the initial lockdowns saw demand fluctuate, particularly in France, with sudden stoppages followed by high demand. This put stress on the supply chain as businesses replenished their stock levels. The UK market was harder hit, with demand remaining low for much of the year.
Strategy and performance Demonstrating resilience across EMEAOur businesses in EMEA demonstrated resilience against the impact of COVID-19 on market demand. Sales picked up after the initial lockdowns, supported by stock level replenishment from our distributors and strong demand in the DIY retail segment in France and Germany.
Better cooperation with our key suppliers and partners has enabled mutual protection and helped us tackle the challenge of peak demands for raw material.
Strong cost control, close inventory management and government support in France, Germany and the UK helped maintain a good performance across the Division over the year.
Unlocking value to boost performanceWe have made changes to our EMEA organisation that are designed to unlock value, boost performance and deliver growth. This includes building an organisation in Europe that will be market driven with local teams fully empowered to grow sales in their territory by accessing the full range of Aliaxis products, irrespective of where they are produced. Country line management and functions will work more closely together to create end-to-end value in each market.
To accelerate, we have made changes in the Leadership Team: a new Divisional CEO (Gustavo Vianna, since November 2020), and new country leaders in France, Germany, Italy and the UK.
We have also created three new roles: International business development to organise export to third party customers more efficiently; Industry business development to seize the opportunities in this strategic segment by becoming a multi-market solutions provider; and Sales operations to drive productivity and effectiveness in the sales organisation.
Operational excellenceWe are implementing an operational excellence programme across 15 plants in EMEA to unlock the potential in our manufacturing facilities.
32Aliaxis SA – Consolidated Annual Report 2020
including supporting the rapid deployment of NHS England’s Nightingale Hospitals as part of its response to COVID-19. We also supported NHS Wales’ project to prepare field hospitals for emergency use in the crisis.
Keeping close to our customers in ItalyDespite huge pressure on the Italian economy, we adapted to the conditions and achieved a strong performance on export markets by keeping close to our customers and agents using digital means.
As in Spain, Italy launched a programme to merge their country ERPs into one. This programme will finish in 2021 and will deliver harmonised data and processes, as well as a single face to the customer.
Other marketsThe other markets in EMEA, like Switzerland and Eastern Europe, were less affected by the pandemic and had a rather soft year.
We put a strong focus on strengthening our teams and on talent development in the region. Leadership training – starting with safety – and cultural awareness coaching helped colleagues improve their leadership skills.
A good example of how the region has been working closer than ever with our customers came in Hungary, where the team won their biggest ever project: an important contract for PE pipes and fittings for water, with a large and well-known European car manufacturer that will produce around 150,000 vehicles in its new plant.
Looking aheadHaving dedicated time and effort over the last few years building robust operational plans across EMEA improving efficiencies, it is time to get our teams behind these plans. We will remain close to our customers and make full use of all the digital channels available.
Our growth will be focused on our main segment, building. We also expect growth to come from infrastructure (water and gas markets) as well as from the industry segment.
The programme provides quick wins by improving operational processes that will enable continuous improvements to generate the cash we need to reinvest in our business. It is the first step towards a larger Aliaxis Operations Model that will build long-term capabilities across the Group.
France’s focus on Sales and Customer ServiceAliaxis France was confronted with the biggest drop because of COVID-19, but also saw the highest recovery. The French team also launched a new sales and customer service organisation, to better serve dealers, installers and specifiers, making use of a range of new digital tools.
Our supply chain was under severe pressure, but our teams worked hard to recover normal levels of service. We introduced extended working times, including shifts over weekends and public holidays, to meet reviving customer demand.
New management team in GermanyWe rebuilt our senior management team in Germany during the year, with new permanent appointments to Strategic Procurement, Safety, HR, and Sales roles, alongside a new Country Head.
Sales of Infra Germany’s Electrofusion fittings and solutions remained strong, as infrastructure installation of gas and water lines continued in Germany, despite the COVID-19 restrictions.
Leading the industry in SpainOur teams in Spain ramped-up production month by month after the initial lockdown. Our engagement with customers and employees, making good use of digital channels and new technological platforms, was very well received. Our webinars and communications positioned us as a leader in our industry in the country.
Protecting our UK businessStrong cost control, inventory management, and working hard to keep our customers happy have been key to protecting our business in the UK. We have contributed to several key projects in the year,
Red Cross Business ChallengeThe Red Cross Business Challenge is a Spanish initiative that supports individuals facing the greatest difficulty in accessing the labour market. Because we care at Aliaxis, our team in Alicante was keen to take part. We worked with the Red Cross to hire 51 employees who were at risk of exclusion, with the recruitment process taking just two weeks.
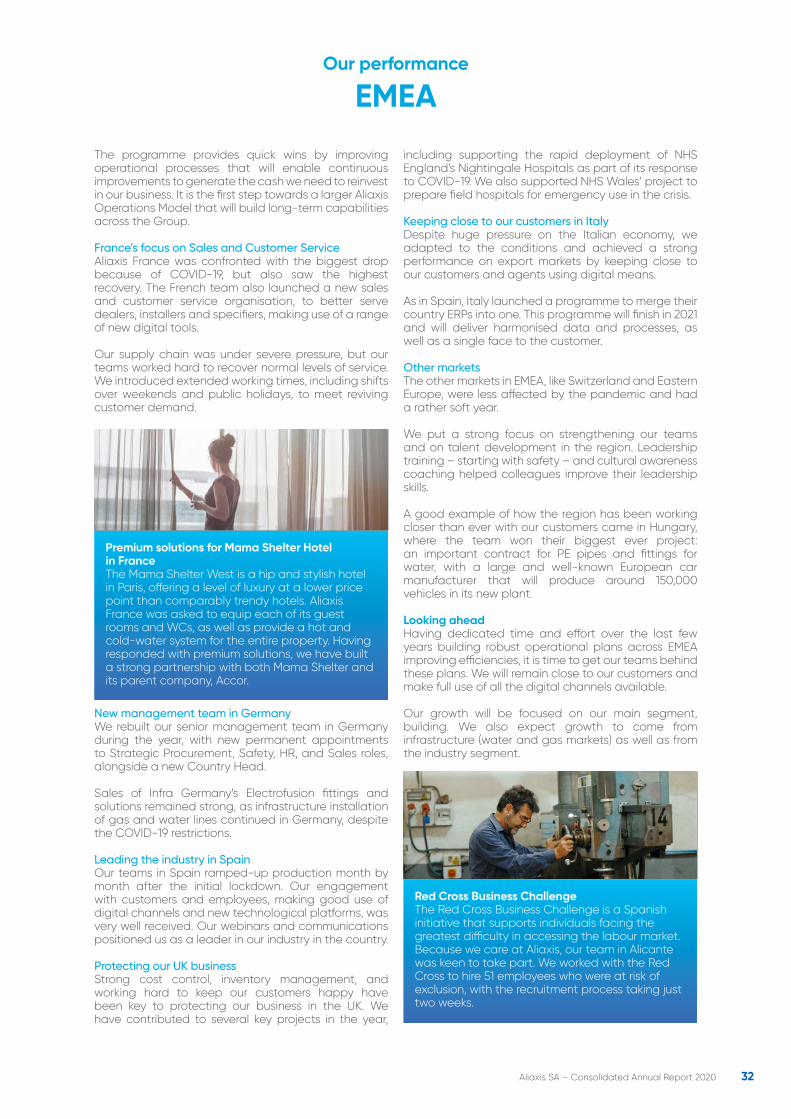
Premium solutions for Mama Shelter Hotel in FranceThe Mama Shelter West is a hip and stylish hotel in Paris, offering a level of luxury at a lower price point than comparably trendy hotels. Aliaxis France was asked to equip each of its guest rooms and WCs, as well as provide a hot and cold-water system for the entire property. Having responded with premium solutions, we have built a strong partnership with both Mama Shelter and its parent company, Accor.
EMEAOur performance
33Aliaxis SA – Consolidated Annual Report 2020
We continued to pursue our growth trajectory in India. Despite 54 days of hard shutdown to contain COVID-19 in the first half, our sector has bounced back strongly in the second half. Adapting throughout the year, we enhanced our digital capabilities and focused on sustainable revenue growth and overall profitability.
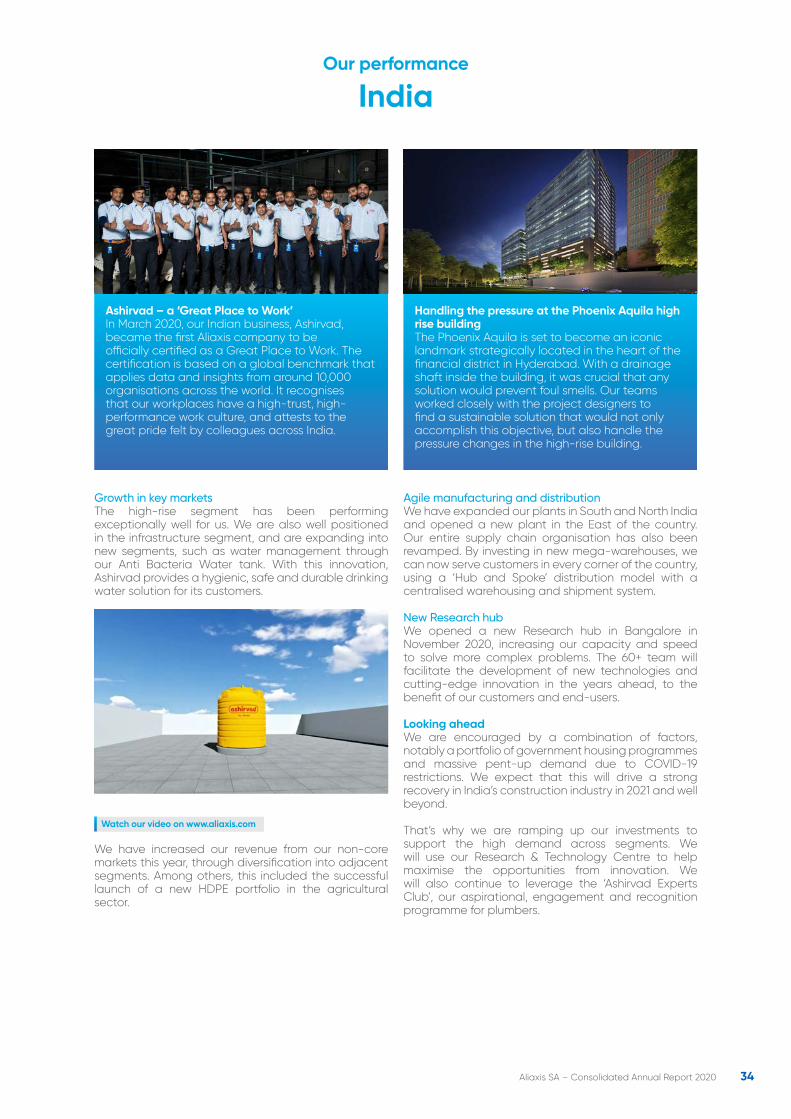
Helping hands that show Ashirvad CaresOur Ashirvad Cares programme in India was launched to provide a helping hand to underprivileged families in local communities – particularly those most affected by the lockdown. Through our COVID-19 Hotline, we reached out to more than 650,000 plumbers, mechanics and contractors, offering financial aid and health services to those in need. This outreach extended to our own colleagues, many of whom were adapting to a new and unusual situation. Happiness Champions helped to protect our colleagues’ wellbeing, and direct support was provided to more than 130 employees and their families.We also started to manufacture hand sanitisers and face shields, donating around 20,000 litres of hand sanitisers, along with COVID-19 personal safety kits and food parcels, to people in neighbourhoods around the country.
India
Market overview From contraction to strong recoveryThe first strict lockdown – from 24 March to 17 May – to prevent the virus outbreak largely brought construction initially to a halt – although construction work on some infrastructure projects was allowed from 20 April. However, many thousands of construction projects were delayed.
After experiencing one of the world’s tightest lockdowns, India’s construction industry made a strong recovery in the second half of 2020. The Government’s programmes to revive the economy through investment in infrastructure and housing supported the return to growth.
Long term growth storyPopulation growth, urbanisation, industrialisation and the rise in disposable income remain key growth drivers of the construction industry.
India’s construction industry includes both real estate (housing projects, building offices, hotels, leisure parks, etc.) and urban development projects (highway construction, building schools, transport and healthcare infrastructure, sewage treatment, water supply, power generation, etc.)
Given the country’s ambition to modernise infrastructure, advance its cities with ‘smart’ development, and boost employment, India is expected to become the third largest construction market in the world by 2025.
Strategy and performance Adapting quickly to the COVID-19 crisisOur traditional stronghold core markets were severely impacted by the COVID-19 crisis in the first half of 2020. Global PVC price volatility and shortages have also been a challenge to manage.
However, we adapted quickly, taking a series of actions to protect our people and our business during the year, which was critical to helping us bounce back. We have improved the services and solutions we offer, to meet our customers’ evolving needs. We have built ‘Digital Ashirvad’, a new platform that provides data-driven capabilities across the value chain. We have also improved communications with colleagues and customers.
Our performance
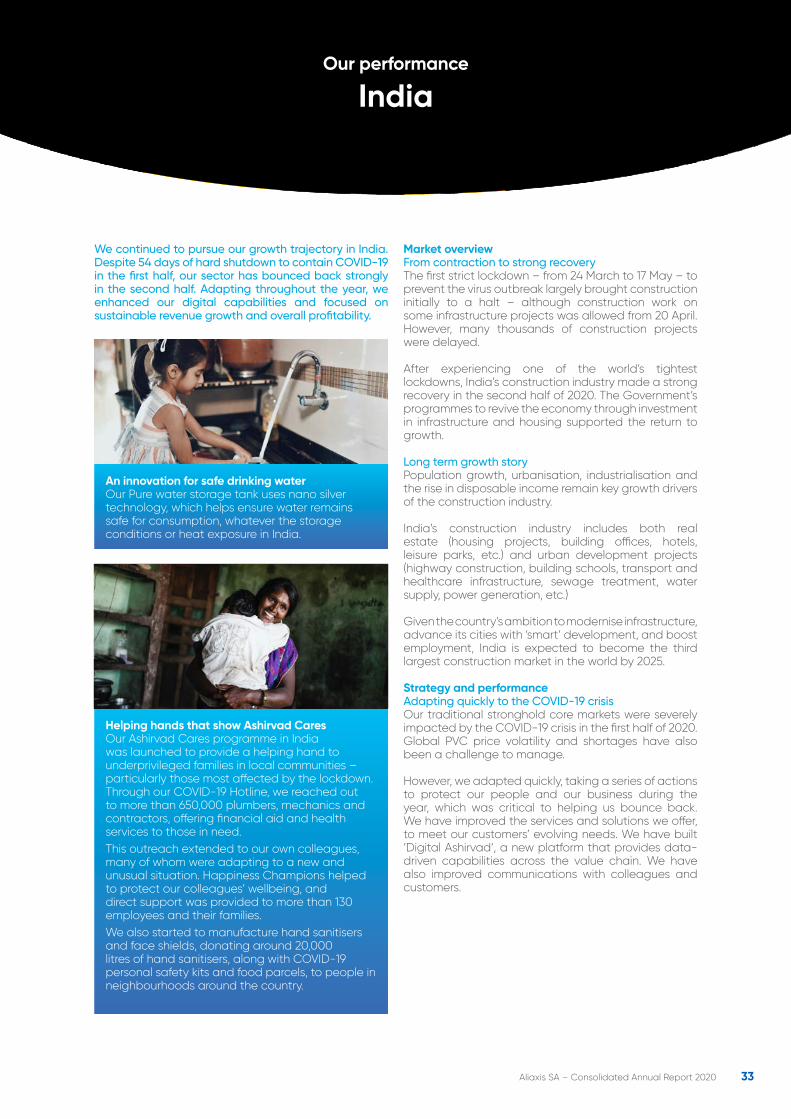
An innovation for safe drinking water Our Pure water storage tank uses nano silver technology, which helps ensure water remains safe for consumption, whatever the storage conditions or heat exposure in India.
34Aliaxis SA – Consolidated Annual Report 2020
India
Growth in key marketsThe high-rise segment has been performing exceptionally well for us. We are also well positioned in the infrastructure segment, and are expanding into new segments, such as water management through our Anti Bacteria Water tank. With this innovation, Ashirvad provides a hygienic, safe and durable drinking water solution for its customers.
Watch our video on www.aliaxis.com
We have increased our revenue from our non-core markets this year, through diversification into adjacent segments. Among others, this included the successful launch of a new HDPE portfolio in the agricultural sector.
Agile manufacturing and distributionWe have expanded our plants in South and North India and opened a new plant in the East of the country. Our entire supply chain organisation has also been revamped. By investing in new mega-warehouses, we can now serve customers in every corner of the country, using a ‘Hub and Spoke’ distribution model with a centralised warehousing and shipment system.
New Research hubWe opened a new Research hub in Bangalore in November 2020, increasing our capacity and speed to solve more complex problems. The 60+ team will facilitate the development of new technologies and cutting-edge innovation in the years ahead, to the benefit of our customers and end-users.
Looking aheadWe are encouraged by a combination of factors, notably a portfolio of government housing programmes and massive pent-up demand due to COVID-19 restrictions. We expect that this will drive a strong recovery in India’s construction industry in 2021 and well beyond.
That’s why we are ramping up our investments to support the high demand across segments. We will use our Research & Technology Centre to help maximise the opportunities from innovation. We will also continue to leverage the ‘Ashirvad Experts Club’, our aspirational, engagement and recognition programme for plumbers.
Our performance
Handling the pressure at the Phoenix Aquila high rise buildingThe Phoenix Aquila is set to become an iconic landmark strategically located in the heart of the financial district in Hyderabad. With a drainage shaft inside the building, it was crucial that any solution would prevent foul smells. Our teams worked closely with the project designers to find a sustainable solution that would not only accomplish this objective, but also handle the pressure changes in the high-rise building.
Ashirvad – a ‘Great Place to Work’In March 2020, our Indian business, Ashirvad, became the first Aliaxis company to be officially certified as a Great Place to Work. The certification is based on a global benchmark that applies data and insights from around 10,000 organisations across the world. It recognises that our workplaces have a high-trust, high-performance work culture, and attests to the great pride felt by colleagues across India.
35Aliaxis SA – Consolidated Annual Report 2020
Directors’ Report and Financial Statements
Aliaxis SA – Consolidated Annual Report 2020
36Aliaxis SA – Consolidated Annual Report 2020
Part 2: Directors’ Report and Financial Statements
1. Corporate governance Global leadership team Composition of the Board of Directors Board of Directors and Committees of the Board Strategy Committee Audit Committee Appointment and Remuneration Committee
37373738383838
2. Directors’ report Trading review Financial review Our people Our innovations Sustainability Risks and uncertainties Use of derivative financial instruments Subsequent events Outlook for 2021 Dividend Statutory appointments
393940424243444445454545
3. Financial Statements Consolidated Financial Statements Notes to the Consolidated Financial Statements Auditor’s Report Non-consolidated accounts, profit distribution and statutory appointments
464754119124
4. Glossary 127
5. Key figures 128
Table of contents
37Aliaxis SA – Consolidated Annual Report 2020
1. Corporate Governance
The Board of Directors delegates responsibility for the day-to-day management of the Group to the Chief Executive Officer, in his capacity as Managing Director.
1.1 Global Leadership TeamAliaxis is organised around 2 leadership bodies that are presided by the CEO: the Executive Committee and the Global Leadership Team. They are working closely together, supporting our journey to be an integrated global industry leader that connects people with water and energy.
The Executive CommitteeThe Executive Committee (ExCom) is responsible to drive performance, increase speed of execution and focus all efforts behind the right priorities in a coordinated approach, across geographies and functions. The ExCom consists of the following leadership positions as of December 31, 2020:
Chief Executive Officer, Eric OlsenChief Finance Officer, Koen StickerChief HR & CR Officer, Ursula Saint LégerChief Operations & Supply Chain Officer, William Ledger Chief Growth Officer, Tom Van GyseghemDivisional CEO Americas, Alex MestresDivisional CEO APAC, Mark NykielDivisional CEO EMEA, Gustavo ViannaDivisional CEO India, Deepak Mehrotra
The Global Leadership TeamThe ExCom is supported by a Global Leadership Team (GLT) that is comprised of functional leaders. Their mission is to build up alignment to ensure fast and flawless implementation of all ExCom decisions, cascade information and make sure our whole organisation across the globe is fully mobilised to deliver results.
The GLT is composed of the following roles as of December 31, 2020*:
Functional roles:Innovation, R&D – Dominique NeerinckStrategy & Digital – Peter Van BylenLegal – Manuel MonardVentures/M&A – Frank ThielenIT – Patricia de Lanlay
*Since February 1, 2021, Communications: Amanda Jones
1.2 Composition of the Board of DirectorsOlivier van der Rest – ChairmanEric Olsen – Chief Executive Officer (as of October 1, 2020)George Durman Esquivel3F Advisory srl (Represented by Olivier Hamoir)Andréa HatschekRajesh JejurikarDidier LeroyKieran MurphyMarc Nolet de BrauwereAmaury Pelgrims de BigardPatrick SimonardThierry Vanlancker (as of May 2020)Hélène van Zeebroeck
Jean-Louis Piérard – Honorary Chairman
Laurent Lenoir – Chief Executive Officer (until July 2020)Patrick Thomas (until May 2020)Koen Sticker BV (represented by Koen Sticker) – Chief Executive Officer as from August 2020 until September 2020
Corporate governance
38Aliaxis SA – Consolidated Annual Report 2020
Corporate governance
1.3 Board of Directors and Committees of the BoardAliaxis SA is a private company. Its shares are not listed on any regulated stock market. Nevertheless, the Board is committed to maintaining high standards of corporate governance.
The Board determines the overall strategy of the Group, oversees the major investments and monitors the activities of the management in implementing the Group strategy.
The Board of Directors met ten times during 2020. There are three standing committees. Each of these committees supports the Board in specific aspects of its remit. A subset of Board members met in an ad hoc committee in 2020 to follow up on the details of the implementation of the ERP project.
1.4 Strategy CommitteeThe Strategy Committee is responsible for reviewing the strategic direction of the Group and makes recommendations to the Board on strategic options.
The Committee met five times during 2020. It was composed of Olivier van der Rest, Jean-Louis de Cartier de Marchienne (until May 2020), 3F Advisory srl (represented by Olivier Hamoir) (Chairman), Laurent Lenoir (until July 2020), Didier Leroy, Kieran Murphy, Marc Nolet de Brauwere, Patrick Simonard, Patrick Thomas (until May 2020) and Thierry Vanlancker (as of May 2020).
1.5 Audit CommitteeThe Audit Committee supports the Board in monitoring the accounting and financial reporting of the Group. It also focuses on reviewing the scope and results of Aliaxis’ external and internal audit procedures.
The Committee met four times in 2020. Its members were Kieran Murphy (Chairman), Amaury Pelgrims de Bigard, Patrick Thomas (until May 2020), Thierry Vanlancker (as of May 2020) and Patrick Simonard (as of September 2020).
1.6 Appointment and Remuneration CommitteeThe Appointment and Remuneration Committee advises the Board on Board-level appointments and supports them in reviewing remuneration at executive-committee level.
The Committee met fourteen times in 2020 and its members were Hélène van Zeebroeck, 3F Advisory srl (represented by Olivier Hamoir) (Chairman), Didier Leroy, Marc Nolet de Brauwere and Olivier van der Rest.
AgendaAnnual General meeting of shareholdersWednesday 26 May 2021
At the Group’s registered office: Avenue Arnaud Fraiteur 15-23 – 1050 Brussels – Belgium
Given the exceptional circumstances related to the COVID-19 health crisis and the lack of visibility regarding the governmental measures that will be in force at the time of the Annual General Meeting, Aliaxis SA reserves the right to adapt and change the modalities of the Annual General Meeting if required.
PAYMENT OF DIVIDENDThursday, 1 July 2021
2021 HALF YEAR RESULTSSeptember 2021Board of Directors to approve 2021 Half Year results – Results announcement
2021 FULL YEAR RESULTSMarch 2022Board of Directors to approve 2021 Full Year results – Results announcement
39Aliaxis SA – Consolidated Annual Report 2020
2. Directors’ report
2.1 Trading reviewMost geographies were impacted by the pandemic shock in the first half. During that period, the Group benefited from government support in a few countries in Q2, while at the same time applying stringent cost measures and delaying noncritical investments.
The second half of the year came unexpectedly strong with sales recovering in most markets and segments. Europe, Australia and New Zealand were slower to recover in the second half. However, the Americas and India showed accelerating growth over the second half.
In the last financial year, Aliaxis total tax – including social security payments – was more than €160 million across the globe.
2.1.1 AmericasNorth America2020 was a record year for the North America region. Canada faced a subdued first half of the year but top line regained growth early in the summer thanks to a resilient housing market and a solid irrigation segment. The USA reported all time high sales behind strong housing market and robust demand in wholesale retail. The successful integration of Silver-Line Plastics helped to capture the growth coming from this segment. Improved product mix, Canadian government support in Q2 and tight cost control reinforced the results of the North America region.
Latin AmericaThe Latin America region had a moderate start in Q1 with an irrigation segment that performed well throughout the year. After the severe drop in Q2, the building and public infrastructure segment showed a solid recovery during H2 2020, with 2020 sales ending close to 2019 levels.
2.1.2 APACLockdowns and overall travel restrictions in the region severely impacted business resulting in sales below 2019.
In Australia, business confidence decline led to subdued demand in infrastructure projects and the agricultural segment. The building segment demonstrated strength in the second half of the year with an upturn behind government support to local economies and low interest rates.
In New Zealand, the residential new build permits were boosted by favourable financing conditions. Yet the demand in this market was softened by a COVID-19 related migration halt. Agriculture solutions sales accelerated as higher dairy pay-out encouraged farmers to invest in water management systems.
2.1.3 EMEAThe EMEA region demonstrated resilience against the COVID-19 impact: sales remained below 2019 but profitability improved as a result of several efficiency programmes launched early in the year.
Demand in the DIY retail segment in France and Germany remained solid across the year. The residential building market in France, Italy and Spain resisted well but the industry market suffered more. While the German infrastructure and industry segment remained strong in Germany, the UK business demonstrated significant volatility. Strong cost control, close inventory management and government support in France, Germany and the UK supported the Divisions performance.
2.1.4 IndiaAshirvad continued to pursue its growth trajectory. Despite 54 days of hard shutdown to contain COVID-19 in the first half, our sector has strongly bounced back in the second half. Adapting throughout the year, we enhanced our digital capabilities and focused on sustainable revenue growth and overall profitability.
The high-rise segment has been performing exceptionally well for us. We are also well positioned in the infrastructure segment, and are expanding into new segments, such as water management through our Anti Bacteria Water tank. We have increased our revenue, including from our non-core markets this year, through diversification into adjacent segments. Among others, this included the successful launch of a new HDPE portfolio in the agricultural sector.
Directors’ report
40Aliaxis SA – Consolidated Annual Report 2020
Directors’ report
2.2 Financial review
Changes in the scope of consolidationIn early 2020, the Group completed the divestment of Harrington Industrial Plastics.
In Q4 2020, the Group sold its businesses in Singapore and Malaysia.
These transactions are described in more detailed in Note 6 (Acquisitions and disposals of subsidiaries and non-controlling interests) to the consolidated financial statements.
Statement of comprehensive incomeIn the 12 months period ended 31 December 2020, Aliaxis reported revenue of €2,908 million, a decrease of 6.7% compared to 2019. Foreign exchange negatively impacted the Group’s sales by 2.9%, due to the weakening of the major trading currencies against the EUR, mainly the Indian rupee (7.3%), the Canadian dollar (2.9%), US dollar (2.0%) and the trading currencies in the Latin American region.
The gross profit was €823 million (2019: €836 million), representing 28.3% (2019: 26.8%) of revenue. Commercial, administrative and other income and charges amounted to €492 million (2019: €513 million), or 16.9% (2019: 16.4%) of sales.
Operating profit (EBIT) for the year was €331 million, an overall increase of €7 million or 2.2%. Foreign exchange negatively impacted the Group’s EBIT by 1.2%.
The adjusted items represented a net exceptional income of €15 million in 2020, compared to a net exceptional income of €24 million in 2019. The adjusted items predominately relate to capital gain on divestment in 2020 (€98 million), partially offset by transformation and restructuring initiatives (€14 million). In addition, the Group reported Goodwill impairment of €38 million and impairment on customer list of €15 million and on global ERP of €10 million.
Excluding the impact of the adjusted items, the Current EBIT amounted to €316 million, an increase of €15 million or 5.1%. The Current EBIT margin amounts to 10.9%, compared to 9.6% in 2019.
Excluding depreciation and amortisation, the Current EBITDA amounted to €461 million, an overall increase of €21 million or 4.8%. Foreign exchange negatively impacted the Group’s Current EBITDA by 2.9%. The Current EBITDA margin increased from 14.1% in 2019 to 15.9% in 2020.
Finance income and expenses mainly consisted of net interest expenses of €14 million (2019: €18 million). An analysis of finance income and expense is given in notes 13 (Finance expenses) and 14 (Finance income) to the consolidated financial statements.
The Group operates a policy of managing its interest rate exposure, and part of its debt was covered throughout the year by fixed interest rate swaps. The proportion of the debt covered by such instruments reduces in line with the debt maturity dates. The balance of the Group’s debt remained at variable interest rates. The management of interest rate exposure is explained in notes 5 (Financial risk management) and note 30 (Financial instruments) to the consolidated financial statements.
Income taxes, consisting of current and deferred taxes, amounted to €109 million (2019: €109 million), representing an effective income tax rate of 35.4% (2019: 37.2%). The reconciliation of the aggregated weighted nominal tax rate (25.2%) with the effective tax rate is set out in note 15 (Income taxes) to the consolidated financial statements.
The Group’s share of the profit for 2020 was €198 million (2019: €183 million). The Group’s earnings per share in 2020 were €2.54 (2019: €2.33), an increase of 8.7%.
Other comprehensive income for the period, net of income tax, decreased by €217 million from €70 million in 2019 to €-147 million in 2020, mainly explained by the negative impact of exchange rate movements due to the weakening of the major trading currencies against the EUR in 2020 compared to last year. The equity movement is explained below.
The Group’s current taxes to the different local authorities in all the countries in which it operates, were €92 million (excl. withholding taxes on the Group dividend), total employers’ social security contribution were €77 million (excl. employees’ social security contribution and payroll taxes) and taxes to be considered as operating expenses were €9 million (excl. VAT, duties…).
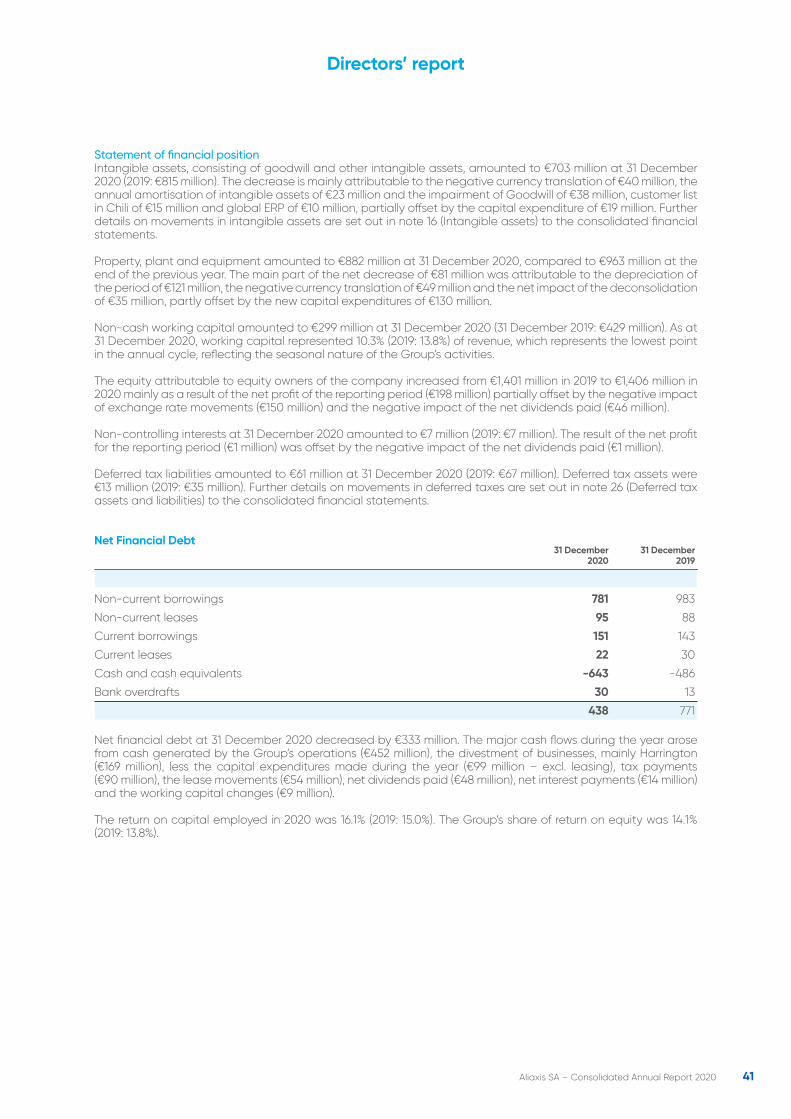
41Aliaxis SA – Consolidated Annual Report 2020
Statement of financial position Intangible assets, consisting of goodwill and other intangible assets, amounted to €703 million at 31 December 2020 (2019: €815 million). The decrease is mainly attributable to the negative currency translation of €40 million, the annual amortisation of intangible assets of €23 million and the impairment of Goodwill of €38 million, customer list in Chili of €15 million and global ERP of €10 million, partially offset by the capital expenditure of €19 million. Further details on movements in intangible assets are set out in note 16 (Intangible assets) to the consolidated financial statements.
Property, plant and equipment amounted to €882 million at 31 December 2020, compared to €963 million at the end of the previous year. The main part of the net decrease of €81 million was attributable to the depreciation of the period of €121 million, the negative currency translation of €49 million and the net impact of the deconsolidation of €35 million, partly offset by the new capital expenditures of €130 million.
Non-cash working capital amounted to €299 million at 31 December 2020 (31 December 2019: €429 million). As at 31 December 2020, working capital represented 10.3% (2019: 13.8%) of revenue, which represents the lowest point in the annual cycle, reflecting the seasonal nature of the Group’s activities.
The equity attributable to equity owners of the company increased from €1,401 million in 2019 to €1,406 million in 2020 mainly as a result of the net profit of the reporting period (€198 million) partially offset by the negative impact of exchange rate movements (€150 million) and the negative impact of the net dividends paid (€46 million).
Non-controlling interests at 31 December 2020 amounted to €7 million (2019: €7 million). The result of the net profit for the reporting period (€1 million) was offset by the negative impact of the net dividends paid (€1 million).
Deferred tax liabilities amounted to €61 million at 31 December 2020 (2019: €67 million). Deferred tax assets were €13 million (2019: €35 million). Further details on movements in deferred taxes are set out in note 26 (Deferred tax assets and liabilities) to the consolidated financial statements.
Net Financial Debt
Net financial debt at 31 December 2020 decreased by €333 million. The major cash flows during the year arose from cash generated by the Group’s operations (€452 million), the divestment of businesses, mainly Harrington (€169 million), less the capital expenditures made during the year (€99 million – excl. leasing), tax payments (€90 million), the lease movements (€54 million), net dividends paid (€48 million), net interest payments (€14 million)and the working capital changes (€9 million).
The return on capital employed in 2020 was 16.1% (2019: 15.0%). The Group’s share of return on equity was 14.1% (2019: 13.8%).
Directors’ report
Non-current borrowings
Non-current leases
Current borrowings
Current leases
Cash and cash equivalents
Bank overdrafts
31 December 2020
31 December 2019
781
95
151
22
-643
30
438
983
88
143
30
-486
13
771
42Aliaxis SA – Consolidated Annual Report 2020
2.3 Our people
2.3.1 COVID-19 responseIn the context of COVID-19, we have supported our colleagues in every way we can. To our knowledge, we had no contamination in the workplace. However, since the outbreak of the pandemic hundreds of colleagues around the world were infected and sadly 5 of them passed away. Via the Aliaxis People Solidarity Fund, we provided support to employees heavily impacted by the pandemic. Set up within the King Baudouin Foundation, the Fund supported 57 employee families in 2020.
A Group crisis team and local crisis management teams were activated to provide a global integrated response. Our local teams adapted quickly to the new ways of working. They ensured we maintained safe workplaces and embraced new and refreshed ways of communicating across remote environments.
Our employees have responded impressively to the challenges we faced in 2020. They have supported difficult decisions to ensure business continuity through disciplined cost control and cash management, while still delivering for our customers.
We were able to keep most of our manufacturing sites open, thanks to our teams’ reactivity, and because our services are critical to society. We also helped ensure efficient water and gas supply in our communities, as well as maintain effective drainage and wastewater treatment systems.
2.3.2 Focus on people working at AliaxisAliaxis respects and protects employees’ fundamental rights across all our locations. In 2020, we adopted global labour standards across the Group, aligned to the International Labour Organization (ILO) Core Conventions.
We believe that an inclusive culture allows our 60+ nationalities to bring a rich diversity of capabilities and perspectives. While the industry gender gap continues to be widespread in most industries today, Aliaxis aims to tackle it. In some areas of the company, we achieved gender balance, such as in our Research hub in Paris where 57% of our employees are female. Besides, many local initiatives across the Group underline our pledge to be an inclusive employer. Currently there are 19.5% female workers, among the 14,000+ people employed by Aliaxis in 2020. This gender split is in the industry average.
The EMEA Division accounts for 29% of all staff. North America ranks second with 21.2%, followed by Latin America with 15.5% and 15% in India. Our businesses in Australia and New Zealand now employs 8.4%. The average age of an Aliaxis employee is 42.5 years, but it varies significantly between Divisions. In APAC, the average age is 46.5 years, while in India, the workforce is 34.5 years on average.
Aliaxis is committed to conducting its business with integrity and in compliance with the law. We provide strong policies, employee training (on Code of Conduct, privacy, anti-corruption and anti-bribery and competition law) and a whistleblowing mechanism.
We continue to strive to be a “Great Place to Work” by valuing our employees as they move through their careers, through our Talent Council, and Compensation and Benefits Council. Our Aliaxis University also brings together all our training programmes to develop our existing talent. We were delighted to see that Aliaxis India received accreditation this year as a Great Place to Work.
2.4 Our innovations
Our ambitions in the field of innovation are based on two main areas. We develop components, systems and solutions that increase the productivity of our customers and end-users. In addition, we develop water management solutions to preserve, store, transport and protect water.
To realise these ambitions, we have consolidated our innovation teams in recent years and focused their efforts onto fewer, more impactful projects.
2.4.1 Three Research hubsOn a global level, we today have three Research hubs that are spearheading our efforts in terms of Innovation. Joining our existing Centres in Toronto, Canada, and Paris, France, we opened a third Centre this year in Bangalore, India. All three Centres have a global reach and cooperate to support all regions. We are building up our team at Bangalore to reach a 60+ strong team. Our three research hubs look into materials, new product design, water purification and digital technology. We work on a prioritised number of projects, focusing on products with positive impact for our customers and for society.
Aliaxis launched about 60 new products in 2020. Some of these were smart improvements – easier connections, easier installation – solving specific customer problems. Other new solutions tackle larger concerns and improve the living conditions of communities. In Latin America, we launched MaxiCanal, a new roof gutter system – designed in collaboration with customers – to cope with extreme heavy rain.
Directors’ report

43Aliaxis SA – Consolidated Annual Report 2020
2.4.2 Rainwater harvesting innovationAmong the major innovations we brought to market in 2020 were water tanks and rainwater harvesting in India. We saw an opportunity in an adjacent segment we were not operating in and used that to drive significant business growth.
Instead of marketing a single component, we offer an end-to-end solution for rainwater harvesting, which helps customers conserve water in line with government regulations. With anti-microbial and anti-fungal properties, our water tanks also provide significant health benefits. We are the first to offer a complete system like this in India, and there is growth potential in other geographies for similar rainwater harvesting systems.
2.4.3 Addressing the challenges of urbanisation Besides addressing water management challenges, we also play a role in supporting growing urbanisation. For example, we provide advanced solutions in wastewater and drainage systems for high-rise buildings.
We work with universities to design solutions for the most difficult problems, using various testing scenarios, including pressure simulations. Using a lift tower, we carry out experiments in collaboration with the Heriot-Watt University in Edinburgh, helping us to develop a series of unique products, ideally suited for high-rise buildings.
2.4.4 Increased focus on green innovation and recyclingWe are adapting our innovation process to consider the environmental impact of our products. This means doing lifecycle analysis to assess the impact of our products on for example our CO2 emissions, water, energy and materials use. These are important criteria in our new product development, playing into our green innovation and recycling agenda.
As part of our sustainability engagement, we have made progress during the year on resolving some of the hurdles around recycling. Products like Ecolotube (Canada – 50% recycled material) and HomeTech (France – 20% recycled material) have led the way.
We aim to integrate more recycled raw materials across all our operations, as it is our main lever in reducing our carbon footprint. Lighter products also provide an economical advantage, bringing a cost benefit for our customers, as well as opportunities for growth. In Italy, we have redesigned our PVC fittings to be 20% lighter, easier to transport and easier to install, with a carbon footprint that is 25% lower.
2.5 SustainabilityIn 2020, we developed a sustainability framework, based on a materiality analysis to identify where we can make the biggest impact. It defines three main axes for enhancing our sustainable performance over the coming years:
1. Safety is our top priority, central to our robust internal business practices;2. High impact areas linked to our core business, such as circular economy, green innovation and recycling; 3. Our commitment to provide solutions for sustainable water management.
A dedicated council (involving both the ExCom in full and internal experts) has been established to oversee the implementation of the framework.
2.5.1 Safety, our top priorityAt Aliaxis we strive for an injury-free work environment and safety is our top priority. Our leading indicator is the reportable incident rate per million hours worked. In 2020, there were 21% fewer accidents versus 2019, North America being the region which improved most with a decrease by 28%.
We track both incidents and near misses in order to capture all learnings and engage teams across the organisation on the lessons learnt to ensure efficient cross fertilisation. As part of the insights from both effective incidents and near misses, we identified the top risks which can lead to most severe injuries.
That’s why in 2020, we focused on two safety standards: “forklift and pedestrians” and “use of lifting equipment”.
2.5.2 Environmental performanceWe are committed to minimising any adverse environmental impacts associated with our direct operations, with a focus on water use and solid waste management. In 2020, we developed our first two global environmental standards – covering waste management and water management. In 2020 we improved by 9% our waste efficiency (vs 2019) and by 13.2% our water efficiency (vs 2019).
In 2020, we also rolled out site energy self-assessments to identify potential energy efficiency projects. Finally, we completed a carbon footprint analysis of our whole value chain, working with the environmental consultancy company ERM. During the year, our energy efficiency (kWh/tonne produced) improved by 5.7% and greenhouse gas emissions (kg CO2 equivalent/tonne produced) decreased by 7.5%, compared to 2019.
Directors’ report
44Aliaxis SA – Consolidated Annual Report 2020
Directors’ report
2.5.3 Circular economy & recyclingAliaxis is developing its contribution to the circular economy, reusing waste plastics as recycled raw materials, reducing waste generation and minimising our environmental footprint.
We continue to make progress on redesigning products and packaging to make use of significantly less raw materials. We play our role in setting relevant quality standards in the field of recycled plastics, and are increasing the proportion of recycled content in our products. We have succeeded in changing a number of product formulations to increase amounts of recycled materials while maintaining the level of quality. We are stepping up our efforts to support industry-wide initiatives focusing on the increased recycling of materials.
In 2020, we carried out a survey across our markets on the use of recyclate. The aim is to establish a baseline of our current use of recycled materials, and to identify opportunities to expand our use.
We have also forged partnerships with external stakeholders, including innovative start-ups, to explore greater recycling of PVC and Polyolefin materials.
In Australia, we have structured supply deals with companies that collect construction and demolition waste for recycling. We have invested in equipment to clean, wash, shred and micronise waste, so that we can re-use it in our production. This initiative received a grant from the Australian Government that will support our efforts to upgrade one of our facilities in 2021, to increase the amount of recycled PVC we can process. In 2020, we strengthened our focus on improving the control of plastic powder and pellet loss in our factories. Powder and pellets released into the environment can contribute to the contamination of our waterways and oceans, so it is important that we have robust practices to prevent this. We have signed up to Operation Clean Sweep, an industry-wide partnership that aims at helping every plastic resin handling operation achieve zero pellet, flake or powder loss. The initial roll out in Europe began this year. Our other regions will sign up to the programme in 2021.
2.5.4 A water management portfolioOur products play an important role in addressing the challenges the world faces in water management. In 2020, we identified products, systems and solutions that support ‘sustainable water management’. This is in line with the UN Sustainable Development Goal SDG 6 to “ensure availability and sustainable management of water and sanitation for all”.
2.6 Risks and uncertainties The risk profile of the companies within the Aliaxis Group is similar to that of other manufacturing and distribution companies operating in an international environment, and includes economic and sector risks as well as credit, liquidity and market risks arising from exposure to currencies, interest rates and commodity prices. The Group is also exposed to more specific risks of, for example, public, product and employer’s liability, property damage and business interruption and the risks from administrative, fiscal and legal proceedings.
Developments in respect of administrative, fiscal, and legal proceedings are described as appropriate in notes 27 (Provisions) and 33 (Contingencies) to the consolidated financial statements.
The Group has adopted a range of internal policies and procedures to identify, reduce and manage these risks either at individual company level or, where appropriate, at Group level.
The Group’s approach to the management of credit, liquidity and market risks (including commodity, interest rate and currency) is set out in note 5 (Financial risk management) to the consolidated financial statements.
2.7 Use of derivative financial instrumentsRisks relating to creditworthiness, interest rate and exchange rate movements, commodity prices and liquidity arise in the Group’s normal course of business. However, the most significant financial exposures for the Group relate to the fluctuation of interest rates on the Group’s financial debt, and to fluctuations in currency exchange rates.
The Group’s approach to the management of these risks is described in note 30 (Financial instruments).
45Aliaxis SA – Consolidated Annual Report 2020
Directors’ report
2.8 Subsequent events No subsequent events have occurred that warrant a modification of the value of the assets and liabilities or any additional disclosure.
2.9 Outlook for 2021The positive momentum should continue through Q1 2021. Visibility on Q2 and the second half of 2021 remains limited with high uncertainty. Further, we expect raw materials (resins) supply and conditions to be challenging.
2.10 DividendThe Board of Directors will propose that the general meeting of shareholders on 26 May 2021 approves the distribution of a gross dividend of €0.658 per share. The dividend is well below 30% of the net profit. Upon approval by the General meeting, this dividend will become payable as of 1 July 2021.
2.11 Statutory appointments– The mandates of Mr Olivier van der Rest, Mr Patrick Simonard, Mr Didier Leroy, Mrs Andrea Hatschek, Mr Eric
Olsen, Mr George Durman- Esquivel and Mr Thierry Vanlancker will expire at the next general meeting of shareholders on May 26, 2021. They are all candidate for re-election. Upon recommendation of the appointment and remuneration committee, the Board proposes to the shareholders their re-election for a term of office of three years, ending at the general meeting of shareholders in 2024.
– The mandate of Mr Kieran Murphy will also expire at the next general meeting of shareholders of May 26, 2021. He is candidate for re-election. Upon recommendation of the appointment and remuneration committee, the Board proposes to the shareholders the re-election for a term of office of two years, ending at the general meeting of shareholders of 2023.
– The mandate of Mrs Hélène Van Zeebroeck, Mr Marc Nolet de Brauwere and Mr Amaury Pelgrims de Bigard will also expire at the next general meeting of shareholders of May 26, 2021. They are not candidate for re-election. The Board of directors wishes to sincerely thank them for their valuable contribution to the Group during their many years of service.
– Upon recommendation of the appointment and remuneration committee, the Board proposes to the shareholders to elect GDF Impact SRL (represented by its permanent representative Mr Guy della Faille) and Mr Pierre-Alexandre Peters as directors of Aliaxis SA for a term of office of three years ending at the general meeting of shareholders to be held in 2024.
– The mandate of KPMG Bedrijfsrevisoren – Réviseurs d’Entreprises as auditor of the consolidated and non-consolidated accounts will expire at the next general meeting of shareholders. It has been proposed to the general meeting of shareholders to reappoint KPMG Bedrijfsrevisoren – Réviseurs d’Entreprises, as auditor of the consolidated and non-consolidated accounts of Aliaxis SA, for a term of three years, ending at the general meeting of shareholders in 2024.
Financialperformance
Aliaxis SA – Consolidated Annual Report 2020
46Aliaxis SA – Consolidated Annual Report 2020
47Aliaxis SA – Consolidated Annual Report 2020
Table of contents
Consolidated financial statements
Consolidated statement of profit or loss and other comprehensive income 48
Consolidated statement of financial position 50
Consolidated statement of changes in equity 51
Consolidated statement of cash flows 52
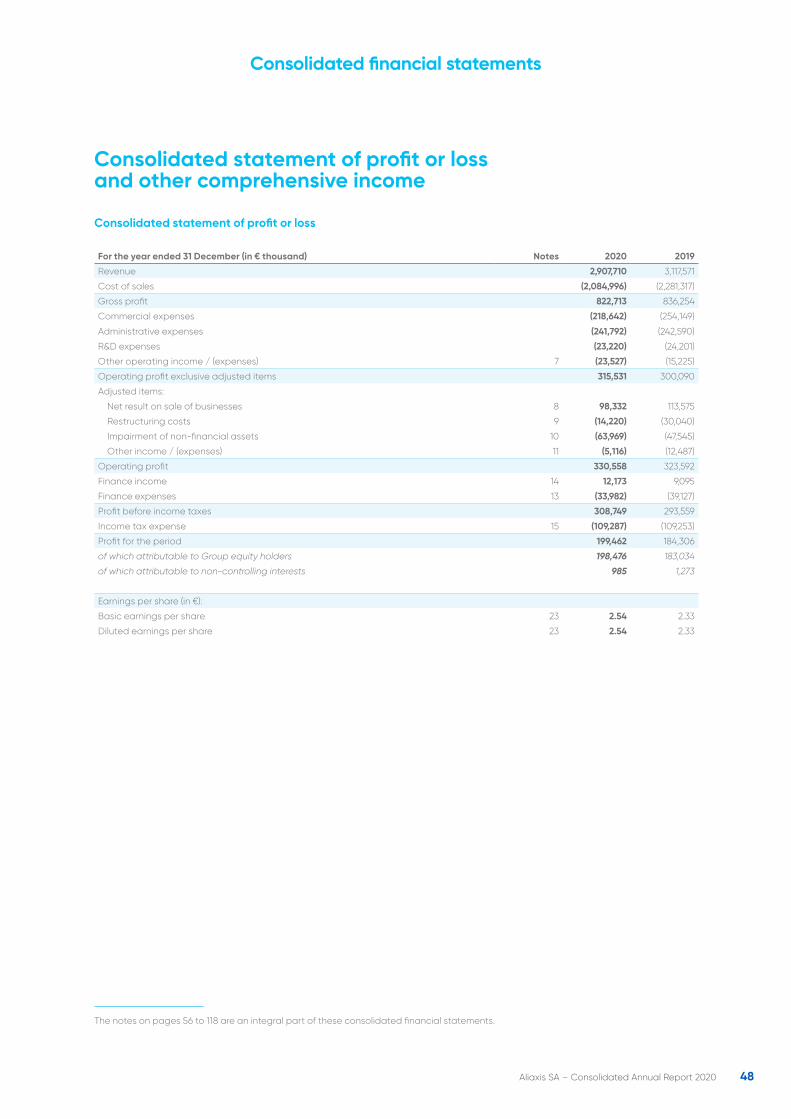
Consolidated statement of profit or loss and other comprehensive income
Consolidated statement of profit or loss
For the year ended 31 December (in € thousand) Notes 2020 2019
Revenue 2,907,710 3,117,571
Cost of sales (2,084,996) (2,281,317)
Gross profit 822,713 836,254
Commercial expenses (218,642) (254,149)
Administrative expenses (241,792) (242,590)
R&D expenses (23,220) (24,201)
Other operating income / (expenses) 7 (23,527) (15,225)
Operating profit exclusive adjusted items 315,531 300,090
Adjusted items:
Net result on sale of businesses 8 98,332 113,575
Restructuring costs 9 (14,220) (30,040)
Impairment of non-financial assets 10 (63,969) (47,545)
Other income / (expenses) 11 (5,116) (12,487)
Operating profit 330,558 323,592
Finance income 14 12,173 9,095
Finance expenses 13 (33,982) (39,127)
Profit before income taxes 308,749 293,559
Income tax expense 15 (109,287) (109,253)
Profit for the period 199,462 184,306
of which attributable to Group equity holders 198,476 183,034
of which attributable to non-controlling interests 985 1,273
Earnings per share (in €):
Basic earnings per share 23 2.54 2.33
Diluted earnings per share 23 2.54 2.33
The notes on pages 56 to 118 are an integral part of these consolidated financial statements.
48Aliaxis SA – Consolidated Annual Report 2020
Consolidated financial statements
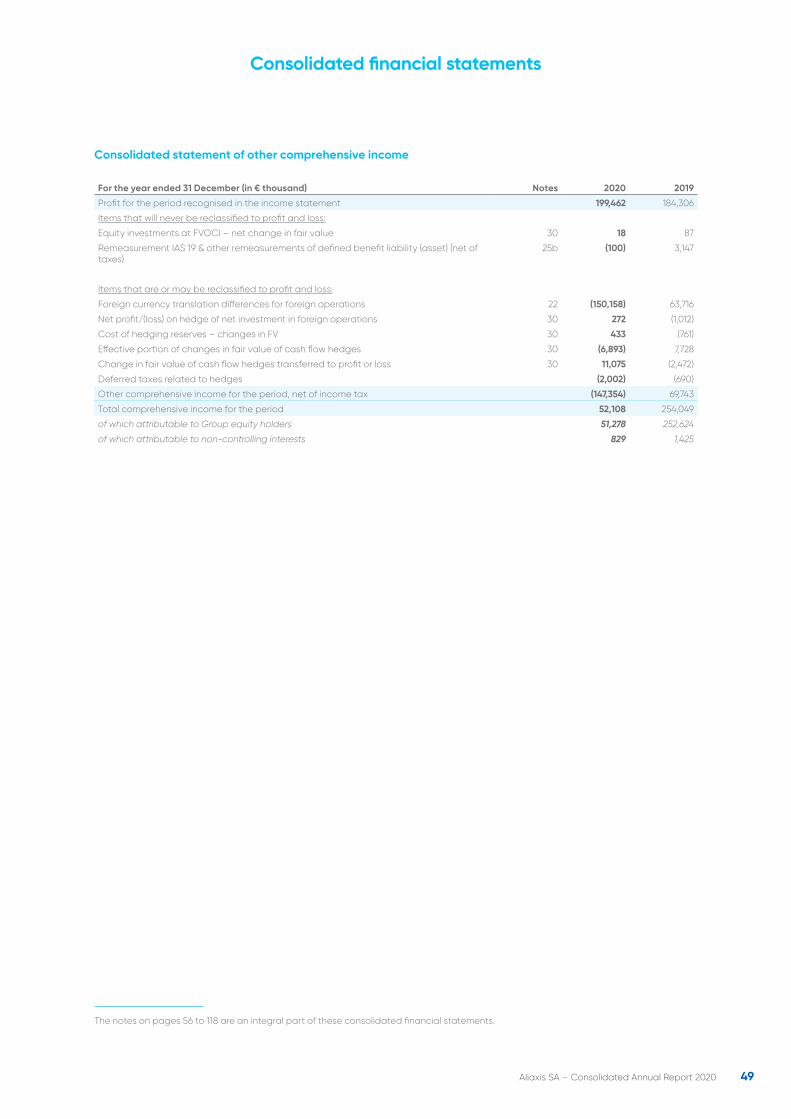
Consolidated statement of other comprehensive income
For the year ended 31 December (in € thousand) Notes 2020 2019
Profit for the period recognised in the income statement 199,462 184,306
Items that will never be reclassified to profit and loss:
Equity investments at FVOCI – net change in fair value 30 18 87
Remeasurement IAS 19 & other remeasurements of defined benefit liability (asset) (net of taxes)
25b (100) 3,147
Items that are or may be reclassified to profit and loss:
Foreign currency translation differences for foreign operations 22 (150,158) 63,716
Net profit/(loss) on hedge of net investment in foreign operations 30 272 (1,012)
Cost of hedging reserves – changes in FV 30 433 (761)
Effective portion of changes in fair value of cash flow hedges 30 (6,893) 7,728
Change in fair value of cash flow hedges transferred to profit or loss 30 11,075 (2,472)
Deferred taxes related to hedges (2,002) (690)
Other comprehensive income for the period, net of income tax (147,354) 69,743
Total comprehensive income for the period 52,108 254,049
of which attributable to Group equity holders 51,278 252,624
of which attributable to non-controlling interests 829 1,425
The notes on pages 56 to 118 are an integral part of these consolidated financial statements.
49Aliaxis SA – Consolidated Annual Report 2020
Consolidated financial statements
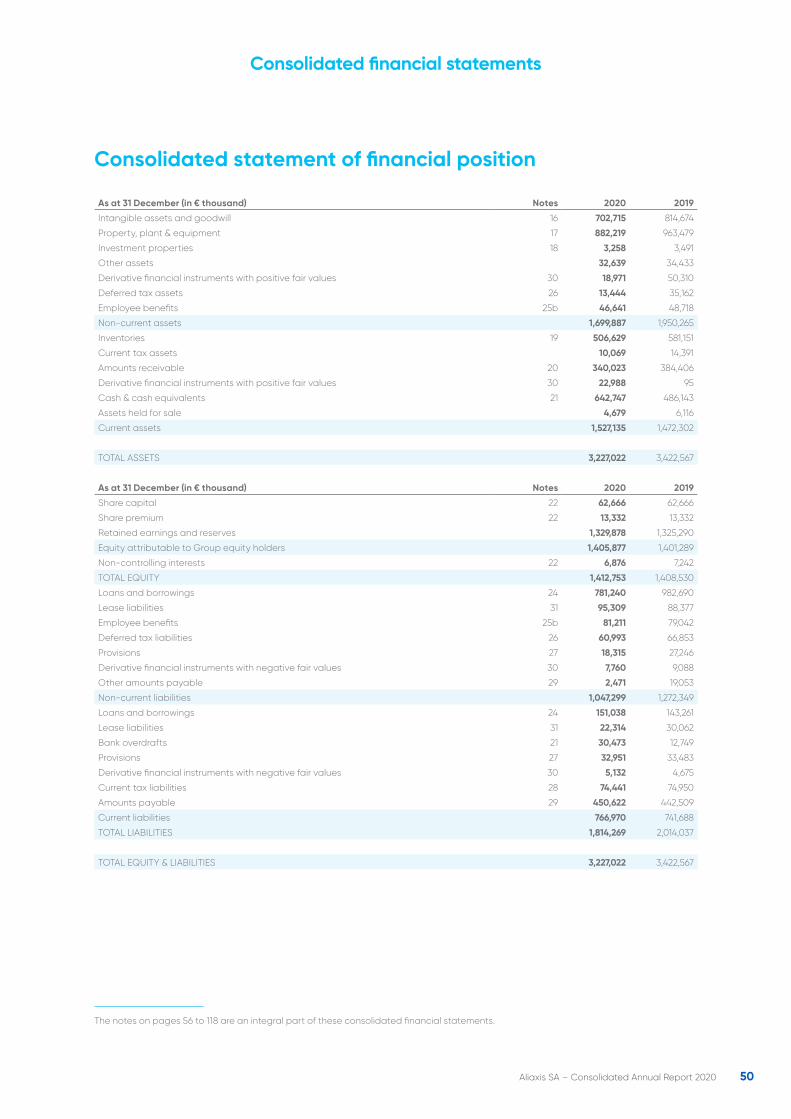
Consolidated statement of financial position
As at 31 December (in € thousand) Notes 2020 2019
Intangible assets and goodwill 16 702,715 814,674
Property, plant & equipment 17 882,219 963,479
Investment properties 18 3,258 3,491
Other assets 32,639 34,433
Derivative financial instruments with positive fair values 30 18,971 50,310
Deferred tax assets 26 13,444 35,162
Employee benefits 25b 46,641 48,718
Non-current assets 1,699,887 1,950,265
Inventories 19 506,629 581,151
Current tax assets 10,069 14,391
Amounts receivable 20 340,023 384,406
Derivative financial instruments with positive fair values 30 22,988 95
Cash & cash equivalents 21 642,747 486,143
Assets held for sale 4,679 6,116
Current assets 1,527,135 1,472,302
TOTAL ASSETS 3,227,022 3,422,567
As at 31 December (in € thousand) Notes 2020 2019
Share capital 22 62,666 62,666
Share premium 22 13,332 13,332
Retained earnings and reserves 1,329,878 1,325,290
Equity attributable to Group equity holders 1,405,877 1,401,289
Non-controlling interests 22 6,876 7,242
TOTAL EQUITY 1,412,753 1,408,530
Loans and borrowings 24 781,240 982,690
Lease liabilities 31 95,309 88,377
Employee benefits 25b 81,211 79,042
Deferred tax liabilities 26 60,993 66,853
Provisions 27 18,315 27,246
Derivative financial instruments with negative fair values 30 7,760 9,088
Other amounts payable 29 2,471 19,053
Non-current liabilities 1,047,299 1,272,349
Loans and borrowings 24 151,038 143,261
Lease liabilities 31 22,314 30,062
Bank overdrafts 21 30,473 12,749
Provisions 27 32,951 33,483
Derivative financial instruments with negative fair values 30 5,132 4,675
Current tax liabilities 28 74,441 74,950
Amounts payable 29 450,622 442,509
Current liabilities 766,970 741,688
TOTAL LIABILITIES 1,814,269 2,014,037
TOTAL EQUITY & LIABILITIES 3,227,022 3,422,567
The notes on pages 56 to 118 are an integral part of these consolidated financial statements.
50Aliaxis SA – Consolidated Annual Report 2020
Consolidated financial statements
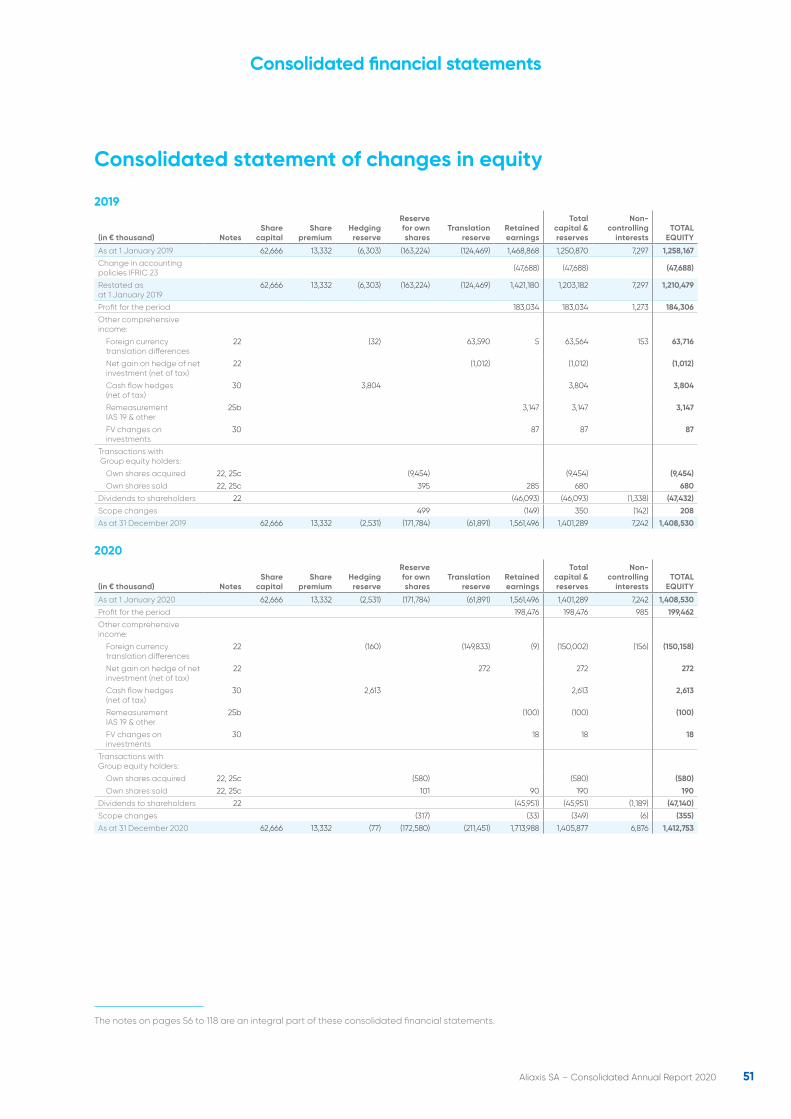
Consolidated statement of changes in equity
2019
(in € thousand) NotesShare
capitalShare
premiumHedging
reserve
Reserve for own shares
Translation reserve
Retained earnings
Total capital & reserves
Non-controlling
interestsTOTAL
EQUITY
As at 1 January 2019 62,666 13,332 (6,303) (163,224) (124,469) 1,468,868 1,250,870 7,297 1,258,167
Change in accounting policies IFRIC 23 (47,688) (47,688) (47,688)
Restated as at 1 January 2019
62,666 13,332 (6,303) (163,224) (124,469) 1,421,180 1,203,182 7,297 1,210,479
Profit for the period 183,034 183,034 1,273 184,306
Other comprehensive income:
Foreign currency translation differences
22 (32) 63,590 5 63,564 153 63,716
Net gain on hedge of net investment (net of tax)
22 (1,012) (1,012) (1,012)
Cash flow hedges (net of tax)
30 3,804 3,804 3,804
Remeasurement IAS 19 & other
25b 3,147 3,147 3,147
FV changes on investments
30 87 87 87
Transactions with Group equity holders:
Own shares acquired 22, 25c (9,454) (9,454) (9,454)
Own shares sold 22, 25c 395 285 680 680
Dividends to shareholders 22 (46,093) (46,093) (1,338) (47,432)
Scope changes 499 (149) 350 (142) 208
As at 31 December 2019 62,666 13,332 (2,531) (171,784) (61,891) 1,561,496 1,401,289 7,242 1,408,530
2020
(in € thousand) NotesShare
capitalShare
premiumHedging
reserve
Reserve for own shares
Translation reserve
Retained earnings
Total capital & reserves
Non-controlling
interestsTOTAL
EQUITY
As at 1 January 2020 62,666 13,332 (2,531) (171,784) (61,891) 1,561,496 1,401,289 7,242 1,408,530
Profit for the period 198,476 198,476 985 199,462
Other comprehensive income:
Foreign currency translation differences
22 (160) (149,833) (9) (150,002) (156) (150,158)
Net gain on hedge of net investment (net of tax)
22 272 272 272
Cash flow hedges (net of tax)
30 2,613 2,613 2,613
Remeasurement IAS 19 & other
25b (100) (100) (100)
FV changes on investments
30 18 18 18
Transactions with Group equity holders:
Own shares acquired 22, 25c (580) (580) (580)
Own shares sold 22, 25c 101 90 190 190
Dividends to shareholders 22 (45,951) (45,951) (1,189) (47,140)
Scope changes (317) (33) (349) (6) (355)
As at 31 December 2020 62,666 13,332 (77) (172,580) (211,451) 1,713,988 1,405,877 6,876 1,412,753
The notes on pages 56 to 118 are an integral part of these consolidated financial statements.
51Aliaxis SA – Consolidated Annual Report 2020
Consolidated financial statements
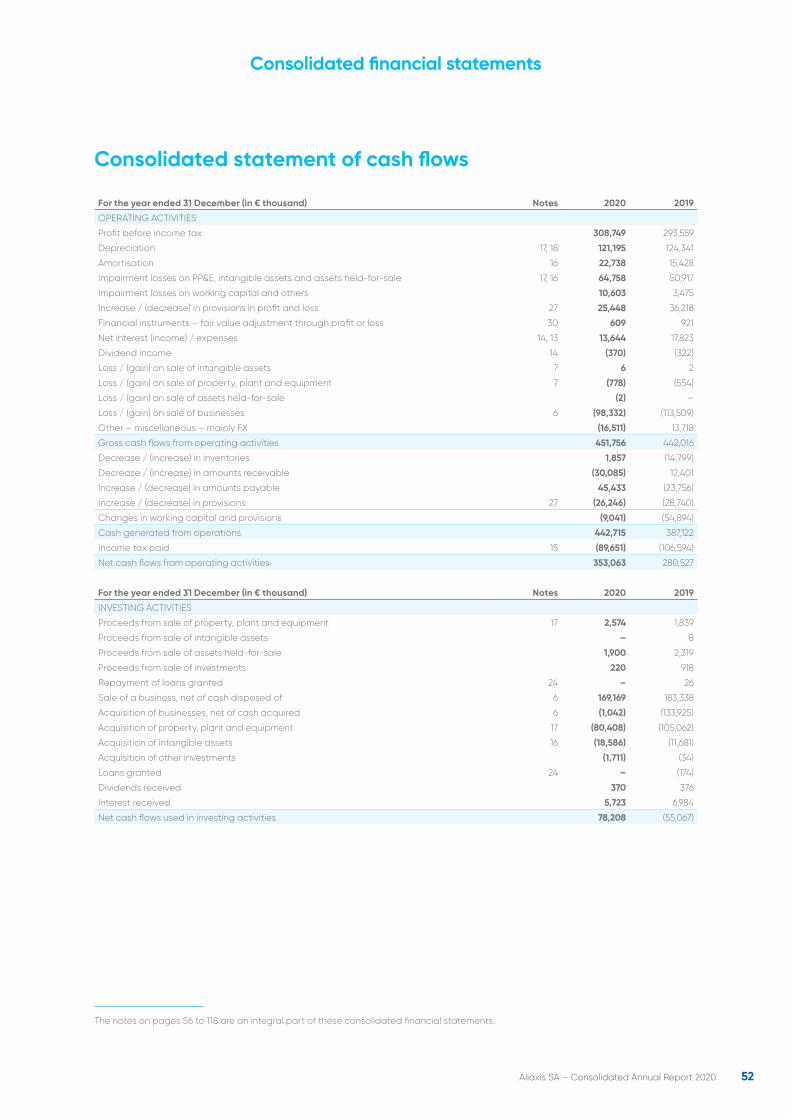
Consolidated statement of cash flows
For the year ended 31 December (in € thousand) Notes 2020 2019
OPERATING ACTIVITIES
Profit before income tax 308,749 293,559
Depreciation 17, 18 121,195 124,341
Amortisation 16 22,738 15,428
Impairment losses on PP&E, intangible assets and assets held-for-sale 17, 16 64,758 50,917
Impairment losses on working capital and others 10,603 3,475
Increase / (decrease) in provisions in profit and loss 27 25,448 36,218
Financial instruments – fair value adjustment through profit or loss 30 609 921
Net interest (income) / expenses 14, 13 13,644 17,823
Dividend income 14 (370) (322)
Loss / (gain) on sale of intangible assets 7 6 2
Loss / (gain) on sale of property, plant and equipment 7 (778) (554)
Loss / (gain) on sale of assets held-for-sale (2) –
Loss / (gain) on sale of businesses 6 (98,332) (113,509)
Other – miscellaneous – mainly FX (16,511) 13,718
Gross cash flows from operating activities 451,756 442,016
Decrease / (increase) in inventories 1,857 (14,799)
Decrease / (increase) in amounts receivable (30,085) 12,401
Increase / (decrease) in amounts payable 45,433 (23,756)
Increase / (decrease) in provisions 27 (26,246) (28,740)
Changes in working capital and provisions (9,041) (54,894)
Cash generated from operations 442,715 387,122
Income tax paid 15 (89,651) (106,594)
Net cash flows from operating activities 353,063 280,527
For the year ended 31 December (in € thousand) Notes 2020 2019
INVESTING ACTIVITIES
Proceeds from sale of property, plant and equipment 17 2,574 1,839
Proceeds from sale of intangible assets – 8
Proceeds from sale of assets held-for-sale 1,900 2,319
Proceeds from sale of investments 220 918
Repayment of loans granted 24 – 26
Sale of a business, net of cash disposed of 6 169,169 183,338
Acquisition of businesses, net of cash acquired 6 (1,042) (133,925)
Acquisition of property, plant and equipment 17 (80,408) (105,062)
Acquisition of intangible assets 16 (18,586) (11,681)
Acquisition of other investments (1,711) (34)
Loans granted 24 – (174)
Dividends received 370 376
Interest received 5,723 6,984
Net cash flows used in investing activities 78,208 (55,067)
The notes on pages 56 to 118 are an integral part of these consolidated financial statements.
52Aliaxis SA – Consolidated Annual Report 2020
Consolidated financial statements
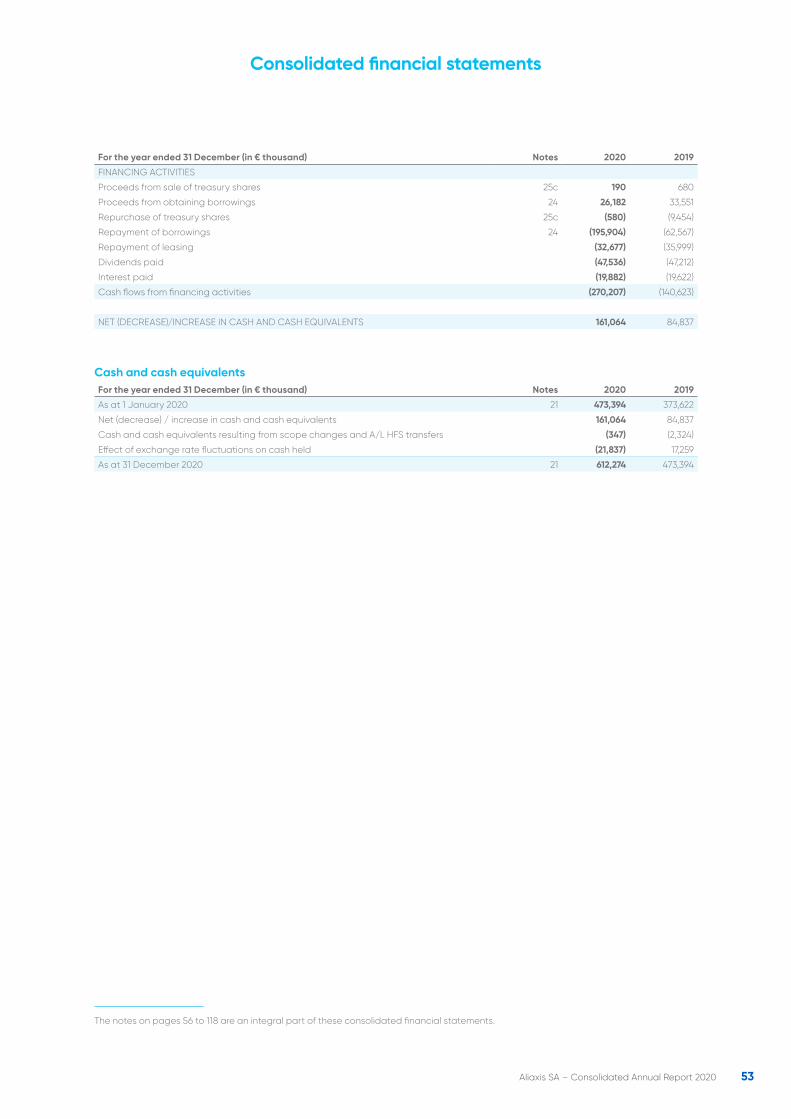
For the year ended 31 December (in € thousand) Notes 2020 2019
FINANCING ACTIVITIES
Proceeds from sale of treasury shares 25c 190 680
Proceeds from obtaining borrowings 24 26,182 33,551
Repurchase of treasury shares 25c (580) (9,454)
Repayment of borrowings 24 (195,904) (62,567)
Repayment of leasing (32,677) (35,999)
Dividends paid (47,536) (47,212)
Interest paid (19,882) (19,622)
Cash flows from financing activities (270,207) (140,623)
NET (DECREASE)/INCREASE IN CASH AND CASH EQUIVALENTS 161,064 84,837
Cash and cash equivalentsFor the year ended 31 December (in € thousand) Notes 2020 2019
As at 1 January 2020 21 473,394 373,622
Net (decrease) / increase in cash and cash equivalents 161,064 84,837
Cash and cash equivalents resulting from scope changes and A/L HFS transfers (347) (2,324)
Effect of exchange rate fluctuations on cash held (21,837) 17,259
As at 31 December 2020 21 612,274 473,394
The notes on pages 56 to 118 are an integral part of these consolidated financial statements.
53Aliaxis SA – Consolidated Annual Report 2020
Consolidated financial statements
54Aliaxis SA – Consolidated Annual Report 2020
Table of contents
Notes to the consolidated financial statements
1. Corporate information 56
2. Basis of preparation 56
3. Significant accounting policies 58
4. Business combinations 74
5. Financial risk management 75
6. Acquisitions and disposals of subsidiaries and non-controlling interests 79
7. Other operating income and expenses 79
8. Net result on sale of businesses 79
9. Restructuring costs 79
10. Impairment of non-financial assets 80
11. Other income and expenses 80
12. Additional information on operating expenses 80
13. Finance expenses 81
14. Finance income 81
15. Income taxes 82
16. Intangible assets and goodwill 83
17. Property, plant and equipment 85
18. Investment properties 86
19. Inventories 86
20. Amounts receivable 86
55Aliaxis SA – Consolidated Annual Report 2020
Table of contents
21. Cash and cash equivalents 87
22. Equity 87
23. Earnings per share 88
24. Loans and borrowings 89
25. Employee benefits 92
26. Deferred tax assets and liabilities 100
27. Provisions 101
28. Current tax liabilities 101
29. Amounts payable 102
30. Financial instruments 103
31. Leases 112
32. Guarantees, collateral and contractual commitments 113
33. Contingencies 114
34. Related parties 114
35. Aliaxis companies 115
36. Services provided by the statutory auditor 118
37. Subsequent events 118
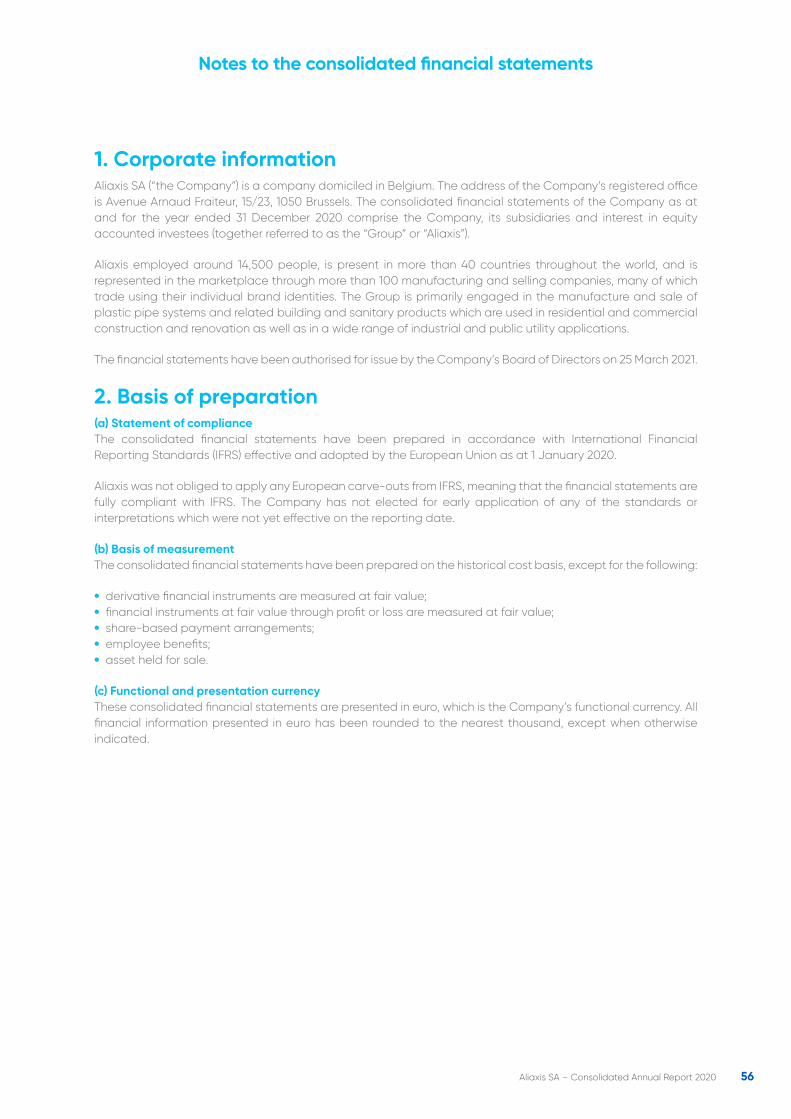
56Aliaxis SA – Consolidated Annual Report 2020
1. Corporate informationAliaxis SA (“the Company”) is a company domiciled in Belgium. The address of the Company’s registered office is Avenue Arnaud Fraiteur, 15/23, 1050 Brussels. The consolidated financial statements of the Company as at and for the year ended 31 December 2020 comprise the Company, its subsidiaries and interest in equity accounted investees (together referred to as the “Group” or “Aliaxis”).
Aliaxis employed around 14,500 people, is present in more than 40 countries throughout the world, and is represented in the marketplace through more than 100 manufacturing and selling companies, many of which trade using their individual brand identities. The Group is primarily engaged in the manufacture and sale of plastic pipe systems and related building and sanitary products which are used in residential and commercial construction and renovation as well as in a wide range of industrial and public utility applications.
The financial statements have been authorised for issue by the Company’s Board of Directors on 25 March 2021.
2. Basis of preparation(a) Statement of complianceThe consolidated financial statements have been prepared in accordance with International Financial Reporting Standards (IFRS) effective and adopted by the European Union as at 1 January 2020.
Aliaxis was not obliged to apply any European carve-outs from IFRS, meaning that the financial statements are fully compliant with IFRS. The Company has not elected for early application of any of the standards or interpretations which were not yet effective on the reporting date.
(b) Basis of measurementThe consolidated financial statements have been prepared on the historical cost basis, except for the following:
• derivative financial instruments are measured at fair value; • financial instruments at fair value through profit or loss are measured at fair value; • share-based payment arrangements; • employee benefits; • asset held for sale.
(c) Functional and presentation currencyThese consolidated financial statements are presented in euro, which is the Company’s functional currency. All financial information presented in euro has been rounded to the nearest thousand, except when otherwise indicated.
Notes to the consolidated financial statements
57Aliaxis SA – Consolidated Annual Report 2020
(d) Use of estimates and judgmentsThe preparation of consolidated financial statements requires management to make judgments, estimates and assumptions that affect the application of accounting policies and the reported amounts of assets, liabilities, income and expenses. Actual results may differ from these estimates.
Estimates and underlying assumptions are reviewed on an ongoing basis. Revisions to accounting estimates are recognised in the period in which the estimate is revised and in any future periods affected.
In particular, information about significant areas of estimation, uncertainty and critical judgments in applying accounting policies that have the most significant effect on the amount recognised in the consolidated financial statements, are described in the following notes:
• Note 16 – measurement of the recoverable amounts of cash-generating units; • Note 25b – measurement of defined benefit obligations; • Note 25c – measurement of share-based payments; • Note 26 – use of tax losses; • Notes 27 and 33 – provisions and contingencies; • Note 28 – liabilities for uncertain tax positions; • Note 30 – valuation of derivative financial instruments and determination of effectiveness for hedge
accounting.
Measurement of fair valuesA number of the Group’s accounting policies and disclosures require the measurement of fair values, for both financial and non-financial assets and liabilities.
When measuring the fair values of an asset and liability, the Group uses market observable data as far as possible. Fair values are categorised into different levels in a fair value hierarchy based on the inputs used in the valuation techniques as follows:
• Level 1: quoted prices (unadjusted) in active markets for identical assets or liabilities. • Level 2: inputs other than quoted prices included in Level 1 that are observable for the asset or liability, either
directly (i.e. as prices) or indirectly (i.e. derived from prices). • Level 3: inputs for the asset or liability that are not based on observable market data (unobservable inputs).
Further information about the assumptions made in measuring fair values is included in the following notes:
• Note 18 – investment properties; • Note 25c – share-based payments; • Note 30 – financial instruments.
Notes to the consolidated financial statements
58Aliaxis SA – Consolidated Annual Report 2020
3. Significant accounting policiesExcept for the changes explained below, the accounting policies adopted are consistent with those of the previous financial year.
As of 1 January 2020, Aliaxis adopted the following new and amended IFRS standards and interpretations and considered that did not result in significant changes in the consolidated financial statements.
Amendment to IFRS 3 Business Combinations, issued on 22 October 2018, provides more guidance on the definition of a business. The amendment includes an election to use a concentration test. This is a simplified assessment that will result in an asset acquisition if substantially all of the fair value of the gross assets is concentrated in a single identifiable asset or a group of similar identifiable assets. If one does not apply the concentration test, or the test is failed, then the assessment focuses on the existence of substantive process.
Amendments to IAS 1 and IAS 8: Definition of Material was issued on 31 October 2018 clarifying the definition of ‘Material’ and aligning the definition of ‘material’ across the standards. The new definition states that “information is considered material, if omitting, misstating or obscuring it could reasonably be expected to influence decisions that primarily users of general-purpose financial statements make on the basis of those financial statements, which provide information about a specific reporting entity”. The amendments clarify that materiality will depend on the nature or magnitude of information.
On 29 March 2018, the IASB has issued Amendments to References to the Conceptual Framework in IFRS Standards (Amendments to CF). The Conceptual Framework sets out the fundamental concepts of financial reporting that guides the Board in developing IFRS Standards. It helps to ensure that the Standards are conceptually consistent and that similar transactions are treated the same way, providing useful information for investors and others. The Conceptual Framework also assists companies in developing accounting policies when no IFRS Standard applies to a particular transaction; and it helps stakeholders to understand the Standards better.
Key changes include:
• Increasing the prominence of stewardship in the objective of financial reporting, which is to provide information that is useful in making resource allocation decisions.
• Reinstating prudence, defined as the exercise of caution when making judgements under conditions of uncertainty, as a component of neutrality.
• Defining a reporting entity, which might be a legal entity or a portion of a legal entity. • Revising the definition of an asset as a present economic resource controlled by the entity as a result of past
events. • Revising the definition of a liability as a present obligation of the entity to transfer an economic resource as
a result of past events. • Removing the probability threshold for recognition and adding guidance on derecognition. • Adding guidance on the information provided by different measurement bases and explaining factors to
consider when selecting a measurement basis. • Stating that profit or loss is the primary performance indicator and that, in principle, income and expenses in
other comprehensive income should be recycled where the relevance or faithful representation of the financial statements would be enhanced.
On 26 September 2019, the IASB has issued Amendments to IFRS 9, IAS 39 and IFRS 7 (interest rate benchmark reform). The related amendments modify some specific hedge accounting requirements to provide relief from potential effects of the uncertainty caused by the IBOR reform. In addition, it requires companies to provide additional information to investors about their hedging relationships which are directly affected by these uncertainties.
Notes to the consolidated financial statements
59Aliaxis SA – Consolidated Annual Report 2020
The amendments are summarised as follows:
• When determining whether a forecast transaction is highly probable, a company shall assume that the interest rate benchmark on which the hedged cash flows are based is not altered as a result of the reform.
• When performing prospective assessments, a company shall assume that the interest rate benchmark on which the hedged item, hedged risk and/or hedging instrument are based is not altered as a result of their interest rate benchmark reform.
• When applying IAS 39, the company is not required to undertake the IAS 39 retrospective assessment for hedging relationships directly affected by the reform. However, the company must comply with all other IAS 39 hedge accounting requirements, including the prospective assessment.
• For hedges of a non-contractually specified benchmark component of interest rate risk, a company shall apply the separately identifiable requirement only at the inception of such hedging relationship.
(a) Basis of consolidationA list of the most important subsidiaries and equity accounted investees is presented in Note 35.
SubsidiariesSubsidiaries are entities controlled by the Group. The Group controls an entity when it is exposed to, or has rights to, variable returns from its involvement with the entity and has the ability to affect those returns through its power over the entity. The financial statements of subsidiaries are included in the consolidated financial statements from the date on which control commences until the date on which control ceases.
Non-controlling interestsNon-controlling interests are measured at their proportionate share of the acquiree’s identifiable net assets at the date of acquisition.
Changes in the Group’s interest in a subsidiary that do not result in a loss of control are accounted for as equity transactions.
Transactions eliminated on consolidationIntra-group balances, and any unrealised income and expenses arising from intra-group transactions, are eliminated in preparing the consolidated financial statements. Unrealised gains arising from transactions with equity accounted investees are eliminated against the investment to the extent of the Group’s interest in the investee. Unrealised losses are eliminated in the same way as unrealised gains, but only to the extent that there is no evidence of impairment.
Loss of controlUpon the loss of control, the Group derecognises the assets and liabilities of the subsidiary, any related, non-controlling interests and the other components of equity related to the subsidiary. Any resulting gain or loss is recognised in profit or loss. If the Group retains any interest in the former subsidiary, then such interest is measured at fair value at the date that control is lost.
(b) Foreign currenciesForeign currency transactionsTransactions in foreign currencies are translated to the respective functional currency of Aliaxis entities at exchange rates at the date of the transactions. Monetary assets and liabilities denominated in foreign currencies at the reporting date are retranslated to the functional currency at the exchange rate at that date. Non-monetary assets and liabilities denominated in foreign currencies that are carried at historical cost are translated at the reporting date at exchange rates at the dates of the transactions. Non-monetary assets and liabilities denominated in foreign currencies that are stated at fair value are translated at the reporting date at the exchange rate at the date the fair value was determined. Foreign currency differences arising on retranslation are recognised in profit or loss, except for differences arising on the retranslation of equity instruments at FVOCI or a financial liability designated as a hedge of the net investment in a foreign operation (see below), which are recognised directly in other comprehensive income (OCI) under translation reserve.
Notes to the consolidated financial statements
60Aliaxis SA – Consolidated Annual Report 2020
Foreign operationsThe assets and liabilities of foreign operations, including goodwill and fair value adjustments arising on acquisition, are translated to euro at exchange rates at the reporting date. The income and expenses of foreign operations are translated to euro at average exchange rates for the year approximating the foreign exchange rates at the dates of the transactions. The components of shareholders’ equity are translated at historical exchange rates.
Foreign currency differences are recognised in OCI and presented in the foreign currency translation reserve (translation reserve) in equity. However, if the operation is a non-wholly owned subsidiary, then the relevant proportionate share of the translation difference is allocated to non-controlling interests. When a foreign operation is disposed of such that control, significant influence or joint control is lost, the cumulative amount in the translation reserve related to that foreign operation is reclassified to profit or loss as part of the gain or loss on disposal. When the Group disposes of only part of its interest in a subsidiary that includes a foreign operation while retaining control, the relevant proportion of the cumulative amount is reattributed to non-controlling interests. When the Group disposes of only part of its investment in an associate or joint venture that includes a foreign operation while retaining significant influence or joint control, the relevant proportion of the cumulative amount is reclassified to profit or loss.
Hedge of net investment in a foreign operationThe Group applies hedge accounting to foreign currency differences arising between the functional currency of the foreign operation and the euro regardless of whether the net investment is held directly or through an intermediate parent. Foreign currency differences arising on the retranslation of a financial liability designated as a hedge of a net investment in a foreign operation are recognised directly in OCI under translation reserve, to the extent that the hedge is effective. To the extent that the hedge is ineffective, such differences are recognised in profit or loss. When an entity partially disposes of a subsidiary that includes a foreign operation, but retains control, the entity re-attributes a proportionate share of the cumulative amounts previously recognised in OCI to NCI.
In addition, monetary items receivable from or payable to a foreign operation for which settlement is neither planned nor likely to occur in the foreseeable future are a part of the Group’s net investment in such foreign operation. Any foreign currency differences on these items are recognised directly in OCI under translation reserve, and the relevant cumulative amount in OCI is transferred to profit or loss when the investment is disposed of, in part or in full.
Exchange ratesThe following major exchange rates have been used in preparing the consolidated financial statements.
Average Reporting date
2020 2019 2020 2019
AUD 1.655 1.611 1.590 1.600
CAD 1.530 1.486 1.563 1.460
GBP 0.889 0.878 0.899 0.851
NZD 1.756 1.700 1.698 1.665
USD 1.142 1.120 1.227 1.123
INR 84.599 78.835 89.661 80.187
(c) Intangible assets and goodwillGoodwillThe carrying amount of goodwill is allocated to those reporting entities that are expected to benefit from the synergies of the business combination and those are considered as the Group’s cash-generating units.
Goodwill is expressed in the functional currency of the reporting entity to which it is allocated and is translated to euro using the exchange rate at the reporting date.
In respect of equity accounted investees, the carrying amount of goodwill is included in the carrying amount of the investment.
Notes to the consolidated financial statements
61Aliaxis SA – Consolidated Annual Report 2020
Goodwill is measured at cost less accumulated impairment losses (see Note 3k).
The Group elected not to restate those business combinations that occurred prior to the transition to IFRS; this goodwill represented the amount, net of accumulated amortisation, recognised under the Group’s previous accounting framework, Belgian GAAP.
For acquisitions as of 1 January 2010, goodwill represents the excess of the consideration transferred with respect to the acquisition over the Group’s interest in the net fair value of the identifiable assets, liabilities and contingent liabilities of the acquiree. When the excess is negative (negative goodwill), it is recognised immediately in profit or loss.
Intangible assets acquired in a business combinationIntangible assets such as customers’ relationships, trademarks, patents acquired in a business combination initially are recognised at fair value. If the criteria for separate recognition are not met, they are subsumed under goodwill.
The calculation of the fair value of a customer list is based on the discounted cash flows (after tax) derived from the sales related to such customers after (i) applying an attrition rate (as observed over a relevant historical period of time), and (ii) accounting for all related operating costs (except financial) including specific contributory charges on assets and labour.
Research and developmentExpenditure on research activities undertaken with the prospect of gaining new scientific or technical knowledge and understanding is recognised in profit or loss when incurred.
Development activities involve a plan or design for the production of new or substantially improved products and processes. Development expenditure is capitalised only if development costs can be measured reliably, the product or process is technically and commercially feasible, future economic benefits are probable, and Aliaxis intends to and has sufficient resources to complete development and to use or sell the asset. The expenditure capitalised includes capitalised borrowing costs and the cost of materials, direct labour and overhead costs that are directly attributable to preparing the asset for its intended use. If the recognition criteria referred to above are not met, the expenditure is recognised in profit or loss as an expense when incurred.
Capitalised development expenditure is measured at cost less accumulated amortisation (see below) and accumulated impairment losses (see Note 3k).
Other intangible assetsOther intangible assets that are acquired by Aliaxis which have finite useful lives are measured at cost less accumulated amortisation (see below) and accumulated impairment losses (see Note 3k).
Subsequent expenditureSubsequent expenditure is capitalised only when it increases the future economic benefits embodied in the specific asset to which it relates. All other expenditure, including expenditure on internally generated goodwill and brands, is recognised in profit or loss when incurred.
AmortisationAmortisation is recognised in profit or loss on a straight-line basis over the estimated useful lives of intangible assets with a finite life, from the date that they are available for use. Goodwill is not amortised. The estimated useful lives are as follows:
• Patents, concessions and licenses 5 years • Capitalised development costs 3-5 years • IT software 5-7 years • Drawings 25 years
Notes to the consolidated financial statements
62Aliaxis SA – Consolidated Annual Report 2020
The value of the customer list is amortised -with a straight-line method- along a useful life which corresponds to the number of years until the present value of the last individual cash-flow becomes insignificant.
Amortisation methods, useful lives and residual values are reviewed at each reporting date and adjusted if appropriate.
(d) Property, plant and equipmentRecognition and measurementItems of property, plant and equipment are measured at cost less accumulated depreciation (see below) and impairment losses (see Note 3k). Aliaxis elected to measure certain items of property, plant and equipment at 1 January 2005, the date of transition to IFRS, at fair value and used those fair values as deemed cost at that date.
Cost includes expenditures that are directly attributable to the acquisition of the asset; e.g. cost of materials and direct labour, costs incurred to bring the asset to its working condition and location for its intended use, any relevant costs of dismantling and removing the asset and restoring the site on which the asset was located when the Group has an obligation. Purchased software that is integral to the functionality of the related equipment and borrowing costs are capitalised, as part of that equipment.
Gains and losses on disposal of an item of property, plant and equipment are determined by comparing the net proceeds from disposal with the carrying amount of property, plant and equipment and are recognised within other income/expenses in profit or loss.
When parts of an item of property, plant and equipment have different useful lives, they are accounted for as separate items (major components) of property, plant and equipment.
Subsequent expenditureThe cost of replacing part of an item of property, plant and equipment is recognised in the carrying amount of the item only if it is probable that the future economic benefits embodied within such part will flow to the Group and its cost can be measured reliably. The carrying amount of the replaced part is derecognised. The costs of the day-to-day servicing of property, plant and equipment are recognised in profit or loss as incurred.
DepreciationDepreciation is recognised in profit or loss on a straight-line basis over the estimated useful lives of each part of an item of property, plant and equipment. Leased assets are depreciated over the shorter of the lease term and their useful lives, unless there is certainty that the Group will take ownership at the end of the lease term. Land is not depreciated.
Items of property, plant and equipment are depreciated from the date that they are installed and are ready for use.
The estimated useful lives are as follows:
• Buildings:• Structure 40-50 years• Roof and cladding 15-40 years• Installations 15-20 years
• Plant, machinery and equipment:• Silos 20 years• Machinery and surrounding equipment 10 years• Moulds 3-5 years
• Furniture 10 years • Office machinery 3-5 years • Vehicles 5 years • IT & IS 3-5 years
Notes to the consolidated financial statements
63Aliaxis SA – Consolidated Annual Report 2020
Depreciation methods and useful lives, together with residual values if not insignificant, are reassessed at each reporting date and adjusted if appropriate.
(e) Leased assetsLeases are recognised as a right-of-use asset and corresponding liability at the date of which the leased asset is available for use by the Group. Right-of-use assets are measured at cost, less any accumulated depreciation and impairment losses, and adjusted for any remeasurement of lease liabilities. The cost of right-of-use assets includes the amount of lease liabilities recognised, initial direct costs incurred, and lease payments made at or before the commencement date less any lease incentives received.
Right-of-use assets are depreciated on a straight-line basis over the shorter of the lease term and the estimated useful lives of the assets.
The Group elected to use the recognition exemptions for lease contracts that, at the commencement date, have a lease term of less than 12 months (‘short-term leases’) and lease contracts for which the underlying asset is of low value (‘low-value assets’). Low value refers to assets with a value of € 5.000 or less when they are new.
At the commencement date of the lease, the Group recognises lease liabilities measured at the present value of lease payments to be made over the lease term. The lease payments include fixed payments less any lease incentives receivable, variable lease payments that depend on an index or a rate, and amounts expected to be paid under residual value guarantees. The lease payments also include the exercise price of a purchase option reasonably certain to be exercised by the Group and payments of penalties for terminating the lease, if the lease term reflects the Group exercising the option to terminate. Variable lease payments that do not depend on an index or a rate are recognised as expenses in the period in which the event or condition that triggers the payment occurs.
In calculating the present value of lease payments, the Group uses its incremental borrowing rate which has been determined along two dimensions:
• The currency in which the lease contract is denominated; • The duration of the lease contract. For simplicity, durations have been grouped in categories with individual
appropriate rates being extrapolated when necessary and averaged thereafter.
After the commencement date, the amount of lease liabilities is increased to reflect the accretion of interest and reduced for the lease payments made. Each lease payment is allocated between the liability and finance cost. The finance cost is charged to the income statement over the lease period so as to produce a constant periodic rate of interest on the remaining balance of the liability for each period.
In addition, the carrying amount of lease liabilities is remeasured if there is a modification, a change in the lease term, a change in the lease payments (e.g. changes to future payments resulting from a change in an index or rate used to determine such lease payments) or a change in the assessment of an option to purchase the underlying asset.
Lease payments that are due within 12 months are classified as current liabilities. All lease payments that are due at least 12 months after the balance sheet date are classified as non-current liabilities.
Payments associated with short-term leases and leases of low-value assets are recognised on a straight-line basis as an expense in profit or loss.
Notes to the consolidated financial statements
64Aliaxis SA – Consolidated Annual Report 2020
Some of the car leases contain variable lease payments. It concerns car lease agreements that contain a Terminal Rental Adjustment Clause (TRAC): a final settlement calculation is made at termination of the lease to determine the final rental adjustment. This final rent adjustment is a rent payment (or credit) that reflects actual usage of the vehicle while under lease. This final amount is not known at lease commencement. The rental adjustment amount is not a specified amount but depends upon known factors such as monthly depreciation and initial acquisition cost, and several unknown factors at lease commencement, such as mileage, condition of the vehicle, wear and tear, damage, geography of operation, disposal channel, and other factors. Together, these factors generally represent “use” of the vehicle. Payments that vary due to use of the underlying asset and vehicle mileage specifically are variable lease payments. The final rental adjustment is recognised as expense or, in case of a credit, as a reduction of expenses when realised.
(f) Investment propertiesInvestment property is property held either to earn rental income or for capital appreciation or for both. Investment property is measured at cost less accumulated depreciation and impairment losses (see Note 3k).
Depreciation is recognised in profit or loss on a straight-line basis over the estimated useful life of the property consistent with the useful lives for property, plant and equipment (see Note 3d).
The fair values, which are determined for disclosure purposes, are based on market values, being the estimated amount for which a property could be exchanged on the date of the valuation between a willing buyer and a willing seller in an arm’s length transaction after proper marketing wherein the parties had each acted knowledgeably, prudently and without compulsion. In the absence of current prices in an active market, the valuations are prepared by considering the aggregate of the estimated cash flows expected to be received from renting out the property. A yield that reflects the specific risks inherent in the net cash flows is then applied to the net annual cash flows to arrive at the property valuation.
(g) Other non-current assetsInvestments in equity securitiesInvestments in equity securities are undertakings in which Aliaxis does not have significant influence or control. These investments are designated as financial assets at FVTPL which are, subsequent to initial recognition, measured at fair value, except for those equity instruments that do not have a quoted market price in an active market and whose fair value cannot be reliably measured. Those equity instruments that are excluded from fair valuation are stated at cost. Changes in the fair value, other than impairment losses (see Note 3k), are recognised directly in OCI. When an investment is derecognised, the cumulative gain or loss previously recognised directly in equity is transferred to profit or loss.
Investments in debt securitiesInvestments in debt securities are classified at fair value through profit or loss or fair value through OCI and are carried at fair value with any resulting gain or loss respectively recognised in profit or loss or directly in OCI. Impairment losses (see Note 3k) and foreign exchange gains and losses are recognised in profit or loss.
Other financial assetsA financial asset is classified at fair value through profit or loss if it is held for trading or is designated as such upon initial recognition. Financial assets are designated at fair value through profit or loss if Aliaxis manages such investments and makes purchase and sale decisions based on their fair value. Upon initial recognition, attributable transaction costs are recognised in profit or loss when incurred. Financial assets at fair value through profit or loss are measured at fair value, and changes therein are recognised in profit or loss.
Other assetsThese assets are measured at amortised cost using the effective interest rate method, less any impairment losses (see Note 3k).
Notes to the consolidated financial statements
65Aliaxis SA – Consolidated Annual Report 2020
(h) InventoriesInventories are measured at the lower of cost and net realisable value. The cost of inventories is based on the weighted average principle for raw materials, packaging materials, consumables, purchased components and goods purchased for resale, and on the first-in first-out principle for finished goods, work in progress and produced components.
The cost includes expenditure incurred in acquiring the inventories and bringing them to their existing location and condition. In the case of manufactured inventories and work in progress, cost also includes production costs and an appropriate share of production overheads based on normal operating capacity.
Net realisable value is the estimated selling price in the ordinary course of business, less the estimated costs of completion and selling expenses.
(i) Amounts receivableAmounts receivable comprise trade and other receivables. These amounts are carried at amortised cost, less impairment losses (see Note 3k).
(j) Cash and cash equivalentsCash and cash equivalents comprise cash balances and call deposits with final maturities of three months or less at acquisition date. Bank overdrafts that are repayable on demand and form an integral part of the Group’s cash management are included as a component of cash and cash equivalents for the purpose of the statement of cash flows.
(k) Impairment Financial assetsFor financial instruments and contract assets, the Group recognises loss allowances for ECLs on financial assets measured at amortised cost and debt investments measured at FVOCI. The Group measures loss allowances at an amount equal to lifetime ECLs, except for the following, which are measured at 12-month ECLs:
• Debts securities that are determined to have low credit risk at the reporting date; and • Other debt securities and bank balances for which credit risk has not increased significantly since initial
recognition.
The Group assumes that the credit risk on a financial asset has increased significantly if it is more than 30 days past due.
The Group considers a financial asset to be in default when:
• The debtor is unlikely to pay its credit obligations to the Group in full, without recourse by the Group to actions such as realising security (if any is held); or
• The financial asset is more than 365 days past due.
Lifetime ECLs are the ECLs that result from all possible default events over the expected life of a financial instrument. 12-month ECLs are the portion of ECLs that result from default events that are possible within the 12 months after reporting date. The maximum period considered when estimating ECLs is the maximum contractual period over which the Group is exposed to credit risk.
ECLs are a probability-weighted estimate of credit losses. Credit losses are measured as the present value of all cash shortfalls (i.e. the difference between the cash flow due to the entity in accordance with the contract and the cash flows that the Group expects to receive). ECLs are discounted at the effective interest rate of the financial asset.
At each reporting date, the Group assesses whether the financial assets carried at amortised cost and debt securities at FVOCI are credit impaired. A financial asset is credit impaired when one or more events that have an impact on the estimated future cash flows of the financial assets have occurred.
Notes to the consolidated financial statements
66Aliaxis SA – Consolidated Annual Report 2020
Loss allowance for financial assets measured at amortised cost are deducted from the gross carrying amounts of the assets. For debt securities at FVOCI, the loss allowance is charged to profit or loss and is recognised in OCI.
Non-financial assetsThe carrying amounts of the Group’s non-financial assets, other than inventories (see Note 3h) and deferred tax assets (see Note 3v), are reviewed at each reporting date to determine whether there is any external or internal indication of impairment. If any such indication exists, then the asset’s recoverable amount is estimated. For goodwill and intangible assets that have indefinite useful lives or that are not yet available for use, the recoverable amount is estimated at each reporting date.
An impairment loss is recognised if the carrying amount of an asset or its cash-generating unit (“CGU”) exceeds its recoverable amount. A CGU is the smallest identifiable asset group that generates cash flows that largely are independent from other assets and groups. Impairment losses are recognised in profit or loss. Impairment losses recognised in respect of CGUs are allocated first to reduce the carrying amount of any goodwill allocated to the units and then to reduce the carrying amount of the other assets in the unit (or group of units) on a pro rata basis.
The recoverable amount of an asset or CGU is the greater of its value in use and its fair value less costs to sell. In assessing value in use, the estimated future cash flows are discounted to their present value using an appropriate pre-tax discount rate that reflects current market assessments of the time value of money and the risks specific to the asset or CGU.
The Group’s overall approach as to the level for testing goodwill impairment is at the lowest level at which goodwill is monitored for external reporting purposes, which is in general at CGU. The recoverable amount of the CGUs to which the goodwill belongs is based on a discounted free cash flow approach, based on acquisition valuation models. These calculations are corroborated by valuation multiples or other available fair value indicators.
An impairment loss in respect of goodwill is not reversed. In respect of other assets, impairment losses recognised in prior periods are assessed at each reporting date for any indications that the loss has decreased or no longer exists.
An impairment loss is reversed if there has been a change in the estimates used to determine the recoverable amount. An impairment loss is reversed only to the extent that the asset’s carrying amount does not exceed the carrying amount that would have been determined, net of depreciation or amortisation, if no impairment loss had been recognised.
(l) Discontinued operations and assets held for saleDiscontinued operationsA discontinued operation is a component of the Group’s business that represents a separate major line of business or geographical area of operations that has been disposed of or is held for sale, or is a subsidiary acquired exclusively with a view to resale. Classification as a discontinued operation occurs upon disposal or when the operation meets the criteria to be classified as held for sale, if earlier. When an operation is classified as a discontinued operation, the comparative statement of comprehensive income is re-presented as if the operation had been discontinued from the start of the comparative period.
Notes to the consolidated financial statements

67Aliaxis SA – Consolidated Annual Report 2020
Assets held for saleNon-current assets (or disposal groups comprising assets and liabilities) that are expected to be recovered primarily through sale rather than through continuing use are classified as held for sale. Immediately before classification as held for sale, the assets (or components of a disposal group) are measured in accordance with the Group’s accounting policies. Thereafter, the assets (or disposal group) are generally measured at the lower of their carrying amount and fair value less cost to sell. Any impairment loss on a disposal group is first allocated to goodwill, and then to remaining assets and liabilities on a pro rata basis, except that no loss is allocated to inventories, financial assets, deferred tax assets and employee benefit assets, which continue to be measured in accordance with the Group’s accounting policies. Impairment losses on initial classification as held for sale and subsequent gains or losses on remeasurement are recognised in profit or loss. Gains are not recognised in excess of any cumulative impairment loss. Intangible assets and property, plant and equipment once classified as held for sale are not amortised or depreciated. In addition, equity accounting of equity-accounted investees ceases once classified as held for sale.
(m) Share capitalOrdinary sharesIncremental costs directly attributable to the issue of ordinary shares and share options are recognised as a deduction from equity.
Repurchase of share capitalWhen share capital recognised as equity is repurchased, the amount of the consideration paid, including directly attributable costs, net of any tax effects, is recognised as a deduction from equity. Repurchased shares are classified as treasury shares and are presented in the reserve for own shares. When treasury shares are sold or reissued subsequently, the amount received is recognised as an increase in equity, and the resulting surplus or deficit on the transaction is transferred to/from retained earnings.
DividendsDividends are recognised as liabilities in the period in which they are declared.
(n) Interest-bearing loans and borrowingsInterest-bearing loans and borrowings are recognised initially at fair value less attributable transaction costs. Subsequent to initial recognition, interest-bearing loans and borrowings are stated at amortised cost with any difference between the initial amount and the maturity amount being recognised in profit or loss over the expected life of the instrument on an effective interest rate basis.
(o) Employee benefitsDefined contribution plansA defined contribution plan is a post-employment benefit plan under which an entity pays fixed contributions into a separate entity and has no legal or constructive obligation to pay further amounts. Obligations for contributions to defined contribution pension plans are recognised as an expense in profit or loss in the period during which related services are rendered by employees.
Defined benefit plansA defined benefit plan is a post-employment benefit plan other than a defined contribution plan. The Group’s net obligation in respect of defined benefit pension plans is calculated separately for each plan by estimating the amount of future benefit that employees have earned in return for their service in the current and prior periods; that benefit is discounted to determine its present value and the fair value of any plan assets are deducted. The discount rate is the yield at the reporting date on AA credit-rated bonds that have maturity dates approximating the terms of the Group’s obligations and that are denominated in the same currency in which the benefits are expected to be paid.
The calculation is performed annually by qualified actuaries using the projected unit credit method.
When the benefits of a plan are improved, the portion of the increased benefit relating to past service by employees is recognised immediately in profit or loss.
Notes to the consolidated financial statements
68Aliaxis SA – Consolidated Annual Report 2020
The Group recognises gains and losses on the curtailment or settlement of a defined benefit plan when the curtailment or settlement occurs. The gain or loss on curtailment or settlement comprises any resulting change in the fair value of plan assets and any change in the present value of the defined benefit obligation.
Remeasurements of the net defined benefit liability, which comprises actuarial gains and losses, the return on plan assets (excluding interests) and the effect of the asset ceiling (if any, excluding interests) are recognised immediately in OCI. The Group determines the net interest expenses (income) on the net defined benefit liability (asset) for the period by applying the discount rate used to measure the defined benefit obligation at the beginning of the annual period to the then-net defined benefit liability (asset), taking into account any changes in the net defined benefit liability (asset) during the period as a result of contributions and benefit payments. Net interest expenses and other expenses related to a defined benefit plans are recognised in profit or loss.
When the calculation results in a benefit to Aliaxis, the recognised asset is limited to the present value of any future refunds from the plan or reductions in future contributions to the plan.
In order to calculate the present value of economic benefits, consideration is given to any minimum funding requirements that apply to any plan in the Group. An economic benefit is available to the Group if it is realisable during the life of the plan, or on settlement of the plan liabilities.
Other long-term employee benefitsThe Group’s net obligation in respect of long-term employee benefits other than pension plans such as service anniversary bonuses is the amount of future benefit that employees have earned in return for their service in the current and prior periods. The obligation is calculated using the projected unit credit method and is discounted to determine its present value, and the fair value of any related assets is deducted. The discount rate is the yield at the reporting date on AA credit-rated bonds that have maturity dates approximating the terms of the Group’s obligations and that are denominated in the same currency in which the benefits are expected to be paid. Any actuarial gains or losses are recognised in profit or loss in the period in which they arise.
Termination benefitsTermination benefits are recognised as an expense when Aliaxis is demonstrably committed, without realistic possibility of withdrawal, to a formal detailed plan to terminate employment before the normal retirement date. Termination benefits for voluntary redundancies are recognised if Aliaxis has made an offer encouraging voluntary redundancy, it is probable that the offer will be accepted, and the number of acceptances can be estimated reliably. If benefits are payable more than 12 months after the reporting date, then they are discounted to their present value.
Short-term benefitsShort-term employee benefit obligations such as bonuses are measured on an undiscounted basis and are expensed as the related service is provided. A provision is recognised for the amount expected to be paid under short-term cash bonus or profit-sharing plans if Aliaxis has a present legal or constructive obligation to pay this amount as a result of past service provided by the employee and the obligation can be estimated reliably.
Share-based payment transactionsThe fair value of options granted to employees is measured at grant date. The amount is recognised as an employee expense, with a corresponding increase in equity within retained earnings, and spread over the period in which the employees become unconditionally entitled to the options. The amount recognised as an expense is adjusted to reflect the actual number of share options that vest.
The fair value of options granted to employees is measured using the Black & Scholes valuation model. Measurement inputs include share price on measurement date, exercise price of the instrument, expected volatility (based on historic volatility adjusted for changes expected due to publicly available information), weighted average expected life of the instruments (based on historical experience and general option holder behaviour), expected dividends, and the risk-free interest rate (based on government bonds). Service and non-market performance conditions attached to the transactions are not taken into account in determining fair value.
Notes to the consolidated financial statements
69Aliaxis SA – Consolidated Annual Report 2020
(p) ProvisionsA provision is recognised if as a result of a past event, the Group has a present legal or constructive obligation that can be estimated reliably, and it is probable that an outflow of economic benefits will be required to settle the obligation. Provisions are determined by discounting the expected future cash flows at a pre-tax rate that reflects current market assessments of the time value of money and the risks specific to the liability. The unwinding of the discount is recognised as finance cost.
WarrantiesA provision for warranties is recognised when the underlying products or services are sold. The provision is based on historical warranty data and a weighing of all possible outcomes against their associated probabilities.
RestructuringA provision for restructuring is recognised when Aliaxis has approved a detailed and formal restructuring plan, and the restructuring either has commenced or has been announced publicly before the reporting date. Future operating losses are not provided for.
Onerous contractsA provision for onerous contracts is recognised when the expected benefits to be derived by the Group from a contract are lower than the unavoidable cost of meeting its obligations under the contract. The provision is measured as the present value of the lower of the expected cost of terminating the contract and the expected net cost of continuing with the contract. Before a provision is established, the Group recognises any impairment loss on the assets associated with the contract.
(q) Amounts payableAmounts payable which comprise trade and other amounts payable represent goods and services provided to the Group prior to the end of the reporting date which are unpaid. These amounts are carried at amortised cost.
(r) Derivative financial instruments and hedge accountingAliaxis holds derivative financial instruments to hedge its exposure to foreign currency and interest rate risks arising from operational, financing and investment activities. As a policy, Aliaxis does not engage in speculative transactions and does not therefore hold or issue derivative financial instruments for trading purposes. However, derivatives that do not qualify for hedge accounting are accounted for as trading instruments.
Embedded derivatives are separated from the host contract and accounted for separately if the host contract is not a financial asset and certain criteria are met.
On initial designation of the derivative as the hedging instrument, the Group formally documents the relationship between the hedging instrument and hedged item, including the risk management objectives and strategy in undertaking the hedge transaction and the hedged risk, together with the methods that will be used to assess the effectiveness of the hedging relationship. The Group makes an assessment, both at the inception of the hedge relationship as well as on an ongoing basis, of whether the hedging instruments are expected to be highly effective in offsetting the changes in the fair value or cash flows of the respective hedged items attributable to the hedged risk, with the ultimate objective to validate the economic relationship between the hedging instrument and the hedged item. For a cash flow hedge of a forecast transaction, the transaction should be highly probable to occur and should present an exposure to variations in cash flows that could ultimately affect reported profit or loss.
Derivatives are recognised initially at fair value; attributable transaction costs are recognised in profit or loss when incurred. Subsequent to initial recognition, derivatives are measured at fair value, and changes therein are accounted for as described below.
Notes to the consolidated financial statements
70Aliaxis SA – Consolidated Annual Report 2020
Cash flow hedgesWhen a derivative is designated as the hedging instrument in a hedge of the variability in cash flows attributable to a particular risk associated with a recognised asset or liability or a highly probable forecast transaction that could affect profit or loss, the effective portion of changes in the fair value of the derivative hedging instrument designated as a cash flow hedge is recognised in OCI and accumulated in the hedging reserve. The effective portion of changes in the fair value of the derivative that is recognised in OCI is limited to the cumulative change in fair value of the hedged item, determined on a present value basis, from inception of the hedge. Any ineffective portion of changes in fair value is recognised in profit or loss.
If the hedging instrument no longer meets the criteria for hedge accounting, expires or is sold, terminated or exercised, then hedge accounting is discontinued prospectively. When hedge accounting for cash flow hedges is discontinued, the amount that has been accumulated in the hedging reserve remains in equity until, for a hedge of a transaction resulting in the recognition of a non-financial items, it is included in the non-financial item’s cost on its initial recognition or, for other cash flow hedges, it is reclassified to profit or loss in the same period or periods as the hedged expected future cash flows affect profit or loss.
If the hedged future cash flow is no longer expected to occur, then the amounts that have been accumulated in the hedging reserve and the cost of hedging reserve are immediately reclassified to profit and loss.
The Group designates only the change in fair value of the spot element of forward exchange contracts as the hedging instrument in cash flow hedging relationships. The change in fair value of the forward element of forward exchange contracts is separately accounted for a cost of hedging and recognised in a costs of hedging reserve within equity.
When the hedged forecast transaction subsequently results in the recognition of a non-financial item, the amount accumulated in the hedging reserve and the cost of hedging reserve is included directly in the initial cost of the non-financial item when it is recognised.
In other cases, the amount recognised in equity is transferred to profit or loss in the same period that the hedged item affects profit or loss.
Hedge of net investment in foreign operationWhere a derivative financial instrument hedges a net investment in a foreign operation, the portion of the gain or the loss on the hedging instrument that is determined to be effective is recognised directly in equity within the translation reserve, while the ineffective portion is reported in profit or loss.
The amount recognised in OCI is reclassified to profit or loss as a reclassification adjustment on disposal of the foreign operation.
Fair value hedgesWhen a derivative financial instrument hedges the variability in fair value of a recognised asset or liability, any resulting gain or loss on the hedging instrument is recognised in profit or loss. The hedged item is also stated at fair value in respect of the risk being hedged, with any gain or loss being recognised in profit or loss.
Economic hedgesHedge accounting is not applied to derivative instruments that economically hedge monetary assets and liabilities denominated in foreign currencies. Changes in the fair value of such derivatives are recognised in profit or loss as part of foreign currency gains and losses.
Notes to the consolidated financial statements
71Aliaxis SA – Consolidated Annual Report 2020
(s) RevenueGoods soldRevenue from the sale of goods is measured at the fair value of the consideration received or receivable, net of returns and allowances, trade discounts and volume rebates. Revenue from the sale of goods is recognised at the point in time when control of the asset is transferred to the customer, generally on delivery of the goods. The Group considers whether there are other promises in the contract that are separate performance obligations to which a portion of the transaction price needs to be allocated. In determining the transaction price for the sale of goods, the Group considers the effects of variable consideration and the existence of significant financing components (if any).
Rental incomeRental income from investment properties is recognised in profit or loss in other operating income on a straight-line basis over the term of the lease. Lease incentives granted are recognised as an integral part of the total rental income, over the term of the lease.
Government grants and subsidiesGovernment grants are recognised initially as deferred income when there is reasonable assurance that they will be received and that Aliaxis will comply with the conditions associated with the grant. Grants that compensate the Group for expenses incurred are recognised in profit or loss on a systematic basis in the same periods in which the expenses are recognised. Grants that compensate the Group for the cost of an asset are recognised in other operating income and expense on a systematic basis over the useful life of the asset.
Government subsidies that compensate the Group for expenses incurred are recognised in profit or loss on a systematic basis in the same periods in which the expenses are recognised.
(t) Adjusted itemsAdjusted items are those items that are considered by management not to relate to items in the ordinary course of activities of the Group. They are presented separately as they are important for the understanding of users of the consolidated financial statements of the performance of the Group and this compared to the returns defined in the regulatory frameworks applicable to the Group and its subsidiaries. Adjusted items relate to:
• Income and expenses resulting from the sale of businesses • Restructuring costs linked to the transformation and restructuring initiatives of the Group • Impairment of non-financial assets (incl. goodwill impairment) • Other income and expenses related to items outside the ordinary course of activities of the Group
(u) Finance income and expensesFinance income comprises interest income on funds invested, dividend income, net gains on the disposal of financial asset measured at fair value through OCI, changes in the fair value of financial assets at fair value through profit or loss, foreign currency gains, and gains on hedging instruments that are recognised in profit or loss. Interest income is recognised as it accrues, using the effective interest method. Dividend income is recognised on the date that the Group’s right to receive payment is established.
Finance expenses comprise interest expense on borrowings, unwinding of the discount on provisions, foreign currency losses, changes in the fair value of financial assets at fair value through profit or loss, impairment losses recognised on financial assets (except losses on receivables) and losses on hedging instruments that are recognised in profit or loss. Borrowing costs that are not directly attributable to the acquisition or construction of a qualifying asset are recognised in profit or loss using the effective interest method.
Foreign currency gains and losses are reported on a net basis as either finance income or finance expense depending on whether foreign currency movements are in a net gain or net loss position.
Notes to the consolidated financial statements
72Aliaxis SA – Consolidated Annual Report 2020
(v) Income taxIncome tax expense comprises current and deferred tax. Income tax expense is recognised in profit or loss except to the extent that it relates to a business combination, or items recognised directly in equity, or in other comprehensive income.
Current tax is the expected tax payable on the taxable income for the year, using tax rates enacted or substantively enacted at the reporting date, and any adjustment to tax payable in respect of previous years. Current tax payable also includes any tax liability arising from the declaration of dividends.
Deferred tax is recognised in respect of temporary differences between the carrying amounts of assets and liabilities for financial reporting purposes and the amounts used for taxation purposes (including differences arising from fair values of assets and liabilities acquired in a business combination). Deferred tax is not recognised for the initial recognition of goodwill, the initial recognition of assets or liabilities in a transaction that is not a business combination and that affects neither accounting nor taxable profit, and differences relating to investments in subsidiaries to the extent that they probably will not reverse in the foreseeable future.
Deferred tax is measured at the tax rates that are expected to be applied to the temporary differences when they reverse, using tax rates enacted or substantively enacted at the reporting date. Deferred tax assets and liabilities are offset when they relate to income taxes levied by the same taxation authority and on the same taxable entity or group of entities.
In determining the amount of current and deferred tax the Company takes into account the impact of uncertain tax positions and whether additional taxes and interest may be due. The Company believes that its accruals for tax liabilities are adequate for all open tax years based on its assessment of many factors, including interpretations of tax law and prior experience. This assessment relies on estimates and assumptions and may involve a series of judgements about future events. New information may become available that causes the Company to change its judgement regarding the adequacy of existing tax liabilities; such changes to tax liabilities will impact tax expense in the period that such a determination is made.
A deferred tax asset is recognised to the extent that it is probable that future taxable profits will be available against which temporary differences can be utilised. Deferred tax assets are reviewed at each reporting date and are reduced to the extent that it is no longer probable that the related tax benefit will be realised.
(w) ContingenciesContingent liabilities are not recognised in the consolidated financial statements, except if they arise from a business combination. They are disclosed, when material, unless the possibility of a loss is remote. Contingent assets are not recognised in the consolidated financial statements but are disclosed, when material, if the inflow of economic benefits is probable.
(x) Events after the reporting dateEvents after the reporting date which provide additional information about the Group’s position as at the reporting date (adjusting events) are reflected in the consolidated financial statements. Events after the reporting date which are non-adjusting events are disclosed in the notes to the consolidated financial statements, when material.
(y) Earnings per shareAliaxis presents basic and diluted earnings per share (EPS) data for its ordinary shares. Basic EPS is calculated by dividing the profit or loss attributable to ordinary shareholders of the Company by the weighted average number of ordinary shares outstanding during the period. Diluted EPS is determined by adjusting the profit or loss attributable to ordinary shareholders and the weighted average number of ordinary shares outstanding for the effects of all dilutive potential ordinary shares, which comprise share options granted to employees.
Notes to the consolidated financial statements
73Aliaxis SA – Consolidated Annual Report 2020
(z) New standards and interpretations not yet adopted A number of new standards, amendments to standards and interpretations are not yet effective for the year ended 31 December 2020, and have not been applied in preparing these consolidated financial statements:
Amendments to IAS 1 Presentation of Financial statements: Classification of Liabilities as Current or Non-current, issued on 23 January 2020, clarify a criterion in IAS 1 for classifying a liability as non-current: the requirement for an entity to have the right to defer settlement of the liability for at least 12 months after the reporting period.
The amendments:
• specify that an entity’s right to defer settlement must exist at the end of the reporting period; • clarify that classification is unaffected by management’s intentions or expectations about whether the entity
will exercise its right to defer settlement; • clarify how lending conditions affect classification; and • clarify requirements for classifying liabilities an entity will or may settle by issuing its own equity instruments.
On July 15, 2020, the IASB issued Classification of Liabilities as Current or Non-current — Deferral of Effective Date (Amendment to IAS 1) deferring the effective date of the January 2020 amendments to IAS 1 by one year to annual reporting periods beginning on or after January 1, 2023. The amendments are not expected to have a material impact on the Group’s consolidated statements. The amendments have not yet been endorsed by the EU.
Amendments to IFRS 3 Business Combinations; IAS 16 Property, plant and Equipment; IAS 37 Provisions, Contingent Liabilities and Contingent Assets as well as Annual improvements, issued on 14 May 2020, include several narrow-scope amendments which are changes that clarify the wording or correct minor consequences, oversights or conflicts between requirements in the Standards:
• Amendments to IFRS 3 Business Combinations update a reference in IFRS 3 to the Conceptual Framework for Financial Reporting without changing the accounting requirements for business combinations.
• Amendments to IAS 16 Property, Plant and Equipment prohibit a company from deducting from the cost of property, plant and equipment amounts received from selling items produced while the company is preparing the asset for its intended use. Instead, a company will recognise such sales proceeds and related cost in profit or loss. The amendments also clarify that testing whether an item of fixed assets is functioning properly means assessing its technical and physical performance rather than assessing its financial performance.
• Amendments to IAS 37 Provisions, Contingent Liabilities and Contingent Assets specify which costs a company includes when assessing whether a contract will be loss-making. The amendments clarify that the ‘costs of fulfilling a contract’ comprise both: the incremental costs; and an allocation of other direct costs.
• Annual Improvements to IFRS Standards 2018–2020 make minor amendments to IFRS 1 First-time Adoption of International Financial Reporting Standards, IFRS 9 Financial Instruments, IAS 41 Agriculture and the Illustrative Examples accompanying IFRS 16 Leases.
The amendments are effective for annual periods beginning on or after 1 January 2022. These amendments are not expected to have a material impact on the Group’s consolidated statements. These amendments have not yet been endorsed by the EU.
Amendments to IFRS 9, IAS 39, IFRS 7, IFRS 4 and IFRS 16 Interest Rate Benchmark Reform – Phase 2 (issued on 27 August 2020) address issues that might affect financial reporting during the reform of an interest rate benchmark, including the effects of changes to contractual cash flows or hedging relationships arising from the replacement of an interest rate benchmark with an alternative benchmark rate (replacement issues).
Notes to the consolidated financial statements
74Aliaxis SA – Consolidated Annual Report 2020
In Phase 2 of its project, the Board amended requirements in IFRS 9 Financial Instruments, IAS 39 Financial Instruments: Recognition and Measurement, IFRS 7 Financial Instruments: Disclosures, IFRS 4 Insurance Contracts and IFRS 16 Leases relating to:
• changes in the basis for determining contractual cash flows of financial assets, financial liabilities and lease liabilities;
• hedge accounting; and • disclosures.
The Phase 2 amendments apply only to changes required by the interest rate benchmark reform to financial instruments and hedging relationships. The amendments apply retrospectively from 1 January 2021 with earlier application permitted. Hedging relationships previously discontinued solely because of changes resulting from the reform will be reinstated if certain conditions are met. These amendments are not expected to have a material impact on the Group’s consolidated statements. These amendments have not yet been endorsed by the EU.
4. Business combinations(a) Acquisition methodBusiness combinations are accounted for using the acquisition method when control is transferred to the Group (definition of control see 3a). The consideration transferred in the acquisition is measured at fair value, as are the identifiable net assets acquired.
Any goodwill that arises is tested annually for impairment.
Any gain on a bargain purchase is recognised immediately in profit or loss.
The consideration transferred does not include amounts related to the settlement of pre-existing relationships. Such amounts are generally recognised in profit or loss.
Transaction costs related to the acquisition, other than those associated with the issue of debt or equity securities, that the Group incurs in connection with a business combination are expensed as incurred.
Any contingent consideration payable is measured at fair value at the acquisition date. If the contingent consideration meets the definition of a financial instrument and is classified as equity, then it is not remeasured and settlement is accounted for within equity. Otherwise, subsequent changes to in the fair value of the contingent consideration are recognised in profit or loss.
Put options granted to non-controlling shareholders are recognised as a liability measured at the present value of the exercise price and accounted for using the present-access method when the NCI have present access to the returns that are the subject of the put options. Under this method, NCI continue to be recognised because the non-controlling shareholders still have present access to the returns associated with the underlying ownership interests. All changes in the carrying amount of the liability are recognised in equity. The financial liability arising from the put option is not included in the consideration transferred of a business combination but accounted for separately. If the put option expires unexercised, then the put liability is reversed against equity.
Notes to the consolidated financial statements
75Aliaxis SA – Consolidated Annual Report 2020
(b) Determination of fair valuesThe acquiree’s identifiable assets, liabilities and contingent liabilities that meet the conditions for recognition under IFRS 3 are recognised at their fair value at acquisition date as follows:
• The fair value of property, plant and equipment is based on market values. The fair value of property is the estimated amount for which a property could be exchanged on the date of valuation between a willing buyer and a willing seller in an arm’s length transaction after proper marketing wherein the parties had each acted knowledgeably, prudently and without compulsion. The fair value of items of plant, equipment, fixtures and fittings is based on the quoted market prices for similar items when available and depreciated replacement costs when appropriate.
• The fair value of patents and trademarks is based on the discounted estimated royalty payments that have been avoided as a result of the patent or trademark being owned. The fair value of other intangible assets is based on the discounted cash flows expected to be derived from the use and eventual sale of the assets.
• The fair value of customer list is based on the discounted cash flows (after tax) derived from the sales related to such customers after (i) applying an attrition rate (as observed over a relevant historical period of time), and (ii) accounting for all related operating costs (except financial) including specific contributory charges on assets and labour.
• The fair value of inventories is determined based on its estimated selling price in the ordinary course of business less the estimated costs of completion and sale, and a reasonable profit margin based on the effort required to complete and sell the inventories.
• Contingent liabilities are recognised at fair value on acquisition, if their fair value can be measured reliably. The amount represents what a third party would charge to assume those contingent liabilities, and such amount reflects all expectations about possible cash flows and not the single most likely or the expected maximum or minimum cash flow.
5. Financial risk management(a) OverviewThis note presents information about the Group’s exposure to credit, liquidity and market risks, the Group’s objectives, policies and processes for measuring and managing risk, as well as the Group’s management of capital. Further quantitative disclosures are included throughout the notes to the consolidated financial statements.
Risks relating to credit worthiness, interest rate and exchange rate movements, commodity prices and liquidity arise in the Group’s normal course of business. However, the most significant financial exposures for the Group relate to the fluctuation of interest rates on the Group’s financial debt and to fluctuations in currency exchange rates.
The Group addresses these risks and defines strategies to limit their economic impact on its performance in accordance with its financial risk management policy. Such policy includes the use of derivative financial instruments. Although these derivative financial instruments are subject to fluctuations in market prices subsequent to their acquisition, such changes are generally offset by opposite changes in the value of the underlying items being hedged.
The Audit Committee is responsible for overseeing how management monitors compliance with the Group’s financial risk management policies and procedures and reviews the adequacy of the risk management framework in relation to the risks faced by the Group. The Audit Committee relies on the monitoring performed by management.
The Group considers that the Brexit process would not represent a material risk for the Group and that it will not impact the Group’s normal course of business in any material way.
Notes to the consolidated financial statements
76Aliaxis SA – Consolidated Annual Report 2020
(b) Credit riskCredit risk is the risk of financial loss to the Group if a customer or counterparty to a financial instrument fails to meet its contractual obligations and arises principally from the Group’s receivables from customers.
The Group’s exposure to credit risk is influenced by the individual characteristics of each customer, its industry and the country or region where it operates. The Group’s main sales distribution channels are wholesale and retail do-it-yourself (DIY) chains. Despite a trend towards consolidation in Europe and North America, the diversity of Aliaxis’ product range helps it to maintain a wide customer portfolio and to avoid as much as possible exposure to any significant individual customer.
Aliaxis management has a credit policy in place and the exposure to credit risk is monitored on an ongoing basis. Credit evaluations are performed on all customers requiring credit above a certain amount. The Group does not require collateral, except in very rare circumstances, in respect of financial assets.
Investments are allowed only in liquid securities and only with counterparties that have a robust credit rating. Transactions involving derivatives are with counterparties with whom the Group has a signed netting agreement and who have sound credit ratings. Management does not expect any counterparty to fail to meet its obligations.
The Group establishes an allowance for impairment that represents its estimate of expected losses in respect of trade and other receivables and investments. The main components of this allowance are a specific loss component that relates to individually significant exposures, and a collective loss component established for groups of similar assets in respect of losses that have been incurred but not yet identified. The collective loss allowance is determined based on historical data of payment statistics for similar financial assets.
The maximum exposure to credit risk is represented by the carrying amount of each financial asset, including derivatives in the statement of financial position.
(c) Liquidity riskLiquidity risk is the risk that the Group will not be able to meet its financial obligations as they fall due.
Typically, the Group ensures that it has sufficient cash on demand to meet expected operational expenses, including the servicing of financial obligations; this excludes the potential impact of extreme circumstances that cannot reasonably be predicted.
In addition, the Group has secured access to Banking Facilities and Debt Capital Markets instruments.
• As for Banking Facilities, the Group has (i) a multi-currency revolving credit facility of € 680 million committed until July 2021 which has been extended until July 2022 for an amount of € 631 million, and (ii) a Club Deal multi-currency Facility of € 350 million maturing in July 2022 made up of a € 150 million amortising Term Loan Tranche, and a € 200 million bullet Revolving Tranche.
• As for Debt Capital Markets Instruments, the Group has issued (i) an amount of USD 223 million of US Private Placement notes for a period of 10 to 12 years maturing from 2021 to 2023; (ii) an amount of USD 35 million of US Private Placement notes for a period of 10 years maturing in 2025, and an amount of € 18 million of US Private Placement (swap note) for a period of 12 years maturing in 2027; and (iii) an amount of € 67 million of Shuldschein certificates for a period of 7 years maturing in 2022.
(d) Market riskMarket risk is the risk that changes in market prices, such as foreign exchange rates, commodity prices, interest rates or equity prices will affect the Group’s income or the value of its holdings of financial instruments. The objective of market risk management is to manage and control market risk exposures within acceptable parameters, while optimising the return.
The Group buys and sells derivatives, and also incurs financial liabilities, in order to manage market risks. All such transactions are carried out within the financial risk management policies. Generally, the Group seeks to apply hedge accounting in order to manage volatility in profit or loss.
Notes to the consolidated financial statements
77Aliaxis SA – Consolidated Annual Report 2020
Currency riskThe Group is exposed to foreign currency risk on transactions such as sales, purchases, borrowings, dividends, fees and interests, denominated in non-euro currencies. Currencies giving rise to such risk are primarily the Canadian dollar (CAD), the Australian dollar (AUD), the New Zealand dollar (NZD), the pound sterling (GBP), the Indian rupee (INR) and the US dollar (USD). Where there is no natural hedge, the foreign currency risk is primarily managed by the use of forward exchange contracts. All contracts have maturities of less than one year. Foreign currency risk on firm commitments and forecast transactions is subject to hedging (in whole or in part) when the underlying operating transactions are reasonably expected to occur within a determined time frame. Hedge accounting is not applied to derivative instruments that economically hedge monetary assets and liabilities denominated in foreign currencies. Changes in the fair value of such derivatives are recognised in profit or loss as part of foreign exchange gains and losses.
The Group’s policy is to partially hedge the risk arising from consolidating net assets denominated in non-euro currencies by permanently maintaining liabilities through borrowings or cross currency swaps in such non-euro currencies. Where a foreign currency borrowing, or cross currency swaps are used to hedge a net investment in a foreign operation, exchange differences arising on translation of the borrowing are recognised directly in OCI within translation reserve. The Group’s net investments in Canada, the US, India, Australia, the UK and New Zealand are partially hedged through borrowings or cross currency swaps maintained in Canadian dollars, US dollars, Indian rupees, Australian dollars, pound sterling and New Zealand dollars.
Interest on borrowings is denominated in currencies that match the cash flows generated by the underlying operations of the Group, primarily CAD, EUR, GBP, AUD, INR, and USD. This provides an economic hedge and no derivatives are entered into.
In respect of other monetary assets and liabilities denominated in foreign currencies, the Group ensures that its net exposure is kept to an acceptable level by buying or selling foreign currencies at spot rates when necessary to address short-term imbalances.
Commodity riskRaw materials used to manufacture the Group’s products mainly consist of plastic resins such as polyvinylchloride (PVC), polyethylene (PE) and polypropylene (PP), which are a significant element of the cost of the Group’s products. The prices of these raw materials are volatile and tend to be cyclical, and Aliaxis is generally able to recover raw material price increases through higher product selling prices, although sometimes after a time lag. The Group increasingly seeks to optimise its resin purchases thanks to a centralised approach to the procurement of major raw materials.
In addition, the Group is also exposed to the volatility of energy prices (particularly electricity).
Interest rate riskThe Group has floating-rate borrowings exposed to the risk of changes in cash flows, due to changes in interest rates. The Group has also fixed rate debt instruments (US Private Placement Notes denominated in USD and in EUR, or Schuldschein Certificates denominated in EUR).
The Group policy is to hedge its interest rate risk through swaps, cross currency swaps and other derivatives. No derivatives are ever acquired or maintained for speculative or leveraged transactions.
Other market price riskDemand for the Group’s products is principally driven by the level of construction activity in its main markets, including new housing, repairs, maintenance and improvement, infrastructure and industrial markets. Its geographical and industrial spread provides a degree of risk diversification. Demand is influenced by fluctuations in the level of economic activity in individual markets, the key determinants of which include GDP growth, changes in interest rates, the level of new housing starts and industrial and infrastructure investment.
Notes to the consolidated financial statements
78Aliaxis SA – Consolidated Annual Report 2020
(e) Capital managementThe Board’s policy is to maintain a strong capital base so as to maintain the confidence of investors, creditors and other stakeholders and to sustain future development of the business. The Board of Directors monitors the return on equity (profit of the year attributable to equity holders of the Group divided by the average of equity attributable to equity holders of Aliaxis at the beginning and end of the reporting period).
The Board of Directors also monitors the level of dividends to ordinary Shareholders. The Group’s present intention is to recommend to the Shareholders’ Meeting a dividend increasing in line with past practice and subject to annual review in light of the future profitability of the Group.
No assurance can however be given that the Company will pay dividends in the future. Such payments will depend upon a number of factors, including prospects, strategies, results of operations, earnings, capital requirements and surplus, general financial conditions, contractual restrictions and other factors considered relevant by the Board. Pursuant to the Belgian Company Code, the calculation of amounts available for distribution to Shareholders, as dividends or otherwise must be determined on the basis of the Company’s non-consolidated Belgian GAAP financial statements by which the Company is required to allocate each year at least 5% of its annual net profits to its legal reserve, until the legal reserve equals at least 10% of the Company’s share capital. As a consequence of these factors, there can be no assurance as to whether dividends or similar payments will be paid out in the future or, if they are paid, what their amount will be.
The Board seeks to maintain a balance between the higher returns that might be possible with higher levels of borrowings and the advantages and security afforded by a sound capital position. In 2020, the Group share of return on equity was 14.1% (2019: 13.8%). In comparison the weighted average interest rate on the net financial interest-bearing indebtedness (including leases) was 2.4% (2019: 2.3%).
There were no changes in the Group’s approach to capital management during the year, which will remain prudent given the current economic circumstances.
Neither the Company nor any of its subsidiaries are subject to externally imposed capital requirements.
(f) Impact of COVID-19 pandemicDespite the significant challenges caused by the COVID-19 pandemic, the long-term drivers that support the Aliaxis growth strategy remain intact. Based on the evolution in 2020 and the current outlook, the Company is confident that it has sufficient and adequate resources to continue its operations.
After a promising start to the year, the outbreak of the COVID-19 pandemic and the measures adopted by governments to mitigate its spread in several countries in which we operate, impacted the Group. This included some plants having to shut down for periods during 2020. This negatively impacted the Group’s financial performance during the first half of the year. Aliaxis has been agile, adjusting effectively to the challenges caused by the pandemic and has implemented precautionary measures across its facilities to protect its employees.
Aliaxis also implemented measures to protect cashflows and strengthen its liquidity. The recovery started in May and continued until the end of the year. At the end of 2020, CEBITDA was above the previous year thanks to the strong rebound in the second half. Growth accelerated in the Americas and India, while recovery was slower in Europe, Australia and New Zealand.
For the year ended 31 December 2020, the Group achieved a net profit of €199.5 million. The Group’s net current assets as of 31 December 2020 were €1,527 million. The Group has €1 billion of resources comprising cash and cash equivalents, other highly liquid assets and unused credit lines available at the date of authorisation of these financial statements. Based on these factors, the Company is confident that it has adequate resources and sufficient loan facility headroom for the 2021 financial period.
Supported by the resilience of its recent activities, the Company assesses the likely impact of the pandemic on its 2021 performance, financial position and cashflow as low, and currently does not plan to implement further contingency measures. It will continue to closely monitor the situation and take such measures as may be required by the circumstances.
Notes to the consolidated financial statements
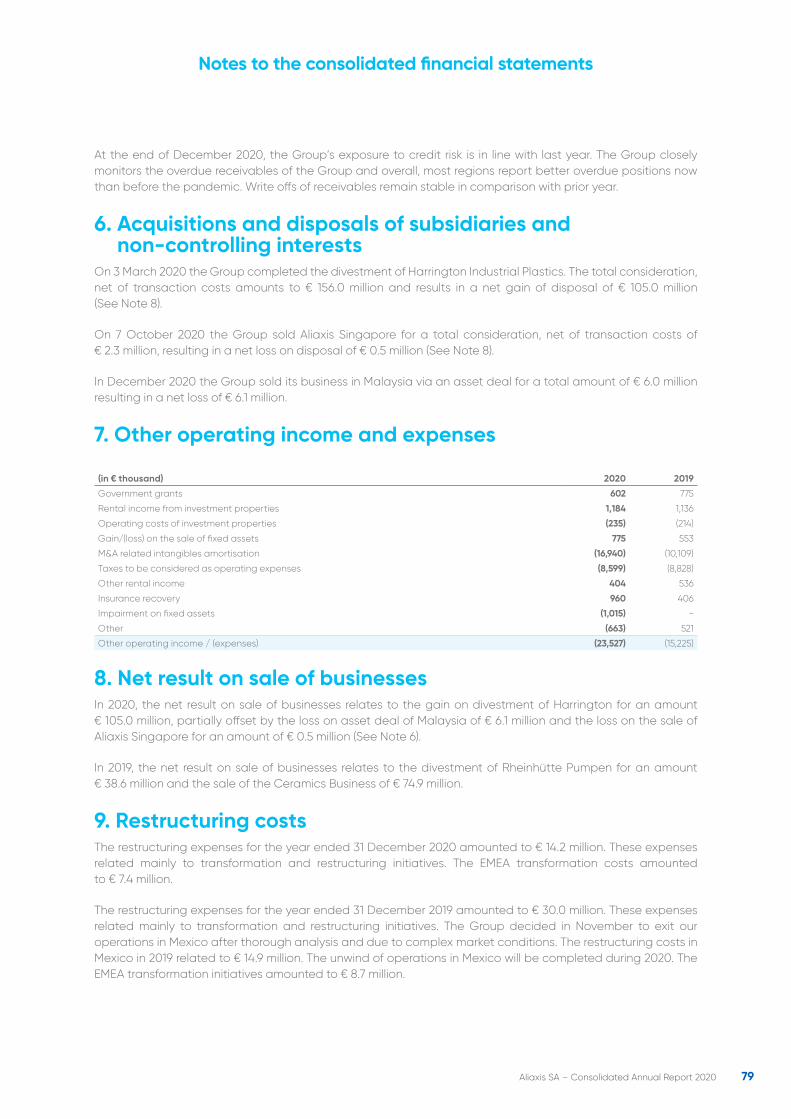
79Aliaxis SA – Consolidated Annual Report 2020
At the end of December 2020, the Group’s exposure to credit risk is in line with last year. The Group closely monitors the overdue receivables of the Group and overall, most regions report better overdue positions now than before the pandemic. Write offs of receivables remain stable in comparison with prior year.
6. Acquisitions and disposals of subsidiaries and non-controlling interests
On 3 March 2020 the Group completed the divestment of Harrington Industrial Plastics. The total consideration, net of transaction costs amounts to € 156.0 million and results in a net gain of disposal of € 105.0 million (See Note 8).
On 7 October 2020 the Group sold Aliaxis Singapore for a total consideration, net of transaction costs of € 2.3 million, resulting in a net loss on disposal of € 0.5 million (See Note 8).
In December 2020 the Group sold its business in Malaysia via an asset deal for a total amount of € 6.0 million resulting in a net loss of € 6.1 million.
7. Other operating income and expenses
(in € thousand) 2020 2019
Government grants 602 775
Rental income from investment properties 1,184 1,136
Operating costs of investment properties (235) (214)
Gain/(loss) on the sale of fixed assets 775 553
M&A related intangibles amortisation (16,940) (10,109)
Taxes to be considered as operating expenses (8,599) (8,828)
Other rental income 404 536
Insurance recovery 960 406
Impairment on fixed assets (1,015) -
Other (663) 521
Other operating income / (expenses) (23,527) (15,225)
8. Net result on sale of businessesIn 2020, the net result on sale of businesses relates to the gain on divestment of Harrington for an amount € 105.0 million, partially offset by the loss on asset deal of Malaysia of € 6.1 million and the loss on the sale of Aliaxis Singapore for an amount of € 0.5 million (See Note 6).
In 2019, the net result on sale of businesses relates to the divestment of Rheinhütte Pumpen for an amount € 38.6 million and the sale of the Ceramics Business of € 74.9 million.
9. Restructuring costsThe restructuring expenses for the year ended 31 December 2020 amounted to € 14.2 million. These expenses related mainly to transformation and restructuring initiatives. The EMEA transformation costs amounted to € 7.4 million.
The restructuring expenses for the year ended 31 December 2019 amounted to € 30.0 million. These expenses related mainly to transformation and restructuring initiatives. The Group decided in November to exit our operations in Mexico after thorough analysis and due to complex market conditions. The restructuring costs in Mexico in 2019 related to € 14.9 million. The unwind of operations in Mexico will be completed during 2020. The EMEA transformation initiatives amounted to € 8.7 million.
Notes to the consolidated financial statements
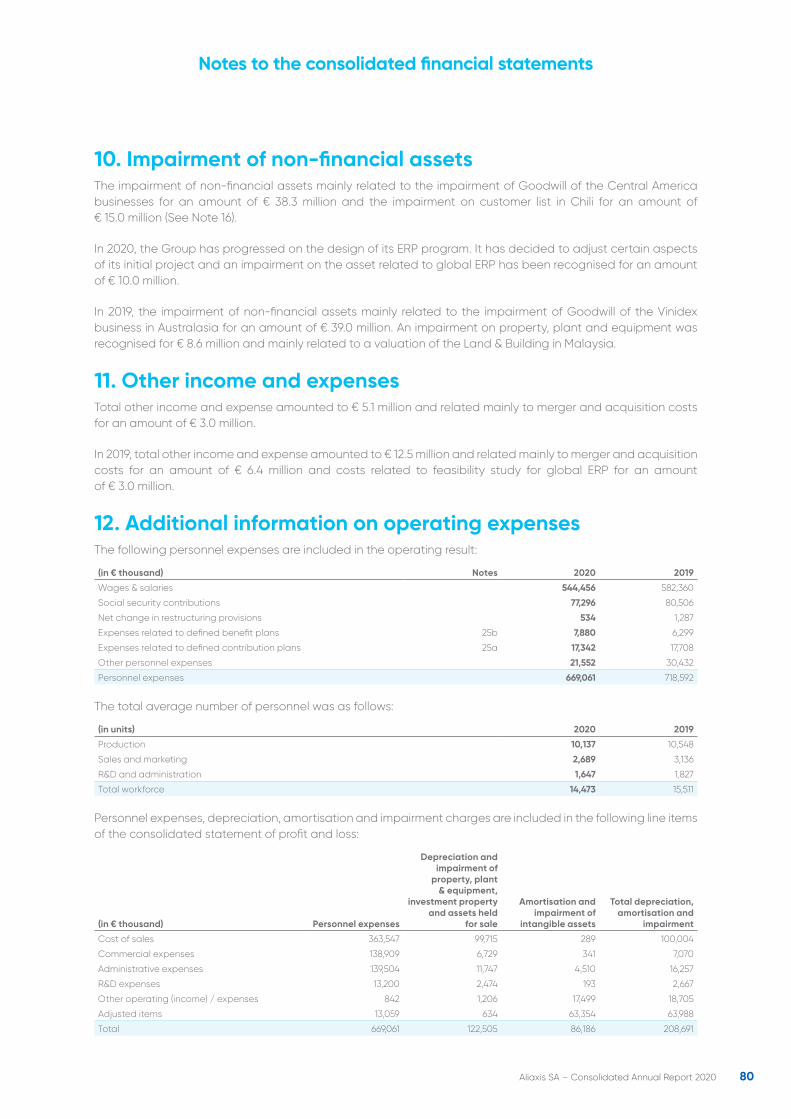
10. Impairment of non-financial assetsThe impairment of non-financial assets mainly related to the impairment of Goodwill of the Central America businesses for an amount of € 38.3 million and the impairment on customer list in Chili for an amount of € 15.0 million (See Note 16).
In 2020, the Group has progressed on the design of its ERP program. It has decided to adjust certain aspects of its initial project and an impairment on the asset related to global ERP has been recognised for an amount of € 10.0 million.
In 2019, the impairment of non-financial assets mainly related to the impairment of Goodwill of the Vinidex business in Australasia for an amount of € 39.0 million. An impairment on property, plant and equipment was recognised for € 8.6 million and mainly related to a valuation of the Land & Building in Malaysia.
11. Other income and expensesTotal other income and expense amounted to € 5.1 million and related mainly to merger and acquisition costs for an amount of € 3.0 million.
In 2019, total other income and expense amounted to € 12.5 million and related mainly to merger and acquisition costs for an amount of € 6.4 million and costs related to feasibility study for global ERP for an amount of € 3.0 million.
12. Additional information on operating expensesThe following personnel expenses are included in the operating result:
(in € thousand) Notes 2020 2019
Wages & salaries 544,456 582,360
Social security contributions 77,296 80,506
Net change in restructuring provisions 534 1,287
Expenses related to defined benefit plans 25b 7,880 6,299
Expenses related to defined contribution plans 25a 17,342 17,708
Other personnel expenses 21,552 30,432
Personnel expenses 669,061 718,592
The total average number of personnel was as follows:
(in units) 2020 2019
Production 10,137 10,548
Sales and marketing 2,689 3,136
R&D and administration 1,647 1,827
Total workforce 14,473 15,511
Personnel expenses, depreciation, amortisation and impairment charges are included in the following line items of the consolidated statement of profit and loss:
(in € thousand) Personnel expenses
Depreciation and impairment of
property, plant & equipment,
investment property and assets held
for sale
Amortisation and impairment of
intangible assets
Total depreciation, amortisation and
impairment
Cost of sales 363,547 99,715 289 100,004
Commercial expenses 138,909 6,729 341 7,070
Administrative expenses 139,504 11,747 4,510 16,257
R&D expenses 13,200 2,474 193 2,667
Other operating (income) / expenses 842 1,206 17,499 18,705
Adjusted items 13,059 634 63,354 63,988
Total 669,061 122,505 86,186 208,691
80Aliaxis SA – Consolidated Annual Report 2020
Notes to the consolidated financial statements

13. Finance expenses
(in € thousand) 2020 2019
Interest expense on financial borrowings (15,425) (21,154)
Interest expense on leases (3,862) (3,894)
Amortisation of deferred arrangement fees (1,034) (1,270)
Interest expense on other liabilities (7) (23)
Net change in the fair value of hedging derivatives – ineffective portion (629) (1,056)
Net foreign exchange loss (7,044) (3,495)
Bank fees (4,000) (5,379)
Other (1,981) (2,857)
Finance expenses (33,982) (39,127)
14. Finance income
(in € thousand) 2020 2019
Interest income from cash & cash equivalents 5,169 5,971
Interest income on other assets 461 1,306
Dividend income 370 322
Gain on sale of financial investments 5,923 –
Other 201 1,496
Finance income 12,173 9,095
81Aliaxis SA – Consolidated Annual Report 2020
Notes to the consolidated financial statements

82Aliaxis SA – Consolidated Annual Report 2020
15. Income taxesIncome taxes recognised in the profit or loss can be detailed as follows:
(in € thousand) 2020 2019
Current taxes for the period (99,475) (108,226)
Adjustments to current taxes in respect of prior periods 7,169 (13,293)
Total current tax expense (92,306) (121,519)
Origination and reversal of temporary differences 5,600 –
Impact of change in enacted tax rates (1,164) 3,141
Adjustment of deferred taxes in respect of prior periods (21,417) 9,594
Recognition of deferred tax assets on tax losses not previously recognised – (468)
Total deferred tax income / (expense) (16,981) 12,267
Income tax expense in profit & loss (109,287) (109,253)
The income tax recognised in other comprehensive income is not material.
The reconciliation of the effective tax rate with the aggregated weighted nominal tax rate can be summarised as follows:
(in € thousand) 2020 2019
Profit before income taxes 308,749 293,559
Tax at aggregated weighted nominal tax rate (77,664) 25.2% (83,213) 28.3%
Tax effect of:
Non-deductible expenses (4,050) 1.3% (5,197) 1.8%
Non-deductible interest expenses (1,918) 0.6% (2,110) 0.7%
Tax credits and tax deductions 577 (0.2%) 800 (0.3%)
Current year losses for which no deferred tax asset is recognised (13,479) 4.4% (11,574) 3.9%
Change in enacted tax rates (1,164) 0.4% 9,594 (3.3%)
Taxes on distributed and undistributed earnings (8,232) 2.7% (825) 0.3%
Withholding taxes on interest and royalty income (4,384) 1.4% (4,969) 1.7%
Other taxes on income (1,007) 0.3% (892) 0.3%
Utilisation of tax losses not previously recognised 2,453 (0.8%) 1,613 (0.5%)
Current tax adjustments in respect of prior periods 7,169 (2.3%) (13,293) 4.5%
Deferred tax adjustments in respect of prior periods (21,417) 6.9% (468) 0.2%
Other 13,829 (4.5%) 1,282 (0.4%)
Income tax expense in profit & loss (109,287) 35.4% (109,253) 37.2%
Income taxes, consisting of current and deferred taxes, amounted to € 109 million (2019: € 109 million), representing an effective income tax rate of 35.4% (2019: 37.2%).
Notes to the consolidated financial statements
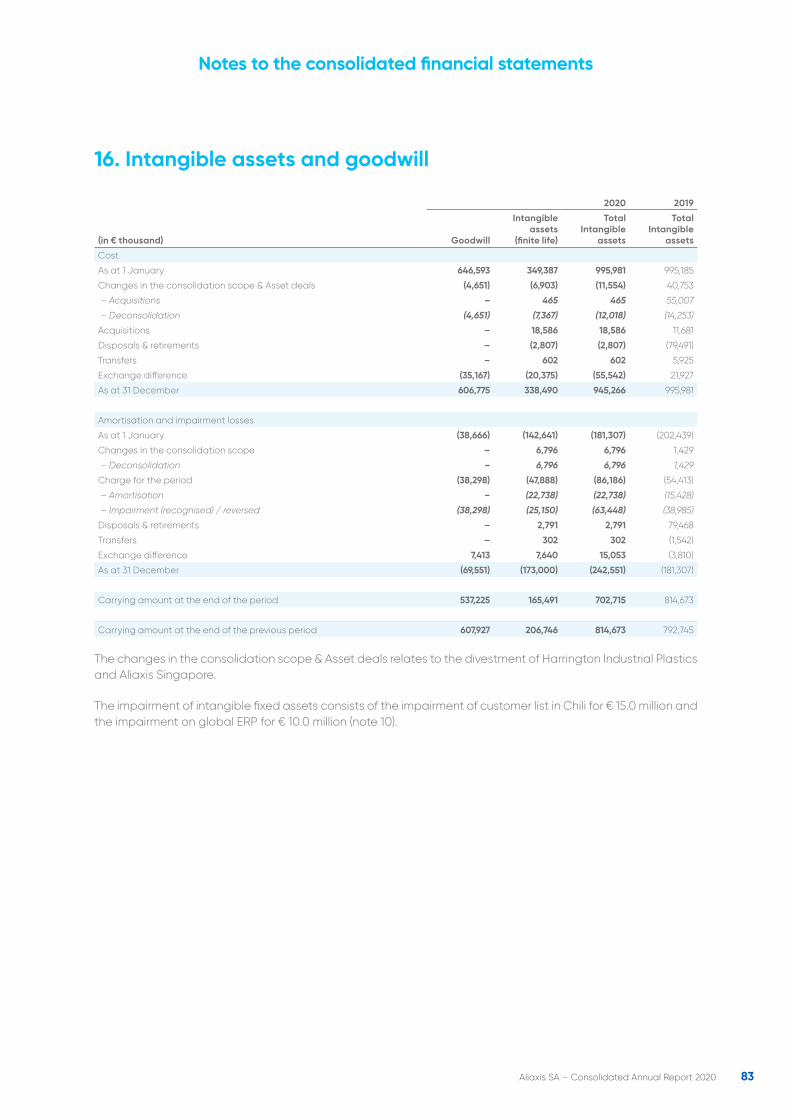
83Aliaxis SA – Consolidated Annual Report 2020
16. Intangible assets and goodwill
(in € thousand)
2020 2019
Goodwill
Intangible assets
(finite life)
Total Intangible
assets
Total Intangible
assets
Cost
As at 1 January 646,593 349,387 995,981 995,185
Changes in the consolidation scope & Asset deals (4,651) (6,903) (11,554) 40,753
– Acquisitions – 465 465 55,007
– Deconsolidation (4,651) (7,367) (12,018) (14,253)
Acquisitions – 18,586 18,586 11,681
Disposals & retirements – (2,807) (2,807) (79,491)
Transfers – 602 602 5,925
Exchange difference (35,167) (20,375) (55,542) 21,927
As at 31 December 606,775 338,490 945,266 995,981
Amortisation and impairment losses
As at 1 January (38,666) (142,641) (181,307) (202,439)
Changes in the consolidation scope – 6,796 6,796 1,429
– Deconsolidation – 6,796 6,796 1,429
Charge for the period (38,298) (47,888) (86,186) (54,413)
– Amortisation – (22,738) (22,738) (15,428)
– Impairment (recognised) / reversed (38,298) (25,150) (63,448) (38,985)
Disposals & retirements – 2,791 2,791 79,468
Transfers – 302 302 (1,542)
Exchange difference 7,413 7,640 15,053 (3,810)
As at 31 December (69,551) (173,000) (242,551) (181,307)
Carrying amount at the end of the period 537,225 165,491 702,715 814,673
Carrying amount at the end of the previous period 607,927 206,746 814,673 792,745
The changes in the consolidation scope & Asset deals relates to the divestment of Harrington Industrial Plastics and Aliaxis Singapore.
The impairment of intangible fixed assets consists of the impairment of customer list in Chili for € 15.0 million and the impairment on global ERP for € 10.0 million (note 10).
Notes to the consolidated financial statements

84Aliaxis SA – Consolidated Annual Report 2020
The carrying amounts of goodwill allocated to each CGU at 31 December is as follows:
(in € thousand) 2020 2019
CGU Country
Aliaxis North America and subsidiaries Canada and USA 270,716 291,062
FIP Italy 61,887 61,887
Durman Esquivel and subsidiaries Central America – 39,305
Ashirvad India 33,990 38,005
New Zealand and subsidiaries New Zealand 36,328 37,050
Nicoll France 32,701 32,701
Friatec Technical Plastics Germany 31,712 31,712
Vinidex and Philmac Australia 26,781 26,616
Marley Deutschland Gmbh Germany 19,402 19,402
Nicoll Perù SA Peru 7,805 9,315
Other(1) Other 15,901 20,871
Goodwill 537,225 607,927
(1) Carrying amount of goodwill for various CGUs of which none is individually significant.
For the purpose of impairment testing, goodwill is allocated to the Group’s operating units which represent the lowest level within the Group at which the goodwill is monitored for internal management purposes.
The recoverable amounts of the CGUs are, through calculation methods consistent with past practice, determined from value-in-use calculations. These value-in-use calculations use 5-year free cash flow projections, starting from 2021 budget information and extrapolated for the four years thereafter.
Assumptions were made for each CGU taking into account past performance and management expectation of market developments, generally implying a stable operating performance vs. the 2021 budget and growth not exceeding 2% per year (for most industrialised countries), 2% to 4% for Latin American countries and 10% for India (reflecting India’s specific market characteristics). Deviations from such general assumptions were made for certain CGUs to deal with specific circumstances applying to such units. Due to the specific situation of the CGU in Central America, the projections for some individual countries deviate from the above mentioned general assumptions, notably in Costa Rica and Panama (both in CGU Central America) where implied annualised growth rates (CAGR) of 5%-6% have been applied, whilst the combined CAGR for the CGU Central America remains in line with the above-mentioned 2%-4%.
The terminal value is based on the normalised cash flows at the end of the last projected period for each business and a sustainable nominal growth rate (including the expected inflation rate) of on average 1% for most industrialised countries (Europe, Canada, USA), 2% for Australia/New Zealand, 2.5% for Latin American (Chile, Peru and Central America) and 3.5% in India to reflect the higher growth prospects for the latter.
The cash flows are discounted at the average weighted cost of capital. Depending on the countries involved, the pre-tax weighted average cost of capital ranged between 8% and 15%, in line with previous years. The cost of equity component for developed economies is based on a risk-free rate and an equity risk premium. For emerging economies, a country risk premium is added. The cost of debt component for both types of economies reflects the estimated long-term cost of funding in the corresponding economies.
The results of the impairment test are sensitive to the assumptions used. An increase of 1% in the weighted average cost of capital would not result in a significant impairment loss.
During 2020, an impairment on goodwill of € 38.3 million has been recognised in the consolidated statement of profit or loss in relation to the Central American business as a result of revised cashflow projections due to changed local market conditions.
Notes to the consolidated financial statements
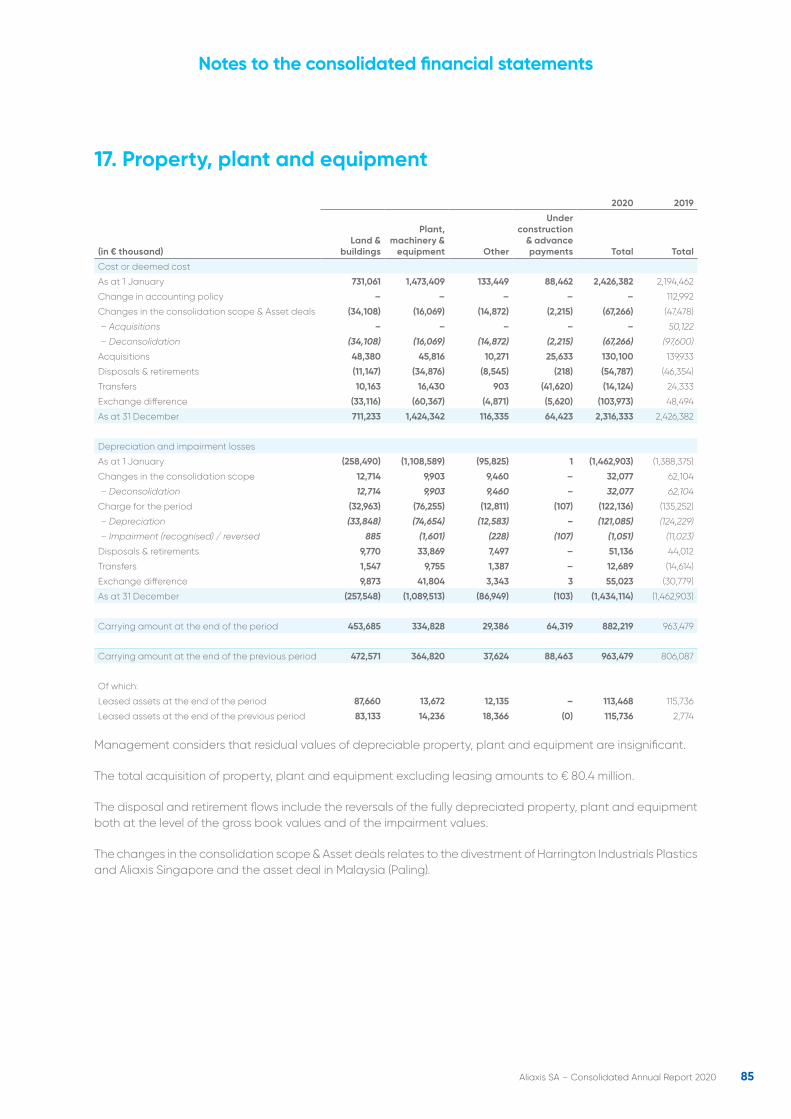
85Aliaxis SA – Consolidated Annual Report 2020
17. Property, plant and equipment
(in € thousand)
2020 2019
Land & buildings
Plant, machinery &
equipment Other
Under construction
& advance payments Total Total
Cost or deemed cost
As at 1 January 731,061 1,473,409 133,449 88,462 2,426,382 2,194,462
Change in accounting policy – – – – – 112,992
Changes in the consolidation scope & Asset deals (34,108) (16,069) (14,872) (2,215) (67,266) (47,478)
– Acquisitions – – – – – 50,122
– Deconsolidation (34,108) (16,069) (14,872) (2,215) (67,266) (97,600)
Acquisitions 48,380 45,816 10,271 25,633 130,100 139,933
Disposals & retirements (11,147) (34,876) (8,545) (218) (54,787) (46,354)
Transfers 10,163 16,430 903 (41,620) (14,124) 24,333
Exchange difference (33,116) (60,367) (4,871) (5,620) (103,973) 48,494
As at 31 December 711,233 1,424,342 116,335 64,423 2,316,333 2,426,382
Depreciation and impairment losses
As at 1 January (258,490) (1,108,589) (95,825) 1 (1,462,903) (1,388,375)
Changes in the consolidation scope 12,714 9,903 9,460 – 32,077 62,104
– Deconsolidation 12,714 9,903 9,460 – 32,077 62,104
Charge for the period (32,963) (76,255) (12,811) (107) (122,136) (135,252)
– Depreciation (33,848) (74,654) (12,583) – (121,085) (124,229)
– Impairment (recognised) / reversed 885 (1,601) (228) (107) (1,051) (11,023)
Disposals & retirements 9,770 33,869 7,497 – 51,136 44,012
Transfers 1,547 9,755 1,387 – 12,689 (14,614)
Exchange difference 9,873 41,804 3,343 3 55,023 (30,779)
As at 31 December (257,548) (1,089,513) (86,949) (103) (1,434,114) (1,462,903)
Carrying amount at the end of the period 453,685 334,828 29,386 64,319 882,219 963,479
Carrying amount at the end of the previous period 472,571 364,820 37,624 88,463 963,479 806,087
Of which:
Leased assets at the end of the period 87,660 13,672 12,135 – 113,468 115,736
Leased assets at the end of the previous period 83,133 14,236 18,366 (0) 115,736 2,774
Management considers that residual values of depreciable property, plant and equipment are insignificant.
The total acquisition of property, plant and equipment excluding leasing amounts to € 80.4 million.
The disposal and retirement flows include the reversals of the fully depreciated property, plant and equipment both at the level of the gross book values and of the impairment values.
The changes in the consolidation scope & Asset deals relates to the divestment of Harrington Industrials Plastics and Aliaxis Singapore and the asset deal in Malaysia (Paling).
Notes to the consolidated financial statements
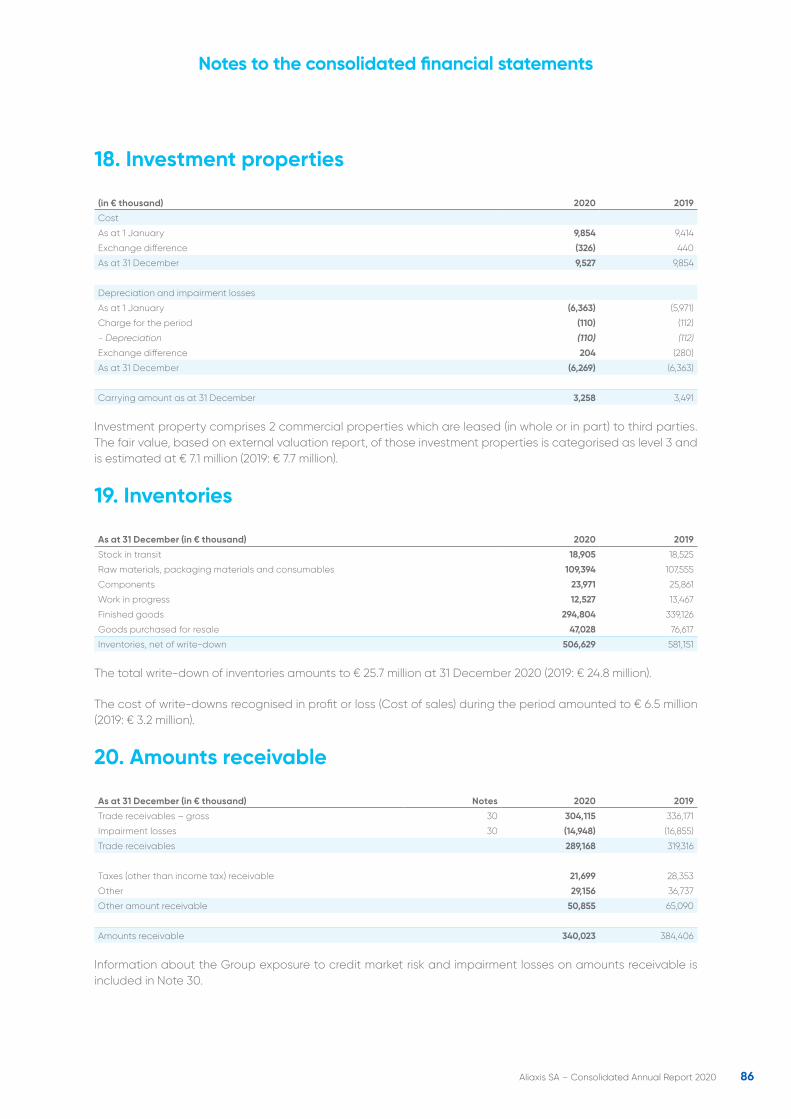
86Aliaxis SA – Consolidated Annual Report 2020
18. Investment properties
(in € thousand) 2020 2019
Cost
As at 1 January 9,854 9,414
Exchange difference (326) 440
As at 31 December 9,527 9,854
Depreciation and impairment losses
As at 1 January (6,363) (5,971)
Charge for the period (110) (112)
- Depreciation (110) (112)
Exchange difference 204 (280)
As at 31 December (6,269) (6,363)
Carrying amount as at 31 December 3,258 3,491
Investment property comprises 2 commercial properties which are leased (in whole or in part) to third parties. The fair value, based on external valuation report, of those investment properties is categorised as level 3 and is estimated at € 7.1 million (2019: € 7.7 million).
19. Inventories
As at 31 December (in € thousand) 2020 2019
Stock in transit 18,905 18,525
Raw materials, packaging materials and consumables 109,394 107,555
Components 23,971 25,861
Work in progress 12,527 13,467
Finished goods 294,804 339,126
Goods purchased for resale 47,028 76,617
Inventories, net of write-down 506,629 581,151
The total write-down of inventories amounts to € 25.7 million at 31 December 2020 (2019: € 24.8 million).
The cost of write-downs recognised in profit or loss (Cost of sales) during the period amounted to € 6.5 million (2019: € 3.2 million).
20. Amounts receivable
As at 31 December (in € thousand) Notes 2020 2019
Trade receivables – gross 30 304,115 336,171
Impairment losses 30 (14,948) (16,855)
Trade receivables 289,168 319,316
Taxes (other than income tax) receivable 21,699 28,353
Other 29,156 36,737
Other amount receivable 50,855 65,090
Amounts receivable 340,023 384,406
Information about the Group exposure to credit market risk and impairment losses on amounts receivable is included in Note 30.
Notes to the consolidated financial statements
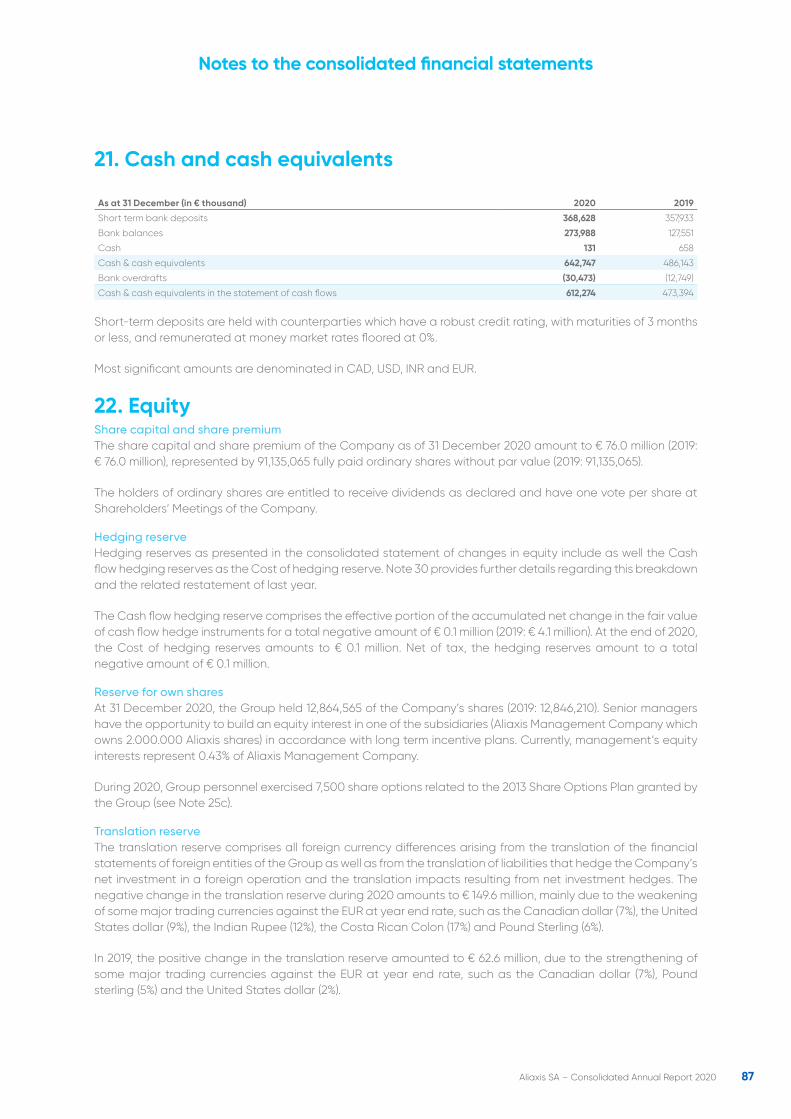
87Aliaxis SA – Consolidated Annual Report 2020
21. Cash and cash equivalents
As at 31 December (in € thousand) 2020 2019
Short term bank deposits 368,628 357,933
Bank balances 273,988 127,551
Cash 131 658
Cash & cash equivalents 642,747 486,143
Bank overdrafts (30,473) (12,749)
Cash & cash equivalents in the statement of cash flows 612,274 473,394
Short-term deposits are held with counterparties which have a robust credit rating, with maturities of 3 months or less, and remunerated at money market rates floored at 0%.
Most significant amounts are denominated in CAD, USD, INR and EUR.
22. EquityShare capital and share premiumThe share capital and share premium of the Company as of 31 December 2020 amount to € 76.0 million (2019: € 76.0 million), represented by 91,135,065 fully paid ordinary shares without par value (2019: 91,135,065).
The holders of ordinary shares are entitled to receive dividends as declared and have one vote per share at Shareholders’ Meetings of the Company.
Hedging reserveHedging reserves as presented in the consolidated statement of changes in equity include as well the Cash flow hedging reserves as the Cost of hedging reserve. Note 30 provides further details regarding this breakdown and the related restatement of last year.
The Cash flow hedging reserve comprises the effective portion of the accumulated net change in the fair value of cash flow hedge instruments for a total negative amount of € 0.1 million (2019: € 4.1 million). At the end of 2020, the Cost of hedging reserves amounts to € 0.1 million. Net of tax, the hedging reserves amount to a total negative amount of € 0.1 million.
Reserve for own sharesAt 31 December 2020, the Group held 12,864,565 of the Company’s shares (2019: 12,846,210). Senior managers have the opportunity to build an equity interest in one of the subsidiaries (Aliaxis Management Company which owns 2.000.000 Aliaxis shares) in accordance with long term incentive plans. Currently, management’s equity interests represent 0.43% of Aliaxis Management Company.
During 2020, Group personnel exercised 7,500 share options related to the 2013 Share Options Plan granted by the Group (see Note 25c).
Translation reserveThe translation reserve comprises all foreign currency differences arising from the translation of the financial statements of foreign entities of the Group as well as from the translation of liabilities that hedge the Company’s net investment in a foreign operation and the translation impacts resulting from net investment hedges. The negative change in the translation reserve during 2020 amounts to € 149.6 million, mainly due to the weakening of some major trading currencies against the EUR at year end rate, such as the Canadian dollar (7%), the United States dollar (9%), the Indian Rupee (12%), the Costa Rican Colon (17%) and Pound Sterling (6%).
In 2019, the positive change in the translation reserve amounted to € 62.6 million, due to the strengthening of some major trading currencies against the EUR at year end rate, such as the Canadian dollar (7%), Pound sterling (5%) and the United States dollar (2%).
Notes to the consolidated financial statements
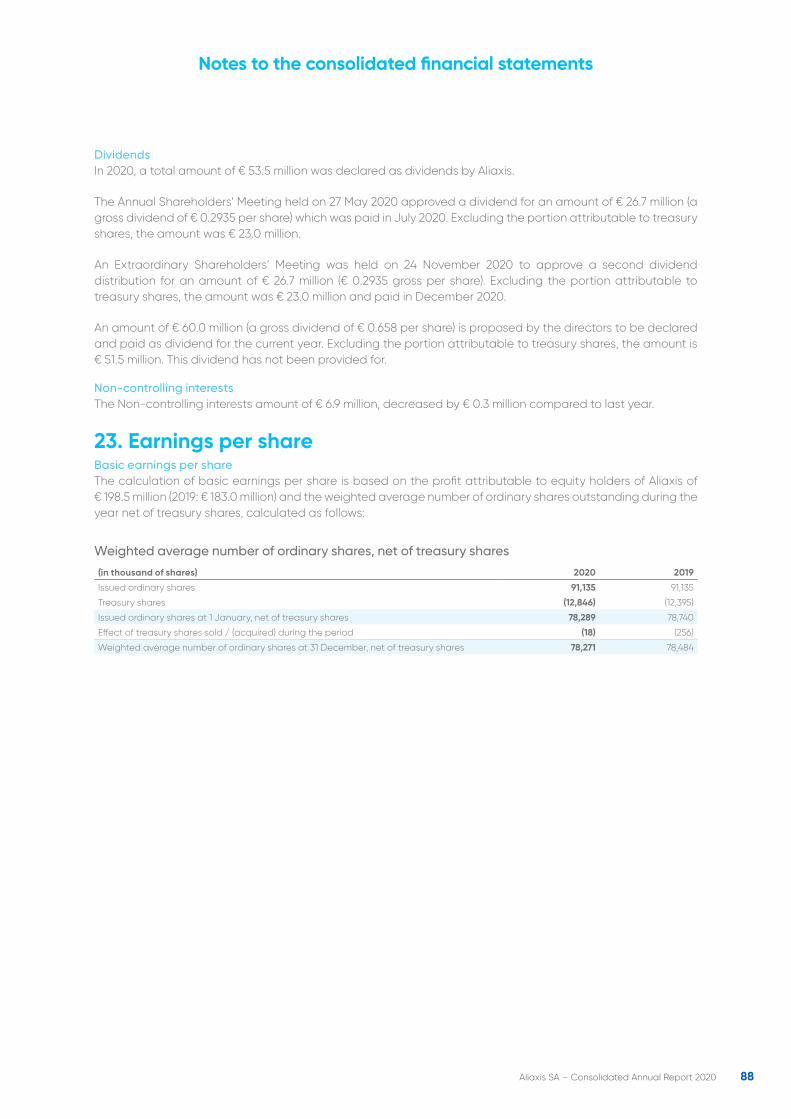
88Aliaxis SA – Consolidated Annual Report 2020
DividendsIn 2020, a total amount of € 53.5 million was declared as dividends by Aliaxis.
The Annual Shareholders’ Meeting held on 27 May 2020 approved a dividend for an amount of € 26.7 million (a gross dividend of € 0.2935 per share) which was paid in July 2020. Excluding the portion attributable to treasury shares, the amount was € 23.0 million.
An Extraordinary Shareholders’ Meeting was held on 24 November 2020 to approve a second dividend distribution for an amount of € 26.7 million (€ 0.2935 gross per share). Excluding the portion attributable to treasury shares, the amount was € 23.0 million and paid in December 2020.
An amount of € 60.0 million (a gross dividend of € 0.658 per share) is proposed by the directors to be declared and paid as dividend for the current year. Excluding the portion attributable to treasury shares, the amount is € 51.5 million. This dividend has not been provided for.
Non-controlling interestsThe Non-controlling interests amount of € 6.9 million, decreased by € 0.3 million compared to last year.
23. Earnings per shareBasic earnings per shareThe calculation of basic earnings per share is based on the profit attributable to equity holders of Aliaxis of € 198.5 million (2019: € 183.0 million) and the weighted average number of ordinary shares outstanding during the year net of treasury shares, calculated as follows:
Weighted average number of ordinary shares, net of treasury shares
(in thousand of shares) 2020 2019
Issued ordinary shares 91,135 91,135
Treasury shares (12,846) (12,395)
Issued ordinary shares at 1 January, net of treasury shares 78,289 78,740
Effect of treasury shares sold / (acquired) during the period (18) (256)
Weighted average number of ordinary shares at 31 December, net of treasury shares 78,271 78,484
Notes to the consolidated financial statements
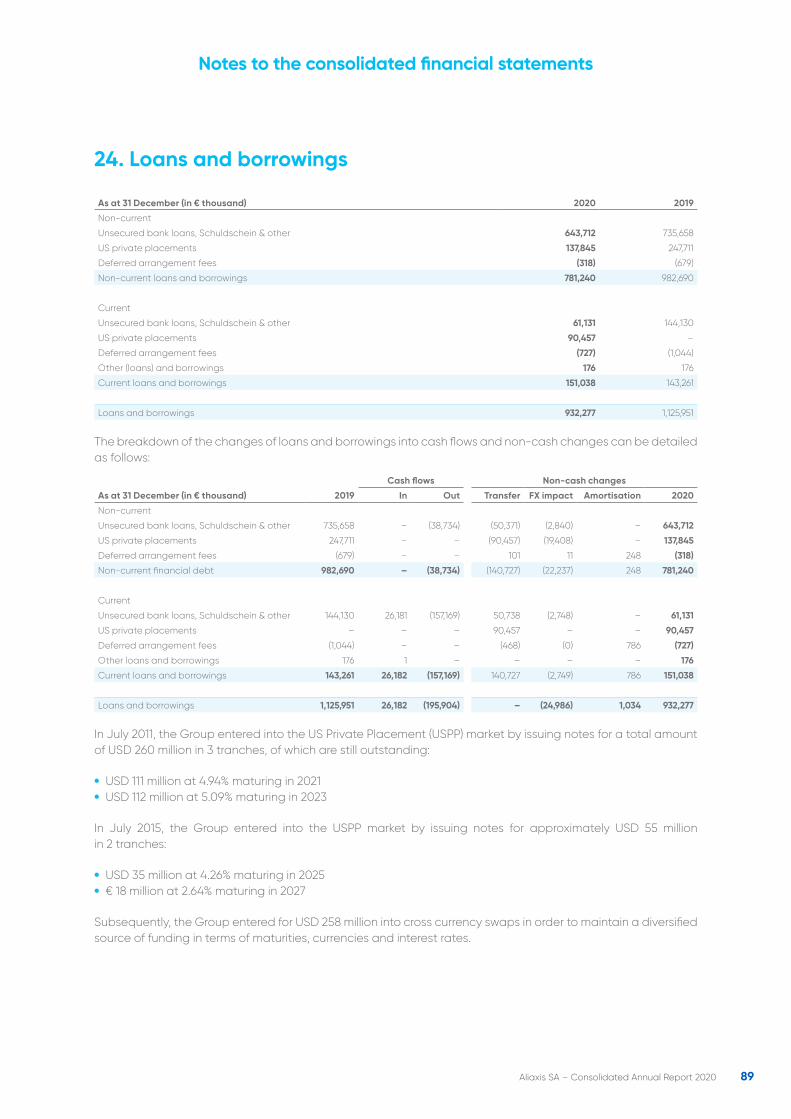
89Aliaxis SA – Consolidated Annual Report 2020
24. Loans and borrowings
As at 31 December (in € thousand) 2020 2019
Non-current
Unsecured bank loans, Schuldschein & other 643,712 735,658
US private placements 137,845 247,711
Deferred arrangement fees (318) (679)
Non-current loans and borrowings 781,240 982,690
Current
Unsecured bank loans, Schuldschein & other 61,131 144,130
US private placements 90,457 –
Deferred arrangement fees (727) (1,044)
Other (loans) and borrowings 176 176
Current loans and borrowings 151,038 143,261
Loans and borrowings 932,277 1,125,951
The breakdown of the changes of loans and borrowings into cash flows and non-cash changes can be detailed as follows:
As at 31 December (in € thousand) 2019
Cash flows Non-cash changes
In Out Transfer FX impact Amortisation 2020
Non-current
Unsecured bank loans, Schuldschein & other 735,658 – (38,734) (50,371) (2,840) – 643,712
US private placements 247,711 – – (90,457) (19,408) – 137,845
Deferred arrangement fees (679) – – 101 11 248 (318)
Non-current financial debt 982,690 – (38,734) (140,727) (22,237) 248 781,240
Current
Unsecured bank loans, Schuldschein & other 144,130 26,181 (157,169) 50,738 (2,748) – 61,131
US private placements – – – 90,457 – – 90,457
Deferred arrangement fees (1,044) – – (468) (0) 786 (727)
Other loans and borrowings 176 1 – – – – 176
Current loans and borrowings 143,261 26,182 (157,169) 140,727 (2,749) 786 151,038
Loans and borrowings 1,125,951 26,182 (195,904) – (24,986) 1,034 932,277
In July 2011, the Group entered into the US Private Placement (USPP) market by issuing notes for a total amount of USD 260 million in 3 tranches, of which are still outstanding:
• USD 111 million at 4.94% maturing in 2021 • USD 112 million at 5.09% maturing in 2023
In July 2015, the Group entered into the USPP market by issuing notes for approximately USD 55 million in 2 tranches:
• USD 35 million at 4.26% maturing in 2025 • € 18 million at 2.64% maturing in 2027
Subsequently, the Group entered for USD 258 million into cross currency swaps in order to maintain a diversified source of funding in terms of maturities, currencies and interest rates.
Notes to the consolidated financial statements
90Aliaxis SA – Consolidated Annual Report 2020
In July 2015 also, the Group entered into the Schuldschein (SSD) market by issuing certificates for a total amount of € 120 million in 4 tranches, of which are still outstanding:
• € 40 million at 2.13% maturing in 2022 • € 27 million at floating rate maturing in 2022
Simultaneously, the Group refinanced its syndicated bank debt by entering into a 5 year (with two possible one-year extensions) committed multi-currency revolving credit facility of € 680 million between Aliaxis Finance/Aliaxis North America/Aliaxis Holding Australia and a syndicate of banks. The borrowing rate is based on a short-term interest rate plus margin. The management of interest rate risk is described in Note 30.
In June 2016, the syndicated loan maturity was extended by one year for the total amount of € 680 million with maturity fixed at July 2021.
In June 2017, the syndicated loan maturity was extended by an additional one year for the amount of € 631 million, with final maturity now fixed at July 2022.
In May 2018, the Group entered into a Club Deal multi-currency bank facility of € 400 Million maturing in July 2022 made up of a € 200 million amortising Term Loan Tranche (€ 50 million repayment in July 2020 and EUR 50 million repayment in July 2021), and a € 200 million bullet Revolving Tranche. In both tranches, the borrowing rate is based on a short-term interest rate plus margin. The management of interest rate risk is described in Note 30.
At 31 December 2020, € 276 million of the syndicated facility was drawn (2019: € 318 million), and the term loan tranche of the Club deal amounted to €150 million (2019: € 200 million).
These USPP and SSD programs together with the Syndicated loan and the Club deal bank facility are unsecured, subject to covenants (including, inter alia, financial covenants based on interest cover and leverage ratios) and undertakings standard for this type of financing, and were not subject to any breach of covenants as at 31 December 2020.
Other facilities of Aliaxis Finance S.A. and other subsidiaries of the Group include a number of additional bilateral and multilateral credit facilities.
Notes to the consolidated financial statements
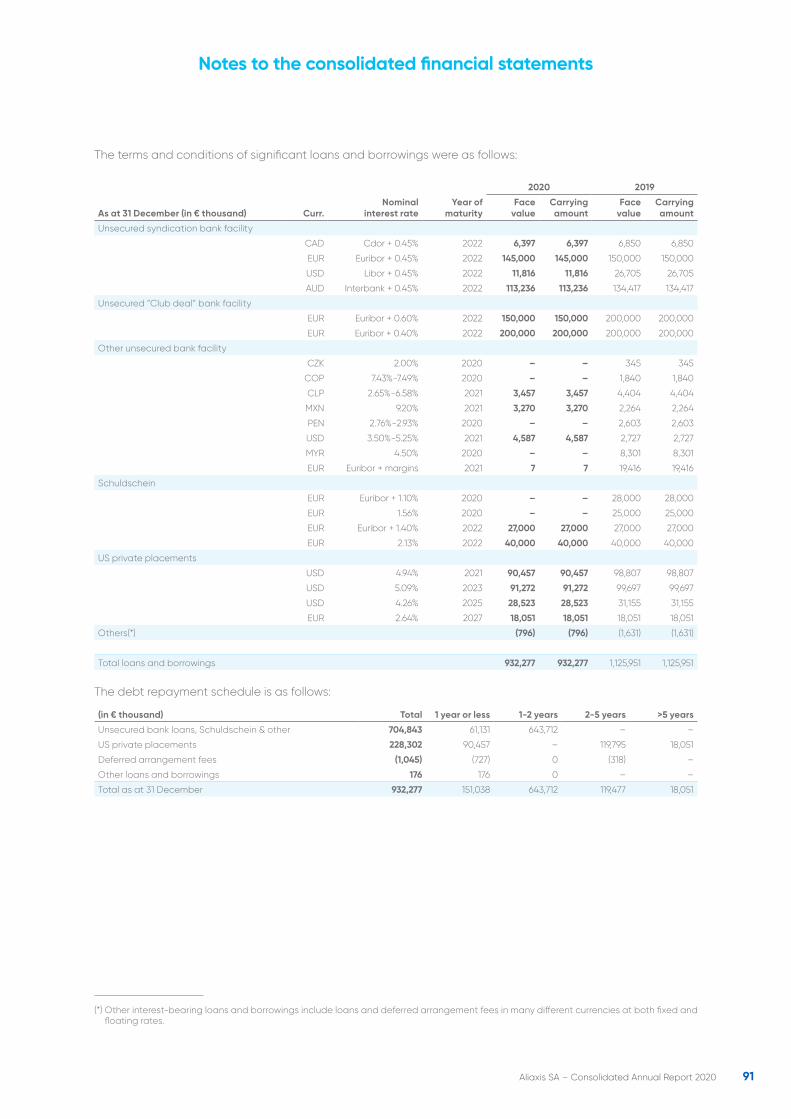
91Aliaxis SA – Consolidated Annual Report 2020
The terms and conditions of significant loans and borrowings were as follows:
As at 31 December (in € thousand) Curr.Nominal
interest rateYear of
maturity
2020 2019
Face value
Carrying amount
Face value
Carrying amount
Unsecured syndication bank facility
CAD Cdor + 0.45% 2022 6,397 6,397 6,850 6,850
EUR Euribor + 0.45% 2022 145,000 145,000 150,000 150,000
USD Libor + 0.45% 2022 11,816 11,816 26,705 26,705
AUD Interbank + 0.45% 2022 113,236 113,236 134,417 134,417
Unsecured “Club deal” bank facility
EUR Euribor + 0.60% 2022 150,000 150,000 200,000 200,000
EUR Euribor + 0.40% 2022 200,000 200,000 200,000 200,000
Other unsecured bank facility
CZK 2.00% 2020 – – 345 345
COP 7.43%-7.49% 2020 – – 1,840 1,840
CLP 2.65%-6.58% 2021 3,457 3,457 4,404 4,404
MXN 9.20% 2021 3,270 3,270 2,264 2,264
PEN 2.76%-2.93% 2020 – – 2,603 2,603
USD 3.50%-5.25% 2021 4,587 4,587 2,727 2,727
MYR 4.50% 2020 – – 8,301 8,301
EUR Euribor + margins 2021 7 7 19,416 19,416
Schuldschein
EUR Euribor + 1.10% 2020 – – 28,000 28,000
EUR 1.56% 2020 – – 25,000 25,000
EUR Euribor + 1.40% 2022 27,000 27,000 27,000 27,000
EUR 2.13% 2022 40,000 40,000 40,000 40,000
US private placements
USD 4.94% 2021 90,457 90,457 98,807 98,807
USD 5.09% 2023 91,272 91,272 99,697 99,697
USD 4.26% 2025 28,523 28,523 31,155 31,155
EUR 2.64% 2027 18,051 18,051 18,051 18,051
Others(*) (796) (796) (1,631) (1,631)
Total loans and borrowings 932,277 932,277 1,125,951 1,125,951
The debt repayment schedule is as follows:
(in € thousand) Total 1 year or less 1-2 years 2-5 years >5 years
Unsecured bank loans, Schuldschein & other 704,843 61,131 643,712 – –
US private placements 228,302 90,457 – 119,795 18,051
Deferred arrangement fees (1,045) (727) 0 (318) –
Other loans and borrowings 176 176 0 – –
Total as at 31 December 932,277 151,038 643,712 119,477 18,051
(*) Other interest-bearing loans and borrowings include loans and deferred arrangement fees in many different currencies at both fixed and floating rates.
Notes to the consolidated financial statements
92Aliaxis SA – Consolidated Annual Report 2020
25. Employee benefitsAliaxis maintains benefit plans such as retirement and medical care plans, termination plans and other long-term benefit plans in several countries in which the Group operates. In addition, the Group also has share-based payment plans and a long-term incentive scheme.
The Group operates a number of defined benefit and defined contribution plans throughout the world, the assets of which are generally held in separate trustee-administered funds. The pension plans are generally funded by payments from employees and the company. Aliaxis maintains funded and unfunded pension plans.
(a) Defined contribution plansFor defined contribution plans, the Group companies pay contributions to pension funds or insurance companies.
Once the contributions have been paid, the Group companies have no further payment obligation. The regular contributions constitute an expense for the period in which they are due. In 2020, the defined contribution plan expenses for the Group amounted to € 17.3 million (2019: € 17.7 million).
(b) Defined benefit plansAliaxis reports on a total of 59 defined benefit plans over 2020, which provide the following benefits:
Retirement benefits: 42
Long service awards: 12
Termination benefits: 1
Medical benefits: 4
All the plans have been established in accordance with common practice and legal requirements in each relevant country.
The retirement defined benefit plans generally provide a benefit related to years of service and rates of pay close to retirement.
The retirement benefit plans in Australia, Belgium, India, Switzerland and the UK are separately funded through external insurance contracts or pension funds legally separate from the Group. There are both funded and unfunded plans in Canada, Germany and France.
The funding requirements are stipulated in the insurance contract or, in the case of pension funds, based on the pension fund’s actuarial measurement framework set out in the funding policies of the plan, and comply with the local minimum funding requirements. For two plans in Canada a recovery contribution plan is in place in order to attain the minimum funding requirements.
The retirement benefit plans in Italy, Austria and New Zealand are unfunded.
The termination benefit plans consist of early retirement plans in Germany.
The medical plans provide medical benefits after retirement to former employees in France, Canada, the US and the UK.
The long service awards are granted in Australia, Austria, Germany, India, New Zealand and France.
Notes to the consolidated financial statements
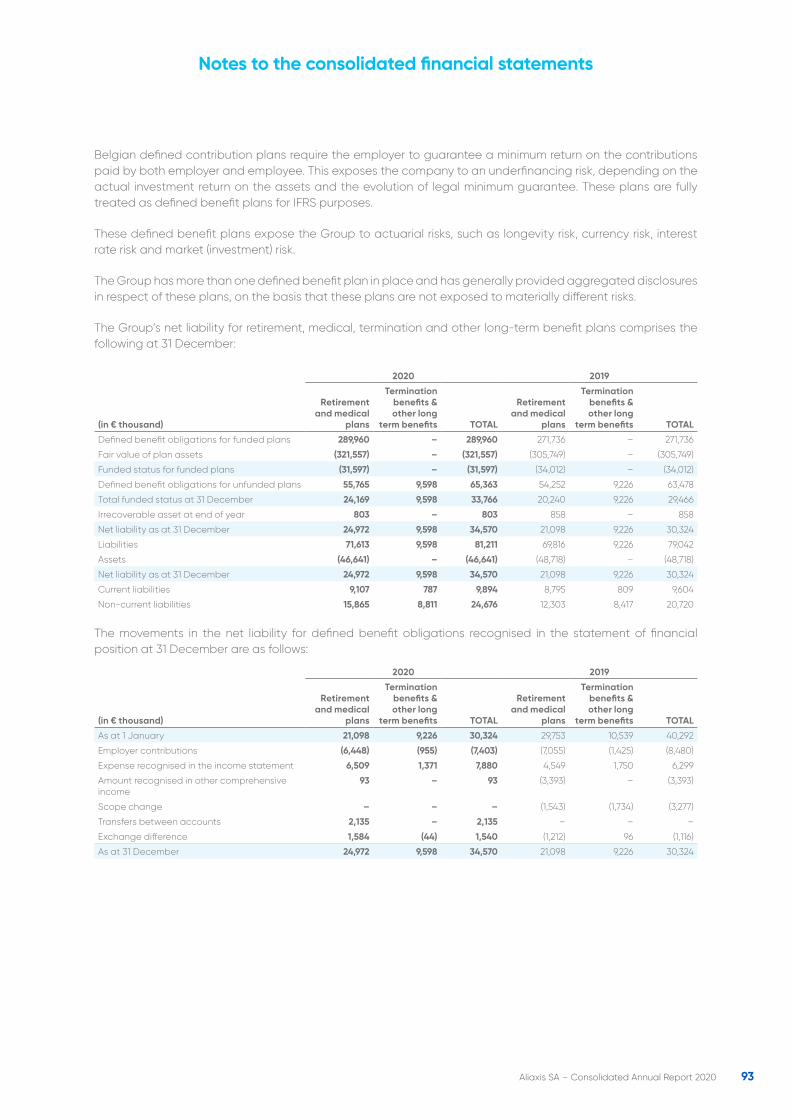
93Aliaxis SA – Consolidated Annual Report 2020
Belgian defined contribution plans require the employer to guarantee a minimum return on the contributions paid by both employer and employee. This exposes the company to an underfinancing risk, depending on the actual investment return on the assets and the evolution of legal minimum guarantee. These plans are fully treated as defined benefit plans for IFRS purposes.
These defined benefit plans expose the Group to actuarial risks, such as longevity risk, currency risk, interest rate risk and market (investment) risk.
The Group has more than one defined benefit plan in place and has generally provided aggregated disclosures in respect of these plans, on the basis that these plans are not exposed to materially different risks.
The Group’s net liability for retirement, medical, termination and other long-term benefit plans comprises the following at 31 December:
(in € thousand)
2020 2019
Retirement and medical
plans
Termination benefits & other long
term benefits TOTAL
Retirement and medical
plans
Termination benefits & other long
term benefits TOTAL
Defined benefit obligations for funded plans 289,960 – 289,960 271,736 – 271,736
Fair value of plan assets (321,557) – (321,557) (305,749) – (305,749)
Funded status for funded plans (31,597) – (31,597) (34,012) – (34,012)
Defined benefit obligations for unfunded plans 55,765 9,598 65,363 54,252 9,226 63,478
Total funded status at 31 December 24,169 9,598 33,766 20,240 9,226 29,466
Irrecoverable asset at end of year 803 – 803 858 – 858
Net liability as at 31 December 24,972 9,598 34,570 21,098 9,226 30,324
Liabilities 71,613 9,598 81,211 69,816 9,226 79,042
Assets (46,641) – (46,641) (48,718) – (48,718)
Net liability as at 31 December 24,972 9,598 34,570 21,098 9,226 30,324
Current liabilities 9,107 787 9,894 8,795 809 9,604
Non-current liabilities 15,865 8,811 24,676 12,303 8,417 20,720
The movements in the net liability for defined benefit obligations recognised in the statement of financial position at 31 December are as follows:
(in € thousand)
2020 2019
Retirement and medical
plans
Termination benefits & other long
term benefits TOTAL
Retirement and medical
plans
Termination benefits & other long
term benefits TOTAL
As at 1 January 21,098 9,226 30,324 29,753 10,539 40,292
Employer contributions (6,448) (955) (7,403) (7,055) (1,425) (8,480)
Expense recognised in the income statement 6,509 1,371 7,880 4,549 1,750 6,299
Amount recognised in other comprehensive income
93 – 93 (3,393) – (3,393)
Scope change – – – (1,543) (1,734) (3,277)
Transfers between accounts 2,135 – 2,135 – – –
Exchange difference 1,584 (44) 1,540 (1,212) 96 (1,116)
As at 31 December 24,972 9,598 34,570 21,098 9,226 30,324
Notes to the consolidated financial statements
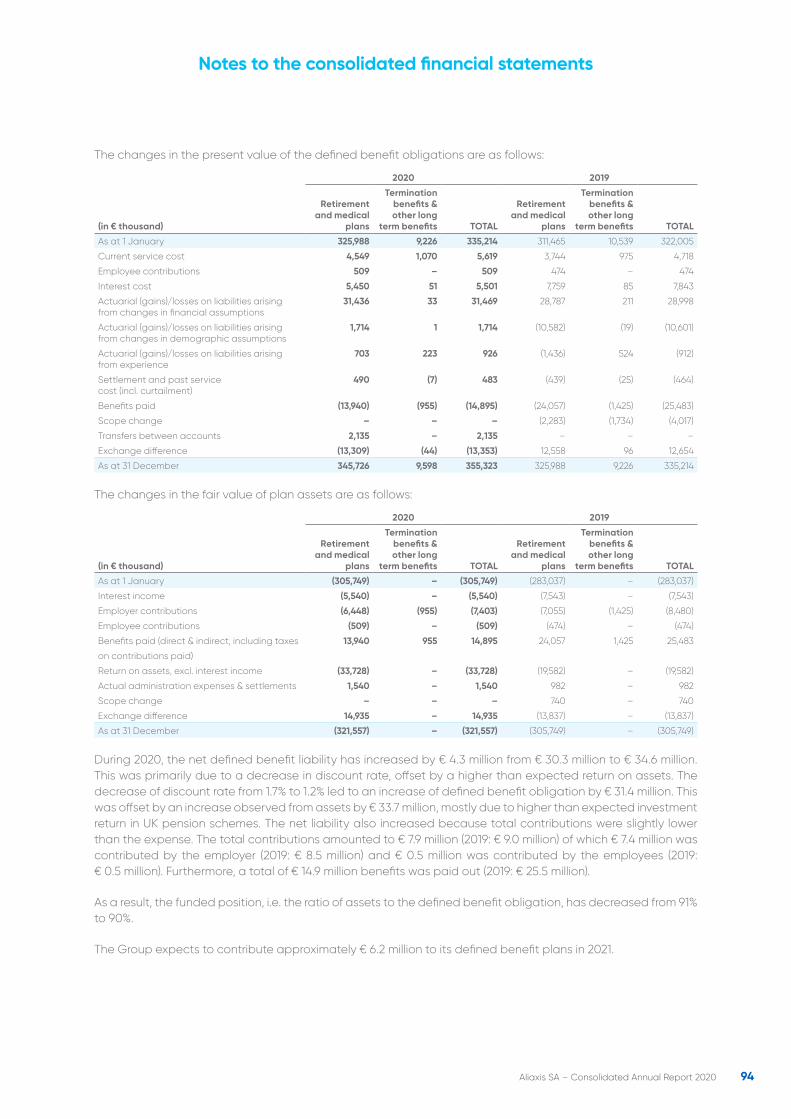
94Aliaxis SA – Consolidated Annual Report 2020
The changes in the present value of the defined benefit obligations are as follows:
(in € thousand)
2020 2019
Retirement and medical
plans
Termination benefits & other long
term benefits TOTAL
Retirement and medical
plans
Termination benefits & other long
term benefits TOTAL
As at 1 January 325,988 9,226 335,214 311,465 10,539 322,005
Current service cost 4,549 1,070 5,619 3,744 975 4,718
Employee contributions 509 – 509 474 – 474
Interest cost 5,450 51 5,501 7,759 85 7,843
Actuarial (gains)/losses on liabilities arising from changes in financial assumptions
31,436 33 31,469 28,787 211 28,998
Actuarial (gains)/losses on liabilities arising from changes in demographic assumptions
1,714 1 1,714 (10,582) (19) (10,601)
Actuarial (gains)/losses on liabilities arising from experience
703 223 926 (1,436) 524 (912)
Settlement and past service cost (incl. curtailment)
490 (7) 483 (439) (25) (464)
Benefits paid (13,940) (955) (14,895) (24,057) (1,425) (25,483)
Scope change – – – (2,283) (1,734) (4,017)
Transfers between accounts 2,135 – 2,135 – – –
Exchange difference (13,309) (44) (13,353) 12,558 96 12,654
As at 31 December 345,726 9,598 355,323 325,988 9,226 335,214
The changes in the fair value of plan assets are as follows:
(in € thousand)
2020 2019
Retirement and medical
plans
Termination benefits & other long
term benefits TOTAL
Retirement and medical
plans
Termination benefits & other long
term benefits TOTAL
As at 1 January (305,749) – (305,749) (283,037) – (283,037)
Interest income (5,540) – (5,540) (7,543) – (7,543)
Employer contributions (6,448) (955) (7,403) (7,055) (1,425) (8,480)
Employee contributions (509) – (509) (474) – (474)
Benefits paid (direct & indirect, including taxes 13,940 955 14,895 24,057 1,425 25,483
on contributions paid)
Return on assets, excl. interest income (33,728) – (33,728) (19,582) – (19,582)
Actual administration expenses & settlements 1,540 – 1,540 982 – 982
Scope change – – – 740 – 740
Exchange difference 14,935 – 14,935 (13,837) – (13,837)
As at 31 December (321,557) – (321,557) (305,749) – (305,749)
During 2020, the net defined benefit liability has increased by € 4.3 million from € 30.3 million to € 34.6 million. This was primarily due to a decrease in discount rate, offset by a higher than expected return on assets. The decrease of discount rate from 1.7% to 1.2% led to an increase of defined benefit obligation by € 31.4 million. This was offset by an increase observed from assets by € 33.7 million, mostly due to higher than expected investment return in UK pension schemes. The net liability also increased because total contributions were slightly lower than the expense. The total contributions amounted to € 7.9 million (2019: € 9.0 million) of which € 7.4 million was contributed by the employer (2019: € 8.5 million) and € 0.5 million was contributed by the employees (2019: € 0.5 million). Furthermore, a total of € 14.9 million benefits was paid out (2019: € 25.5 million).
As a result, the funded position, i.e. the ratio of assets to the defined benefit obligation, has decreased from 91% to 90%.
The Group expects to contribute approximately € 6.2 million to its defined benefit plans in 2021.
Notes to the consolidated financial statements
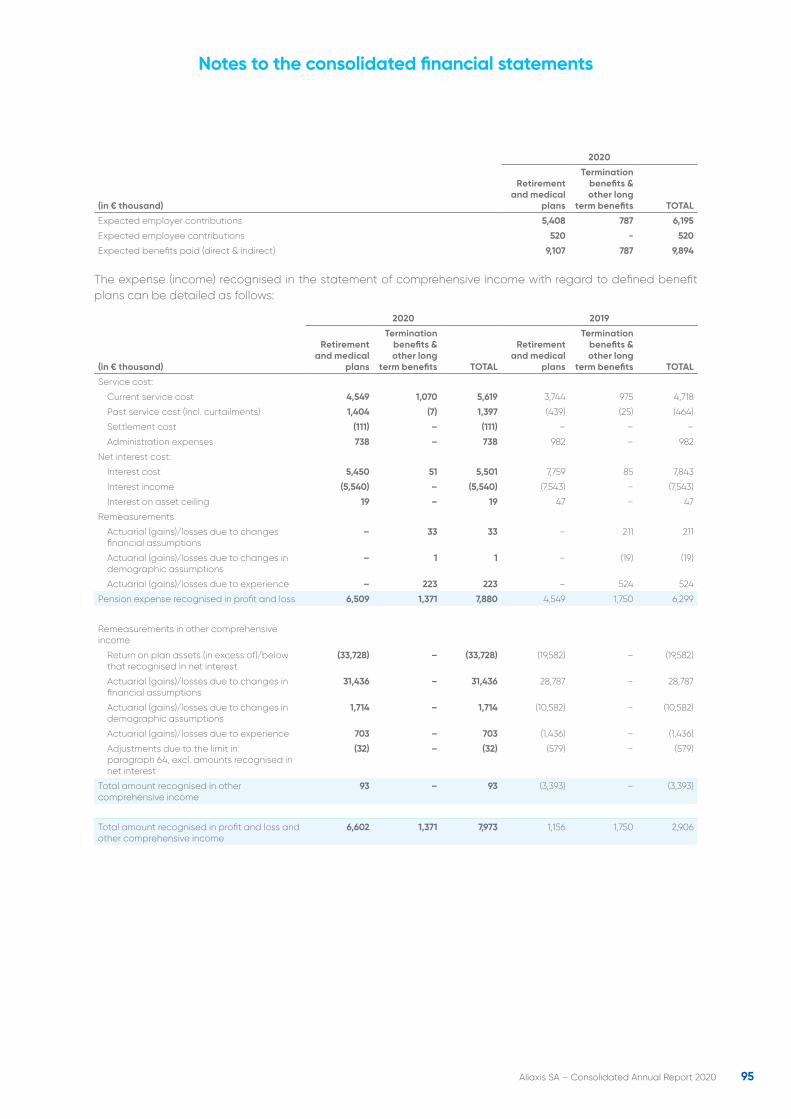
95Aliaxis SA – Consolidated Annual Report 2020
(in € thousand)
2020
Retirement and medical
plans
Termination benefits & other long
term benefits TOTAL
Expected employer contributions 5,408 787 6,195
Expected employee contributions 520 - 520
Expected benefits paid (direct & indirect) 9,107 787 9,894
The expense (income) recognised in the statement of comprehensive income with regard to defined benefit plans can be detailed as follows:
(in € thousand)
2020 2019
Retirement and medical
plans
Termination benefits & other long
term benefits TOTAL
Retirement and medical
plans
Termination benefits & other long
term benefits TOTAL
Service cost:
Current service cost 4,549 1,070 5,619 3,744 975 4,718
Past service cost (incl. curtailments) 1,404 (7) 1,397 (439) (25) (464)
Settlement cost (111) – (111) – – –
Administration expenses 738 – 738 982 – 982
Net interest cost:
Interest cost 5,450 51 5,501 7,759 85 7,843
Interest income (5,540) – (5,540) (7,543) – (7,543)
Interest on asset ceiling 19 – 19 47 – 47
Remeasurements
Actuarial (gains)/losses due to changes financial assumptions
– 33 33 – 211 211
Actuarial (gains)/losses due to changes in demographic assumptions
– 1 1 – (19) (19)
Actuarial (gains)/losses due to experience – 223 223 – 524 524
Pension expense recognised in profit and loss 6,509 1,371 7,880 4,549 1,750 6,299
Remeasurements in other comprehensive income
Return on plan assets (in excess of)/below that recognised in net interest
(33,728) – (33,728) (19,582) – (19,582)
Actuarial (gains)/losses due to changes in financial assumptions
31,436 – 31,436 28,787 – 28,787
Actuarial (gains)/losses due to changes in demographic assumptions
1,714 – 1,714 (10,582) – (10,582)
Actuarial (gains)/losses due to experience 703 – 703 (1,436) – (1,436)
Adjustments due to the limit in paragraph 64, excl. amounts recognised in net interest
(32) – (32) (579) – (579)
Total amount recognised in other comprehensive income
93 – 93 (3,393) – (3,393)
Total amount recognised in profit and loss and other comprehensive income
6,602 1,371 7,973 1,156 1,750 2,906
Notes to the consolidated financial statements
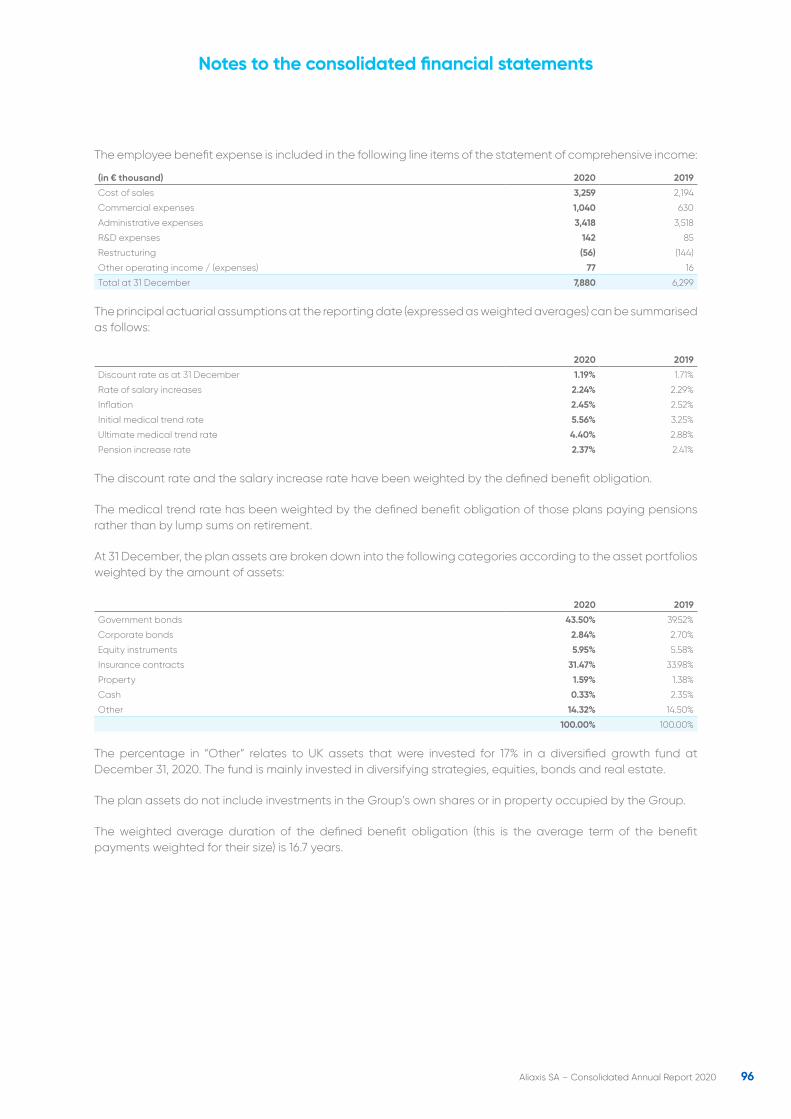
96Aliaxis SA – Consolidated Annual Report 2020
The employee benefit expense is included in the following line items of the statement of comprehensive income:
(in € thousand) 2020 2019
Cost of sales 3,259 2,194
Commercial expenses 1,040 630
Administrative expenses 3,418 3,518
R&D expenses 142 85
Restructuring (56) (144)
Other operating income / (expenses) 77 16
Total at 31 December 7,880 6,299
The principal actuarial assumptions at the reporting date (expressed as weighted averages) can be summarised as follows:
2020 2019
Discount rate as at 31 December 1.19% 1.71%
Rate of salary increases 2.24% 2.29%
Inflation 2.45% 2.52%
Initial medical trend rate 5.56% 3.25%
Ultimate medical trend rate 4.40% 2.88%
Pension increase rate 2.37% 2.41%
The discount rate and the salary increase rate have been weighted by the defined benefit obligation.
The medical trend rate has been weighted by the defined benefit obligation of those plans paying pensions rather than by lump sums on retirement.
At 31 December, the plan assets are broken down into the following categories according to the asset portfolios weighted by the amount of assets:
2020 2019
Government bonds 43.50% 39.52%
Corporate bonds 2.84% 2.70%
Equity instruments 5.95% 5.58%
Insurance contracts 31.47% 33.98%
Property 1.59% 1.38%
Cash 0.33% 2.35%
Other 14.32% 14.50%
100.00% 100.00%
The percentage in “Other” relates to UK assets that were invested for 17% in a diversified growth fund at December 31, 2020. The fund is mainly invested in diversifying strategies, equities, bonds and real estate.
The plan assets do not include investments in the Group’s own shares or in property occupied by the Group.
The weighted average duration of the defined benefit obligation (this is the average term of the benefit payments weighted for their size) is 16.7 years.
Notes to the consolidated financial statements
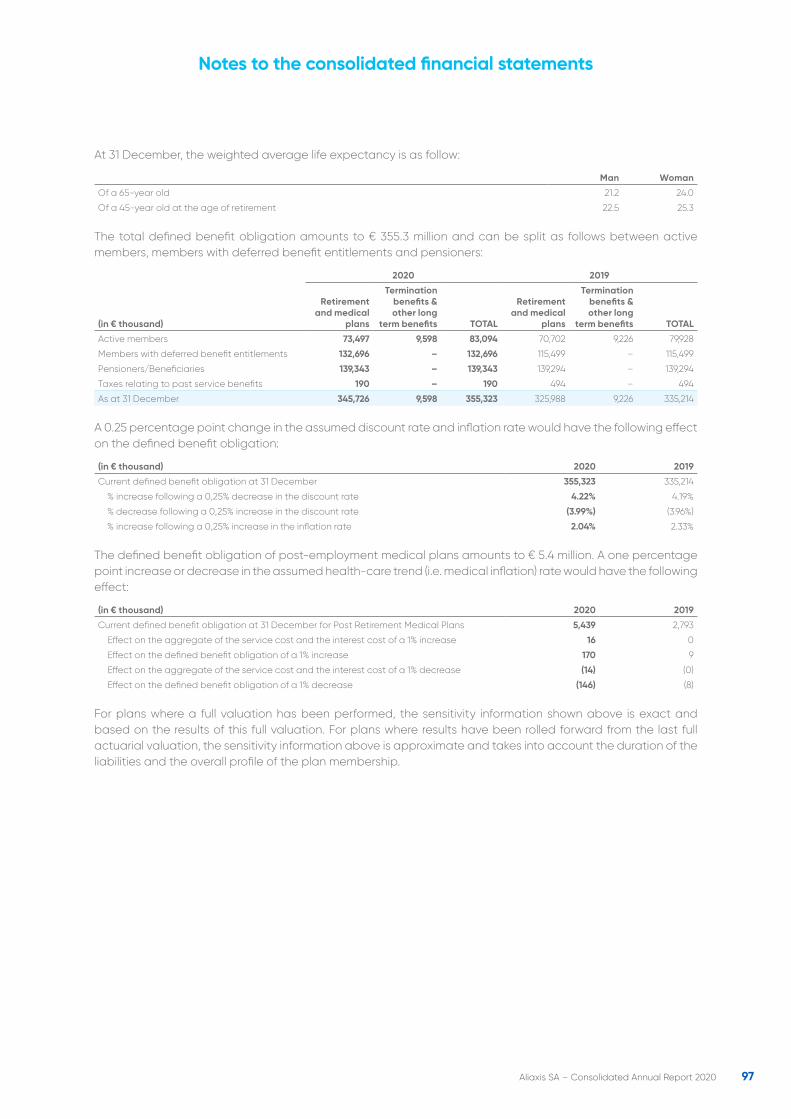
97Aliaxis SA – Consolidated Annual Report 2020
At 31 December, the weighted average life expectancy is as follow:
Man Woman
Of a 65-year old 21.2 24.0
Of a 45-year old at the age of retirement 22.5 25.3
The total defined benefit obligation amounts to € 355.3 million and can be split as follows between active members, members with deferred benefit entitlements and pensioners:
(in € thousand)
2020 2019
Retirement and medical
plans
Termination benefits & other long
term benefits TOTAL
Retirement and medical
plans
Termination benefits & other long
term benefits TOTAL
Active members 73,497 9,598 83,094 70,702 9,226 79,928
Members with deferred benefit entitlements 132,696 – 132,696 115,499 – 115,499
Pensioners/Beneficiaries 139,343 – 139,343 139,294 – 139,294
Taxes relating to past service benefits 190 – 190 494 – 494
As at 31 December 345,726 9,598 355,323 325,988 9,226 335,214
A 0.25 percentage point change in the assumed discount rate and inflation rate would have the following effect on the defined benefit obligation:
(in € thousand) 2020 2019
Current defined benefit obligation at 31 December 355,323 335,214
% increase following a 0,25% decrease in the discount rate 4.22% 4.19%
% decrease following a 0,25% increase in the discount rate (3.99%) (3.96%)
% increase following a 0,25% increase in the inflation rate 2.04% 2.33%
The defined benefit obligation of post-employment medical plans amounts to € 5.4 million. A one percentage point increase or decrease in the assumed health-care trend (i.e. medical inflation) rate would have the following effect:
(in € thousand) 2020 2019
Current defined benefit obligation at 31 December for Post Retirement Medical Plans 5,439 2,793
Effect on the aggregate of the service cost and the interest cost of a 1% increase 16 0
Effect on the defined benefit obligation of a 1% increase 170 9
Effect on the aggregate of the service cost and the interest cost of a 1% decrease (14) (0)
Effect on the defined benefit obligation of a 1% decrease (146) (8)
For plans where a full valuation has been performed, the sensitivity information shown above is exact and based on the results of this full valuation. For plans where results have been rolled forward from the last full actuarial valuation, the sensitivity information above is approximate and takes into account the duration of the liabilities and the overall profile of the plan membership.
Notes to the consolidated financial statements
98Aliaxis SA – Consolidated Annual Report 2020
(c) Share-based payments On 23 June 2004, Aliaxis approved a share option program entitling key management personnel and senior employees to purchase shares of the Company and authorising the issuance of up to 3,250,000 options to be granted annually over a period of 5 years. Five Stock Option Plans were accordingly granted on 5 July 2004 (SOP 2004), 4 July 2005 (SOP 2005), 3 July 2006 (SOP 2006), 4 July 2007 (SOP 2007) and 8 July 2008 (SOP 2008) respectively.
One share option gives the beneficiary the right to buy one ordinary share of the Company. The vesting period is four years after the grant date, and the options can be exercised subsequently during a period of three years with one exercise period per year. Options are to be settled by the physical delivery of shares using the treasury shares held by Aliaxis (see Note 22).
Each beneficiary is also granted a put option, as long as the Group remains unlisted, whereby Aliaxis shares acquired under these plans can be sold back to the Group at a price to be determined at each put exercise period. The put exercise periods run in parallel with the exercise periods of each plan.
At each grant/exercise date, Aliaxis determines the fair value of the shares by applying market multiples derived from a representative sample of listed companies to its last annual financial performance.
On 23 April 2009, Aliaxis decided to propose to all share option holders under the Aliaxis share option plans 2005 to 2008, that the exercise period under these plans be extended for three years, as permitted by an amendment to the law of 26 March 1999.
The exercise period of the SOP 2005 to 2008 has consequently been extended by 3 years for the holders who agreed to the proposed extension.
On 24 June 2009, Aliaxis approved a new share option program on the same basis as the previous share option scheme but limited to Group Senior Executives. Options will be available for granting over a maximum of 5 years. Five Stock Option Plans were accordingly granted on 7 July 2009 (SOP 2009), 6 July 2010 (SOP 2010), 4 July 2011 (SOP 2011), 5 July 2012 (SOP 2012) and 8 July 2013 (SOP 2013).
In June 2020, Group personnel exercised 7,500 share options related to the 2013 Share Option Plan.
No new Stock Option Plan was granted during 2020.
The total value of the share options exercised in 2020 at exercise or call price amounts to € 0.2 million. Their value at put price amounts to € 0.3 million.
Notes to the consolidated financial statements

99Aliaxis SA – Consolidated Annual Report 2020
Details of these stock option plans are as follows:
Number of share options
Date granted
Exercise price (in €) Granted Exercised Forfeited Outstanding
Exercise periods
1 June – 20 June
SOP 2004 05.07.2004 9.19 647,500 631,030 16,470 – 2008 – 2011
SOP 2005 04.07.2005 12.08 617,000 586,590 30,410 – 2009 – 2015
SOP 2006 03.07.2006 18.35 594,000 513,786 80,214 – 2010 – 2016
SOP 2007 04.07.2007 26.82 610,000 458,000 152,000 – 2011 – 2017
SOP 2008 08.07.2008 16.25 557,250 367,955 189,295 – 2012 – 2018
SOP 2009 07.07.2009 12.93 266,000 266,000 – – 2013 – 2016 (*)
SOP 2010 06.07.2010 14.74 253,000 253,000 – – 2014 – 2017 (*)
SOP 2011 04.07.2011 20.15 133,000 133,000 – – 2015 – 2018 (*)
SOP 2012 05.07.2012 14.50 138,000 138,000 – – 2016 – 2019 (*)
SOP 2013 08.07.2013 25.39 195,000 182,500 12,500 – 2017 – 2020 (*)
4,010,750 3,529,861 480,889 –
The number and weighted average exercise price of share options are as follows:
2020 2019
Number of share options
Weighted average
exercise price per option
(in €)
Number of share
options
Weighted average
exercise price per option
(in €)
Outstanding as at 1 January 7,500 25.39 37,500 26.84
Movements of the period:
Options exercised 7,500 25.39 30,000 27.21
Outstanding as at 31 December – – 7,500 25.39
Exercisable as at 31 December – – 7,500 25.39
The fair value of the services received in return for share options granted is based on the fair value of share options granted, measured using the Black & Scholes valuation model, with the following assumptions:
Fair value and assumptionsSOP 2013
SOP 2012
SOP 2011
SOP 2010
SOP 2009
SOP 2008
SOP 2007
SOP 2006
SOP 2005
Fair value at grant date (in € per option) 4.21 2.08 4.05 2.59 2.41 4.02 7.13 4.39 2.39
Share price (in €) 25.39 14.5 20.15 14.74 12.93 16.25 26.82 18.35 12.08
Exercise price (in €) 25.39 14.5 20.15 14.74 12.93 16.25 26.82 18.35 12.08
Expected volatility (in %) 20.00 20.00 20.00 20.00 20.00 20.00 20.00 21.00 21.00
Expected option average life (in years) 5.50 5.50 5.50 5.50 5.50 5.50 5.50 5.50 5.50
Expected dividends (in €) 0.25 0.23 0.20 0.18 0.17 0.16 0.14 0.12 0.11
Risk-free interest rate (in %) 1.19 1.13 2.86 2.12 2.82 4.89 4.84 4.08 2.76
The expected volatility percentage is based on the historical volatility which is observed for comparable companies in Belgium. Expected dividends take into account a 10% growth of the dividends paid during the year. The risk-free interest rate is based on the swap euro interest rate corresponding to the expected options’ average life. The vesting expectations are based on historical data of key management personnel turnover.
(*) from 1 June – 30 June
Notes to the consolidated financial statements
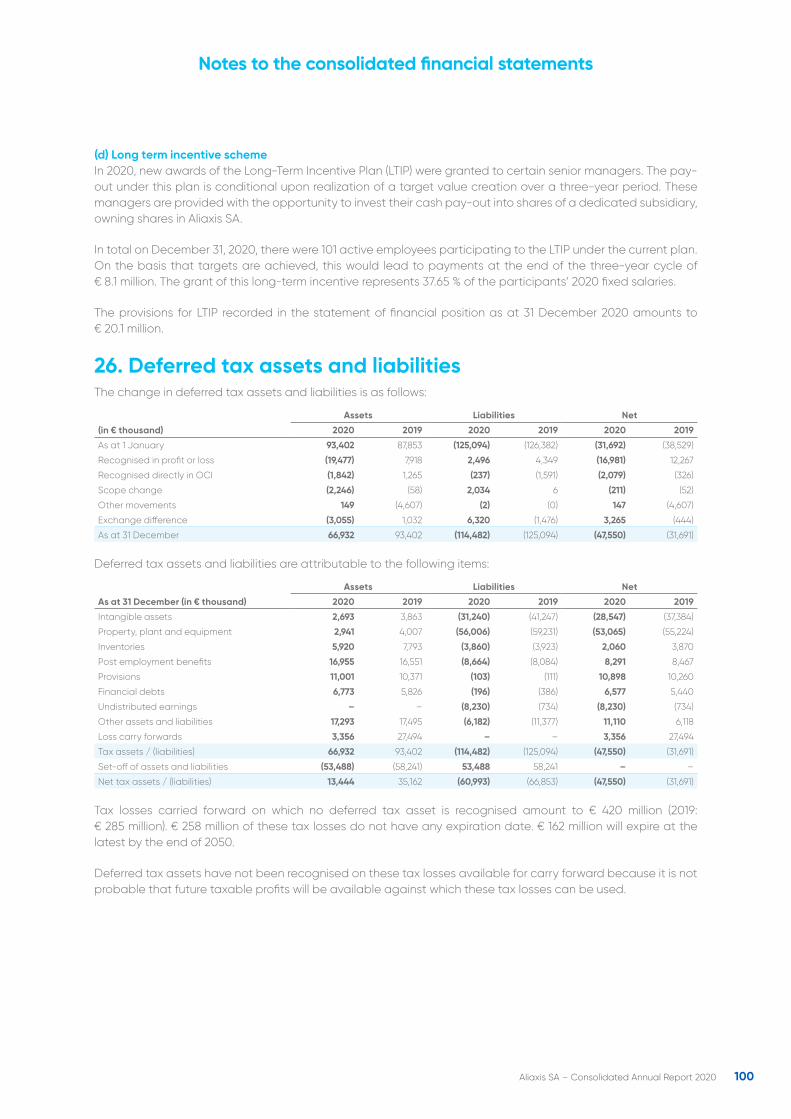
100Aliaxis SA – Consolidated Annual Report 2020
(d) Long term incentive schemeIn 2020, new awards of the Long-Term Incentive Plan (LTIP) were granted to certain senior managers. The pay-out under this plan is conditional upon realization of a target value creation over a three-year period. These managers are provided with the opportunity to invest their cash pay-out into shares of a dedicated subsidiary, owning shares in Aliaxis SA.
In total on December 31, 2020, there were 101 active employees participating to the LTIP under the current plan. On the basis that targets are achieved, this would lead to payments at the end of the three-year cycle of € 8.1 million. The grant of this long-term incentive represents 37.65 % of the participants’ 2020 fixed salaries.
The provisions for LTIP recorded in the statement of financial position as at 31 December 2020 amounts to € 20.1 million.
26. Deferred tax assets and liabilitiesThe change in deferred tax assets and liabilities is as follows:
Assets Liabilities Net
(in € thousand) 2020 2019 2020 2019 2020 2019
As at 1 January 93,402 87,853 (125,094) (126,382) (31,692) (38,529)
Recognised in profit or loss (19,477) 7,918 2,496 4,349 (16,981) 12,267
Recognised directly in OCI (1,842) 1,265 (237) (1,591) (2,079) (326)
Scope change (2,246) (58) 2,034 6 (211) (52)
Other movements 149 (4,607) (2) (0) 147 (4,607)
Exchange difference (3,055) 1,032 6,320 (1,476) 3,265 (444)
As at 31 December 66,932 93,402 (114,482) (125,094) (47,550) (31,691)
Deferred tax assets and liabilities are attributable to the following items:
Assets Liabilities Net
As at 31 December (in € thousand) 2020 2019 2020 2019 2020 2019
Intangible assets 2,693 3,863 (31,240) (41,247) (28,547) (37,384)
Property, plant and equipment 2,941 4,007 (56,006) (59,231) (53,065) (55,224)
Inventories 5,920 7,793 (3,860) (3,923) 2,060 3,870
Post employment benefits 16,955 16,551 (8,664) (8,084) 8,291 8,467
Provisions 11,001 10,371 (103) (111) 10,898 10,260
Financial debts 6,773 5,826 (196) (386) 6,577 5,440
Undistributed earnings – – (8,230) (734) (8,230) (734)
Other assets and liabilities 17,293 17,495 (6,182) (11,377) 11,110 6,118
Loss carry forwards 3,356 27,494 – – 3,356 27,494
Tax assets / (liabilities) 66,932 93,402 (114,482) (125,094) (47,550) (31,691)
Set-off of assets and liabilities (53,488) (58,241) 53,488 58,241 – –
Net tax assets / (liabilities) 13,444 35,162 (60,993) (66,853) (47,550) (31,691)
Tax losses carried forward on which no deferred tax asset is recognised amount to € 420 million (2019: € 285 million). € 258 million of these tax losses do not have any expiration date. € 162 million will expire at the latest by the end of 2050.
Deferred tax assets have not been recognised on these tax losses available for carry forward because it is not probable that future taxable profits will be available against which these tax losses can be used.
Notes to the consolidated financial statements
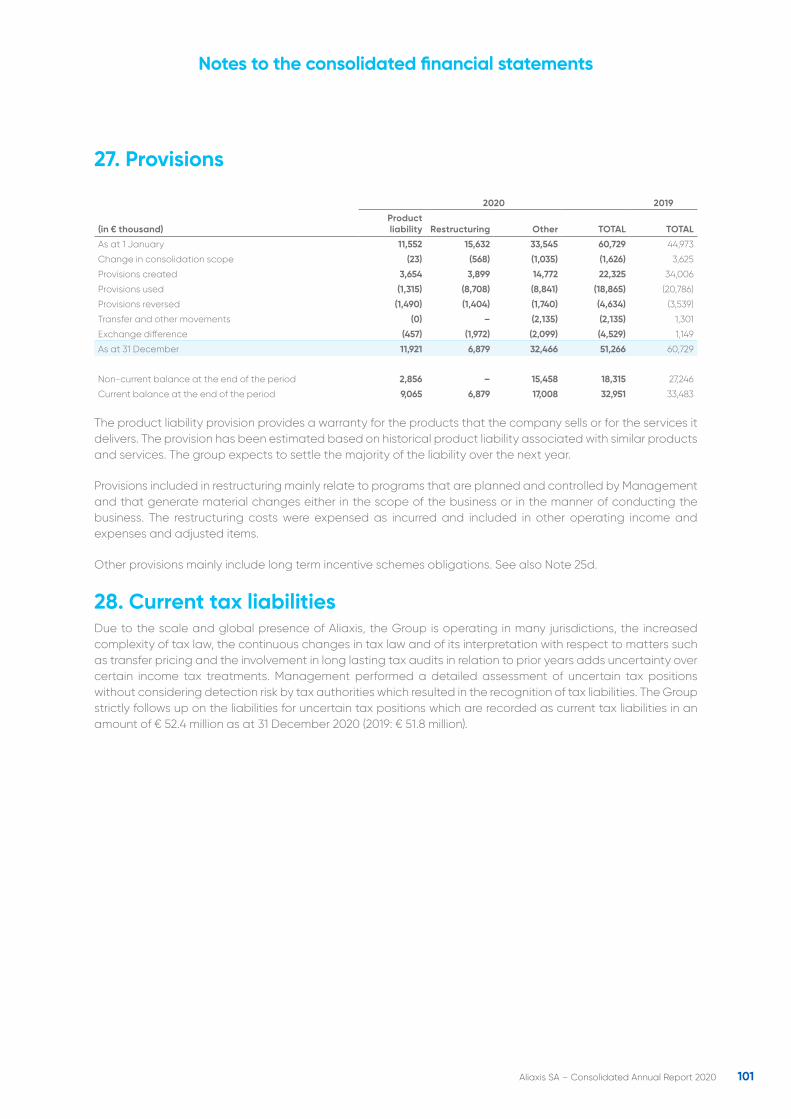
101Aliaxis SA – Consolidated Annual Report 2020
27. Provisions
2020 2019
(in € thousand)Product liability Restructuring Other TOTAL TOTAL
As at 1 January 11,552 15,632 33,545 60,729 44,973
Change in consolidation scope (23) (568) (1,035) (1,626) 3,625
Provisions created 3,654 3,899 14,772 22,325 34,006
Provisions used (1,315) (8,708) (8,841) (18,865) (20,786)
Provisions reversed (1,490) (1,404) (1,740) (4,634) (3,539)
Transfer and other movements (0) – (2,135) (2,135) 1,301
Exchange difference (457) (1,972) (2,099) (4,529) 1,149
As at 31 December 11,921 6,879 32,466 51,266 60,729
Non-current balance at the end of the period 2,856 – 15,458 18,315 27,246
Current balance at the end of the period 9,065 6,879 17,008 32,951 33,483
The product liability provision provides a warranty for the products that the company sells or for the services it delivers. The provision has been estimated based on historical product liability associated with similar products and services. The group expects to settle the majority of the liability over the next year.
Provisions included in restructuring mainly relate to programs that are planned and controlled by Management and that generate material changes either in the scope of the business or in the manner of conducting the business. The restructuring costs were expensed as incurred and included in other operating income and expenses and adjusted items.
Other provisions mainly include long term incentive schemes obligations. See also Note 25d.
28. Current tax liabilitiesDue to the scale and global presence of Aliaxis, the Group is operating in many jurisdictions, the increased complexity of tax law, the continuous changes in tax law and of its interpretation with respect to matters such as transfer pricing and the involvement in long lasting tax audits in relation to prior years adds uncertainty over certain income tax treatments. Management performed a detailed assessment of uncertain tax positions without considering detection risk by tax authorities which resulted in the recognition of tax liabilities. The Group strictly follows up on the liabilities for uncertain tax positions which are recorded as current tax liabilities in an amount of € 52.4 million as at 31 December 2020 (2019: € 51.8 million).
Notes to the consolidated financial statements
102Aliaxis SA – Consolidated Annual Report 2020
29. Amounts payable(a) Non-current other amounts payableAs at 31 December (in € thousand) 2020 2019
Other 2,471 19,053
Other amounts payable 2,471 19,053
(b) Current amounts payableInformation about the Group exposure to currency and liquidity risk is included in Note 30.
As at 31 December (in € thousand) 2020 2019
Trade payables 286,856 284,879
Payroll and social security payable 113,263 101,780
Taxes (other than income tax) payables 17,826 11,222
Interest payable 7,801 12,451
Other payables 24,876 32,175
Amounts payable 450,622 442,509
The minority shareholders of Ashirvad Pipes Pvt. Ltd. exercised their put option in 2018 and the Group acquired in July a further 37% stake in Ashirvad Pipes Pvt Ltd in addition to its 60% stake. Aliaxis agreed to purchase the remaining 3% over a three-year period (settlement of 1/3rd every year) and recorded in this respect a payable of € 50 million reported as Other Payables in 2018. In 2020, 1% of the remaining 3% was paid and amounted to € 16.4 million.
Notes to the consolidated financial statements
103Aliaxis SA – Consolidated Annual Report 2020
30. Financial instruments(a) Currency riskExposure
Currency risk arises from transactions and financial instruments that are denominated in a currency other than the functional currency in which they are measured.
The Group’s most significant exposure to foreign currency risk arises from trade sales and purchases denominated in USD, and from the USD denominated Private Placement notes.
To mitigate the Group’s exposure to foreign exchange currency risk, cross currency swaps and foreign exchange forward contracts are entered into in accordance with the Group’s risk policy.
The following table sets out the Group’s total exposure to major foreign currency risk, based on notional amounts, and the net FX exposure for those currencies.
31 December 2020 31 December 2019
(in thousand of currency) EUR USD CAD GBP AUD NZD EUR USD CAD GBP AUD NZD
Trade and other receivables 9,260 91,854 319 2,790 2,109 303 7,955 110,127 175 1,992 2,577 460
Other financial assets 6,416 50,482 603 (8) 67 147,298 6,166 58,362 566 61 46 104,751
Trade and other payables (33,617) (122,653) (17,723) (567) (3,764) (1,025) (48,260) (144,256) (5,946) (804) (1,888) (1,177)
Other financial liabilities (518) (342,391) (335) (215,521) (21) (73,608) (129) (363,285) – (68,501) – –
Gross balance sheet exposure (18,460) (322,708) (17,136) (213,306) (1,610) 72,969 (34,269) (339,053) (5,204) (67,251) 735 104,034
Forward FX contracts 1,596 69,002 – 213,750 (50) (73,830) 3,798 77,958 – 65,900 (1,580) (105,100)
Cross currency interest rate swaps (CCRS)
– 258,000 – – – – – 258,000 – – – –
FX options – – – – – – – – – – – –
Net exposure (16,864) 4,294 (17,136) 444 (1,660) (861) (30,471) (3,095) (5,204) (1,351) (845) (1,066)
FX derivatives hedging forecasted trade positions
Forward FX contracts 3,864 8,307 – – – – 12,286 2,713 – – – –
FX options 6,600 – – – – – 17,500 – – – – –
The impact on INR is limited and therefore not included in the table above.
Sensitivity analysisA 10% strengthening of the euro at 31 December against the currencies listed above would have increased (decreased) equity and profit or loss by the amounts shown below. This analysis assumes that all other variables, in particular interest rates, remain constant. A 10% weakening of the euro against those same currencies would have had the equal but opposite effect.
The exchange impact on the net exposure is reflected in profit or loss as shown in the following table. The exchange impact on Items that are hedge accounting compliant is reflected in equity.
2020 2019
(in € thousand) EUR USD CAD GBP AUD NZD EUR USD CAD GBP AUD NZD
Equity (116) (652) – 1,423 – – (1,297) (220) – 1,504 – –
Profit or loss 1,504 (318) 996 (45) 95 46 2,368 250 324 144 48 58
Notes to the consolidated financial statements
104Aliaxis SA – Consolidated Annual Report 2020
(b) Credit riskThe carrying amount of financial assets represents the maximum credit exposure. The maximum exposure to credit risk at the reporting date was:
2020 2019
(in € thousand) Carrying amount
Other non-current assets 16,432 17,247
Current amounts receivable 318,324 356,049
Forward exchange contracts used for hedging 4,979 94
CCRS 36,978 50,309
Cash and cash equivalents 642,747 486,143
Total 1,019,460 909,842
The maximum exposure to credit risk for trade receivables at the reporting date by geographic region was:
2020 2019
(in € thousand) Carrying amount
Eurozone countries 80,378 71,180
United Kingdom 20,027 18,206
United States 43,222 70,176
Canada 17,371 9,489
New Zealand and Australia 49,202 49,680
Latin America 43,975 53,023
India 18,145 25,992
Other regions 16,848 21,569
Total 289,167 319,315
The ageing of trade receivables at the reporting date was:
2020 2019
(in € thousand) Gross Impairment Gross Impairment
Not past due 224,829 299 242,924 318
Past due 0 – 30 days 41,368 171 50,135 150
Past due 31 – 90 days 14,175 1,184 19,649 502
Past due 91 – 365 days 9,752 1,419 9,275 1,759
Past due more than one year 13,991 11,874 14,187 14,126
Total 304,115 14,948 336,170 16,855
The movement of impairment in respect of trade receivables during the year was as follows:
(in € thousand) 2020 2019
As at 1 January 16,855 16,163
Change in the consolidation scope (475) 16
Recognised 5,053 3,622
Used (4,186) (2,558)
Reversed (758) (1,184)
Transfer to assets held for sales – 302
Exchange difference (1,542) 493
Total 14,948 16,855
The Group believes that the unimpaired amounts that are past due by more than 30 days are still collectable, based on historical payment behaviour and analysis of customer credit risk.
Notes to the consolidated financial statements
105Aliaxis SA – Consolidated Annual Report 2020
(c) Commodity riskAt 31 December 2020, the Group had no outstanding commodity hedging contracts.
(d) Interest rate riskAt the reporting date, around 72% of the gross financial debt (excluding leases) were at floating rates, whereas around 16% of the net financial debt (financial assets deducted) were at floating rates.
Sensitivity to interest rate variationsA change of 25 basis points in interest rates at the reporting date would have increased (respectively decreased) equity and profit or loss by the amounts shown below. This analysis assumes that all other variables, in particular foreign currency rates, remain constant.
The analysis was performed on the same basis as in 2019. Due to extremely low interest rates prevailing in markets at the reporting date, a variation of 25 basis points only was assumed (25 basis points in 2019).
2020 2019
Profit or loss Equity Profit or loss Equity
As at 31 December (in € thousand)
25 bp increase
25 bp decrease
25 bp increase
25 bp decrease
25 bp increase
25 bp decrease
25 bp increase
25 bp decrease
Variable rate instruments (131) 131 – – (854) 854 – –
Interest rate derivatives 2 (2) – – 4 (4) – –
Cash flow sensitivity (net) (129) 129 – – (850) 850 – –
2020 2019
Profit or loss Equity Profit or loss Equity
As at 31 December (in € thousand)
25 bp increase
25 bp decrease
25 bp increase
25 bp decrease
25 bp increase
25 bp decrease
25 bp increase
25 bp decrease
Fixed rate instruments 292 (294) – – 557 (562) – –
Interest rate derivatives (486) 487 (16) 16 (752) 756 (71) 71
Fair value sensitivity (net) (193) 193 (16) 16 (195) 194 (71) 71
Notes to the consolidated financial statements
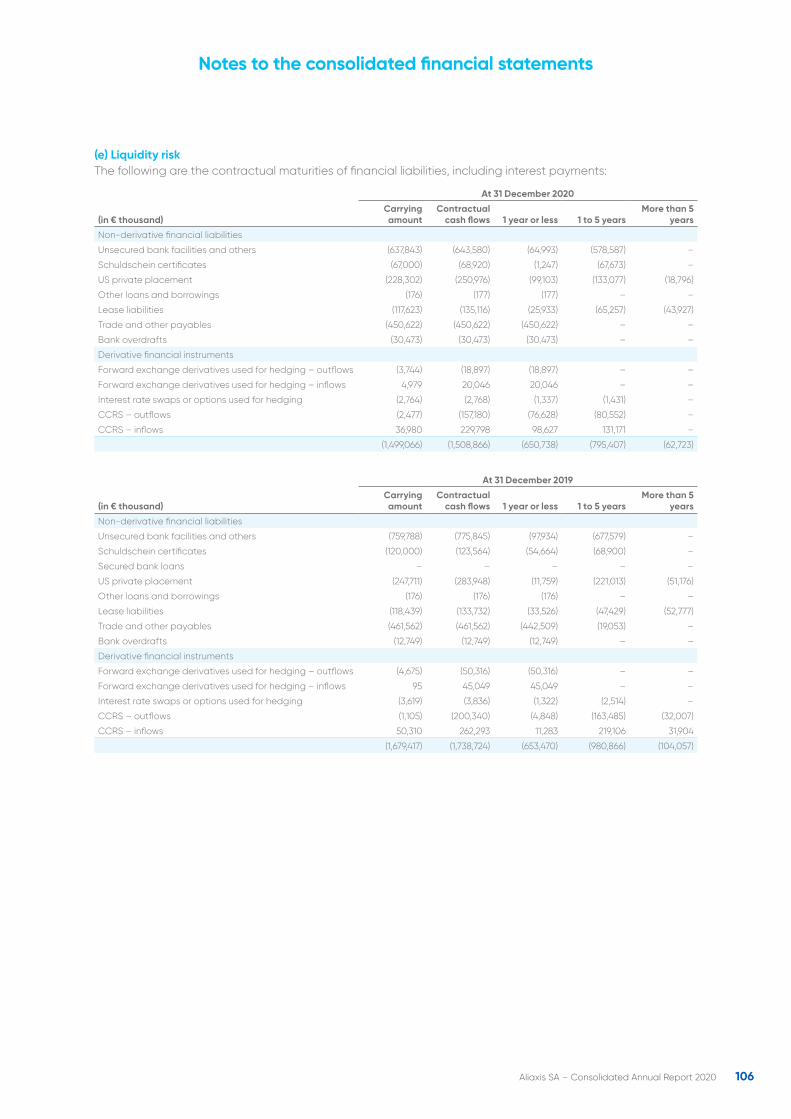
106Aliaxis SA – Consolidated Annual Report 2020
(e) Liquidity riskThe following are the contractual maturities of financial liabilities, including interest payments:
At 31 December 2020
(in € thousand)Carrying amount
Contractual cash flows 1 year or less 1 to 5 years
More than 5 years
Non-derivative financial liabilities
Unsecured bank facilities and others (637,843) (643,580) (64,993) (578,587) –
Schuldschein certificates (67,000) (68,920) (1,247) (67,673) –
US private placement (228,302) (250,976) (99,103) (133,077) (18,796)
Other loans and borrowings (176) (177) (177) – –
Lease liabilities (117,623) (135,116) (25,933) (65,257) (43,927)
Trade and other payables (450,622) (450,622) (450,622) – –
Bank overdrafts (30,473) (30,473) (30,473) – –
Derivative financial instruments
Forward exchange derivatives used for hedging – outflows (3,744) (18,897) (18,897) – –
Forward exchange derivatives used for hedging – inflows 4,979 20,046 20,046 – –
Interest rate swaps or options used for hedging (2,764) (2,768) (1,337) (1,431) –
CCRS – outflows (2,477) (157,180) (76,628) (80,552) –
CCRS – inflows 36,980 229,798 98,627 131,171 –
(1,499,066) (1,508,866) (650,738) (795,407) (62,723)
At 31 December 2019
(in € thousand)Carrying amount
Contractual cash flows 1 year or less 1 to 5 years
More than 5 years
Non-derivative financial liabilities
Unsecured bank facilities and others (759,788) (775,845) (97,934) (677,579) –
Schuldschein certificates (120,000) (123,564) (54,664) (68,900) –
Secured bank loans – – – – –
US private placement (247,711) (283,948) (11,759) (221,013) (51,176)
Other loans and borrowings (176) (176) (176) – –
Lease liabilities (118,439) (133,732) (33,526) (47,429) (52,777)
Trade and other payables (461,562) (461,562) (442,509) (19,053) –
Bank overdrafts (12,749) (12,749) (12,749) – –
Derivative financial instruments
Forward exchange derivatives used for hedging – outflows (4,675) (50,316) (50,316) – –
Forward exchange derivatives used for hedging – inflows 95 45,049 45,049 – –
Interest rate swaps or options used for hedging (3,619) (3,836) (1,322) (2,514) –
CCRS – outflows (1,105) (200,340) (4,848) (163,485) (32,007)
CCRS – inflows 50,310 262,293 11,283 219,106 31,904
(1,679,417) (1,738,724) (653,470) (980,866) (104,057)
Notes to the consolidated financial statements
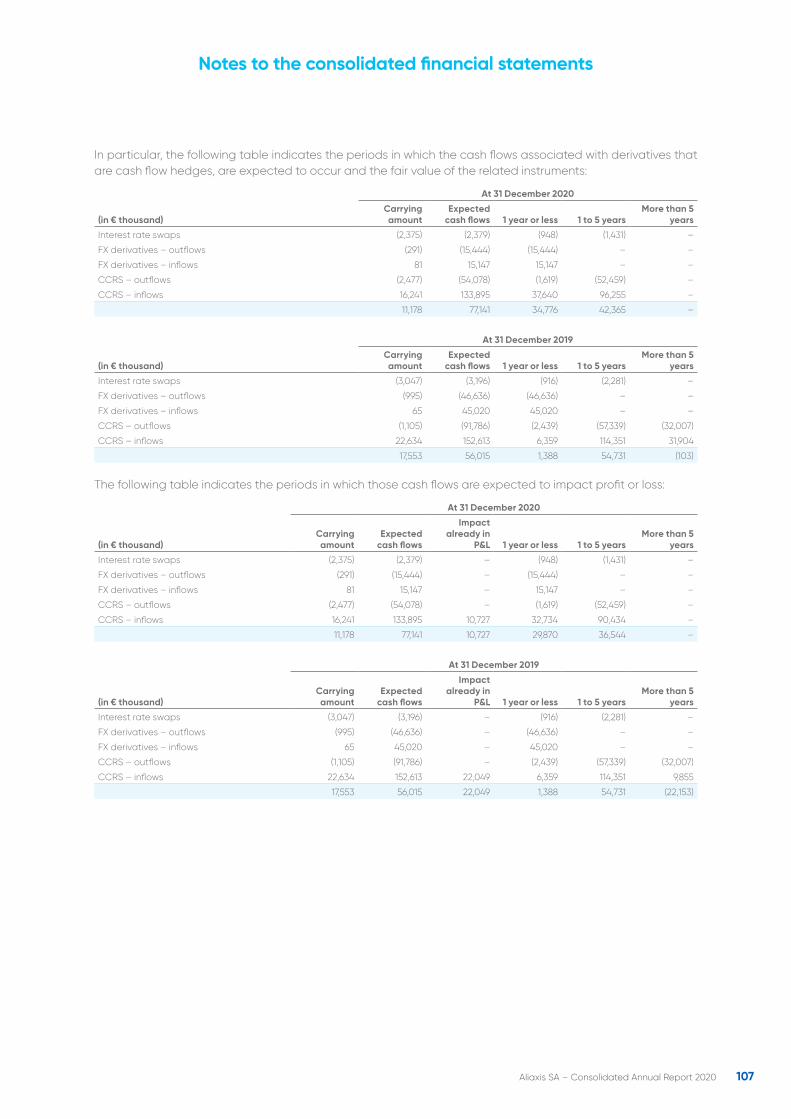
107Aliaxis SA – Consolidated Annual Report 2020
In particular, the following table indicates the periods in which the cash flows associated with derivatives that are cash flow hedges, are expected to occur and the fair value of the related instruments:
At 31 December 2020
(in € thousand)Carrying amount
Expected cash flows 1 year or less 1 to 5 years
More than 5 years
Interest rate swaps (2,375) (2,379) (948) (1,431) –
FX derivatives – outflows (291) (15,444) (15,444) – –
FX derivatives – inflows 81 15,147 15,147 – –
CCRS – outflows (2,477) (54,078) (1,619) (52,459) –
CCRS – inflows 16,241 133,895 37,640 96,255 –
11,178 77,141 34,776 42,365 –
At 31 December 2019
(in € thousand)Carrying amount
Expected cash flows 1 year or less 1 to 5 years
More than 5 years
Interest rate swaps (3,047) (3,196) (916) (2,281) –
FX derivatives – outflows (995) (46,636) (46,636) – –
FX derivatives – inflows 65 45,020 45,020 – –
CCRS – outflows (1,105) (91,786) (2,439) (57,339) (32,007)
CCRS – inflows 22,634 152,613 6,359 114,351 31,904
17,553 56,015 1,388 54,731 (103)
The following table indicates the periods in which those cash flows are expected to impact profit or loss:
At 31 December 2020
(in € thousand)Carrying amount
Expected cash flows
Impact already in
P&L 1 year or less 1 to 5 yearsMore than 5
years
Interest rate swaps (2,375) (2,379) – (948) (1,431) –
FX derivatives – outflows (291) (15,444) – (15,444) – –
FX derivatives – inflows 81 15,147 – 15,147 – –
CCRS – outflows (2,477) (54,078) – (1,619) (52,459) –
CCRS – inflows 16,241 133,895 10,727 32,734 90,434 –
11,178 77,141 10,727 29,870 36,544 –
At 31 December 2019
(in € thousand)Carrying amount
Expected cash flows
Impact already in
P&L 1 year or less 1 to 5 yearsMore than 5
years
Interest rate swaps (3,047) (3,196) – (916) (2,281) –
FX derivatives – outflows (995) (46,636) – (46,636) – –
FX derivatives – inflows 65 45,020 – 45,020 – –
CCRS – outflows (1,105) (91,786) – (2,439) (57,339) (32,007)
CCRS – inflows 22,634 152,613 22,049 6,359 114,351 9,855
17,553 56,015 22,049 1,388 54,731 (22,153)
Notes to the consolidated financial statements
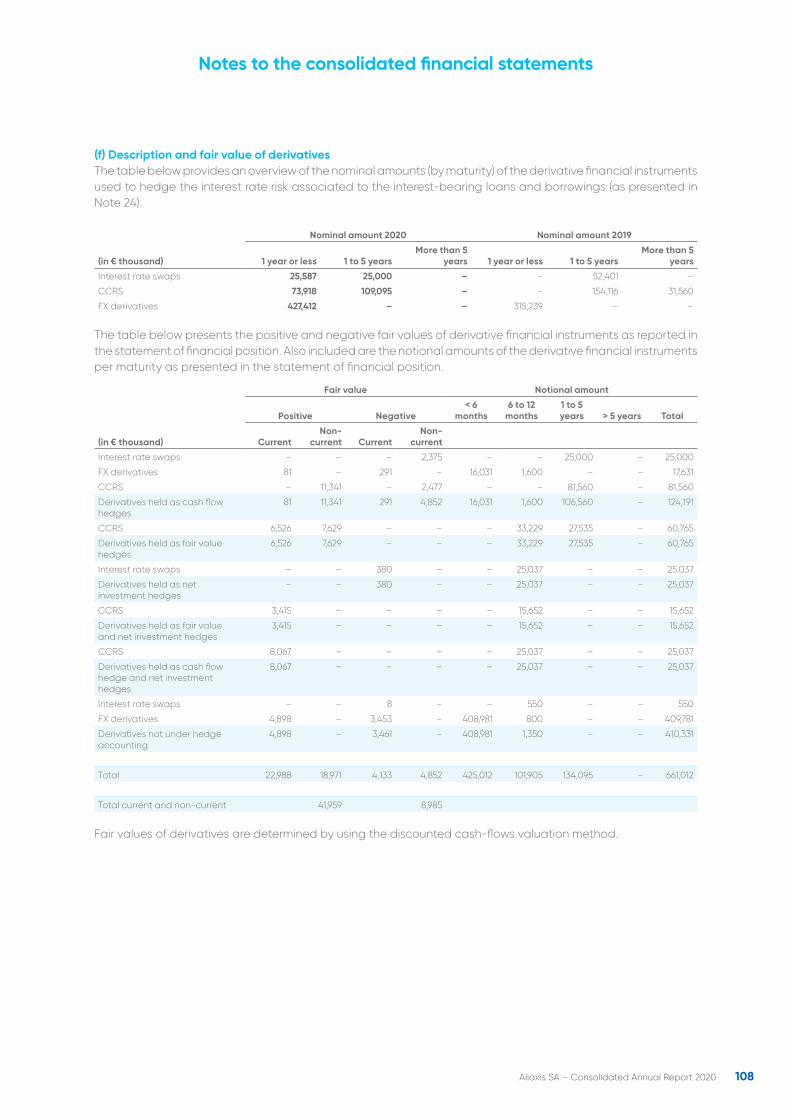
108Aliaxis SA – Consolidated Annual Report 2020
(f) Description and fair value of derivativesThe table below provides an overview of the nominal amounts (by maturity) of the derivative financial instruments used to hedge the interest rate risk associated to the interest-bearing loans and borrowings (as presented in Note 24).
Nominal amount 2020 Nominal amount 2019
(in € thousand) 1 year or less 1 to 5 yearsMore than 5
years 1 year or less 1 to 5 yearsMore than 5
years
Interest rate swaps 25,587 25,000 – – 52,401 –
CCRS 73,918 109,095 – – 154,116 31,560
FX derivatives 427,412 – – 315,239 – –
The table below presents the positive and negative fair values of derivative financial instruments as reported in the statement of financial position. Also included are the notional amounts of the derivative financial instruments per maturity as presented in the statement of financial position.
Fair value Notional amount
Positive Negative< 6
months6 to 12
months1 to 5 years > 5 years Total
(in € thousand) CurrentNon-
current CurrentNon-
current
Interest rate swaps – – – 2,375 – – 25,000 – 25,000
FX derivatives 81 – 291 – 16,031 1,600 – – 17,631
CCRS – 11,341 – 2,477 – – 81,560 – 81,560
Derivatives held as cash flow hedges
81 11,341 291 4,852 16,031 1,600 106,560 – 124,191
CCRS 6,526 7,629 – – – 33,229 27,535 – 60,765
Derivatives held as fair value hedges
6,526 7,629 – – – 33,229 27,535 – 60,765
Interest rate swaps – – 380 – – 25,037 – – 25,037
Derivatives held as net investment hedges
– – 380 – – 25,037 – – 25,037
CCRS 3,415 – – – – 15,652 – – 15,652
Derivatives held as fair value and net investment hedges
3,415 – – – – 15,652 – – 15,652
CCRS 8,067 – – – – 25,037 – – 25,037
Derivatives held as cash flow hedge and net investment hedges
8,067 – – – – 25,037 – – 25,037
Interest rate swaps – – 8 – – 550 – – 550
FX derivatives 4,898 – 3,453 – 408,981 800 – – 409,781
Derivatives not under hedge accounting
4,898 – 3,461 – 408,981 1,350 – – 410,331
Total 22,988 18,971 4,133 4,852 425,012 101,905 134,095 – 661,012
Total current and non-current 41,959 8,985
Fair values of derivatives are determined by using the discounted cash-flows valuation method.
Notes to the consolidated financial statements
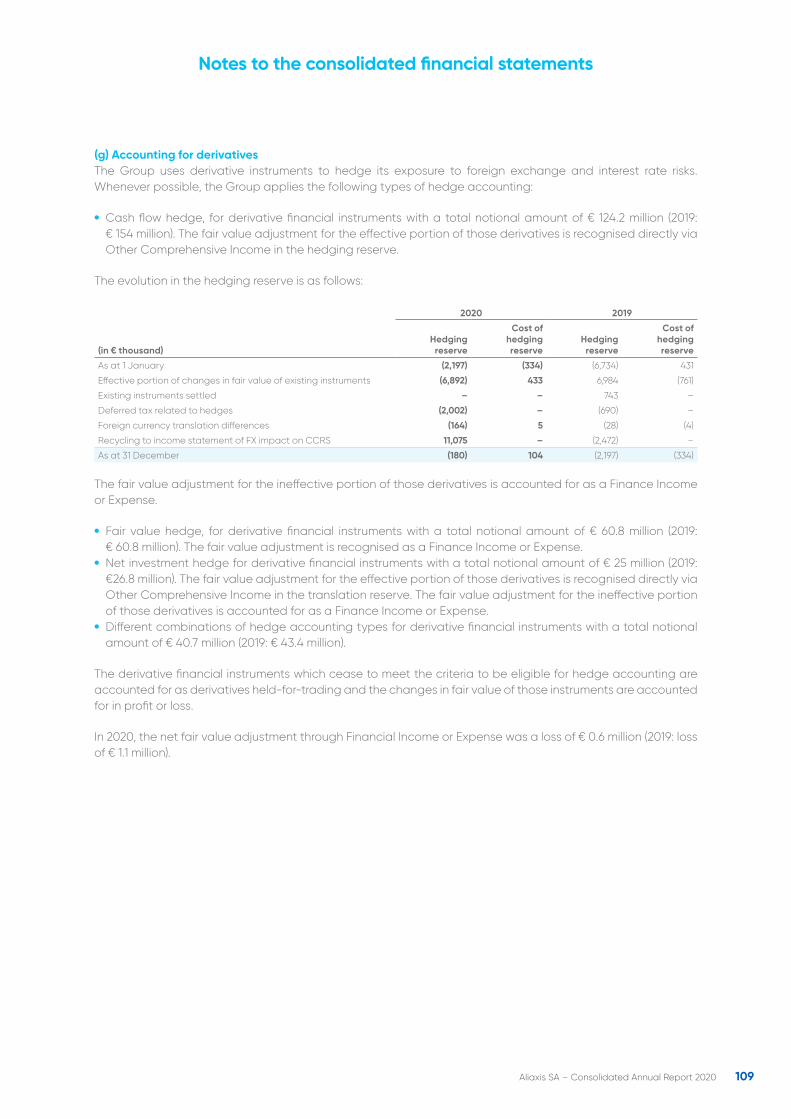
109Aliaxis SA – Consolidated Annual Report 2020
(g) Accounting for derivativesThe Group uses derivative instruments to hedge its exposure to foreign exchange and interest rate risks. Whenever possible, the Group applies the following types of hedge accounting:
• Cash flow hedge, for derivative financial instruments with a total notional amount of € 124.2 million (2019: € 154 million). The fair value adjustment for the effective portion of those derivatives is recognised directly via Other Comprehensive Income in the hedging reserve.
The evolution in the hedging reserve is as follows:
2020 2019
(in € thousand)Hedging
reserve
Cost of hedging reserve
Hedging reserve
Cost of hedging reserve
As at 1 January (2,197) (334) (6,734) 431
Effective portion of changes in fair value of existing instruments (6,892) 433 6,984 (761)
Existing instruments settled – – 743 –
Deferred tax related to hedges (2,002) – (690) –
Foreign currency translation differences (164) 5 (28) (4)
Recycling to income statement of FX impact on CCRS 11,075 – (2,472) –
As at 31 December (180) 104 (2,197) (334)
The fair value adjustment for the ineffective portion of those derivatives is accounted for as a Finance Income or Expense.
• Fair value hedge, for derivative financial instruments with a total notional amount of € 60.8 million (2019: € 60.8 million). The fair value adjustment is recognised as a Finance Income or Expense.
• Net investment hedge for derivative financial instruments with a total notional amount of € 25 million (2019: €26.8 million). The fair value adjustment for the effective portion of those derivatives is recognised directly via Other Comprehensive Income in the translation reserve. The fair value adjustment for the ineffective portion of those derivatives is accounted for as a Finance Income or Expense.
• Different combinations of hedge accounting types for derivative financial instruments with a total notional amount of € 40.7 million (2019: € 43.4 million).
The derivative financial instruments which cease to meet the criteria to be eligible for hedge accounting are accounted for as derivatives held-for-trading and the changes in fair value of those instruments are accounted for in profit or loss.
In 2020, the net fair value adjustment through Financial Income or Expense was a loss of € 0.6 million (2019: loss of € 1.1 million).
Notes to the consolidated financial statements
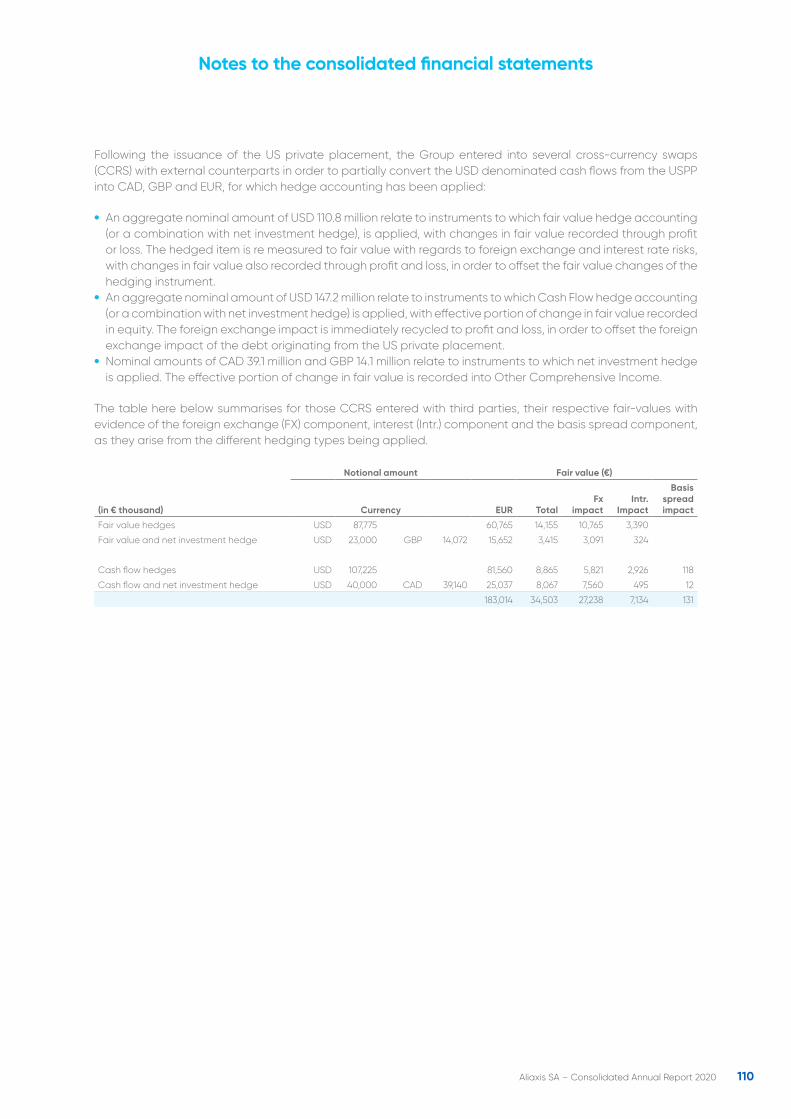
110Aliaxis SA – Consolidated Annual Report 2020
Following the issuance of the US private placement, the Group entered into several cross-currency swaps (CCRS) with external counterparts in order to partially convert the USD denominated cash flows from the USPP into CAD, GBP and EUR, for which hedge accounting has been applied:
• An aggregate nominal amount of USD 110.8 million relate to instruments to which fair value hedge accounting (or a combination with net investment hedge), is applied, with changes in fair value recorded through profit or loss. The hedged item is re measured to fair value with regards to foreign exchange and interest rate risks, with changes in fair value also recorded through profit and loss, in order to offset the fair value changes of the hedging instrument.
• An aggregate nominal amount of USD 147.2 million relate to instruments to which Cash Flow hedge accounting (or a combination with net investment hedge) is applied, with effective portion of change in fair value recorded in equity. The foreign exchange impact is immediately recycled to profit and loss, in order to offset the foreign exchange impact of the debt originating from the US private placement.
• Nominal amounts of CAD 39.1 million and GBP 14.1 million relate to instruments to which net investment hedge is applied. The effective portion of change in fair value is recorded into Other Comprehensive Income.
The table here below summarises for those CCRS entered with third parties, their respective fair-values with evidence of the foreign exchange (FX) component, interest (Intr.) component and the basis spread component, as they arise from the different hedging types being applied.
Notional amount Fair value (€)
(in € thousand) Currency EUR TotalFx
impactIntr.
Impact
Basis spread impact
Fair value hedges USD 87,775 60,765 14,155 10,765 3,390
Fair value and net investment hedge USD 23,000 GBP 14,072 15,652 3,415 3,091 324
Cash flow hedges USD 107,225 81,560 8,865 5,821 2,926 118
Cash flow and net investment hedge USD 40,000 CAD 39,140 25,037 8,067 7,560 495 12
183,014 34,503 27,238 7,134 131
Notes to the consolidated financial statements
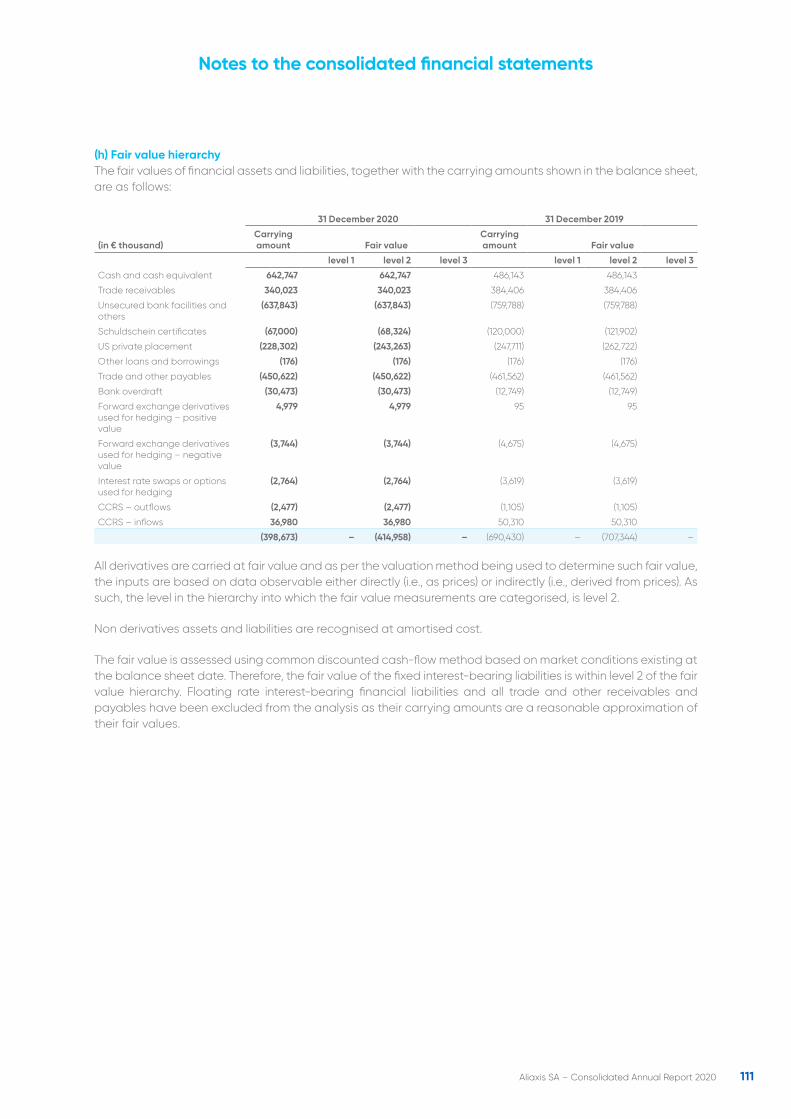
111Aliaxis SA – Consolidated Annual Report 2020
(h) Fair value hierarchy The fair values of financial assets and liabilities, together with the carrying amounts shown in the balance sheet, are as follows:
31 December 2020 31 December 2019
(in € thousand)Carrying amount Fair value
Carrying amount Fair value
level 1 level 2 level 3 level 1 level 2 level 3
Cash and cash equivalent 642,747 642,747 486,143 486,143
Trade receivables 340,023 340,023 384,406 384,406
Unsecured bank facilities and others
(637,843) (637,843) (759,788) (759,788)
Schuldschein certificates (67,000) (68,324) (120,000) (121,902)
US private placement (228,302) (243,263) (247,711) (262,722)
Other loans and borrowings (176) (176) (176) (176)
Trade and other payables (450,622) (450,622) (461,562) (461,562)
Bank overdraft (30,473) (30,473) (12,749) (12,749)
Forward exchange derivatives used for hedging – positive value
4,979 4,979 95 95
Forward exchange derivatives used for hedging – negative value
(3,744) (3,744) (4,675) (4,675)
Interest rate swaps or options used for hedging
(2,764) (2,764) (3,619) (3,619)
CCRS – outflows (2,477) (2,477) (1,105) (1,105)
CCRS – inflows 36,980 36,980 50,310 50,310
(398,673) – (414,958) – (690,430) – (707,344) –
All derivatives are carried at fair value and as per the valuation method being used to determine such fair value, the inputs are based on data observable either directly (i.e., as prices) or indirectly (i.e., derived from prices). As such, the level in the hierarchy into which the fair value measurements are categorised, is level 2.
Non derivatives assets and liabilities are recognised at amortised cost.
The fair value is assessed using common discounted cash-flow method based on market conditions existing at the balance sheet date. Therefore, the fair value of the fixed interest-bearing liabilities is within level 2 of the fair value hierarchy. Floating rate interest-bearing financial liabilities and all trade and other receivables and payables have been excluded from the analysis as their carrying amounts are a reasonable approximation of their fair values.
Notes to the consolidated financial statements
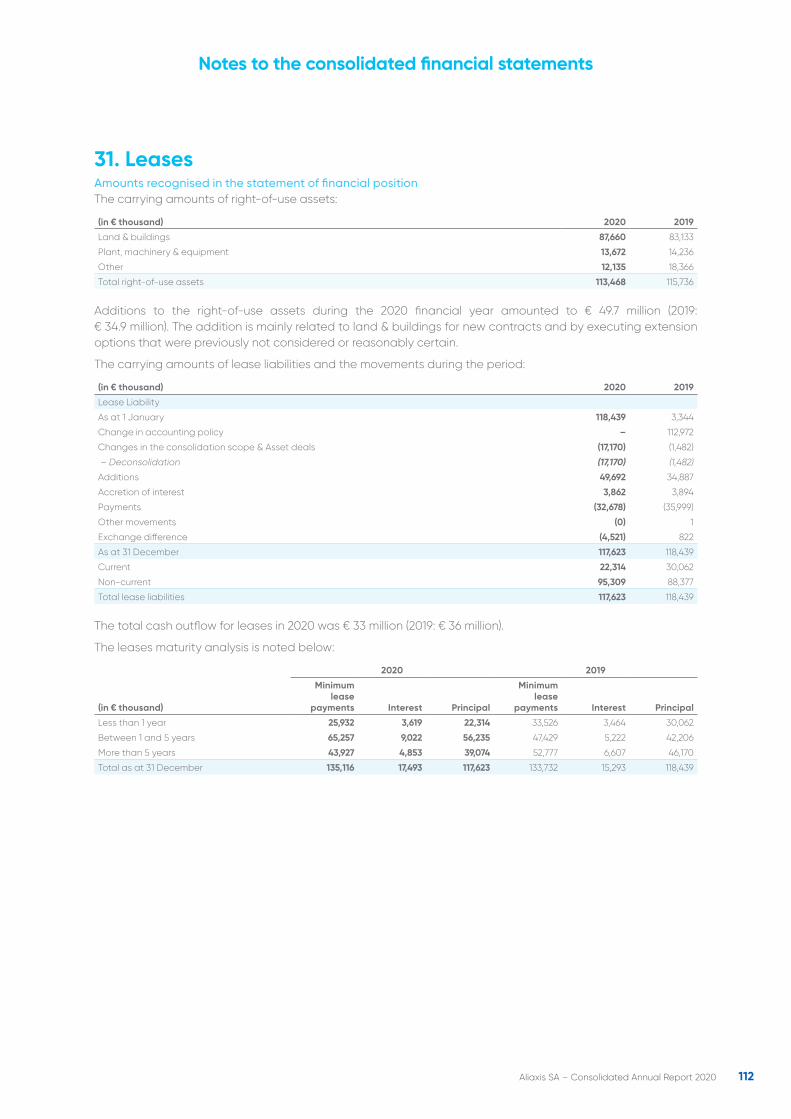
112Aliaxis SA – Consolidated Annual Report 2020
31. LeasesAmounts recognised in the statement of financial positionThe carrying amounts of right-of-use assets:
(in € thousand) 2020 2019
Land & buildings 87,660 83,133
Plant, machinery & equipment 13,672 14,236
Other 12,135 18,366
Total right-of-use assets 113,468 115,736
Additions to the right-of-use assets during the 2020 financial year amounted to € 49.7 million (2019: € 34.9 million). The addition is mainly related to land & buildings for new contracts and by executing extension options that were previously not considered or reasonably certain.
The carrying amounts of lease liabilities and the movements during the period:
(in € thousand) 2020 2019
Lease Liability
As at 1 January 118,439 3,344
Change in accounting policy – 112,972
Changes in the consolidation scope & Asset deals (17,170) (1,482)
– Deconsolidation (17,170) (1,482)
Additions 49,692 34,887
Accretion of interest 3,862 3,894
Payments (32,678) (35,999)
Other movements (0) 1
Exchange difference (4,521) 822
As at 31 December 117,623 118,439
Current 22,314 30,062
Non-current 95,309 88,377
Total lease liabilities 117,623 118,439
The total cash outflow for leases in 2020 was € 33 million (2019: € 36 million).
The leases maturity analysis is noted below:
2020 2019
(in € thousand)
Minimum lease
payments Interest Principal
Minimum lease
payments Interest Principal
Less than 1 year 25,932 3,619 22,314 33,526 3,464 30,062
Between 1 and 5 years 65,257 9,022 56,235 47,429 5,222 42,206
More than 5 years 43,927 4,853 39,074 52,777 6,607 46,170
Total as at 31 December 135,116 17,493 117,623 133,732 15,293 118,439
Notes to the consolidated financial statements
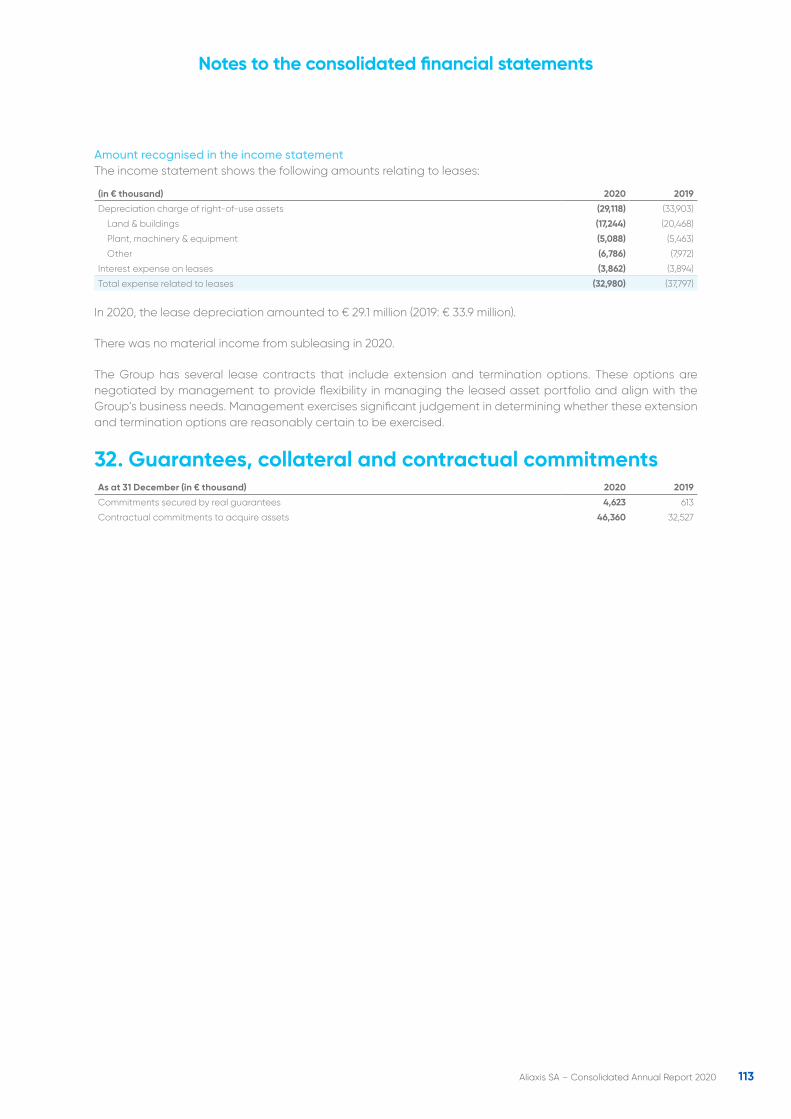
113Aliaxis SA – Consolidated Annual Report 2020
Amount recognised in the income statementThe income statement shows the following amounts relating to leases:
(in € thousand) 2020 2019
Depreciation charge of right-of-use assets (29,118) (33,903)
Land & buildings (17,244) (20,468)
Plant, machinery & equipment (5,088) (5,463)
Other (6,786) (7,972)
Interest expense on leases (3,862) (3,894)
Total expense related to leases (32,980) (37,797)
In 2020, the lease depreciation amounted to € 29.1 million (2019: € 33.9 million).
There was no material income from subleasing in 2020.
The Group has several lease contracts that include extension and termination options. These options are negotiated by management to provide flexibility in managing the leased asset portfolio and align with the Group’s business needs. Management exercises significant judgement in determining whether these extension and termination options are reasonably certain to be exercised.
32. Guarantees, collateral and contractual commitmentsAs at 31 December (in € thousand) 2020 2019
Commitments secured by real guarantees 4,623 613
Contractual commitments to acquire assets 46,360 32,527
Notes to the consolidated financial statements
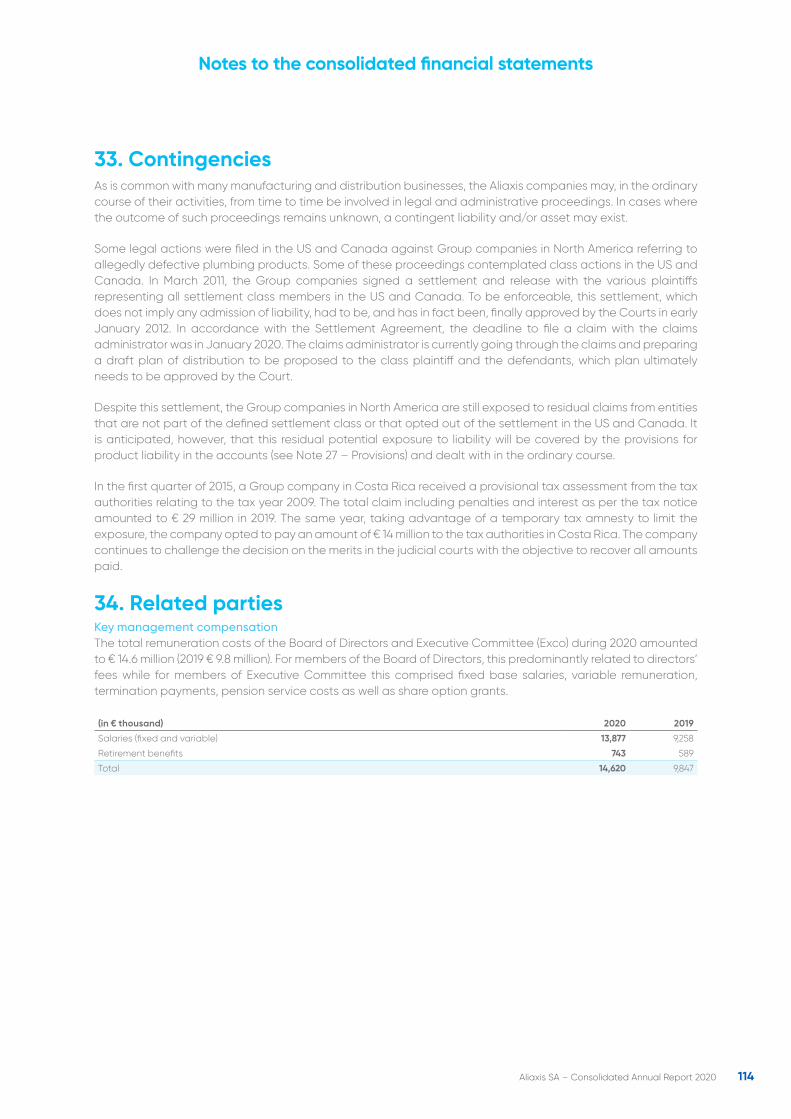
114Aliaxis SA – Consolidated Annual Report 2020
33. ContingenciesAs is common with many manufacturing and distribution businesses, the Aliaxis companies may, in the ordinary course of their activities, from time to time be involved in legal and administrative proceedings. In cases where the outcome of such proceedings remains unknown, a contingent liability and/or asset may exist.
Some legal actions were filed in the US and Canada against Group companies in North America referring to allegedly defective plumbing products. Some of these proceedings contemplated class actions in the US and Canada. In March 2011, the Group companies signed a settlement and release with the various plaintiffs representing all settlement class members in the US and Canada. To be enforceable, this settlement, which does not imply any admission of liability, had to be, and has in fact been, finally approved by the Courts in early January 2012. In accordance with the Settlement Agreement, the deadline to file a claim with the claims administrator was in January 2020. The claims administrator is currently going through the claims and preparing a draft plan of distribution to be proposed to the class plaintiff and the defendants, which plan ultimately needs to be approved by the Court.
Despite this settlement, the Group companies in North America are still exposed to residual claims from entities that are not part of the defined settlement class or that opted out of the settlement in the US and Canada. It is anticipated, however, that this residual potential exposure to liability will be covered by the provisions for product liability in the accounts (see Note 27 – Provisions) and dealt with in the ordinary course.
In the first quarter of 2015, a Group company in Costa Rica received a provisional tax assessment from the tax authorities relating to the tax year 2009. The total claim including penalties and interest as per the tax notice amounted to € 29 million in 2019. The same year, taking advantage of a temporary tax amnesty to limit the exposure, the company opted to pay an amount of € 14 million to the tax authorities in Costa Rica. The company continues to challenge the decision on the merits in the judicial courts with the objective to recover all amounts paid.
34. Related partiesKey management compensationThe total remuneration costs of the Board of Directors and Executive Committee (Exco) during 2020 amounted to € 14.6 million (2019 € 9.8 million). For members of the Board of Directors, this predominantly related to directors’ fees while for members of Executive Committee this comprised fixed base salaries, variable remuneration, termination payments, pension service costs as well as share option grants.
(in € thousand) 2020 2019
Salaries (fixed and variable) 13,877 9,258
Retirement benefits 743 589
Total 14,620 9,847
Notes to the consolidated financial statements
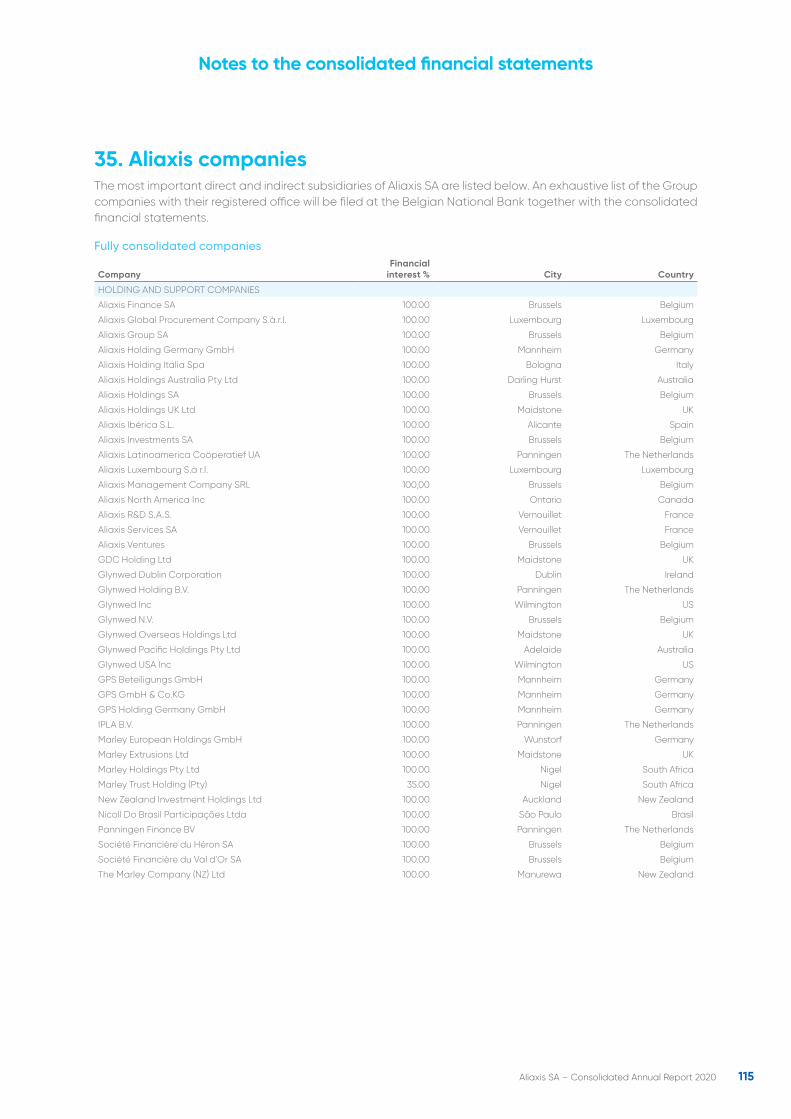
115Aliaxis SA – Consolidated Annual Report 2020
35. Aliaxis companiesThe most important direct and indirect subsidiaries of Aliaxis SA are listed below. An exhaustive list of the Group companies with their registered office will be filed at the Belgian National Bank together with the consolidated financial statements.
Fully consolidated companies
CompanyFinancial
interest % City Country
HOLDING AND SUPPORT COMPANIES
Aliaxis Finance SA 100.00 Brussels Belgium
Aliaxis Global Procurement Company S.à.r.l. 100.00 Luxembourg Luxembourg
Aliaxis Group SA 100.00 Brussels Belgium
Aliaxis Holding Germany GmbH 100.00 Mannheim Germany
Aliaxis Holding Italia Spa 100.00 Bologna Italy
Aliaxis Holdings Australia Pty Ltd 100.00 Darling Hurst Australia
Aliaxis Holdings SA 100.00 Brussels Belgium
Aliaxis Holdings UK Ltd 100.00 Maidstone UK
Aliaxis Ibérica S.L. 100.00 Alicante Spain
Aliaxis Investments SA 100.00 Brussels Belgium
Aliaxis Latinoamerica Coöperatief UA 100.00 Panningen The Netherlands
Aliaxis Luxembourg S.à r.l. 100.00 Luxembourg Luxembourg
Aliaxis Management Company SRL 100,00 Brussels Belgium
Aliaxis North America Inc 100.00 Ontario Canada
Aliaxis R&D S.A.S. 100.00 Vernouillet France
Aliaxis Services SA 100.00 Vernouillet France
Aliaxis Ventures 100.00 Brussels Belgium
GDC Holding Ltd 100.00 Maidstone UK
Glynwed Dublin Corporation 100.00 Dublin Ireland
Glynwed Holding B.V. 100.00 Panningen The Netherlands
Glynwed Inc 100.00 Wilmington US
Glynwed N.V. 100.00 Brussels Belgium
Glynwed Overseas Holdings Ltd 100.00 Maidstone UK
Glynwed Pacific Holdings Pty Ltd 100.00 Adelaide Australia
Glynwed USA Inc 100.00 Wilmington US
GPS Beteiligungs GmbH 100.00 Mannheim Germany
GPS GmbH & Co.KG 100.00 Mannheim Germany
GPS Holding Germany GmbH 100.00 Mannheim Germany
IPLA B.V. 100.00 Panningen The Netherlands
Marley European Holdings GmbH 100.00 Wunstorf Germany
Marley Extrusions Ltd 100.00 Maidstone UK
Marley Holdings Pty Ltd 100.00 Nigel South Africa
Marley Trust Holding (Pty) 35.00 Nigel South Africa
New Zealand Investment Holdings Ltd 100.00 Auckland New Zealand
Nicoll Do Brasil Participações Ltda 100.00 São Paulo Brasil
Panningen Finance BV 100.00 Panningen The Netherlands
Société Financière du Héron SA 100.00 Brussels Belgium
Société Financière du Val d'Or SA 100.00 Brussels Belgium
The Marley Company (NZ) Ltd 100.00 Manurewa New Zealand
Notes to the consolidated financial statements
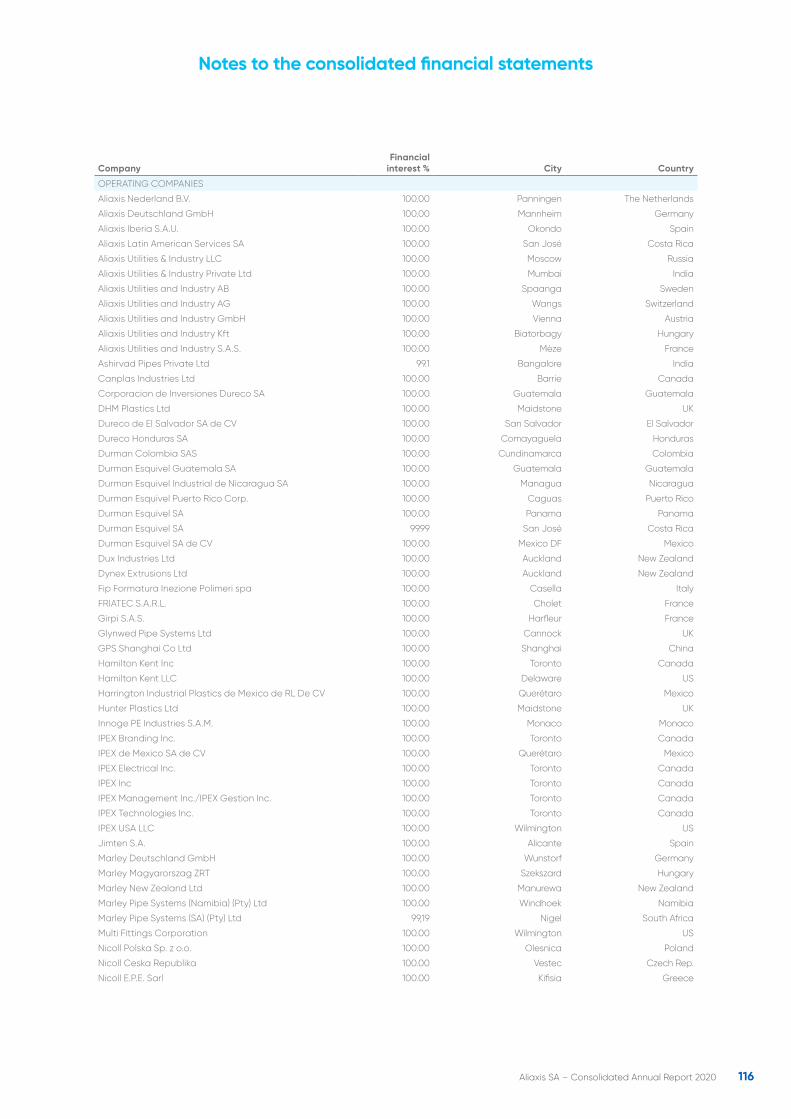
116Aliaxis SA – Consolidated Annual Report 2020
CompanyFinancial
interest % City Country
OPERATING COMPANIES
Aliaxis Nederland B.V. 100.00 Panningen The Netherlands
Aliaxis Deutschland GmbH 100.00 Mannheim Germany
Aliaxis Iberia S.A.U. 100.00 Okondo Spain
Aliaxis Latin American Services SA 100.00 San José Costa Rica
Aliaxis Utilities & Industry LLC 100.00 Moscow Russia
Aliaxis Utilities & Industry Private Ltd 100.00 Mumbai India
Aliaxis Utilities and Industry AB 100.00 Spaanga Sweden
Aliaxis Utilities and Industry AG 100.00 Wangs Switzerland
Aliaxis Utilities and Industry GmbH 100.00 Vienna Austria
Aliaxis Utilities and Industry Kft 100.00 Biatorbagy Hungary
Aliaxis Utilities and Industry S.A.S. 100.00 Mèze France
Ashirvad Pipes Private Ltd 99.1 Bangalore India
Canplas Industries Ltd 100.00 Barrie Canada
Corporacion de Inversiones Dureco SA 100.00 Guatemala Guatemala
DHM Plastics Ltd 100.00 Maidstone UK
Dureco de El Salvador SA de CV 100.00 San Salvador El Salvador
Dureco Honduras SA 100.00 Comayaguela Honduras
Durman Colombia SAS 100.00 Cundinamarca Colombia
Durman Esquivel Guatemala SA 100.00 Guatemala Guatemala
Durman Esquivel Industrial de Nicaragua SA 100.00 Managua Nicaragua
Durman Esquivel Puerto Rico Corp. 100.00 Caguas Puerto Rico
Durman Esquivel SA 100.00 Panama Panama
Durman Esquivel SA 99.99 San José Costa Rica
Durman Esquivel SA de CV 100.00 Mexico DF Mexico
Dux Industries Ltd 100.00 Auckland New Zealand
Dynex Extrusions Ltd 100.00 Auckland New Zealand
Fip Formatura Inezione Polimeri spa 100.00 Casella Italy
FRIATEC S.A.R.L. 100.00 Cholet France
Girpi S.A.S. 100.00 Harfleur France
Glynwed Pipe Systems Ltd 100.00 Cannock UK
GPS Shanghai Co Ltd 100.00 Shanghai China
Hamilton Kent Inc 100.00 Toronto Canada
Hamilton Kent LLC 100.00 Delaware US
Harrington Industrial Plastics de Mexico de RL De CV 100.00 Querétaro Mexico
Hunter Plastics Ltd 100.00 Maidstone UK
Innoge PE Industries S.A.M. 100.00 Monaco Monaco
IPEX Branding Inc. 100.00 Toronto Canada
IPEX de Mexico SA de CV 100.00 Querétaro Mexico
IPEX Electrical Inc. 100.00 Toronto Canada
IPEX Inc 100.00 Toronto Canada
IPEX Management Inc./IPEX Gestion Inc. 100.00 Toronto Canada
IPEX Technologies Inc. 100.00 Toronto Canada
IPEX USA LLC 100.00 Wilmington US
Jimten S.A. 100.00 Alicante Spain
Marley Deutschland GmbH 100.00 Wunstorf Germany
Marley Magyarorszag ZRT 100.00 Szekszard Hungary
Marley New Zealand Ltd 100.00 Manurewa New Zealand
Marley Pipe Systems (Namibia) (Pty) Ltd 100.00 Windhoek Namibia
Marley Pipe Systems (SA) (Pty) Ltd 99,19 Nigel South Africa
Multi Fittings Corporation 100.00 Wilmington US
Nicoll Polska Sp. z o.o. 100.00 Olesnica Poland
Nicoll Ceska Republika 100.00 Vestec Czech Rep.
Nicoll E.P.E. Sarl 100.00 Kifisia Greece
Notes to the consolidated financial statements
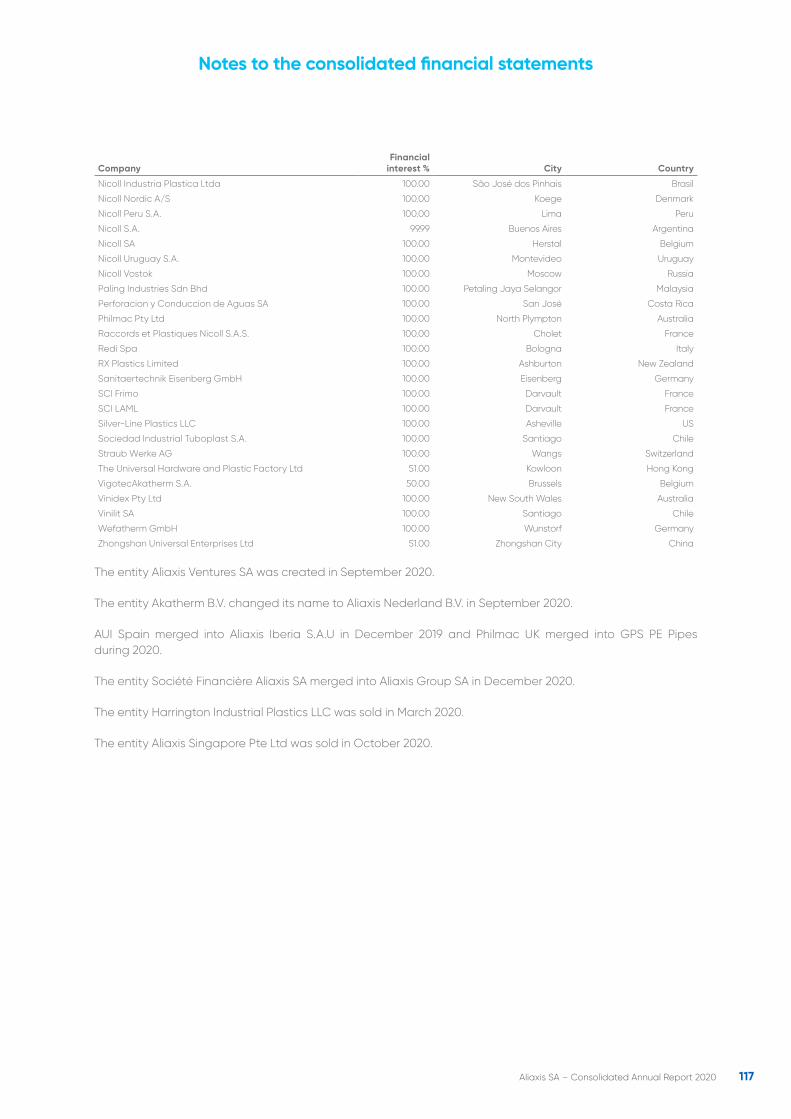
117Aliaxis SA – Consolidated Annual Report 2020
CompanyFinancial
interest % City Country
Nicoll Industria Plastica Ltda 100.00 São José dos Pinhais Brasil
Nicoll Nordic A/S 100.00 Koege Denmark
Nicoll Peru S.A. 100.00 Lima Peru
Nicoll S.A. 99.99 Buenos Aires Argentina
Nicoll SA 100.00 Herstal Belgium
Nicoll Uruguay S.A. 100.00 Montevideo Uruguay
Nicoll Vostok 100.00 Moscow Russia
Paling Industries Sdn Bhd 100.00 Petaling Jaya Selangor Malaysia
Perforacion y Conduccion de Aguas SA 100.00 San José Costa Rica
Philmac Pty Ltd 100.00 North Plympton Australia
Raccords et Plastiques Nicoll S.A.S. 100.00 Cholet France
Redi Spa 100.00 Bologna Italy
RX Plastics Limited 100.00 Ashburton New Zealand
Sanitaertechnik Eisenberg GmbH 100.00 Eisenberg Germany
SCI Frimo 100.00 Darvault France
SCI LAML 100.00 Darvault France
Silver-Line Plastics LLC 100.00 Asheville US
Sociedad Industrial Tuboplast S.A. 100.00 Santiago Chile
Straub Werke AG 100.00 Wangs Switzerland
The Universal Hardware and Plastic Factory Ltd 51.00 Kowloon Hong Kong
VigotecAkatherm S.A. 50.00 Brussels Belgium
Vinidex Pty Ltd 100.00 New South Wales Australia
Vinilit SA 100.00 Santiago Chile
Wefatherm GmbH 100.00 Wunstorf Germany
Zhongshan Universal Enterprises Ltd 51.00 Zhongshan City China
The entity Aliaxis Ventures SA was created in September 2020.
The entity Akatherm B.V. changed its name to Aliaxis Nederland B.V. in September 2020.
AUI Spain merged into Aliaxis Iberia S.A.U in December 2019 and Philmac UK merged into GPS PE Pipes during 2020.
The entity Société Financière Aliaxis SA merged into Aliaxis Group SA in December 2020.
The entity Harrington Industrial Plastics LLC was sold in March 2020.
The entity Aliaxis Singapore Pte Ltd was sold in October 2020.
Notes to the consolidated financial statements
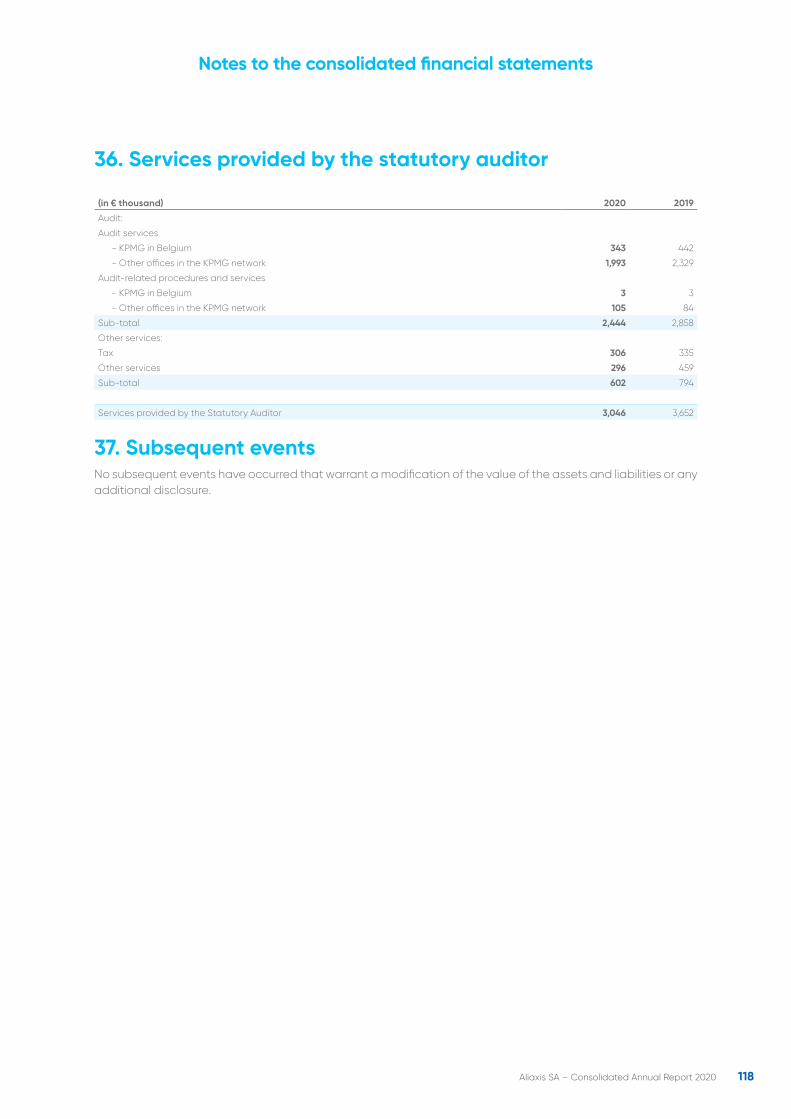
118Aliaxis SA – Consolidated Annual Report 2020
36. Services provided by the statutory auditor
(in € thousand) 2020 2019
Audit:
Audit services
- KPMG in Belgium 343 442
- Other offices in the KPMG network 1,993 2,329
Audit-related procedures and services
- KPMG in Belgium 3 3
- Other offices in the KPMG network 105 84
Sub-total 2,444 2,858
Other services:
Tax 306 335
Other services 296 459
Sub-total 602 794
Services provided by the Statutory Auditor 3,046 3,652
37. Subsequent eventsNo subsequent events have occurred that warrant a modification of the value of the assets and liabilities or any additional disclosure.
Notes to the consolidated financial statements
119Aliaxis SA – Consolidated Annual Report 2020
Auditor’s report
KPMG Bedrijfsrevisoren - KPMG Réviseurs d'Entreprises, a Belgian BV/SRL and a member firm of the KPMG global organization of independent member firms affiliated with KPMG International Limited, a private English company limited by guarantee. All rights reserved. Document Classification: KPMG Public
Zetel - Siège: Luchthaven Brussel Nationaal 1K B-1930 Zaventem
KPMG Bedrijfsrevisoren - KPMG Réviseurs d'Entreprises BV/SRL Ondernemingsnummer / Numéro d’entreprise 0419.122.548 BTW - TVA BE 0419.122.548 RPR Brussel - RPM Bruxelles IBAN : BE 95 0018 4771 0358 BIC : GEBABEBB
Statutory auditor’s report to the general meeting of Aliaxis SA on the consolidated financial statements as of and for the year ended 31 December 2020
In the context of the statutory audit of the consolidated financial statements of Aliaxis SA (“the Company”) and its subsidiaries (jointly “the Group”), we provide you with our statutory auditor’s report. This includes our report on the consolidated financial statements for the year ended 31 December 2020, as well as other legal, regulatory and professional requirements. Our report is one and indivisible. We were appointed as statutory auditor by the general meeting of 23 May 2018, in accordance with the proposal of the board of directors. Our mandate will expire on the date of the general meeting deliberating on the annual accounts for the year ended 31 December 2020. We have performed the statutory audit of the consolidated financial statements of Aliaxis SA for 18 consecutive financial years.
Report on the consolidated financial statements Unqualified opinion We have audited the consolidated financial statements of the Group as of and for the year ended 31 December 2020, prepared in accordance with International Financial Reporting Standards as adopted by the European Union, and with the legal and regulatory requirements applicable in Belgium. These consolidated financial statements comprise the consolidated statement of financial position as at 31 December 2020, the consolidated statements of profit or loss and other comprehensive income, changes in equity and cash flows for the year then ended, and notes, comprising a summary of significant accounting policies and other explanatory information. The total of the consolidated statement of financial position amounts to EUR 3.227.022 (000) and the consolidated statement of profit or loss shows a profit for the year of EUR 199.462 (000). In our opinion, the consolidated financial statements give a true and fair view of the Group’s equity and financial position as at 31 December 2020 and of its consolidated financial performance and its consolidated cash flows for the year then ended in accordance with International Financial Reporting Standards as adopted by the European Union, and with the legal and regulatory requirements applicable in Belgium.
Auditor’s report
120Aliaxis SA – Consolidated Annual Report 2020
Statutory auditor’s report to the general meeting of Aliaxis SA on the consolidated financial statements as of and for the year ended 31 December 2020
Document Classification: KPMG Public 2
Basis for our unqualified opinion We conducted our audit in accordance with International Standards on Auditing (“ISAs”) as adopted in Belgium. In addition, we have applied the ISAs as issued by the IAASB and applicable for the current accounting year while these have not been adopted in Belgium yet. Our responsibilities under those standards are further described in the “Statutory auditors’ responsibility for the audit of the consolidated financial statements” section of our report. We have complied with the ethical requirements that are relevant to our audit of the consolidated financial statements in Belgium, including the independence requirements. We have obtained from the board of directors and the Company’s officials the explanations and information necessary for performing our audit. We believe that the audit evidence we have obtained is sufficient and appropriate to provide a basis for our opinion. Board of directors’ responsibilities for the preparation of the consolidated financial statements The board of directors is responsible for the preparation of these consolidated financial statements that give a true and fair view in accordance with International Financial Reporting Standards as adopted by the European Union, and with the legal and regulatory requirements applicable in Belgium, and for such internal control as board of directors determines, is necessary to enable the preparation of consolidated financial statements that are free from material misstatement, whether due to fraud or error. In preparing the consolidated financial statements, the board of directors is responsible for assessing the Group’s ability to continue as a going concern, disclosing, as applicable, matters related to going concern and using the going concern basis of accounting unless the board of directors either intends to liquidate the Group or to cease operations, or has no realistic alternative but to do so. Statutory auditor’s responsibilities for the audit of the consolidated financial statements Our objectives are to obtain reasonable assurance as to whether the consolidated financial statements as a whole are free from material misstatement, whether due to fraud or error, and to issue an auditor’s report that includes our opinion. Reasonable assurance is a high level of assurance, but is not a guarantee that an audit conducted in accordance with ISAs will always detect a material misstatement when it exists. Misstatements can arise from fraud or error and are considered material if, individually or in the aggregate, they could reasonably be expected to influence the economic decisions of the users taken on the basis of these consolidated financial statements.
Auditor’s report
121Aliaxis SA – Consolidated Annual Report 2020
Statutory auditor’s report to the general meeting of Aliaxis SA on the consolidated financial statements as of and for the year ended 31 December 2020
Document Classification: KPMG Public 3
When performing our audit we comply with the legal, regulatory and professional requirements applicable to audits of the consolidated financial statements in Belgium. The scope of the statutory audit of the consolidated financial statements does not extend to providing assurance on the future viability of the Group nor on the efficiency or effectivity of how the board of directors has conducted or will conduct the business of the Group. Our responsibilities regarding the going concern basis of accounting applied by the board of directors are described below. As part of an audit in accordance with ISAs, we exercise professional judgement and maintain professional skepticism throughout the audit. We also perform the following procedures:
— Identify and assess the risks of material misstatement of the consolidated financial statements, whether due to fraud or error, design and perform audit procedures responsive to those risks, and obtain audit evidence that is sufficient and appropriate to provide a basis for our opinion. The risk of not detecting a material misstatement resulting from fraud is higher than for one resulting from error, as fraud may involve collusion, forgery, intentional omissions, misrepresentations, or the override of internal control;
— Obtain an understanding of internal controls relevant to the audit in order to design audit procedures that are appropriate in the circumstances, but not for the purpose of expressing an opinion on the effectiveness of the Group’s internal control;
— Evaluate the appropriateness of accounting policies used and the reasonableness of accounting estimates and related disclosures made by board of directors;
— Conclude on the appropriateness of board of directors’ use of the going concern basis of accounting and, based on the audit evidence obtained, whether a material uncertainty exists related to events or conditions that may cast significant doubt on the Group’s ability to continue as a going concern. If we conclude that a material uncertainty exists, we are required to draw attention in our auditors’ report to the related disclosures in the consolidated financial statements or, if such disclosures are inadequate, to modify our opinion. Our conclusions are based on the audit evidence obtained up to the date of our auditors’ report. However, future events or conditions may cause the Group to cease to continue as a going concern;
— Evaluate the overall presentation, structure and content of the consolidated financial statements, including the disclosures, and whether the consolidated financial statements represent the underlying transactions and events in a manner that achieves fair presentation;
— Obtain sufficient appropriate audit evidence regarding the financial information of the entities or business activities within the Group to express an opinion on the consolidated financial statements. We are responsible for the direction, supervision and performance of the group audit. We remain solely responsible for our audit opinion.
Auditor’s report
122Aliaxis SA – Consolidated Annual Report 2020
Statutory auditor’s report to the general meeting of Aliaxis SA on the consolidated financial statements as of and for the year ended 31 December 2020
Document Classification: KPMG Public 4
We communicate with the board of directors regarding, among other matters, the planned scope and timing of the audit and significant audit findings, including any significant deficiencies in internal control that we identify during our audit.
Other legal and regulatory requirements Responsibilities of the Board of directors The board of directors is responsible for the preparation and the content of the board of directors’ annual report on the consolidated financial statements and the other information included in the annual report. Statutory auditor’s responsibilities In the context of our engagement and in accordance with the Belgian standard which is complementary to the International Standards on Auditing as applicable in Belgium, our responsibility is to verify, in all material respects, the board of directors’ annual report on the consolidated financial statements and the other information included in the annual report, and to report on these matters. Aspects concerning the board of directors’ annual report on the consolidated financial statements and other information included in the annual report Based on specific work performed on the board of directors’ annual report on the consolidated financial statements, we are of the opinion that this report is consistent with the consolidated financial statements for the same period and has been prepared in accordance with article 3:32 of the Companies’ and Associations’ Code. In the context of our audit of the consolidated financial statements, we are also responsible for considering, in particular based on the knowledge gained throughout the audit, whether the board of directors’ annual report on the consolidated financial statements and other information included in the annual report:
— Part 1: Focusing on what matters in 2020 — Corporate governance contain material misstatements, or information that is incorrectly stated or misleading. In the context of the procedures carried out, we did not identify any material misstatements that we have to report to you.
Auditor’s report
123Aliaxis SA – Consolidated Annual Report 2020
Statutory auditor’s report to the general meeting of Aliaxis SA on the consolidated financial statements as of and for the year ended 31 December 2020
Document Classification: KPMG Public 5
Information about the independence — Our audit firm and our network have not performed any engagement which
is incompatible with the statutory audit of the consolidated financial statements and our audit firm remained independent of the Group during the term of our mandate.
— The fees for the additional engagements which are compatible with the statutory audit referred to in article 3:65 of the Companies’ and Associations’ Code were correctly stated and disclosed in the notes to the consolidated financial statements.
Antwerp, 30 March 2021
KPMG Bedrijfsrevisoren - Réviseurs d’Entreprises Statutory Auditor represented by
Filip De Bock Bedrijfsrevisor / Réviseur d’Entreprises
Auditor’s report
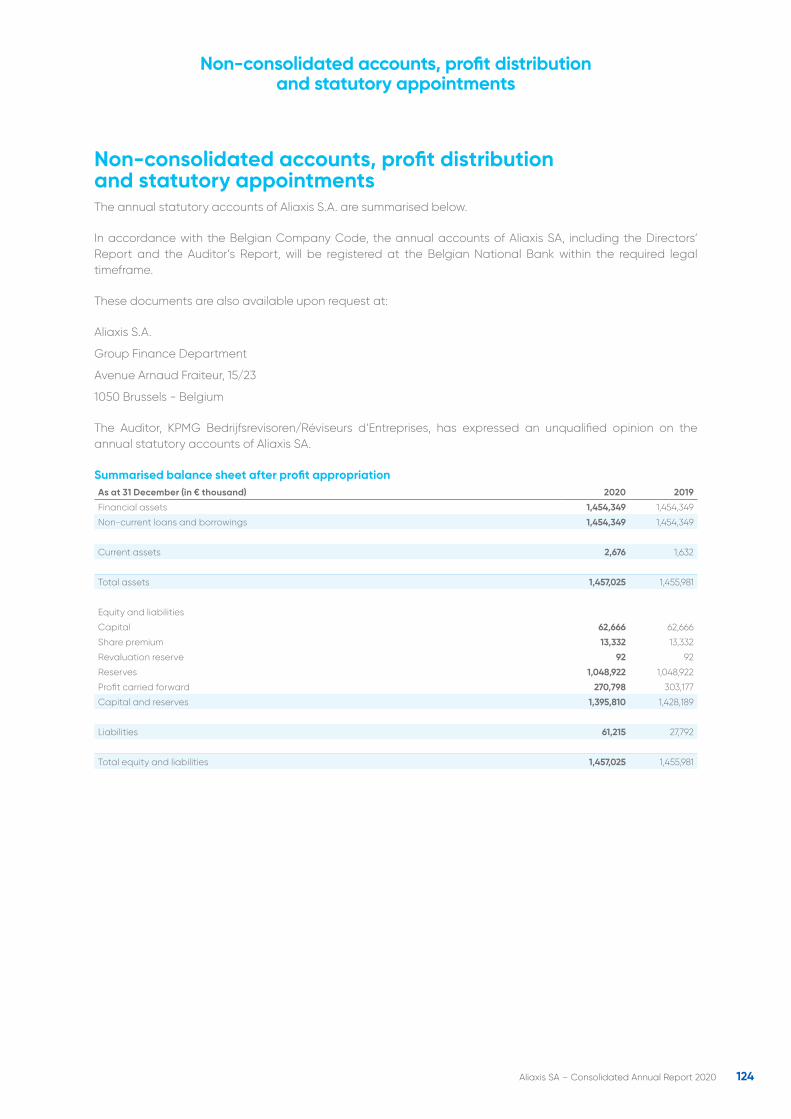
Non-consolidated accounts, profit distribution and statutory appointmentsThe annual statutory accounts of Aliaxis S.A. are summarised below.
In accordance with the Belgian Company Code, the annual accounts of Aliaxis SA, including the Directors’ Report and the Auditor’s Report, will be registered at the Belgian National Bank within the required legal timeframe.
These documents are also available upon request at:
Aliaxis S.A.
Group Finance Department
Avenue Arnaud Fraiteur, 15/23
1050 Brussels - Belgium
The Auditor, KPMG Bedrijfsrevisoren/Réviseurs d’Entreprises, has expressed an unqualified opinion on the annual statutory accounts of Aliaxis SA.
Summarised balance sheet after profit appropriationAs at 31 December (in € thousand) 2020 2019
Financial assets 1,454,349 1,454,349
Non-current loans and borrowings 1,454,349 1,454,349
Current assets 2,676 1,632
Total assets 1,457,025 1,455,981
Equity and liabilities
Capital 62,666 62,666
Share premium 13,332 13,332
Revaluation reserve 92 92
Reserves 1,048,922 1,048,922
Profit carried forward 270,798 303,177
Capital and reserves 1,395,810 1,428,189
Liabilities 61,215 27,792
Total equity and liabilities 1,457,025 1,455,981
124Aliaxis SA – Consolidated Annual Report 2020
Non-consolidated accounts, profit distribution and statutory appointments
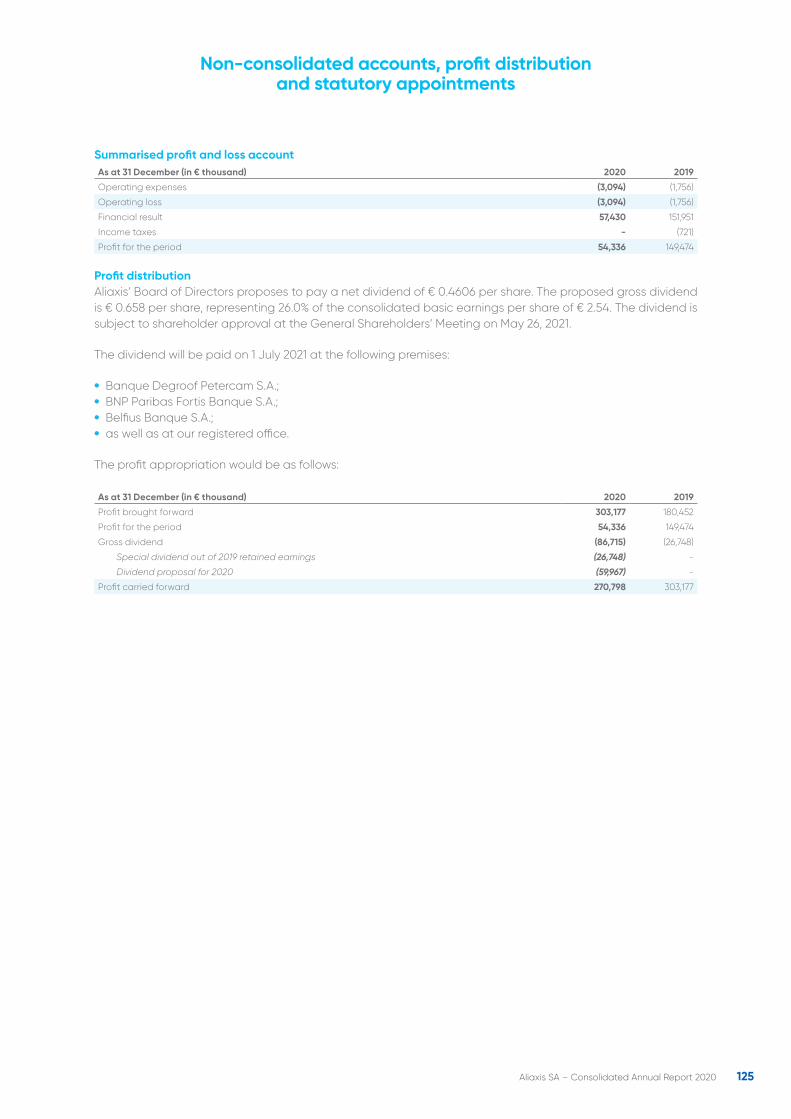
Summarised profit and loss accountAs at 31 December (in € thousand) 2020 2019
Operating expenses (3,094) (1,756)
Operating loss (3,094) (1,756)
Financial result 57,430 151,951
Income taxes - (721)
Profit for the period 54,336 149,474
Profit distributionAliaxis’ Board of Directors proposes to pay a net dividend of € 0.4606 per share. The proposed gross dividend is € 0.658 per share, representing 26.0% of the consolidated basic earnings per share of € 2.54. The dividend is subject to shareholder approval at the General Shareholders’ Meeting on May 26, 2021.
The dividend will be paid on 1 July 2021 at the following premises:
• Banque Degroof Petercam S.A.; • BNP Paribas Fortis Banque S.A.; • Belfius Banque S.A.; • as well as at our registered office.
The profit appropriation would be as follows:
As at 31 December (in € thousand) 2020 2019
Profit brought forward 303,177 180,452
Profit for the period 54,336 149,474
Gross dividend (86,715) (26,748)
Special dividend out of 2019 retained earnings (26,748) -
Dividend proposal for 2020 (59,967) -
Profit carried forward 270,798 303,177
125Aliaxis SA – Consolidated Annual Report 2020
Non-consolidated accounts, profit distribution and statutory appointments
Statutory appointmentsThe mandates of Mr Olivier van der Rest, Mr Patrick Simonard, Mr Didier Leroy, Mrs Andrea Hatschek, Mr Eric Olsen, Mr George Durman- Esquivel and Mr Thierry Vanlancker will expire at the next general meeting of shareholders on May 26, 2021. They are all candidate for re-election. Upon recommendation of the appointment and remuneration committee, the board proposes to the shareholders their re-election for a term of office of three years, ending at the general meeting of shareholders in 2024.
The mandate of Mr Kieran Murphy will also expire at the next general meeting of shareholders of May 26, 2021. He is candidate for re-election. Upon recommendation of the appointment and remuneration committee, the board proposes to the shareholders the re-election for a term of office of two years, ending at the general meeting of shareholders of 2023.
The mandate of Mrs Hélène Van Zeebroeck, Mr Marc Nolet de Brauwere and Mr Amaury Pelgrims de Bigard will also expire at the next general meeting of shareholders of May 26, 2021. They are not candidate for re-election.
The board of directors wishes to sincerely thank them for their valuable contribution to the group during their many years of service.
Upon recommendation of the appointment and remuneration committee, the board proposes to the shareholders to elect GDF Impact SRL (represented by its permanent representative Mr Guy della Faille) and Mr Pierre Alexandre Peters as directors of Aliaxis SA for a term of office of three years ending at the general meeting of shareholders to be held in 2024.
The mandate of KPMG Bedrijfsrevisoren – Réviseurs d’Entreprises as auditor of the consolidated and non-consolidated accounts will expire at the next general meeting of shareholders. It has been proposed to the general meeting of shareholders to reappoint KPMG Bedrijfsrevisoren – Réviseurs d’Entreprises, as auditor of the consolidated and non-consolidated accounts of Aliaxis SA, for a term of three years, ending at the general meeting of shareholders in 2024.
126Aliaxis SA – Consolidated Annual Report 2020
Non-consolidated accounts, profit distribution and statutory appointments
GlossaryRevenue (Sales)Amounts invoiced to customers for goods and services provided by the Group, less credits for returns, rebates and allowances and discounts for cash payments
EBITDAEBIT before charging depreciation, amortisation and impairment
Current EBITDAAdjusted EBIT plus depreciation, amortisation and impairment (other than goodwill impairment)
Current EBITOperating profit exclusive adjusted items
EBITOperating income
Net profit (group share)Profit of the year attributable to equity holders of the Group
Capital expenditureExpenditure on the acquisition of property plant and equipment, investment properties and intangible assets
Net financial debtThe aggregate of (I) non-current and current interest-bearing loans and borrowings and (II) bank overdrafts, less (III) cash and cash equivalents
Capital employedThe aggregate of (I) intangible assets, (II) property, plant & equipment, (III) investment properties, (IV) inventories and (V) amounts receivable, less the aggregate of (a) current provisions, and (b) current amounts payable
Non-cash working capitalThe aggregate of (I) inventories and (II) amounts receivable, less the aggregate of (a) current provisions, and (b) current amounts payable
Return on capital employed (%)EBIT / average of capital employed at 1 January and 31 December x 100
Return on equity (group share) (%)Net profit (group share) / average of equity attributable to equity holders of Aliaxis at 1 January and 31 December x 100
Effective Income tax rate (%)Income taxes / profit before income taxes x 100
Pay-out ratio (%)Gross dividend per share / basic earnings per share x 100
127Aliaxis SA – Consolidated Annual Report 2020
Glossary
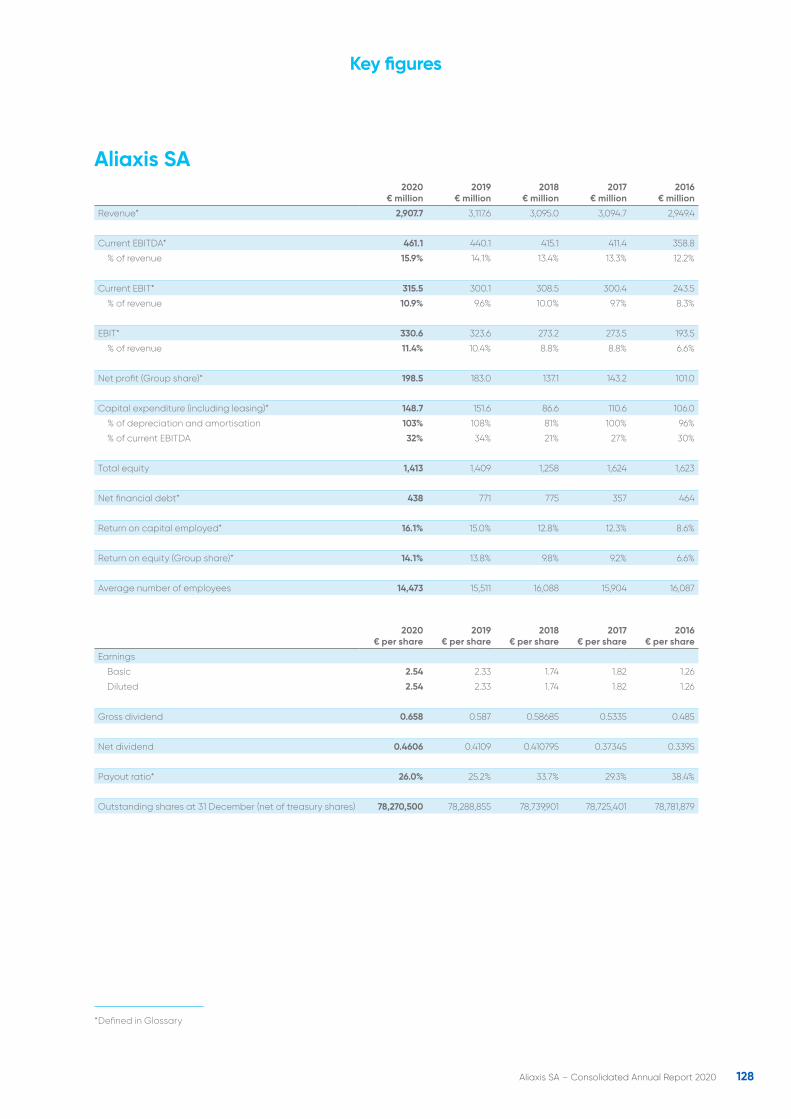
Aliaxis SA 2020
€ million2019
€ million2018
€ million2017
€ million2016
€ million
Revenue* 2,907.7 3,117.6 3,095.0 3,094.7 2,949.4
Current EBITDA* 461.1 440.1 415.1 411.4 358.8
% of revenue 15.9% 14.1% 13.4% 13.3% 12.2%
Current EBIT* 315.5 300.1 308.5 300.4 243.5
% of revenue 10.9% 9.6% 10.0% 9.7% 8.3%
EBIT* 330.6 323.6 273.2 273.5 193.5
% of revenue 11.4% 10.4% 8.8% 8.8% 6.6%
Net profit (Group share)* 198.5 183.0 137.1 143.2 101.0
Capital expenditure (including leasing)* 148.7 151.6 86.6 110.6 106.0
% of depreciation and amortisation 103% 108% 81% 100% 96%
% of current EBITDA 32% 34% 21% 27% 30%
Total equity 1,413 1,409 1,258 1,624 1,623
Net financial debt* 438 771 775 357 464
Return on capital employed* 16.1% 15.0% 12.8% 12.3% 8.6%
Return on equity (Group share)* 14.1% 13.8% 9.8% 9.2% 6.6%
Average number of employees 14,473 15,511 16,088 15,904 16,087
2020€ per share
2019€ per share
2018 € per share
2017€ per share
2016€ per share
Earnings
Basic 2.54 2.33 1.74 1.82 1.26
Diluted 2.54 2.33 1.74 1.82 1.26
Gross dividend 0.658 0.587 0.58685 0.5335 0.485
Net dividend 0.4606 0.4109 0.410795 0.37345 0.3395
Payout ratio* 26.0% 25.2% 33.7% 29.3% 38.4%
Outstanding shares at 31 December (net of treasury shares) 78,270,500 78,288,855 78,739,901 78,725,401 78,781,879
*Defined in Glossary
128Aliaxis SA – Consolidated Annual Report 2020
Key figures

ColophonContent and Coordination: Group Communications – Group Finance
Layout and production: Gather www.gather.london

Aliaxis Group sa/nvAvenue Arnaud Fraiteur 15-23 • 1050 Brussels • Belgium T +32 2 775 50 50 • F +32 2 775 50 51 • [email protected]