focus paper free trade from lisbon to vladivostok · free trade from lisbon to vladivostok ......
TRANSCRIPT

Free Trade from Lisbon to Vladivostok
A Tool for Peace and Prosperity: The Effects of a Free Trade Area between the EU and the Eurasian Region
Focus Paper


Free Trade from Lisbon to Vladivostok
A Tool for Peace and Prosperity: The Effects of a Free Trade Area
between the EU and the Eurasian Region
Focus Paper

4
Free Trade from Lisbon to Vladivostok
Table of contents
Executive Summary 4
Introduction 5
The Political Rationale of an EEU-EU FTA 6
The EU Neighbourhood Policy 7The Eurasian Economic Union and the Community of Independent States 7Overcoming Divisions to Build Trust 8
The Macroeconomic Effects 12
Substantial Trade Creation 12Transitional Economic Effects 13
Conclusion 16
Abbreviations 17Literature 17Imprint 18

5
Free Trade from Lisbon to Vladivostok – A Tool for Peace and Prosperity?
Executive Summary
1. The mutual exclusivity of the EEU and the ENP have contributed to mounting tensions between the EU and Russia. Overcoming this mutual exclusivity and creating a common free trade area would help to overcome these divisions and restore trust and cooperation.
2. The economic benefits of a free trade area between the EU and the EEU (and potentially additional CIS coun-tries) would be substantial. Exports from the EEU to the EU are likely to increase substantially. E.g., Russia’s exports to the EU are expected to rise by about 30 per-cent, while the EU’s exports to the EEU would rise by close to 60 percent in the case of an ambitious free trade agreement. These increases in export levels would entail significant increases in real income, which would rise in Russia by about 3.1 percent and in Belarus by 4.9 per-cent. The eastern member states of the EU would also experience gains in real income between 1.2 and 1.8 per-cent. These benefits would be even greater if other CIS countries were included.
3. A free trade area between the EU and the Eurasian region would imply some sectoral reorientation. The energy and natural resources sector is especially likely to gain in the EEU countries, whereas on the European side agriculture and the automotive sector are likely to gain the most. The net employment effect is positive, but transitional unemployment should be dealt with through adequate mitigating strategies.

6
Free Trade from Lisbon to Vladivostok
Introduction
Trade is an essential source of prosperity. But with pros-perity come other benefits: Trade brings people together. These increased personal contacts lead to a better mutual understanding, to more trust and to cultural exchange. As a matter of fact, trade alliances have a much better track record than military alliances of preventing conflict and maintaining stability.1 This ability of trade to bring people together makes it a welcome tool of diplomacy. Trade can be used to overcome the political and economic divisions in Europe and to create a more stable and prosperous envi-ronment.
Nobody gains from the present tension at the EU’s east-ern border. The disruption of trade relationships between the EU and Russia following the Ukraine conflict has aggra-vated Russia’s recession and made many European busi-nesses who had previously seen Russia as a growth market suffer. In addition, the climate of confrontation and dis-trust has led to a flexing of military muscles on both sides. Many security experts and politicians argue, however, that it is important to deescalate the situation and rebuild con-fidence.2 In this context, the idea of a free trade area from Lisbon to Vladivostok has regained importance. Such a free trade area would tie the EU’s internal market and at least the Eurasian Economic Union Customs Union (EEU) and perhaps other countries from the Community of Independ-ent States (CIS) together as well.
The idea of a free trade area from “Lisbon to Vladivostok” was first coined by Vladimir Putin on a state visit to Berlin in September 2001 and renewed in November 2010. His aim was to abolish barriers to trade between the Eurasian Eco-nomic Union (EEU) and the EU. Chancellor Schröder said that a joint EU-EEU free trade area would be the only way to compete with the US and China in a globalised economy. However, no tangible steps were taken in this direction, not even after Russia’s accession to the WTO in 2012. One year
1 (Jackson, 2014)2 (Spiegel, 2016)
later, tensions over whether the Ukraine should belong to the EEU or sign a free trade agreement with the EU led to a deterioration of mutual relationships. Rather than engaging in free trade, business ties with Russia were significantly curtailed and sanctions imposed.
While the existing sanctions were confirmed to remain in place by the EU Council in June 2016, the rhetoric on both sides suggests that a rapprochement is in the cards for the near future. Both Chancellor Merkel and the Vice-Chan-cellor and German Minister for Business Affairs, Sigmar Gabriel, had earlier voiced their support for lifting all eco-nomic sanctions as soon as Russia has effectively ensured compliance with the terms of the Minsk Protocol by all parties.3 They also saw an option to take steps towards a free trade area between the EU and the EEU in this case. Given that these political conditions are fulfilled, such a free trade area would not only have substantial economic benefits, especially for the countries belonging to the EEU, but also important political benefits. First, it may serve as an incentive for Russia to play a more active role in enforc-ing the Minsk Protocol and help with building peace in Ukraine. Second, such a free trade area would eliminate the tensions arising from the rivalry between the EU’s neigh-bourhood policy and Russia’s endeavour to maintain its sphere of influence. Thus, it would contribute not only to more economic prosperity but also to less political tensions and a more stable environment.
This essay aims to describe the political and economic rationale of such a free trade area. It first discusses the role of free trade areas in Russian and EU diplomacy before turning to the macroeconomic effects of a free trade area involving either the EU and the EEU only alone or including the remaining CIS states.
3 e.g. (Der Standard, 03.06.2016)

7
Free Trade from Lisbon to Vladivostok
The Political Rationale of an EEU-EU FTA
Free trade areas (FTAs) have played an important part in the diplomacy of both the EU and Russia. The European Neigh-bourhood Policy (ENP), a programme designed to fos-ter friendly and stable relations with Europe’s neighbours, makes use of FTAs to establish closer economic relation-ships and political ties with its Eastern and Southern neigh-bours. Russia, however, felt increasingly isolated given the EU’s growing role in what it traditionally considered its sphere of influence. In response, Russia set up a series of free trade areas with former Soviet Union countries, now organised in the Community of Independent States (CIS), as part of its “normative rivalry” strategy, out of which the EEU initiative was the most successful.4 Russia has since used its influence to dissuade other countries from forming a free-trade area with the EU, a process which culminated in the Ukraine-Crisis. An overview of the different trade agreements is provided in the map in Figure 1.
4 (Dragevna, 2012)
The political rationale of an EEU-EU FTA would be to overcome this rivalry between two trading blocs presently perceived as mutually exclusive. If Russia were part of the EU’s Eastern FTA regime, it would experience substan-tial economic gains and – perhaps even more importantly – it would no longer feel the threat of marginalisation and isolation. Thus a free trade arrangement involving Russia would create more political stability, less potential for con-flict and more prosperous development in general in the region. Once the EU-Russia antagonism is overcome, there would be no reason not to include other countries in the region. These could be the present member states of the EEU – or it could extend beyond this framework and open it up to all remaining CIS countries that are not yet a member of a trading bloc. This would allow further eco-nomic integration and put cooperation at the place of con-frontation.
Figure 1: Membership in different trading blocs
n EU Countries n EEU Countries n CIS Countries n ENP DCFTA (negotiated)

8
Free Trade from Lisbon to Vladivostok
The Eurasian Economic Union and the
Community of Independent States
The World Bank economist Lúcio Vinhas de Souza qual-ified a Eurasian FTA as “a GDP-reducing framework in which the negative trade-diversion effects surpass posi-tive trade-creation ones”.6 Indeed the economic ration-ale of this free-trade area is not very strong, and the moti-vation for forging this entity is much more a political than economic one. It can be viewed as an instrument of Russian foreign policy to assert its normative influence among the CIS countries.
Before the present day Eurasian Economic Union, other attempts for regional economic cooperation had seen the light of day. It started already in 1993 when Russia pro-posed to let the CIS evolve following the EU model, build-ing on economic integration. The first step was a free trade agreement which was signed in 1994 but only par-tially implemented and the compliance of member states could not be assured. Creating a functional area of eco-nomic cooperation was a priority for President Putin. Thus the Eurasian Economic Community was established in 2000, with Belarus, Kazakhstan, Kyrgyzstan, Russia and Tajikistan as member states. A customs union between these countries was implemented in 2010. This organisa-tion emulated the structure of the European Union, fea-turing an integration council as an executive and a con-flict resolution body. In 2014, the EEC was replaced with the EEU, which had a similar institutional set-up and identical member countries but pursues more ambitious policies. It aims at moving beyond a customs union towards a common market for goods, capital and labour, with common regula-tions on competition, financial regulation and a harmoni-sation of energy policy.
The EEU has become a tool to challenge the normative pre-dominance of the EU and its ENP, which was viewed by Russia as a threat. Dragevna and Wolczuk write: “Norma-tive convergence as a key tenet of the EU’s approach to the post-soviet countries became a major stumbling block in relations with Russia as the latter questioned the necessity and legitimacy of this approach. Thus Russia is unwilling to yield to what it perceived as the EU’s diktat, demand-ing greater reciprocity and partnership-like relations.”7 Russia’s policy of using the EEU as a tool for “norma-tive rivalry” was effective in the sense that the EU is now
6 (Souza, 2011), p. 17 (Dragevna, 2012), p. 14
The EU Neighbourhood Policy
The ENP was conceived in the wake of the 2004 EU enlarge- ment. Its aim was to prevent the emergence of new dividing lines between the EU and its neighbours by “developing a special relationship between the EU and each of its partner countries, contributing to an area of security, prosperity and good neighbourliness.”5 Trade is only one way through which the ENP tries to achieve its objectives. It is accompa-nied by financial support, cooperation in various sectors of EU policies as well as arrangements to improve migration and mobility.
The ENP defines several strategic geographical areas: the ENP South, covering the Mediterranean, the Enlarge-ment Agenda, comprised of countries poised to eventually become full EU members, the ENP East, oriented towards Belarus, Ukraine, Moldova, Georgia, Armenia and Azerbai-jan. Russia is not part of the ENP East as it was given a spe-cial status. Collaboration with Russia takes place through the Shared Spaces programme.
Deep and Comprehensive Free Trade Areas (DCFTAs) are an important part of the ENP East. Through these agreements, the participating countries gain preferential access to the EU’s internal market and become more attractive to inves-tors, as they guarantee that they can operate under the same regulatory environment as in the EU. The first DCFTA negotiations started between the EU and Ukraine, subse-quently followed by negotiations with Georgia, Armenia and Moldova. The EU-Ukraine DCFTA was initialled on July 19, 2012. As the Eurasian Economic Commission threatened that Ukraine would lose its membership in the EEU if it engaged in a DCFTA with the EU, the Ukrainian government decided on November 21, 2013 not to sign the agreement. This provoked pro-EU demonstrations, eventually lead-ing to the overthrow of the government and the installation of a pro-European successor. The Ukraine-EU DCFTA has been provisionally applied since January 1, 2016, although it is not yet formally ratified by the EU. The introduction of a DCFTA with Armenia was also cumbersome. The negotiations were completed in July 2013. However, wary of losing good relations with Russia, the Armenian govern-ment decided not to ratify the agreement and to join the EEU instead. The DCFTAs with Georgia and Moldova have been implemented since September 1, 2014.
5 (European Commission, 2014)

9
Free Trade from Lisbon to Vladivostok
Together with the enlargement of NATO, the strong nor-mative appeal of the EU has provoked Russia’s sentiment of isolation and marginalisation. The requirement for many CIS countries to declare themselves either for the EU or for Russia has fuelled a confrontational climate. One strat-egy for de-escalation would be to take President Putin seri-ously and pursue the idea of a free trade area between the Eurasian region and the EU. Such cooperation would dis-pel the fear that European trade policy is directed against Russia. Given the economic gains for both sides that can be expected, it is not difficult to imagine that trade coop-eration will lead to a realisation that Russia, the other CIS countries and the EU will benefit more from a partnership.
As mentioned in the introduction, some politicians have called for a stronger role of Russia in ensuring compli-ance with the Minsk protocol as a prerequisite for lift-ing the economic sanctions. The prospect of an FTA which would help Russia’s economy return to a strong growth path would create another incentive for increased coopera-tion. The mere proposal could thus lead to a more effective peace process in Ukraine and a de-escalation of EU-Rus-sian relations.
required to rethink its DCFTA approach and adapt it in response to Russia’s policy.
Overcoming Divisions to Build Trust
Countries cannot be a member of both trading blocs. Thus the competition for influence leads to a situation in which governments need to decide whether to engage in free trade with the EU or the EEU, whether to position themselves as pro-European or pro-Russia, accepting the negative effects that such a decision and the alienation of the other partner will inevitably bring. The economic benefits of becoming an EEU member are much weaker – for most countries – than engaging in a free trade area with the EU. However, for many eastern European and central Asian economies, the Russian market remains important and the political good-will of Russia is essential.
This conflict is highlighted by the developments in Ukraine and Armenia. Armenia’s largest trading partner is the EU and Armenia is keen to develop a positive political rela-tionship with the EU. However, traditionally Russia is an important ally of Armenia and the Armenian government did not want to risk losing this support. Hence it saw itself unable to join the already-negotiated DCFTA with the EU. The case of Ukraine is much better known. Being divided in its political and economic structure, the decision of which trade area to belong to is not an easy one. The pro-Rus-sian industrial east did benefit from being part of the EEU. The pro-Western service-orientated west wished for closer economic ties with the EU. The decision of the pro-Russian Yanukovich government to not ratify the DCFTA with the EU led to outrage amongst a large share of the population, eventually leading to the overthrow of the government. The new pro-Western government did ratify the DCFTA at the expense of a severe disruption of economic ties with Rus-sia and the outbreak of separatist belligerent activities in Ukraine’s east and the annexation of Crimea by Russia.
This was followed by a sharp response from the West. Eco-nomic sanctions were imposed on Russia and the pres-ence of armed forces in the eastern members of the NATO was strengthened. Some observers have already forecast the beginning of a new Cold War.8 In order to avoid the dangers inherent in the confrontation of two strong military blocs, new strategies have to be found.
8 E.g. (Bildt, 2016)

10
Free Trade from Lisbon to Vladivostok
Table 1 Evolution of Exports under an EU-EEU FTA
Total exports Exports to EU28 / former SU Evolution of Exports under an EU-EEU FTA
Total exports in Euro m in Euro m in percent
total exports, in percent
exports to EU / former SU,
in percent
Former Soviet Union Countries
Russia 410,730 223,332 54.00 19.00 32.00
Moldova 1,941 1,020 53.00 – 2.00 2.00
Azerbaijan 26,563 12,622 48.00 0.00 – 6.00
Armenia 1,475 657 45.00 34.00 81.00
Kazakhstan 59,821 25,861 43.00 10.00 18.00
Belarus 19,152 7,321 38.00 46.00 109.00
Georgia 2,527 946 37.00 – 1.00 1.00
Ukraine 60,028 17,225 29.00 – 3.00 2.00
Kyrgyzstan 2,068 352 17.00 20.00 100.00
Tajikistan, Turkmenistan, Uzbekistan 23,357 3,967 17.00 – 1.00 1.00
EU 28.00
Lithuania 18,586 3,313 18.00 10.00 82.00
Cyprus 9,320 1,401 15.00 6.00 43.00
Latvia 9,688 1,163 12.00 10.00 79.00
Estonia 12,696 1,362 11.00 10.00 81.00
Finland 70,053 6,903 10.00 6.00 78.00
Poland 140,875 12,136 9.00 5.00 69.00
Bulgaria 24,474 1,528 6.00 2.00 42.00
Romania 50,152 2,940 6.00 2.00 30.00
Hungary 84,409 4,781 6.00 3.00 55.00
Czech Republic 115,829 6,135 5.00 3.00 60.00
Slovenia 24,228 1,268 5.00 2.00 45.00
Slovakia 57,168 2,686 5.00 5.00 131.00
Germany 1,120,817 51,937 5.00 2.00 59.00
Italy 441,237 17,086 4.00 2.00 67.00
Greece 56,022 2,063 4.00 5.00 61.00
Austria 149,937 5,064 3.00 1.00 49.00
Croatia 21,830 663 3.00 1.00 54.00
Sweden 165,894 4,999 3.00 1.00 58.00
UK 486,034 14,189 3.00 1.00 59.00
France 524,116 15,113 3.00 2.00 64.00
Denmark 113,240 3,160 3.00 2.00 57.00
Netherlands 289,084 7,412 3.00 2.00 72.00
Spain 297,450 7,003 2.00 1.00 65.00
Malta 5,979 135 2.00 1.00 31.00
Belgium 292,423 5,893 2.00 1.00 70.00
Luxembourg 54,919 935 2.00 1.00 34.00
Ireland 174,019 2,258 1.00 0.00 61.00
Portugal 58,682 640 1.00 0.00 56.00
EU 28 4,869,160 184,167 4.00 2.00 63.00

11
Free Trade from Lisbon to Vladivostok
Table 2 Economic Effects of an EU– former SU FTA
BIP change in real income (annual) change in wages change in prices
total, in bn Euro
per capita, in Euro
in percent
in bn in Euro
per capita, in Euro
in percent
in percent
Former SU sphere of influence countries
Moldova 6 1,564 6.20 0.35 97.45 6.90 – 2.80
Belarus 56 5,917 5.30 2.93 310.83 3.20 – 3.30
Ukraine 81 1,896 4.70 3.84 89.93 4.60 – 1.20
Russia 1,111 7,593 3.30 37.10 253.61 0.70 – 3.10
Azerbaijan 58 6,107 3.30 1.92 203.48 0.50 – 3.30
Turkmenistan 40 6,772 3.00 1.18 200.38 1.00 – 2.40
Uzbekistan 59 1,914 3.00 1.75 56.64 1.00 – 2.40
Tajikistan 7 853 3.00 0.21 25.24 1.00 – 2.40
Georgia 12 3,344 2.90 0.36 96.58 3.00 – 0.80
Armenia 10 3,188 2.60 0.25 83.57 2.70 – 0.70
Kyrgyzstan 6 1,077 2.50 0.16 26.48 3.30 – 1.00
Kazakhstan 175 9,912 2.30 3.99 225.44 0.40 – 2.40
Albania 10 3,775 0.00 0.00 0.02 – 0.10 – 0.10
Bosnia–Herzegovina 14 3,622 0.00 0.00 – 1.07 0.00 0.00
Montenegro 4 5,728 0.00 0.00 – 1.70 0.00 0.00
Serbia 33 4,586 0.00 – 0.01 – 1.36 0.00 0.00
Macedonia 9 4,375 0.00 0.00 – 1.30 0.00 0.00
EU28
Latvia 25 12,340 1.90 0.48 237.39 3.20 0.50
Lithuania 38 12,869 1.80 0.66 226.79 3.80 1.00
Croatia 44 10,383 1.50 0.66 155.17 3.30 1.40
Estonia 21 15,662 1.30 0.27 202.44 2.00 0.10
Cyprus 17 19,352 1.30 0.22 243.28 1.80 0.10
Hungary 107 10,804 1.00 1.03 104.36 1.30 0.40
Slovakia 77 14,284 1.00 0.74 135.84 1.70 0.70
Bulgaria 42 5,916 0.90 0.40 55.30 1.20 0.10
Poland 433 11,381 0.60 2.78 73.02 1.50 0.60
Czech Republic 164 15,576 0.60 1.05 99.34 1.10 0.50
Finland 207 37,893 0.50 1.13 207.04 1.20 0.50
Slovenia 38 18,616 0.50 0.21 100.97 1.10 0.50
Greece 173 15,870 0.50 0.91 82.96 0.60 – 0.10
Romania 157 7,916 0.40 0.69 34.55 0.70 0.20
Malta 8 19,360 0.40 0.03 78.91 0.50 – 0.10
Ireland 204 43,988 0.30 0.67 143.06 0.30 0.10
Belgium 412 36,363 0.30 1.33 117.52 0.60 0.20
Netherlands 675 39,847 0.30 2.18 128.47 0.50 0.20
Italy 1,635 26,827 0.30 4.87 79.87 0.50 0.20
Germany 3,030 37,092 0.30 9.01 110.27 0.60 0.30
Denmark 262 46,220 0.30 0.76 134.54 0.40 0.10
Austria 335 39,140 0.30 0.86 100.05 0.50 0.30
Sweden 435 44,011 0.20 0.82 83.08 0.30 0.20
Spain 1,098 23,663 0.20 1.86 40.02 0.30 0.10
Luxembourg 52 92,746 0.10 0.08 135.06 0.40 0.20
Portugal 178 17,063 0.10 0.25 24.13 0.20 0.00
France 2,178 33,911 0.10 2.91 45.39 0.30 0.10
UK 2,575 39,654 0.10 3.25 50.03 0.20 0.00
EU28 14,620 28,745 0.30 40.07 78.84
12
Free Trade from Lisbon to Vladivostok
The Macroeconomic Effects
In order to understand why a free trade area between the two trading blocs would be an attractive option, it is impor-tant to describe the macroeconomic effects that can be expected. According to a study commissioned by the Ber-telsmann Stiftung (Felbermayr, 2016), which studies the long-term effects of trade integration, the trade creation effects are substantial.9 The EEU countries in particular are likely to gain substantially. The volume of trade is likely to increase and per capita welfare gains to reach impor-tant levels. In Russia, for example, the annual real income might increase by up to 235 Euros, or 3.1 percent. The EU is also likely to experience positive trade effects, espe-cially the Baltic countries. However, since the main bene-fit of trade comes from the participating parties producing and exporting what they can do best – called a compara-tive advantage – any trade deal implies a restructuring of the economy. Some sectors will be challenged, others will thrive. The stronger these distributional effects are, the more difficult an economic transition will be. Managing the transition well is key to harnessing the beneficial potential of such a trade deal. While transitional effects are expected to be moderate, the issue cannot be neglected. It is impor-tant to devote some attention to this area because if such a trade deal is not a success, the social and political reper-cussions might be substantial, which would imperil the political rationale of such a trade deal. This section will be devoted to describing the expected effects for the partici-pating economies – overall and on a sectoral level – and to develop ideas on how the implied economic transition can be effectively managed.
Substantial Trade Creation
The economic effects of increased trade between the EU and the Eurasian region have been studied in depth by
9 The model used by (Felbermayr, 2016) computes a long-term equi-librium of trade effects. Such a long-term equilibrium is typically achieved 12-15 years after integration. It does not take transitional ef-fects into account.
(Felbermayr, 2016). This section summarises their results. The author’s calculations are based on the year 2011 and are thus predating the economic sanctions against Rus-sia. Thus, the estimated effects presented here are likely to be lower than they would be if a free trade area were actu-ally implemented. Several scenarios have been calculated. Geographically, the first case to study was a free trade area between the EEU and the EU but this is subsequently extended to include more CIS countries and other coun-tries in the former Soviet sphere of influence. Generally, a deep and a shallow version of a trade agreement have been computed in order to provide the reader with an idea of the potential upper and lower bounds of the expected effects.
The expected growth potential of a free trade area between the EEU and the EU is substantial. In the case of a deep agreement, Russia’s exports to the EU would grow by about 32 percent in comparison to 2011, Armenia’s by more than 80 percent and those of Belarus and Kyrgyzstan would double. The EU would also benefit: Its total exports to EEU countries would rise by about 60 percent, with the growth potential being highest in Slovakia, Finland and Poland. German exports would rise by about 59 percent. Should a potential free trade area comprise more than just the EEU countries and also include some other countries from the former Soviet sphere of influence, the positive effects would be even greater. The detailed effects for all countries are presented in Tables 1 and 2.
In terms of income per capita, a deep EEU-EU trade agree-ment would raise Russia’s real annual income by 3.1 per-cent or €34 billion. Belarus would profit even more, with an income rise of 4.9 percent and also the growth effects in the other EEU countries would be positive and significant. Should other CIS countries not be included in such a trade deal, an EEU-EU trade deal would have slight negative con-sequences for them because of trade diversion effects. In Europe, the Baltic countries stand to gain most, with per-capital income rises of 1.2 to 1.8 percent, which corre-sponds to 200 Euros per capita. The EU as a whole would

13
Free Trade from Lisbon to Vladivostok
increase its real income by ca. €30 billion. Germany could expect a rise between seven and nine percent, which corre-sponds to €90-110 per capita. Even a shallow trade agree-ment would still generate substantial positive effects.
In Russia, the sectors that would gain most are those linked to natural resources, above all the oil industry. But met-als would also experience a positive effect. A more negative effect should be expected in agriculture and in the automo-tive sector. The opposite sectoral effect is anticipated for the EU: Here the agricultural and automotive sectors would gain most. The Russian sectorial effects are displayed in table 3. The sectoral effects are very similar in all other EEU countries. The total percentage of a displaced workforce – meaning workers that need to change sectors – is pre-sented in Table 4.
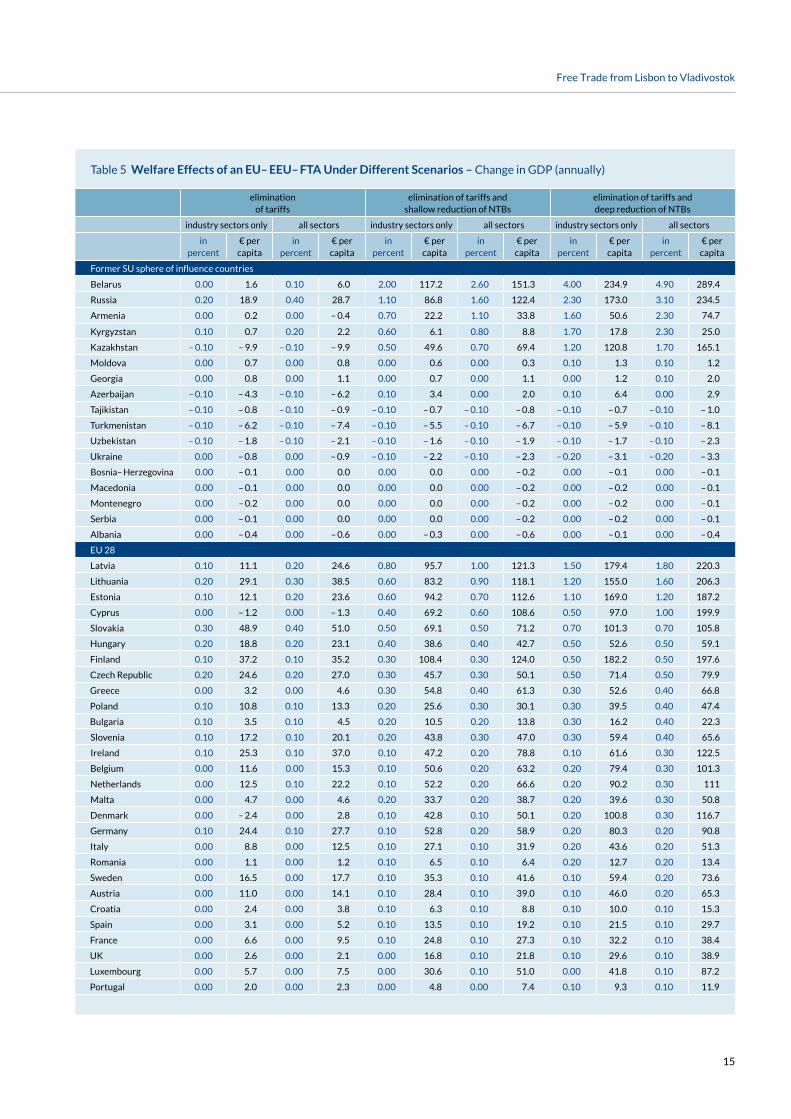
So far, I have only described the effects of a deep FTA. Table 5 provides a comparison of different scenarios. As can be observed, the effects of a mere elimination of tariffs are only modest. However, welfare gains are more substantial as soon as NTBs are reduced along with tariffs being elim-inated. Please note that Table 5 presents the calculations for an EU-EEU FTA, hence some countries that are not part of either trading bloc would experience some minor trade diversion effects.
Transitional Economic Effects
The divergent effects for different sectors as presented in Table 4 imply certain transitional costs. While the net effect in employment is positive, some sectors will increase employment and others will have to let people go. Table 3 also shows the employment effects per sector for Russia in the case of an EEU-EU agreement. In this scenario, 1.2 per-cent of the total workforce would have change from one sector to another. In other EEU countries a substantial part of the workforce would also have to change employment, as shown in Table 4.
The economic model used by (Felbermayr, 2016) jumps from one long-term economic equilibrium to another. The advantage of this methodology is that the long-term posi-tive effects of free trade become immediately apparent. The drawback is, however, that short-term transitional costs cannot be studied in detail. The reorientation of the EEU economies would certainly have transitional effects that will need to be managed in order to avoid public dissatis-faction with such a trade arrangement. This mostly con-cerns EEU countries, the transitional effects in the EU are
negligible and the effects on other CIS countries are also of a much lower magnitude than in EEU countries. The results suggest that the long-term economic benefits outweigh potential negative transitional costs.
Which strategies could be used to smooth the transition? Two potentially complementary approaches are perceivable:
• Sequencing the tariff and NTB reductions in the FTA agreement: In the FTA agreement, not all reductions of trade barriers have to occur at the same time. It would be a smart approach to reduce barriers to trade first in those sectors that stand to gain the most. These sectors would already start expanding, albeit not quite to their full potential yet. Subsequently and gradually, trade bar-riers could be lowered for those sectors likely to be neg-atively impacted. Due to the gradual nature of the pro-cess, the expanding winning sectors would be able to absorb the newly available workforce and thus minimise transitional unemployment. Theoretically, it would also be possible not to liberalise those sectors that would be negatively impacted. However, the overall economic gain would not be quite as large as it would be in the case of a deep and encompassing trade liberalisation coupled with a smooth transition.
• Support programmes: Since the sectors that are expand-ing and those likely to be contracting require differ-ent skill sets, retraining the workforce might be neces-sary. Also, in some cases the developing new industries might need technical and financial support to get off the ground in the beginning. For these purposes, support programmes could be helpful. These could be imple-mented by the member states themselves, but depending on the economic situation of the country and the extent of the measures required, this might be a sensible area for the EU to provide help.
Ensuring that a free trade area between the EU and the Eurasian region is a success and achieves popular support is crucial for the political rationale of such an enterprise to work. If the aim is to create peace through prosperity and stability, it is important that the majority of the population perceives itself as winning from such a free trade agree-ment.

14
Free Trade from Lisbon to Vladivostok
Table 3 Evolution of sectoral value-added in Russia under an EU-EEU-FTA, top and bottom 5
Currently Change through EU-EEU-FTA
Rank Sector in m €Share of national
value-added, in percent in m € in percentemployment
in tsds
1 Oil 162,333 13.55 11,193 7.00 185
2 Metals 13,177 1.10 2,972 23.00 161
3 Petroleum products 13,207 1.10 2,021 15.00 137
4 Minerals 9,143 0.76 1,545 17.00 80
5 Coal 9,037 0.75 1,126 12.00 79
…
53 Paper 5,080 0.42 – 876 – 17.00 – 67
54 Milk products 5,830 0.49 – 1,096 – 19.00 – 78
55 Manufacturing 28,860 2.41 – 1,258 – 4.00 – 131
56 Automotive 4,831 0.40 – 1,801 – 37.00 – 169
57 Vegetables, Fruits, Nuts 15,455 1.29 – 2,647 – 17.00 – 249
Table 4 Percentage of employees changing sectors following an EU-former Soviet influence-FTA
Kyrgyzstan 2.17
Belarus 1.89
Armenia 1.21
Russia 1.20
Tajikistan, Turkmenistan, Uzbekistan 0.74
Ukraine 0.65
Moldova 0.65
Kazakstan 0.61
Georgia 0.39
Azerbaijan 0.39
Albania 0.30
Bosnia-Herzegovina, Macedonia, Montenegro, Serbia 0.18
15
Free Trade from Lisbon to Vladivostok
Table 5 Welfare Effects of an EU– EEU– FTA Under Different Scenarios – Change in GDP (annually)
elimination of tariffs
elimination of tariffs and shallow reduction of NTBs
elimination of tariffs and deep reduction of NTBs
industry sectors only all sectors industry sectors only all sectors industry sectors only all sectors
in percent
€ per capita
in percent
€ per capita
in percent
€ per capita
in percent
€ per capita
in percent
€ per capita
in percent
€ per capita
Former SU sphere of influence countries
Belarus 0.00 1.6 0.10 6.0 2.00 117.2 2.60 151.3 4.00 234.9 4.90 289.4
Russia 0.20 18.9 0.40 28.7 1.10 86.8 1.60 122.4 2.30 173.0 3.10 234.5
Armenia 0.00 0.2 0.00 – 0.4 0.70 22.2 1.10 33.8 1.60 50.6 2.30 74.7
Kyrgyzstan 0.10 0.7 0.20 2.2 0.60 6.1 0.80 8.8 1.70 17.8 2.30 25.0
Kazakhstan – 0.10 – 9.9 – 0.10 – 9.9 0.50 49.6 0.70 69.4 1.20 120.8 1.70 165.1
Moldova 0.00 0.7 0.00 0.8 0.00 0.6 0.00 0.3 0.10 1.3 0.10 1.2
Georgia 0.00 0.8 0.00 1.1 0.00 0.7 0.00 1.1 0.00 1.2 0.10 2.0
Azerbaijan – 0.10 – 4.3 – 0.10 – 6.2 0.10 3.4 0.00 2.0 0.10 6.4 0.00 2.9
Tajikistan – 0.10 – 0.8 – 0.10 – 0.9 – 0.10 – 0.7 – 0.10 – 0.8 – 0.10 – 0.7 – 0.10 – 1.0
Turkmenistan – 0.10 – 6.2 – 0.10 – 7.4 – 0.10 – 5.5 – 0.10 – 6.7 – 0.10 – 5.9 – 0.10 – 8.1
Uzbekistan – 0.10 – 1.8 – 0.10 – 2.1 – 0.10 – 1.6 – 0.10 – 1.9 – 0.10 – 1.7 – 0.10 – 2.3
Ukraine 0.00 – 0.8 0.00 – 0.9 – 0.10 – 2.2 – 0.10 – 2.3 – 0.20 – 3.1 – 0.20 – 3.3
Bosnia– Herzegovina 0.00 – 0.1 0.00 0.0 0.00 0.0 0.00 – 0.2 0.00 – 0.1 0.00 – 0.1
Macedonia 0.00 – 0.1 0.00 0.0 0.00 0.0 0.00 – 0.2 0.00 – 0.2 0.00 – 0.1
Montenegro 0.00 – 0.2 0.00 0.0 0.00 0.0 0.00 – 0.2 0.00 – 0.2 0.00 – 0.1
Serbia 0.00 – 0.1 0.00 0.0 0.00 0.0 0.00 – 0.2 0.00 – 0.2 0.00 – 0.1
Albania 0.00 – 0.4 0.00 – 0.6 0.00 – 0.3 0.00 – 0.6 0.00 – 0.1 0.00 – 0.4
EU 28.00
Latvia 0.10 11.1 0.20 24.6 0.80 95.7 1.00 121.3 1.50 179.4 1.80 220.3
Lithuania 0.20 29.1 0.30 38.5 0.60 83.2 0.90 118.1 1.20 155.0 1.60 206.3
Estonia 0.10 12.1 0.20 23.6 0.60 94.2 0.70 112.6 1.10 169.0 1.20 187.2
Cyprus 0.00 – 1.2 0.00 – 1.3 0.40 69.2 0.60 108.6 0.50 97.0 1.00 199.9
Slovakia 0.30 48.9 0.40 51.0 0.50 69.1 0.50 71.2 0.70 101.3 0.70 105.8
Hungary 0.20 18.8 0.20 23.1 0.40 38.6 0.40 42.7 0.50 52.6 0.50 59.1
Finland 0.10 37.2 0.10 35.2 0.30 108.4 0.30 124.0 0.50 182.2 0.50 197.6
Czech Republic 0.20 24.6 0.20 27.0 0.30 45.7 0.30 50.1 0.50 71.4 0.50 79.9
Greece 0.00 3.2 0.00 4.6 0.30 54.8 0.40 61.3 0.30 52.6 0.40 66.8
Poland 0.10 10.8 0.10 13.3 0.20 25.6 0.30 30.1 0.30 39.5 0.40 47.4
Bulgaria 0.10 3.5 0.10 4.5 0.20 10.5 0.20 13.8 0.30 16.2 0.40 22.3
Slovenia 0.10 17.2 0.10 20.1 0.20 43.8 0.30 47.0 0.30 59.4 0.40 65.6
Ireland 0.10 25.3 0.10 37.0 0.10 47.2 0.20 78.8 0.10 61.6 0.30 122.5
Belgium 0.00 11.6 0.00 15.3 0.10 50.6 0.20 63.2 0.20 79.4 0.30 101.3
Netherlands 0.00 12.5 0.10 22.2 0.10 52.2 0.20 66.6 0.20 90.2 0.30 111
Malta 0.00 4.7 0.00 4.6 0.20 33.7 0.20 38.7 0.20 39.6 0.30 50.8
Denmark 0.00 – 2.4 0.00 2.8 0.10 42.8 0.10 50.1 0.20 100.8 0.30 116.7
Germany 0.10 24.4 0.10 27.7 0.10 52.8 0.20 58.9 0.20 80.3 0.20 90.8
Italy 0.00 8.8 0.00 12.5 0.10 27.1 0.10 31.9 0.20 43.6 0.20 51.3
Romania 0.00 1.1 0.00 1.2 0.10 6.5 0.10 6.4 0.20 12.7 0.20 13.4
Sweden 0.00 16.5 0.00 17.7 0.10 35.3 0.10 41.6 0.10 59.4 0.20 73.6
Austria 0.00 11.0 0.00 14.1 0.10 28.4 0.10 39.0 0.10 46.0 0.20 65.3
Croatia 0.00 2.4 0.00 3.8 0.10 6.3 0.10 8.8 0.10 10.0 0.10 15.3
Spain 0.00 3.1 0.00 5.2 0.10 13.5 0.10 19.2 0.10 21.5 0.10 29.7
France 0.00 6.6 0.00 9.5 0.10 24.8 0.10 27.3 0.10 32.2 0.10 38.4
UK 0.00 2.6 0.00 2.1 0.00 16.8 0.10 21.8 0.10 29.6 0.10 38.9
Luxembourg 0.00 5.7 0.00 7.5 0.00 30.6 0.10 51.0 0.00 41.8 0.10 87.2
Portugal 0.00 2.0 0.00 2.3 0.00 4.8 0.00 7.4 0.10 9.3 0.10 11.9

16
Free Trade from Lisbon to Vladivostok
Conclusion
The present confrontation between Russia and the EU is harmful in many ways. The geopolitical use of trade strat-egies by both actors in the past have contributed to mount-ing tensions and to the present threat to peace and sta-bility. Hence, new strategies have to be found, capable of overcoming rivalry rather than fostering it. Trade has the capacity to forge stronger ties and thus facilitate greater cooperation. Overcoming the rivalry of trade arrangements could have the potential to improve the security situation and additionally lead to greater prosperity for the countries involved.
The gains to be expected from an EEU-EU free trade area are substantial, especially for the EEU countries and east-ern member states of the EU. Even greater effects could be achieved if other CIS countries were part of this coopera-tion, not just EEU states. The net effects are not only pos-itive, they are of a magnitude that represents a substantial impact on the people’s purchasing power, especially in the EEU states. While there are some redistributional effects associated with a potential free trade agreement, these could be effectively mitigated by well-thought out transi-tional strategies.
A free trade area between the EU and the Eurasian region has considerable potential to deescalate tensions and cre-ate a basis for cooperation. Such a plan should not be dis-missed lightly.
17
Free Trade from Lisbon to Vladivostok
Abbreviations
CIS Commonwealth of Independent StatesEU European UnionEEU Eurasian Economic UnionENP European Neighbourhood PolicyFTA Free trade areaNATO North Atlantic Treaty OrganisationNTB Non-tariff barriers (to trade)
Literature
Bildt, C. (2016, 2 11). Three Ways to Stop a ‘Revisionist, Militaristic’ Russia. Politico.
Der Standard. (03.06.2016). Merkel: Russland-Sanktionen enden bei Minsk-Erfüllung sofort.
Dragevna, W. (2012, 08). Russia, the Eurasian Customs Union and the EU: Cooperation, Stagnation or Rivarly. Chatham House Briefing Paper.
European Commission. (2014). Neighbourhood at the Crossroads - Taking Stock of a Year of Challenges. Brussels.
Felbermayr, A. u. (2016, 07). Free Trade from Lisbon to Vladivostok: Who is Positively or Negatively Impacted by a Eurasian Free Trade Agreement? Bertelsmann Stiftung, GED Studies.
Jackson, M. a. (2014, 05). Networks of Military Alliances, Wars, and International Trade. Stanford Graduate School of Business Working Paper 3097.
Souza, d. (2011). An Initial Estimation of the Economic Effects of the Creation of the EurAsEC Customs Union on Its Members. Washington DC: World Bank Poverty Reduction and Eco-nomic Management Network.
Spiegel. (2016, 06 23). Kritik an der Nato: Ischinger warnt vor Kriegsgefahr mit Russland.

18
Free Trade from Lisbon to Vladivostok
Imprint
© 2016 Bertelsmann StiftungBertelsmann StiftungCarl-Bertelsmann-Straße 25633311 GüterslohPhone +49 5241 81-0www.bertelsmann-stiftung.de
Responsible
Christian Bluth
Author
Christian Bluth
Design
Dietlind Ehlers, Bielefeld
Photo
Shutterstock /Zholobov Vadim


Address | Contact
Bertelsmann Stiftung
Carl-Bertelsmann-Straße 256
33311 Gütersloh
Phone +49 5241 81-0
GED-Team
Programm Nachhaltig Wirtschaften
Phone +49 5241 81-81353
www.ged-project.de
www.bertelsmann-stiftung.de