focus on equalities v - oxfordshire insight
TRANSCRIPT
Oxfordshire Insight Briefing, November 2013
This briefing provides a profile of Oxfordshire’s residents, based on the protected characteristics set out in the Equality Act 2010. A note on deprivation is also included.
Population
Latest estimates show 661,600 people were living in Oxfordshire in mid 2012:
Estimated population, 2012
Oxfordshire 660,800
Cherwell 142,800
Oxford 152,500
South Oxfordshire 135,500
Vale of White Horse 122,800
West Oxfordshire 107,100 Source: Office for National Statistics, 2012 mid year population estimates
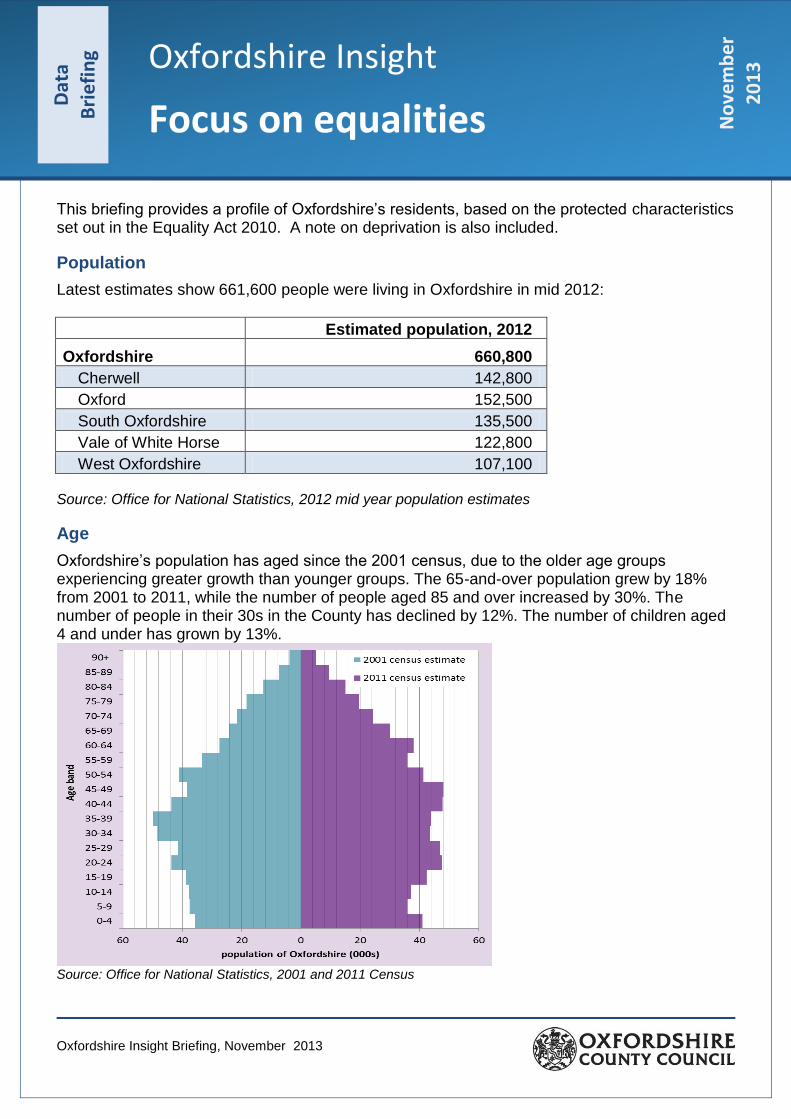
Age
Oxfordshire’s population has aged since the 2001 census, due to the older age groups experiencing greater growth than younger groups. The 65-and-over population grew by 18% from 2001 to 2011, while the number of people aged 85 and over increased by 30%. The number of people in their 30s in the County has declined by 12%. The number of children aged 4 and under has grown by 13%.
Source: Office for National Statistics, 2001 and 2011 Census
Oxfordshire Insight
Focus on equalities
Dat
a
Bri
efi
ng
No
vem
be
r
20
13

Oxfordshire Insight Briefing, November 2013
Sex
Women remain in the majority across the county.
Men Women
Oxfordshire 327,400 49.5% 333,300 50.4%
Cherwell 70,600 49.4% 72,200 50.6%
Oxford 76,000 49.8% 76,600 50.2%
South Oxfordshire 66,700 49.2% 68,800 50.8%
Vale of White Horse 61,200 49.8% 61,600 50.2%
West Oxfordshire 52,900 49.4% 54,200 50.6% Source: Office for National Statistics, 2012 Mid-year Estimates
Race and ethnicity
The ethnic composition of Oxfordshire has changed since the 2001 census. All of the county’s black or minority ethnic communities have grown, and now account for 9.2% of the population, just under double the 2001 figure of 4.9%. There has been a growth in people from white backgrounds other than British or Irish, who now account for 6.3% of the population (up from 4% in 2001). Much of this increase is explained by a movement of people from the countries which joined the EU in 2004 and 2007. In 2011, 13,000 residents in Oxfordshire were born in these countries, with more than half born in Poland (7,500 people, 2,700 resident in Oxford and 2,300 in Banbury). People from white gypsy or Irish Traveller backgrounds make up 0.1% of the county, and this is the same proportion across all the districts aside from West Oxfordshire, where 0.2% of the population classify themselves as such. 4.8% of the population are from Asian backgrounds, twice the 2001 figure of 2.4% People from Asian communities form the largest minority ethnic group in the county, and most come from Indian or Pakistani backgrounds (2.45%) The proportion from all Black backgrounds has more than doubled, from 0.8% to 1.75% of the county’s population. People from mixed ethnic backgrounds account for 2% of the population (up from 1.2% in 2001).

Oxfordshire Insight Briefing, November 2013
Source: ONS. Please note, to display minority groups on a chart, the category of ‘White British’ (83.6% of the population) is not shown. Table 1 Ethnic groups by district, 2011 (% of resident population)
Cherwell Oxford
South Oxfordshire
Vale of White Horse
West Oxfordshire
White
English/Welsh/Scottish/Northern Irish/British
86.3 63.6 90.9 89.8 92.6
Irish 0.8 1.6 0.8 0.8 0.7
Gypsy or Irish Traveller 0.1 0.1 0.1 0.1 0.2
Other White 5 12.4 4.2 4.3 3.4
Mixed/multiple ethnic group
White and Black Caribbean 0.6 1.1 0.4 0.3 0.3
White and Black African 0.3 0.5 0.1 0.1 0.1
White and Asian 0.5 1.3 0.5 0.5 0.5
Other Mixed 0.4 1.1 0.3 0.3 0.3
Asian/Asian British
Indian 1.2 2.9 0.6 0.7 0.3
Pakistani 1.7 3.2 0.1 0.3 0.1
Bangladeshi 0.1 1.2 0.1 0.2 0.1
Chinese 0.5 2.3 0.3 0.5 0.3
Other Asian 0.8 2.8 0.6 0.8 0.5
Black/African/ Caribbean/
Black British
African 0.7 2.9 0.3 0.7 0.3
Caribbean 0.4 1.2 0.2 0.2 0.1
Other Black 0.2 0.5 0.1 0.1 0.1
Other ethnic group
Arab 0.1 0.6 0.1 0.1 0.1
Any other ethnic group 0.3 0.7 0.1 0.2 0.1
Source: ONS, 2011 Census
0% 1% 2% 3% 4% 5% 6% 7%
Gypsy or Irish Traveller
Other Black
Arab
White and Black African
Any other ethnic group
Bangladeshi
Caribbean
Other Mixed
White and Black Caribbean
White and Asian
Chinese
Irish
African
Other Asian
Pakistani
Indian
Other White
% of population
Minority Ethnic Groups in Oxfordshire, 2011
Oxfordshire Insight Briefing, November 2013
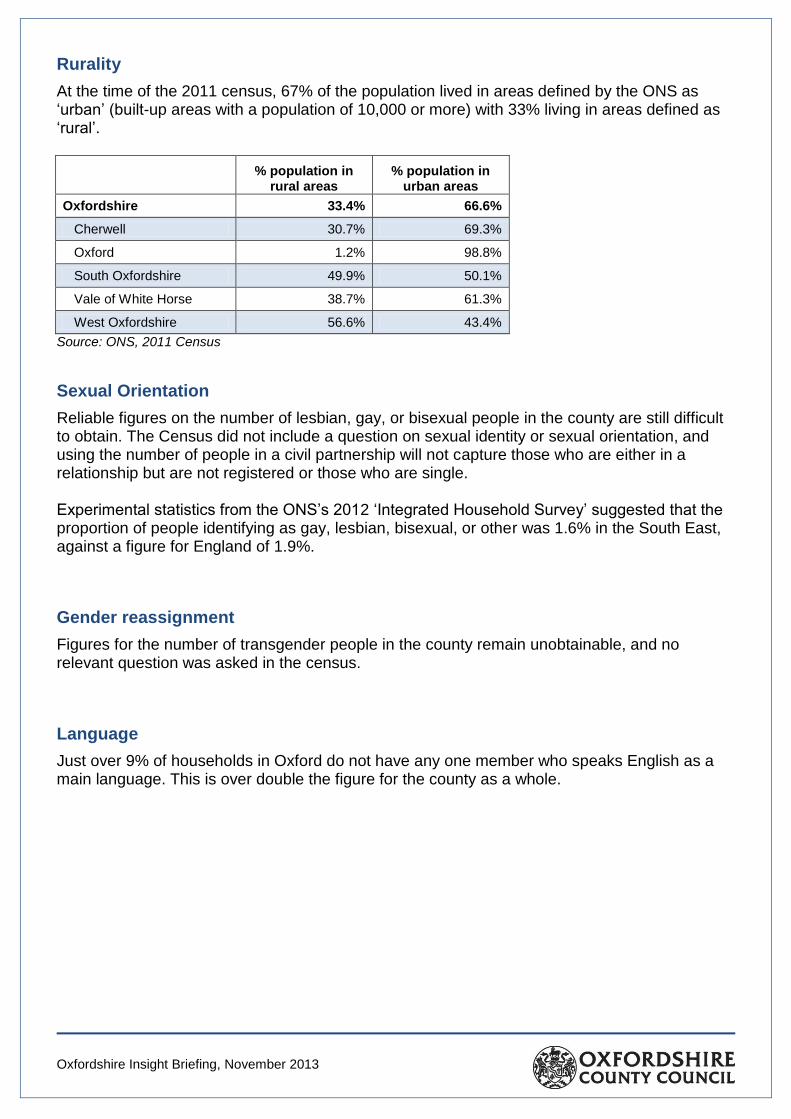
Rurality
At the time of the 2011 census, 67% of the population lived in areas defined by the ONS as ‘urban’ (built-up areas with a population of 10,000 or more) with 33% living in areas defined as ‘rural’.
% population in
rural areas % population in
urban areas
Oxfordshire 33.4% 66.6%
Cherwell 30.7% 69.3%
Oxford 1.2% 98.8%
South Oxfordshire 49.9% 50.1%
Vale of White Horse 38.7% 61.3%
West Oxfordshire 56.6% 43.4%
Source: ONS, 2011 Census
Sexual Orientation
Reliable figures on the number of lesbian, gay, or bisexual people in the county are still difficult to obtain. The Census did not include a question on sexual identity or sexual orientation, and using the number of people in a civil partnership will not capture those who are either in a relationship but are not registered or those who are single. Experimental statistics from the ONS’s 2012 ‘Integrated Household Survey’ suggested that the proportion of people identifying as gay, lesbian, bisexual, or other was 1.6% in the South East, against a figure for England of 1.9%.
Gender reassignment
Figures for the number of transgender people in the county remain unobtainable, and no relevant question was asked in the census.
Language
Just over 9% of households in Oxford do not have any one member who speaks English as a main language. This is over double the figure for the county as a whole.

Oxfordshire Insight Briefing, November 2013
Source: ONS, 2011 Census
Religion
60% of the county’s population are Christian, whilst 28% do not have any religion. The county’s Muslims make up 2.4% of the populace. The proportion of Hindus in Oxfordshire in 2011 was 0.6%. The size of the county’s Jewish population is 0.3%. The growth and size of county’s Buddhist population (0.5%) is in line with the regional and national figures.
Source: ONS, 2011 Census
0
1
2
3
4
5
6
7
8
9
10
Cherwell Oxford South Oxfordshire Vale of WhiteHorse
West Oxfordshire Oxfordshire
% o
f H
ou
seh
old
s Households where at least one member does not have English as a
main language
At least one but not all people aged 16 and over in household have English as a main language (English orWelsh in Wales)
No people aged 16 and over in household but at least one person aged 3 to 15 has English as a main language(English or Welsh in Wales)
No people in household have English as a main language (English or Welsh in Wales)
0% 10% 20% 30% 40% 50% 60% 70%
Sikh
Jewish
Any other religion
Buddhist
Hindu
Muslim
Religion not stated
No religion
Christian

Oxfordshire Insight Briefing, November 2013
As the table below shows, Oxford remains the most diverse district in the county.
Cherwell Oxford
South Oxfordshire
Vale of White Horse
West Oxfordshire
Christian 64% 48% 64% 63% 65%
No religion 25% 33% 27% 27% 26%
Religion not stated 7% 8% 8% 7% 7%
Muslim 2.3% 6.8% 0.5% 0.9% 0.4%
Buddhist 0.4% 0.9% 0.3% 0.4% 0.3%
Hindu 0.4% 1.3% 0.4% 0.5% 0.2%
Any other religion 0.4% 0.5% 0.4% 0.4% 0.4%
Sikh 0.3% 0.3% 0.1% 0.1% 0.0%
Jewish 0.1% 0.7% 0.2% 0.2% 0.2% Source: ONS, 2011 Census
Disability
The proportion of residents reporting that their day-to-day activities are limited either a little or a lot due to a long-standing health problem or disability is roughly the same across the districts.
Source: ONS, 2011 Census
0
2
4
6
8
10
12
14
16
Cherwell Oxford SouthOxfordshire
Vale of WhiteHorse
WestOxfordshire
Oxfordshire
% o
f p
op
ula
tio
n
People who find their day-to-day activites limited due to a health problem or disability
Limited a lot Limited a little

Oxfordshire Insight Briefing, November 2013
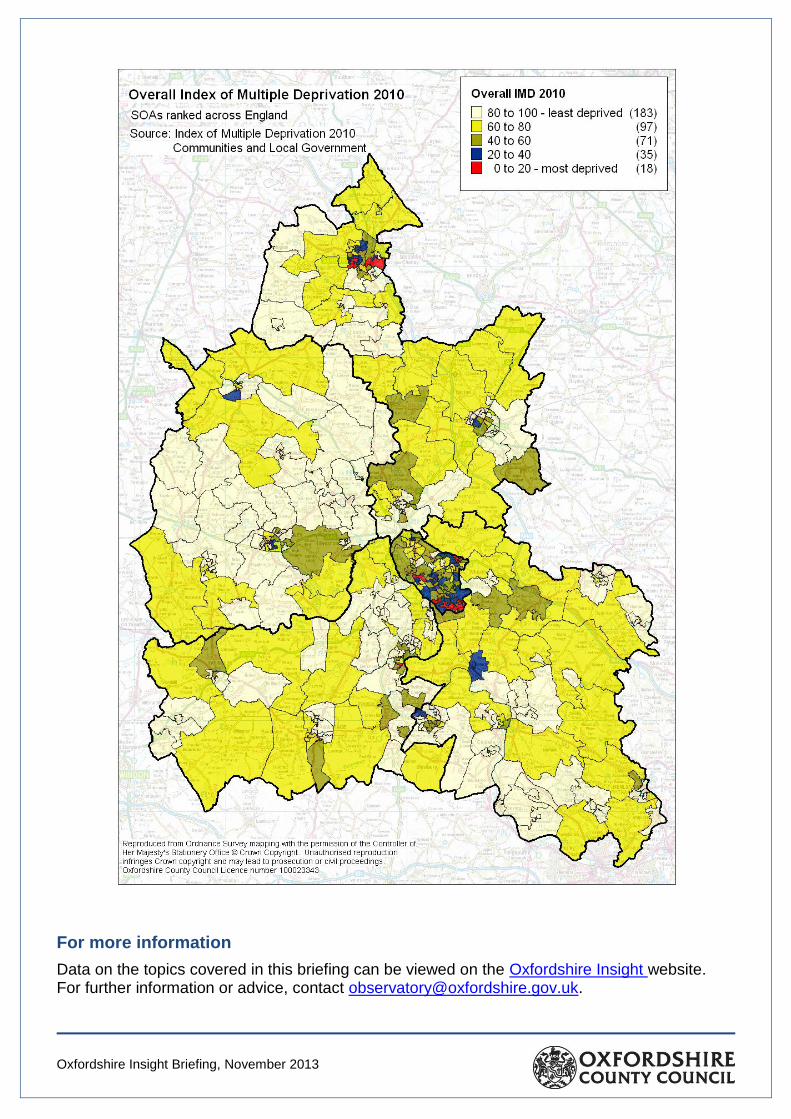
Deprivation
The Index of Multiple Deprivation (IMD) combines over 30 measures into a single deprivation score for each Lower Super Output Area (LSOA) in England1. These scores are then ranked to show relative deprivation at a local level across the country (where rank 1 is the most deprived and rank 32,482 is the least deprived). According to the 2010 IMD Oxfordshire has generally low levels of deprivation: South Oxfordshire, Vale of White Horse and West Oxfordshire districts rank in the 10% least deprived local authorities in England.
However, eighteen local areas in the County are amongst the 20% most deprived in England. These include 12 areas in Oxford, five in Banbury and one in Abingdon Caldecott ward (table 2). One area of Northfield Brook ward in Oxford ranks amongst the 10% most deprived nationally.
Table 2 LSOAs in Oxfordshire in the 20% most deprived nationally
Code LSOA (name includes the ward)
Score (higher is more deprived)
Rank (lower is more deprived)
% rank of LSOAs of 32,482 in England
E01028568 Northfield Brook 018B 45.23 3165 9.74
E01028577 Rose Hill and Iffley 016F 44.49 3346 10.30
E01028520 Blackbird Leys 018A 42.85 3740 11.51
E01028569 Northfield Brook 018C 42.46 3844 11.83
E01028514 Barton and Sandhills 005B 41.74 4043 12.45
E01028513 Barton and Sandhills 005A 41.57 4096 12.61
E01028449 Banbury Ruscote 005A 41.20 4209 12.96
E01028435 Banbury Grimsbury & Castle 004A 40.50 4424 13.62
E01028518 Blackbird Leys 017B 40.43 4438 13.66
E01028454 Banbury Ruscote 005F 40.03 4551 14.01
E01028552 Littlemore 016A 38.45 5037 15.51
E01028450 Banbury Ruscote 005B 38.21 5116 15.75
E01028522 Carfax 008B 37.80 5245 16.15
E01028517 Blackbird Leys 017A 37.68 5296 16.30
E01028436 Banbury Grimsbury & Castle 004A 37.19 5452 16.78
E01028576 Rose Hill and Iffley 016E 36.80 5575 17.16
E01028567 Northfield Brook 017D 35.24 6133 18.88
E01028692 Abingdon Caldecott 008C 34.77 6302 19.40
Source: Department for Communities and Local Government, Index of Multiple Deprivation, 2010
1 The LSOA is a small geographical area used for producing small area statistics. Each one has an average
population of 1,500). There are 32,482 SOAs in England and 404 in Oxfordshire.
Oxfordshire Insight Briefing, November 2013
For more information
Data on the topics covered in this briefing can be viewed on the Oxfordshire Insight website. For further information or advice, contact [email protected].