fmt beta user guide - optical imaging core facility | the university
TRANSCRIPT
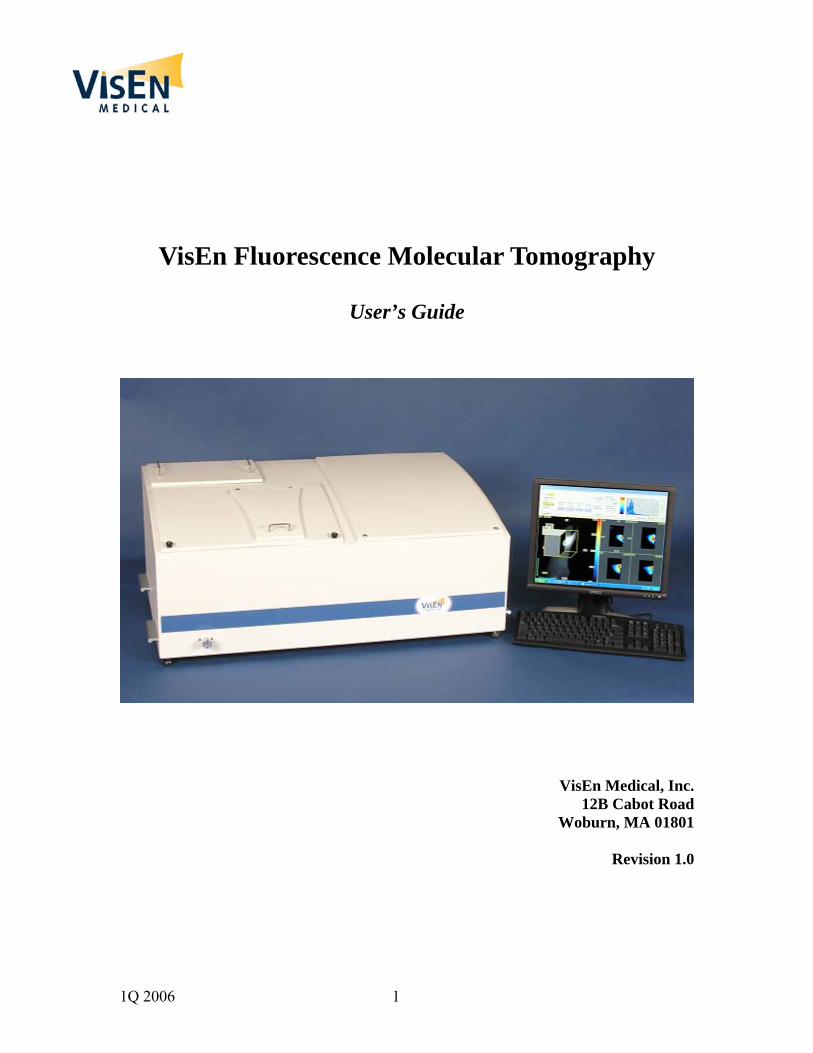
VisEn Fluorescence Molecular Tomography
User’s Guide
VisEn Medical, Inc. 12B Cabot Road
Woburn, MA 01801
Revision 1.0
1Q 2006 1

VisEn FMT User’s Guide
© VisEn Medical, Inc., 2006. All rights reserved. No section of this manual may be photocopied, reproduced, translated into another language, stored in a retrieval system, or transmitted in any form without the prior written consent of VisEn Medical, Inc. The information contained in this manual is subject to change without notice. VisEn Medical makes no warranty of any kind with regard to this written material. VisEn Medical assumes no responsibility for any errors that may appear in this document. FMT, VisEn and the VisEn logo are trademarks of VisEn Medical, Inc. Cy5.5 and Cy 7 are trademarks of Amersham Biosciences. AlexaFluor680 and AlexaFluor750 are trademarks of Molecular Probes. Access, Excel, Windows and Windows XP are registered trademarks of Microsoft Corp. All other products or name brands are trademarks of their respective holders. The FMT imaging system is covered under several issued and pending US and international patents. For laboratory research use only. Not suitable or intended for human or animal diagnostic or therapeutic use.
1Q 2006 2
VisEn FMT User’s Guide
Table of Contents 1 Overview ................................................................................................. 5
1.1 Warnings, Cautions and Notes............................................................................ 9 1.2 Explanation of Symbols.................................................................................... 11 1.3 Labels and Markings......................................................................................... 12
2 System Installation and Configuration.............................................. 14 2.1 Environmental and Site Requirements.............................................................. 14 2.2 Electrical Requirements .................................................................................... 16 2.3 General and Laser Safety .................................................................................. 16 2.4 Computer Specification .................................................................................... 17 2.5 Installing the FMT System................................................................................ 18
2.5.1 Unpacking................................................................................................................ 18 2.5.2 Disposing of the FMT System................................................................................. 18 2.5.3 Connecting the computer cables .............................................................................. 19 2.5.4 Connecting the fluid drain ....................................................................................... 19 2.5.5 Filling the fluid tanks............................................................................................... 19
2.6 Before launching FMT 3.0 Software for the first time ..................................... 22 2.7 Multiple Database Setup ................................................................................... 23 2.8 List of Abbreviations and Acronyms................................................................ 25
3 Typical FMT Imaging Session and Overview of the FMT 3.0 Program ....................................................................................................... 26
3.1 Scan, Reconstruction and ROI Analysis tabs ................................................... 27 3.2 Viewing Images ................................................................................................ 28
3.2.1 General Viewing Options ........................................................................................ 29 3.2.2 Histogram controls .................................................................................................. 30
4 FMT System Database......................................................................... 32 4.1 Data Menu......................................................................................................... 33 4.2 Study/Subject Tab............................................................................................. 34 4.3 Database Management Menu............................................................................ 37
4.3.1 Delete Database Items ............................................................................................. 37 4.3.2 Import/Export Database Item .................................................................................. 38
5 Scan Acquisition Process..................................................................... 40 5.1 Scan Setup......................................................................................................... 42 5.2 Laser Channel ................................................................................................... 43 5.3 Reflectance Images ........................................................................................... 43 5.4 Scan Field.......................................................................................................... 44 5.5 Fluid Handling .................................................................................................. 45 5.6 Scan Execution.................................................................................................. 47 5.7 Review Scan...................................................................................................... 48 5.8 Advanced Scan Info Menu................................................................................ 50
6 The Tomographic Reconstruction process ........................................ 52 6.1 Recon Setup ...................................................................................................... 53 6.2 Verify Reconstruction Area .............................................................................. 53 6.3 Select Reconstruction Resolution ..................................................................... 53
1Q 2006 3
VisEn FMT User’s Guide
6.4 Execute Reconstruction .................................................................................... 54 6.5 View Reconstruction results ............................................................................. 54 6.6 Advanced Reconstruction features ................................................................... 58 6.7 Batch Processing of Reconstructions................................................................ 63
7 ROI Analysis......................................................................................... 64 7.1 Analysis Setup .................................................................................................. 65 7.2 Defining a Region of Interest (ROI) ................................................................. 66 7.3 Storing a ROI Analysis ..................................................................................... 68 7.4 Reviewing an Analysis ..................................................................................... 68 7.5 Analysis Display Options Page......................................................................... 69
7.5.1 Toolbar Display Modes ........................................................................................... 69 7.5.2 ROI Shape................................................................................................................ 69 7.5.3 ROI Min Value ........................................................................................................ 70 7.5.4 Viewing ROI Contour.............................................................................................. 70
8 Exporting Data and Images ................................................................ 71 8.1 Spreadsheet Export ........................................................................................... 71 8.2 Image Export..................................................................................................... 72 8.3 DICOM Export ................................................................................................. 74 8.4 Capture Screen.................................................................................................. 75
9 Guidelines and Troubleshooting Tips................................................ 76 9.1 Scan Setup......................................................................................................... 76 9.2 Reconstruction Parameters................................................................................ 77
10 Maintaining the System....................................................................... 79 10.1 Cleaning the imaging chamber ......................................................................... 79 10.2 System Diagnostics........................................................................................... 81 10.3 System Calibration............................................................................................ 81
11 Warranty and Regulatory Information............................................. 83 11.1 VisEn FMT Limited Warranty.......................................................................... 83 11.2 Regulatory Information..................................................................................... 86
12 Technical Services and Support ......................................................... 89 12.1 Obtaining Technical Assistance........................................................................ 89 12.2 Return Material Procedure................................................................................ 89 12.3 Repackaging the VisEn FMT System............................................................... 89
Appendix A: Index-Matching Fluid Material Safety Data Sheet .......... 91
1Q 2006 4
VisEn FMT User’s Guide
1 Overview The Fluorescence Molecular Tomography (FMT) unit is an in vivo small-animal imaging system for research use. It is designed to provide calibrated quantitative tomographic images and data of fluorescence in biological tissue at any depth. The instrument operates on two near-infrared channels excited at 670 nm and 746 nm, and emitting at 700 nm and 775 nm respectively. User interaction with the FMT system primarily consists of placing and removing the subject into and out of the imaging chamber. Image acquisition, data reconstruction and analysis is entirely software-driven from the PC provided with the system running the VisEn FMT 3.0 software. Laser and filter selection, acquisition of reflectance images, and other ancillary steps are all software-controlled as well. The user will, on occasion, fill up the index-matching fluid tank and cleaning solution tank (the latter is optional). The system is compatible with standard isoflurane-based gas anesthesia systems. The rest of this document is organized as follows:
• Section 2 summarizes system requirements and installation
• Section 3 describes the typical FMT imaging session and provides a summary overview of the FMT software application
• Section 4 describes the Data menu interface
• Section 5 describes the Scan acquisition process
• Section 6 describes the Reconstruction process
• Section 7 describes the Analysis process
• Section 8 summarizes the data and image export tools
• Section 9 presents some guidelines and troubleshooting tips
• Section 10 discusses system maintenance, diagnostics and calibration protocols
• Section 11 provides system warranty and regulatory information
• Section 12 provides technical services and support information
1Q 2006 5

VisEn FMT User’s Guide
IMF tank Cleaning solution tank Imaging
Chamber
Chamber release knob
Figure 1-1a: System overview
Imaging compartment vent
Power switch and cable connectors
Figure 1-1b: Power panel
1Q 2006 6

VisEn FMT User’s Guide
Chamber access cover with laser interlock
Chamber access panel for wide area access
Animal holder positioned in imaging chamber
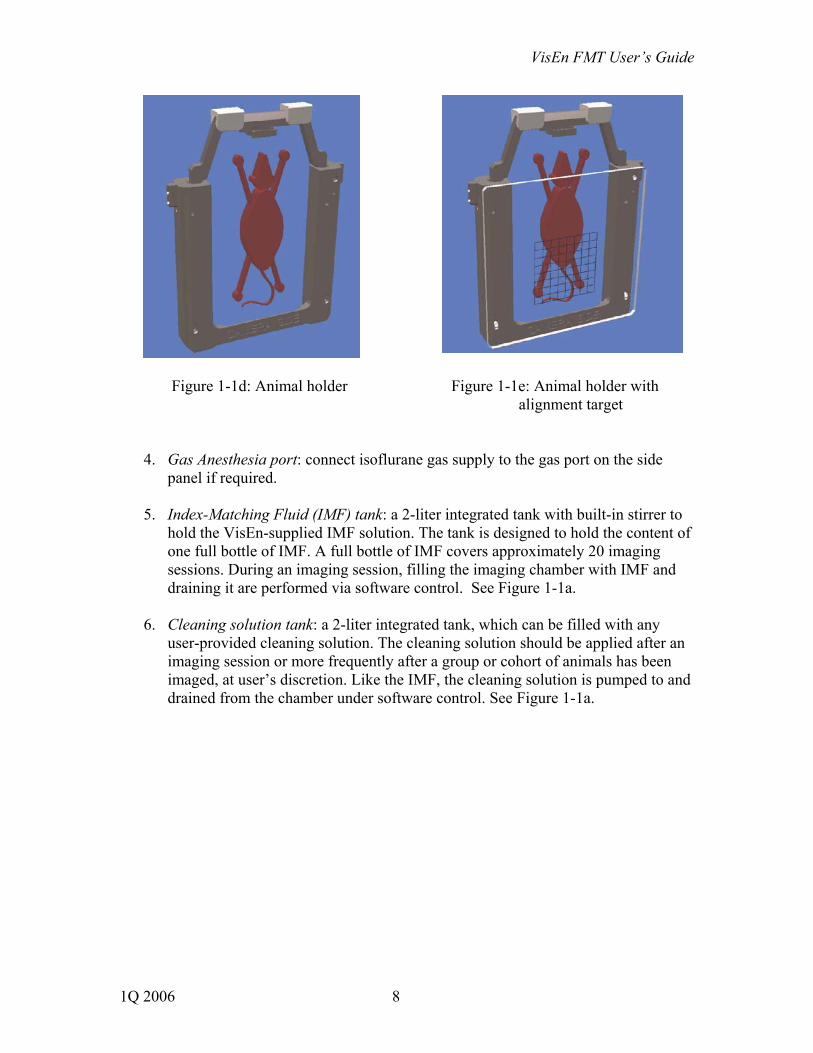
Figure 1-1c: Imaging chamber access lid and animal holder Referring to the annotated diagram of Figures 1-1a to 1-1e, the principal elements of the FMT system are:
1. Imaging chamber: open the lid to expose the small-animal imaging chamber and position the animal. Close the lid prior to initiating a scan. A laser safety interlock switch disables the lasers as long as the lid remains open. The imaging chamber is designed to be held at the subject’s body temperature. See Figure 1-1c.
2. Removable animal holder with alignment target: the holder is designed to be removed from the instrument and placed on the lab bench. Position the anesthetized animal on the holder; use the alignment target to center the lesion on or close to the center of the alignment target. See Figures 1-1d and 1-1e
3. Imaging chamber backplate fix/release knob: once the animal is positioned in the chamber, adjust the backplate position to ensure good contact with the animal (Figure 1-1c).
1Q 2006 7
VisEn FMT User’s Guide
Figure 1-1d: Animal holder Figure 1-1e: Animal holder with alignment target
4. Gas Anesthesia port: connect isoflurane gas supply to the gas port on the side panel if required.
5. Index-Matching Fluid (IMF) tank: a 2-liter integrated tank with built-in stirrer to hold the VisEn-supplied IMF solution. The tank is designed to hold the content of one full bottle of IMF. A full bottle of IMF covers approximately 20 imaging sessions. During an imaging session, filling the imaging chamber with IMF and draining it are performed via software control. See Figure 1-1a.
6. Cleaning solution tank: a 2-liter integrated tank, which can be filled with any user-provided cleaning solution. The cleaning solution should be applied after an imaging session or more frequently after a group or cohort of animals has been imaged, at user’s discretion. Like the IMF, the cleaning solution is pumped to and drained from the chamber under software control. See Figure 1-1a.
1Q 2006 8

VisEn FMT User’s Guide
1.1 Warnings, Cautions and Notes The precautions are grouped into two main categories, WARNINGS and CAUTIONS. In addition, the manual highlights Notes of significant information relevant to the monitor display, operator instruction, or operator action being described in the text.
Notes provide useful information regarding a function or procedure. The following are warnings that define precautions that must be observed to avoid injury to personnel. Some of these precautions are specific to particular operator actions. They will appear in the text. Others may be of a “general-purpose” nature, and may not be duplicated in the many places in which they may be relevant.
1Q 2006 9

VisEn FMT User’s Guide
1Q 2006 10

VisEn FMT User’s Guide
Laser cautions are shown in Section 1.3 below.
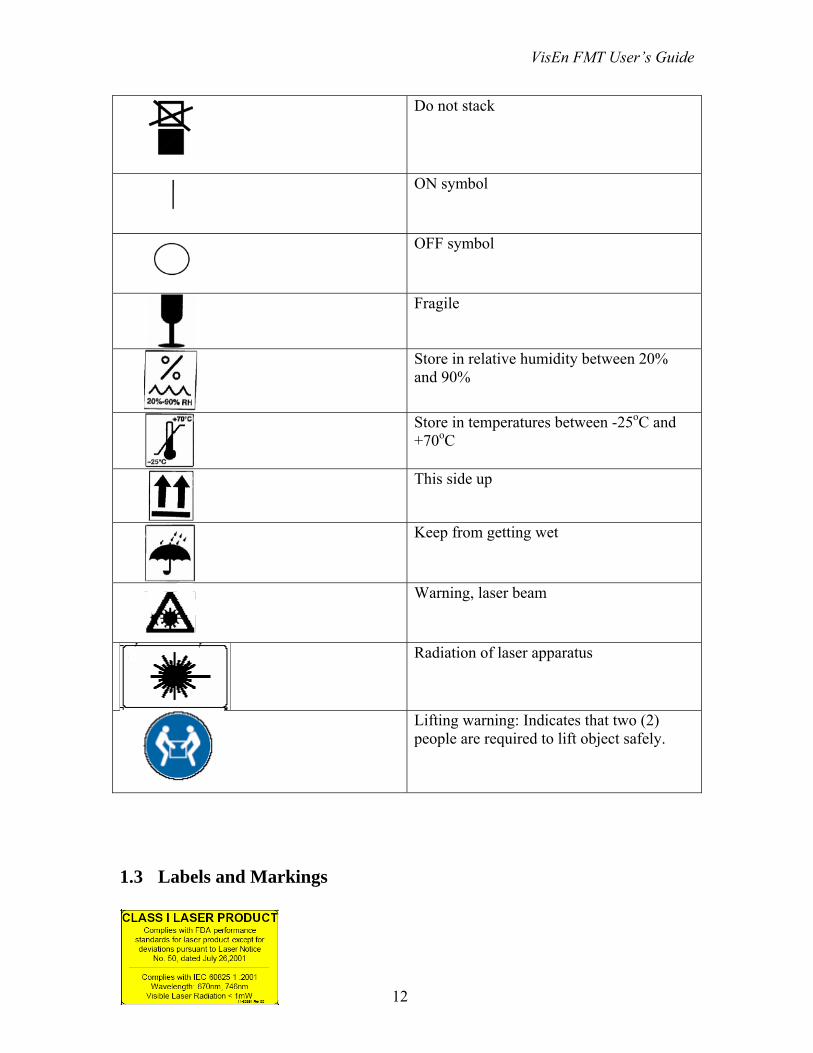
1.2 Explanation of Symbols
Symbol Explanation Finger pinch warning
Hazardous Voltage
Refer to User Guide
Protective earth
Date of Manufacture
Do not discard
NRTL Approval for the US and Canada, CE Mark
1Q 2006 11
VisEn FMT User’s Guide
Do not stack
ON symbol
OFF symbol
Fragile
Store in relative humidity between 20% and 90%
Store in temperatures between -25oC and +70oC
This side up
Keep from getting wet
Warning, laser beam
Radiation of laser apparatus
Lifting warning: Indicates that two (2) people are required to lift object safely.
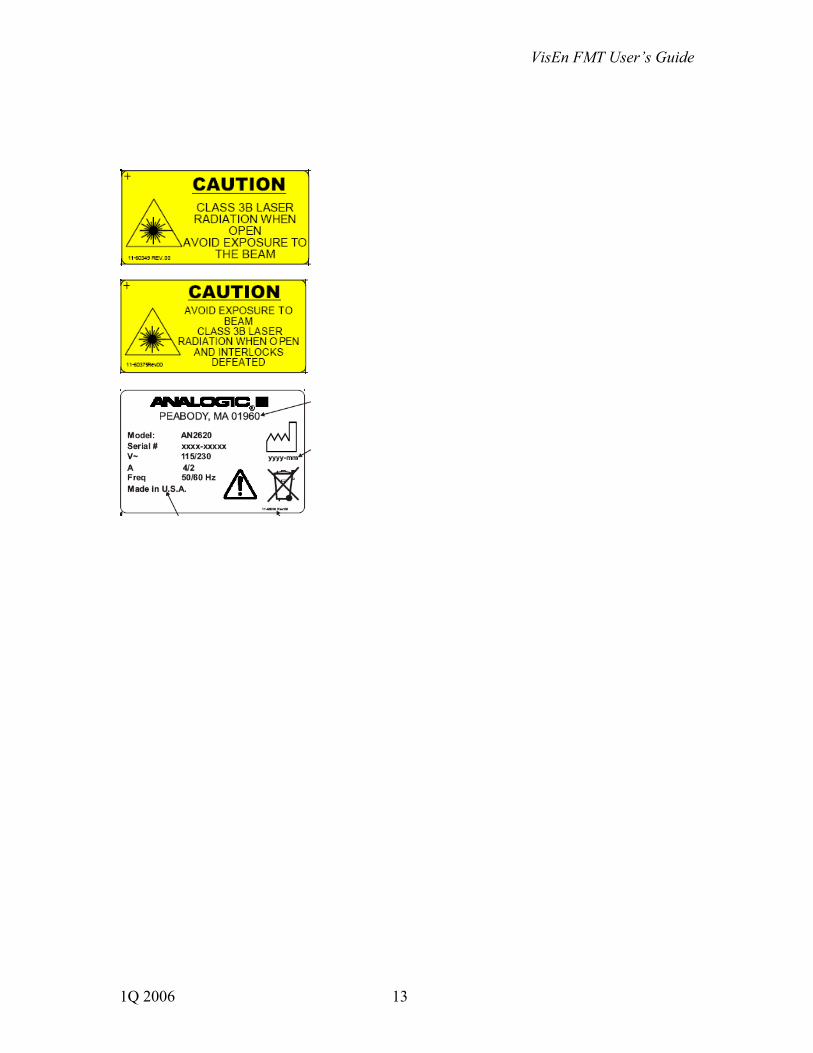
1.3 Labels and Markings
1Q 2006 12
VisEn FMT User’s Guide
1Q 2006 13

VisEn FMT User’s Guide
2 System Installation and Configuration
2.1 Environmental and Site Requirements The FMT System is designed for indoor use only, and can be operated within the temperature and humidity ranges normally encountered in laboratories. For normal operation, these ranges should be as follows:
Temperature 15oC to 28oC Relative Humidity < 55%, non-condensing
Sufficient space should be provided to allow access to all compartments of the system, as well as the switch panel on the right side (see Figure 1-1b). The bench or tabletop that carries the system must be capable of supporting the weight of the system. The following are the critical dimensions of the system:
• Width: 91cm (36 inches) • Depth: 61cm (24 inches) • Height: 40cm (16 inches) • Weight: 60kg (132 lbs.)
Host Computer (PC):
• Width: 18.96 cm (7.3 inches) • Depth: 43.18 cm (17 inches) • Height: 41.14 cm (16.2 inches) • Weight: 12 kg ( 27 lbs)
Monitor:
• Width: 37.6 cm (13.48 inches) • Depth: 21.4 cm (8.4 inches) • Height: 54.8 cm (21.6 inches) • Weight: 2 kg (5 lbs)
To obtain the best performance from your FMT System:
• Place the FMT System in an environment that is relatively dust-free • Make sure that the bench top is free from vibrations or mechanical shocks • Do not place the FMT System or the PC directly against room heating or cooling
equipment, ducts, water pipes, or in direct sunlight • Leave at least 5cm (2 inches) between the sides or rear of the instrument and any
vertical obstruction (walls, partitions, or other equipment) to allow for adequate ventilation
1Q 2006 14

VisEn FMT User’s Guide
• During operation, there should be a minimum gap of at least 30 cm (12 inches) between any surface and the top surface of the instrument, to allow for the fluid compartment lid to be fully opened
• The area near the PC must be free of strong magnetic fields • Provide space for the waste container near or under the bench or table top that
holds the FMT System • Do not install the instrument against a wall to the right, in order to leave sufficient
access to the power switch and the power cord. The power cord for the FMT System is the means of disconnection.
1Q 2006 15
VisEn FMT User’s Guide
2.2 Electrical Requirements The VisEn FMT System operates on power supplies of 110V/220V, 50Hz/60Hz. The line supply must be within 10% of the nominal voltage.
CAUTION
The Personal Computer supplied with the FMT must be manually switched to accept either 115 V or 230 V line voltage. The red voltage selector is located on the rear panel of the desktop tower, as described in the enclosed computer documentation.
The rated power of the FMT System is 115/230 VAC, 4/2 A, 50/60 Hz. The rated power of the PC is 115/230 VAC, 6/3 A, 60/50 Hz. The rated power of the monitor is 100-240 VAC, 2A Max, 60/50 Hz. It is recommended to plug the power connectors for the FMT System, the PC and the monitor into a surge-protected power strip rather than into a wall outlet directly.
2.3 General and Laser Safety The VisEn FMT System has been designed and tested in accordance with the safety requirements of the International Electrotechnical Commission (IEC). The System conforms to IEC publication 61010-1 (“Safety requirements for electrical equipment for measurement, control and laboratory use”) as it applies to IEC Class 1 (earthed) appliances, and therefore meets the requirements of EC Low Voltage directive 73/23/EEC, amended by 93/68/EEC. If possible, avoid any adjustment, maintenance and repair of the opened, operating instrument. If any adjustment, maintenance or repair of the opened, operating instrument is necessary, this must only be done by a skilled person who is aware of the hazard involved. The VisEn FMT System is a CDRH Class I, EN 60825-1/IEC 60825-1 Class 1 laser product. The optical train contains two Class IIIb laser diodes emitting continuous wave radiation at wavelengths of 670 nm and 746 nm with a maximum power of 80 mW. Laser
1Q 2006 16

VisEn FMT User’s Guide
radiation is automatically interrupted when either the small or large lid above the imaging chamber is opened. The VisEn FMT System complies with the following laser safety regulations:
1. 21 CFR Chapter 1, Subchapter J, “Radiological Health”, Part 1040.10, administered by the Center for Devices and Radiological Health, U.S. Department of Health and Human Services.
2. EN 60825-1:1994 and Amendment 1 and Amendment 2 “Radiation safety of laser products, equipment classification, requirements and user’s guide”. EN 60825-1 implements CENELEC European Normalization document EN 60825-1
3. IEC 60825-1:2001 “Safety of laser products –Part 1: Equipment classification, requirements and user’s guide”.
2.4 Computer Specification The VisEn FMT System is shipped with its host computer already pre-configured. For optimal performance, it is required to dedicate this computer exclusively for use with the FMT System, and that the FMT System be the only USB device connected to the computer’s USB port. We recommend not installing any additional software applications on this computer. The Dell Optiplex GX620 host computer specifications are as follows:
Windows XP PC (Service Pack 2) personal computer with NTFS file system Pentium 4 CPU 3.4GHz, 800MHz FSB, Hyperthreading enabled 2GB of 533MHz DDR2 RAM 160GB Serial ATA 7200RPM Hard Drive
1Q 2006 17

VisEn FMT User’s Guide
Video board 128MB ATI Radeon X600SE graphics Standard Ethernet NIC, DVD burner/reader, USB 2.0 ports, 2 RS232 ports, floppy drive
2.5 Installing the FMT System The FMT unit is shipped already pre-assembled and configured. Prior to powering up the system for the first time, the system must be connected to the computer via the USB port and two serial ports, and to a fluid drain for the IMF and cleaning fluid run-off.
2.5.1 Unpacking Examine the cartons and look for any evidence of mishandling in the shipment. Follow institutional procedures for reporting such evidence. Remove the contents from the shipping cartons. Compare the shipped items with the packing slip and your order. Each VisEn FMT System shipment includes the items listed below.
One FMT System –AN2620 One Host Computer –Dell GX620 with appropriate country power cord
(determined at time of order) One Monitor –Dell 1704fpvt with appropriate country power cord (determined at
time of order) One Keyboard One Mouse One User’s Guide and CD
Retain the shipping cartons in case of the need for return shipment. Supplies The VisEn FMT System is designed to be used in conjunction with Index-Matching Fluid (IMF), which can be obtained from VisEn Medical under the following catalog number: One case of Index-Matching Fluid (IMF) – VM10094
2.5.2 Disposing of the FMT System To avoid contamination or infecting personnel, the environment or other equipment, make sure you disinfect and decontaminate the system/components appropriately before disposing of it in accordance with your country’s laws for equipment containing electrical and electronic parts.
1Q 2006 18

VisEn FMT User’s Guide
For disposal of parts and accessories, follow local regulations regarding disposal of laboratory waste. For disposal of lithium batteries, follow local regulations for safe disposal.
2.5.3 Connecting the computer cables
There are four electrical cables coming from the right side panel of the VisEn FMT system. These are as follows:
• Camera USB connector • 2 serial port connectors • System power cord
The camera USB connector must be inserted into the correspondingly labeled USB port in the rear of the desktop tower PC. Similarly, the two serial port connectors must be inserted into the COM1 and COM2 serial ports of the desktop tower PC as labeled.
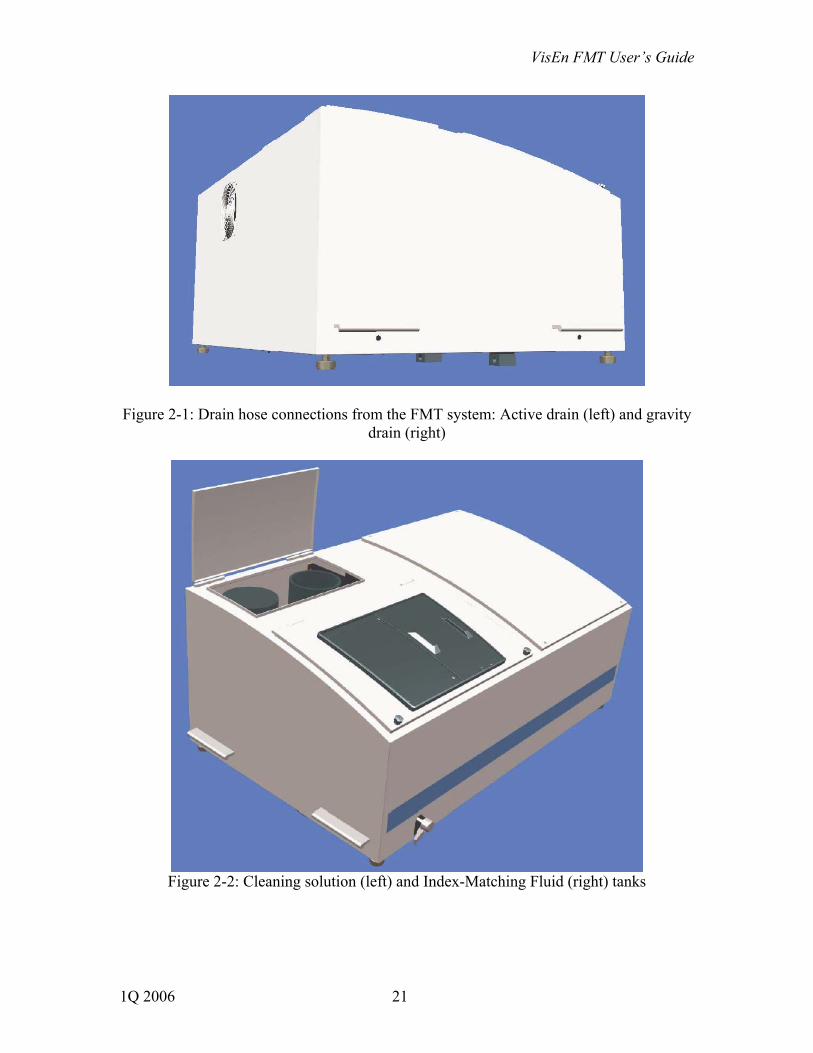
2.5.4 Connecting the fluid drain Indicated in Figure 2-1 are the two drain connections on the left side of the FMT System. The active drain is actuated via software and is used to transfer index-matching fluid (IMF) and cleaning solution from the imaging chamber to a waste receptacle (see Section 5.5). The gravity drain is a passive safety measure in case of accidental overspill or system failure.
• Insert the provided Quick-Connect (brown hose with white connector) into the active drain port below the chassis on the left side panel. An audible sharp click will indicate that the drain is properly connected.
• Insert the 1cm (0.5 inch) diameter clear hose into the gravity drain port on the left side panel while rotating it until it is fully engaged.
Connect the two drain hoses to a waste receptacle (any lab liquid waste receptacle or carboy would be appropriate).
2.5.5 Filling the fluid tanks Referring to Figure 2-2, the rear left side of the instrument contains the tanks for the cleaning solution and the index-matching fluid (IMF), which are labeled accordingly. The tanks can be exposed by raising the hinged cover and removing the tank covers. Each tank has a capacity of 2.1 liters.
1Q 2006 19
VisEn FMT User’s Guide
You will notice that the IMF tank (right tank) has a small pellet at the bottom, which acts as a stirring device. The duty cycle of this stirrer is automatically controlled by the FMT software and does not need user intervention. To fill the IMF tank, remove its cover and, after vigorous shaking, pour the contents of one (1) VisEn Medical IMF 2-Liter bottle into the tank. Depending on the specific imaging conditions, a single IMF bottle should cover approximately 10-20 mice. The IMF is heated up to body temperature (37oC) prior to entering the imaging chamber.
The cleaning solution tank is filled in similar fashion. Please see Section 10.1 for recommended formulations of the cleaning solution. It is also possible to use distilled water as a cleaning solution. Section 5.5 describes the filling and draining of these fluids into and out of the imaging chamber from the FMT 3.0 software. Index-Matching Fluid disposal requirements: The Material Safety Data Sheet for VisEn’s Index-Matching Fluid formulation is included in Appendix A of this manual. The Index-Matching Fluid is considered non-toxic, non-hazardous and should be disposed of according to federal, state and local environmental control regulations.
1Q 2006 20
VisEn FMT User’s Guide
Figure 2-1: Drain hose connections from the FMT system: Active drain (left) and gravity
drain (right)
Figure 2-2: Cleaning solution (left) and Index-Matching Fluid (right) tanks
1Q 2006 21
VisEn FMT User’s Guide
The unit is now ready to be powered up. The power button is located on the right-hand side panel.
→Note: It is advisable to turn on power to the FMT System first, and then wait a few seconds prior to launching the FMT 3.0 software application.
2.6 Before launching FMT 3.0 Software for the first time In addition to the FMT imager hardware, the host PC runs the VisEn FMT 3.0 application software. This single application integrates the entire imaging sequence, from setting up a study and a subject, to performing a scan, performing tomographic reconstruction, and ROI Analysis and exporting results. The VisEn FMT 3.0 program relies on a hierarchical mapping of files in a database in order to maintain proper file associations. This mechanism is built using the Microsoft Access relational database. MS Access does not need to be installed on the PC for this application to run properly. Prior to launching the VisEn FMT 3.0 program for the first time, the database needs to be registered using the Windows XP operating system administrative tools, as outlined in the following steps. Note: this procedure has already been performed by the manufacturer prior to shipment of the VisEn FMT System and host computer. The procedure is documented here for reference only, should a re-installation ever be required in the future. The rest of this section may be skipped. To register the database file, run the system program Administrative Tools. The Administrative Tools program can be found under the Control Panel of the computer.
• Click the Data Sources (ODBC) icon displayed by the Administrative Tools, which opens the ODBC Data Source Administrator window.
• Select the User DSN folder, which lists User Data Sources.
• Click the button “Add ..” to open another window titled “Create New Data Source”, which lists available drivers for a data source.
• From this list, select the item “Driver do Microsoft Access (*.mdb)”, and then click the Finish button.
• This will open “ODBC Microsoft Access Setup” window. In this window, in the text box for Data Source Name, enter FMTdata. Under description, type in the words VisEn FMT database.
1Q 2006 22
VisEn FMT User’s Guide
• Then under the Database box, click the button “Select…” to open the “Select Database” window. After finding and selecting the file “FMTdata.mdb” under the directory “C:/FMT/info”, click “OK” button to close the Select Database window.
• Click “OK” button again to close the ODBC Microsoft Access Setup window. The name “FMTdata” should appear on the User Data Sources list of the ODBC Data Source Administrator window.
• Click “OK” button to complete the database setup.
2.7 Multiple Database Setup Once the Initial Registration has been completed, the home database and other databases are automatically registered by specifying the database locations in the configuration file, “Configure_FMT.txt”. There are two optional items added to the configuration file that facilitate database registration. The first of these, the “Home Database” item, specifies the default home database. The “Other Database” item, of which there may be more than one, specifies additional databases at the remote or local site. Multiple lines of Other Database items will set up access for multiple databases. Both the Home Database and Other Database entries follow the same format. In each of these items there are three fields to be specified:
• The first field “Name=” specifies the name of the database to be registered in the computer system. It can be any unique name in the registration. If a previous name is used here, the previous database will be replaced by the database declared here.
• The second field “File=” specifies the Microsoft access database file name and
its path. For example, the default home database has: File=C:\FMT\Info\FMTdata.mdb. If a remote database is being registered, the second field should specify a path of a mapped network drive. For example, if a database of file name FMTdata_Y05.mdb resides in a folder C:\FMT\Info of a remote computer named MyOfficeDesktop, that folder must be mapped to a disk drive by using the “Map Network Drive” feature under the Tools menu of Window Explorer. In the window of Map Network Drive, select a drive symbol such as “X:” and click the Browse button to select the folder in the network. The Folder box should appear as “\\MyOfficeDesktop\FMT”. With the mapped disk drive, the remote database can be registered in the same manner as the home database. Thus, the second field becomes File=X:\Info\FMTdata_Y05.mdb.
1Q 2006 23

VisEn FMT User’s Guide
• The third field “Menu=” specifies the name to appear in the Working Database
selection menu of the Data Menu. It also appears in Source Database, Target Database, and Delete Database selection menu in the Database Management features. For example: Menu= FMT_Lab Menu=Office_Desktop could describe the FMT System host PC and a remote office location database respectively.
The declaration is complete and effective only when all three fields are valid. The user can leave the third field open, for example, for the temporary suspension of accessing that database. After the multiple database registration is complete, future instances of the V3.0 Application will provide access to all newly registered databases.
1Q 2006 24
VisEn FMT User’s Guide
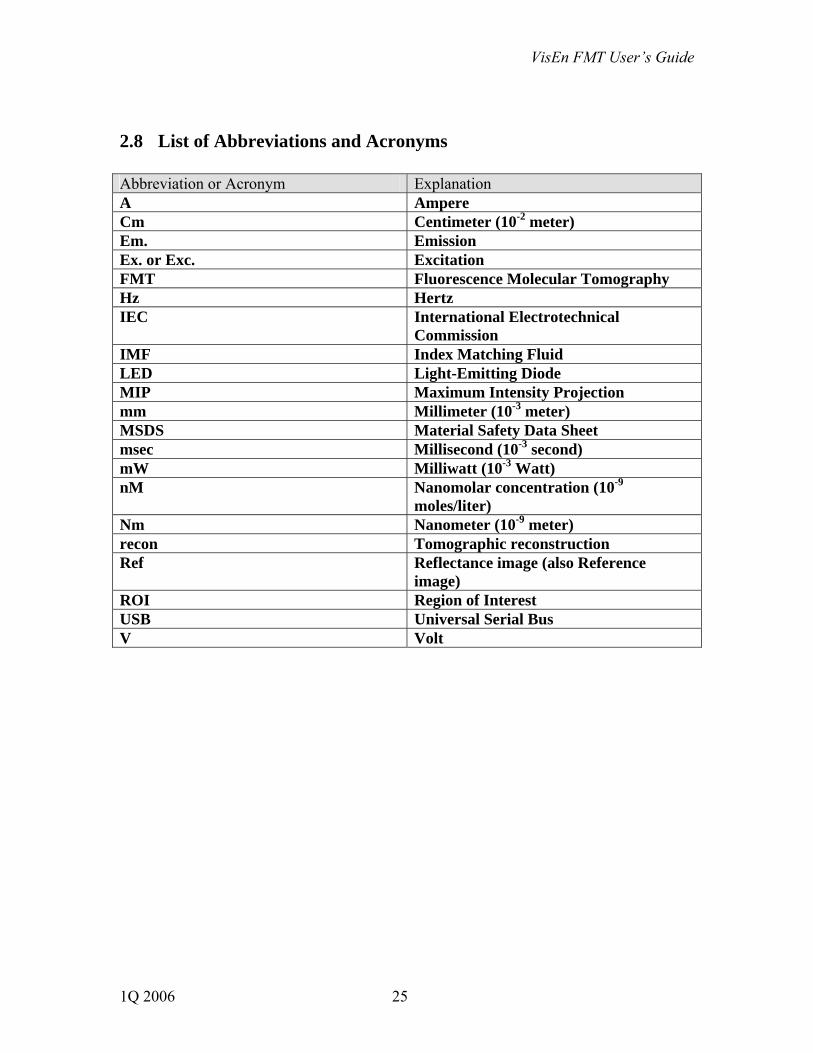
2.8 List of Abbreviations and Acronyms Abbreviation or Acronym Explanation A Ampere Cm Centimeter (10-2 meter) Em. Emission Ex. or Exc. Excitation FMT Fluorescence Molecular Tomography Hz Hertz IEC International Electrotechnical
Commission IMF Index Matching Fluid LED Light-Emitting Diode MIP Maximum Intensity Projection mm Millimeter (10-3 meter) MSDS Material Safety Data Sheet msec Millisecond (10-3 second) mW Milliwatt (10-3 Watt) nM Nanomolar concentration (10-9
moles/liter) Nm Nanometer (10-9 meter) recon Tomographic reconstruction Ref Reflectance image (also Reference
image) ROI Region of Interest USB Universal Serial Bus V Volt
1Q 2006 25

VisEn FMT User’s Guide
3 Typical FMT Imaging Session and Overview of the FMT
3.0 Program A typical imaging session with FMT consists of the following steps:
(A) Turn the imager power switch to the ON position (B) After waiting for 10 seconds, launch the FMT 3.0 application on the PC (C) Visually verify fluid levels in the IMF and cleaning solution tanks –refill as
needed (D) Position the animal on the holder using the alignment target, and insert the holder
into the imager. Close the lid. (E) From the PC, define a new study or new subject as appropriate (see Section 4) (F) Setup and execute a new scan (see Section 5) (G) When scan is complete, drain IMF and remove animal holder from the imaging
chamber. Note scan is automatically saved after acquisition.
At this juncture, the imaging session is complete. The remaining steps can be conducted off-line, independently of the imaging session:
(H) Setup and execute a new reconstruction (see Section 6) (I) Setup and execute a new analysis (see Section 7) (J) Optional: when a Study is complete, it is suggested that the user can apply a
cleaning solution to the chamber and heater to flush out any remaining IMF prior to system shutdown.
Upon launching the FMT 3.0 application, the screen shown in Figure 3-1 will be displayed. The program displays a top-level taskbar and five tabs at all times. These five tabs are arranged from left to right corresponding to the chronological sequence of an imaging session:
(1) Study/Subject, for defining a new study or a new subject (2) Scan, for setting up a new scan or viewing a previous scan (3) Reconstruction, for defining a new tomographic reconstruction or viewing an
existing reconstruction (4) ROI Analysis, for setting up a new Region of Interest analysis, or viewing an
existing analysis In addition to these four tabs, a fifth Data Menu tab to the right is used to display the database structure and/or to load existing items—whether studies, subjects, scans, reconstructions or analyses (Section 4).
1Q 2006 26

VisEn FMT User’s Guide
Information and entry fields in all screens are presented in the same style. The white text boxes are input parameters that can be edited. The gray text boxes display read-only information.
Figure 3-1: Initial screen upon launching FMT 3.0 application
3.1 Scan, Reconstruction and ROI Analysis tabs Each of the Scan, Reconstruction and ROI Analysis screens is laid out sequentially from left to right. A Setup button is shown at the left-hand side for the user to initiate a scan, reconstruction, or analysis operation; similarly, an Execute or Save button is shown on the right-hand side for execution of the corresponding operation after the relevant parameters have been defined (Figure 3-2). Sections 5 through 7 of this manual document these operations in further detail. Each of the Scan, Reconstruction and ROI Analysis screens contains a block with the key parameters of the current Scan, Recon, or Analysis. Just above the image display, a region labeled “Loaded Scan” identifies the active scan images, whether these images are generated from a current or prior scan operation (Figure 3-2). Similarly, a region labeled “Loaded Recon” in the Reconstruction page and a region labeled “Loaded Analysis” in
1Q 2006 27

VisEn FMT User’s Guide
the ROI Analysis page contain the corresponding current reconstruction and analysis identifiers. A checkbox labeled More at the center right of the Scan and Reconstruction screens can be toggled On or Off to either display or hide more advanced information.
Execute button
Identificaactive da
3.2 ViewThe lower twcontains the
• a • a • a
To the righcontrolling display featunder their
1Q 2006
Setup button
tion of taset Display/Hide advanced
parameter information
Figure 3-2: Sample Scan screen
ing Images o thirds of the screen in the Scan, Reconstruction and ROI Analysis tabs
image viewing area. Each of these tabs has (see Figure 3-3): “Frame No” or “Slice No” navigational block “Background” block for overlaying/hiding reflectance images histogram with a corresponding windowing function underneath each image
t of the main images is a set of tab-specific image selection buttons the image display mode. The rest of this section describes the three general ures listed above. The tab-specific image selection buttons are described respective tabs.
28

VisEn FMT User’s Guide
3.2.1 General Viewing Options The “Frame No.” or “Slice No.” block selects the index of the image to be displayed. When multiple frames are displayed (for example 4 or 16 frames at a time), the index refers to the first frame of the sequence. A click on the arrow button changes the index by one. (Figure 3-3). The “Background” block controls the display of the reflectance (reference) image shown in the left pane. The user can uncheck the “Show Ref” option to hide the reflectance image. By selecting a percentage figure from the adjacent pull-down menu, one can control the overlay contribution of the reflectance image (10%= very faint reflectance image, 90%=very dominant reflectance image). The user can also change the intensity of the reflectance image (always on the left of the screen) by selecting it and changing the scale of the histogram. A “Show Text” option is included to show or hide a legend on the images. There are four color palettes available using the color pull down menu, and the color spectrum is shown according to the selected palette.
Figure 3-3: General image navigati
Image navigation and display
1Q 2006 29
Frame / slice selection arrows
Image/ Histogram pair
Image/ Histogram pair
on controls
Background imagoverlay controls
Parameterentry and display
e
VisEn FMT User’s Guide
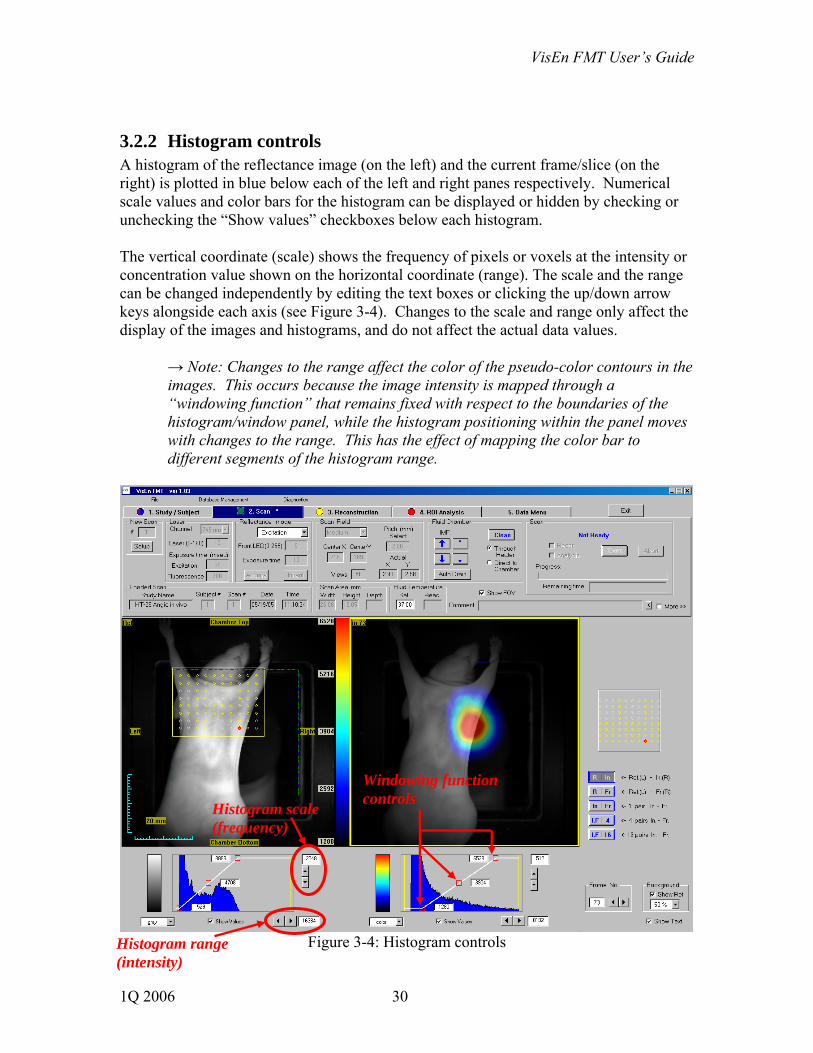
3.2.2 Histogram controls A histogram of the reflectance image (on the left) and the current frame/slice (on the right) is plotted in blue below each of the left and right panes respectively. Numerical scale values and color bars for the histogram can be displayed or hidden by checking or unchecking the “Show values” checkboxes below each histogram. The vertical coordinate (scale) shows the frequency of pixels or voxels at the intensity or concentration value shown on the horizontal coordinate (range). The scale and the range can be changed independently by editing the text boxes or clicking the up/down arrow keys alongside each axis (see Figure 3-4). Changes to the scale and range only affect the display of the images and histograms, and do not affect the actual data values.
→ Note: Changes to the range affect the color of the pseudo-color contours in the images. This occurs because the image intensity is mapped through a “windowing function” that remains fixed with respect to the boundaries of the histogram/window panel, while the histogram positioning within the panel moves with changes to the range. This has the effect of mapping the color bar to different segments of the histogram range.
Windowing function controls
Figure 3-4: Histogram controls
Histogram scale (frequency)
Histogram range (intensity)
1Q 2006 30

VisEn FMT User’s Guide
The windowing function is plotted in three line segments overlaid on top of the histogram in the histogram/window panel (Figure 3-4). The corner between the first and second segments of the windowing function, indicated by the leftmost square, defines the minimum windowing level; and the corner between the second and third segments, indicated by the rightmost square, defines the maximum windowing level. The intensity values between the minimum and maximum windowing level are linearly mapped to a color spectrum indicated by the colorbar along the left side of the histogram/window plot panel. The slope of the window is such that the highest range values are displayed in red and the lowest values are displayed in black.
→ Note: All intensity values less than or equal to the minimum level are mapped to a pixel value of 0; and all intensity values greater than or equal to the maximum level are mapped to a pixel value of 255 for display. The intensity values between the minimum and maximum level are mapped into the pixel values between 0 and 255 for display.
There are three handles on the windowing function for adjustment, each indicated by small squares overlaid on the windowing function. The user can press the left mouse button while over the left handle and drag it to change the minimum level. Likewise, the user can change the maximum level by pressing and dragging the left button on the right handle. The center handle is provided for the user to move up or down the windowing function without altering the width (or slope) of the windowing function. The user can also adjust these levels by entering numerical values from the keyboard. To do so, the Show Values option should be checked to display the current values for editing. At all times, there are 4 sets of independent windowing levels:
• One set for the reflectance image shown in left pane on all screens • One set for the scan images shown under Scan pages • One set for the reconstructed slices shown in the Reconstruction pages • One set for the analysis images shown in the ROI Analysis pages
1Q 2006 31
VisEn FMT User’s Guide
4 FMT System Database The general file interface for the FMT 3.0 application is built on a database platform, rather than the conventional Windows folder structure. The primary reason is to maintain the necessary hierarchical associations between particular studies, subjects, scans, reconstructions and analyses as follows:
• An analysis is always associated with a particular tomographic reconstruction • A reconstruction is always associated with a particular scan • A scan is always associated with an individual subject • A subject is always associated with a particular study
Note that a study can have multiple subjects; a subject can have multiple scans; etc. When running the application, the user always has a choice between loading pre-existing sessions and setting up a new session. Note here that “session” can refer to a study, a subject, a scan, a reconstruction, or an analysis. The Data Menu is the primary interface with existing session files, while the Study/Subject Info Page is the primary interface for setting up new studies and subjects.
1Q 2006 32
VisEn FMT User’s Guide
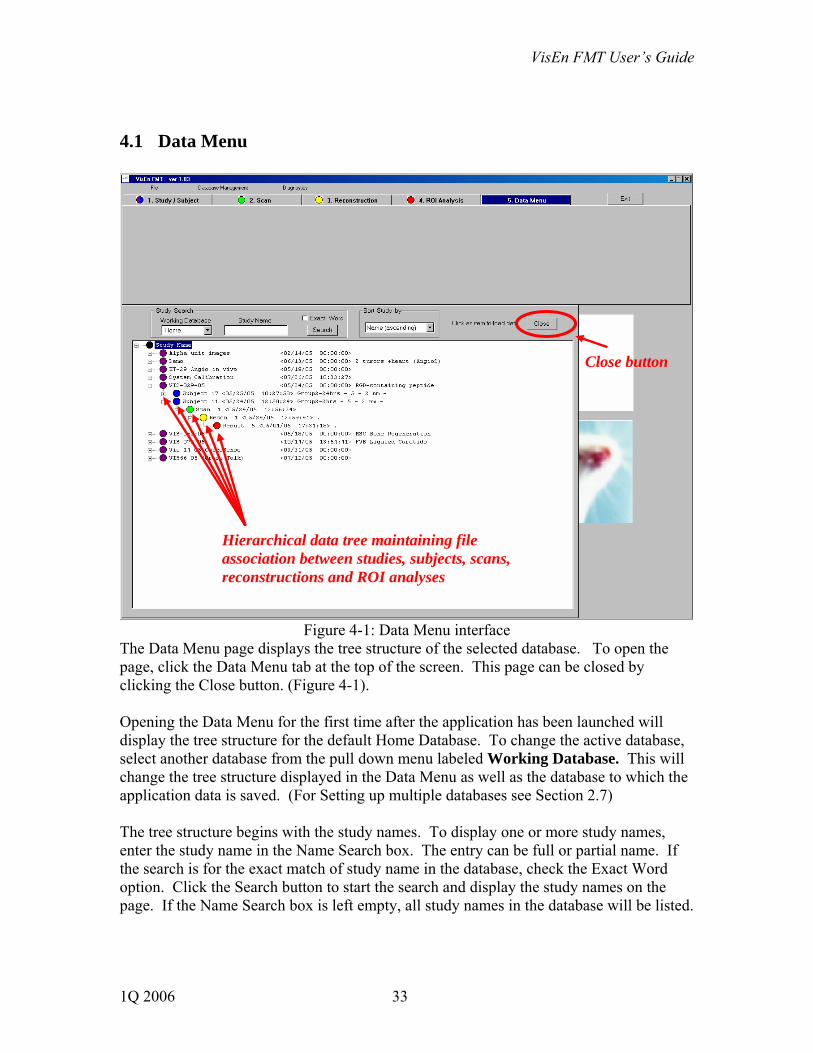
4.1 Data Menu
Close button
Hierarchical data tree maintaining file association between studies, subjects, scans, reconstructions and ROI analyses
Figure 4-1: Data Menu interface The Data Menu page displays the tree structure of the selected database. To open the page, click the Data Menu tab at the top of the screen. This page can be closed by clicking the Close button. (Figure 4-1). Opening the Data Menu for the first time after the application has been launched will display the tree structure for the default Home Database. To change the active database, select another database from the pull down menu labeled Working Database. This will change the tree structure displayed in the Data Menu as well as the database to which the application data is saved. (For Setting up multiple databases see Section 2.7) The tree structure begins with the study names. To display one or more study names, enter the study name in the Name Search box. The entry can be full or partial name. If the search is for the exact match of study name in the database, check the Exact Word option. Click the Search button to start the search and display the study names on the page. If the Name Search box is left empty, all study names in the database will be listed.
1Q 2006 33
VisEn FMT User’s Guide
To display the subjects under a study name, click the tree node to expand the structure. Similarly, the scans under a subject, the tomographic reconstructions under a scan, and the analysis results under a reconstruction can all be displayed by clicking the corresponding tree nodes.
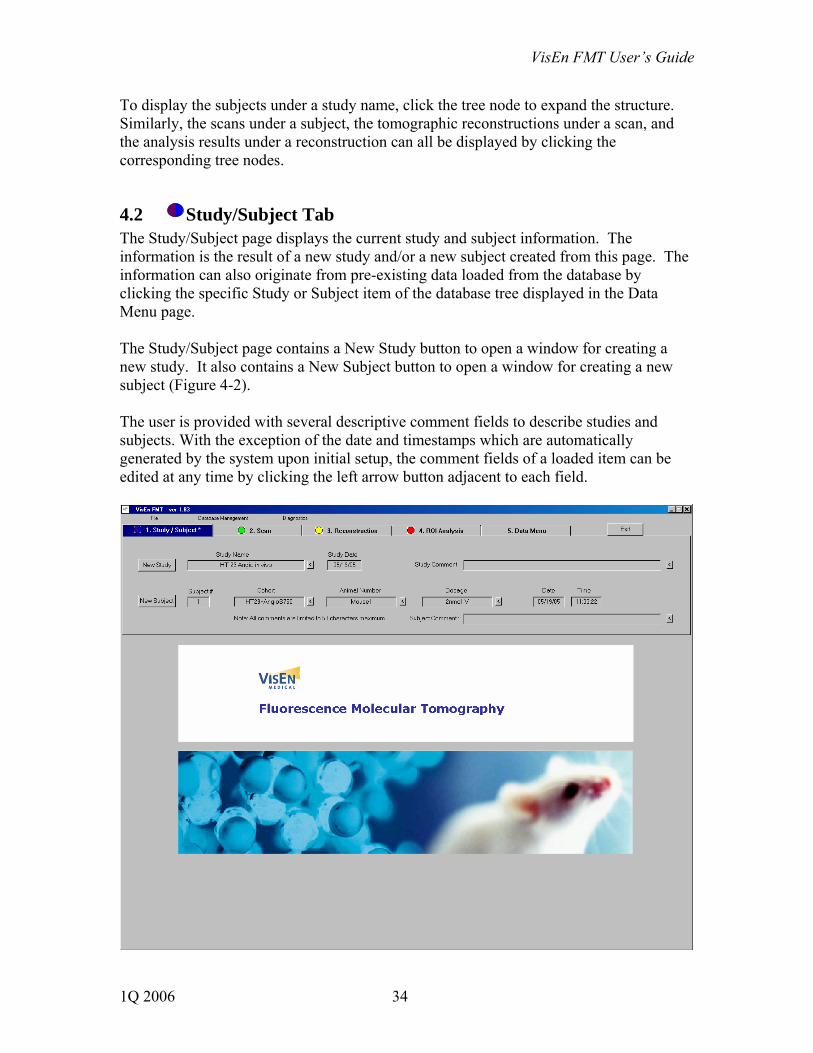
4.2 Study/Subject Tab The Study/Subject page displays the current study and subject information. The information is the result of a new study and/or a new subject created from this page. The information can also originate from pre-existing data loaded from the database by clicking the specific Study or Subject item of the database tree displayed in the Data Menu page. The Study/Subject page contains a New Study button to open a window for creating a new study. It also contains a New Subject button to open a window for creating a new subject (Figure 4-2). The user is provided with several descriptive comment fields to describe studies and subjects. With the exception of the date and timestamps which are automatically generated by the system upon initial setup, the comment fields of a loaded item can be edited at any time by clicking the left arrow button adjacent to each field.
1Q 2006 34
VisEn FMT User’s Guide
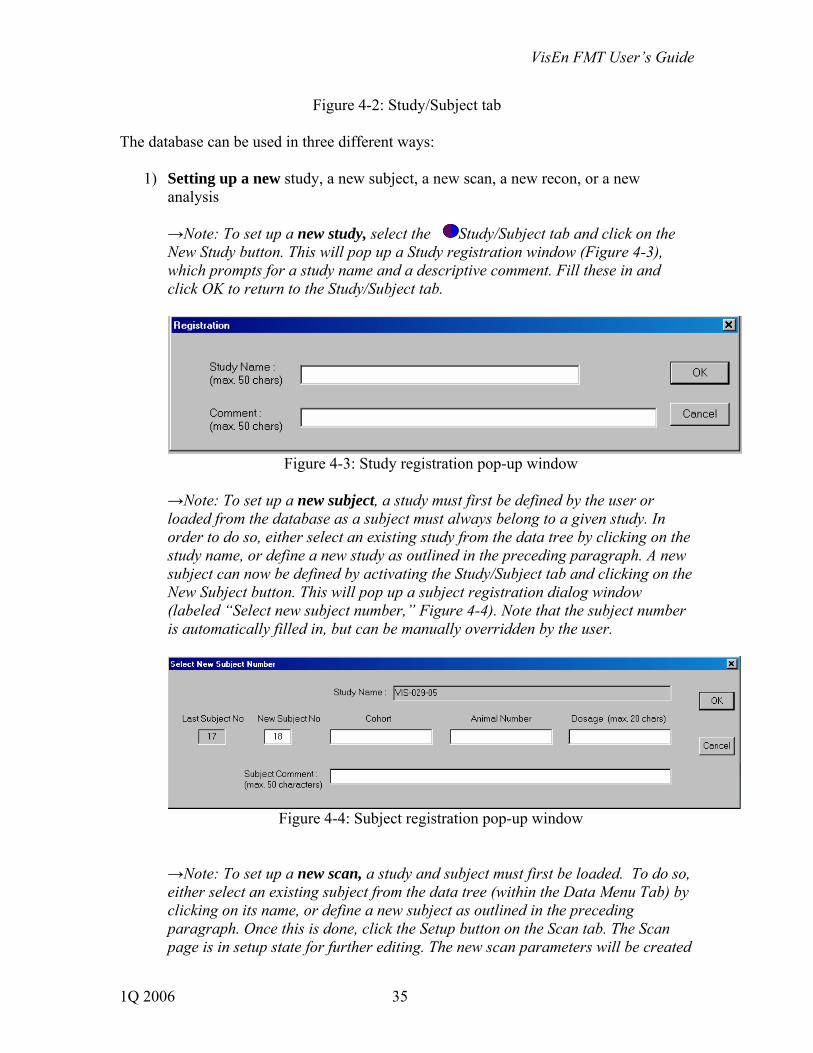
Figure 4-2: Study/Subject tab The database can be used in three different ways:
1) Setting up a new study, a new subject, a new scan, a new recon, or a new
analysis
→Note: To set up a new study, select the Study/Subject tab and click on the New Study button. This will pop up a Study registration window (Figure 4-3), which prompts for a study name and a descriptive comment. Fill these in and click OK to return to the Study/Subject tab.
Figure 4-3: Study registration pop-up window
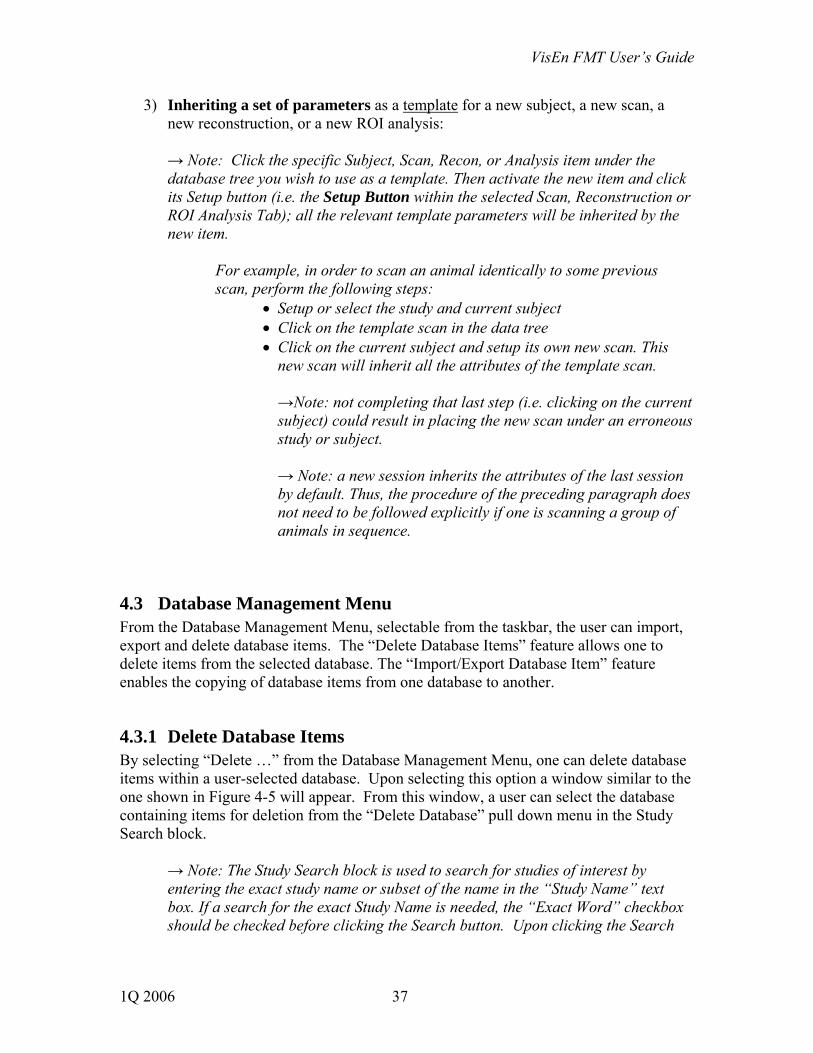
→Note: To set up a new subject, a study must first be defined by the user or loaded from the database as a subject must always belong to a given study. In order to do so, either select an existing study from the data tree by clicking on the study name, or define a new study as outlined in the preceding paragraph. A new subject can now be defined by activating the Study/Subject tab and clicking on the New Subject button. This will pop up a subject registration dialog window (labeled “Select new subject number,” Figure 4-4). Note that the subject number is automatically filled in, but can be manually overridden by the user.
Figure 4-4: Subject registration pop-up window
→Note: To set up a new scan, a study and subject must first be loaded. To do so, either select an existing subject from the data tree (within the Data Menu Tab) by clicking on its name, or define a new subject as outlined in the preceding paragraph. Once this is done, click the Setup button on the Scan tab. The Scan page is in setup state for further editing. The new scan parameters will be created
1Q 2006 35

VisEn FMT User’s Guide
based on the parameters in the Scan page (Section 5). The associated study and subject information are automatically loaded from the database into the Study/Subject tab. →Note: To set up a new reconstruction, a study, a subject and a scan must first be loaded. To do so, either load an existing scan from the database by clicking on its name in the data tree, or define a new scan (preceding paragraph) and execute it (Section 5). Once this is done, click the Setup button on the Reconstruction tab. The Reconstruction page is in setup state for further editing. The new reconstruction parameters will be created based on the parameter settings in the Reconstruction page (Section 6). The associated study and subject information are loaded from the database to the Study/Subject tab, and the scan images are loaded into the Scan tab. →Note: To set up a new analysis, a study, subject, scan and reconstruction must first be loaded. To do so, either load an existing reconstruction from the database by clicking on its name in the data tree, or define a new reconstruction (preceding paragraph) and execute it (Section 6). Once this is done, click the Setup button on the ROI Analysis tab. The new analysis parameters will be created based on the parameter settings in the ROI Analysis tab. The associated study and subject information, scan images and reconstruction images are loaded from the database into their respective tabs.
2) Reviewing a set of existing scan images, recon images, or analysis images
→Note: To review an existing set of scan images, click the specific Scan item from the data tree. The scan parameters and images are loaded into the Scan tab for display. In addition, the study and subject information of the scan is loaded into the Study/Subject tab. →Note: To review an existing set of reconstructions, click the specific reconstruction from the data tree. The reconstruction parameters and images are loaded into the Reconstruction tab for display. In addition, the corresponding scan parameters scan images are loaded into the Scan tab. The corresponding study and subject information is also loaded into the Study/Subject tab. → Note: To review an existing set of analysis images, click the specific Analysis item from the data tree. The analysis parameters and images are loaded into the ROI Analysis tab for display. In addition, the corresponding reconstruction parameters and images are loaded into the Reconstruction tab. The corresponding scan parameters and scan images are also loaded into the Scan tab, and the corresponding study and subject information is loaded into the Study/Subject tab.
1Q 2006 36
VisEn FMT User’s Guide
3) Inheriting a set of parameters as a template for a new subject, a new scan, a new reconstruction, or a new ROI analysis: → Note: Click the specific Subject, Scan, Recon, or Analysis item under the database tree you wish to use as a template. Then activate the new item and click its Setup button (i.e. the Setup Button within the selected Scan, Reconstruction or ROI Analysis Tab); all the relevant template parameters will be inherited by the new item.
For example, in order to scan an animal identically to some previous scan, perform the following steps:
• Setup or select the study and current subject • Click on the template scan in the data tree • Click on the current subject and setup its own new scan. This
new scan will inherit all the attributes of the template scan. →Note: not completing that last step (i.e. clicking on the current subject) could result in placing the new scan under an erroneous study or subject. → Note: a new session inherits the attributes of the last session by default. Thus, the procedure of the preceding paragraph does not need to be followed explicitly if one is scanning a group of animals in sequence.
4.3 Database Management Menu From the Database Management Menu, selectable from the taskbar, the user can import, export and delete database items. The “Delete Database Items” feature allows one to delete items from the selected database. The “Import/Export Database Item” feature enables the copying of database items from one database to another.
4.3.1 Delete Database Items By selecting “Delete …” from the Database Management Menu, one can delete database items within a user-selected database. Upon selecting this option a window similar to the one shown in Figure 4-5 will appear. From this window, a user can select the database containing items for deletion from the “Delete Database” pull down menu in the Study Search block.
→ Note: The Study Search block is used to search for studies of interest by entering the exact study name or subset of the name in the “Study Name” text box. If a search for the exact Study Name is needed, the “Exact Word” checkbox should be checked before clicking the Search button. Upon clicking the Search
1Q 2006 37

VisEn FMT User’s Guide
button, all matching studies in the Delete Database will be displayed in the database tree structure. .
The user can then select the item(s) of interest to be deleted from the database tree. Once the item is selected, the “Delete” button should be clicked to initiate the deletion. All data from the selected item, as well as data hierarchically below the latter, will be deleted from the selected database.
Figure 4-5 The Delete Database Items window
4.3.2 Import/Export Database Item By selecting “Import/Export Database” from the Database Management Menu, it is possible to exchange data across multiple databases. Upon selecting this option, a window similar to that shown in Figure 4-6 will appear. From this window, select the source database (left “Study Search” block) and target database (right “Study Search” block), at which point the corresponding database trees will be displayed. Note that a more detailed search can be performed to find the study of interest as described in Section 4.3.1. After the import and export databases have been selected, the user can select an item from the exporting database to be copied to the importing database and initiate the export by clicking the “>>” button.
→ Note: The selected item, as well as items hierarchically below it, will be copied to the target database; no alterations are done to the source database. → Note: If the data-tree path for the export item already exists in the target database, the copied data is added to that path in the target database. For example, if the user selects Subject 5 from Study “HT-29 Angio in vivo” (Figure
1Q 2006 38

VisEn FMT User’s Guide
4-6) for export from the “VisEn_Lab” database to the “Home” database, that Subject and its underlying Scan, Recon and Result data will be copied over and inserted at the right location in the Home database tree . Otherwise, the data-tree path corresponding to that item is also copied to the target database.
Figure 4-6 The Import/Export Database Items window
1Q 2006 39

VisEn FMT User’s Guide
5 Scan Acquisition Process The user can proceed with the scan acquisition process by traversing the top section of the Scan tab screen from left to right. A subject scan acquisition procedure is organized in the following sequence:
1) Click the Setup button to begin a new scan. 2) Select a channel for the scan (Channel 1 or Channel 2) 3) Acquire a reflectance (reference) image or set of images for visualization or co-
registration purposes. Note the reflectance image can be acquired at the excitation or the emission wavelength, or both. It is also possible to inherit a reflectance image from a previous scan.
4) Define the tomographic scan field by drawing it with the computer mouse over
the reflectance image. The user can also select a scan pitch (i.e. spacing between source locations) from a pre-defined list (Coarse/Medium/Fine) or can enter it numerically
5) Fill up the chamber with Index-Matching Fluid (IMF) by pressing and holding the
bold vertical arrow button, while observing the level of fluid fill in the right hand screen. If this is your first scan for this imaging session, check that the heater and hoses are primed with IMF (i.e. that the fluid is white like the IMF). Fine adjustment to the fill level can be performed with the slow fill arrow button:
6) Click the Execute button to perform the scan
These steps are laid out sequentially left to right on the Scan screen (Figures 5-1 and 5-2a,b).
1Q 2006 40

VisEn FMT User’s Guide
Fig
1Q 2006
(1) Setup anew scan
ure 5
(2) Select desired channel
Figure 5-1: First 3 step
-2a: Sample Reflectanc
(3) Acquire reflectance image(s)
s of the scan acquisition sequence
e image at excitation (intrinsic) wavelength
41

VisEn FMT User’s Guide
(5) Fill chamber with IMF
(6) Click to execute scan
(4) Define scan field
Figure 5-2b: Sample Reflectance image at fluorescent wavelength, also showing the last 3 steps of the scan acquisition sequence
5.1 Scan Setup When the FMT 3.0 program is first launched, the scan parameters shown on the Scan page default to those associated with the last scan operation.
→ Note: The user can also load a set of scan parameters associated with any previous scan as outlined in Section 4.
The scan parameters of an existing scan are not editable. To start a new scan, click the Setup button in the “New Scan” block. This will make most of the scan parameters editable.
→Note: The new scan setup can be aborted by simply clicking the small arrow
toggle button next to the Setup button: (this button only appears after clicking Setup)
The system automatically sets the optimal exposure conditions (laser power, exposure time, etc.). In the Loaded Scan block, the Scan # box displays the scan number of the loaded scan parameters. When the Setup button is clicked, the number in the Scan # box is changed to 0 indicating a new scan. When the new scan operation is completed, the scan number from the New Scan block is copied to this Scan # box, and the scan number in the New Scan block is incremented to the next available number.
1Q 2006 42
VisEn FMT User’s Guide
5.2 Laser Channel The FMT system operates on 2 channels:
• Channel 1: Excitation=670 nm, Emission=700 nm • Channel 2: Excitation=746 nm, Emission=775 nm
A scan can be performed at either one of these 2 channels. The software application automatically activates the correct laser, as well as a motorized filter wheel to position the correct excitation and emission filters in front of the detectors.
→Note: the software application will also automatically load the optical and numerical parameters corresponding to each channel (see Section 6 on the Reconstruction process)
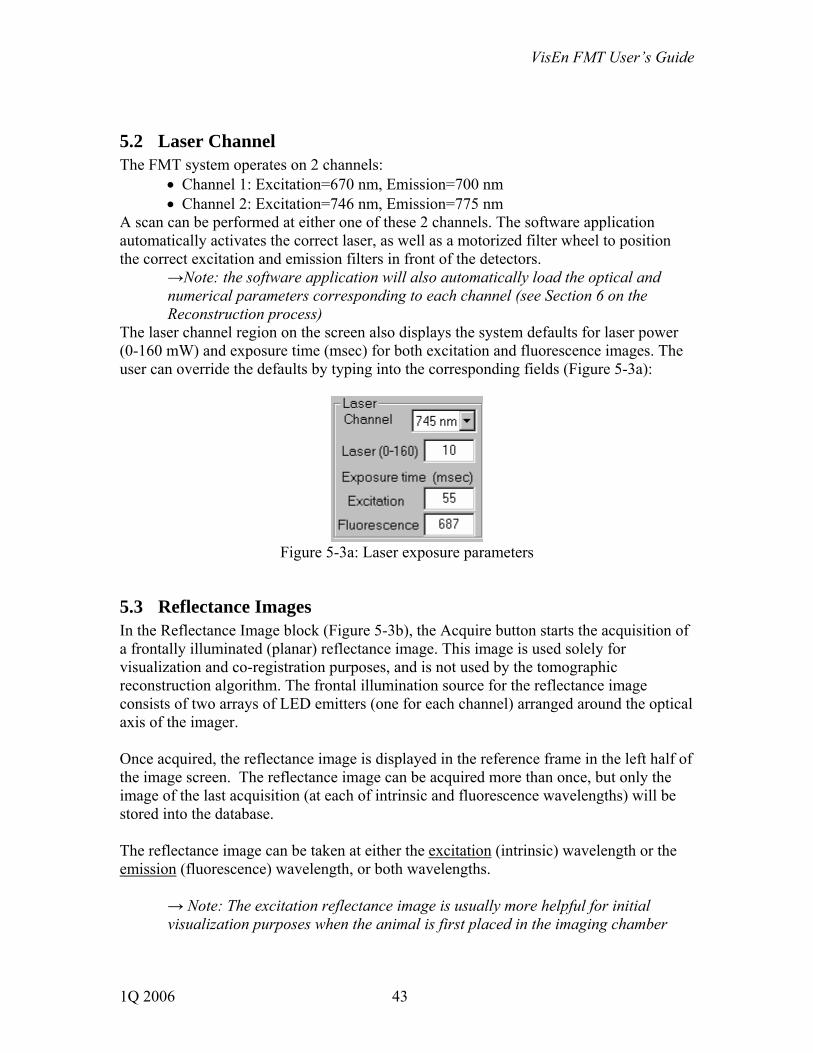
The laser channel region on the screen also displays the system defaults for laser power (0-160 mW) and exposure time (msec) for both excitation and fluorescence images. The user can override the defaults by typing into the corresponding fields (Figure 5-3a):
Figure 5-3a: Laser exposure parameters
5.3 Reflectance Images In the Reflectance Image block (Figure 5-3b), the Acquire button starts the acquisition of a frontally illuminated (planar) reflectance image. This image is used solely for visualization and co-registration purposes, and is not used by the tomographic reconstruction algorithm. The frontal illumination source for the reflectance image consists of two arrays of LED emitters (one for each channel) arranged around the optical axis of the imager. Once acquired, the reflectance image is displayed in the reference frame in the left half of the image screen. The reflectance image can be acquired more than once, but only the image of the last acquisition (at each of intrinsic and fluorescence wavelengths) will be stored into the database. The reflectance image can be taken at either the excitation (intrinsic) wavelength or the emission (fluorescence) wavelength, or both wavelengths.
→ Note: The excitation reflectance image is usually more helpful for initial visualization purposes when the animal is first placed in the imaging chamber
1Q 2006 43

VisEn FMT User’s Guide
→ Note: The emission reflectance image is typically used to identify the rough outline of the fluorescent target tissue, which helps determining the scan field (Step 4).
When the user presses the Acquire button, there will be a slight time delay as the filter wheel positions the appropriate filter in front of the detectors. Once the reflectance images have been taken, the user can toggle between the fluorescence and intrinsic images by selecting the desired image with the pull-down menu in the Reflectance Image block.
Figure 5-3b: Reflectance image exposure parameters
The Reflectance Image region also displays the default exposure parameters for the reflectance image (LED intensity and exposure time), which the user can override if desired. It is often desirable to inherit a reflectance image from a prior scan, rather than acquire a new reflectance image. For example, if an animal has been injected with fluorescent contrast agents on both channels, aimed at different molecular or physiological targets, the animal will be scanned twice in succession; the second scan can simply inherit the reflectance image from the first scan. In such a case, click on the Inherit button rather than the Acquire button, and the inherited reflectance image will immediately be displayed.
5.4 Scan Field Once the reflectance image has been acquired, the user can then determine the location, span, and pitch of the area to be scanned for subsequent tomographic reconstruction. The scan field consists of a number of source locations which provide the multiple projections needed for 3D information recovery. The scan pitch is the spacing in millimeters between adjacent source locations. With the computer mouse, the user can stretch, shrink, or drag the rectangular scan field to be centered on the region of interest. This determines the location, width and height of the scan sources which are displayed as yellow dots overlaid on the reflectance image in the reference frame (see Figure 5-2b).
1Q 2006 44
VisEn FMT User’s Guide
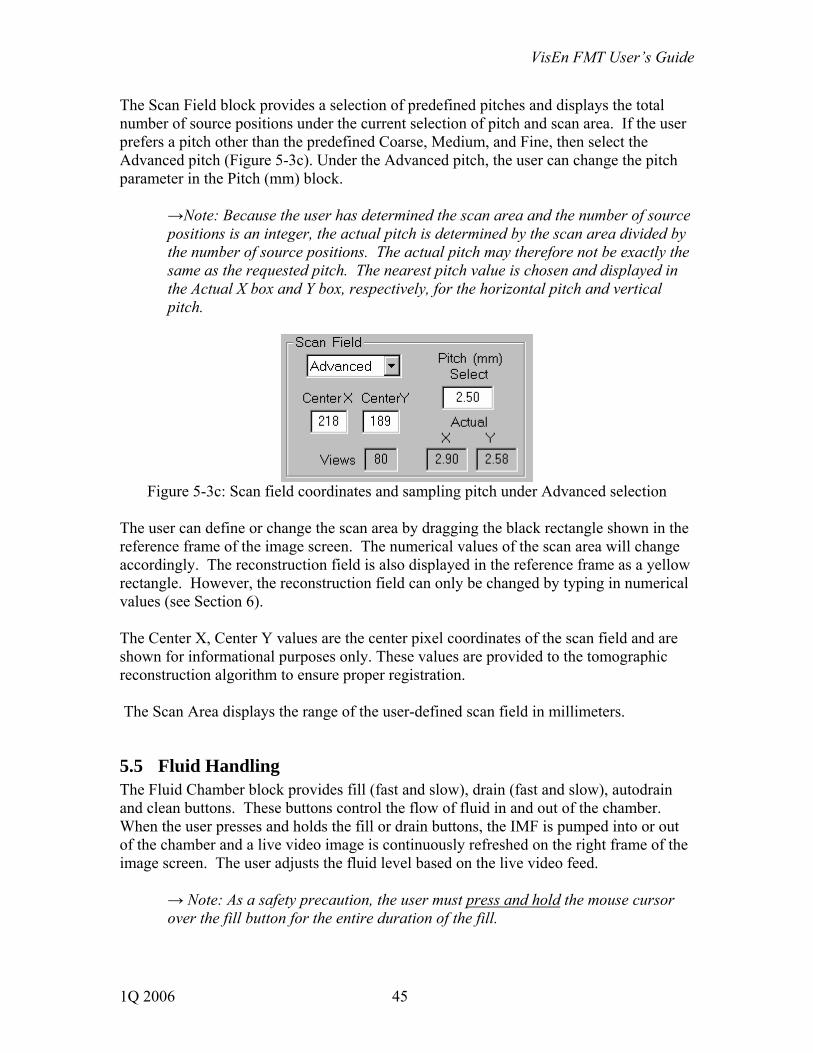
The Scan Field block provides a selection of predefined pitches and displays the total number of source positions under the current selection of pitch and scan area. If the user prefers a pitch other than the predefined Coarse, Medium, and Fine, then select the Advanced pitch (Figure 5-3c). Under the Advanced pitch, the user can change the pitch parameter in the Pitch (mm) block.
→Note: Because the user has determined the scan area and the number of source positions is an integer, the actual pitch is determined by the scan area divided by the number of source positions. The actual pitch may therefore not be exactly the same as the requested pitch. The nearest pitch value is chosen and displayed in the Actual X box and Y box, respectively, for the horizontal pitch and vertical pitch.
Figure 5-3c: Scan field coordinates and sampling pitch under Advanced selection
The user can define or change the scan area by dragging the black rectangle shown in the reference frame of the image screen. The numerical values of the scan area will change accordingly. The reconstruction field is also displayed in the reference frame as a yellow rectangle. However, the reconstruction field can only be changed by typing in numerical values (see Section 6). The Center X, Center Y values are the center pixel coordinates of the scan field and are shown for informational purposes only. These values are provided to the tomographic reconstruction algorithm to ensure proper registration. The Scan Area displays the range of the user-defined scan field in millimeters.
5.5 Fluid Handling The Fluid Chamber block provides fill (fast and slow), drain (fast and slow), autodrain and clean buttons. These buttons control the flow of fluid in and out of the chamber. When the user presses and holds the fill or drain buttons, the IMF is pumped into or out of the chamber and a live video image is continuously refreshed on the right frame of the image screen. The user adjusts the fluid level based on the live video feed.
→ Note: As a safety precaution, the user must press and hold the mouse cursor over the fill button for the entire duration of the fill.
1Q 2006 45

VisEn FMT User’s Guide
→ Note: The recommended IMF fill level is about 2 cm above the top of the scan area, as well as above the 5cm x 5cm rear glass. → Note: As the level approaches the head of the animal, the user can switch to the slow fill button to reduce the fill rate. → Note: The live video feed has a delay of approximately 0.5 seconds. → Note: As a safety precaution in case of computer mouse button failure, hitting any keyboard key will interrupt fluid flow to the chamber. Note: The Auto Drain button is a single-touch operation and will time out after 15 seconds.
Figure 5-3d: Fluid handling controls
When the Clean button is pressed, the cleaning solution can be dispensed along either one of two paths, depending on user preference: directly into the chamber, or via the heating element underneath the chamber first (before going to the chamber). Pumping the cleaning solution directly into the chamber is typically appropriate for cleaning the imaging chamber between successive animals, if desired. Going via the heating element, and then into the imaging chamber will flush out any IMF residing in the heater and the connecting hoses, which is typically recommended at the end of a study or at the end of the day to avoid any build-up of IMF.
→Note: It is recommended to flush out residual IMF from the heater and connecting hoses at the end of a study or the end of the day. When this is done, the user should prime the heater and hoses with IMF immediately prior to initiating the next scan session, as outlined in the next paragraph.
Recommended protocol for priming the system: When the system is first used at the start of an imaging session or subsequent to a cleaning cycle such as the one described above, it may be necessary to prime it with IMF.
i. In the VisEn FMT 3.0 application, select the Scan tab ii. Press and hold the IMF Fill button for about 15 seconds. The live video panel
will initially show clear water being pumped in, which is the standing volume of liquid held in the supply hoses and heater coils since the last cleaning. After
1Q 2006 46

VisEn FMT User’s Guide
about 10-15 seconds, the live video panel should show fresh IMF being pumped into the chamber (opaque white swirls mixing with the water).
iii. Drain the chamber by pressing and holding the Drain button until the chamber is completely evacuated, or by pressing and releasing the Auto Drain button.
5.6 Scan Execution The Scan block shows the scan status on the top row. If the scanner is connected to the PC and the scanner has been powered up, “Live” is shown in the scan status. Otherwise, a message of “Offline” is shown.
→ Note: When the imager is Offline, it is still possible to perform reconstructions and analyses on previously acquired scan data, as well as to view previously acquired scan data.
When the Exec button is clicked, the scan operation starts and the progress of the scanning position is shown as a progression of red dots overlaid on the source locations of the scan field. The raw scan images are shown in real time in the right image pane. A progress bar and estimate of remaining time are shown below the Exec button. The scan consists of two sequential data sets: a set of images acquired at the excitation (intrinsic) wavelength, followed by a similar set acquired at the emission (fluorescence) wavelength. Proper positioning of the filters and exposure settings are automatically adjusted by the software. The scan can be aborted by clicking the Abort button. In that case the new scan parameters and images will be not stored into the database. If the Recon option is checked, a tomographic reconstruction operation will be executed automatically at the completion of the scan, based on the parameters shown in the Reconstruction page (except for the reconstruction area parameters, which will be inherited from the Scan page at the completion of the scan –see Section 6). If the Analysis option is also checked, the analysis operation will be executed automatically at the completion of the reconstruction, based on the parameters shown in the ROI Analysis page. When the Analysis option is checked, the program will automatically check the Recon option.
→Note: It is recommended to keep both the Recon and Analysis options initially unchecked, and to perform these steps manually after the Scan has been completed in order to gain familiarity with overall system operation.
1Q 2006 47
VisEn FMT User’s Guide
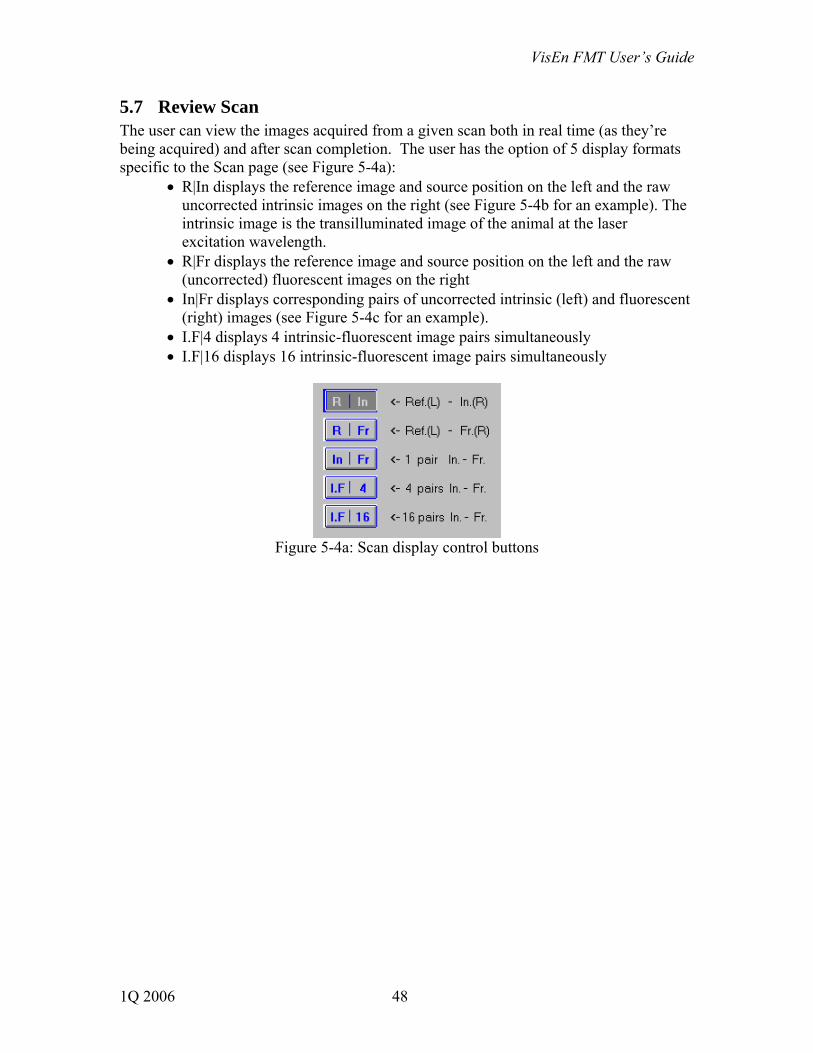
5.7 Review Scan The user can view the images acquired from a given scan both in real time (as they’re being acquired) and after scan completion. The user has the option of 5 display formats specific to the Scan page (see Figure 5-4a):
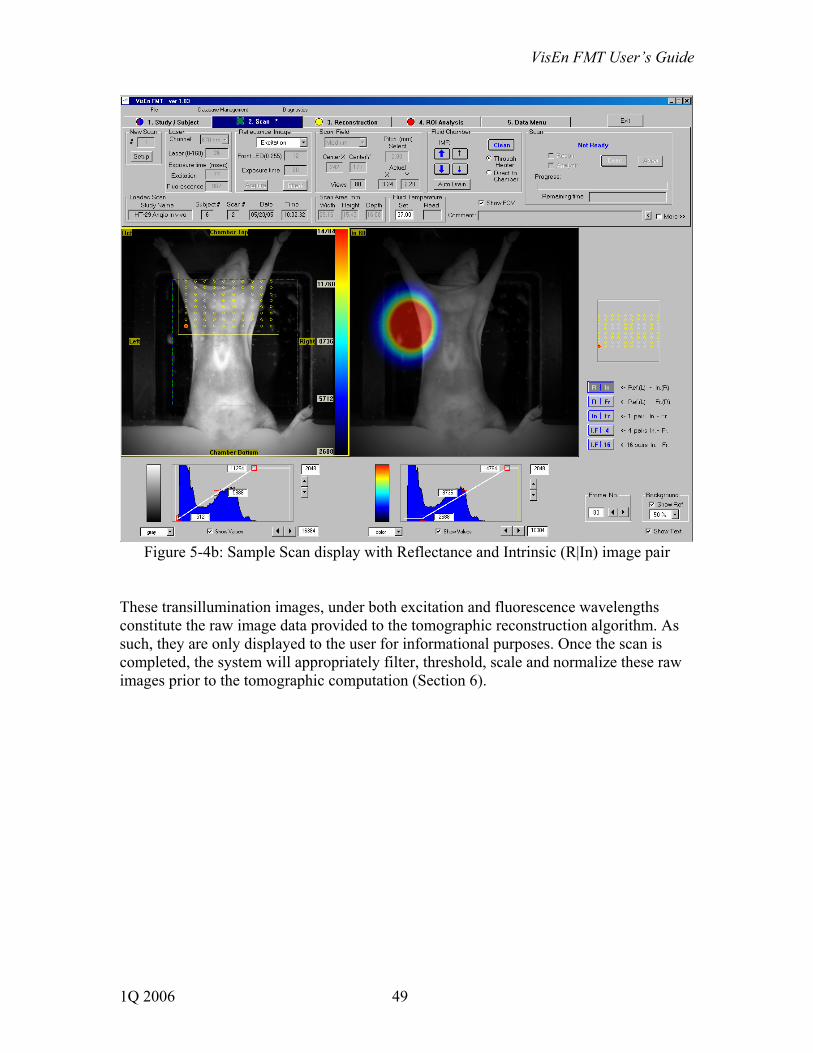
• R|In displays the reference image and source position on the left and the raw uncorrected intrinsic images on the right (see Figure 5-4b for an example). The intrinsic image is the transilluminated image of the animal at the laser excitation wavelength.
• R|Fr displays the reference image and source position on the left and the raw (uncorrected) fluorescent images on the right
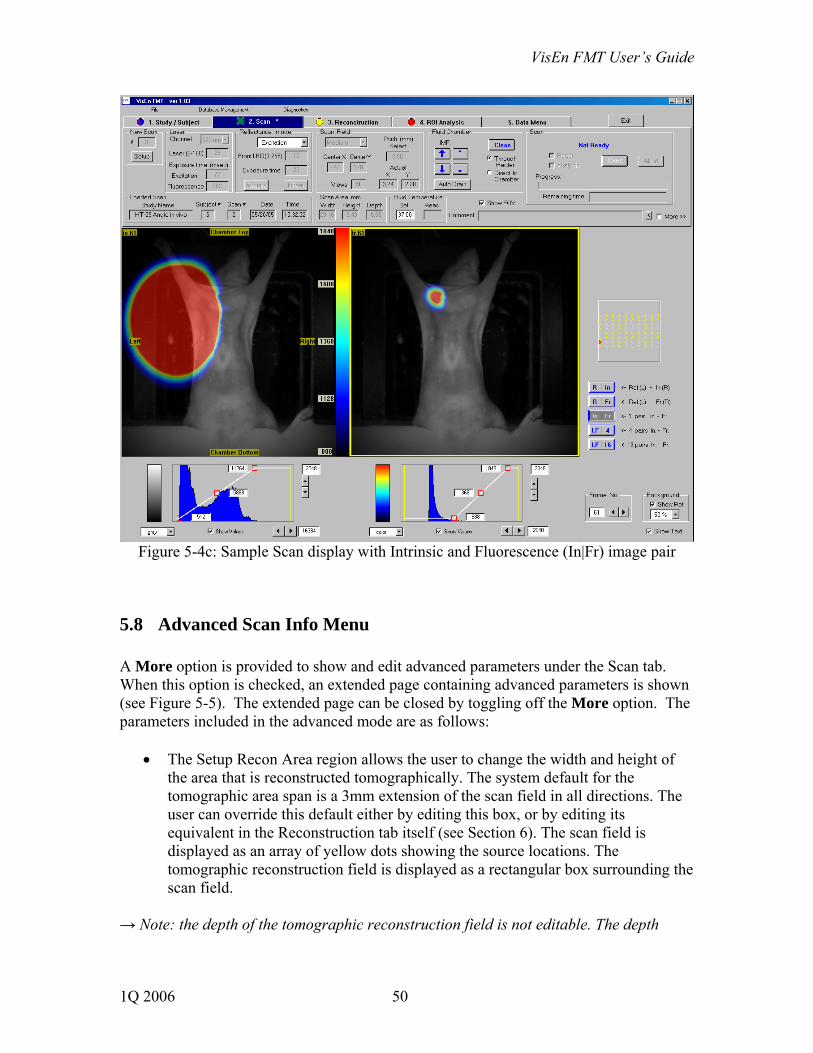
• In|Fr displays corresponding pairs of uncorrected intrinsic (left) and fluorescent (right) images (see Figure 5-4c for an example).
• I.F|4 displays 4 intrinsic-fluorescent image pairs simultaneously • I.F|16 displays 16 intrinsic-fluorescent image pairs simultaneously
Figure 5-4a: Scan display control buttons
1Q 2006 48
VisEn FMT User’s Guide
Figure 5-4b: Sample Scan display with Reflectance and Intrinsic (R|In) image pair
These transillumination images, under both excitation and fluorescence wavelengths constitute the raw image data provided to the tomographic reconstruction algorithm. As such, they are only displayed to the user for informational purposes. Once the scan is completed, the system will appropriately filter, threshold, scale and normalize these raw images prior to the tomographic computation (Section 6).
1Q 2006 49
VisEn FMT User’s Guide
Figure 5-4c: Sample Scan display with Intrinsic and Fluorescence (In|Fr) image pair
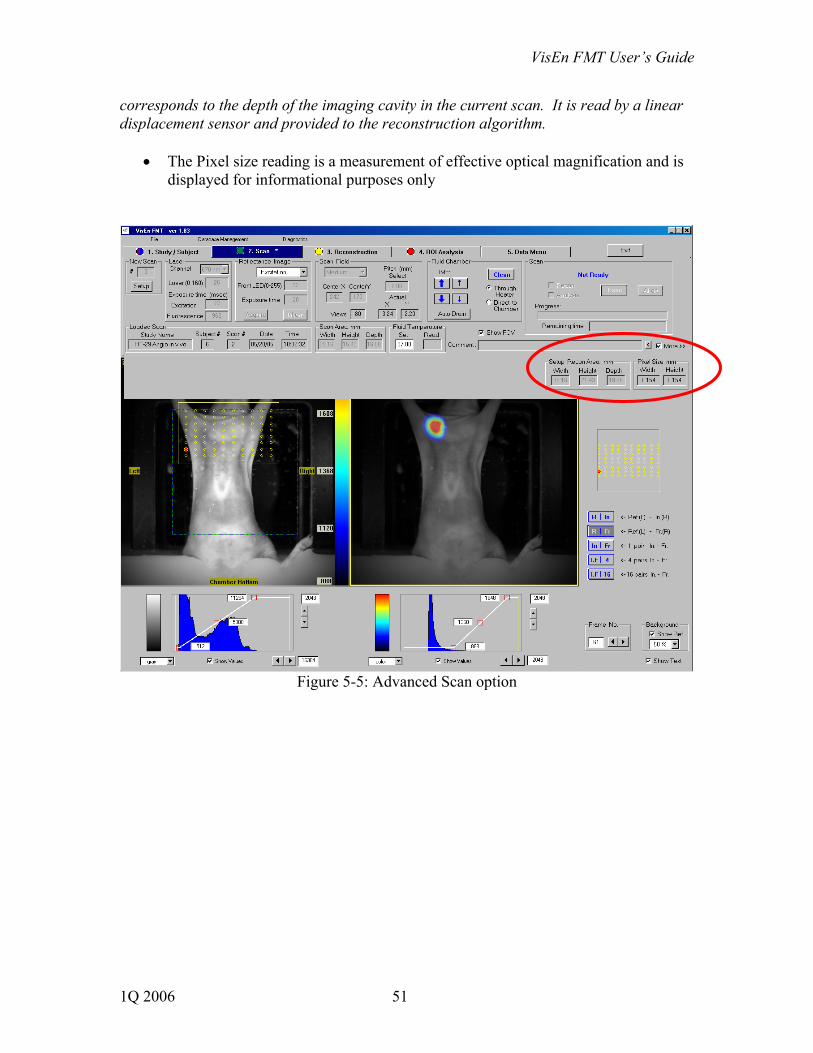
5.8 Advanced Scan Info Menu A More option is provided to show and edit advanced parameters under the Scan tab. When this option is checked, an extended page containing advanced parameters is shown (see Figure 5-5). The extended page can be closed by toggling off the More option. The parameters included in the advanced mode are as follows:
• The Setup Recon Area region allows the user to change the width and height of the area that is reconstructed tomographically. The system default for the tomographic area span is a 3mm extension of the scan field in all directions. The user can override this default either by editing this box, or by editing its equivalent in the Reconstruction tab itself (see Section 6). The scan field is displayed as an array of yellow dots showing the source locations. The tomographic reconstruction field is displayed as a rectangular box surrounding the scan field.
→ Note: the depth of the tomographic reconstruction field is not editable. The depth
1Q 2006 50
VisEn FMT User’s Guide
corresponds to the depth of the imaging cavity in the current scan. It is read by a linear displacement sensor and provided to the reconstruction algorithm.
• The Pixel size reading is a measurement of effective optical magnification and is displayed for informational purposes only
Figure 5-5: Advanced Scan option
1Q 2006 51
VisEn FMT User’s Guide
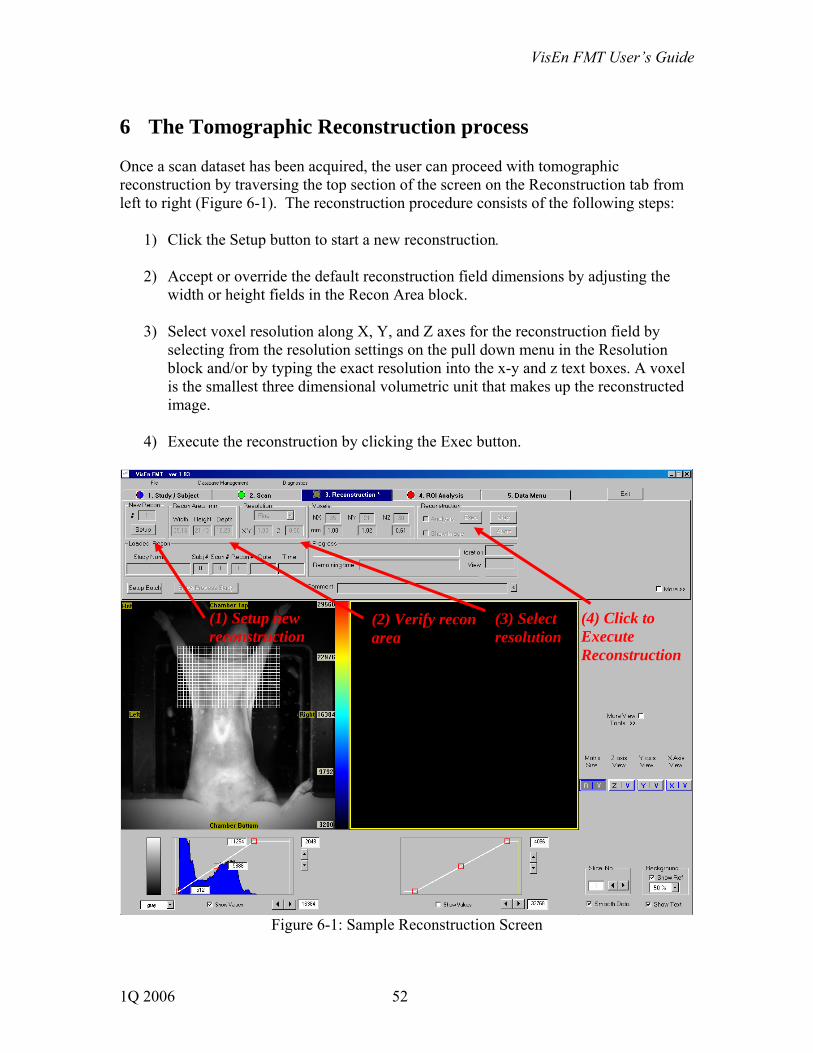
6 The Tomographic Reconstruction process Once a scan dataset has been acquired, the user can proceed with tomographic reconstruction by traversing the top section of the screen on the Reconstruction tab from left to right (Figure 6-1). The reconstruction procedure consists of the following steps:
1) Click the Setup button to start a new reconstruction. 2) Accept or override the default reconstruction field dimensions by adjusting the
width or height fields in the Recon Area block.
3) Select voxel resolution along X, Y, and Z axes for the reconstruction field by selecting from the resolution settings on the pull down menu in the Resolution block and/or by typing the exact resolution into the x-y and z text boxes. A voxel is the smallest three dimensional volumetric unit that makes up the reconstructed image.
4) Execute the reconstruction by clicking the Exec button.
(1) Setup new reconstruction
(2) Verify recon area
(3) Select resolution
(4) Click to Execute Reconstruction
Figure 6-1: Sample Reconstruction Screen
1Q 2006 52
VisEn FMT User’s Guide
6.1 Recon Setup The Reconstruction page displays its parameters in the same style as the Scan page. When the FMT 3.0 program is first launched, it automatically loads the reconstruction parameters associated with the last reconstruction operation.
→ Note: As indicated in Section 4, the user can load any set of reconstruction parameters associated with a previous reconstruction by clicking on the specific Reconstruction displayed in the Data Menu page.
The reconstruction parameters of an existing reconstruction are not editable. To start a new reconstruction, click the Setup button in the “New Recon” block. This will make most of the reconstruction parameters editable.
→ Note: The new recon setup can be aborted by simply clicking the small arrow toggle button next to the Setup button (the toggle button only appears after clicking on the Setup button).
In the Loaded Recon block, the Recon # box displays the reconstruction number of the loaded reconstruction. When the Setup button is clicked, the Recon # box changes to 0, indicating a new reconstruction. When the new reconstruction operation is completed, the recon number from the New Recon block is copied to this Recon # box, and the recon number in the New Recon block is incremented to the next available number.
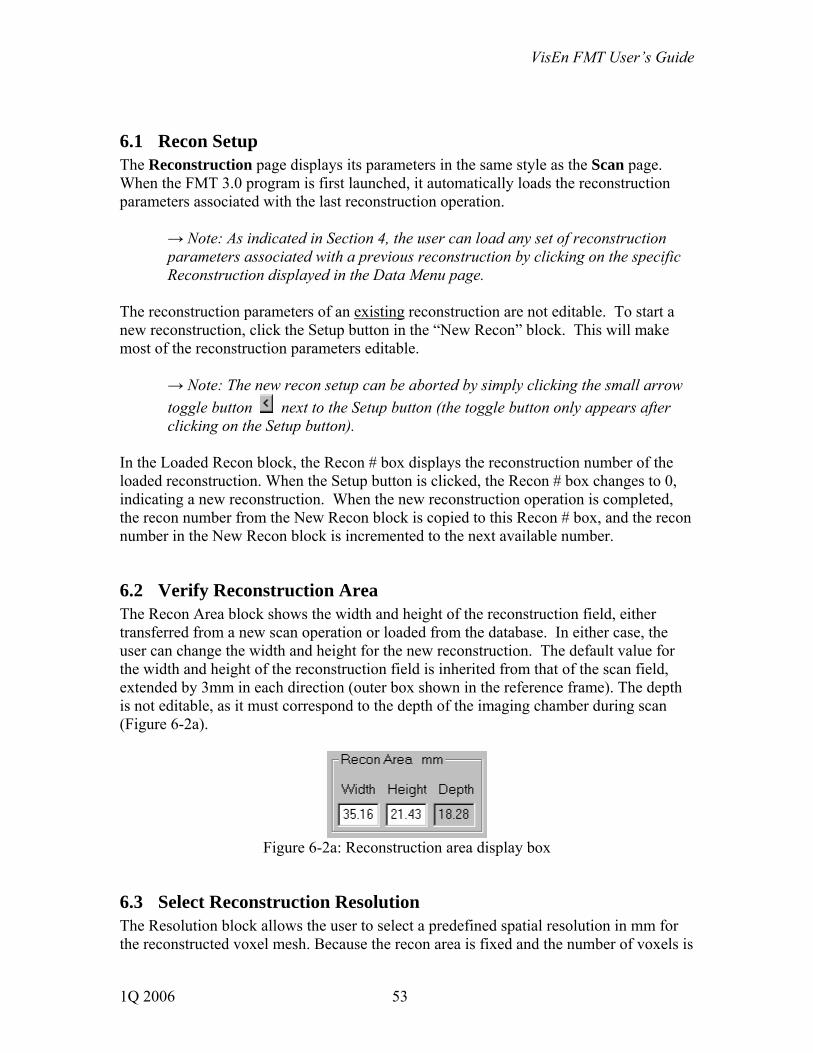
6.2 Verify Reconstruction Area The Recon Area block shows the width and height of the reconstruction field, either transferred from a new scan operation or loaded from the database. In either case, the user can change the width and height for the new reconstruction. The default value for the width and height of the reconstruction field is inherited from that of the scan field, extended by 3mm in each direction (outer box shown in the reference frame). The depth is not editable, as it must correspond to the depth of the imaging chamber during scan (Figure 6-2a).
Figure 6-2a: Reconstruction area display box
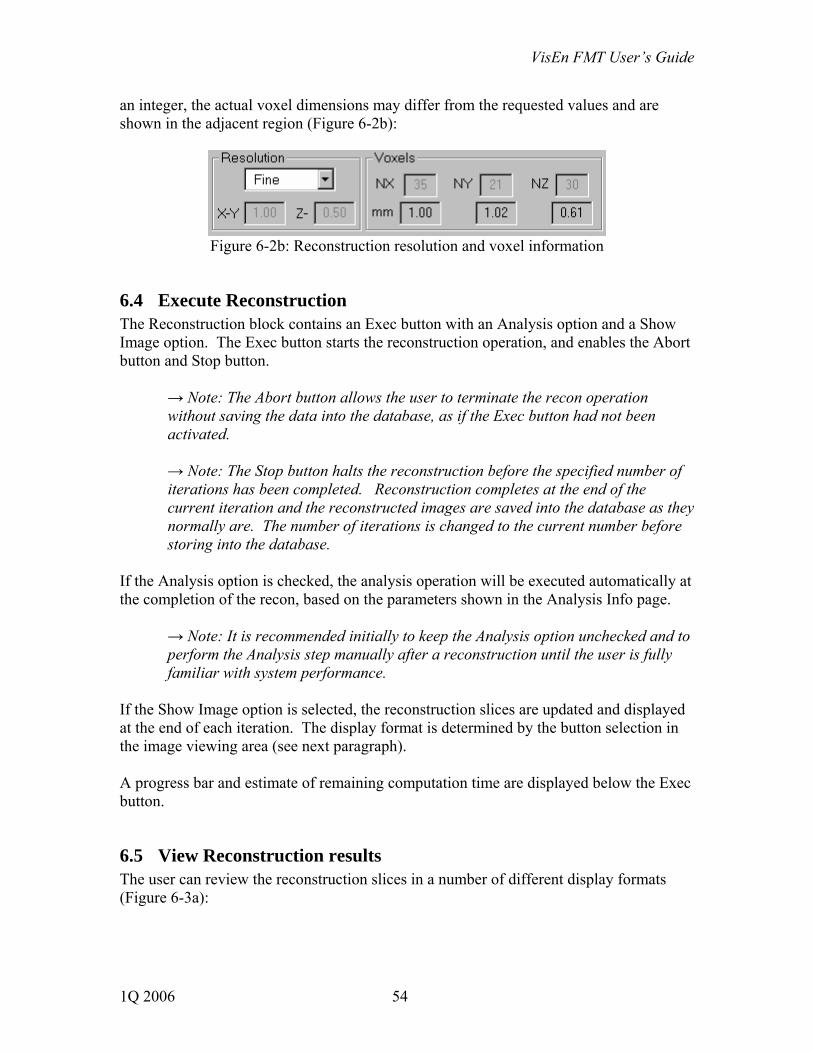
6.3 Select Reconstruction Resolution The Resolution block allows the user to select a predefined spatial resolution in mm for the reconstructed voxel mesh. Because the recon area is fixed and the number of voxels is
1Q 2006 53
VisEn FMT User’s Guide
an integer, the actual voxel dimensions may differ from the requested values and are shown in the adjacent region (Figure 6-2b):
Figure 6-2b: Reconstruction resolution and voxel information
6.4 Execute Reconstruction The Reconstruction block contains an Exec button with an Analysis option and a Show Image option. The Exec button starts the reconstruction operation, and enables the Abort button and Stop button.
→ Note: The Abort button allows the user to terminate the recon operation without saving the data into the database, as if the Exec button had not been activated. → Note: The Stop button halts the reconstruction before the specified number of iterations has been completed. Reconstruction completes at the end of the current iteration and the reconstructed images are saved into the database as they normally are. The number of iterations is changed to the current number before storing into the database.
If the Analysis option is checked, the analysis operation will be executed automatically at the completion of the recon, based on the parameters shown in the Analysis Info page.
→ Note: It is recommended initially to keep the Analysis option unchecked and to perform the Analysis step manually after a reconstruction until the user is fully familiar with system performance.
If the Show Image option is selected, the reconstruction slices are updated and displayed at the end of each iteration. The display format is determined by the button selection in the image viewing area (see next paragraph). A progress bar and estimate of remaining computation time are displayed below the Exec button.
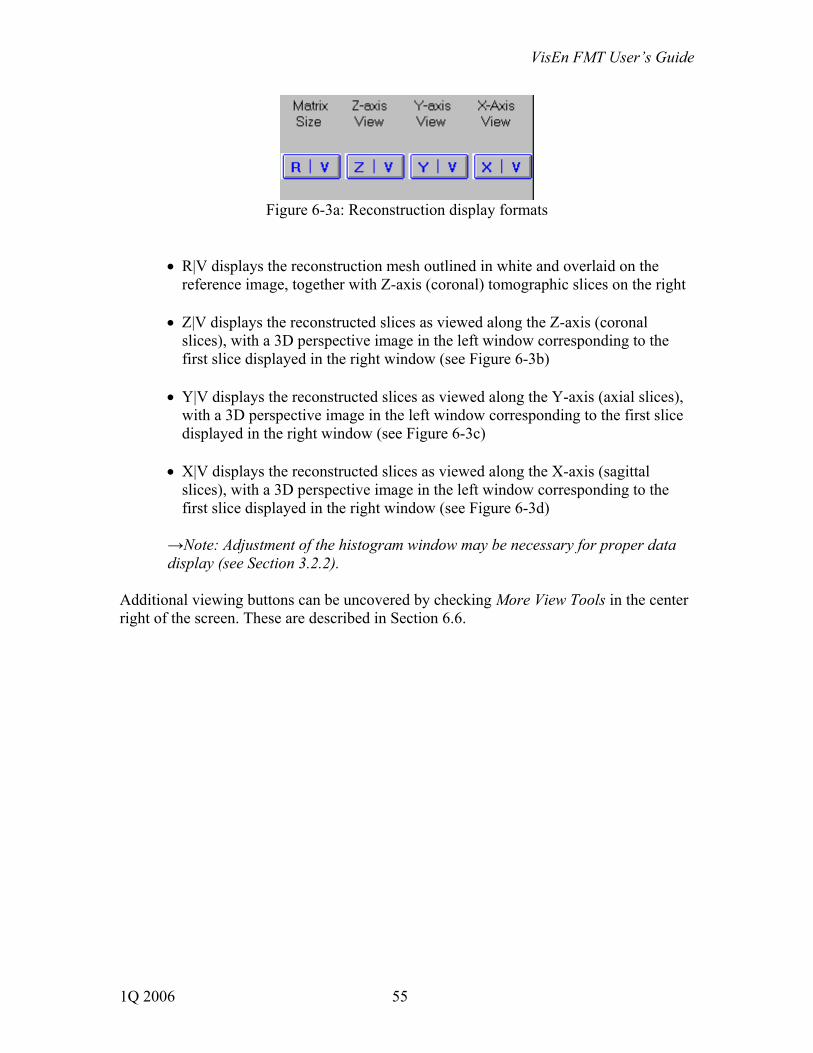
6.5 View Reconstruction results The user can review the reconstruction slices in a number of different display formats (Figure 6-3a):
1Q 2006 54
VisEn FMT User’s Guide
Figure 6-3a: Reconstruction display formats
• R|V displays the reconstruction mesh outlined in white and overlaid on the reference image, together with Z-axis (coronal) tomographic slices on the right
• Z|V displays the reconstructed slices as viewed along the Z-axis (coronal
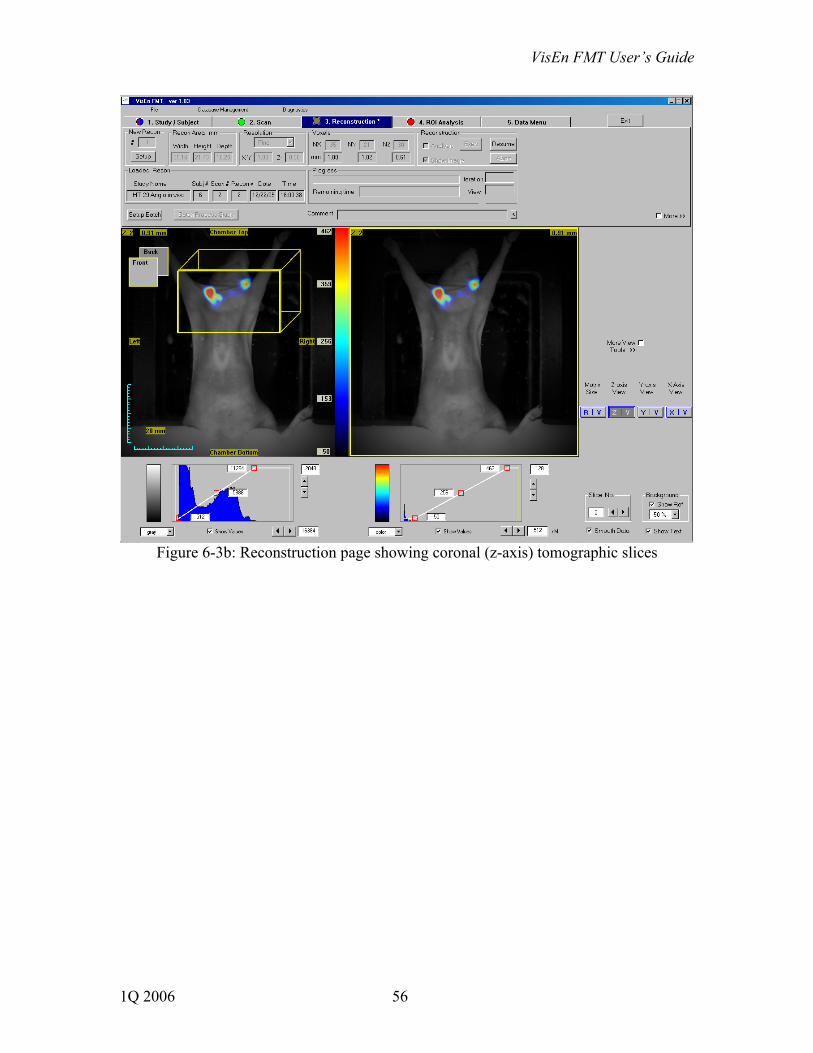
slices), with a 3D perspective image in the left window corresponding to the first slice displayed in the right window (see Figure 6-3b)
• Y|V displays the reconstructed slices as viewed along the Y-axis (axial slices),
with a 3D perspective image in the left window corresponding to the first slice displayed in the right window (see Figure 6-3c)
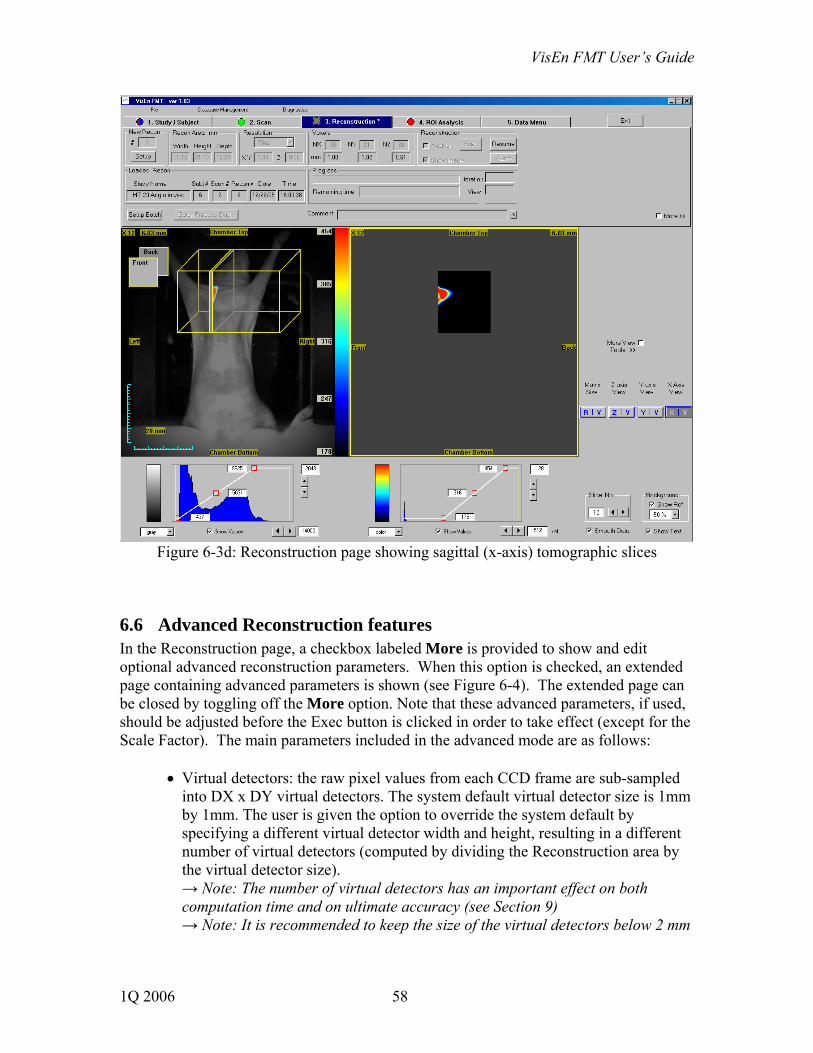
• X|V displays the reconstructed slices as viewed along the X-axis (sagittal slices), with a 3D perspective image in the left window corresponding to the first slice displayed in the right window (see Figure 6-3d)
→Note: Adjustment of the histogram window may be necessary for proper data display (see Section 3.2.2).
Additional viewing buttons can be uncovered by checking More View Tools in the center right of the screen. These are described in Section 6.6.
1Q 2006 55
VisEn FMT User’s Guide
Figure 6-3b: Reconstruction page showing coronal (z-axis) tomographic slices
1Q 2006 56

VisEn FMT User’s Guide
Figure 6-3c: Reconstruction page showing axial (y-axis) tomographic slices
The result of a tomographic reconstruction is a three-dimensional map of fluorochrome concentration in the tissue, which is displayed in pseudo-color tomographic slices. The central color bar in the image display area provides an annotated scale of voxel concentration.
→Note: Concentration values are measured in physical units of nanomoles/liter, or nanomolar (nM), and are based on a calibration of the FMT system for the corresponding fluorescent agent. →Note: Section 10.3 reviews calibration issues in more detail.
1Q 2006 57
VisEn FMT User’s Guide
Figure 6-3d: Reconstruction page showing sagittal (x-axis) tomographic slices
6.6 Advanced Reconstruction features In the Reconstruction page, a checkbox labeled More is provided to show and edit optional advanced reconstruction parameters. When this option is checked, an extended page containing advanced parameters is shown (see Figure 6-4). The extended page can be closed by toggling off the More option. Note that these advanced parameters, if used, should be adjusted before the Exec button is clicked in order to take effect (except for the Scale Factor). The main parameters included in the advanced mode are as follows:
• Virtual detectors: the raw pixel values from each CCD frame are sub-sampled into DX x DY virtual detectors. The system default virtual detector size is 1mm by 1mm. The user is given the option to override the system default by specifying a different virtual detector width and height, resulting in a different number of virtual detectors (computed by dividing the Reconstruction area by the virtual detector size). → Note: The number of virtual detectors has an important effect on both computation time and on ultimate accuracy (see Section 9) → Note: It is recommended to keep the size of the virtual detectors below 2 mm
1Q 2006 58
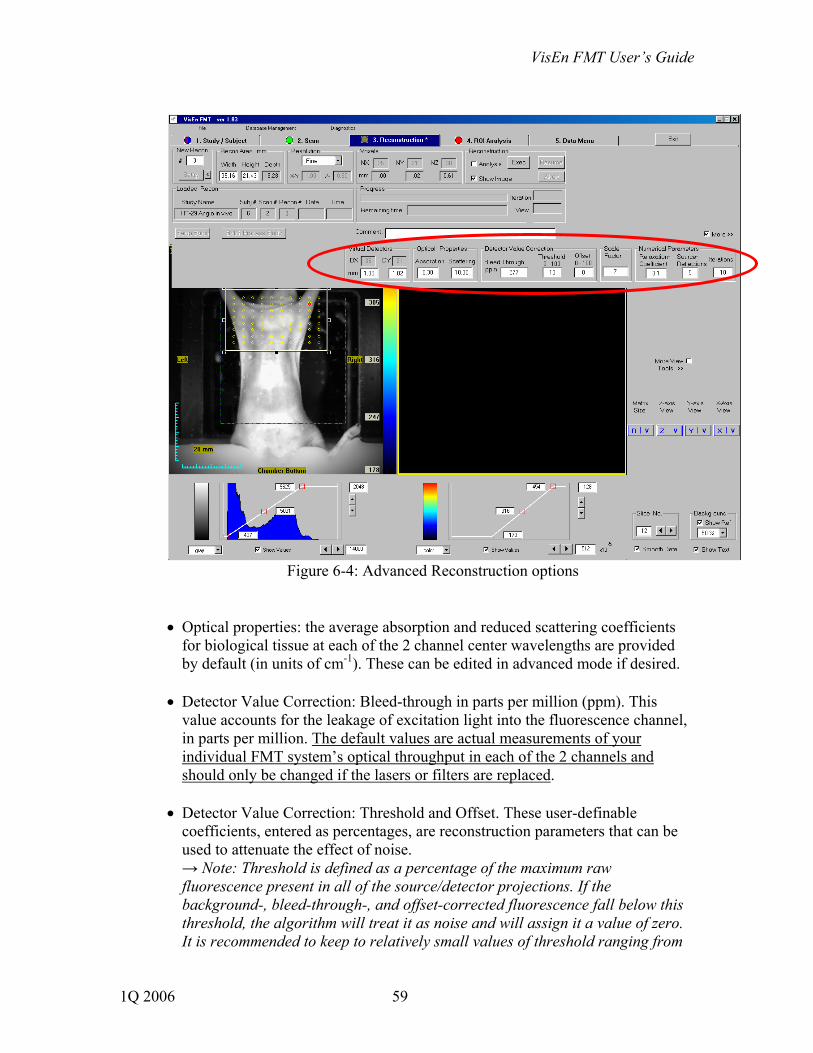
VisEn FMT User’s Guide
Figure 6-4: Advanced Reconstruction options
• Optical properties: the average absorption and reduced scattering coefficients for biological tissue at each of the 2 channel center wavelengths are provided by default (in units of cm-1). These can be edited in advanced mode if desired.
• Detector Value Correction: Bleed-through in parts per million (ppm). This value accounts for the leakage of excitation light into the fluorescence channel, in parts per million. The default values are actual measurements of your individual FMT system’s optical throughput in each of the 2 channels and should only be changed if the lasers or filters are replaced.
• Detector Value Correction: Threshold and Offset. These user-definable coefficients, entered as percentages, are reconstruction parameters that can be used to attenuate the effect of noise. → Note: Threshold is defined as a percentage of the maximum raw fluorescence present in all of the source/detector projections. If the background-, bleed-through-, and offset-corrected fluorescence fall below this threshold, the algorithm will treat it as noise and will assign it a value of zero. It is recommended to keep to relatively small values of threshold ranging from
1Q 2006 59

VisEn FMT User’s Guide
0-10%. → Note: Offset is also defined as a percentage of the maximum raw fluorescence present in the projections. This amount is subtracted from the background and bleed-through-corrected fluorescence. Applying a small offset (in the range of 0-5%) may be useful in imaging situations with high levels of background fluorescence (auto-fluorescence).
• Scale Factor: the scale factor is a post-reconstruction multiplication factor for each voxel in the reconstruction mesh accounting for system calibration. The value is different for each of the 2 channels. The default values are actual calibrations of your individual FMT system using phantoms at each wavelength. Periodic or occasional recalibration may be performed by users in the field, as described in Section 10.3.
• Numerical Parameters: Relaxation Coefficient. This number (between 0 and 1) is a multiplier used in the inversion procedure to enhance numerical convergence. The current default is 0.1; higher values may result in faster but possibly less stable computation.
• Numerical Parameters: Source reflections. This parameter controls the handling of a zero-flux boundary condition for the algorithm and should generally not be changed.
• Numerical Parameters: Iterations. The number of iterations used in the inversion part of the algorithm. → Note: A recommended starting value is 10 iterations. When the Show Image option is checked prior to executing a reconstruction, the system will show the incremental progress after each iteration. In situations of slow convergence (the reconstructed concentration still appears to change between iterations), the number of iterations may be increased to any value.
The Reconstruction page also has a check box for More View Tools, which reveals additional view buttons (Figure 6-5a):
Figure 6-5a: Additional reconstruction view buttons
1Q 2006 60
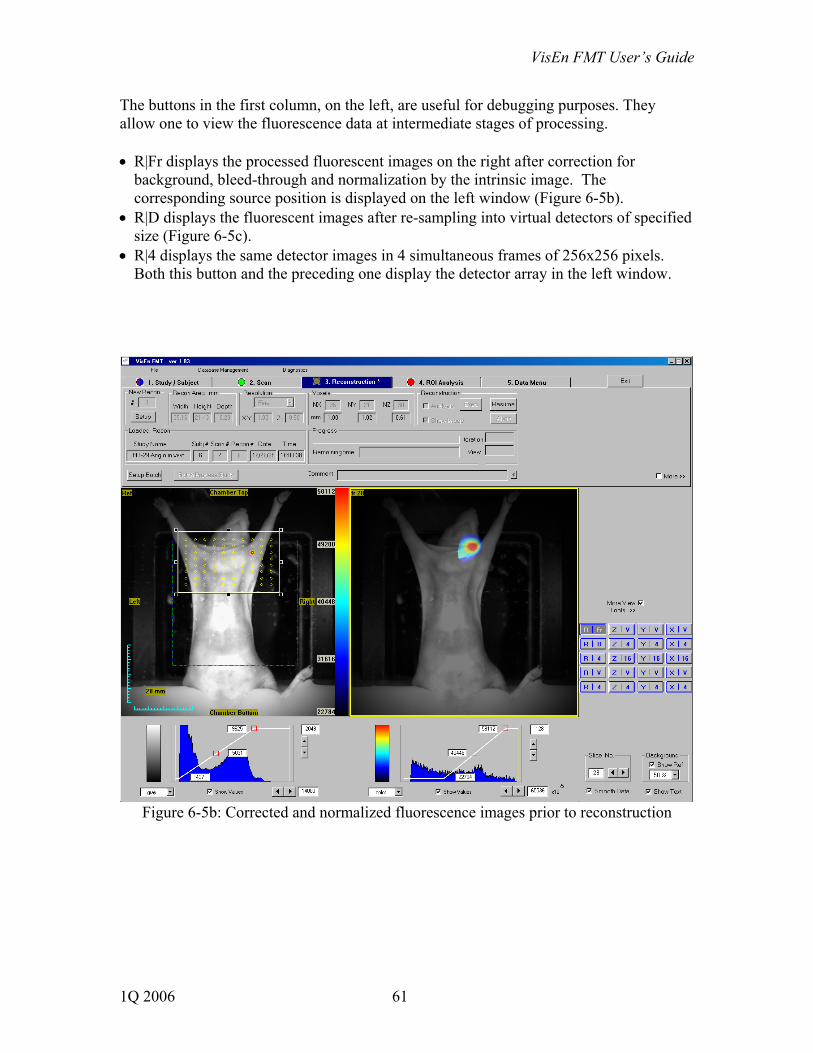
VisEn FMT User’s Guide
The buttons in the first column, on the left, are useful for debugging purposes. They allow one to view the fluorescence data at intermediate stages of processing. • R|Fr displays the processed fluorescent images on the right after correction for
background, bleed-through and normalization by the intrinsic image. The corresponding source position is displayed on the left window (Figure 6-5b).
• R|D displays the fluorescent images after re-sampling into virtual detectors of specified size (Figure 6-5c).
• R|4 displays the same detector images in 4 simultaneous frames of 256x256 pixels. Both this button and the preceding one display the detector array in the left window.
Figure 6-5b: Corrected and normalized fluorescence images prior to reconstruction
1Q 2006 61

VisEn FMT User’s Guide
Figure 6-5c: Virtual detector data for one source/detector pair
The buttons in the other 3 columns display coronal, axial and sagittal slices in multiple views, as labeled. For example, the Z|4 button allows for the display of 4 consecutive coronal slices, as illustrated in Figure 6-5d, which shows the receding of a fluorescent lesion with increasing depth.
1Q 2006 62

VisEn FMT User’s Guide
Figure 6-5d: Display of 4 consecutive coronal reconstruction slices
6.7 Batch Processing of Reconstructions A useful feature in the Reconstruction tab is batch processing of reconstructions for a given study. This feature allows the user to reconstruct all scans for a given study, using the same reconstruction parameters, with one batch process command. In order to launch a batch processing session, select a study from the database, open the Reconstruction tab and click the “Setup Batch” button on the left. Upon doing this, the Recon Setup screen will become partially editable. The user can then enter the reconstruction parameter settings to be used throughout all reconstructions in the batch.
→Note: a few select reconstruction parameters are un-editable and are therefore grayed out. These parameters inherit their channel-specific default values, as defined in the configuration config.txt file; and in the case of the reconstruction area will inherit the systems’ default based on the scan area.
Once the user has selected the desired reconstruction parameter settings, the “Batch Process Study” button may be clicked to initiate the batch processing. After the batch process begins a, “Stop Batch” button appears for the user to stop the process if needed. If the “Stop Batch” button is clicked only the reconstructions already completed within
1Q 2006 63

VisEn FMT User’s Guide
that batch will remain saved under the appropriate scan; the current reconstruction will be stopped at its current iteration and saved. 7 ROI Analysis The user can perform Region of Interest (ROI) analysis on tomographic results in the Analysis Tab once a reconstruction is completed. The steps to perform ROI analysis are as follows (Figure 7-1):
1) Click the Setup button on the Analysis tab to start a new analysis. 2) Select the ROI boundary shape from the ROI Shape block (Rectangular,
Ellipsoid, Cylindrical). The Rectangular shape is the system default.
3) (Optional) If desired, one can assign a threshold value as a minimum voxel fluorescence concentration. This does not alter the dataset from the tomographic reconstruction in any way. Rather, it allows the user to perform automatic contouring in 3D on the actual region of interest for analysis purposes by only analyzing the data within the ROI of fluorescence concentration larger than the threshold value. If this option is desired, select the ROI Min value on the Analysis Tools page by editing the text box or gradually incrementing the ROI Min value with the arrow keys.
4) Draw ROI boundaries around the region of interest by using the mouse to drag
and resize the ROI boundary in any or all of the 3 views (Xmip, Ymip, Zmip).
5) Execute the analysis by double-clicking just outside of the ROI, or by clicking the Save button. Note the analysis is only saved to the database when the Save button is clicked.
Up to 4 regions of interest may be specified within any one Analysis by repeating Steps 4 and 5. Analysis results are displayed in the upper right table, as illustrated in Figure 7-1.
1Q 2006 64

VisEn FMT User’s Guide
(1) Setup new analysis (5) Save analysis
(4) Draw ROI
(2) Select ROI Shape (3) Select ROI Threshold
Figure 7-1: Analysis tab layout
7.1 Analysis Setup The Analysis tab displays the analysis parameters and some related reconstruction parameters, and works in the same fashion as the Scan and Recon tabs. The user can complete an entire Analysis by progressing through the analysis steps outlined above; and can also adjust the image levels, ROI shape, and the ROI Min Value. When the FMT 3.0 program is launched, it automatically loads the analysis parameters associated with the last ROI Analysis operation.
→ Note: As indicated in Section 4, the user can load any set of ROI Analysis parameters associated with a previous analysis by clicking on the specific Analysis displayed in the Data Menu page.
1Q 2006 65
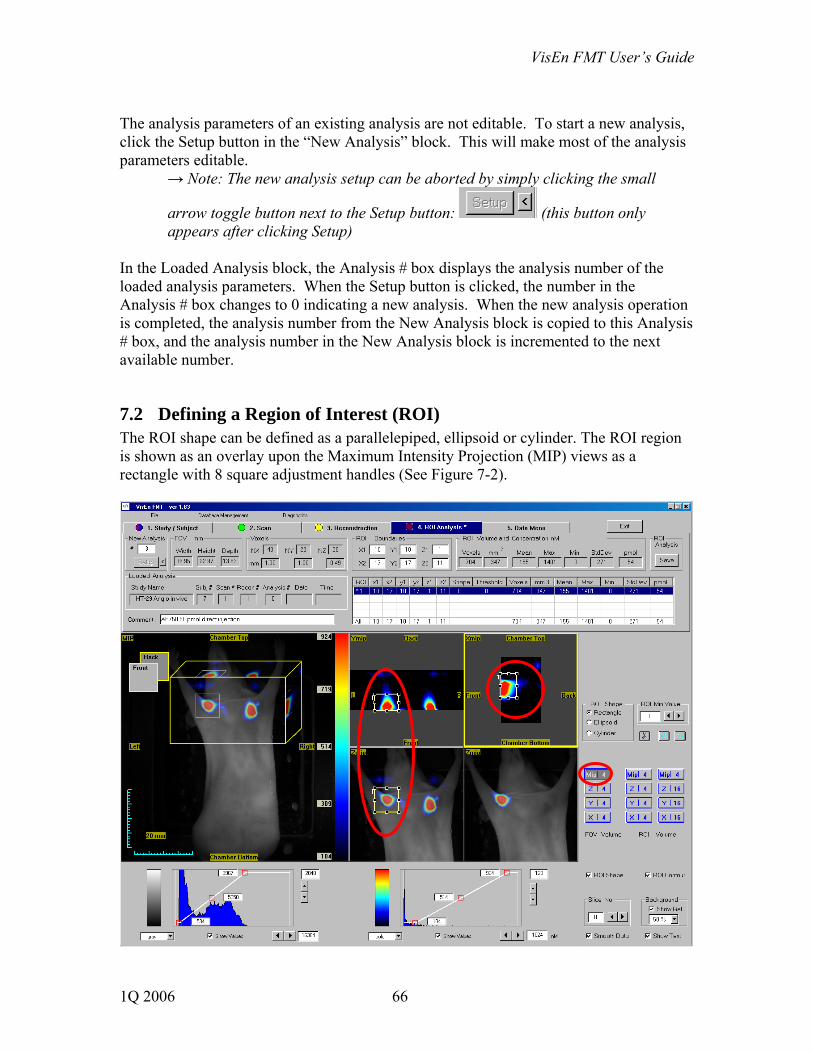
VisEn FMT User’s Guide
The analysis parameters of an existing analysis are not editable. To start a new analysis, click the Setup button in the “New Analysis” block. This will make most of the analysis parameters editable.
→ Note: The new analysis setup can be aborted by simply clicking the small
arrow toggle button next to the Setup button: (this button only appears after clicking Setup)
In the Loaded Analysis block, the Analysis # box displays the analysis number of the loaded analysis parameters. When the Setup button is clicked, the number in the Analysis # box changes to 0 indicating a new analysis. When the new analysis operation is completed, the analysis number from the New Analysis block is copied to this Analysis # box, and the analysis number in the New Analysis block is incremented to the next available number.
7.2 Defining a Region of Interest (ROI) The ROI shape can be defined as a parallelepiped, ellipsoid or cylinder. The ROI region is shown as an overlay upon the Maximum Intensity Projection (MIP) views as a rectangle with 8 square adjustment handles (See Figure 7-2).
1Q 2006 66

VisEn FMT User’s Guide
Figure 7-2: Defining the ROI
→ Note: Since the display levels default to those of the last analysis, the user may have to adjust the display level when setting up a new analysis to ensure that the date is visible within the displayed image. → Note: If the ROI Selection Rectangle is not visible, it can be created by pressing the left button and dragging the mouse from upper left to lower right on one of the frames labeled Zmip, Ymip, or Xmip.
Position the mouse cursor on one of the 8 handles to resize the ROI, or to the central area of the rectangle to move the ROI.
→ Note: When editing the ROI, it is recommended to edit the rectangle within the Zmip frame (selecting the ROI’s X and Y dimensions) and to then change the vertical locations of the ROI Selection Rectangle in the Ymip frame by moving the middle handles of the top and bottom edges of the ROI Selection Rectangle.
Double click on one the Xmip, Ymip, or Zmip images with the left mouse button to complete the ROI definition, being sure not double click on the ROI Selection Rectangle. When an ROI definition is completed, the handles change to a smaller size and the rectangle is no longer adjustable.
→ Note: The ROI statistics are calculated and displayed in the ROI Volume and Concentration block for the most recently completed ROI definition (Figure 7-3a):
Figure 7-3a: Analysis results for the active ROI
→ Note: The 4th frame at the lower right corner of the window, also labeled as Zmip, displays the maximum intensity projection image along Z-axis for the most recently completed ROI definition. → Note: The ROI can be recalled for further editing by double clicking on any of the images in the lower half of the screen with the left mouse button.
The numerical values of the ROI region are shown in the ROI Boundaries block of the Analysis Info page (Figure 7-3b):
1Q 2006 67

VisEn FMT User’s Guide
Figure 7-3b: ROI boundaries in voxel or slice number coordinates
Numerically, the boundaries of the ROI rectangle along the x-axis are defined by the values of x1 and x2. Likewise, the boundaries along the y-axis are defined by the values y1 and y2, and the boundaries along the z-axis are defined by the values z1 and z2. If the whole volume along the z-axis has Nz slices, then z1 and z2 define the starting and ending slice boundaries ranging from 0 to Nz. Thus if z1 = 0 and z2 = Nz, all slices along the z-axis are included in the ROI region. If z1 = 4 and z2 = 8, for example, four slices are included in the ROI region. They are slice number 5, slice number 6, slice number 7, and slice number 8. Similarly, the values of x1 and x2 define the ROI slices along the x-axis, and the values of y1 and y2 define the ROI slices along the y-axis.
→Note: The user can also define the ROI region by changing the numerical values of the x, y, and z text boxes in the ROI Boundaries block. After adjusting any of the numerical values the user can hit enter or left-click outside of the altered text box to see the resulting change in the ROI region.
To cancel the ROI definition, double click with the right mouse button. A new ROI can be created again by pressing and dragging the mouse.
7.3 Storing a ROI Analysis When an ROI is completed, clicking the Save button on the Analysis info page will store the Analysis results into the database.
→Note: Double-clicking outside the ROI region will post the ROI statistics as outlined above (Figure 7-3a). However, the analysis will not be saved into the database until the Save button is clicked .
7.4 Reviewing an Analysis After an ROI has been defined or an ROI analysis stored, the corresponding ROI statistics for that analysis are displayed in the ROI Volume and Concentration block as well as in the table directly underneath. These statistics are displayed in un-editable text boxes underneath the corresponding statistic name. Descriptions of the statistics are given below:
• Voxels – the total number of voxels contained with in the ROI region • mm3 – the volume of the ROI region in cubic millimeters • Mean – the sum of the voxel concentration within the ROI region in nano-
molar (nM) divided by the number of voxels within the ROI region. • Max – the maximum voxel concentration within the ROI region in nM
1Q 2006 68
VisEn FMT User’s Guide
• Min – the minimum voxel concentration within the ROI region in nM • StdDev – the standard deviation of the voxel concentrations within the ROI
region • Total pmol – the total number of pico-moles of fluorochrome within the ROI
region
7.5 Analysis Display Options Page From the Analysis tab, the user is provided with access to several display options as well as access to the windowing functions, which are described in Sections 5 and 6. Furthermore, the user can view the reconstruction slices individually (as previously done in the Reconstruction tab) or through a new feature view the maximum intensity projections (MIP) of the reconstruction in several toolbar display modes. The user can also adjust the ROI shape, the ROI Min Value, and the turn on/off the view of the ROI outline and the ROI contour.
7.5.1 Toolbar Display Modes The Analysis Tools page contains 3 sets of toolbars with 4 items each: The left toolbar displays the reconstruction images to be analyzed. These images are either generated from a reconstruction operation or loaded from the database.
• Mip|4 displays the Maximum Intensity Projection images, viewed along, X, Y, and Z axes. They are used as reference to define the ROI for analysis.
• Z|4, Y|4, X|4 display regular coronal, axial or sagittal slices 4 at a time. These can also be used as reference to define the ROI.
The middle and right toolbars display the reconstruction slices with all but the ROI voxels masked, 4 and 16 slices at a time respectively.
• Mip|4 displays the maximum intensity projection images of the ROI, with 3D perspective view on the left window and X-, Y-, Z-axis views on the right window. The 4th frame, also labeled as Zmip, displays the ROI size and shape only, without image intensity data, for visualization purposes.
• Z|, Y| and X| display the volume images of the ROI in 4 frames or 16 frames on the right window.
7.5.2 ROI Shape The user can toggle between the parallelepiped (rectangular), ellipsoid or cylindrical ROI shapes by clicking on the desired ROI shape in the ROI Shape block. The Show ROI Shape checkbox allows the user to view each individual ROI shape when checked and suppress views of the ROI shapes when un-checked. The ROI shapes are displayed in the left most image as well as in one of the four right images in the Z|4, Y|4, X|4 views.
1Q 2006 69

VisEn FMT User’s Guide
→ Note: The Z|16, Y|16, or X|16 views do not display the ROI shapes in the right image.
7.5.3 ROI Min Value The ROI Min Value block allows the user to set an analysis concentration threshold below which voxels are not considered to contribute useful signal and are discarded from the ROI region. As a result, increasing the ROI Min Value will either decrease the ROI volume by excluding voxels below the ROI Min Value or have no effect on the ROI volume.
→ Note: This ROI Minimum value only affects the ROI results, and has no impact on the reconstruction results. → Note: This value should not be confused with the Threshold used in the Detector Value Correction box in the advanced Reconstruction features; the latter is a pre-reconstruction threshold which does have an effect on the reconstruction results (see Section 6.6).
7.5.4 Viewing ROI Contour The Show ROI Contour checkbox allows the user to view the ROI contour when checked and suppress views of the ROI contour when un-checked The contour is the border of the summed ROI regions. Thus, if one analysis contains two ROIs and one of the ROI’s resides inside the other, and the ROI Min Value is set to zero; the ROI contour will be the boundary of the larger ROI.
→ Note: If the Show ROI Contour is checked in the MIP/4 viewing mode and the ROI Contour is not visible, refer to Section 7.1.2 Defining a ROI.
In the Analysis Tab, three buttons are provided to facilitate the editing of the ROIs. The
cut button, , allows the user to delete the selected ROI. An undo button, , and a
redo button, , allow the user to discard and reinstate the last actions.
1Q 2006 70
VisEn FMT User’s Guide
8 Exporting Data and Images The File Menu, at the top left of the taskbar, provides access to several export features. The user can export experiment parameters and results to a spreadsheet, export images in several standard file formats as well as DICOM, and capture screen snapshots of currently loaded database items. These features are described in the following sub-sections.
8.1 Spreadsheet Export Clicking the Spreadsheet Export item from the File Menu exports selected study, subject, scan, recon, and analysis parameter settings and analysis results. The data associated with some or all tree paths at or hierarchically below the user’s selection will be exported to the spreadsheet according to a layout specified by the user. →Note: In order to take advantage of the Spreadsheet Export feature, Microsoft Excel must be installed on the host PC. Upon selecting “Spreadsheet Export” from the File Menu, a Spreadsheet Export Window similar to that shown in Figure 8-1 appears. There are two sub-blocks within this window. First, the user chooses whether to export to the spreadsheet based on the “Database Selection”, the item selected in the database, or based on the “Current Selection”, the item open in the current application tabs (Scan, Recon, or Analysis).
• Choosing “Database Selection” will result in all parameter settings and results associated with the selected database item and all the items hierarchically below being exported to the spreadsheet.
• Choosing “Current Selection” will result in all parameter settings and results associated with the open item being exported to the spreadsheet; where an open item is defined as an item whose image data can be seen by selecting any Scan, Recon, or Analysis tab. Note that the hierarchical level of this item is determined by the lowest tab level (Scan, Recon, or Analysis) for which images are displayed.
The second sub-block of the “Spreadsheet Export” window, “Excel Sheet Division”, allows the user to group exported data into separate worksheets by Analysis, Recon, Scan, Subject, or Study.
→ Note: For example, selecting a Scan from the database menu and then selecting the “Per Recon” option with the prior “Database Selection” option will save information corresponding to each Reconstruction into its own worksheet. Note that all information corresponding to the associated analyses of a given Recon will be part of that Recon’s worksheet. Choosing one of the other “Excel Sheet Division” options will lead to sheet divisions based on the option selected.
1Q 2006 71

VisEn FMT User’s Guide
To initiate the spreadsheet export, click the “Export” button, at which point, an instance of Microsoft Excel will be launched and the user can see each worksheet being populated with the exported data. At the completion of the export, the instance of Excel will be closed and the user can either export more data using the Spreadsheet Export window or click the “Close” button to close the window.
Figure 8-1: Spreadsheet Export Window
8.2 Image Export By selecting the Image Export from the File Menu, users can export images or stacks of images to a user-defined path and filename. In order to access this feature, a Scan, Recon, or Analysis must be open to export a Reflectance image; or the Recon or an Analysis tab must be open to export Recon or Analysis Images respectively. Exporting Analysis images is different from exporting Recon images in that the exported Analysis images will show signal only within the ROI selected for that analysis. Upon selecting “Image Export” from the File Menu, an Image Export Window appears (Figure 8-2). From this window, the user can select whether to export an “Individual Frame”, a “Frame Stack”, or a “Reflectance” image. Selecting “Individual Frame” allows the user to export one or multiple coronal, axial, or sagittal slices; each slice being saved to an individual file. Selecting “Frame Stack” allows the user to export multiple slices to a layered .TIFF file. Selecting “Reflectance” allows the user to export the fluorescent and/or excitation reflectance images. Note that if either “Frame Stack” or “Individual Frame” are selected, the Image Export Window shown in Figure 8-2a will be
1Q 2006 72
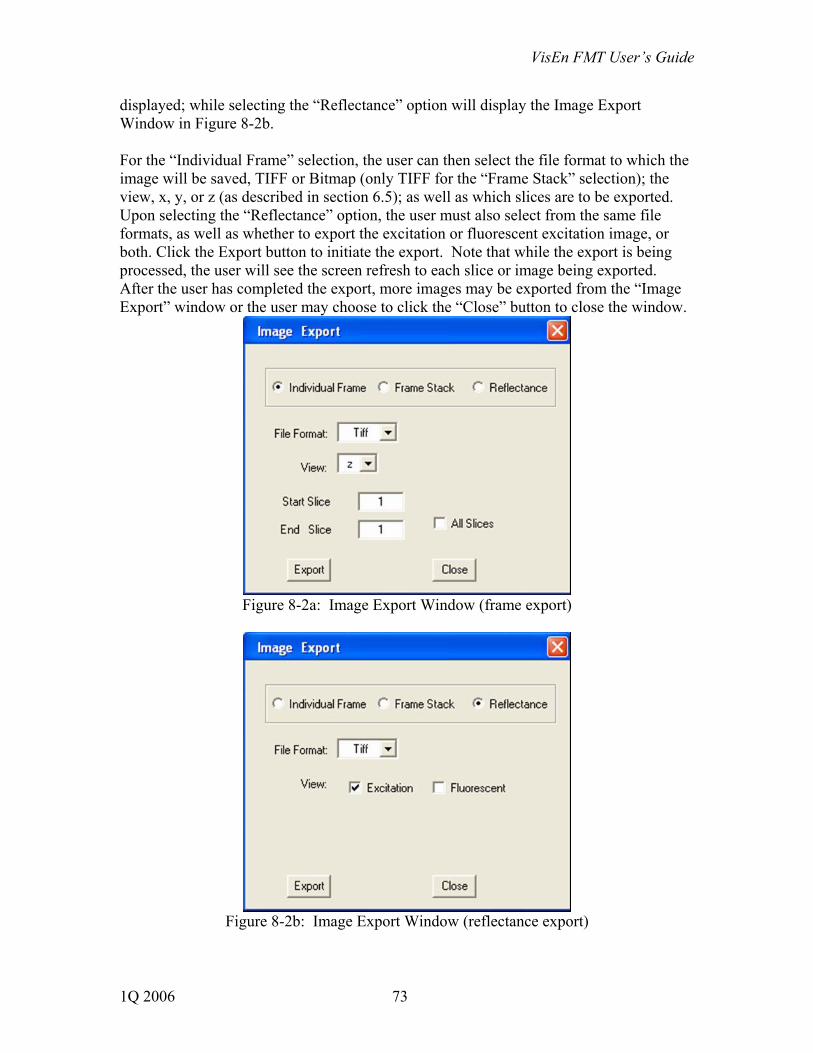
VisEn FMT User’s Guide
displayed; while selecting the “Reflectance” option will display the Image Export Window in Figure 8-2b. For the “Individual Frame” selection, the user can then select the file format to which the image will be saved, TIFF or Bitmap (only TIFF for the “Frame Stack” selection); the view, x, y, or z (as described in section 6.5); as well as which slices are to be exported. Upon selecting the “Reflectance” option, the user must also select from the same file formats, as well as whether to export the excitation or fluorescent excitation image, or both. Click the Export button to initiate the export. Note that while the export is being processed, the user will see the screen refresh to each slice or image being exported. After the user has completed the export, more images may be exported from the “Image Export” window or the user may choose to click the “Close” button to close the window.
Figure 8-2a: Image Export Window (frame export)
Figure 8-2b: Image Export Window (reflectance export)
1Q 2006 73

VisEn FMT User’s Guide
8.3 DICOM Export By selecting “DICOM Export” from the File Menu, users can export reconstruction slices, analysis slices, and reflectance images in DICOM format to a DICOM folder within the Export folder of the Home Database. These files are readable by most standard DICOM viewers. Upon selecting “DICOM Export” from the File Menu, a DICOM Export window, as shown in Fig 8-3, appears. Exports from either the “Current Selection” or the “Database Selection” can be made. Note that, as previously described in Section 8.1, the current selection option can only be used if a Scan, Recon, or Analysis tab is open. The export will be performed on the item currently open item in these tabs. When selecting the “Database Selection” the user exports all of the “Reconstruction Slice” or “ROI Analysis” DICOM data at or hierarchically below the selected item.
Figure 8-3 DICOM Export window
The user can next opt to export all of the “Reconstruction Slices” or “ROI Analysis” from the Volume Data block. Note that similarly to the Image Export feature described in Section 8.2, the “ROI Analysis” selection exports the data within the ROI only; but this feature differs in that all of the slices will be included in the DICOM file rather than a user selected number. Prior to export, it is possible to apply a smoothing filter to the reconstruction or analysis data (“Filtering” block). Note that the image display default for this application is smoothing the data, and the un-smoothed image display can be seen by un-checking the smooth data checkbox from the Recon or Analysis tabs. Subsequently, the user may choose to check the “Include Reflectance Image” checkbox to automatically save the Reflectance image to a DICOM file. After making the final export selections, the DICOM export can be initiated by clicking the “Save” button. While the system is exporting the DICOM files, the item currently being exported can be seen in the textbox in the DICOM export window. The user may choose to abort the export while in process by clicking the “Abort” button. Once the export is complete, the user may continue exporting images or they can close the DICOM Export window by clicking the “Close” button.
1Q 2006 74
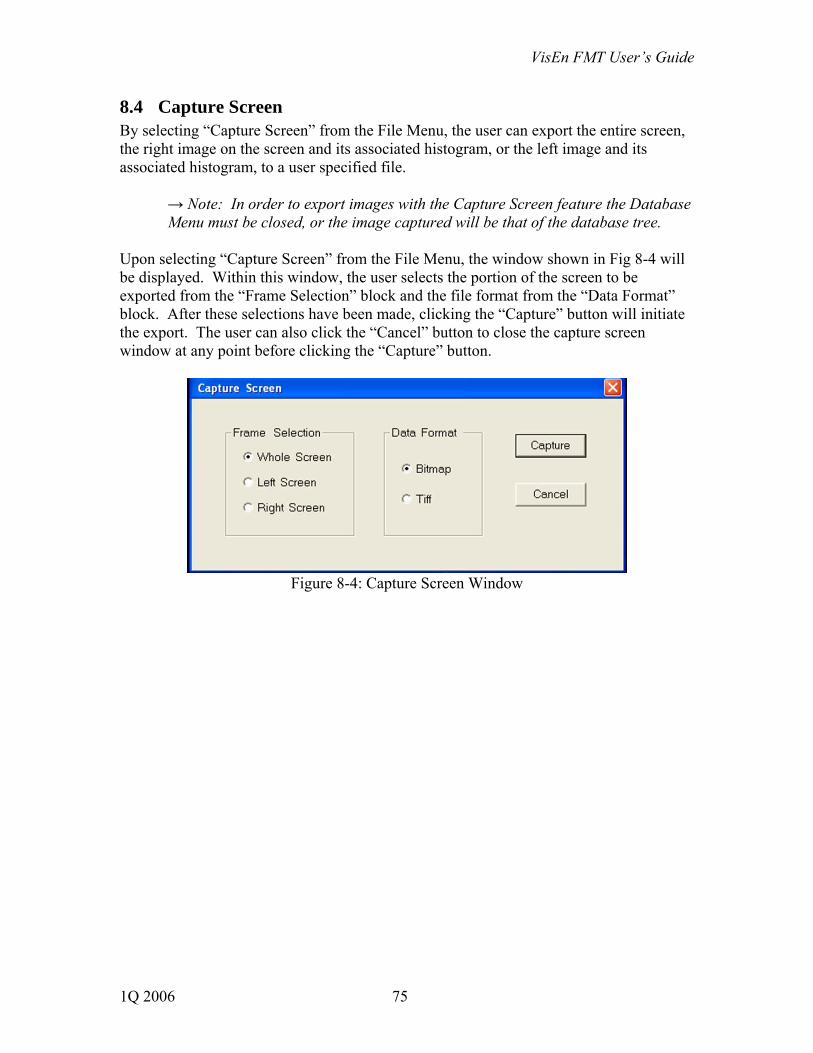
VisEn FMT User’s Guide
8.4 Capture Screen By selecting “Capture Screen” from the File Menu, the user can export the entire screen, the right image on the screen and its associated histogram, or the left image and its associated histogram, to a user specified file.
→ Note: In order to export images with the Capture Screen feature the Database Menu must be closed, or the image captured will be that of the database tree.
Upon selecting “Capture Screen” from the File Menu, the window shown in Fig 8-4 will be displayed. Within this window, the user selects the portion of the screen to be exported from the “Frame Selection” block and the file format from the “Data Format” block. After these selections have been made, clicking the “Capture” button will initiate the export. The user can also click the “Cancel” button to close the capture screen window at any point before clicking the “Capture” button.
Figure 8-4: Capture Screen Window
1Q 2006 75
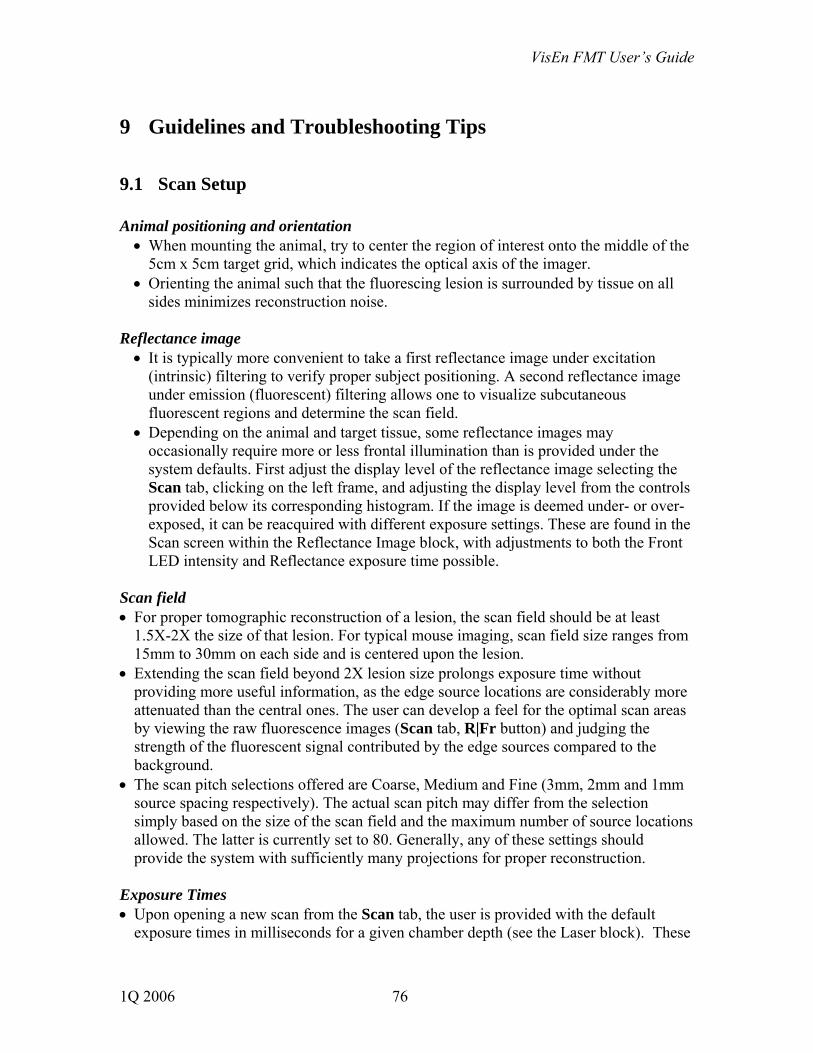
VisEn FMT User’s Guide
9 Guidelines and Troubleshooting Tips
9.1 Scan Setup Animal positioning and orientation • When mounting the animal, try to center the region of interest onto the middle of the
5cm x 5cm target grid, which indicates the optical axis of the imager. • Orienting the animal such that the fluorescing lesion is surrounded by tissue on all
sides minimizes reconstruction noise.
Reflectance image • It is typically more convenient to take a first reflectance image under excitation
(intrinsic) filtering to verify proper subject positioning. A second reflectance image under emission (fluorescent) filtering allows one to visualize subcutaneous fluorescent regions and determine the scan field.
• Depending on the animal and target tissue, some reflectance images may occasionally require more or less frontal illumination than is provided under the system defaults. First adjust the display level of the reflectance image selecting the Scan tab, clicking on the left frame, and adjusting the display level from the controls provided below its corresponding histogram. If the image is deemed under- or over-exposed, it can be reacquired with different exposure settings. These are found in the Scan screen within the Reflectance Image block, with adjustments to both the Front LED intensity and Reflectance exposure time possible.
Scan field • For proper tomographic reconstruction of a lesion, the scan field should be at least
1.5X-2X the size of that lesion. For typical mouse imaging, scan field size ranges from 15mm to 30mm on each side and is centered upon the lesion.
• Extending the scan field beyond 2X lesion size prolongs exposure time without providing more useful information, as the edge source locations are considerably more attenuated than the central ones. The user can develop a feel for the optimal scan areas by viewing the raw fluorescence images (Scan tab, R|Fr button) and judging the strength of the fluorescent signal contributed by the edge sources compared to the background.
• The scan pitch selections offered are Coarse, Medium and Fine (3mm, 2mm and 1mm source spacing respectively). The actual scan pitch may differ from the selection simply based on the size of the scan field and the maximum number of source locations allowed. The latter is currently set to 80. Generally, any of these settings should provide the system with sufficiently many projections for proper reconstruction.
Exposure Times • Upon opening a new scan from the Scan tab, the user is provided with the default
exposure times in milliseconds for a given chamber depth (see the Laser block). These
1Q 2006 76

VisEn FMT User’s Guide
exposure times are set to maintain a 50:1 laser energy ratio between the fluorescent and excitation image acquisitions. For this reason, when the user adjusts the excitation exposure time, the fluorescent exposure time will change in order to maintain the laser energy ratio. Note, though that if the user adjusts the fluorescent exposure time, the laser energy ratio will not be maintained. Because the FMT system has been calibrated at a 50:1 laser energy ratio, the user will need to re-calibrate the system at the new laser energy ratio in order to obtain accurate concentration information from scan acquisitions taken at this new ratio.
IMF level • The IMF level within the Imaging Chamber should at least cover the top of the 5cm x
5cm rear glass window. It should also be about 2cm above the highest point of the scan in order to minimize reflections from the liquid/air interface.
• Air bubbles trapped between the animal and the front glass plate may occasionally appear and should be visible in the reflectance image. As this may add noise to your reconstruction result it is recommended to gently nudge the animal in order to release these air bubbles.
9.2 Reconstruction Parameters Reconstruction Field of View • The default size for the reconstruction field of view (Recon Area) is based on that of
the Scan Field, extended by 3mm in each direction. • While it is possible for the user to override and provide a different reconstruction field
size; best results are usually associated with Scan and Reconstruction fields that are roughly symmetrical, and for which the Reconstruction area is not significantly larger than the Scan area.
Resolution • The resolution selection for the voxel mesh (not to be confused with that of the Scan
Field) is also displayed as Coarse, Medium and Fine in the drop-down menu. These settings correspond to voxel cubes that are 1.5mm, 1mm or 0.5mm on the side along the z-axis. The actual voxel size might differ slightly in order to retain an integer number of voxels within the reconstruction field, and is displayed in the Voxels block on the right.
• The voxel resolution, the scan resolution, and the detector resolution (number of virtual detectors) all have a direct impact on the computational time as well as the quality of the reconstruction. It is generally more useful to increase the latter two (i.e. number of sources prior to a Scan and number of detectors) than to increase the number of voxels in order to improve reconstruction.
Virtual Detectors • The default size for the virtual detectors is 1mm, but this can be overridden. It is
generally recommended to keep the size below 2mm for accurate reconstructions. Too
1Q 2006 77

VisEn FMT User’s Guide
small a virtual detector size would result in long computation times. To avoid long computational times it is recommended to keep the number of detectors at or below 30 x 30..
• The numbers of sources and detectors both have an impact on the quality of the image. Favor the side closer to the lesion by increasing the number of elements on that side –i.e., for a lesion on the camera-facing side increase the number of detectors and for a lesion nearer to the rear of the chamber increase the number of sources.
Detector Value Correction • The threshold correction is used to reduce the noise contribution to the reconstruction,
and generally falls in the 0-10% range. Bear in mind that too high a threshold setting will eliminate the contribution of the weaker signals, which typically come from the edges of the scan field. This will reduce the number of projections (source/detector pairs) contributing to the reconstruction, which will reduce the z-axis resolution of the reconstruction. The system will default to the following system defaults: threshold = 10%, offset = 0%..
• The offset correction is used to reduce the contribution of background fluorescence, and generally falls in the 0-5% range.
Please contact VisEn Medical for technical support and troubleshooting of other aspects of instrument operation.
1Q 2006 78
VisEn FMT User’s Guide
10 Maintaining the System
The VisEn FMT System needs little maintenance on a regular, on-going basis and is easy to clean. The System’s imaging chamber is water-tight and resistant to mild chemicals. The FMT 3.0 software has built-in controls to clean the chamber on a daily basis or at the end of a study. The rest of this section discusses chamber cleaning procedures as well as the use of the built-in diagnostics and calibration menus.
10.1 Cleaning the imaging chamber As outlined in Section 5.5 (Fluid Handling), the user has the option of applying a cleaning solution to the imaging chamber when a scan is completed or when a study is completed.
→Note: The schedule of applying the cleaning solution is user-determined. →Note: It is recommended to flush out residual IMF from the heater and connecting hoses at the end of a study or the end of the day. When this is done, the user should prime the heater and hoses with IMF immediately prior to initiating the next scan session. →Note: The formulation and supply of the cleaning solution is user-determined.
Recommended solutions for cleaning the chamber include the following: • Surfactants such as Triton X-100, glycerol or Tween; < 0.5% dilution with
water • Quatricide in water (for example Quatricide PV from Pharmacal); dilute as
indicated by the manufacturer and rinse thoroughly with water to remove any residual Quatricide
Recommended protocol for cleaning the chamber: See Figure 5-3d, reproduced here as Figure 10-1:
i. In the VisEn FMT 3.0 application, select the Scan tab ii. Drain all IMF from chamber by pressing and holding the Drain button in
the Fluid Chamber display region. Continue pressing Drain button for 10 seconds after IMF is no longer visible in the live video panel. Alternatively,
you can press and release the Auto Drain button
iii. Check either the “Through Heater” or “Direct to Chamber” radio button. When the Clean button is pressed, the cleaning solution can be dispensed along either one of two paths, depending on user preference: directly into the chamber, or via the heating element underneath the chamber first (before going to the chamber). Pumping the cleaning solution directly into the chamber is typically appropriate for cleaning the imaging chamber between
1Q 2006 79
VisEn FMT User’s Guide
successive animals if desired. Pumping via the heating element, and then into the imaging chamber will flush out any IMF residing in the heater and the connecting hoses, which is typically recommended at the end of a study or at the end of the day to avoid any build-up of IMF.
→Note: It is recommended to flush out residual IMF from the heater and connecting hoses at the end of a study or the end of the day. When this is done, the user should prime the heater and hoses with IMF immediately prior to initiating the next scan session, as outlined in the next paragraph.
iv. Press and hold for about 15 seconds the Clean button to dispense
cleaning solution v. Drain chamber completely, as in Step (ii), and use the brush provided with the
system to steer the white IMF particles into the drain path at the bottom of the chamber
Figure 10-1 Fluid handling controls
Recommended protocol for priming the system: When the system is first used at the start of an imaging session subsequent to a cleaning cycle such as the one described above, it may be necessary to prime it with IMF.
i. In the VisEn FMT 3.0 application, select the Scan tab ii. Press and hold the IMF Fill button for about 15 seconds. The live video panel
will initially show clear water being pumped in, which is the standing volume of liquid held in the supply hoses and heater coils since the last cleaning. After about 10-15 seconds, the live video panel should show fresh IMF being pumped into the chamber (opaque white swirls mixing with the water).
iii. Drain the chamber by pressing and holding the Drain button until the chamber is completely evacuated, or by pressing and releasing the Auto Drain button.
The system is now ready to be used.
1Q 2006 80
VisEn FMT User’s Guide
10.2 System Diagnostics The Diagnostics menu in the top taskbar is password-protected and designed to be used by service personnel only.
These diagnostic dialogs allow the user to check and set the status of various hardware elements. These diagnostic functionalities have been integrated into four separate diagnostic dialogs, accessible from the main menu bar of the FMT program as “Diagnostics”. The dialogs are: Image Acquisition System, Fluid Pumps and Valves Diagnostic System, Laser Excitation and Motor Control System, and Miscellaneous I/O Controls. Please contact VisEn Medical for further technical assistance with the System Diagnostics feature.
10.3 System Calibration The VisEn FMT System is calibrated in the factory prior to shipment, and the calibration values are stored in a configuration file accessed by the software. The system is calibrated on each of the two channels. Please note that these calibration values are representative of VisEn Medical contrast agents available in each channel. System calibration yields a Scale Factor for each channel, displayed under the advanced Reconstruction tab features (see Figure 10-2). This scale factor is multiplied into each voxel value post-reconstruction to give the result a physical dimension in units of fluorochrome concentration (nM, or 10-9 moles/liter). The system calibration and resulting Scale Factor are dependent upon the following parameters:
1Q 2006 81

VisEn FMT User’s Guide
Figure 10-2 Scale Factor display, under Reconstruction advanced features 1. Light source intensity 2. Attenuation of all optical elements between the light source and the detector,
including: • Optical fibers • Beam combining optics • Coupling, collimating and objective lenses • Imaging chamber glass plate and anti-reflective coatings • Bandpass filters for both excitation and emission wavelengths
3. CCD camera spectral sensitivity 4. Fluorochrome extinction coefficient and quantum yield product It is not necessary to perform periodic re-calibration of the instrument, unless one of the above components were to change. Any maintenance work on the system which involves a change to one of these components will also include a complete re-calibration of the system by a qualified support technician. If the user wishes to use other contrast agents than the ones provided by VisEn Medical, then a simple field calibration may be required for the instrument to provide accurate concentration readouts. The field calibration involves a simple scan, reconstruction and ROI analysis of a phantom containing the new contrast agent. Please contact VisEn Medical for technical assistance.
1Q 2006 82
VisEn FMT User’s Guide
11 Warranty and Regulatory Information
11.1 VisEn FMT Limited Warranty VisEn Medical warrants the VisEn FMT System to function properly for one year from the date of purchase. Specific system components warranted by VisEn Medical are the imaging chamber, the hardware components within the imaging system, the interface cables and power cord, and the VisEn FMT 3.0 Software. The host PC is covered under separate warranty provided by the computer manufacturer.
If, during the warranty period, the equipment does not function properly, as determined by VisEn Medical, shipping instructions and packing materials will be provided to the customer to ship the FMT System to a repair facility, or VisEn Medical will ship replacement parts to the customer site. Repair service will include any adjustments and/or replacement of parts as required to maintain the equipment in operating condition. If your unit needs to be returned for any reason, please contact VisEn Medical, Inc., to obtain a return authorization. All returned units must be decontaminated prior to their return. No returns will be accepted without a return authorization and proper decontamination documentation.
Limitations This warranty does not cover (i) circumstances beyond VisEn Medical’s control, such as customer overriding, bypassing or defeating interlock switches (ii) problems due to failure of customer to conform to VisEn Medical site specifications; (iii) service or parts associated with any unauthorized modifications, attachment or service; (iv) failure to follow operating instructions; (v) misuse or abuse. VISEN MEDICAL MAKES NO OTHER WARRANTIES, EXPRESS, IMPLIED OR OF MERCHANTABILITY OR FITNESS FOR A PARTICULAR PURPOSE FOR THIS EQUIPMENT OR SOFTWARE. Repair or replacement without charge are VisEn Medical’s only obligation under this warranty. VISEN MEDICAL WILL NOT BE RESPONSIBLE FOR CONSEQUENTIAL OR INCIDENTAL DAMAGES RESULTING FROM THE SALE, USE OR IMPROPER FUNCTIONING OF THIS EQUIPMENT OR SOFTWARE REGARDLESS OF THE CAUSE. SUCH DAMAGES FOR WHICH VISEN MEDICAL WILL NOT BE RESPONSIBLE FOR INCLUDE, BUT ARE NOT LIMITED TO, LOSS OF REVENUE OR PROFIT, DOWN-TIME COSTS, LOSS OF USE OF THE EQUIPMENT, COST OF SUBSTITUTE EQUIPMENT, FACILITIES OR SERVICES OR CLAIMS OF CUSTOMERS FOR SUCH DAMAGES.
1Q 2006 83
VisEn FMT User’s Guide
Software License Agreement You should carefully read the following terms and conditions before using this software package. Using the VisEn FMT 3.0 software indicates your acceptance of these terms and conditions. VisEn Medical provides this program and licenses its use. You assume responsibility for selection of the program to achieve your intended results, and for use and results obtained from the program. License You may:
1. use the program on a single machine in addition to the computer physically connected to the VisEn FMT System;
2. copy the program into any machine-readable or printed form for backup or modification purposes in support of your use of the program;
3. transfer the program and license to another party if the other party agrees to accept the Terms and Conditions of this License Agreement. If you transfer the program, you must at the same time either transfer all copies whether in printed or machine-readable form to the same party or destroy any copies not transferred; this includes all modifications and portions of the program contained or merged into other programs.
You must reproduce and include the copyright notice on any copy, modification or portion merged into another program. You may not use, copy, modify or transfer the program, or any copy, modification, or merged portion, in whole or in part, except as expressly provided for in this license. If you transfer possession of any copy, modification, or merged portion of the program to another party, your license is automatically terminated. Term The license is effective until terminated. You may terminate it at any time by destroying the program together with all copies, modifications, and merged portions in any form. It will also terminate upon conditions set forth elsewhere in this Agreement or if you fail to comply with any term or condition of this Agreement. You agree upon such termination to destroy the program together with all copies, modifications, and merged portions in any form. Limitation of Liability and Remedy VisEn Medical warrants that it has full power to enter into this Agreement and to grant you the rights provided herein and that the software will substantially conform to VisEn’s specifications.
1Q 2006 84
VisEn FMT User’s Guide
EXCEPT FOR REPLACEMENT OF UNMODIFIED COPIES OF SOFTWARE FOUND BY VISEN MEDICAL TO BE DEFECTIVELY REPRODUCED OR DAMAGED PRIOR TO DELIVERY TO YOU, VISEN MEDICAL EXPRESSLY EXCLUDES ALL OTHER REMEDIES OR WARRANTIES, EXPRESS OR IMPLIED, IN RELATION TO THE SOFTWARE (AND ANY SERVICES RENDERED TO SUPPORT THE SOFTWARE), INCLUDING ANY WARRANTY OF MERCHANTABILITY OR OF FITNESS FOR A PARTICULAR PURPOSE. In particular, VisEn Medical does not warrant that the functions contained in the program will meet your requirements or that the operation of the program will be uninterrupted or error-free. Neither you nor any other third party claiming rights through you will hold VisEn Medical, or any third party from whom it has derived rights in the Software Products, liable for any loss or damage because of any defects or ineffectiveness of the Software Products, including without limitation, any interruption of business, loss of profits, lost data, or indirect, consequential, or incidental damages. VISEN MEDICAL’S LICENSOR(S) MAKES NO WARRANTIES, EXPRESS OR IMPLIED, INCLUDING WITHOUT THE LIMITATION THE IMPLIED WARRANTIES OF MERCHANTABILITY AND FITNESS FOR A PARTICULAR PURPOSE, REGARDING THE SOFTWARE. VISEN MEDICAL’S LICENSOR(S) DOES NOT WARRANT, GUARANTEE, OR MAKE ANY REPRESENTATIONS REGARDING THE USE OR THE RESULTS OF THE USE OF THE SOFTWARE IN TERMS OF ITS CORRECTNESS, ACCURACY, RELIABILITY, CURRENTNESS OR OTHERWISE. THE ENTIRE RISK AS TO THE RESULTS AND PERFORMANCE OF THE SOFTWARE IS ASSUMED BY YOU. THE EXCLUSION OF IMPLIED WARRANTIES IS NOT PERMITTED BY SOME JURISDICTIONS; THE ABOVE EXCLUSION MAY NOT APPLY TO YOU. IN NO EVENT WILL VISEN MEDICAL’S LICENSOR(S), THEIR DIRECTORS, OFFICERS, EMPLOYEES OR AGENTS (COLLECTIVELY VISEN MEDICAL LICENSOR) BE LIABLE TO YOU FOR ANY CONSEQUENTIAL, INCIDENTAL OR INDIRECT DAMAGES (INCLUDING DAMAGES FOR LOSS OF BUSINESS PROFITS, BUSINESS INTERRUPTION, LOSS OF BUSINESS INFORMATION AND THE LIKE) ARISING OUT OF THE USE OR INABILITY TO USE THE SOFTWARE EVEN IF VISEN MEDICAL’S LICENSOR HAS BEEN ADVISED OF THE POSSIBILITY OF SUCH DAMAGES. BECAUSE SOME JURISDICTIONS DO NOT ALLOW THE EXCLUSION OR LIMITATION OF LIABILITY FOR CONSEQUENTIAL OR INCIDENTAL DAMAGES, THE ABOVE LIMITATIONS MAY NOT APPLY TO YOU. General You may not sublicense, assign, or transfer the license or the program except as expressly provided for in this Agreement. Any attempt otherwise to sublicense, assign or transfer any of the rights, duties, or obligations hereunder is void.
1Q 2006 85
VisEn FMT User’s Guide
This Agreement will be governed by the laws of the Commonwealth of Massachusetts. Should you have any questions concerning this Agreement, you may contact VisEn Medical by writing to VisEn Medical, Inc., 12B Cabot Road, Woburn MA 01801, USA.
11.2 Regulatory Information CE Declaration of Conformity The CE Declaration of Conformity is shown on the next page.
1Q 2006 86

VisEn FMT User’s Guide
1Q 2006 87

VisEn FMT User’s Guide
Electromagnetic Compatibility: This product conforms to CENELEC regulations relating to Radio Frequency devices and complies with the requirements of the EMC directive (89/336/EEC). These have been satisfied by testing the product against, and being found to be compliant with:
EN 61326-1: Class A: Electrical equipment for measurement, control and laboratory use – EMC requirements. Including Amendment A1: 1998, Amendment A2: 2001, Amendment A3: 2003
EN 61000-3-2 - Electro-magnetic compatibility (EMC) — Part 3-2: Limits - Limits for harmonic current emissions (equipment input current up to and including 16 A per phase)
EN61000-3-3 - Electro-magnetic compatibility (EMC) — Part 3-3: Limits - Limitation of voltage changes, voltage fluctuations and flicker in public low-voltage supply systems, for equipment with rated current ≤ 16 A per phase and not subject to conditional connection
Safety Information This product shall comply with the requirements of the European Union Low Voltage Directive (73/23/EEC), United States, Canadian, European and International requirements. United States: UL61010-1 - Safety requirements for electrical equipment for measurement, control, and laboratory use — Part 1: General requirements Canada: CAN/CSA C22.2 No. 61010-1 - Safety requirements for electrical equipment for measurement, control, and laboratory use — Part 1: General requirements Europe: EN 61010-1 - Safety requirements for electrical equipment for measurement, control, and laboratory use — Part 1: General requirements International: IEC 61010-1 - Safety requirements for electrical equipment for measurement, control, and laboratory use — Part 1: General requirements
1Q 2006 88

VisEn FMT User’s Guide
12 Technical Services and Support This section includes instructions for obtaining technical assistance and for returning the FMT System for repairs.
12.1 Obtaining Technical Assistance VisEn Medical is the resource for providing installation, preventive and corrective maintenance, technical and operator support, and parts and documentation provisioning. To contact VisEn Medical:
Call: +1.781.932.6875 x315 Email: [email protected]
12.2 Return Material Procedure To return a defective product to the manufacturer, Analogic Corporation, you will need to obtain a Return Material Authorization (RMA) number from VisEn Medical, Inc. Please contact a service coordinator at: Call: +1.781.932.6875 x315 Fax: +1.781.937.4994 Email: [email protected] You will need to supply the service coordinator with the following information:
• The Model number(s) and Serial number(s) of the product, • The “Bill To” address for invoice purposes • The “Ship To” address • A Purchase Order number, and • Details of the reported failure
The service coordinator will then inform you of:
• The Return Material Authorization (RMA) number, • The warranty or non-warranty status of the unit being returned, • Any repair charge • Shipping address for the returned material
Important Note: Please reference your RMA number on both your purchase order and the shipping label.
12.3 Repackaging the VisEn FMT System Inappropriate packing will void the VisEn FMT warranty. Follow these steps when packing the FMT for shipment:
1Q 2006 89
VisEn FMT User’s Guide
• Remove any animal or imaging subject from the imaging chamber
• Drain the unit (including the imaging chamber, both tanks, and all hoses)
• Clean and decontaminate the unit to meet Federal and State Regulatory and
Safety standards.
• Disconnect the power cord and all the computer interface cords. Tie all cords and secure with bubble wrap. These DO NOT have to be returned with the system for repair.
• Cradle the camera using the foam padding originally supplied with the unit
• Fill the imaging chamber with the foam padding originally supplied with the unit
• Close and tighten imaging chamber access panels and camera access panel. Secure fluid tank access panel with masking tape.
• Pack the VisEn FMT System in its original crate. If the original crate was discarded, contact VisEn Medical to arrange for delivery of new packing materials.
Important: All returned units must be decontaminated prior to their return. No returns will be accepted without a return authorization and proper decontamination documentation.
1Q 2006 90

VisEn FMT User’s Guide
Appendix A: Index-Matching Fluid Material Safety Data Sheet
1Q 2006 91
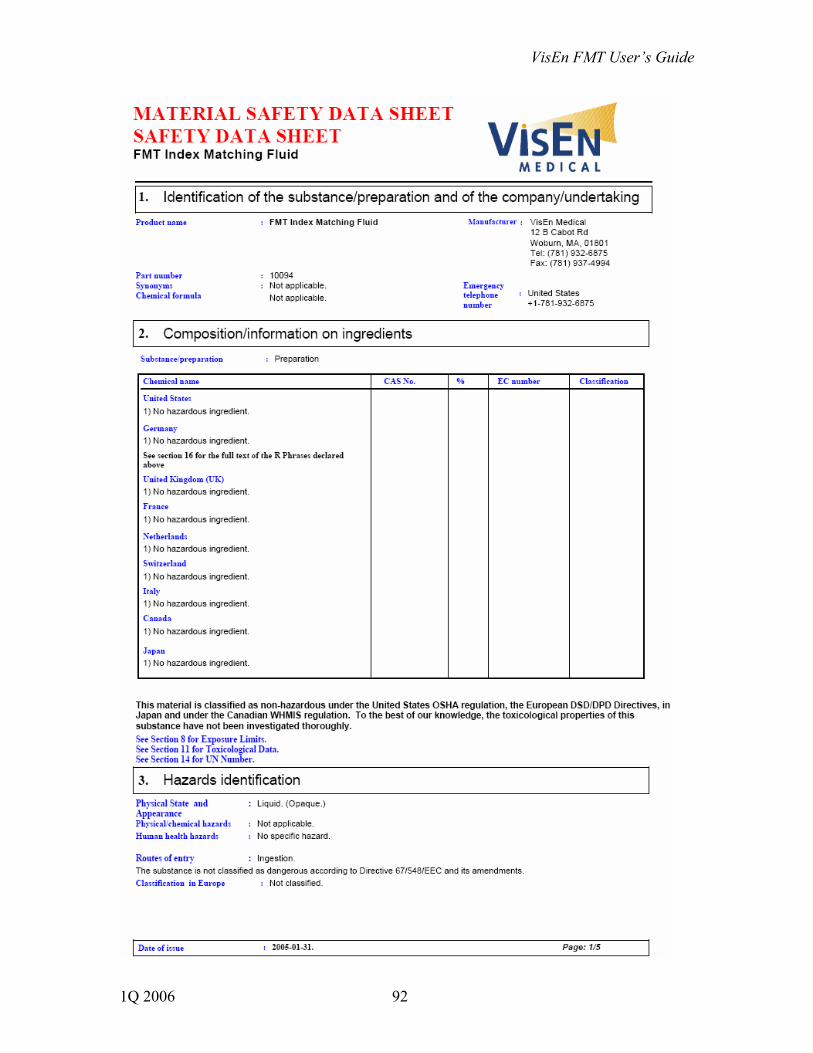
VisEn FMT User’s Guide
1Q 2006 92

VisEn FMT User’s Guide
1Q 2006 93
VisEn FMT User’s Guide
1Q 2006 94
VisEn FMT User’s Guide
1Q 2006 95
VisEn FMT User’s Guide
1Q 2006 96