fmri資料分析講習:...
TRANSCRIPT

fMRI資料分析講習:SPM實作
薛人瑞 博士
心智影像研究中心
2017.4.15

Some parameters we should know TR = 2 s
TE = 35 ms
Number of Slice = 32
Slice order = sequential or interleave
Number of dummy scan = 5
Scan Time= 310 s
5 dummies * 2 s = 10 s
+
150 scans * 2 s = 300 s

Some parameters we should know Resolution = FOV/Matrix size
– in-plane resolution = 3.5 * 3.5 mm (224/64=3.5)
– voxel resolution = 3.5 * 3.5 * 3 mm (224/64=3.5)
FOV =
224 mm
64
64
224 mm
Slice thickness
3 mm
3.5 mm
3.5 mm
3 mm

DICOM?TR
out.nii or
out.img
Slice
DICOM
(Digital Imaging and
Communication in
Medicine)
為醫療數位影像傳輸協定與標準

DICOM format
+

http://people.cas.sc.edu/rorden/dicom/index.html
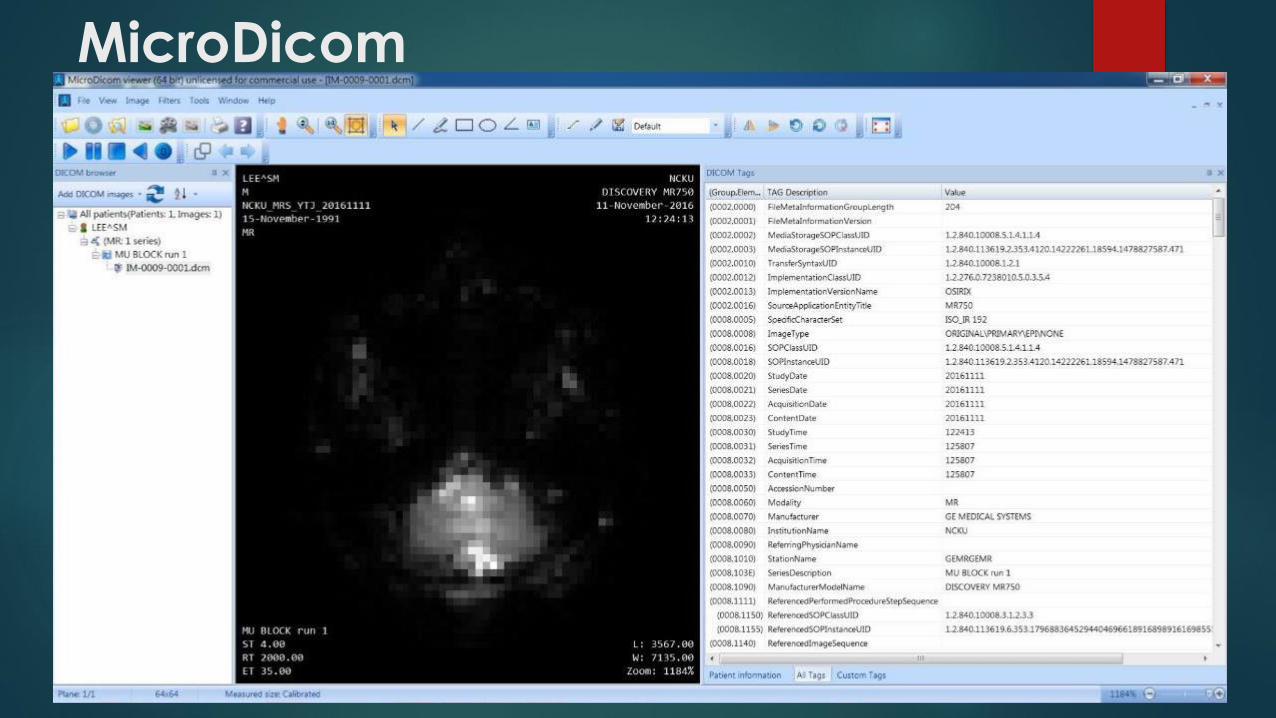
MicroDicom

Matlab Info = dicominfo(‘data.dcm’);
data = dicomread(info);

Matlab imshow(data,[]);

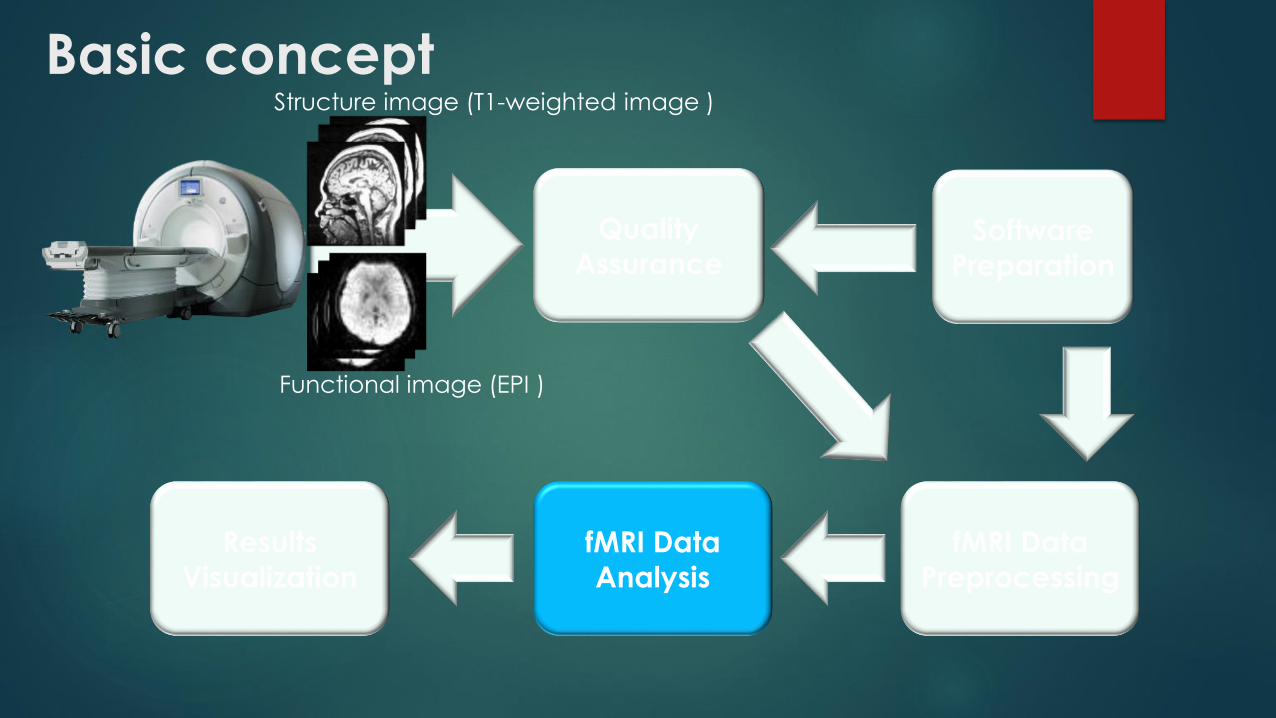
Basic concept
Functional image (EPI )
Structure image (T1-weighted image )
Quality
Assurance
fMRI Data
Preprocessing
fMRI Data
Analysis
Results
Visualization
Software
Preparation

Basic concept
Functional image (EPI )
Structure image (T1-weighted image )
Quality
Assurance
fMRI Data
Preprocessing
fMRI Data
Analysis
Results
Visualization
Software
Preparation

Quality assurance
brightening of the center of the
image compared with the
periphery.
white pixels
visual inspection
abnormal

Quality assurance - visual inspection

Basic concept
Functional image (EPI )
Structure image (T1-weighted image )
Quality
Assurance
fMRI Data
Preprocessing
fMRI Data
Analysis
Results
Visualization
Software
Preparation


SPM

SPM

SPM

SPM
Installation:
1. Unzip spm8.zip
2. Copy to any folder you want
3. Set path (important)
4. Unzip spm8_updates and overwrite to installed folder
or >> spm_update update

Basic concept
Functional image (EPI )
Structure image (T1-weighted image )
Quality
Assurance
fMRI Data
Preprocessing
fMRI Data
Analysis
Results
Visualization
Software
Preparation

Experimental Paradigm
Close Open Close Open Close Open
0 50 100 150 200 250 300 Second
0 25 50 75 100 125 150 TR (scan)
TR/TE = 2 s/ 35ms
Number of Slice = 32
Scan Time= 310 s (5 dummies + 150 scans)
FOV = 224 mm
Voxel size = 3.75 * 3.75 * 4 mm

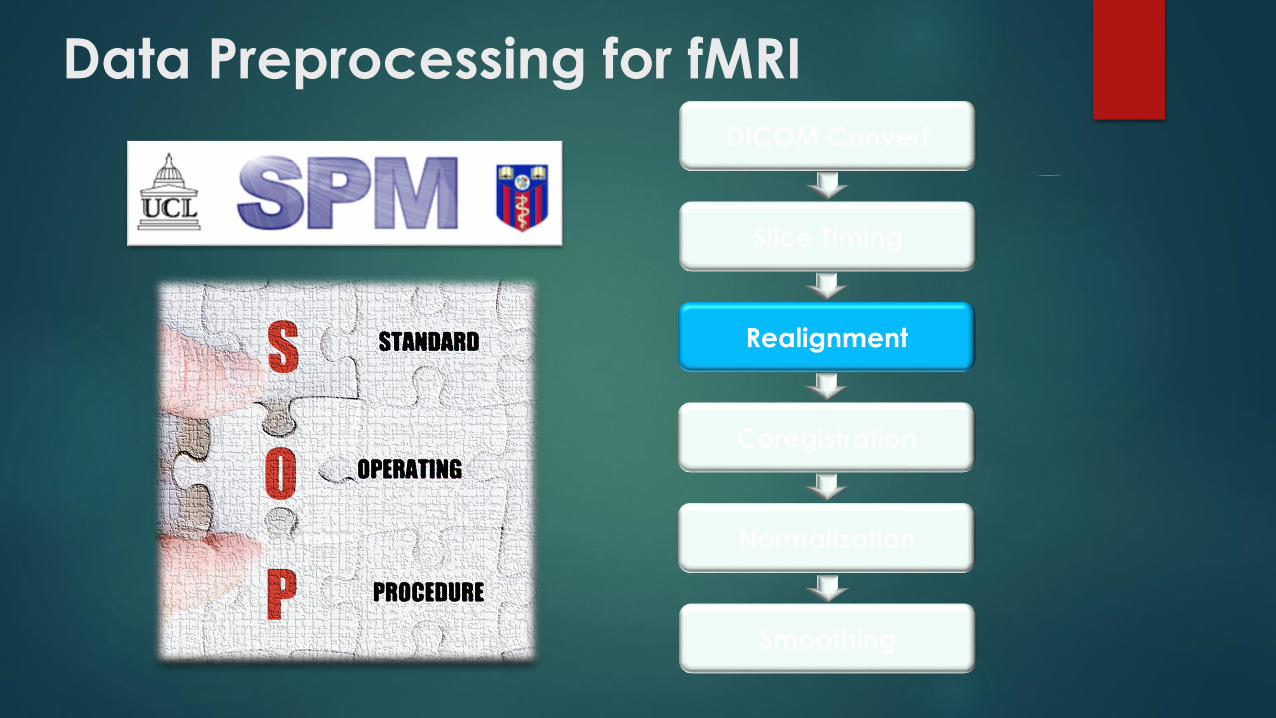
Data Preprocessing for fMRI
DICOM Convert
Slice Timing
Realignment
Coregistration
Normalization
Smoothing

Data Preprocessing for fMRI
DICOM Convert
Slice Timing
Realignment
Coregistration
Normalization
Smoothing

DICOM ConvertTR
out.img
Slice

Slice number = 32 per TR (2s)

Check data
- Display: 1 image
- Check Reg: >1 & <15 images

Data Preprocessing for fMRI
DICOM Convert
Slice Timing
Realignment
Coregistration
Normalization
Smoothing

Slice Timing
Sladky et al, NeuroImage 2011,58:588-594
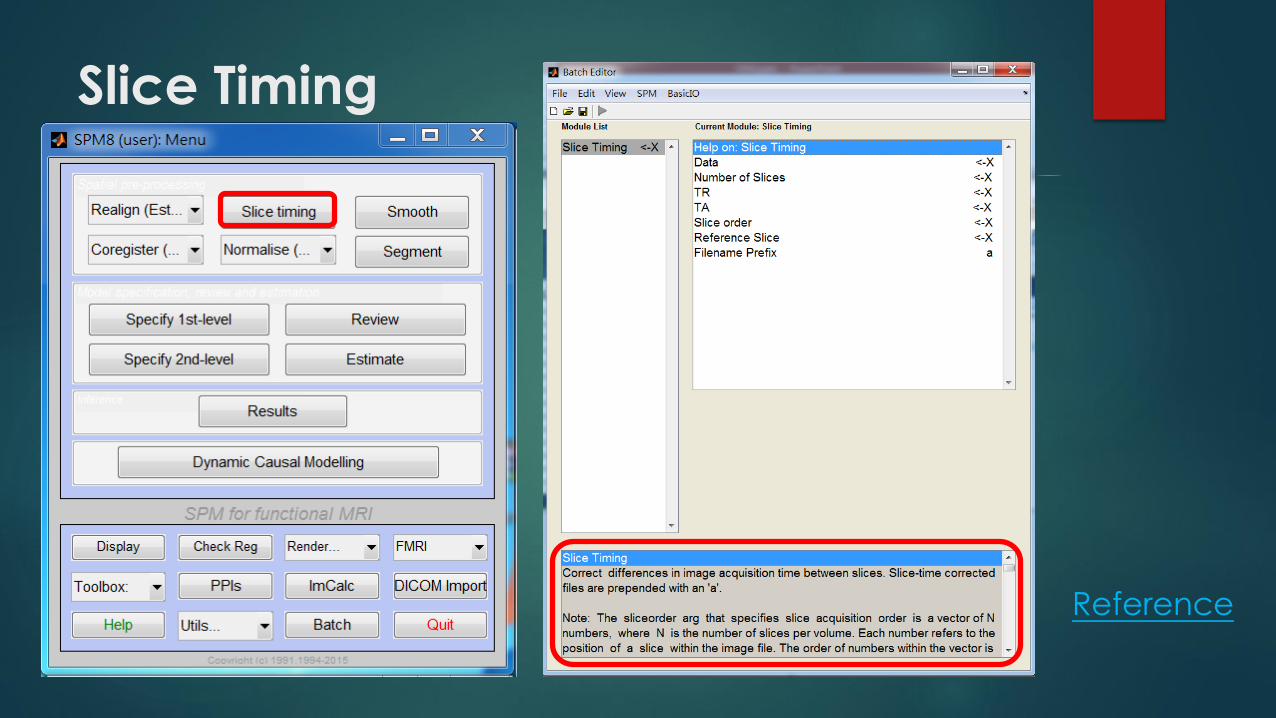


TA: the time between acquisition of the first slice and
the last slice
Slice order: 1:2:32 2:2:32
The reference slice is usually acquired in the
middle of the sequence, but any slice can be
used
Data Preprocessing for fMRI
DICOM Convert
Slice Timing
Realignment
Coregistration
Normalization
Smoothing

Realignment


ZX
Y
Z axis: up & down
X axis: left & right
Y axis: forward & backward

Translation

Rotation


Output.img
• rp_asNCKU.txt
• ImCalc
asNCKU.img rasNCKU.img
-
=

Criteria for head motion
• Ideal
- < 0.5-0.75 mm
- < 0.5o
• Acceptable
< 1 voxel
< 1o

Slice timing or head motion
correction first?
With a sequential slice order
- motion correction first
With an interleaved slice order:
- slice timing correction first
Slice timing correction generally isn’t as important for block design
Reference

Ready for functional analysis?
No!!!
Such corrections are sufficient for functional analysis to a single subject.
Two important questions:
1. how does activity map onto anatomy?
2. how consistent is that mapping across subjects?

Data Preprocessing for fMRI
DICOM Convert
Slice Timing
Realignment
Coregistration
Normalization
Smoothing

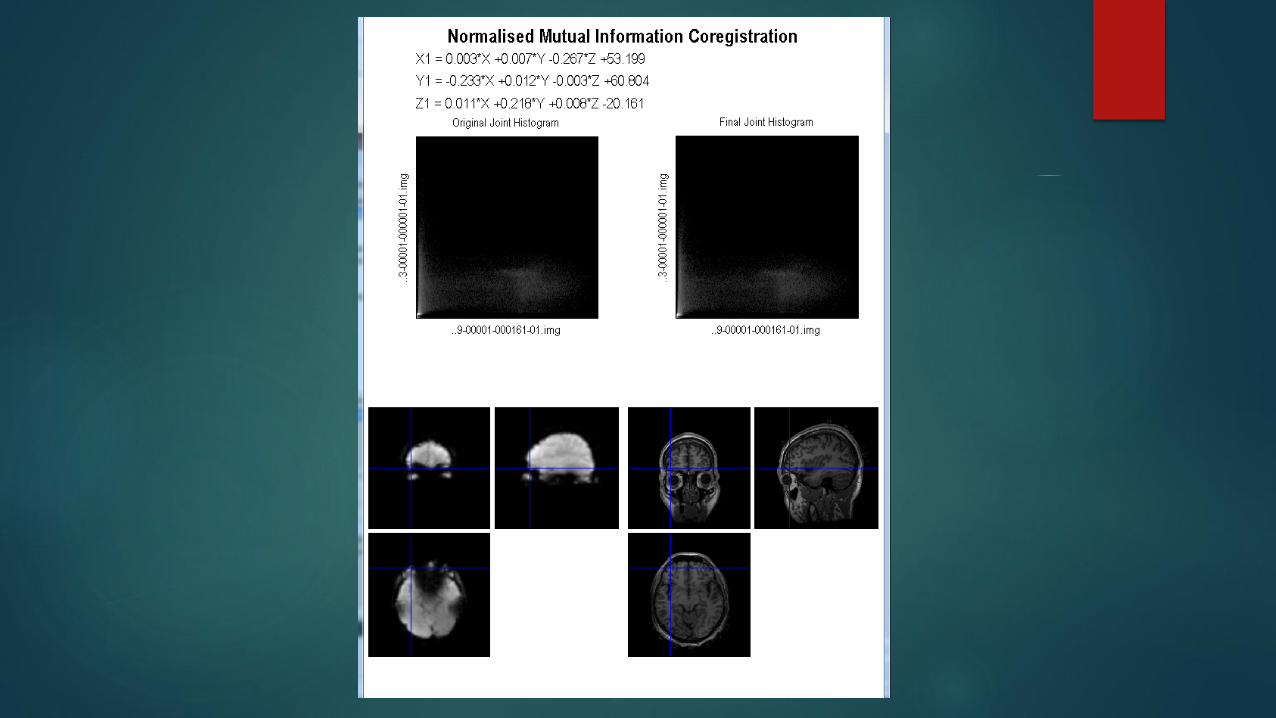
Coregistration Align fMRI (EPI) with structural images (T1).

Align T1 to EPI

Data Preprocessing for fMRI
DICOM Convert
Slice Timing
Realignment
Coregistration
Normalization
Smoothing

Normalization
Normalized EPI
Normalized T1Template (T1)
Template (EPI)
Transformation
parameter
Subject T1
Subject EPI

Normalization (T1 to template)
Coregistrated T1
T1.nii, 1

Normalization (EPI to template)
Transformation
parameter

Default
-78 -112 -50
78 76 85
-90 -126 -72
90 90 108

Data Preprocessing for fMRI
DICOM Convert
Slice Timing
Realignment
Coregistration
Normalization
Smoothing

Smoothing
Advantages:
- Increase the signal-to-noise ratio (SNR)
- Decrease the noise
- Improve the validity of statistical techniques
- Can help to reduce the mismatch across subjects
Disadvantages:
- Reduces the spatial resolution, more blurrier
- Peaks are squashed
Normalized Normalized + smoothed

Twice of voxel size

Check data
- Display: 1 image
- Check Reg: >1 & <15 images

Data Preprocessing for fMRI
DICOM Convert
Slice Timing
Realignment
Coregistration
Normalization
Smoothing

Batch

DICOM Convert
Slice Timing
Realignment
Coregistration
Normalization
Smoothing
Batch

Batch
dicom-to-img files
T1 images
Subject folder

Create your own batch

Batch for multi-subject
One subjectBatch file
Basic concept
Functional image (EPI )
Structure image (T1-weighted image )
Quality
Assurance
fMRI Data
Preprocessing
fMRI Data
Analysis
Results
Visualization
Software
Preparation
1st level analysis:
A within-subjects analysis where activation is averaged across scans
for an individual subject
2nd level analysis:
A between-subject analysis is referred to as a 2nd level analysis.
Key concept

Key concept General linear model (GLM)
𝑌
= 𝑌 × 𝑌 + 𝑌Dependent
Variable
(What you are
measuring)
Independent
Variable
(What you are
manipulating)
Relative Contribution
(These need to be estimated)Error
Matrix of BOLD signals
(preprocessed data)
Design matrix
(regressors,
This is what is
put into SPM)
Matrix parameters
(These need to be estimated)
Error matrixfMRI
analysis

Regressors:
- contributors in your experiment
Regressors of interest:
- experimental regressors which you manipulated
Regressors of non-interest:
- nuisance regressors which are not related to the experimental hypotheses
E.g. - The 6 movement regressors (rotations x3 & translations x3 ) or physiological factors
e.g. heart rate
Key concept

Design matrix Modeling Hemodynamics response
Hemodynamic response function (HRF)
Unit step function
convolve

Experimental Paradigm
Close Open Close Open Close Open
0 50 100 150 200 250 300 Second
0 25 50 75 100 125 150 TR (scan)
TR/TE = 2 s/ 35ms
Number of Slice = 32
Scan Time= 310 s (5 dummies + 150 scans)
FOV = 224 mm
Voxel size = 3.75 * 3.75 * 4 mm
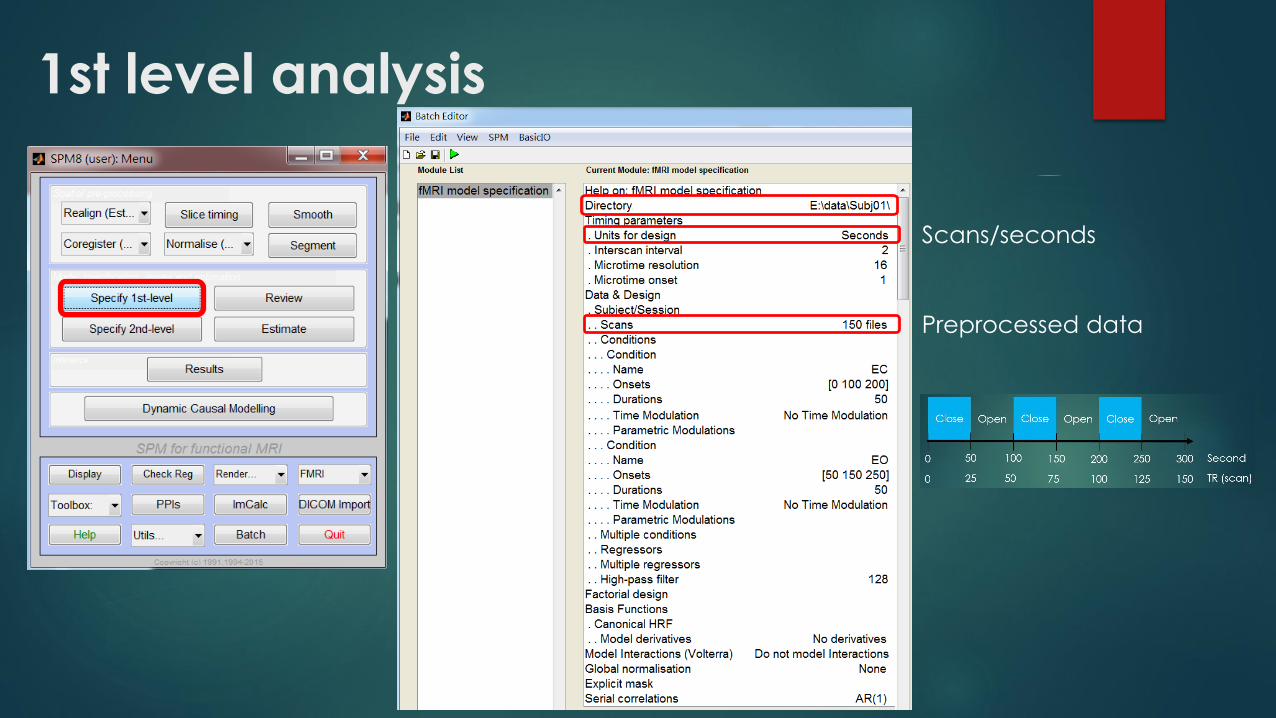
1st level analysis
Scans/seconds
Preprocessed data
0
50
100
150
200
250
300
(s)
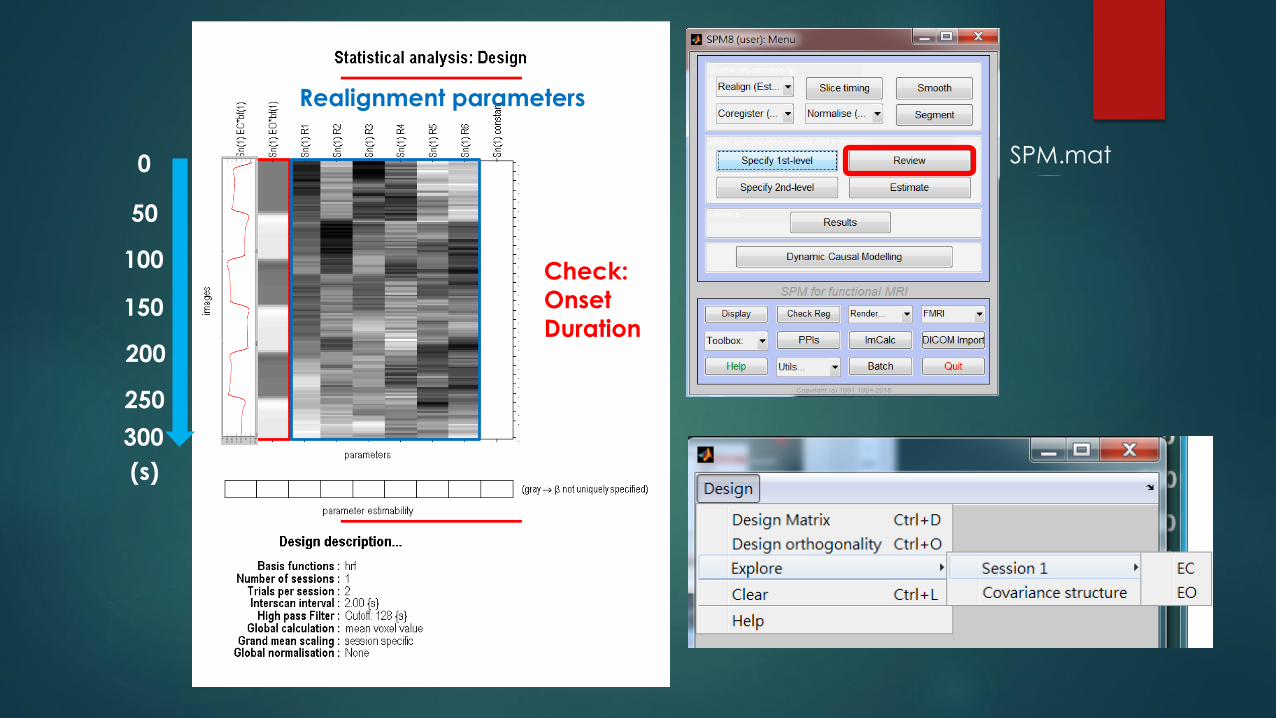
Check:
Onset
Duration
Realignment parameters
SPM.mat

Key concept General linear model (GLM)
𝑌
= 𝑌 × 𝑌 + 𝑌Dependent
Variable
(What you are
measuring)
Independent
Variable
(What you are
manipulating)
Relative Contribution
(These need to be estimated)Error
Matrix of BOLD signals
(preprocessed data)
Design matrix
(regressors,
This is what is
put into SPM)
Matrix parameters
(These need to be estimated)
Error matrixfMRI
analysis

SPM.mat


SPM.mat
One-side test Two-side test


Delete contrasts?
NO!!!
Redo estimate


Do all the contrasts!!

The map of T-values :
spmT_*.img
The contrast itself:
con_*.img
2nd level analysis
Contrasts =
combination of beta values

Basic concept
Functional image (EPI )
Structure image (T1-weighted image )
Quality
Assurance
fMRI Data
Preprocessing
fMRI Data
Analysis
Results
Visualization
Software
Preparation

Normalized or
Template images
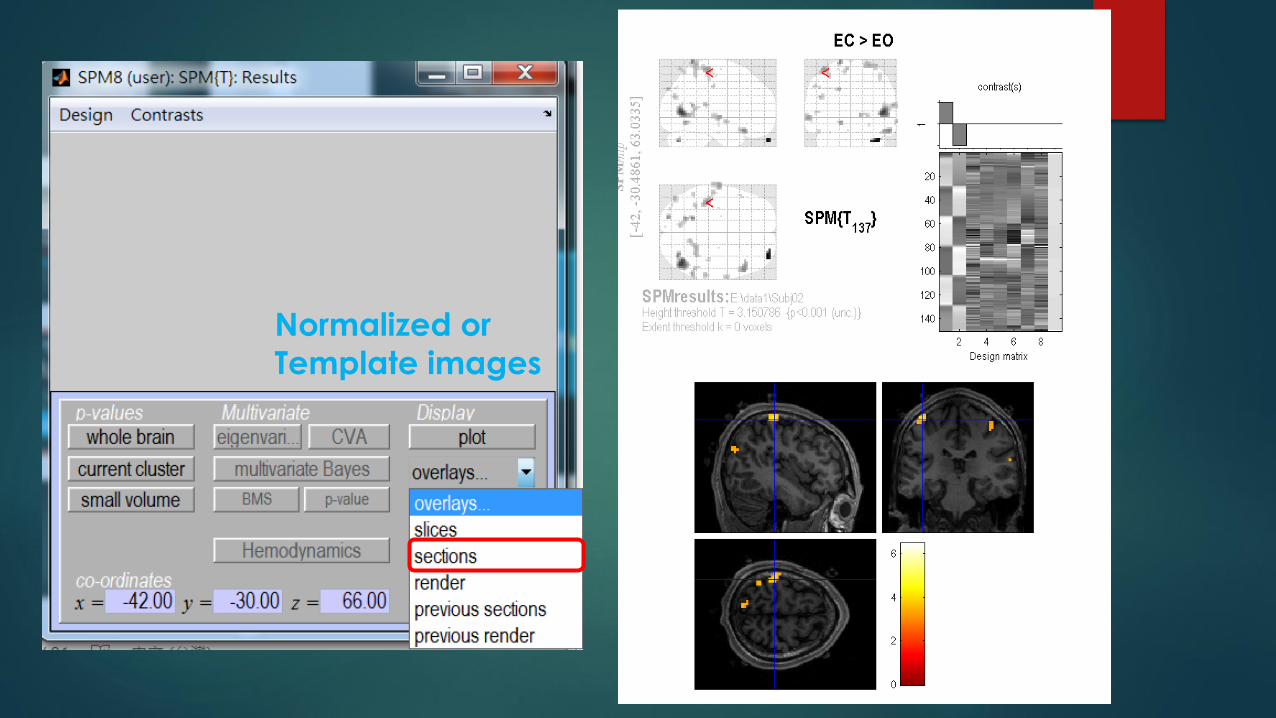
Normalized or
Template images

Spm8\rend\
Spm8\canonical\

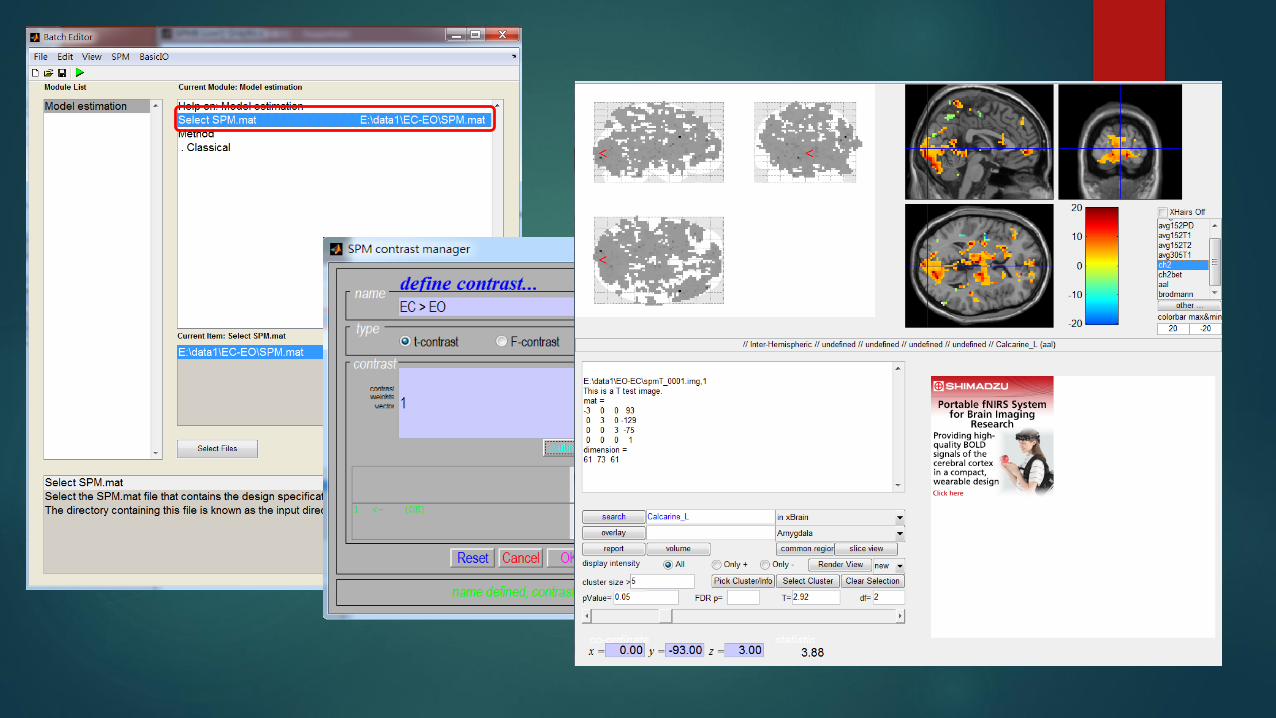
xjView


Marsbar
SPM.mat

Marsbar

Marsbar

Marsbar

Marsbar

Marsbar Reopen

Marsbar Reopen

Subj01
Subj02
Subj03
con
tras
t im
ages
Con_*.img
N=3
One-sample
t-test
p < 0.001 (uncorrected)
SPM{t}
1st-level (within-subject) 2nd-level (within-subject)
2nd level analysis


EO > EC
The question: is mean activation significantly greater
than zero?

Two-sample t-test

Paired t-test
One subject for one pair

Event-related analysis Preprocessing
TR/TE = 2 s/ 35ms
Number of Slice = 32
Scan Time= 600 s
(5 dummies + 295 scans)
FOV = 224 mm
Voxel size = 3.75 * 3.75 * 4 mm