fluorescence spectrophotometer jasco fp6500 · 1.1 wavelength accuracy • various wavelength light...
TRANSCRIPT
Fluorescence SpectrophotometerJasco FP6500
Validation and Correction
30th March, 2014
Ankit Raj1

1. Validation(by inbuilt software and given accessories)
Includes• Wavelength accuracy• Wavelength repeatability• Resolution• Stray light• Minimum detectable amount• Photometric stability
2

1.1 Wavelength accuracy• Various wavelength light is sent via diffusion
plate, and recorded as emission.
Diffusion Platewhite plate, no window 3
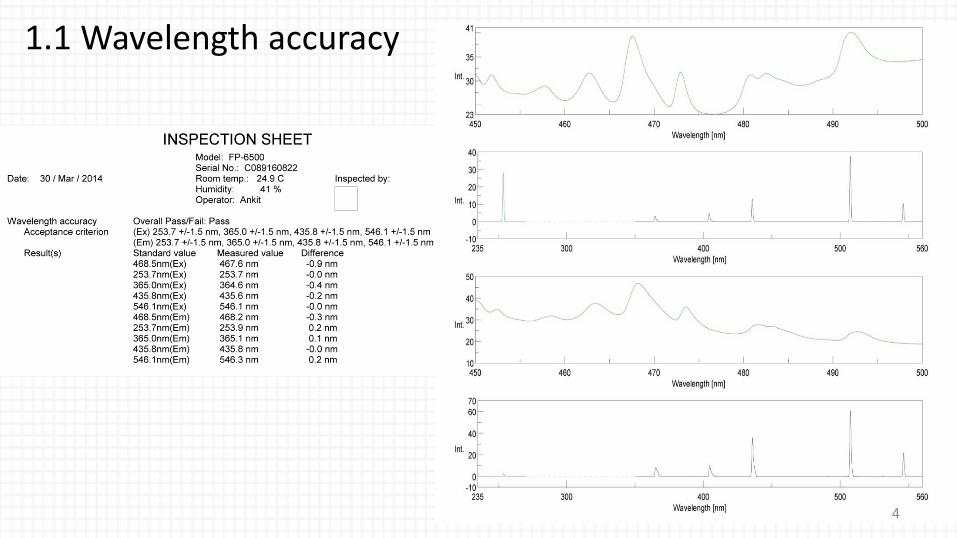
1.1 Wavelength accuracy
4

1.2 Wavelength repeatability• 546.1 nm light is sent via diffusion plate, and recorded as
emission. The repeatibility of the light at 546.1nm is tested.
Diffusion Platewhite plate, no window 5

1.2 Wavelength repeatability
6
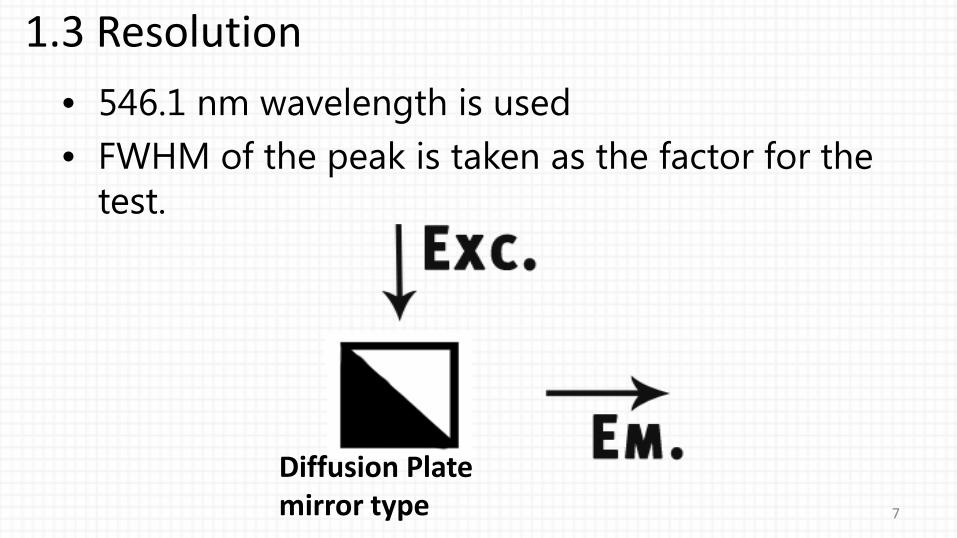
• 546.1 nm wavelength is used• FWHM of the peak is taken as the factor for the
test.
1.3 Resolution
Diffusion Platemirror type 7
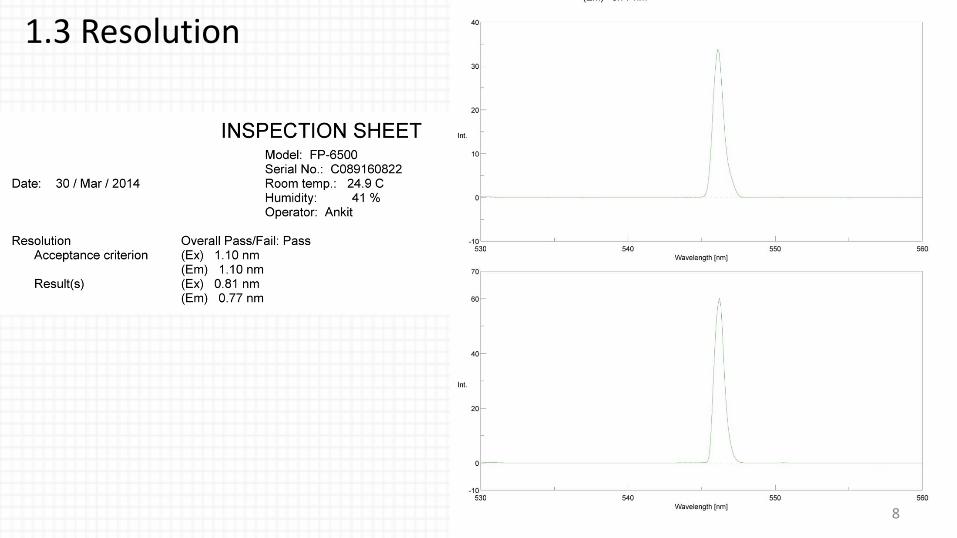
1.3 Resolution
8

1.4 Stray light• Triangular cell with Rhodamine B dye used.• In step 1 Rhodamine B is tested. [for emission]• In step 2, only Diffusion plate is kept, no sample.
Rhodamine B Solution
[for Excitation]
9

1.4 Stray light
10
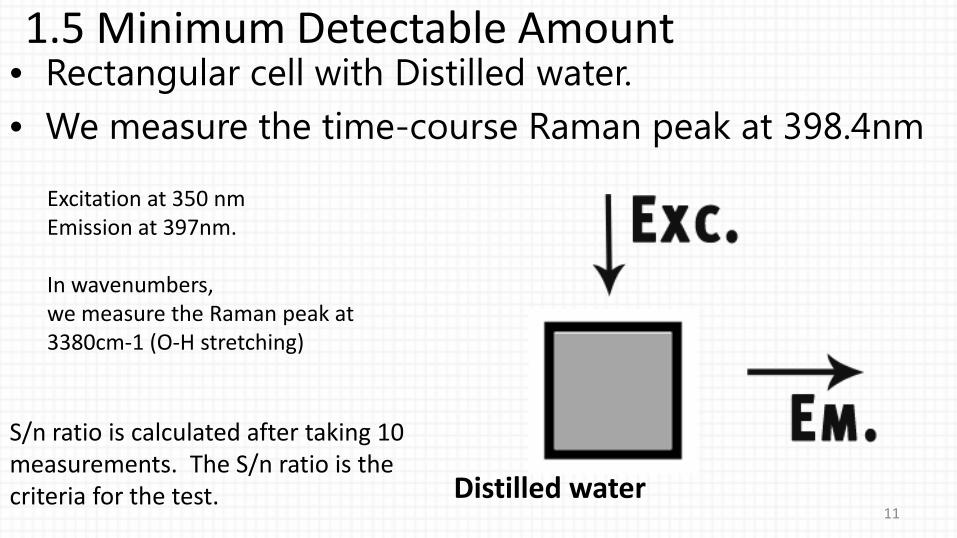
1.5 Minimum Detectable Amount• Rectangular cell with Distilled water.• We measure the time-course Raman peak at 398.4nm
Distilled water
S/n ratio is calculated after taking 10 measurements. The S/n ratio is the criteria for the test.
Excitation at 350 nmEmission at 397nm.
In wavenumbers,we measure the Raman peak at 3380cm-1 (O-H stretching)
11
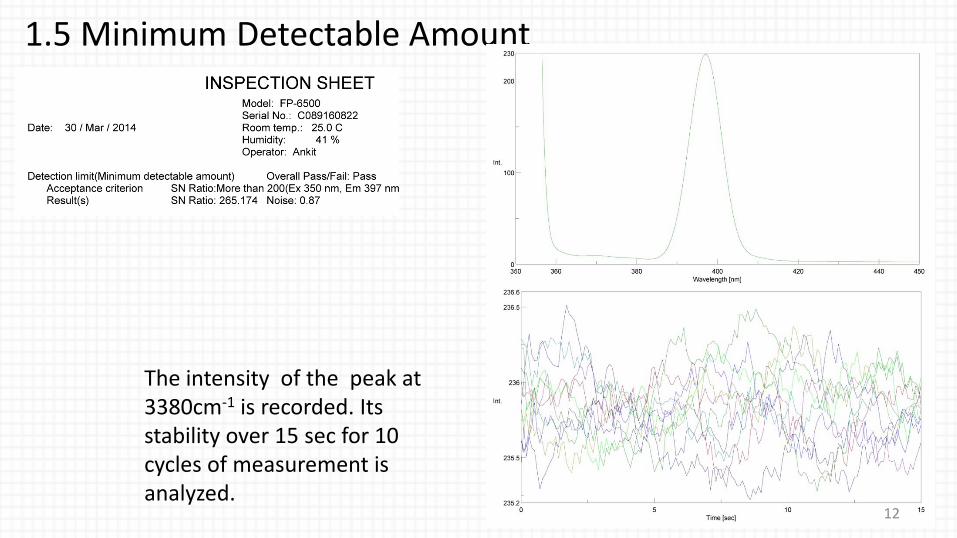
1.5 Minimum Detectable Amount
12
The intensity of the peak at 3380cm-1 is recorded. Its stability over 15 sec for 10 cycles of measurement is analyzed.

1.6 Photometric Stability• Rectangular cell with Distilled water.• We measure the time-course Raman peak at 398.4nm
Distilled water
Excitation at 350 nmEmission at 397.1 nm measured over 1 hour.
In wavenumbers,we measure the peak at 3380cm-1.
Variation in the signal intensity is recorded.
13
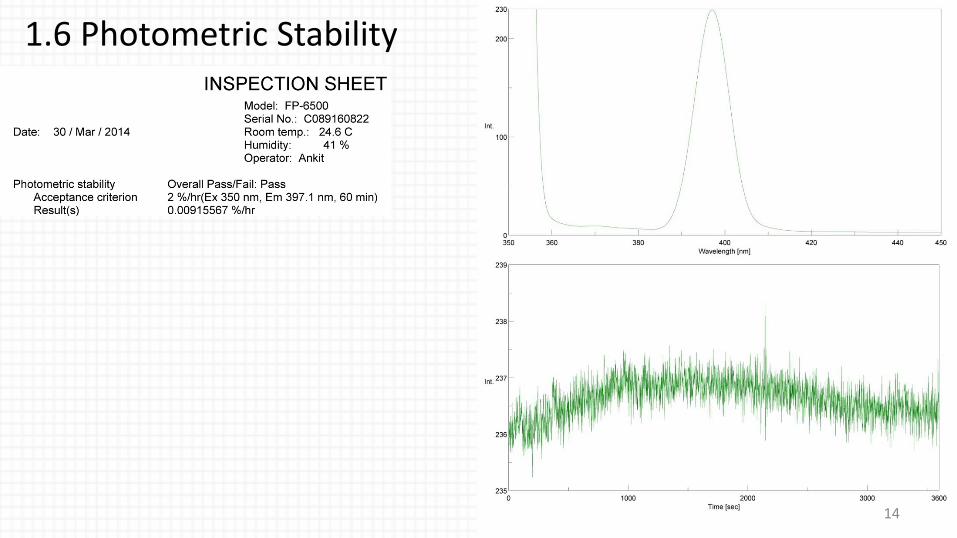
1.6 Photometric Stability
14
• We can correct the Excitation intensity, Emission intensity, over the range 200-600nm using Rhodamine B solution.For full spectral range correction we require Standard light source.
1. Correction(by inbuilt software and given accessories)
15
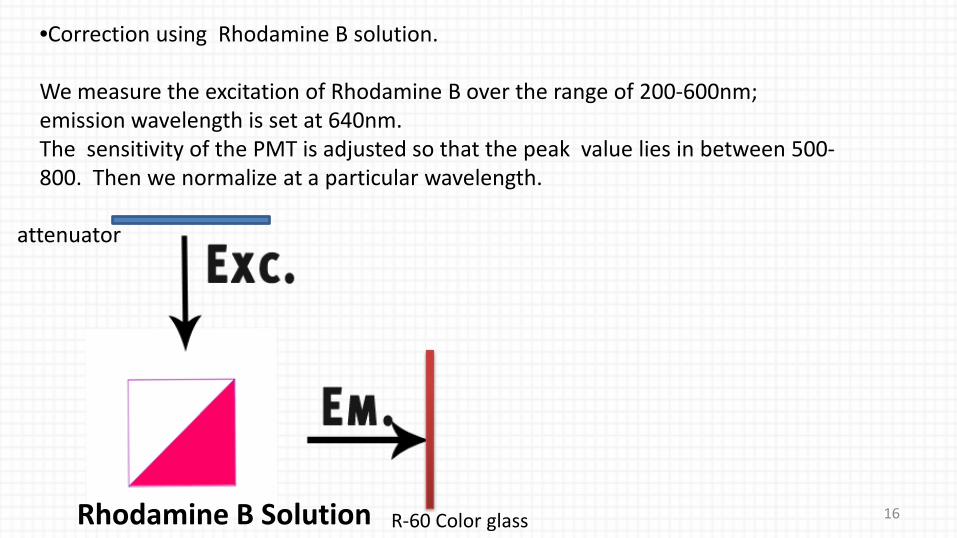
Rhodamine B Solution
attenuator
R-60 Color glass
•Correction using Rhodamine B solution.
We measure the excitation of Rhodamine B over the range of 200-600nm; emission wavelength is set at 640nm.The sensitivity of the PMT is adjusted so that the peak value lies in between 500-800. Then we normalize at a particular wavelength.
16

• For our case:
We normalized at 400nm for both Excitation and Emission. This was the first correction data produced. And then we applied the correction data to compare with previous results.
17
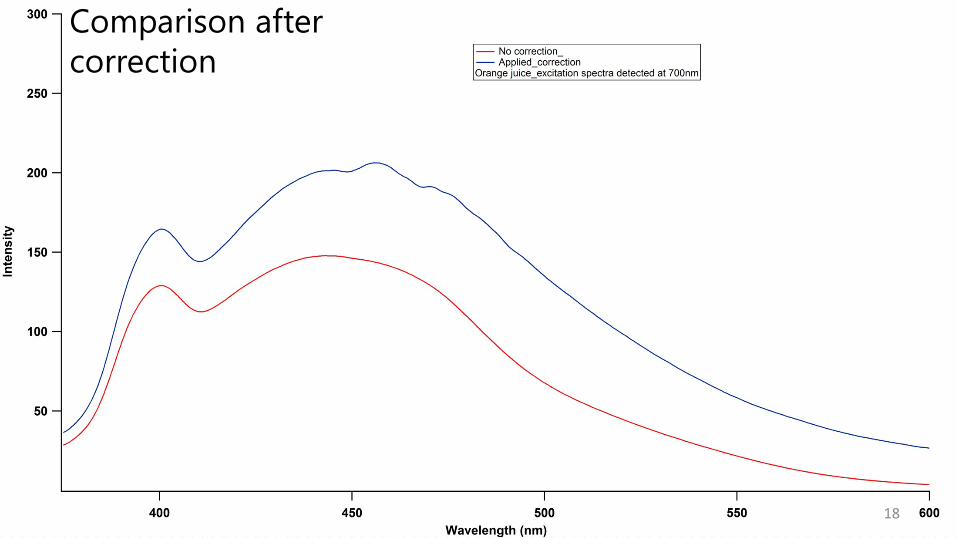
Comparison after correction
18

I acknowledge Sudhakar Bhaiya for his kind help and giving time on Sunday!
19