fluid-rhyolite interaction in geothermal systems ...°-júlíabjörke.pdf · 5.2 chemical...
TRANSCRIPT

Fluid-rhyolite interaction in geothermal systems, Torfajökull Iceland - secondary
surface mineralogy and fluid chemistry upon phase segregation and fluid mixing
Júlía Katrín Björke
Faculty of Earth Sciences University of Iceland
2010

Fluid-rhyolite interaction in geothermal systems, Torfajökull Iceland - secondary surface mineralogy and fluid chemistry upon phase segregation and fluid mixing
Júlía Katrín Björke
90 ECTS thesis submitted in partial fulfillment of a Magister Scientiarum degree in Geology
Advisors Andri Stefánsson, University of Iceland
Faculty of Earth Sciences School of Engineering and Natural Sciences
University of Iceland Reykjavik, May 2010
Fluid-rhyolite interaction in geothermal systems, Torfajökull Iceland - secondary surface mineralogy and fluid chemistry upon phase segregation and fluid mixing Fluid-rhyolite interaction in the Torfajökull geothermal system 90 ECTS thesis submitted in partial fulfillment of a Magister Scientiarum degree in Geology Copyright © 2010 Júlía K. Björke All rights reserved Faculty of Earth Sciences School of Engineering and Natural Sciences University of Iceland Askja, Sturlugötu 7 101, Reykjavik Iceland Telephone: 525 4000 Bibliographic information: Júlía K. Björke, 2010, Fluid-rhyolite interaction in geothermal systems, Torfajökull Iceland - secondary surface mineralogy and fluid chemistry upon phase segregation and fluid mixing, Master’s thesis, Faculty of Earth Sciences, University of Iceland, pp. 61. ISBN XX Printing: XX Reykjavik, Iceland, May 2010

Abstract The surface hydrothermal water chemistry and alteration mineralogy associated with rhyolitic rocks at Torfajökull Iceland was studied. The hydrothermal surface activity was characterized by acid sulphate and carbonate steam heated waters, steam vents and boiling NaCl springs. Distinguished alteration was observed associated with various types of waters. The pH and temperature of the waters ranged from 2.14 to 9.77 (at ~20°C) and 12 to 98°C, respectively, and total dissolved solids (TDS) were between 97 and 1895 ppm. The alteration mineralogy associated with acid sulphate waters was dominated by amorphous silica, quartz, kaolinite, pyrite, anatase, smectite and alunite, whereas around carbonate springs amorphous silica, ferrihydrite, amorphous iron silicates and quartz predominated. Around NaCl waters quartz, pyrite, goethite and anatase were most common. Based on the chemical composition of the waters and alteration product, secondary mineralogy, mineral saturation and reaction path modelling, elemental geochemistry and mobility was evaluated. Sodium, K, Mg and Ca were observed to be mobile and leached out during acid sulphate alteration whereas Fe, Ti and to a less extent Si, were retained in the alteration product forming SiO2, kaolinite, anatase and pyrite as well as some smectites and sulphates. For carbonate waters, Na and K were observed to be mobile whereas Fe and Si are retained in SiO2, ferrihydrites and iron rich silicates. Carbonates were not calculated or observed to form associated with carbonate springs. Magnesium, Ca and K were observed to be mobile at pH<6 whereas they are quantitatively retained into smectites and eventually also zeolites and carbonates with increasing pH. As a consequence, the mobility of Mg and K and to a less extent Ca and Na are greatly reduced in NaCl type waters under alkaline conditions. Based on the above, the key factors controlling the fluid-rhyolite interaction under surface hydrothermal conditions (~100°C) are acid supply, oxidation state and extent of reaction. The aquifer fluid composition was reconstructed based on the chemical composition of NaCl boiling hot springs and boiling models as well as thermodynamic mineral-fluid equilibria. Boiling and phase segregation of the aquifer fluids and mixing with oxygenated surface waters resulted in the various hydrothermal fluids observed at surface. Carbonate waters seem to be formed from <10% steam by weight, formed upon boiling and phase segregation at >200°C and mixed with non-thermal surface waters. On the other hand, acid sulphate waters are formed upon extensive boiling and steam condensation and mixing with non-thermal surface waters. NaCl waters are the residual boiled hydrothermal aquifer waters at surface.

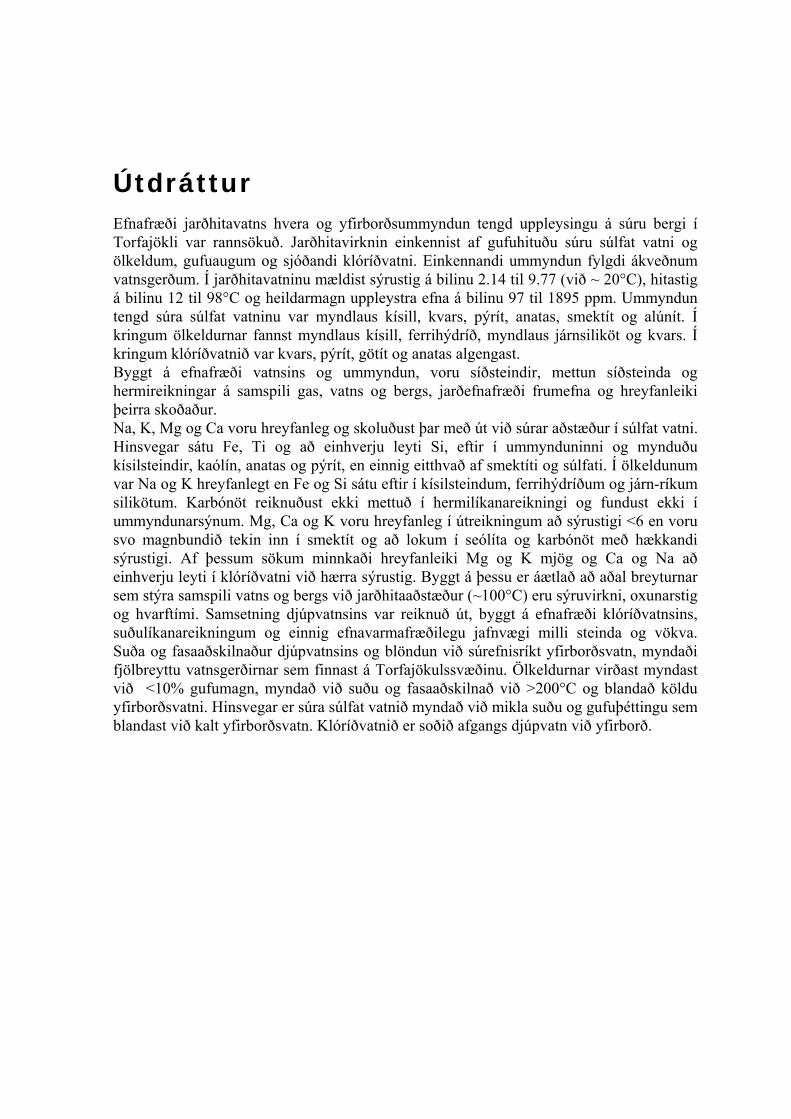
Útdráttur Efnafræði jarðhitavatns hvera og yfirborðsummyndun tengd uppleysingu á súru bergi í Torfajökli var rannsökuð. Jarðhitavirknin einkennist af gufuhituðu súru súlfat vatni og ölkeldum, gufuaugum og sjóðandi klóríðvatni. Einkennandi ummyndun fylgdi ákveðnum vatnsgerðum. Í jarðhitavatninu mældist sýrustig á bilinu 2.14 til 9.77 (við ~ 20°C), hitastig á bilinu 12 til 98°C og heildarmagn uppleystra efna á bilinu 97 til 1895 ppm. Ummyndun tengd súra súlfat vatninu var myndlaus kísill, kvars, pýrít, anatas, smektít og alúnít. Í kringum ölkeldurnar fannst myndlaus kísill, ferrihýdríð, myndlaus járnsiliköt og kvars. Í kringum klóríðvatnið var kvars, pýrít, götít og anatas algengast. Byggt á efnafræði vatnsins og ummyndun, voru síðsteindir, mettun síðsteinda og hermireikningar á samspili gas, vatns og bergs, jarðefnafræði frumefna og hreyfanleiki þeirra skoðaður. Na, K, Mg og Ca voru hreyfanleg og skoluðust þar með út við súrar aðstæður í súlfat vatni. Hinsvegar sátu Fe, Ti og að einhverju leyti Si, eftir í ummynduninni og mynduðu kísilsteindir, kaólín, anatas og pýrít, en einnig eitthvað af smektíti og súlfati. Í ölkeldunum var Na og K hreyfanlegt en Fe og Si sátu eftir í kísilsteindum, ferrihýdríðum og járn-ríkum silikötum. Karbónöt reiknuðust ekki mettuð í hermilíkanareikningi og fundust ekki í ummyndunarsýnum. Mg, Ca og K voru hreyfanleg í útreikningum að sýrustigi <6 en voru svo magnbundið tekin inn í smektít og að lokum í seólíta og karbónöt með hækkandi sýrustigi. Af þessum sökum minnkaði hreyfanleiki Mg og K mjög og Ca og Na að einhverju leyti í klóríðvatni við hærra sýrustig. Byggt á þessu er áætlað að aðal breyturnar sem stýra samspili vatns og bergs við jarðhitaaðstæður (~100°C) eru sýruvirkni, oxunarstig og hvarftími. Samsetning djúpvatnsins var reiknuð út, byggt á efnafræði klóríðvatnsins, suðulíkanareikningum og einnig efnavarmafræðilegu jafnvægi milli steinda og vökva. Suða og fasaaðskilnaður djúpvatnsins og blöndun við súrefnisríkt yfirborðsvatn, myndaði fjölbreyttu vatnsgerðirnar sem finnast á Torfajökulssvæðinu. Ölkeldurnar virðast myndast við <10% gufumagn, myndað við suðu og fasaaðskilnað við >200°C og blandað köldu yfirborðsvatni. Hinsvegar er súra súlfat vatnið myndað við mikla suðu og gufuþéttingu sem blandast við kalt yfirborðsvatn. Klóríðvatnið er soðið afgangs djúpvatn við yfirborð.

vii
Table of Contents
List of Figures ..................................................................................................................... ix
List of Tables ........................................................................................................................ x
Acknowledgements ........................................................................................................... xiii
1 Introduction ..................................................................................................................... 1
2 Torfajökull hydrothermal area ..................................................................................... 3
3 Methods............................................................................................................................ 7 3.1 Water sampling and analysis ................................................................................... 7 3.2 Alteration mineralogy and composition .................................................................. 7 3.3 Geochemical modelling ........................................................................................... 8
4 Hydrothermal surface water composition .................................................................... 9
5 Hydrothermal surface alteration and mineral chemistry ......................................... 17 5.1 Mineral occurrence ................................................................................................ 17 5.2 Chemical composition of the alteration product ................................................... 17
6 Hydrothermal alteration of rhyolites .......................................................................... 23 6.1 Mineralogical and chemical changes of the alteration product during
hydrothermal alteration ......................................................................................... 23 6.2 Water-rock interaction and secondary mineral saturation state ............................ 26
7 Fluid-rhyolite interaction, boiling and mixing ........................................................... 28 7.1 Calculation of aquifer fluid composition .............................................................. 29 7.2 Boiling, phase segregation and mixing ................................................................. 33 7.3 Fluid-rhyolite interaction, elemental mobility and secondary mineralogy ........... 36 7.4 Overall fluid-rhyolite interaction .......................................................................... 39
8 Summary and conclusions ........................................................................................... 41
References .......................................................................................................................... 43
Appendix A ......................................................................................................................... 49
Appendix B ......................................................................................................................... 55
Appendix C ......................................................................................................................... 56
Appendix D ......................................................................................................................... 57

viii

ix
List of Figures Figure 1. A simplified map of the main petrological formations in the Torfajökull
area ..................................................................................................................... 3
Figure 2. Distribution of surface hydrothermal activity at the Torfajökull area .................. 5
Figure 3. The relationship between pH and temperature in the water samples ................... 9
Figure 4. The relationship between SO4, CO2 and Cl concentrations and pH in surface hydrothermal waters at Torfajökull ..................................................... 10
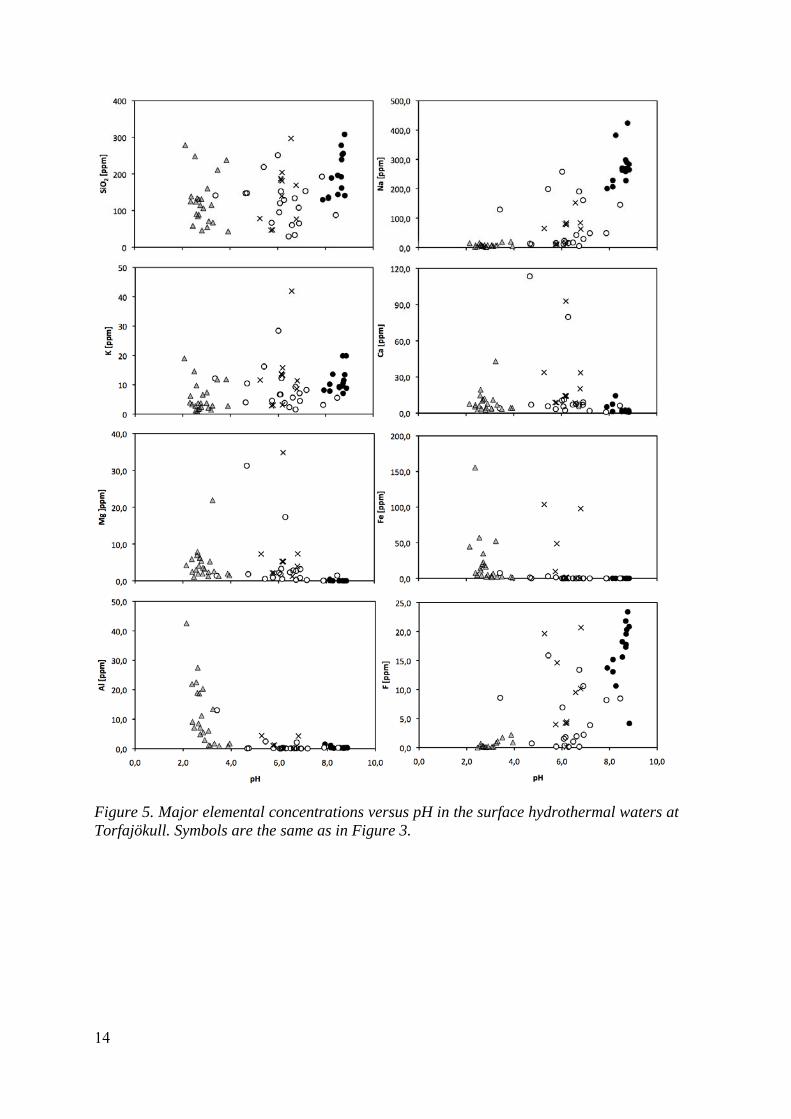
Figure 5. Major elemental concentrations versus pH in the surface hydrothermal waters at Torfajökull ........................................................................................ 14
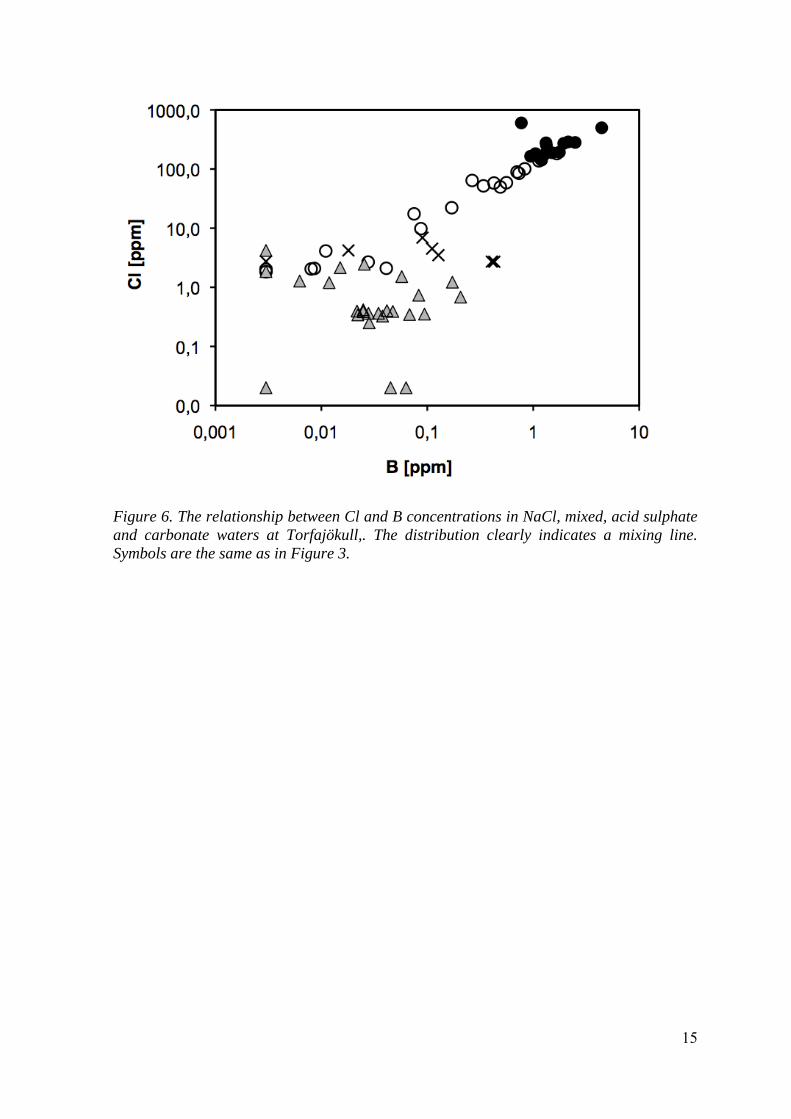
Figure 6. The relationship between Cl and B concentrations in NaCl, mixed, acid sulphate and carbonate waters at Torfajökull .................................................. 15
Figure 7. Scanning electron micrographs (SEM) of selected grains, representing the main alteration minerals found in the Torfajökull geothermal area ................ 20
Figure 8. The relationship between major elemental composition of the alteration product at Torfajökull area .............................................................................. 22
Figure 9. Ternary diagrams showing the major elemental distribution relative to unaltered rhyolites. ........................................................................................... 24
Figure 10. Saturation state of the major alteration phases associated with the hydrothermal water samples from Torfajökull geothermal field ..................... 27
Figure 11. Relationship between mixing of non-thermal surface waters and steam .......... 35
Figure 12. The relationship between Cl and SO4 in surface hydrothermal waters ............ 36
Figure 13. The relationship between major elemental concentrations and pH in surface hydrothermal waters at Torfajökull ..................................................... 37
Figure 14. Results of the reaction path model calculations. ............................................... 38

x
List of Tables Table 1. The initial water composition used in the reaction path calculations .................... 8
Table 2. Major and trace element concentrations of the rhyolite reference sample (AALK) used for the reaction path calculations. ................................................ 8
Table 3. Major element concentrations of the hydrothermal waters at Torfajökull area, Iceland ..................................................................................................... 12
Table 4. Alteration minerals identified associated with acid sulphate waters, alkaline waters and carbonate waters ........................................................................... 19
Table 5. Major and trace element concentrations of the hydrothermally altered rhyolite from Torfajökull geothermal area ...................................................... 21
Table 6. Calculated aquifer water composition .................................................................. 31
Table 7. Mineral-fluid equilibrium reactions considered to control major component concentrations at >230°C in dilute geothermal fluids as well as the respective equilibrium constants. ..................................................................... 32
Table 8. Concentration of CO2 and H2S in vapor, calculated with adiabatic boiling to 100°C ............................................................................................................ 34

xi


xiii
Acknowledgements First of all I want to thank my supervisor Andri Stefánsson for letting me work on this great project, his support during the study and for teaching me endless of new things related to geochemistry. Níels Óskarsson for his help in analyzing the composition of the alteration chemistry and with the interpretations of the processes involved. Þráinn Fridriksson for his help with analytical work and for reviewing the thesis and Sigurður Sveinn Jónsson at Iceland GeoSurvey for the XRD analyzes.
I would like to thank Sigurður H. Markússon for his help and great company during our struggles with similar problems in almost all aspects of our projects.
Helgi Arnar Alfredsson would need a whole thank you page on his own for everything he has helped me with, in the field and many, many computer problems as well as managing me at home.
I am very grateful to Alex Gysi and Hanna Kaasalainen for their help in the lab and in the field and to Erna Knútsdóttir, Heiðar V. Viggósson and Jón Örn Bjarnason for their assistance in the field.
As well I want to thank my fellow students and faculty for their company and help, especially Eydís Salome Eiríksdóttir and Ingvi Gunnarsson for their assistance in the lab and Nicole Hurtig for her help and fruitful discussions.
I thank The National Energy Authority for their financial support.
Finally, I thank my family and friends for their support and patience during my studies.


1
1 Introduction One of the main objectives of hydrothermal geochemistry is to quantify fluid origin and composition (Arnórsson et al., 2007). It has been concluded that local fluid-mineral equilibrium controls the major elemental composition at a particular temperature with the exception of mobile components like Cl (Giggenbach, 1981, Arnórsson et al., 1983, Giggenbach, 1980, Hedenquist et al., 1990, Gudmundsson and Arnórsson, 2005, Browne and Ellis, 1970). Boiling and phase segregation, cooling and mixing are, however, active processes in such systems modifying the water composition and alteration mineralogy on the way to and at the surface (Arnórsson, 1985, Hedenquist et al., 1990). These can lead to very variable surface activities including boiling and non-boiling hot springs, steam heated mud pots, carbonate springs and steam vents. Quantifying such processes is, however, complex and needs to include re-equilibration between the gases, water and alteration minerals, phase segregation and mixing, temperature changes, redox reactions and time.
Alteration mineralogy at depth has been studied in both fossil and active volcanic hydrothermal systems in Iceland (Kristmannsdóttir, 1976, 1979, Tómasson and Kristmannsdóttir, 1972, Ragnarsdóttir et al., 1984, Sveinbjörnsdóttir et al., 1986, Schiffman and Fridleifsson, 1991, Franzson, 1983, 1988, 1990, Lonker et al., 1993, Tómasson and Franzson, 1992, Exley, 1980, Mehegan et al., 1980, Viereck et al., 1980). The secondary minerals generally show temperature dependent distribution. At temperatures below ~200°C various smecties and zeolites predominate, replaced with chlorite, prehnite, epidote and actinolite with increasing temperature. Calcite and pyrite, however, are observed independent of temperature as well as silica with chalcedony and quartz predominating below and above ~200°C, respectively. Hydrothermal surface alteration has received much less attention.
Arnórsson (1969) and Sigvaldason (1959) studied hydrothermal alteration associated with acid surface leaching. Rhyolites have been observed to be altered to montmorillonite, hematite, anatase, kaolinite, amorphous silica, native sulphur and pyrite depending on the intensity of alteration. Silica, Na, K, Ca and Mg were leached out compared to Ti (Sigvaldason, 1959). Similar trends in elemental mobility are observed during weathering of rhyolite with depletion in Si, Na and K relative to Al and Ti (Yokoyama and Banfield, 2002) as well as in laboratory experiments that indicate Si, Na and K to be initially released followed by Ca, Mg and Fe from olivines, pyroxenes and amphiboles. Iron and Ti oxides are stable and not released during weathering (Craig and Laughnan, 1964, Colman, 1982, Eggelton et al., 1987, Nesbitt and Wilson, 1992, Stefánsson et al., 2001).
Extensive research has been carried out on the geology and geochemistry at Torfajökull, Iceland. It has mainly focused on the geology, petrology, mapping, geothermal subsurface manifestations, reconstruction of deep water fluid composition, mixing processes and subsurface temperatures. Still there is not a full understanding of the geochemical processes going on in the system. The general aim of the present contribution was to study the hydrothermal surface processes associated with rhyolitic rocks at Torfajökull. For this purpose, surface hydrothermal waters and secondary mineralogy were sampled and

2
analysed. In addition geochemical modelling calculations were carried out in order to quantify the various processes occurring in the surface zone.

3
2 Torfajökull hydrothermal area The Torfajökull central volcano is located on the central south of the active volcanic belts in Iceland (Fig. 1) (Björnsson and Einarsson, 1974, Jakobsson, 1979, Einarsson et al., 1981). The volcanic activity has produced different magma types of intermediate to silicic rich in composition as well as transitional to alkaline basalt. It shows components of both rifting characterized by linear volcanic features and tholeiitic volcanics as well as non-rifting characterized with a central volcano producing large quantities of evolved magmas (Ívarsson, 1992).
Figure 1. A simplified map of the main petrological formations in the Torfajökull area. In the corner a map of Iceland shows the active volcanic belts and volcanic hydrothermal areas (dots). The square represents the location of Torfajökull area in the southern highland. Based on Gunnarsson et al., 1998 and Saemundsson and Fridleifsson, 2001.
Three different tectonic trends can be distinguished in this area. A young tectonic NE-SW trend is observed and exhibited by most postglacial eruptive fissures within and outside
4
Torfajökull (McGarvie, 1984, Saemundsson, 1988). A less prominent and probably older NW-SE trend that is exposed in subglacial rhyolites and subglacial hyaloclastites and finally a ring structure around its marginal parts which is considered to be the result of one or more caldera collapse events (Fig.1) (Saemundsson and Fridleifsson, 2001).
The Torfajökull area is the location of the largest outcrop of silicic extrusives in Iceland (Walker, 1966) and contains the largest (aerially) geothermal field extending over an area of 140 km2 (Fig.2) (Bödvarsson, 1961, Pálmason et al., 1979, Arnórsson et al., 1987, Saemundsson, 1988). A negative gravity anomaly coincides with the silicic extrusives and includes a gravity high in its centre (Gunnarsson et al., 1998). This may be due to basaltic magma or intrusives that underlie the silicic sequence and are trapped due to higher density (Walker, 1974). These basaltic intrusives as well as silicic intrusives are considered to be the heat source for the geothermal area (Arnórsson, 1985).
Ívarsson (1992) combined morphological and petrochemical methods to divide the volcanic sequence at Torfajökull into four main volcanic series: Brandsgil, Jökulgil, Bláhnúkur and Postglacial volcanics. The Brandsgil series consists of peralkaline comendites and transitional or alkaline basalts. The beginning of the Weichsel glaciation defines the end of the Brandsgil Series period. Jökulgil series is the most prominent stratigraphical unit at Torfajökull and consists of highly peralkaline rhyolites. The eruptive units are of subglacial origin. Bláhnúkur series are characterized initially by basaltic activity following by peralkaline magma. Postglacial volcanics (< 10.000 years old) are the subaerial equivalents of the Bláhnúkur series.
Geothermal manifestations in the Torfajökull geothermal region mostly consist of steam vents, hot springs, mud pots and areas of argillic alteration (Fig 2.) (Arnórsson et al., 1987, Bjarnason and Ólafsson, 2000). The manifestations are predominantly located within the caldera ring structure with steam vents and mud pots dominating inside the caldera and boiling hot springs and carbonate springs on the caldera rim.
Studies on fluid composition at Torfajökull area have mainly focused on steam vents, spring water chemistry and mixing processes (Arnórsson, 1985, Arnórsson et al., 1987, Bjarnason and Ólafsson, 2000). The gas concentration in steam vents range from 20 to 25000 mmole/kg with (0.2-0.4 mol% of the steam) that is 70-90 %, CO2, 0-15% H2 and 0.5-8% H2S (Arnórsson et al., 1987, Bjarnason and Ólafsson, 2000). Based on gas geothermometry the subsurface temperatures at Torfajökull are up to ~300°C. The hot springs have Cl concentrations ranging from 300-600 ppm and pH values between 5 and 9. They show typical trends of boiled aquifer waters with elevated SiO2, Na and Cl concentration and often low Mg concentration. Some of these waters show mixing trends with local non-thermal surface waters (Arnórsson et al., 1987). Less data are, however, available on the composition of carbonate springs and acid sulphate waters.

5
Figure 2. Distribution of surface hydrothermal activity at the Torfajökull area. Circles, diamonds, squares and triangles represent the sampling locations and water types. Reproduced from Fridleifsson and Saemundsson, 2001.

7
3 Methods
3.1 Water sampling and analysis
Samples of surface geothermal waters were collected during summers 2006 to 2009. The water types sampled included hot boiling springs, mud pots and warm springs. Altogether, 68 samples were collected and analyzed. Sample locations are shown in Figure 2. Samples for determination of major and trace elements were filtered on-site through a 0.2 µm cellulose acetate membrane with a Teflon filter holder into poly propylene (PP) bottles of various sizes and amber glass bottles. Samples for determination of major cations and trace metals were acidified using Suprapur® HNO3, 0.5 ml to 100 ml sample. Samples for determination of major anions were not treated. Samples for determination of dissolved CO2 and pH were cooled in-line and collected into two amber glass bottles.
The pH was determined within two days of sampling using a Metrohm combination electrode. Dissolved CO2 was analyzed by two methods, either by modified alkalinity titration (Arnórsson et al., 2006) or by ion chromatography (Dionex-2000) (Stefánsson et al., 2007). Hydrogen sulphide was determined according to the methylen blue method (APHA, 1985) or titrated using mercury and dithizone as an indicator (Arnórsson et al., 2006). Fluoride, Cl and SO4 were determined in untreated filtered samples using same ion chromatography system. Major cations including Na, K, Li, Mg, Ca Al, Fe, Si and Sr were determined by Ion Chromatography (Dionex-1000) and ICP-AES (Spectro CIROS). Selected trace metals were analyzed using Thermo Fisher ELEMENT 2 HR-ICP-MS. These samples were also diluted prior to analysis and spiked with In for matrix, dilution and instrumental drift corrections.
3.2 Alteration mineralogy and composition
Samples of the alteration products were collected from three locations within the Torfajökull area, Hrafntinnusker, Landmannalaugar, and Jökulgil (Fig.2). Samples were both collected from the surface and by digging profiles (as deep as 1 m) into the altered ground.
The mineralogy of the bulk rock was determined by XRD using a Bruker AXS D8 Focus instrument equipped with a Bragg-Brentano goniometer and a Cu anode lamp with a NaI crystal type scintillation counter. Bulk samples were dried at ambient temperature, powdered in an agate mortar prior to analysis (representative XRD patterns are presented in Appendix D).
Alteration samples were further examined using SEM using LEO Supra 25 equipped with an Energy Dispersive X-ray Spectrometer (EDS) to determine mineral textures and

8
paragenesis. The samples were sputter coated with an Au alloy prior to analysis. Chemical analyses of bulk alteration samples were further carried out. The samples were fused with LiBO2 flux in a graphite crucible at 1000°C for 30 minutes. The glassy material was dissolved in mixture of acids (5% nitric acid, 1.33% hydrochloric acid and 1.33% oxalic acid) followed by ICP-OES analyses. The sulphur content of the bulk samples were determined by oxidizing all sulphur in the sample to sulphate in concentrated nitric acid. The acid was boiled off and the sampled dissolved in de-ionized water.
3.3 Geochemical modelling
Four types of geochemical model calculations were carried out. Firstly, aqueous speciation and mineral saturation state calculations, secondly, reconstruction of hydrothermal aquifer waters from data on boiling hot springs, thirdly, closed and open system boiling calculations and mixing and fourthly reaction path modelling. The calculations were carried out with the aid of the PHREEQC program and WATEQ database (Parkhurst and Appelo, 1999) and the WATCH program (Bjarnason, 1994) as appropriated. For these calculations, the thermodynamic dataset was updated to include the solubility and hydrolysis of aqueous Ti and anatase solubility (Knauss et al., 2001, Smith et al., 2009).
Reaction path modelling was carried out to simulate the interactions of rhyolite with rain water containing initially elevated CO2 and SO4 under reduced and oxidized conditions. The calculations were carried out at 100°C. The composition of the initial water for the simulation and the rhyolitic glass is given in Tables 1 and 2, respectively. The minerals selected where those observed by XRD and SEM in the alteration samples from the Torfajökull area (Table 4) and common secondary minerals known to form around acid sulphate springs (e.g. Sigvaldason, 1959, Klammer, 1997, Boyce et al., 2007, Karakaya et al., 2007).
Table 1. The initial water composition used in the reaction path calculations. Units are in ppm.
t / °C pH CO2 SiO2 Na K Mg Ca Fe Al Cl B F SO4 S2O3 H2S
09-ÁKS-28 2 7.5 44 19.82 18.65 2.17 1.723 4.15 0.056 0.059 3.015 0.02 0.347 8.34 <0.1 n.a.
Table 2. Major and trace elemental concentrations of the rhyolite reference sample (AALK) used for the reaction path calculations.
wt %
SiO2 Al2O3 FeO MnO MgO CaO Na2O K2O TiO2 P2O5
74.030 12.363 3.170 0.068 0.121 0.506 5.060 4.230 0.241 0.062
ppmBa Co Cr Cu Ni Sc Sr V Y Zn S Zr
0.0172 9E-05 0.0007 0.0005 0.0007 0.0001 0.0046 0.002 0.0125 0.0161 0.0001 0.105
9
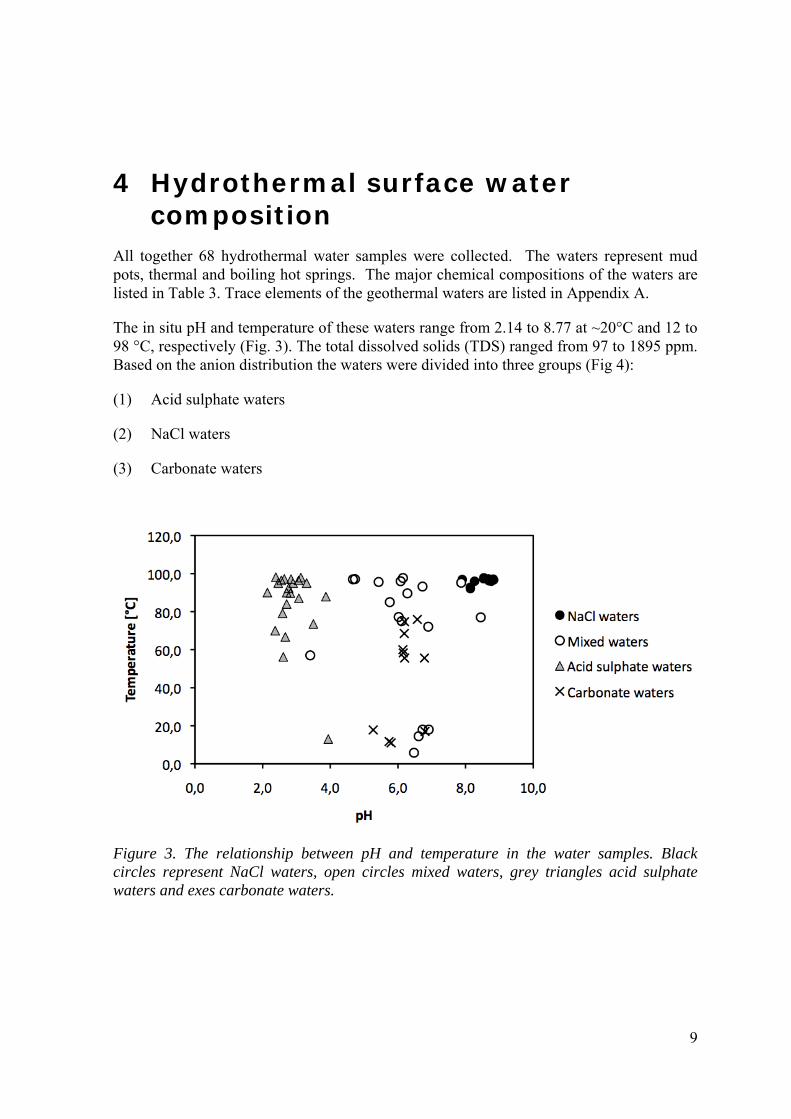
4 Hydrothermal surface water composition
All together 68 hydrothermal water samples were collected. The waters represent mud pots, thermal and boiling hot springs. The major chemical compositions of the waters are listed in Table 3. Trace elements of the geothermal waters are listed in Appendix A.
The in situ pH and temperature of these waters range from 2.14 to 8.77 at ~20°C and 12 to 98 °C, respectively (Fig. 3). The total dissolved solids (TDS) ranged from 97 to 1895 ppm. Based on the anion distribution the waters were divided into three groups (Fig 4):
(1) Acid sulphate waters
(2) NaCl waters
(3) Carbonate waters
Figure 3. The relationship between pH and temperature in the water samples. Black circles represent NaCl waters, open circles mixed waters, grey triangles acid sulphate waters and exes carbonate waters.

10
Figure 4. The relationship between SO4, CO2 and Cl concentrations and pH in surface hydrothermal waters at Torfajökull. Symbols are the same as in Figure 3.
Acid sulphate waters are formed upon steam heating of oxygenated shallow ground- and surface waters. Upon mixing, H2S oxidizes to sulphuric acid decreasing the pH value of the waters to <4. Moreover, the waters are characterized by low Cl concentration and

11
elevated metal concentrations (Figs. 4 and 5). In particular, the concentration of dissolved Al and Fe are enriched with decreasing pH. The acid sulphate waters are common in the area. Some springs are clear whereas other have large quantity of muds, hence they are commonly called mud pots.
Carbonate waters have pH ranging from mildly acidic to neutral (4.5-7) and the dominant anion is bicarbonate. In the carbonate spring Mg, Ca and K concentrations are order of magnitude higher compared to NaCl and acid sulphate waters (Fig. 5). The temperatures of the carbonate springs were variable ranging from ~20°C to boiling. They are considered to be formed upon steam heating rich in CO2 with shallow ground and surface waters. The origin of the CO2 is somewhat, however, unclear. The carbonate springs are mostly found close to the rim of the caldera to the south and in Jökulgil.
NaCl waters have a pH ranging from near neutral to slightly alkaline. Chloride is the dominant anion, typically with concentrations between ~50 and ~600 ppm and Na and Si the dominant cations. The concentrations of many metals are low including Mg, Fe and Al. The discharge temperatures of the springs are often close to boiling and it is considered that the fluids are caused by depressurization boiling of aquifer waters mixed to various degrees with shallow ground- and surface waters. The NaCl waters are most common in the area around Landmannalaugar and in Vondugil close to the rim of the caldera.
Even if the springs can be sorted into various water types there are samples that can not be easily fitted into these categories. Springs which have diluted concentrations of Cl and Na and/or have elevated concentrations of sulphate and/or carbonate, are mixed springs. These waters are a result of NaCl waters ascending through and mixing with cold groundwater or steam heated surface waters. The mixing trend can be seen from the relationship between B and Cl in the waters (Fig. 6). According to Sigurdsson and Einarsson (1986), local precipitation in the Torfajökull area contains ~5 ppm Cl. Chloride and B are mobile in hydrothermal waters in Iceland (Arnórsson and Andrésdóttir, 1995) and the sources are both rock leaching and input from the source fluid (magma degassing and meteoric water). The springs that have the highest Cl/B ratio are the springs from Landmannalaugar which have reacted the most with the host rock. Lower Cl/B ratios indicate larger meteoric water or condensed steam component until end member steam heated concentrations are reached i.e. the precipitation concentrations. Due to the various mixing proportions of the geothermal waters from Torfajökull the Cl/B data points reveal a mixing line.

12
Table 3. Major elemental concentrations of the hydrothermal waters in the Torfajökull area, Iceland. Units are in ppm.
Sample Location t / °C pH / °C CO2 SiO2 B Na06-3810 Litli-Sullur 97.3 9.47 / 22 83.10 196.58 1.50 270.1506-3811 Vondugil 93.2 7.17 / 21 103.80 135.32 1.13 190.6406-3812 Vondugil 57.0 3.33 / 21 8.32 142.93 0.73 129.1606-3813 Vondugil 92.1 8.93 / 21 145.30 137.85 1.17 228.7006-3814 Vondugil 72.1 7.03 / 21 139.50 110.06 0.83 161.1106-3815 By Laugavegur 97.2 2.50 / 21 0.93 135.33 0.01 7.5706-3816 By Laugavegur 95.0 2.33 / 21 18.60 61.88 0.01 3.5606-3817 By Laugavegur 95.0 2.75 / 21 0.96 108.87 0.02 8.0706-3818 By Laugavegur 89.7 2.64 / 21 4.87 132.98 0.05 2.8406-3819 Vondugil 97.2 9.70 / 21 21.80 276.99 2.49 298.1106-3820 Vondugil 96.4 2.35 / 21 0.80 247.65 0.21 15.2006-3821 Vondugil 95.6 5.22 / 22 0.54 218.84 1.67 199.1506-3822 Hrafntinnusker 95.2 8.83 / 22 42.90 193.17 0.03 49.0006-3823 Hrafntinnusker na 7.18 / 22 87.80 154.52 0.01 48.7106-3824 Hrafntinnusker 87.9 3.74 / 22 12.80 237.50 0.03 20.2506-3825 Hrafntinnusker 87.0 2.97 / 22 35.20 161.36 n.a. 8.7206-3826 Hrafntinnusker 92.4 2.61 / 22 2.27 116.83 0.06 8.4506-3827 Hrafntinnusker 96.0 6.12 / 22 35.50 97.83 0.01 11.4906-3828 Reykjadalur 68.5 6.29 / 22 530.50 141.23 n.a. 13.7306-3829 Reykjadalur 89.6 6.38 / 22 19.70 130.86 0.01 15.1806-3830 Landmannalaugar 74.7 6.28 / 22 300.90 204.27 0.56 83.5806-3832 Hrafntinnusker na 3.24 / 22 n.a. 117.45 0.17 7.1401-229 Landmannalaugar 77.2 6.08 / 26 333.65 250.44 1.32 258.0601-230 Landmannalaugar 14.5 6.55 / 26 28.30 63.64 0.27 42.7801-231 Landmannalaugar 5.8 6.35 / 26 13.95 33.32 0.08 16.9501-232 Landmannalaugar 58.3 6.23 / 26 261.05 184.29 0.49 79.8601-233 Landmannalaugar 60.0 6.22 / 26 279.65 188.06 0.43 80.5501-234 Landmannalaugar 55.6 6.27 / 26 262.35 181.69 0.34 77.9501-235 Skriduhver 96.2 9.57 / 26 67.00 162.72 1.26 227.8001-236 Bóluhver 96.7 9.60 / 26 156.25 142.52 1.05 264.9401-237 Litli-Sullur 96.9 9.58 / 26 65.75 238.69 1.33 267.6001-238 Svartaauga 96.9 8.68 / 26 104.65 131.36 0.94 200.7701-239 Svuntuhver 97.1 9.77 / 26 15.78 306.45 1.94 283.3401-240 Eyrarauga 96.5 9.63 / 26 35.40 252.35 2.14 290.9101-241 Eyrarhver 96.0 9.63 / 26 51.75 255.18 4.43 423.9201-242 Gjótuhver 96.0 9.08 / 26 9.53 189.56 0.77 382.2201-243 Raudanefskelda 11.7 5.66 / 26 44.93 49.61 0.02 11.2801-244 Grænalaug 55.6 6.86 / 26 250.25 170.24 0.11 84.0801-245 Stefánsauga 75.9 6.65 / 26 443.75 295.46 0.09 152.4501-246 Landmannalaugar 18.0 6.87 / 26 61.50 68.10 0.17 29.1507-JB-01 Hrafntinnusker 79.1 2.59 / 22 12.26 125.67 0.07 9.0907-JB-02 Hrafntinnusker 73.5 3.50 / 22 5.53 211.26 0.02 19.0107-JB-03 Hrafntinnusker 66.7 2.67 / 21 12.92 86.75 0.04 5.7907-JB-04 Hrafntinnusker 56.2 2.61 / 21 13.24 93.16 0.08 9.7707-JB-05 Hrafntinnusker 96.4 3.06 / 22 16.62 57.71 0.03 4.8407-JB-06 Hrafntinnusker 95.0 3.30 / 21 11.71 70.34 0.03 7.7607-JB-07 Hrafntinnusker 97.1 4.73 / 22 22.65 149.11 0.02 10.8907-JB-08 Hrafntinnusker 98.1 2.39 / 21 6.53 140.44 0.02 7.6007-JB-09 Hrafntinnusker 97.7 6.15 / 21 41.15 153.84 0.03 16.9607-JB-10 Hrafntinnusker 13.0 3.94 / 21 7.68 46.96 0.02 4.6207-JB-11 Hrafntinnusker 97.9 3.13 / 21 5.16 74.02 0.04 5.1107-JB-12 Hrafntinnusker 84.0 2.71 / 21 9.13 91.22 0.09 4.5307-JB-13 Laugavegur 97.0 4.67 / 22 2.67 148.66 0.09 13.0607-JB-14 Laugavegur 97.1 2.84 / 21 n.a. 49.44 n.a. 1.7307-JB-15 Laugavegur 70.0 2.37 / 22 n.a. 126.94 0.06 2.4207-JB-16 Laugavegur 85.0 5.76 / 22 5.30 69.80 n.a. 14.9207-JB-17 Laugavegur 18.0 6.73 / 22 32.46 37.08 n.a. 5.2007-JB-18 Laugavegur 75.0 6.11 / 22 18.37 122.19 0.04 22.9007-JB-19 Laugavegur 90.0 2.71 / 22 n.a. 132.50 n.a. 4.0907-JB-20 Vondugil 92.8 8.69 / 20 113.63 135.63 1.20 206.6307-JB-21 Vondugil/Sullur 96.9 9.70 / 20 159.12 192.56 1.77 258.7307-JB-22 Vondugil 97.8 9.47 / 20 226.90 145.38 1.22 263.3007-JB-23 Vondugil 77.0 8.97 / 20 192.36 90.36 0.70 145.5707-JB-24 Vondugil 90.0 2.14 / 20 n.a. 277.49 0.05 14.8409-JB-25 Ölstallur 17.8 5.27 / 17 1249.85 81.14 0.43 64.8409-JB-26 Rauðanefskelda 11.7 5.60 / 12 110.77 50.78 0.13 11.3509-JB-27 Ölstallur 17.0 5.40 / 17 1101.23 79.32 0.41 62.82

13
Sample K Ca Mg Fe Al Cl F SO4 H2S06-3810 9.33 1.34 0.00 0.06 0.34 188.87 18.25 53.82 17.7606-3811 9.29 5.68 0.30 0.28 2.10 137.66 13.40 87.19 16.0706-3812 12.17 4.11 1.38 7.52 13.03 84.67 8.57 248.61 0.1206-3813 7.87 1.32 0.09 0.02 0.38 147.87 15.18 56.36 10.8806-3814 7.13 6.80 0.80 0.02 0.03 100.64 10.59 66.33 7.6306-3815 9.78 3.76 1.93 4.38 8.49 1.20 0.15 232.46 6.0006-3816 3.29 1.94 1.05 4.84 7.13 1.27 0.02 311.31 0.1006-3817 6.59 7.71 3.23 5.10 2.92 2.15 0.19 178.33 0.0206-3818 3.76 2.71 1.93 16.38 20.31 0.39 0.09 312.42 <0.0106-3819 19.86 2.32 0.01 0.01 0.10 281.27 21.82 49.03 21.4006-3820 14.62 5.99 3.03 57.10 22.54 0.68 0.36 489.42 0.0106-3821 16.26 5.75 0.55 2.88 2.45 182.61 15.89 165.22 0.0106-3822 3.14 0.88 0.06 0.01 0.36 2.67 8.18 10.30 2.6506-3823 8.24 1.90 0.22 0.00 0.03 4.11 3.86 11.05 2.6506-3824 11.85 4.44 1.94 2.03 0.93 2.45 2.20 69.76 1.4106-3825 7.40 3.94 2.32 1.49 1.22 1.84 0.16 103.14 3.1306-3826 1.92 12.17 5.44 18.61 11.18 1.52 0.13 280.37 1.9106-3827 6.68 5.54 1.76 0.00 0.02 2.04 1.53 10.39 2.2706-3828 3.11 92.86 34.83 1.63 0.04 2.74 0.11 54.01 0.1406-3829 3.82 79.73 17.32 0.02 0.07 2.08 0.14 209.92 0.0606-3830 15.80 14.51 5.20 1.58 0.04 58.70 4.44 50.82 <0.0106-3832 1.48 43.12 21.91 52.38 13.38 1.22 0.81 428.90 na01-229 28.44 10.48 2.20 0.02 0.01 277.00 6.91 59.37 0.0101-230 5.66 7.66 2.83 0.00 0.07 64.04 1.94 30.21 <0.0101-231 2.36 7.01 2.32 0.00 0.07 17.45 1.02 29.49 <0.0101-232 13.52 14.09 5.19 0.80 0.01 49.65 4.25 2.43 <0.0101-233 13.78 14.34 5.25 0.78 0.00 58.00 4.25 2.28 0.0101-234 13.30 13.97 5.27 0.78 0.01 51.90 4.14 2.25 <0.0101-235 7.10 1.47 0.02 0.16 0.36 172.95 17.76 55.68 18.0701-236 8.86 0.83 0.01 0.11 0.26 181.95 4.14 46.37 13.9101-237 10.59 1.85 0.01 0.05 0.24 254.35 19.58 33.63 16.6801-238 8.17 5.21 0.13 0.14 1.51 164.75 13.72 78.37 14.3701-239 19.86 2.21 0.02 0.12 0.43 271.50 20.84 39.62 19.8601-240 11.54 1.65 0.00 0.06 0.18 287.65 20.32 33.74 22.0801-241 13.45 1.03 0.00 0.05 0.31 498.30 23.39 24.82 17.5401-242 13.61 14.44 0.01 0.06 0.14 602.60 10.62 16.26 5.5901-243 2.91 8.83 2.16 9.63 1.12 4.20 3.98 119.43 <0.0101-244 8.59 20.17 3.96 0.26 0.03 4.50 10.17 4.56 0.0301-245 41.92 8.52 1.20 0.12 0.02 6.90 9.50 5.47 15.3001-246 4.50 9.00 3.18 0.02 0.01 22.15 2.20 16.14 <0.0107-JB-01 2.84 14.67 6.95 14.26 18.89 0.35 0.67 359.13 0.3807-JB-02 11.81 3.51 1.26 2.58 0.92 0.34 1.73 81.62 0.4807-JB-03 1.04 10.12 4.10 20.02 18.73 0.40 0.30 309.27 11.8907-JB-04 1.28 19.42 7.88 11.02 27.46 0.73 n.a. 407.16 0.0607-JB-05 3.76 3.67 1.23 3.58 6.04 0.36 0.14 95.82 35.9007-JB-06 2.92 6.81 2.58 2.13 1.72 0.25 1.10 82.12 0.8207-JB-07 10.47 6.98 1.82 0.10 0.13 0.42 0.71 54.82 0.0207-JB-08 6.18 6.68 2.46 7.79 9.09 0.40 n.a. 338.40 0.0307-JB-09 12.26 2.43 0.50 0.10 0.32 0.36 1.79 41.31 11.9207-JB-10 2.80 4.24 1.50 1.09 1.73 0.39 0.89 37.66 0.0507-JB-11 2.15 10.99 5.25 6.62 0.87 0.33 0.17 109.07 0.4107-JB-12 1.71 11.14 6.34 34.83 4.87 0.35 0.19 252.33 0.3507-JB-13 4.02 113.41 31.29 1.30 0.05 9.81 n.a. 407.14 0.0307-JB-14 2.43 4.60 3.58 2.20 5.49 4.19 n.a. 146.56 0.0307-JB-15 3.96 5.36 5.93 155.52 21.96 n.a. n.a. 757.62 0.0407-JB-16 4.56 3.38 0.88 1.44 0.14 1.83 0.18 48.98 0.0507-JB-17 1.60 7.03 2.69 0.36 0.09 2.00 0.15 7.92 0.0307-JB-18 6.69 11.23 3.29 0.29 0.11 2.10 0.35 88.63 0.7707-JB-19 3.77 11.03 6.16 22.94 7.13 n.a. n.a. 262.41 0.0407-JB-20 10.20 7.44 0.38 0.20 1.10 141.67 13.08 91.50 1.9407-JB-21 9.67 1.47 0.01 0.01 0.27 192.29 17.33 76.59 7.2707-JB-22 9.08 2.16 0.05 0.23 0.22 157.92 15.61 66.77 2.1507-JB-23 5.58 6.16 1.43 0.06 0.30 89.26 8.46 59.60 1.2407-JB-24 19.04 7.72 4.22 44.54 42.54 n.a. n.a. 884.39 0.0609-JB-25 11.62 33.84 7.28 103.65 4.37 2.71 19.64 315.58 0.0409-JB-26 3.05 8.70 2.15 48.65 1.27 3.49 14.61 179.10 0.0509-JB-27 11.37 33.52 7.32 97.79 4.26 2.72 20.69 305.17 0.04
14
Figure 5. Major elemental concentrations versus pH in the surface hydrothermal waters at Torfajökull. Symbols are the same as in Figure 3.
15
Figure 6. The relationship between Cl and B concentrations in NaCl, mixed, acid sulphate and carbonate waters at Torfajökull,. The distribution clearly indicates a mixing line. Symbols are the same as in Figure 3.

17
5 Hydrothermal surface alteration and mineral chemistry
5.1 Mineral occurrence
The results of the XRD and SEM analyzes of the hydrothermal alteration in the Torfajökull area are summarized in Table 4. Samples were collected on the margins of acid sulphate waters, carbonate waters and NaCl waters and the results are categorized by those for simplification.
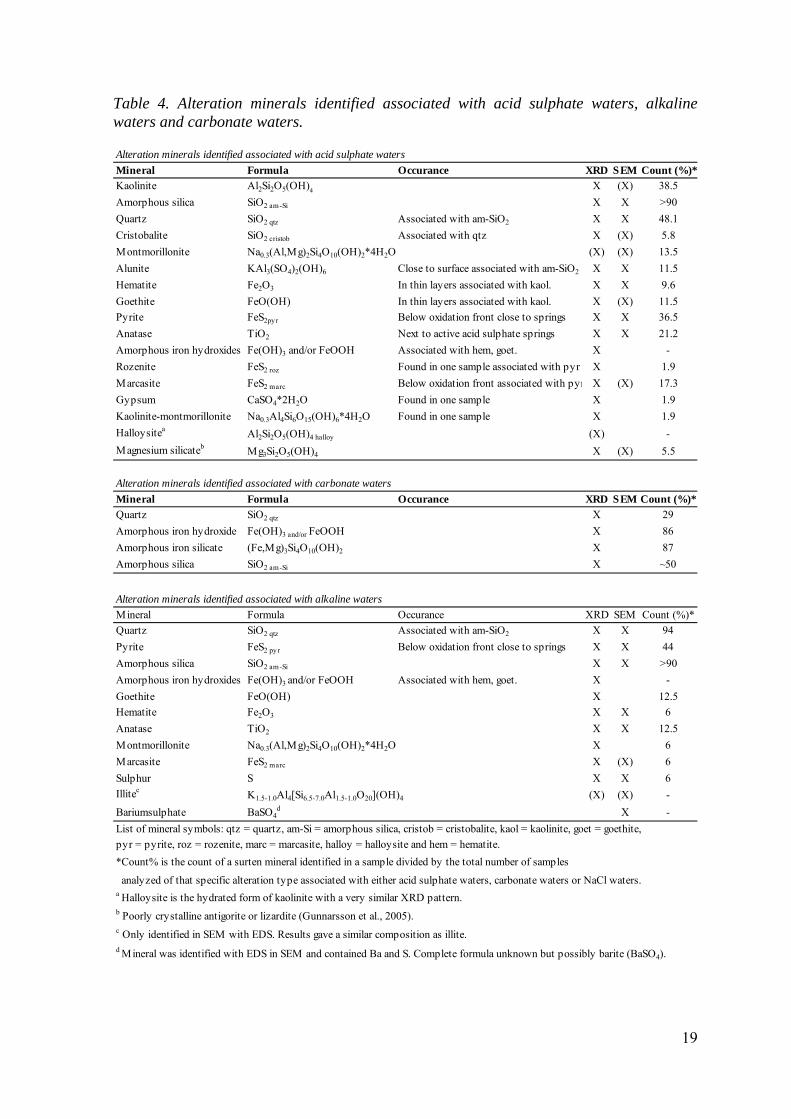
Most common minerals associated with acid sulphate waters are amorphous silica, quartz, kaolinite, pyrite, anatase, smectite and alunite. In less magnitude poorly crystalline antigorite (Gunnarsson et al., 2005), gypsum, rozenite, cristobalite and halloysite. Minerals associated with carbonate waters were amorphous silica, amorphous iron hydroxides, amorphous iron silicates and quartz. Around NaCl waters quartz, pyrite, goethite and anatase predominated with traces of hematite, smectite, marcasite and native sulphur. SEM pictures of selected minerals and dissolving rhyolitic glass are shown in Figure 7.
Some amorphous phases where observed in the SEM but where difficult to identify both using EDS and XRD and are regarded poorly crystalline and without a definite chemical composition.
5.2 Chemical composition of the alteration product
The major and trace elemental concentrations of the altered silicic rocks from the Torfajökull area are given in Table 5. Harker plots are illustrated in Figure 8, and include unaltered silicic and basaltic rocks from the area for comparison (samples T-4, T-6, T-37, T-49, T-104 (Saemundsson and Fridleifsson, 2001); AALK (Óskarsson et al., 1982)). All data included the volatiles and were normalized to 100%.
The altered samples have a much wider range of SiO2 concentrations than the unaltered silicic rocks. The alteration samples related to acid sulphate waters, carbonate waters and NaCl waters show SiO2 concentrations ranging from 37-88 wt%, 7-60 wt% and 70-92 wt%, respectively. All alteration samples show a decrease in Na2O and K2O and increased concentrations of P2O5, total sulphur and FeO, relative to unaltered silicic rocks in the area. The concentrations of FeO are significantly higher in the samples related to carbonate waters but minor in the ones related to NaCl waters relative to unaltered samples. MnO concentrations are close to those of the unaltered rocks except for a few samples related to

18
the NaCl waters. Relative to unaltered silicic rocks in the area the concentrations of Al2O3 is much higher in the samples associated with acid sulphate waters, constant or slightly lower in samples related to NaCl waters and much lower in samples related to carbonate waters. Alteration samples related to acid sulphate waters and NaCl waters show an increase in MgO, but those related to carbonate waters have concentrations close to the unaltered rock. TiO2 concentrations are significantly higher in alteration related to acid sulphate waters. In other samples TiO2 is close to that in the unaltered rocks. Zirconium is the most abundant trace element in the alteration samples. Alteration related to acid sulphate waters contains the highest concentrations of all trace elements except for zinc and barium which are most concentrated in the alteration related to carbonate waters (Table 5).
19
Table 4. Alteration minerals identified associated with acid sulphate waters, alkaline waters and carbonate waters.
Alteration minerals identified associated with acid sulphate waters
Mineral Formula Occurance XRD SEM Count (%)*
Kaolinite Al2Si2O5(OH)4 X (X) 38.5
Amorphous silica SiO2 am-Si X X >90
Quartz SiO2 qtz Associated with am-SiO2 X X 48.1
Cristobalite SiO2 cristob Associated with qtz X (X) 5.8
Montmorillonite Na0.3(Al,Mg)2Si4O10(OH)2*4H2O (X) (X) 13.5
Alunite KAl3(SO4)2(OH)6 Close to surface associated with am-SiO2 X X 11.5
Hematite Fe2O3 In thin layers associated with kaol. X X 9.6
Goethite FeO(OH) In thin layers associated with kaol. X (X) 11.5
Pyrite FeS2pyr Below oxidation front close to springs X X 36.5
Anatase TiO2 Next to active acid sulphate springs X X 21.2
Amorphous iron hydroxides Fe(OH)3 and/or FeOOH Associated with hem, goet. X -
Rozenite FeS2 roz Found in one sample associated with pyr X 1.9
Marcasite FeS2 marc Below oxidation front associated with pyr X (X) 17.3
Gypsum CaSO4*2H2O Found in one sample X 1.9
Kaolinite-montmorillonite Na0.3Al4Si6O15(OH)6*4H2O Found in one sample X 1.9
Halloysitea Al2Si2O5(OH)4 halloy (X) -
Magnesium silicateb Mg3Si2O5(OH)4 X (X) 5.5
Alteration minerals identified associated with carbonate waters
Mineral Formula Occurance XRD SEM Count (%)*
Quartz SiO2 qtz X 29
Amorphous iron hydroxide Fe(OH)3 and/or FeOOH X 86
Amorphous iron silicate (Fe,Mg)3Si4O10(OH)2 X 87
Amorphous silica SiO2 am-Si X ~50
Alteration minerals identified associated with alkaline waters
Mineral Formula Occurance XRD SEM Count (%)*
Quartz SiO2 qtz Associated with am-SiO2 X X 94
Pyrite FeS2 py r Below oxidation front close to springs X X 44
Amorphous silica SiO2 am-Si X X >90
Amorphous iron hydroxides Fe(OH)3 and/or FeOOH Associated with hem, goet. X -
Goethite FeO(OH) X 12.5
Hematite Fe2O3 X X 6
Anatase TiO2 X X 12.5
Montmorillonite Na0.3(Al,Mg)2Si4O10(OH)2*4H2O X 6
Marcasite FeS2 marc X (X) 6
Sulphur S X X 6
Illitec K1.5-1.0Al4[Si6.5-7.0Al1.5-1.0O20](OH)4 (X) (X) -
Bariumsulphate BaSO4d X -
List of mineral symbols: qtz = quartz, am-Si = amorphous silica, cristob = cristobalite, kaol = kaolinite, goet = goethite,
pyr = pyrite, roz = rozenite, marc = marcasite, halloy = halloysite and hem = hematite.
*Count% is the count of a surten mineral identified in a sample divided by the total number of samples
analyzed of that specific alteration type associated with either acid sulphate waters, carbonate waters or NaCl waters.a Halloysite is the hydrated form of kaolinite with a very similar XRD pattern.b Poorly crystalline antigorite or lizardite (Gunnarsson et al., 2005).c Only identified in SEM with EDS. Results gave a similar composition as illite.d Mineral was identified with EDS in SEM and contained Ba and S. Complete formula unknown but possibly barite (BaSO4).

20
Figure 7. Scanning electron micrographs (SEM) of selected grains, representing the most common minerals found in the alteration samples from the Torfajökull geothermal area. a) Dissolving glass, b) ilmenite, c) alunite, d) smectite, e) hematite, f) iron oxide bands, g) pyrite and h) barium sulphate needles.

21
Tab
le 5
. Maj
or a
nd tr
ace
elem
enta
l con
cent
rati
ons
of th
e hy
drot
herm
ally
alt
ered
rhy
olit
e fr
om th
e T
orfa
jöku
ll g
eoth
erm
al a
rea.
SiO
2A
l 2O
3F
eOM
nO
MgO
CaO
Na 2
OK
2OT
iO2
P2O
5S
um
SB
aC
oC
rC
uN
iS
cS
rV
YZ
nZ
r
wt%
wt%
wt%
wt%
wt%
wt%
wt%
wt%
wt%
wt%
wt%
ppm
ppm
ppm
ppm
ppm
ppm
ppm
ppm
ppm
ppm
ppm
ppm
07-0
1-07
48.6
334
.34
14.6
70.
010.
340.
190.
220.
030.
650.
4499
.51
300
143
836
3019
915
088
186
156
3536
07-0
1-01
57.8
139
.55
0.79
0.00
0.16
0.00
0.26
0.22
0.67
0.06
99.5
265
424
310
2711
204
6157
1756
3555
07-0
1-02
55.0
142
.48
0.00
0.00
0.00
0.00
0.47
1.34
0.34
0.06
99.7
047
836
31
167
73
5641
4448
1931
07-0
1-05
41.5
729
.67
26.6
80.
010.
420.
010.
170.
030.
700.
1399
.39
1244
235
413
1510
512
464
3684
4092
07-0
1-06
51.1
934
.02
12.7
30.
000.
220.
000.
140.
020.
780.
2499
.34
1064
200
69
225
118
135
123
124
142
4184
07-0
1-10
60.8
824
.41
8.11
0.37
3.46
0.99
0.41
0.28
0.45
0.12
99.4
753
436
76
1227
201
7521
513
688
2663
b04-
151
.13
36.2
16.
900.
040.
580.
000.
200.
163.
630.
9499
.79
777
444
3759
8925
2919
699
1713
286
1
b04-
241
.66
24.1
127
.93
0.03
0.74
0.12
0.21
0.11
4.35
0.38
99.6
611
2610
579
101
190
9557
6440
016
041
957
6
b04-
341
.95
26.3
220
.95
0.04
0.82
0.37
0.35
0.40
7.67
0.77
99.6
441
338
570
4310
228
6471
910
7526
164
428
b04-
448
.46
19.6
815
.65
0.05
1.80
1.03
0.29
0.16
9.04
0.65
96.8
129
595
443
7938
4712
2859
212
2414
9050
8
4-1
61.2
419
.19
10.4
40.
020.
240.
000.
211.
451.
160.
0694
.02
5997
226
032
2139
308
1824
615
646
517
29
4-2
87.7
46.
101.
220.
000.
020.
000.
333.
710.
480.
0999
.70
n.a.
285
56
57
228
2648
428
1771
4-5
80.2
511
.92
3.85
0.02
1.27
0.00
0.21
1.73
0.29
0.15
99.6
9n.
a.13
31
910
71
1753
351
4922
91
4-4a
87.2
96.
810.
480.
000.
430.
000.
333.
510.
510.
0999
.46
1491
869
314
94
227
2886
138
1898
4-4b
66.0
523
.51
3.88
0.06
4.92
0.10
0.21
0.26
0.52
0.10
99.6
111
5799
922
1527
26
5213
314
821
76
4-5a
53.9
124
.17
13.2
90.
042.
410.
000.
160.
430.
290.
3295
.03
5019
386
411
1319
114
7161
181
1380
4-5b
52.9
722
.68
19.4
70.
042.
250.
000.
140.
440.
310.
3198
.62
1213
271
432
1815
16
6468
210
1298
4-6
53.5
121
.17
17.6
20.
031.
710.
020.
280.
493.
550.
3998
.76
1016
537
347
4461
2728
182
320
200
321
505
JKB
H1
72.9
512
.84
5.50
0.02
0.16
0.17
0.33
1.49
2.01
0.22
95.6
842
289
391
3029
3218
1391
135
162
3914
92
JKB
H3
63.6
415
.02
10.9
90.
030.
080.
070.
331.
692.
130.
3394
.31
5720
840
243
3060
2222
102
206
168
3915
34
JKB
H2
57.6
512
.06
22.3
10.
090.
561.
181.
001.
462.
420.
9799
.70
821
299
2747
2317
1293
300
101
8910
54
H-0
137
.33
4.56
51.4
40.
040.
531.
010.
820.
772.
011.
0499
.56
2309
184
1831
2038
1178
594
4610
390
2
H-0
265
.00
8.96
17.2
40.
090.
891.
451.
501.
892.
050.
6099
.67
1199
279
1937
2353
1111
328
077
105
915
H-0
373
.41
10.6
46.
860.
020.
150.
020.
411.
452.
110.
1595
.21
4717
739
726
3151
1712
9512
713
635
1743
H-0
569
.63
14.9
57.
210.
040.
520.
500.
581.
923.
870.
3999
.62
796
442
2833
1732
1812
029
312
552
1622
JBK
BA
140
.88
14.1
228
.22
0.03
0.00
0.23
0.66
1.94
10.7
81.
9298
.77
1484
2582
105
6330
618
353
569
5897
7073
JBK
BA
293
.59
0.01
0.04
0.00
0.00
0.01
0.14
0.11
4.45
0.25
98.6
058
2720
8140
521
52
1172
214
5643

22
Figure 8. The relationship between major elemental composition of the alteration product at Torfajökull area, Iceland. Composition of unaltered basaltic and silicic rocks are plotted for comparison (Saemundsson and Fridleifsson, 2001; Óskarsson et al., 1982 )

23
6 Hydrothermal alteration of rhyolites
6.1 Mineralogical and chemical changes of the alteration product during hydrothermal alteration
Silicic obsidian and hyaloclastite dominate the petrochemical environment within the Torfajökull area. Rhyolitic glass are very reactive (e.g. Wolff-Boenisch et al., 2004) and weathering results in formation of clays, hydroxides and oxides as well as clay dissolution under extreme conditions (e.g. Ross and Smith, 1955, Casey and Bunker, 1990, Tsong et al., 1978, Jezek and Noble, 1978, Paces, 1972).
One of the major constituents controlling the rate and dissolution order of elements is the mineralogical composition. Most minerals that make up the silicic rocks are far from equilibria in the geothermal environment except for quartz, albite and K-feldspar in the most evolved silicic rocks, and will thus have a tendency to dissolve (Stefánsson and Arnórsson, 2000). Quartz is not observed as a primary mineral in the rhyolites in Torfajökull (Gunnarsson et al., 1998) but may form during rhyolite alteration. It was observed around NaCl waters within small crevasses in bands of amorphous silica suggesting that amorphous silica is re-crystallized to form quartz with time. Other primary minerals observed in fresh rhyolites mostly as phenocrysts include feldspar (andesine to sodic anorthoclase), clinopyroxene, titanomagnetite, amphibole, ilmenite, apatite, zircon and pyrrhotite (Gunnarsson et al., 1998). The only primary minerals observed in the alteration besides rhyolite glass was ilmenite (Figure 7).
Even if the hydrothermal activity takes place in a single petrochemical environment, such as rhyolitic glass (obsidian), it can never be excluded that mass flux in conduits from a deeper strata of different composition, such as basaltic, can have occurred. In Figure 8 the concentrations of basaltic hyaloclastite in the Torfajökull area are plotted with the major elemental concentration of the alteration. The concentrations of basalts are higher in Ca, Mg, Na, Mn and P than of the unaltered rhyolites, but a clear trend of contamination to the alteration can not be identified.
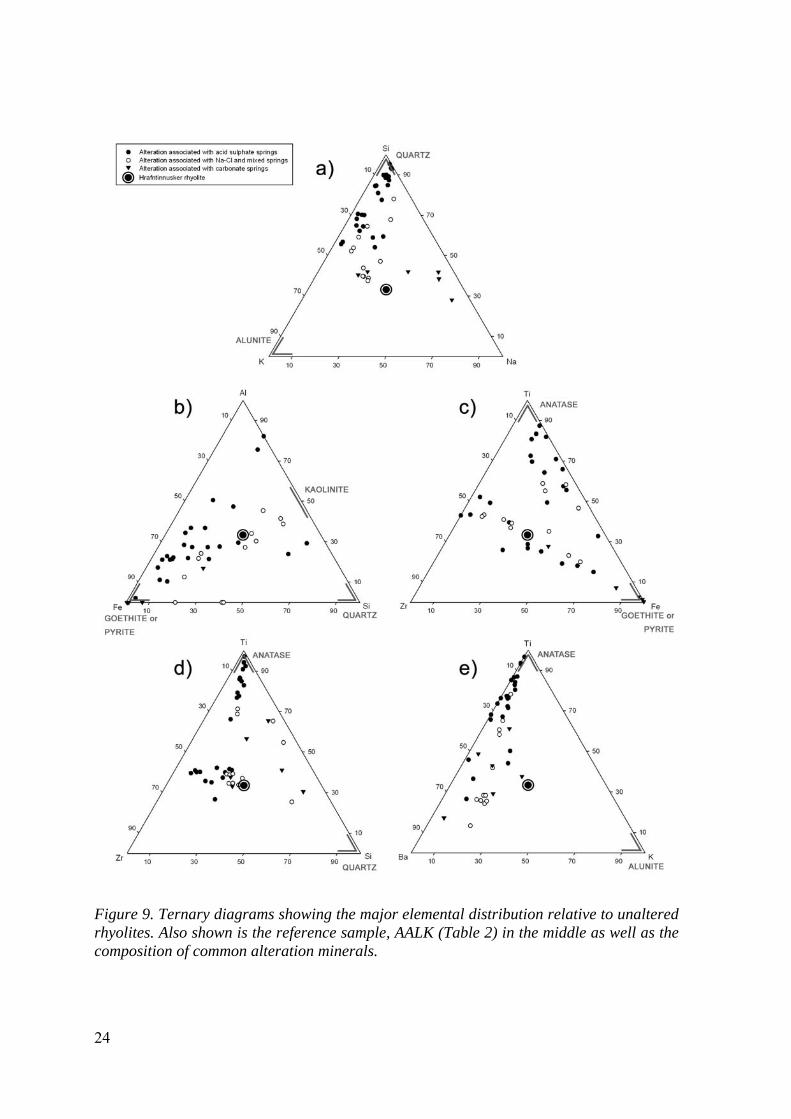
The leaching of the rhyolitic glass (Table 2, AALK) is shown as ternary diagrams in Figure 9. AALK is positioned in the middle of the diagram and all samples are normalized to it. All but four samples have lost alkalis relative to Si (Fig. 9a). It is evident from the figure that several samples have lost significant amount of Na but retain their K indicating formation of illite or alunite that retains potassium. Alunite was identified in the alteration associated with the acid sulphate springs. Illite was, however, not identified with the XRD analyses but in the SEM a clay phase with a composition close to that of illite was observed
24
Figure 9. Ternary diagrams showing the major elemental distribution relative to unaltered rhyolites. Also shown is the reference sample, AALK (Table 2) in the middle as well as the composition of common alteration minerals.

25
(Table 4). Samples that have experienced more intense leaching have lost both Na and K. Four samples show Na enrichment that might be an indication for low temperature Na-rich zeolites in the carbonate springs.
With leaching and formation of Si-Al rich residual clay it may be expected that the residual composition would approach kaolinite composition. This is the case for a few samples (Fig. 9b). The composition of kaolinite is in the middle of the Si-Al line. The composition of illite is more variable and may be on the Al-half of the line. The majority of samples have either lost Al and Si or accumulated Fe. Samples associated with all types of springs have accumulated Fe, but those related to carbonate waters to the most extent and contain almost 100% iron by weight percent.
It may be assumed that highly residual elements such as Ti and Zr may give indication on the order of leaching of the components of the rhyolite. However since the Torfajökull rocks in general and AALK in particular are extremely fluorine rich, the reservation has to be made that Zr may become mobile in a leaching process. This results from the high stability of the Zr-fluoride complex. In Figure 9c the Fe-Ti-Zr relation is illustrated. Most of the samples show a fairly constant Ti/Zr-ratio, regardless of Fe leaching or enrichment. Highly Ti enriched samples have lost Zr, probably due to fluoride leaching.
In Figure 9d, the Si content relative to residual elements, Ti and Zr are illustrated. The samples on the low-Si side of the ternary diagram show samples in the clay formation stage. These samples have a relatively constant Ti/Zr ratio until extreme leaching takes place. Then the concentrations move towards the Ti corner. Titanium and Si are both residual relative to Zr.
A special case in the mobility of the alkali earth metals is the formation of Ba rich sulphates. This is illustrated with the relations between the similar elements K and Ba. Barium forms a stable sulphate and its enrichment is an indication of oxidizing environment. In Figure 9e the relations between Ba, K and Ti are shown. Barium sulphate was observed in SEM in some of the alteration samples associated with acid sulphate waters and most of the ones associated with the NaCl waters. Barium sulphate needles as observed in SEM are shown in Figure 8. Oxidation may also have effect upon the covariation between iron and manganese. However, due to the different degrees of leaching that may prevail during an oxidizing event, it is only in the most iron-rich samples that manganese-loss is obvious.
The ternary diagrams illustrated in Figure 9 indicate that the alteration samples from Torfajökull follow main trends that can be predicted for leaching of rhyolite glass in variable environments. These processes are common with one exception which is the presence of sulphur. While pyrite is present in only minor amounts it is difficult to find covariation between sulphur and other elements. The alkali and alkali earth metals are preferentially leached out but may be incorporated into clays like illite and montmorrilonite and alunites. Silica and Al are incorporated into clays, most commonly kaolinite, and pure phases like amorphous silica. However, the alteration product eventually becomes enriched in Ti and Fe into metal oxides and oxyhydroxides relative to all other components including Si and Zr. In addition, Fe is incorporated into pyrite and sulphur as well into elemental sulphur, the origin being the H2S enriched hydrothermal steam produced upon depressurization boiling.

26
6.2 Water-rock interaction and secondary mineral saturation state
The alteration product and mineral stabilities may also be viewed from studying the mineral saturation states in various water types. The saturation index is calculated from the expression
log( / )SI Q K (1)
where K is the equilibrium solubility constant for a particular mineral reaction and Q is the reaction quotient defined by
iviQ a (2)
where a is the activity of the i-th mineral or species and iv is the respective reaction
stociometric coefficient, which is positive for products and negative for reactants. The aqueous species activites of the water samples were calculated using the PHREEQC program (Parkhurst and Appelo, 1999) and the secondary minerals selected where those observed in the alteration samples (Table 4).
The saturation state with respect to selected secondary minerals as a function of pH is shown in Figure 10. The saturation states of various minerals show distinctive trends with pH. Under acid conditions, native sulphur, alunite, pyrite, kaolinite and chalcedony are supersaturated and have the potential to form. With increasing pH complex Al-Si minerals become stable including clays and zeolites as well as Fe and hydroxides and carbonates these observed associated with the carbonate springs and NaCl waters.
The calculated mineral saturation states are in good agreement with observations and leaching trends (Table 4). In acid sulphate waters, most alkali and alkali earth elements are leached out. This is in agreement with more complex clays like celadonite and mordenite being unstable in contact with low pH waters. However, some K may be incorporated into minerals like alunite. The commonly identified minerals like native sulphur, pyrite, kaolinite SiO2 (chalcedony) are all close to saturation consistent with the build up of these elements relative to the alkali and alkali earth metals and their presence in the alteration product. Goethite may also form, and is often observed, depending on the redox conditions. In the calculations the redox potential (pe) was calculated from the H2S/SO4 redox couple that may not in all cases be realistic.

27
Figure 10. Saturation state of the major alteration phases associated with the hydrothermal water samples from Torfajökull geothermal field. Dashed lines correspond to equilibrium.
Carbonate waters had pH values typically between 5 and 7. These waters are saturated with respect to SiO2 (chalcedony) and Al and Fe hydroxides and oxyhydroxides but undersaturated with respect to most other secondary minerals. This is in very good agreement with amorphous silica and iron containing hydroxides and silicates being the dominant alteration product associated with carbonate springs. Moreover, carbonates like calcite and siderite are calculated to be undersaturated or close to saturation indicating that

28
they are most likely unstable. This is in line with carbonates being absent from the alteration product associated with carbonate waters at the surface.
NaCl waters had pH values between 7 and 9. Under these conditions SiO2 (chalcedony), pyrite, carbonates, complex clays and zeolites were observed to be saturated and supersaturated as well as Mg rich silicate. This is in very good agreement with the secondary mineralogy associated with the NaCl springs. In addition, the formation of clays and zeolites as well as carbonates may greatly reduce the mobility of many of the alkali and alkali earth metals as observed for example by decreased in concentrations of Mg and Ca.

29
7 Fluid-rhyolite interaction, boiling and mixing
To gain insight in the dominant geochemical processes including water-rock interaction, formation of steam and gases (H2S and CO2) in the surface springs and boiled water and mixing trends with surface waters, sets of geochemical model calculations were carried out. These involved essentially three steps: (1) reconstruction of the aquifer fluids at Torfajökull from data on NaCl hot springs and mineral-buffer equilibria, (2) depressurization closed and open boiling and phase segregation simulations and (3) gas-water-rhyolite interaction under surface conditions and variable acid supply (CO2 and SO4) and oxidation state.
7.1 Calculation of aquifer fluid composition
The first step in the forward modelling of boiling of aquifer fluid and mixing with shallow ground and surface waters involved the reconstruction of the aquifer fluid composition. No wells have been drilled into the geothermal reservoir in the Torfajökull area. Therefore, the aquifer fluid composition has to be estimated based on surface spring composition and geochemical modelling. This involves three steps, estimation of aquifer fluid temperatures, reversed boiling modelling whereas the volatile gases and steam lost upon boiling in the boiling NaCl waters are added to the waters. Finally estimations and comparison with mineral buffer reactions considered to control the aquifer fluid composition at a particular temperature (Arnórsson et al., 1983, Stefánsson and Arnórsson, 2000, Gudmundsson and Arnórsson, 2005).
NaCl waters are considered to represent boiled aquifer waters at the surface (Arnórsson, 1985). They are predominantly found close to Landmannalaugar and in Vondugil (Fig. 2). Based on geothermometry and mixing models, Arnórsson and Gunnlaugsson (1985) and Arnórsson (1985) concluded that the aquifer temperatures in these locations were ~265°C. Higher gas geotherometry temperatures have been estimated in the Hrafntinnusker area or close to ~300°C but these are not associated with boiling NaCl waters (Arnórsson and Gunnlaugsson, 1985, Bjarnason and Ólafsson, 2000). Based on these findings 265°C was selected as the aquifer temperature for further calculations.
Based on adiabatic boiling, Arnórsson et al. (1983, 2007) developed a model to reconstruct aquifer fluid composition from data on boiled NaCl springs at surface. In a closed boiling system the aquifer fluid is given by,
)1( vli
vvi
totali xmxmm (3)

30
where totalim is the aquifer fluid composition of the i-th component, v
im and lim are the
concentration in the vapour and the liquid phase, respectively, and xv is the vapour fraction. For boiling hot springs, the boiling is assumed to be from the estimated aquifer temperature to the surface (100°C), along the two phase curve (psat). Assuming adiabatic boiling, the steam fraction may be calculated from the relationship
l
lfluidv
L
hhx
(4)
where hfluid is the initial fluid enthalpy obtained from the estimated aquifer temperature, hl is the liquid enthalpy at surface and Ll is the latent heat of vaporation. For conservative elements that do not enter the steam phase becomes zero, i.e. xv is only needed for the calculations. For volatiles that are found in both the steam and liquid phase, like CO2 and H2S, but only analysed in the liquid phase one can calculate the steam concentration from,
11
51.55 stotal
vli
vi Kp
xmm (5)
where Ks is the solubility constant for a particular gas in liquid water and ς is the degassing factor. A value of unity for ς indicates equilibrium gas solubility, and a value of <1 incomplete degassing.
31
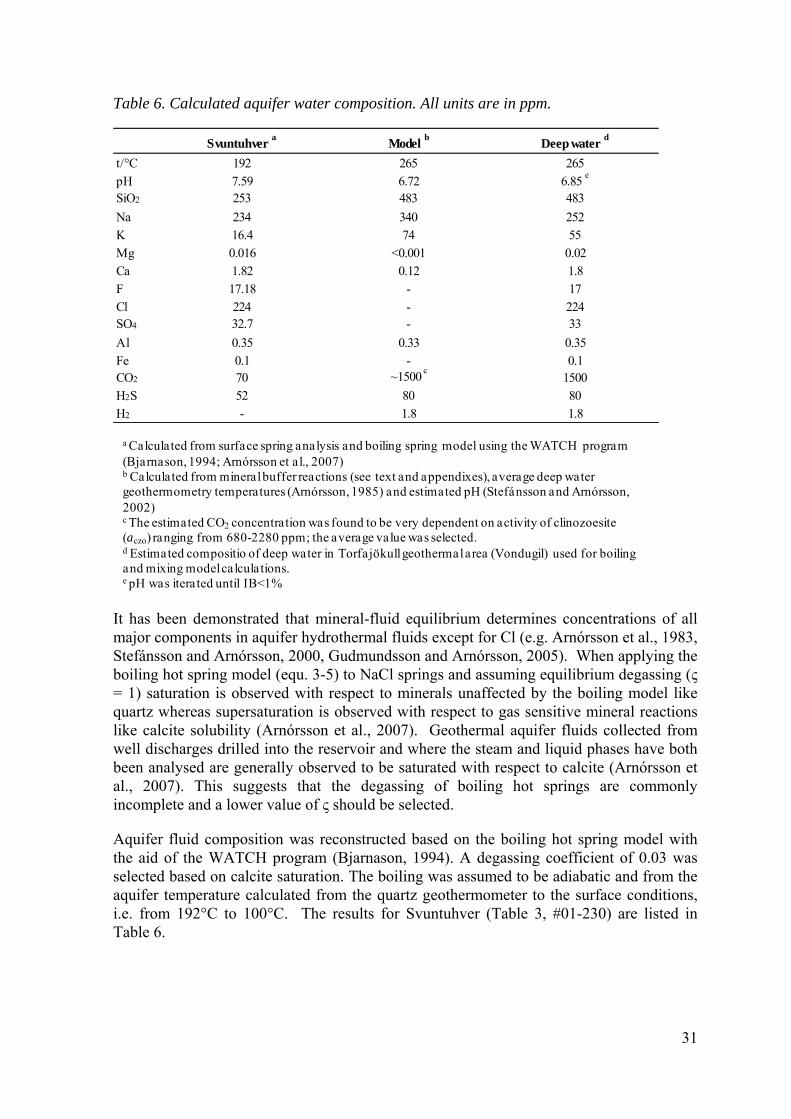
Table 6. Calculated aquifer water composition. All units are in ppm.
Svuntuhver a
Model b
Deep water d
t/°C 192 265 265
pH 7.59 6.72 6.85 e
SiO2 253 483 483
Na 234 340 252
K 16.4 74 55
Mg 0.016 <0.001 0.02
Ca 1.82 0.12 1.8
F 17.18 - 17
Cl 224 - 224SO4 32.7 - 33
Al 0.35 0.33 0.35Fe 0.1 - 0.1CO2 70 ~1500
c1500
H2S 52 80 80
H2 - 1.8 1.8
a Calculated from surface spring analysis and boiling spring model using the WATCH program (Bjarnason, 1994; Arnórsson et al., 2007)b Calculated from mineral buffer reactions (see text and appendixes), average deep water geothermometry temperatures (Arnórsson, 1985) and estimated pH (Stefánsson and Arnórsson, 2002)c The estimated CO2 concentration was found to be very dependent on activity of clinozoesite (aczo) ranging from 680-2280 ppm; the average value was selected.d Estimated compositio of deep water in Torfajökull geothermal area (Vondugil) used for boiling and mixing model calculations.e pH was iterated until IB<1%
It has been demonstrated that mineral-fluid equilibrium determines concentrations of all major components in aquifer hydrothermal fluids except for Cl (e.g. Arnórsson et al., 1983, Stefánsson and Arnórsson, 2000, Gudmundsson and Arnórsson, 2005). When applying the boiling hot spring model (equ. 3-5) to NaCl springs and assuming equilibrium degassing (ς = 1) saturation is observed with respect to minerals unaffected by the boiling model like quartz whereas supersaturation is observed with respect to gas sensitive mineral reactions like calcite solubility (Arnórsson et al., 2007). Geothermal aquifer fluids collected from well discharges drilled into the reservoir and where the steam and liquid phases have both been analysed are generally observed to be saturated with respect to calcite (Arnórsson et al., 2007). This suggests that the degassing of boiling hot springs are commonly incomplete and a lower value of ς should be selected.
Aquifer fluid composition was reconstructed based on the boiling hot spring model with the aid of the WATCH program (Bjarnason, 1994). A degassing coefficient of 0.03 was selected based on calcite saturation. The boiling was assumed to be adiabatic and from the aquifer temperature calculated from the quartz geothermometer to the surface conditions, i.e. from 192°C to 100°C. The results for Svuntuhver (Table 3, #01-230) are listed in Table 6.

32
Tab
le 7
. M
iner
al-f
luid
equ
ilib
rium
rea
ctio
ns c
onsi
dere
d to
con
trol
maj
or c
ompo
nent
con
cent
rati
ons
at >
230°
C i
n di
lute
geo
ther
mal
flui
ds a
s w
ell a
s th
e re
spec
tive
equ
ilib
rium
con
stan
ts.
Con
trol
led
Min
eral
bu
ffer
rea
ctio
na
reac
tion
025
5075
100
125
150
175
200
225
250
275
300
325
350
H4S
iO4(
aq)
qtz
+ 2
H2O
= H
4SiO
4-4
.12
-3.7
9-3
.50
-3.2
4-3
.01
-2.8
1-2
.64
-2.4
8-2
.35
-2.2
4-2
.14
-2.0
7-2
.01
-1.9
6-1
.93
H2S
(aq)
py
r +
py
rr +
2p
re +
2H
2O =
2ep
i + 3
H2S
-29.
43-2
6.18
-23.
32-2
0.79
-18.
54-1
6.51
-14.
67-1
3.00
-11.
47-1
0.06
-8.7
5-7
.53
-6.3
9-5
.29
-4.2
0
H2(
aq)
4py
rr +
2p
re +
2H
2O =
2ep
i + 2
py
r +
3H
2-2
0.80
-19.
27-1
7.85
-16.
56-1
5.37
-14.
28-1
3.26
-12.
31-1
1.42
-10.
57-9
.77
-8.9
9-8
.22
-7.4
4-6
.57
CO
2(aq
)2c
zo +
2cc
+ 3
qtz
+ 2
H2O
= 3
pre
+ 2
CO
2-1
1.71
-10.
51-9
.40
-8.3
9-7
.45
-6.5
9-5
.78
-5.0
2-4
.30
-3.6
1-2
.95
-2.3
1-1
.67
-1.0
1-0
.25
Ca2+
/(H
+)2
1.5p
re +
2H
+ =
1.5
qtz
+ 1
.5cz
o +
2H
2O +
Ca2+
14.7
213
.51
12.5
011
.65
10.9
110
.27
9.70
9.19
8.74
8.31
7.91
7.53
7.17
6.82
6.52
Ca2+
/(N
a+)2
4.5q
tz +
czo
+ 2
Na+
= 0
.5p
re +
2al
+ C
a2+2.
662.
011.
440.
930.
460.
03-0
.38
-0.7
6-1
.11
-1.4
6-1
.78
-2.1
0-2
.41
-2.6
9-2
.93
Na+
/K+
al +
K+
= m
ic +
Na+
3.14
2.71
2.36
2.07
1.83
1.62
1.45
1.30
1.17
1.05
0.95
0.86
0.78
0.71
0.64
Fe2+
/(H
+)2
0.67
epi +
0.6
7py
rr +
2H
+ =
0.3
3py
r +
0.6
7pre
+ 1
.5H
2O
50.6
946
.23
42.4
739
.27
36.5
134
.11
32.0
030
.12
28.4
526
.94
25.5
624
.30
23.1
322
.06
21.1
2
Al(
OH
) 4- /O
H-
czo
+ 2
H2O
+ O
H-
= p
re +
Al(
OH
) 4-
-0.3
7-0
.56
-0.6
7-0
.72
-0.7
4-0
.72
-0.6
9-0
.64
-0.6
0-0
.56
-0.5
3-0
.51
-0.4
9-0
.32
-0.1
4
Mg2+
/Ca2+
chl +
3w
ai +
5C
a2+ =
4p
re +
3qtz
+ 6
H2O
+ 5
Mg2+
-22.
67-2
1.82
-21.
00-2
0.21
-19.
44-1
8.69
-17.
98-1
7.29
-16.
62-1
5.99
-15.
39-1
4.80
-14.
24-1
3.63
-12.
85
a Li
st o
f min
aral
sym
bols
: qtz
= q
uart
z, p
yr =
pyr
ite, p
yrr =
pyr
rhot
ite, p
re =
pre
hnite
, epi
= e
pido
te, c
zo =
clin
ozoi
site
, cc
= ca
lcite
, al =
alb
ite,
mic
= m
icro
clin
e, c
hl =
chl
orite
, wai
= w
aira
cite
.b T
herm
odyn
amic
dat
a fo
r min
eral
s an
d aq
ueou
s sp
ecie
s w
here
sel
ecte
d fr
om R
obie
and
Hem
ingw
ay (1
995)
,Hol
land
and
Pow
ell (
1998
), A
rnór
sson
and
Ste
fáns
son
(199
9), S
upcr
t92
slop
07 (J
ohns
on e
t al.,
199
2), G
unna
rsso
n an
d A
rnór
sson
(200
0),
Hill
(199
0) a
nd B
enez
eth
et a
l. (2
001)
logK
b a
t p s
at a
nd
vari
ous
t °C
33
As discussed above, mineral-fluid equilibria is considered to control the composition of aquifer fluids at a particular temperature, except for mobile components like Cl and B. The major components in the hydrothermal fluids include H2O, Na, K, Ca, Mg, Si, Al, Fe, S and Cl. At temperature above ~230°C in dilute hydrothermal fluids (<1000 ppm Cl) the minerals considered to control the major component concentration include epidote, clinozoesite, prehnite, pyrite, pyrrhotite, calcite, K-feldspars, wairakite and quartz. The respective reactions are given in Table 7 together with the equilibrium solubility constants as a function temperature at psat (Appendixes B and C). To obtain equilibrium fluid composition, one needs to select temperature and pH. The former of 265°C was selected based on geothermometer temperatures and the latter of pH 6.72 based on temperature to pH correlation in dilute hydrothermal fluids in Iceland given by Stefánsson and Arnórsson (2002). The results are listed in Table 6. Concentrations of CO2 where very sensitive to the activity of clinozoisite, ranging from 680-2280 ppm with a mixture of clinozoisite and epidote at 0.3 and 0.7 moles, respectively and clinoziosite and epidote calculated to be pure phases. Because of a solid solution mixing between epidote and clinoziosite that is difficult to assess without analysis of the mineral, the average concentration of CO2 was selected. Concentrations of SiO2, H2S, H2, CO2 and Ca were very sensitive to temperature changes and Ca, Na and K to changes in pH. All activities of species where calculated at ionic strength at approximately 0.01.
Comparison of the two models in Table 6 reveal that Si and K and to less extent Na may be lost upon boiling and degassing. In addition, reconstruction of aquifer volatile concentrations may be uncertain and very dependent on the degassing coefficient selected for the boiling hot spring model. The approach by combining the two methods was selected to reconstruct aquifer fluid composition. Silica, Na, K, CO2 and H2S concentrations were calculated based on mineral-equilibria reactions (Table 7) and other components from the Svuntuhver water sample. The calculations were carried out at 265°C. The results are listed in Table 6.
7.2 Boiling, phase segregation and mixing
The types of hydrothermal waters observed at the surface are considered to be caused by boiling and possible phase segregation of the aquifer fluids on the way from the reservoir to the surface as well as mixing of the boiled fluids and steam with non-thermal shallow ground- and surface waters. It is considered that acid sulphate waters are produced upon mixing and condensation of hydrothermal steam rich in H2S with oxygenated waters and subsequent H2S oxidation to sulphuric acid, carbonate springs are produced upon boiling and phase segregation at depth of hydrothermal fluids followed by mixing with surface waters and NaCl waters are the residual boiled hydrothermal aquifer waters. To test this, boiling and mixing modelling were carried out and the results of the models compared with the composition of the surface waters.
The reconstructed aquifer water (Table 6) was boiled in several steps with the aid of the WATCH program (Bjarnason, 1994). The results on the CO2 and H2S concentration in the steam is given in Table 8. As observed the initial steam formed is highly enriched in the volatile gases. With increased boiling, the steam fraction increases as well as the mass of H2O in steam and the gases are diluted. Moreover, due to differences in the gas solubility

34
Table 8. Concentration (ppm) of CO2 and H2S in vapor, calculated with adiabatic boiling to 100°C. Equilibrium degassing assumed.
t / °C CO2 H2S CO2/H2S Steam fraction (xv)
265 0 0 0264 98422 2087 47 0.0031262 70107 1735 40 0.0091260 54679 1490 37 0.015255 35673 1112 32 0.0294245 21567 756 29 0.0565220 11482 450 26 0.1165200 8636 356 24 0.1587150 5628 259 22 0.2498100 4334 219 20 0.3283
constants, the initial steam is CO2 rich and the CO2 to H2S ratio decreases with increasing degree of boiling. The steam formed under various conditions may then separate from the boiled water depending on the relative permeability of the rocks.
To model steam heating and formation of acid sulphate and carbonate waters, steam formed and separated under various conditions were mixed with surface waters (Table 1). The results are shown in Figures 11 and 12. The lines represent mixing trends with percentage of steam added and the symbols the results from the water analysis. As observed in Figure 11, carbonate waters seem to be formed upon insignificant mixing of CO2 rich steam with surface waters (2-10% by mass). Such steam is likely caused by open system boiling at high temperatures followed by steam separation. With this in mind it is interesting to note that all the carbonate springs are on the rim of the caldera to the south and east where fractured permeability may dominate. The sulphur concentration does not mach these findings completely, the cause considered to be H2S is oxidized to SO4 and accumulates in the spring. The low chlorine concentrations of the acid sulphate waters and carbonate waters indicate steam heating and no mixing with the aquifer fluid.
Acid sulphate springs are, on the other hand, considered to be formed upon steam condensation in the surface and mixing with non-thermal surface waters. This is clearly seen in Figure 12. The acid sulphate springs are all depleted in Cl relative to the surface waters but highly enriched in SO4. Assuming all H2S in steam formed upon boiling to 100°C to be oxidized to SO4 the mixing ratios between steam and surface waters range from almost pure condensed steam to almost pure surface water.
It is therefore clear that both acid sulphate and carbonate waters are produced upon boiling and mixing, the differences between the two most likely caused by various degree of boiling and segregation as well as mixing ratio. However, in the case of carbonate waters, magma degassing as a source of additional CO2 can not be ruled out, however, the chemistry may be explained by steam segregation and mixing.

35
Figure 11. Relationship between mixing of non-thermal surface waters (Table 1) and steam. The lines represent the mixing ratio of steam formed at 245°C with open system boiling and phase segregation and 100°C with a closed system boiling. The results suggests that carbonate waters are formed by mixing of gas rich steam formed at >200°C and then separated from the boiled waters with non-thermal surface waters. By mass, the mixing ratio is <10% and >90% surface waters.
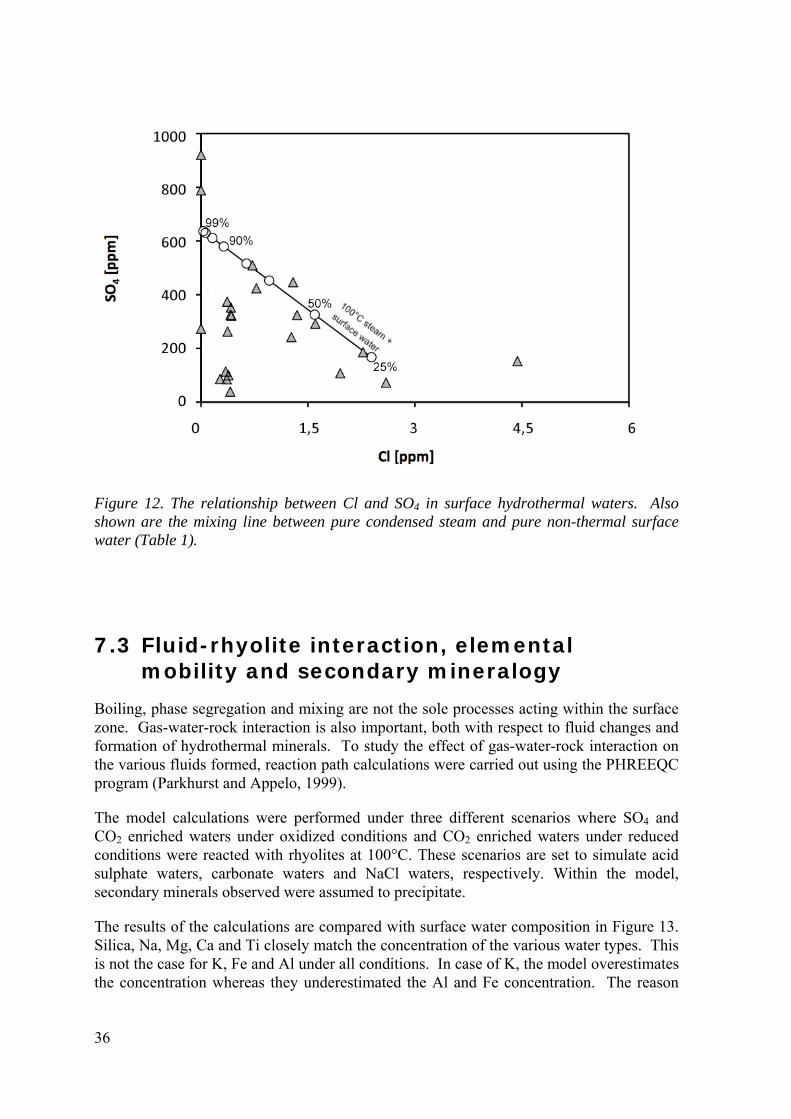
36
Figure 12. The relationship between Cl and SO4 in surface hydrothermal waters. Also shown are the mixing line between pure condensed steam and pure non-thermal surface water (Table 1).
7.3 Fluid-rhyolite interaction, elemental mobility and secondary mineralogy
Boiling, phase segregation and mixing are not the sole processes acting within the surface zone. Gas-water-rock interaction is also important, both with respect to fluid changes and formation of hydrothermal minerals. To study the effect of gas-water-rock interaction on the various fluids formed, reaction path calculations were carried out using the PHREEQC program (Parkhurst and Appelo, 1999).
The model calculations were performed under three different scenarios where SO4 and CO2 enriched waters under oxidized conditions and CO2 enriched waters under reduced conditions were reacted with rhyolites at 100°C. These scenarios are set to simulate acid sulphate waters, carbonate waters and NaCl waters, respectively. Within the model, secondary minerals observed were assumed to precipitate.
The results of the calculations are compared with surface water composition in Figure 13. Silica, Na, Mg, Ca and Ti closely match the concentration of the various water types. This is not the case for K, Fe and Al under all conditions. In case of K, the model overestimates the concentration whereas they underestimated the Al and Fe concentration. The reason

37
for these discrepancies are considered to simply be related to incorrect model assumptions, incorrect mineral solubilities and/or that cation exchange for clays was not included in the modelling.
Figure 13. The relationship between major elemental concentrations (mol/kgw) and pH in surface hydrothermal waters at Torfajökull. Also shown are the results of the reaction path modelling. Red line represent the SO4 model under oxidizing conditions, blue line represents a CO2 model under reducing conditions and the green line represents a CO2 model under oxidizing conditions.
The combined observed and modelled secondary mineralogy as well as elemental mobility with respect to the water phase is shown in Figure 14. For acid sulphate waters (Fig. 14, a) Si, Fe and Ti oxides as well as kaolinite are formed at low pH values (<5) reducing the mobility of Si, Fe, Al and Ti in the waters. This is in good agreement with the observed mineralogy. However, the model was carried out under oxidized conditions preventing the formation of pyrite and native sulphur commonly identified in the alteration product associated with acid sulphate waters. Other elements, like Na, K, Mg and Ca are mobile and will eventually be leached out of the rhyolites.

38
Fig
ure
14. R
esul
ts o
f the
rea
ctio
n pa
th m
odel
cal
cula
tion
s. T
hree
mod
els
wer
e co
nstr
uced
bas
ed o
n ac
id s
uppl
y an
d ox
idat
ion
stat
e in
clud
ing
SO4
(a)
and
CO
2 (b
) un
der
oxid
izin
g co
ndit
ions
wit
h in
itia
l co
mpo
siti
ons
of S
O4
and
CO
2, 1
0 an
d 20
mm
oles
/kgw
, re
spec
tive
ly a
nd C
O2
(c)
unde
r re
duci
ng c
ondi
tion
s, w
ith
init
ial
conc
entr
atio
ns o
f C
O2,
10 m
mol
es/k
gw,
are
repr
esen
ted
wit
h se
cond
ary
min
eral
s an
d el
emen
tal m
obil
ity
vs. p
H. T
he g
ray
area
in th
e fi
gure
rep
rese
nts
the
pH fi
eld
whi
ch th
e m
odel
is a
ppli
ed.

39
For carbonate waters under oxidized conditions (Fig 14, b) the dominant alteration products are Si, Fe and Ti oxides and hydroxides and kaolinite with clays and even zeolites becoming important at pH>6. This is in fair agreement with the secondary mineralogy and elemental mobility associated with carbonate waters.
For carbonate waters under reduced conditions (Fig 14, c) the secondary minerals formed at pH above 7 include Si, Fe and Ti oxides and hydroxides, sulphides, clays, carbonates and zeolites. This is in good agreement with minerals observed. The associated water chemistry is characterized by low mobility of except Na and K, in agreement with the concentrations observed in NaCl boiling hot springs.
7.4 Overall fluid-rhyolite interaction, boiling and mixing, hydrothermal water chemistry and mineralogy at the surface
The processes acting within a volcanic hydrothermal system including fluid-rock interaction, boiling and mixing are considered to be the primary cause of various surface waters and steam vents as well as the observed secondary mineralogy. The primary factors of importance include extent of reaction (water-rock ratio), boiling and phase separation processes, mixing ratios between steam, boiled hydrothermal waters and oxygenated surface waters as well as the oxidation state.
Acid sulphate waters are produced upon boiling of hydrothermal aquifer waters and then separation of the steam from the boiled water. The steam, enriched in H2S and CO2 condenses into oxygenated shallow ground- and surface waters where the H2S is oxidized to sulphuric acid and the CO2 is mostly degassed. From the temperatures and the Cl concentrations, the waters are predominantly condensed steam. The results are acid waters with pH <4 that alters the rhyolites to form amorphous silica, anatase and kaolinite but leaches out many of the alkali and alkali earth metals. The iron and sulphur mineralogy depends mostly on the oxidation front, below pyrite predominates whereas above iron oxyhydroxides and oxides are important.
Carbonate waters are produced upon boiling of hydrothermal aquifer waters and segregation of the steam at high temperatures producing very gas rich steam. Magma degassing may also contribute to the CO2 concentration. The CO2 rich steam mixes with oxygenated shallow ground and surface waters, with low steam to surface water ratio. The H2S is oxidized to SO4, however, the pH is buffered by the elevated dissolved CO2 concentrations between 5 and 7. Upon oxidation, the iron is precipitated into ferrihydrites and Fe containing silicates as well as amorphous silica. The waters are, however, undersaturated with respect to carbonates that is consistent with their absence in the alteration product.
NaCl waters are considered to be boiled aquifer waters sometimes mixed to various degrees with non-thermal ground and surface waters. Upon boiling, cooling and/or mixing some components are lost including Si, K, CO2 and H2S. The boiling and degassing of CO2 and H2S results in alkaline waters with pH values between 7 and 9. They are highly enriched in many elements like Na, Cl and Si due to fluid-rock interaction at elevated
40
temperatures whereas other elements like Fe, Mg and Al are greatly depleted due to formation of clays, zeolites and ion exchange reactions at low temperatures. The secondary mineralogy associated with the NaCl waters are mostly dominated by amorphous silica and some iron oxyhydroxides that probably reflects the low abundance of many elements like Al, Mg and Ca in the source fluid.

41
8 Summary and conclusions The surface hydrothermal water chemistry and alteration mineralogy associated with rhyolitic rocks at Torfajökull Iceland was studied. The hydrothermal surface activity was characterized by boiling hot springs, mud bots, steam vents and intensive alteration.
The surface hydrothermal fluids had pH in the range 2.14-9.77 (at ~20°C) and temperatures in the range 12-98°C. The concentrations of dissolved solids ranged from almost pure surface water to relatively concentrated waters or with TDS between 98 and 1895 ppm. Based on the water composition, the surface hydrothermal waters were divided into three groups, acid sulphate waters, carbonate waters and NaCl waters.
A distinguished alteration was observed associated with the various types of waters. The alteration mineralogy around acid sulphate pools and mud pots was dominated by amorphous silica, quartz, kaolinite, pyrite, anatase, smectite and alunite. Associated with carbonate rich springs amorphous silica, ferrihydrite, amorphous iron silicates and quartz predominated. Around NaCl waters quartz, pyrite, goethite and anatase were most common alteration products.
Based integration of alteration mineralogy and chemical composition, water composition, and geochemical modelling the processes forming various types of surface phenomenon were quantified as well as the overall gas-water-rhyolite interaction under hydrothermal conditions at ~100°C.
Upon ascent to the surface, aquifer hydrothermal fluids start to boil due to decrease in hydrostatic pressure. This results in the formation of steam enriched in volatiles like CO2, H2S and H2 and boiled waters enriched in non-volatiles like Na, Cl and Si. Depending on the relative permeability of the system, the steam may separate from the boiled water. Close to the surface, the steam and boiled water can mix with oxygenated non-thermal waters.
Acid sulphate waters are considered to be formed upon intensive boiling, steam condensation near the surface and mixing with oxygenated surface waters. Generally, the waters are >80% condensed steam. Subsequently, H2S is oxidized to sulphuric acid, lowering the pH to <4 and causing intensive leaching. Sodium, K, Mg and Ca are leached out from the rhyolites whereas Ti and Fe and to a lesser extend Si are retained in the alteration product including amorphous silica, quartz, anatase and kaolinite. Pyrite and goethite and/or hematite are also formed below and above the oxidation front as well as elemental sulphur.
Carbonate waters are considered to be formed upon boiling and phase segregation at >200°C. The gas rich steam then mixes with oxygenated surface water resulting in pH values at 5.5-7. The proportion of gas rich hydrothermal steam was observed to be <10% by mass in most cases. Under these conditions, Na and Ca are mobile whereas Fe and Si are retained into amorphous silica, ferrihydrites and iron rich silicates. Carbonates were

42
not calculated or observed to form associated with carbonate springs. Magnesium, Ca and K where observed to be mobile at pH<6 whereas they are quantitatively retained into smectites and eventually also zeolites and carbonates with increasing pH. As a consequence, the mobility of Mg and K and to less extend Ca and Na are greatly reduced in NaCl type waters under alkaline conditions.
The key factors controlling the nature of hydrothermal fluids at the surface and the associated secondary mineralogy are boiling, phase segregation and mixing with oxygenated non-thermal surface waters. In addition, the major factors controlling the fluid-rhyolite interaction at 100°C include the acid supply, oxidation state and extent of reaction. The various water types and hydrothermal alteration clearly reflects the effects of acid supply on the water chemistry and secondary mineralogy. In addition, at a constant acid supply mobile elements will be leached out with time whereas if the system are cut of from the acid supply, the rhyolite dissolution will results in increase pH and changes in elemental mobilities and secondary mineralogy. As Fe and S are among of the dominant components in the hydrothermal environment, the redox state plays an important role in elemental mobility and secondary mineralogy, with the aquifer fluids being reduced and the surface fluids being oxidized.
43
References American Public Health Association (APHA). 1985. Method 428C. Methylene blue method for sulphide. In: Standard methods for the examination of water and wastewater, 14th ed. American Public Health Association, pp. 403-405.
Arnórsson, S. 1969. A geochemical study of selected elements in thermal waters of Iceland. Unpublished Ph.D. Thesis, Univ. London, U.K., 353 pp.
Arnórsson, S. 1985. The Use of Mixing Models and Chemical Geothermometers for Estimating Underground Temperatures in Geothermal Systems. Journal of Volcanology and Geothermal Research, 23, 299-335.
Arnórsson, S. & Andrésdóttir, A. 1995. Processes Controlling the Distribution of Boron and Chlorine in Natural-Waters in Iceland. Geochimica Et Cosmochimica Acta, 59, 4125-4146.
Arnórsson, S., Bjarnason, J. Ö., Giroud, N., Gunnarsson, I. & Stefánsson, A. 2006. Sampling and analysis of geothermal fluids. Geofluids, 6, 203-216.
Arnórsson, S. & Gunnlaugsson, E. 1985. New Gas Geothermometers for Geothermal-Exploration - Calibration and Application. Geochimica Et Cosmochimica Acta, 49, 1307-1325.
Arnórsson, S., Gunnlaugsson, E. & Svavarsson, H. 1983. The chemistry of geothermal waters in Iceland. II. Mineral equilibria and independent variables controlling water compositions. Geochimica Et Cosmochimica Acta, 47, 547-566.
Arnórsson, S., Ivarsson, G., Cuff, K. E. & Saemundsson, K. 1987. Geothermal activity in the Torfajökull field, south Iceland: summary of geochemical studies. Jökull, 37, 1-12.
Arnórsson, S., Stefánsson, A. 1999. Assessment of feldspar solubility constants in water in the range 0 to 350 °C at vapor saturation pressure. Am. J. Sci. 299, 173–209.
Arnórsson, S., Stefánsson, A. & Bjarnason, J. Ö. 2007. Fluid-Fluid Interactions in Geothermal Systems. In: LIEBSCHER, A. & HEINRICH, C. A. (eds.) Fluid-Fluid Interactions. Mineralogical Society Of America Geochemical Society, 259-312.
Benezeth, P., Palmer, D. A. & Wesolowski, D. J. 2001. Aqueous high-temperature solubility studies. II. The solubility of boehmite at 0.03 m ionic strength as a function of temperature and pH as determined by in situ measurements. Geochimica Et Cosmochimica Acta, 65, 2097-2111.
Bjarnason, J. Ö. 1994. The Speciation Program WATCH, Version 2.1. Reykjavik: National Energy Authority.
44
Bjarnason, J. Ö. & Ólafsson, M. 2000. In Torfajökull, an analysis of fumaroles and hot springs. Reykjavík: Orkustofnun.
Björnsson, S. & Einarsson, P. 1974. Seismicity of Iceland. In: KRISTJÁNSSON, L. (ed.) Geodynamics of Iceland and the North Atlantic Area. Reidel, Dordrecht, 225-239.
Boyce, A. J., Fulignati, P., Sbrana, A. & Fallick, A. E. 2007. Fluids in early stage hydrothermal alteration of high-sulfidation epithermal systems: A view from the Vulcano active hydrothermal system (Aeolian Island, Italy). Journal of Volcanology and Geothermal Research, 166, 76-90.
Browne, P. R. L. & Ellis, A. J. 1970. The Ohaaki-Broadlands hydrothermal area, New Zealand: Mineralogy and related geochemistry. American Journal of Science, 296, 97-131.
Bödvarsson, G. 1961. Physical characteristics of natural heat resources in Iceland. Jökull, 11, 29-38.
Casey, W. H. & Bunker, B. 1990. Leaching of mineral and glass surfaces during dissolution. Rev. Mineral., 23, 397-426.
Colman, S. M. 1982. Chemical weathering of basalts and andesites. U.S. Geol. Surv. Prof. Paper., 1246, 51 pp.
Craig, D. C. & Laughnan, F. C. 1964. Chemical and mineralogical transformations accompanying the weathering of basic volcanic rocks of New South Wales. Aust. J. Soil Res., 2, 218-234.
Eggelton, R. A., Foudoulish, C. & Farkevisser, D. 1987. Weathering of basalts: changes in rock chemistry and mineralogy. Clays Clay Miner., 35, 161-169.
Einarsson, P., Björnsson, S., Foulger, G., Stefánsson, R. & Skaftadóttir, T. 1981. Seismicity pattern in the South Iceland Seismic Zone. In: Earthquake Prediciton-An International Review. Washington, DC.: American Geophysical Union, 141-151.
Exley, R. A. 1980. Electron microprobe studies of Iceland research drilling project of high-temperature hydrothermal mineral chemistry. J. Geophys. Res., 6547-6557.
Franzson, H. 1983. The Svartsengi high-temperature field: subsurface geology and alteration. . Trans. Geotherm. Resour. Counc. , 7, 141-145.
Franzson, H. 1988. Nesjavellir, borehole geology and permeability in the reservoir. National Energy Authority Report, OS-88046/JHD-09, 58 pp.
Franzson, H. 1990. Geological model of the high temperature system and its surroundings. National Energy Authority Report O5-90050/JHD-08, 41 pp.
Giggenbach, W. F. 1980. Geothermal Gas Equilibria. Geochimica Et Cosmochimica Acta, 44, 2021-2032.
Giggenbach, W. F. 1981. Geothermal Mineral Equilibria. Geochimica Et Cosmochimica Acta, 45, 393-410.
45
Gudmundsson, B. T. & Arnórsson, S. 2005. Secondary mineral-fluid equilibria in the Krafla and Namafjall geothermal systems, Iceland. Applied Geochemistry, 20, 1607-1625.
Gunnarsson, B., Marsh, B. D. & Taylor, H. P. 1998. Generation of Icelandic rhyolites: silicic lavas from the Torfajokull central volcano. Journal of Volcanology and Geothermal Research, 83, 1-45.
Gunnarsson, I. & Arnorsson, S. 2000. Amorphous silica solubility and the thermodynamic properties of H4SiO4 in the range of 0 degrees to 350 degrees C at P-sat. Geochimica Et Cosmochimica Acta, 64, 2295-2307.
Gunnarsson, I., Arnórsson, S. & Jakobsson, S. 2005. Precipitation of poorly crystalline antigorite under hydrothermal conditions. Geochimica Et Cosmochimica Acta, 69, 2813-2828.
Hedenquist, J. W., Goff, F., Phillips, F. M., Elmore, D. & Stewart, M. K. 1990. Groundwater Dilution and Residence Times, and Constraints on Chloride Source, in the Mokai Geothermal System, New-Zealand, from Chemical, Stable Isotope, Tritium, and Cl-36 Data. Journal of Geophysical Research-Solid Earth and Planets, 95, 19365-19375.
Hill, P.G. 1990. A unified fundamental equation for the thermodynamic properties of H2O, J. Phys. Chem. Ref. Data. 19, 1233–1274.
Holland, T.J.B., Powell, R. 1998. An internally consistent thermodynamic data set for phases of petrological interest. J. Metamorph. Geol. 16, 309–343.
Ívarsson, G. 1992. Geology and petrochemistry of the Torfajokull central volcano in central south Iceland, in association with the Icelandic hot spot and rift zones. PhD, University of Hawaii.
Jakobsson, S. 1979. Petrology of recent basalts of the Eastern Volcanic Zone, Iceland. Acta Naturalia Islandica, 26, 1-103.
Jezek, P. A. & Noble, D. C. 1978. Natural hydration and ion exchange of obsidian: an elecron microprobe study. Am. Miner., 63, 266-273.
Johnson, J. W., Oelkers, E. H. & Helgeson, H. C. 1992. Supcrt92 - a Software Package for Calculating the Standard Molal Thermodynamic Properties of Minerals, Gases, Aqueous Species, and Reactions from 1-Bar to 5000-Bar and 0-Degrees-C to 1000-Degrees-C. Computers & Geosciences, 18, 899-947. Available online at: http://geopig3.la.asu.edu:8080/GEOPIG/pigopt1.html
Karakaya, N., Karakaya, M. C., Nalbantcilar, M. T. & Yavuz, F. 2007. Relation between spring-water chemistry and hydrothermal alteration in the Saplica volcanic rocks, Sebinkarahisar (Giresun, Turkey). Journal of Geochemical Exploration, 93, 35-46.
Klammer, D. 1997. Mass change during extreme acid-sulphate hydrothermal alteration of a Tertiary latite, Styria, Austria. Chemical Geology, 141, 33-48.

46
Knauss, K. G., Dibley, M. J., Bourcier, W. L. & Shaw, H. F. 2001. Ti(IV) hydrolysis constants derived from rutile solubility measurements made from 100 to 300 degrees C. Applied Geochemistry, 16, 1115-1128.
Kristmannsdóttir, H. 1976. Types of Clay Minerals in Hydrothermally Altered Basaltic Rocks, Reykjanes, Iceland. Jökull, 26, 30-39.
Kristmannsdóttir, H. 1979. Alteration of basaltic rock by hydrothermal activity at 100-300°C. In: International Clay Conference 1978. Elsevier, Amsterdam, 359-367.
Lonker, S. W., Franzson, H. & Kristmannsdóttir, H. 1993. Mineral-Fluid Interactions in the Reykjanes and Svartsengi Geothermal Systems, Iceland. American Journal of Science, 293, 605-670.
Mcgarvie, D. W. 1984. Torfajokull - a Volcano Dominated by Magma Mixing. Geology, 12, 685-688.
Mehegan, J. M., Robinsson, P. T. & Delaney, J. R. 1980. Secondary mineralization and hydrothermal alteration in the Reydarfjordur drill core, eastern Iceland. J. Geophys. Res., 87, 6511-6524.
Nesbitt, H. W. & Wilson, R. E. 1992. Recent Chemical-Weathering of Basalts. American Journal of Science, 292, 740-777.
Óskarsson, N., Sigvaldason, G. E. & Steinthórsson, S. 1982. A Dynamic-Model of Rift-Zone Petrogenesis and the Regional Petrology of Iceland. Journal of Petrology, 23, 28-74.
Paces, T. 1972. Chemical characteristics and equilibrium in natural water-felsic rock-CO2 system. Geochimica Et Cosmochimica Acta, 36, 217-240.
Parkhurst, D. L. & Appelo, C. a. J. 1999. User's guide to PHREEQC (version 2)-A computer program for speciation, batch-reaction, one-dimensional transport, and inverse geochemical calculations. Denver: U.S. Geological Survey Water-Resources Investigations Report 99-4259.
Pálmason, G., Arnórsson, S., Fridleifsson, I. B., Kristmannsdóttir, H., Saemundsson, K., Stefánsson, V., Steingrímsson, B., Tómasson, J. & Kristjánsson, L. 1979. The Icelandic Crust: evidence from drillhole data on struckture and processes. Deep Drilling Results in the Atlantic Ocean: Ocean Crust. Washington, DC.: American Geophysical Union, 43-65.
Ragnarsdóttir, K. V., Walther, J. V. & Arnórsson, S. 1984. Description and Interpretation of the Composition of Fluid and Alteration Mineralogy in the Geothermal System, at Svartsengi, Iceland. Geochimica Et Cosmochimica Acta, 48, 1535-1553.
Robie, R.A., Hemingway, B.S., Fisher, J.R. 1979. Thermodynamic properties of minerals and related substances at 298.15 K and 1 bar (105 Pascals) pressure and at higher temperatures. U.S. Geol. Surv. Bull. 1452, 456 pp.
Ross, C. R. & Smith, R. L. 1955. Water and other volatiles in volcanic glasses. Am. Miner., 40, 1071-1089.
47
Saemundsson, K. 1988. Notes on the geology of the Torfajökull area. Vördur a vegi. 164-180.
Saemundsson, K. & Fridleifsson, G. Ó. 2001. In Torfajökull. Reykjavik: Orkustofnun.
Schiffman, P. & Fridleifsson, G. Ó. 1991. The Smectite Chlorite Transition in Drillhole Nj-15, Nesjavellir Geothermal-Field, Iceland - Xrd, Bse and Electron-Microprobe Investigations. Journal of Metamorphic Geology, 9, 679-696.
Sigurdsson, F. & Einarsson, K. 1986. Groundwater resources in Iceland-availability and demand. Jökull, 38, 35-54.
Sigvaldason, G. E. 1959. Mineralogische Untersuchungen über Gesteinszersetzung durch postvulcanische Aktivität in Island. Contrib. Mineral. Petrol., 6, 405-426.
Smith, S. J., Stevens, R., Liu, S., Guangshe, L. & Navrotsky, A. 2009. Heat capacities and thermodynamic functions of TiO2 anatase and rutile; analysis of phase stability. Am. Miner., 94, 236-243.
Stefánsson, A. & Arnórsson, S. 2000. Feldspar saturation state in natural waters. Geochimica Et Cosmochimica Acta, 64, 2567-2584.
Stefánsson, A. & Arnórsson, S. 2002. Gas pressures and redox reactions in geothermal fluids in Iceland. Chemical Geology, 190, 251-271.
Stefánsson, A., Gíslason, S. R. & Arnórsson, S. 2001. Dissolution of primary minerals in natural waters - II. Mineral saturation state. Chemical Geology, 172, 251-276.
Stefánsson, A., Gunnarsson, I. & Giroud, N. 2007. New methods for the direct determination of dissolved inorganic, organic and total carbon in natural waters by Reagent-FreeTM Ion Chromatography and inductively coupled plasma atomic emission spectrometry. Analytica Chimica Acta, 582, 69-74.
Sveinbjörnsdóttir, A. E., Coleman, M. L. & Yardley, B. W. D. 1986. Origin and History of Hydrothermal Fluids of the Reykjanes and Krafla Geothermal Fields, Iceland - a Stable Isotope Study. Contributions to Mineralogy and Petrology, 94, 99-109.
Tómasson, J. & Franzson, H. 1992. Alteration and temperature distibution within the margin of the volcanic zone on the Reykjanes peninsula, SW-Iceland. Water Rock Interaction, Balkema, Rotterdam., 1467-1469.
Tómasson, J. & Kristmannsdóttir, H. 1972. High-Temperature Alteration Minerals and Thermal Brines, Reykjanes, Iceland. Contributions to Mineralogy and Petrology, 36, 123-134.
Tsong, I. S. T., Houser, C. A., Yusef, N. A., Meissier, R. F. & White, W. B. 1978. Obsidian profiles measured by sputter-induced optical emission. Science, 201, 339-341.
Viereck, L. G., Griffin, B. J. & Schminke, H. U. 1980. Volcanoclastic rocks in the Reydarfjordur drill hole, eastern Iceland. J. Geophys. Res., 87.

48
Walker, G. P. L. 1966. Acid volcanic rock in Iceland. Bull. Volcanol., 29, 375-402.
Walker, G. P. L. 1974. Eruptive mechanisms in Iceland. In: Geodynamics of Iceland and the North-Atlantic Area. Dordrecht: Reidel.
Wolff-Boenisch, D., Gíslason, S. R., Oelkers, E. H. & Putnis, C. V. 2004. The dissolution rates of natural glasses as a function of their composition at pH 4 and 10.6, and temperatures from 25 to 74 degrees C. Geochimica Et Cosmochimica Acta, 68, 4843-4858.
Yokoyama, T. & Banfield, J. F. 2002. Direct determinations of the rates of rhyolite dissolution and clay formation over 52,000 years and comparison with laboratory measurements. Geochimica Et Cosmochimica Acta, 66, 2665-2681.

49
Appendix A Trace elemental composition of the water samples from the Torfajökull geothermal field.

50
Element Ag As Au B Ba Be Bi Br Cd Ce Co Cr CsSample ppb ppb ppb ppb ppb ppb ppb ppb ppb ppb ppb ppb ppb06-3810 n.a.* 29.7 n.a. 1501.4 1.7 n.a. n.a. 951.7 n.a. n.a. <2 <5 n.a.06-3811 n.a. 11.5 n.a. 1128.9 21.5 n.a. n.a. 672.6 n.a. n.a. <2 <5 n.a.06-3812 n.a. <10 n.a. 733.4 45.1 n.a. n.a. 366.5 n.a. n.a. <2 <5 n.a.06-3813 n.a. 12.4 n.a. 1168.9 2.2 n.a. n.a. 727.0 n.a. n.a. <2 <5 n.a.06-3814 n.a. <10 n.a. 831.0 13.2 n.a. n.a. 514.3 n.a. n.a. <2 <5 n.a.06-3815 n.a. <10 n.a. 11.8 34.4 n.a. n.a. <100 n.a. n.a. <2 <5 n.a.06-3816 n.a. <10 n.a. 6.2 17.8 n.a. n.a. <100 n.a. n.a. <2 <5 n.a.06-3817 n.a. <10 n.a. 15.1 16.7 n.a. n.a. <100 n.a. n.a. <2 <5 n.a.06-3818 n.a. <10 n.a. 47.3 6.3 n.a. n.a. <100 n.a. n.a. <2 <5 n.a.06-3819 n.a. 177.4 n.a. 2486.5 0.6 n.a. n.a. 1318.0 n.a. n.a. <2 <5 n.a.06-3820 n.a. 111.8 n.a. 206.2 2.5 n.a. n.a. <100 n.a. n.a. <2 <5 n.a.06-3821 n.a. 66.2 n.a. 1671.3 26.5 n.a. n.a. 735.1 n.a. n.a. <2 <5 n.a.06-3822 n.a. <10 n.a. 27.7 1.2 n.a. n.a. 238.0 n.a. n.a. <2 <5 n.a.06-3823 n.a. <10 n.a. 11.0 2.4 n.a. n.a. 210.6 n.a. n.a. <2 <5 n.a.06-3824 n.a. <10 n.a. 25.4 58.6 n.a. n.a. <100 n.a. n.a. <2 <5 n.a.06-3825 n.a. <10 n.a. <3 33.3 n.a. n.a. <100 n.a. n.a. <2 <5 n.a.06-3826 n.a. <10 n.a. 57.3 1.7 n.a. n.a. <100 n.a. n.a. <2 <5 n.a.06-3827 n.a. <10 n.a. 8.0 9.4 n.a. n.a. <100 n.a. n.a. <2 <5 n.a.06-3828 n.a. <10 n.a. <3 2.3 n.a. n.a. <100 n.a. n.a. <2 <5 n.a.06-3829 n.a. <10 n.a. 8.6 7.4 n.a. n.a. <100 n.a. n.a. <2 <5 n.a.06-3830 n.a. <10 n.a. 557.9 18.0 n.a. n.a. 232.0 n.a. n.a. <2 <5 n.a.06-3831 n.a. n.a. n.a. n.a. n.a. n.a. n.a. n.a. n.a. n.a. n.a. n.a. n.a.06-3832 n.a. <10 n.a. 172.5 <0.5 n.a. n.a. <100 n.a. n.a. <2 <5 n.a.01-229 <0.05 17.1 <0.001 1320.0 22.7 1.2 <0.005 1130.0 0.0 0.0 0.4 0.0 1.001-230 <0.05 1.5 <0.001 265.0 0.6 1.0 <0.005 236.0 0.0 0.0 0.0 0.1 0.601-231 <0.05 0.4 <0.001 75.0 1.0 0.4 <0.005 71.5 0.0 <0.005 0.0 0.0 0.201-232 <0.05 6.5 <0.001 489.0 18.3 1.0 <0.005 224.0 0.0 0.0 0.0 <0.01 1.001-233 <0.05 6.1 <0.001 426.0 20.3 1.1 <0.005 228.0 0.0 0.0 0.0 <0.01 0.901-234 <0.05 4.9 <0.001 339.0 10.1 0.6 <0.005 175.0 0.0 0.0 0.0 0.0 0.601-235 <0.05 48.7 0.0 1260.0 2.9 0.9 <0.005 784.0 <0.002 1.1 <0.005 <0.01 17.401-236 <0.05 17.7 0.0 1050.0 1.2 3.4 <0.005 622.0 <0.002 0.1 0.0 0.0 11.001-237 <0.05 42.9 0.0 1330.0 1.6 1.3 <0.005 872.0 <0.002 0.2 0.0 0.0 17.601-238 <0.05 18.3 0.0 944.0 14.9 3.3 <0.005 575.0 0.0 1.0 0.0 0.0 9.801-239 <0.05 154.0 0.0 1940.0 0.6 0.4 <0.005 1030.0 <0.002 0.1 0.0 <0.01 16.601-240 <0.05 127.0 0.0 2140.0 0.8 0.2 <0.005 1080.0 <0.002 0.4 0.0 0.0 15.701-241 <0.05 252.0 0.0 4430.0 1.8 0.5 <0.005 2010.0 <0.002 0.7 0.1 0.1 13.401-242 <0.05 36.4 0.0 772.0 4.9 0.7 <0.005 2120.0 0.0 0.3 0.0 0.0 2.801-243 <0.05 1.5 <0.001 18.0 8.5 3.6 <0.005 18.5 0.1 16.8 0.2 0.0 0.101-244 <0.05 0.4 <0.001 111.0 17.9 4.5 <0.005 22.7 <0.002 0.7 0.0 0.0 1.001-245 <0.05 0.2 <0.001 90.0 29.6 13.7 <0.005 24.1 <0.002 0.3 0.0 0.0 0.701-246 <0.05 2.8 <0.001 170.0 0.7 0.3 <0.005 88.5 <0.002 0.0 <0.005 0.0 0.7
07-JB-01 0.016 1.2 0.0 68.0 2.6 1.3 0.0 dl 0.1 2.6 0.7 2.1 0.207-JB-02 n.a. dl** n.a. 22.0 35.8 n.a. n.a. 110.6 n.a. n.a. dl dl n.a.07-JB-03 n.a. dl n.a. 41.6 1.6 n.a. n.a. dl n.a. n.a. dl dl n.a.07-JB-04 0.016 1.0 0.0 83.0 2.1 0.8 0.0 dl 0.1 11.0 4.4 2.3 0.107-JB-05 0.003 0.2 0.0 34.6 16.1 1.0 <0.003 dl 0.3 100.7 5.3 0.3 0.007-JB-06 n.a. dl n.a. 28.3 16.9 n.a. n.a. dl n.a. n.a. dl dl n.a.07-JB-07 n.a. dl n.a. 24.8 10.6 n.a. n.a. 93.4 n.a. n.a. dl dl n.a.07-JB-08 n.a. dl n.a. 21.7 29.7 n.a. n.a. dl n.a. n.a. dl dl n.a.07-JB-09 n.a. dl n.a. 27.9 2.5 n.a. n.a. dl n.a. n.a. dl dl n.a.07-JB-10 n.a. dl n.a. 24.8 8.1 n.a. n.a. dl n.a. n.a. dl dl n.a.07-JB-11 n.a. dl n.a. 37.8 28.1 n.a. n.a. dl n.a. n.a. dl dl n.a.07-JB-12 n.a. dl n.a. 94.0 18.8 n.a. n.a. dl n.a. n.a. dl dl n.a.08-JB-13 0.016 0.8 0.0 87.0 16.8 0.2 0.0 dl 0.0 0.8 0.6 0.9 0.108-JB-14 n.a. dl n.a. dl dl n.a. n.a. dl n.a. n.a. dl dl n.a.08-JB-15 0.016 21.2 0.0 63.0 1.6 2.1 0.0 dl 0.5 2.4 25.1 12.6 0.408-JB-16 n.a. dl n.a. dl dl n.a. n.a. dl n.a. n.a. dl dl n.a.08-JB-17 n.a. dl n.a. dl dl n.a. n.a. dl n.a. n.a. dl dl n.a.08-JB-18 0.015 0.2 0.0 41.0 7.6 0.4 <0.003 dl 0.0 0.1 3.3 0.4 0.208-JB-19 n.a. dl n.a. dl dl n.a. n.a. dl n.a. n.a. dl dl n.a.08-JB-20 n.a. dl n.a. 1198.3 15.3 n.a. n.a. 569.3 n.a. n.a. dl dl n.a.08-JB-21 0.016 47.0 0.1 1765.0 2.4 1.2 <0.003 767.0 0.0 0.1 0.0 0.4 19.108-JB-22 n.a. dl n.a. 1215.0 3.9 n.a. n.a. 649.3 n.a. n.a. dl dl n.a.08-JB-23 n.a. dl n.a. 702.7 2.5 n.a. n.a. 370.0 n.a. n.a. dl dl n.a.08-JB-24 0.04 10.2 0.0 45.0 3.2 0.4 0.0 dl 0.0 9.0 0.4 5.1 0.809-JB-25 n.a. dl n.a. 429.2 20.1 n.a. n.a. dl n.a. n.a. n.a. dl n.a.09-JB-26 n.a. dl n.a. 127.3 7.8 n.a. n.a. 28.4 n.a. n.a. n.a. dl n.a.09-JB-27 n.a. dl n.a. 406.5 20.3 n.a. n.a. dl n.a. n.a. n.a. dl n.a.
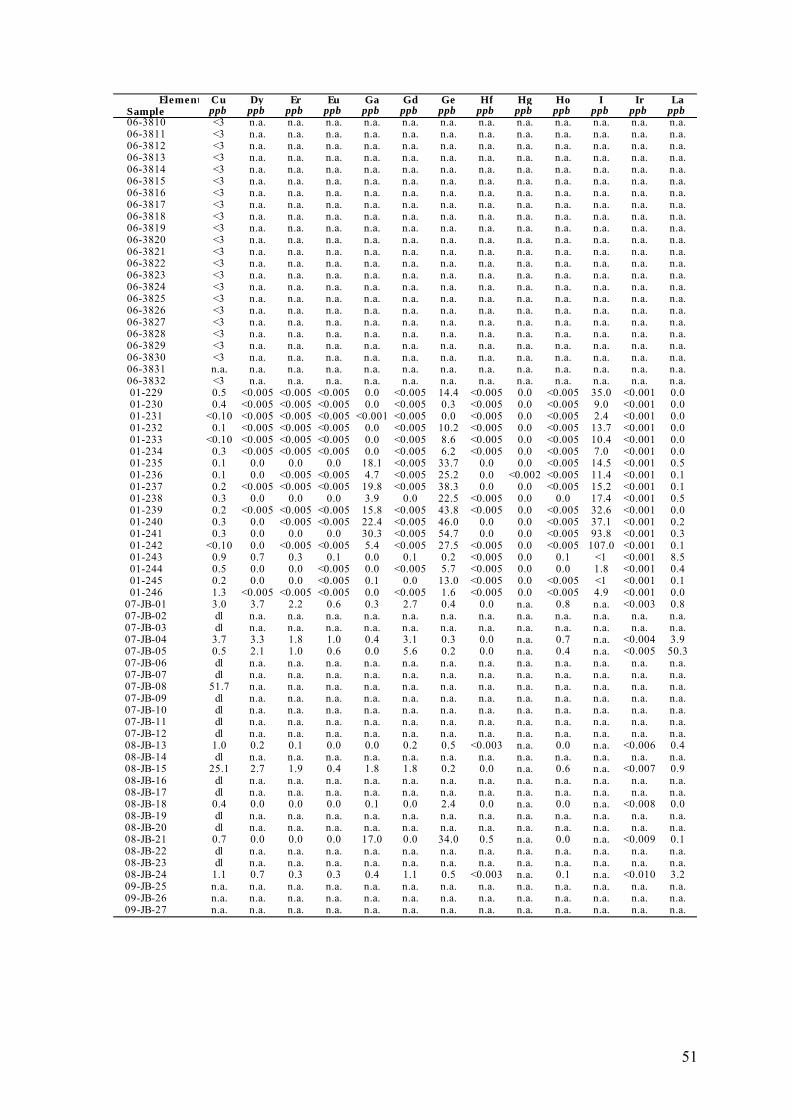
51
Element Cu Dy Er Eu Ga Gd Ge Hf Hg Ho I Ir LaSample ppb ppb ppb ppb ppb ppb ppb ppb ppb ppb ppb ppb ppb06-3810 <3 n.a. n.a. n.a. n.a. n.a. n.a. n.a. n.a. n.a. n.a. n.a. n.a.06-3811 <3 n.a. n.a. n.a. n.a. n.a. n.a. n.a. n.a. n.a. n.a. n.a. n.a.06-3812 <3 n.a. n.a. n.a. n.a. n.a. n.a. n.a. n.a. n.a. n.a. n.a. n.a.06-3813 <3 n.a. n.a. n.a. n.a. n.a. n.a. n.a. n.a. n.a. n.a. n.a. n.a.06-3814 <3 n.a. n.a. n.a. n.a. n.a. n.a. n.a. n.a. n.a. n.a. n.a. n.a.06-3815 <3 n.a. n.a. n.a. n.a. n.a. n.a. n.a. n.a. n.a. n.a. n.a. n.a.06-3816 <3 n.a. n.a. n.a. n.a. n.a. n.a. n.a. n.a. n.a. n.a. n.a. n.a.06-3817 <3 n.a. n.a. n.a. n.a. n.a. n.a. n.a. n.a. n.a. n.a. n.a. n.a.06-3818 <3 n.a. n.a. n.a. n.a. n.a. n.a. n.a. n.a. n.a. n.a. n.a. n.a.06-3819 <3 n.a. n.a. n.a. n.a. n.a. n.a. n.a. n.a. n.a. n.a. n.a. n.a.06-3820 <3 n.a. n.a. n.a. n.a. n.a. n.a. n.a. n.a. n.a. n.a. n.a. n.a.06-3821 <3 n.a. n.a. n.a. n.a. n.a. n.a. n.a. n.a. n.a. n.a. n.a. n.a.06-3822 <3 n.a. n.a. n.a. n.a. n.a. n.a. n.a. n.a. n.a. n.a. n.a. n.a.06-3823 <3 n.a. n.a. n.a. n.a. n.a. n.a. n.a. n.a. n.a. n.a. n.a. n.a.06-3824 <3 n.a. n.a. n.a. n.a. n.a. n.a. n.a. n.a. n.a. n.a. n.a. n.a.06-3825 <3 n.a. n.a. n.a. n.a. n.a. n.a. n.a. n.a. n.a. n.a. n.a. n.a.06-3826 <3 n.a. n.a. n.a. n.a. n.a. n.a. n.a. n.a. n.a. n.a. n.a. n.a.06-3827 <3 n.a. n.a. n.a. n.a. n.a. n.a. n.a. n.a. n.a. n.a. n.a. n.a.06-3828 <3 n.a. n.a. n.a. n.a. n.a. n.a. n.a. n.a. n.a. n.a. n.a. n.a.06-3829 <3 n.a. n.a. n.a. n.a. n.a. n.a. n.a. n.a. n.a. n.a. n.a. n.a.06-3830 <3 n.a. n.a. n.a. n.a. n.a. n.a. n.a. n.a. n.a. n.a. n.a. n.a.06-3831 n.a. n.a. n.a. n.a. n.a. n.a. n.a. n.a. n.a. n.a. n.a. n.a. n.a.06-3832 <3 n.a. n.a. n.a. n.a. n.a. n.a. n.a. n.a. n.a. n.a. n.a. n.a.01-229 0.5 <0.005 <0.005 <0.005 0.0 <0.005 14.4 <0.005 0.0 <0.005 35.0 <0.001 0.001-230 0.4 <0.005 <0.005 <0.005 0.0 <0.005 0.3 <0.005 0.0 <0.005 9.0 <0.001 0.001-231 <0.10 <0.005 <0.005 <0.005 <0.001 <0.005 0.0 <0.005 0.0 <0.005 2.4 <0.001 0.001-232 0.1 <0.005 <0.005 <0.005 0.0 <0.005 10.2 <0.005 0.0 <0.005 13.7 <0.001 0.001-233 <0.10 <0.005 <0.005 <0.005 0.0 <0.005 8.6 <0.005 0.0 <0.005 10.4 <0.001 0.001-234 0.3 <0.005 <0.005 <0.005 0.0 <0.005 6.2 <0.005 0.0 <0.005 7.0 <0.001 0.001-235 0.1 0.0 0.0 0.0 18.1 <0.005 33.7 0.0 0.0 <0.005 14.5 <0.001 0.501-236 0.1 0.0 <0.005 <0.005 4.7 <0.005 25.2 0.0 <0.002 <0.005 11.4 <0.001 0.101-237 0.2 <0.005 <0.005 <0.005 19.8 <0.005 38.3 0.0 0.0 <0.005 15.2 <0.001 0.101-238 0.3 0.0 0.0 0.0 3.9 0.0 22.5 <0.005 0.0 0.0 17.4 <0.001 0.501-239 0.2 <0.005 <0.005 <0.005 15.8 <0.005 43.8 <0.005 0.0 <0.005 32.6 <0.001 0.001-240 0.3 0.0 <0.005 <0.005 22.4 <0.005 46.0 0.0 0.0 <0.005 37.1 <0.001 0.201-241 0.3 0.0 0.0 0.0 30.3 <0.005 54.7 0.0 0.0 <0.005 93.8 <0.001 0.301-242 <0.10 0.0 <0.005 <0.005 5.4 <0.005 27.5 <0.005 0.0 <0.005 107.0 <0.001 0.101-243 0.9 0.7 0.3 0.1 0.0 0.1 0.2 <0.005 0.0 0.1 <1 <0.001 8.501-244 0.5 0.0 0.0 <0.005 0.0 <0.005 5.7 <0.005 0.0 0.0 1.8 <0.001 0.401-245 0.2 0.0 0.0 <0.005 0.1 0.0 13.0 <0.005 0.0 <0.005 <1 <0.001 0.101-246 1.3 <0.005 <0.005 <0.005 0.0 <0.005 1.6 <0.005 0.0 <0.005 4.9 <0.001 0.0
07-JB-01 3.0 3.7 2.2 0.6 0.3 2.7 0.4 0.0 n.a. 0.8 n.a. <0.003 0.807-JB-02 dl n.a. n.a. n.a. n.a. n.a. n.a. n.a. n.a. n.a. n.a. n.a. n.a.07-JB-03 dl n.a. n.a. n.a. n.a. n.a. n.a. n.a. n.a. n.a. n.a. n.a. n.a.07-JB-04 3.7 3.3 1.8 1.0 0.4 3.1 0.3 0.0 n.a. 0.7 n.a. <0.004 3.907-JB-05 0.5 2.1 1.0 0.6 0.0 5.6 0.2 0.0 n.a. 0.4 n.a. <0.005 50.307-JB-06 dl n.a. n.a. n.a. n.a. n.a. n.a. n.a. n.a. n.a. n.a. n.a. n.a.07-JB-07 dl n.a. n.a. n.a. n.a. n.a. n.a. n.a. n.a. n.a. n.a. n.a. n.a.07-JB-08 51.7 n.a. n.a. n.a. n.a. n.a. n.a. n.a. n.a. n.a. n.a. n.a. n.a.07-JB-09 dl n.a. n.a. n.a. n.a. n.a. n.a. n.a. n.a. n.a. n.a. n.a. n.a.07-JB-10 dl n.a. n.a. n.a. n.a. n.a. n.a. n.a. n.a. n.a. n.a. n.a. n.a.07-JB-11 dl n.a. n.a. n.a. n.a. n.a. n.a. n.a. n.a. n.a. n.a. n.a. n.a.07-JB-12 dl n.a. n.a. n.a. n.a. n.a. n.a. n.a. n.a. n.a. n.a. n.a. n.a.08-JB-13 1.0 0.2 0.1 0.0 0.0 0.2 0.5 <0.003 n.a. 0.0 n.a. <0.006 0.408-JB-14 dl n.a. n.a. n.a. n.a. n.a. n.a. n.a. n.a. n.a. n.a. n.a. n.a.08-JB-15 25.1 2.7 1.9 0.4 1.8 1.8 0.2 0.0 n.a. 0.6 n.a. <0.007 0.908-JB-16 dl n.a. n.a. n.a. n.a. n.a. n.a. n.a. n.a. n.a. n.a. n.a. n.a.08-JB-17 dl n.a. n.a. n.a. n.a. n.a. n.a. n.a. n.a. n.a. n.a. n.a. n.a.08-JB-18 0.4 0.0 0.0 0.0 0.1 0.0 2.4 0.0 n.a. 0.0 n.a. <0.008 0.008-JB-19 dl n.a. n.a. n.a. n.a. n.a. n.a. n.a. n.a. n.a. n.a. n.a. n.a.08-JB-20 dl n.a. n.a. n.a. n.a. n.a. n.a. n.a. n.a. n.a. n.a. n.a. n.a.08-JB-21 0.7 0.0 0.0 0.0 17.0 0.0 34.0 0.5 n.a. 0.0 n.a. <0.009 0.108-JB-22 dl n.a. n.a. n.a. n.a. n.a. n.a. n.a. n.a. n.a. n.a. n.a. n.a.08-JB-23 dl n.a. n.a. n.a. n.a. n.a. n.a. n.a. n.a. n.a. n.a. n.a. n.a.08-JB-24 1.1 0.7 0.3 0.3 0.4 1.1 0.5 <0.003 n.a. 0.1 n.a. <0.010 3.209-JB-25 n.a. n.a. n.a. n.a. n.a. n.a. n.a. n.a. n.a. n.a. n.a. n.a. n.a.09-JB-26 n.a. n.a. n.a. n.a. n.a. n.a. n.a. n.a. n.a. n.a. n.a. n.a. n.a.09-JB-27 n.a. n.a. n.a. n.a. n.a. n.a. n.a. n.a. n.a. n.a. n.a. n.a. n.a.

52
Element Li Lu Mn Mo Nb Nd Ni O s P Pb Pd Pr PtSample ppb ppb ppb ppb ppb ppb ppb ppb ppb ppb ppb06-3810 254.1 n.a. 1.8 <10 n.a. n.a. <5 n.a. <10 <10 n.a. n.a. n.a.06-3811 145.8 n.a. 147.0 <10 n.a. n.a. <5 n.a. <10 <10 n.a. n.a. n.a.06-3812 89.7 n.a. 695.3 <10 n.a. n.a. <5 n.a. <10 <10 n.a. n.a. n.a.06-3813 243.9 n.a. 7.9 <10 n.a. n.a. <5 n.a. 20.5 <10 n.a. n.a. n.a.06-3814 146.2 n.a. 311.1 <10 n.a. n.a. <5 n.a. <10 <10 n.a. n.a. n.a.06-3815 <3 n.a. 144.2 <10 n.a. n.a. 1003.7 n.a. 25.5 <10 n.a. n.a. n.a.06-3816 <3 n.a. 105.9 <10 n.a. n.a. <5 n.a. 74.6 <10 n.a. n.a. n.a.06-3817 <3 n.a. 493.4 <10 n.a. n.a. 547.9 n.a. 47.7 <10 n.a. n.a. n.a.06-3818 <3 n.a. 154.9 <10 n.a. n.a. 958.3 n.a. 410.7 <10 n.a. n.a. n.a.06-3819 618.6 n.a. <1 <10 n.a. n.a. <5 n.a. <10 <10 n.a. n.a. n.a.06-3820 20.9 n.a. 282.1 <10 n.a. n.a. <5 n.a. 156.0 <10 n.a. n.a. n.a.06-3821 384.6 n.a. 243.8 <10 n.a. n.a. <5 n.a. <10 <10 n.a. n.a. n.a.06-3822 95.6 n.a. 5.2 <10 n.a. n.a. <5 n.a. <10 <10 n.a. n.a. n.a.06-3823 208.2 n.a. 86.3 <10 n.a. n.a. <5 n.a. <10 <10 n.a. n.a. n.a.06-3824 38.0 n.a. 322.6 <10 n.a. n.a. <5 n.a. 21.3 <10 n.a. n.a. n.a.06-3825 5.5 n.a. 360.4 <10 n.a. n.a. <5 n.a. 18.0 <10 n.a. n.a. n.a.06-3826 3.3 n.a. 391.2 <10 n.a. n.a. <5 n.a. 80.1 <10 n.a. n.a. n.a.06-3827 18.7 n.a. 14.7 <10 n.a. n.a. <5 n.a. <10 <10 n.a. n.a. n.a.06-3828 3.1 n.a. 542.0 <10 n.a. n.a. <5 n.a. 94.2 <10 n.a. n.a. n.a.06-3829 4.2 n.a. 417.4 <10 n.a. n.a. <5 n.a. 29.4 <10 n.a. n.a. n.a.06-3830 61.9 n.a. 620.1 <10 n.a. n.a. <5 n.a. 265.3 <10 n.a. n.a. n.a.06-3831 n.a. n.a. n.a. n.a. n.a. n.a. n.a. n.a. n.a. n.a. n.a. n.a. n.a.06-3832 46.2 n.a. 1155.2 <10 n.a. n.a. <5 n.a. 26.0 <10 n.a. n.a. n.a.01-229 n.a. <0.005 659.0 13.4 0.0 <0.005 0.2 n.a. 349.0 0.1 <0.001 <0.005 n.a.01-230 n.a. <0.005 0.9 7.3 <0.001 <0.005' 0.3 n.a. 116.0 0.2 <0.001 <0.005 n.a.01-231 n.a. <0.005 0.4 4.8 <0.001 0.0 0.1 n.a. 30.1 0.1 <0.001 <0.005 n.a.01-232 n.a. <0.005 549.0 4.5 0.0 0.0 0.1 n.a. 274.0 0.0 <0.001 <0.005 n.a.01-233 n.a. <0.005 603.0 4.2 0.0 <0.005 0.1 n.a. 291.0 0.0 <0.001 <0.005 n.a.01-234 n.a. <0.005 422.0 3.2 0.0 0.0 0.1 n.a. 258.0 0.8 <0.001 <0.005 n.a.01-235 n.a. <0.005 6.7 0.4 0.0 0.4 <0.05 n.a. 2.5 0.0 <0.001 0.1 n.a.01-236 n.a. <0.005 1.8 0.2 0.0 0.1 <0.05 n.a. 2.7 0.1 <0.001 0.0 n.a.01-237 n.a. <0.005 6.6 0.5 0.0 0.1 <0.05 n.a. 2.5 0.2 <0.001 0.0 n.a.01-238 n.a. <0.005 163.0 0.2 0.0 0.4 0.2 n.a. 4.3 0.1 <0.001 0.1 n.a.01-239 n.a. <0.005 3.6 0.7 0.0 0.0 0.1 n.a. 1.1 0.0 <0.001 0.0 n.a.01-240 n.a. <0.005 1.9 0.5 0.0 0.1 0.1 n.a. 3.2 0.1 <0.001 0.0 n.a.01-241 n.a. <0.005 6.3 5.8 0.1 0.3 0.1 n.a. 7.4 0.4 <0.001 0.1 n.a.01-242 n.a. <0.005 7.6 0.2 0.0 0.1 <0.05 n.a. <1.0 0.0 0.0 0.0 n.a.01-243 n.a. 0.0 2230.0 0.8 0.0 5.9 0.3 n.a. 2.9 11.4 0.0 1.8 n.a.01-244 n.a. <0.005 109.0 2.0 0.0 0.3 0.1 n.a. 6.7 0.3 <0.001 0.1 n.a.01-245 n.a. <0.005 214.0 <0.05 0.6 0.1 <0.05 n.a. 5.2 0.7 <0.001 0.0 n.a.01-246 n.a. <0.005 18.3 7.1 <0.001 0.0 <0.05 n.a. 99.9 1.1 <0.001 <0.005 n.a.
07-JB-01 9.5 n.a. 550.0 0.1 0.0 3.6 1.4 0.1 54.8 0.6 0.4 0.5 0.007-JB-02 dl n.a. 200.2 n.a. n.a. n.a. dl n.a. dl dl n.a. n.a. n.a.07-JB-03 dl n.a. 356.7 n.a. n.a. n.a. dl n.a. dl dl n.a. n.a. n.a.07-JB-04 7.3 n.a. 660.0 0.1 0.0 9.9 4.4 0.1 77.0 0.3 0.4 1.8 0.007-JB-05 2.0 n.a. 115.0 0.0 0.0 43.8 109.0 0.0 6.7 0.5 0.3 11.2 0.007-JB-06 dl n.a. 257.2 n.a. n.a. n.a. dl n.a. 52.5 dl n.a. n.a. n.a.07-JB-07 dl n.a. 65.1 n.a. n.a. n.a. dl n.a. 372.7 dl n.a. n.a. n.a.07-JB-08 dl n.a. 251.5 n.a. n.a. n.a. 9.3 n.a. 193.6 26.1 n.a. n.a. n.a.07-JB-09 dl n.a. 46.2 n.a. n.a. n.a. dl n.a. dl dl n.a. n.a. n.a.07-JB-10 dl n.a. 114.5 n.a. n.a. n.a. dl n.a. dl dl n.a. n.a. n.a.07-JB-11 dl n.a. 412.4 n.a. n.a. n.a. dl n.a. 52.8 dl n.a. n.a. n.a.07-JB-12 dl n.a. 484.6 n.a. n.a. n.a. dl n.a. 243.6 dl n.a. n.a. n.a.08-JB-13 10.7 n.a. 1740.0 0.1 0.0 0.6 1.0 0.0 184.0 0.1 0.1 0.1 0.008-JB-14 dl n.a. 222.8 n.a. n.a. n.a. dl n.a. dl dl n.a. n.a. n.a.08-JB-15 18.5 n.a. 470.0 0.2 0.3 3.0 23.3 0.0 780.0 0.2 0.6 0.5 0.008-JB-16 dl n.a. 238.2 n.a. n.a. n.a. dl n.a. dl dl n.a. n.a. n.a.08-JB-17 dl n.a. 85.8 n.a. n.a. n.a. dl n.a. dl dl n.a. n.a. n.a.08-JB-18 4.1 n.a. 230.0 0.1 0.0 0.0 3.9 0.1 169.0 0.0 0.1 0.0 0.008-JB-19 dl n.a. 417.3 n.a. n.a. n.a. dl n.a. 214.5 dl n.a. n.a. n.a.08-JB-20 163.4 n.a. 168.2 n.a. n.a. n.a. dl n.a. dl dl n.a. n.a. n.a.08-JB-21 271.0 n.a. 2.7 0.7 0.1 0.1 0.1 0.0 3.0 0.4 0.1 0.0 0.008-JB-22 311.4 n.a. 51.5 n.a. n.a. n.a. dl n.a. dl dl n.a. n.a. n.a.08-JB-23 152.7 n.a. 47.6 n.a. n.a. n.a. dl n.a. dl dl n.a. n.a. n.a.08-JB-24 9.7 n.a. 44.0 0.2 0.0 6.3 0.6 0.2 44.0 0.4 0.1 1.3 0.009-JB-25 76.1 n.a. 10554 2.4 n.a. n.a. n.a. n.a. 43.8 n.a. n.a. n.a. n.a.09-JB-26 11.6 n.a. 2551.2 2.1 n.a. n.a. n.a. n.a. 10.2 n.a. n.a. n.a. n.a.09-JB-27 74.2 n.a. 10313 2.1 n.a. n.a. n.a. n.a. 21.3 n.a. n.a. n.a. n.a.
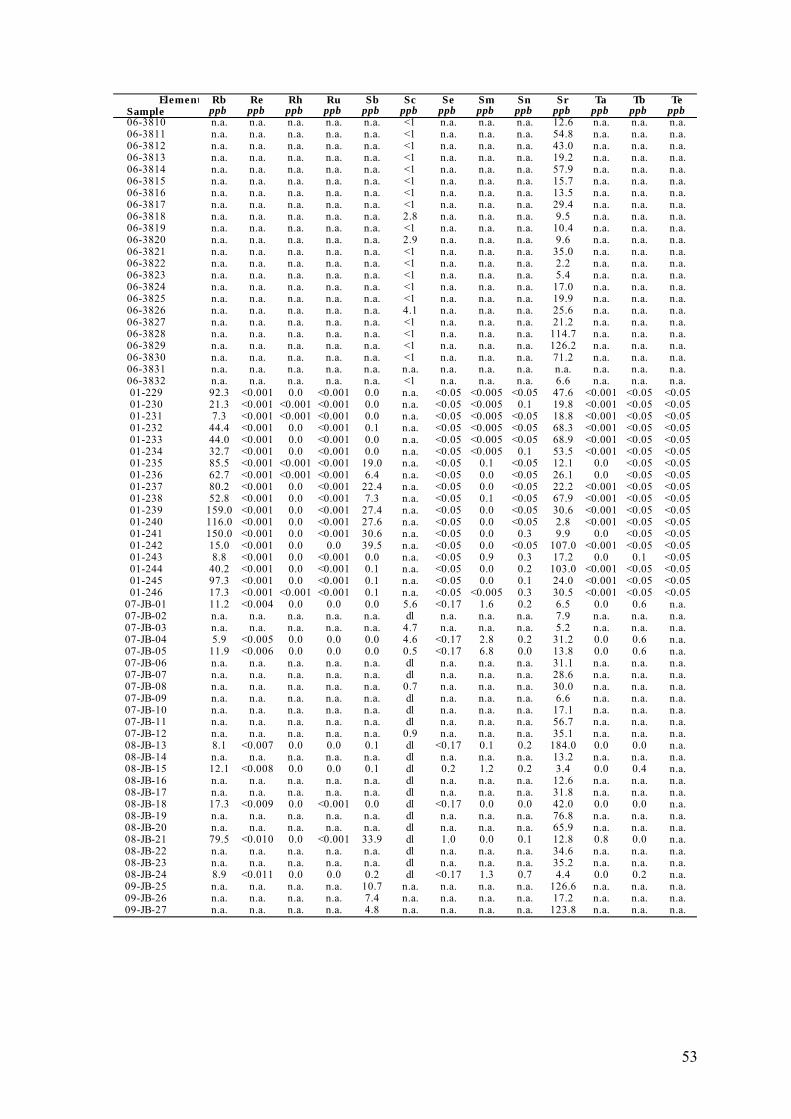
53
Element Rb Re Rh Ru Sb Sc Se Sm Sn Sr Ta Tb TeSample ppb ppb ppb ppb ppb ppb ppb ppb ppb ppb ppb ppb ppb06-3810 n.a. n.a. n.a. n.a. n.a. <1 n.a. n.a. n.a. 12.6 n.a. n.a. n.a.06-3811 n.a. n.a. n.a. n.a. n.a. <1 n.a. n.a. n.a. 54.8 n.a. n.a. n.a.06-3812 n.a. n.a. n.a. n.a. n.a. <1 n.a. n.a. n.a. 43.0 n.a. n.a. n.a.06-3813 n.a. n.a. n.a. n.a. n.a. <1 n.a. n.a. n.a. 19.2 n.a. n.a. n.a.06-3814 n.a. n.a. n.a. n.a. n.a. <1 n.a. n.a. n.a. 57.9 n.a. n.a. n.a.06-3815 n.a. n.a. n.a. n.a. n.a. <1 n.a. n.a. n.a. 15.7 n.a. n.a. n.a.06-3816 n.a. n.a. n.a. n.a. n.a. <1 n.a. n.a. n.a. 13.5 n.a. n.a. n.a.06-3817 n.a. n.a. n.a. n.a. n.a. <1 n.a. n.a. n.a. 29.4 n.a. n.a. n.a.06-3818 n.a. n.a. n.a. n.a. n.a. 2.8 n.a. n.a. n.a. 9.5 n.a. n.a. n.a.06-3819 n.a. n.a. n.a. n.a. n.a. <1 n.a. n.a. n.a. 10.4 n.a. n.a. n.a.06-3820 n.a. n.a. n.a. n.a. n.a. 2.9 n.a. n.a. n.a. 9.6 n.a. n.a. n.a.06-3821 n.a. n.a. n.a. n.a. n.a. <1 n.a. n.a. n.a. 35.0 n.a. n.a. n.a.06-3822 n.a. n.a. n.a. n.a. n.a. <1 n.a. n.a. n.a. 2.2 n.a. n.a. n.a.06-3823 n.a. n.a. n.a. n.a. n.a. <1 n.a. n.a. n.a. 5.4 n.a. n.a. n.a.06-3824 n.a. n.a. n.a. n.a. n.a. <1 n.a. n.a. n.a. 17.0 n.a. n.a. n.a.06-3825 n.a. n.a. n.a. n.a. n.a. <1 n.a. n.a. n.a. 19.9 n.a. n.a. n.a.06-3826 n.a. n.a. n.a. n.a. n.a. 4.1 n.a. n.a. n.a. 25.6 n.a. n.a. n.a.06-3827 n.a. n.a. n.a. n.a. n.a. <1 n.a. n.a. n.a. 21.2 n.a. n.a. n.a.06-3828 n.a. n.a. n.a. n.a. n.a. <1 n.a. n.a. n.a. 114.7 n.a. n.a. n.a.06-3829 n.a. n.a. n.a. n.a. n.a. <1 n.a. n.a. n.a. 126.2 n.a. n.a. n.a.06-3830 n.a. n.a. n.a. n.a. n.a. <1 n.a. n.a. n.a. 71.2 n.a. n.a. n.a.06-3831 n.a. n.a. n.a. n.a. n.a. n.a. n.a. n.a. n.a. n.a. n.a. n.a. n.a.06-3832 n.a. n.a. n.a. n.a. n.a. <1 n.a. n.a. n.a. 6.6 n.a. n.a. n.a.01-229 92.3 <0.001 0.0 <0.001 0.0 n.a. <0.05 <0.005 <0.05 47.6 <0.001 <0.05 <0.0501-230 21.3 <0.001 <0.001 <0.001 0.0 n.a. <0.05 <0.005 0.1 19.8 <0.001 <0.05 <0.0501-231 7.3 <0.001 <0.001 <0.001 0.0 n.a. <0.05 <0.005 <0.05 18.8 <0.001 <0.05 <0.0501-232 44.4 <0.001 0.0 <0.001 0.1 n.a. <0.05 <0.005 <0.05 68.3 <0.001 <0.05 <0.0501-233 44.0 <0.001 0.0 <0.001 0.0 n.a. <0.05 <0.005 <0.05 68.9 <0.001 <0.05 <0.0501-234 32.7 <0.001 0.0 <0.001 0.0 n.a. <0.05 <0.005 0.1 53.5 <0.001 <0.05 <0.0501-235 85.5 <0.001 <0.001 <0.001 19.0 n.a. <0.05 0.1 <0.05 12.1 0.0 <0.05 <0.0501-236 62.7 <0.001 <0.001 <0.001 6.4 n.a. <0.05 0.0 <0.05 26.1 0.0 <0.05 <0.0501-237 80.2 <0.001 0.0 <0.001 22.4 n.a. <0.05 0.0 <0.05 22.2 <0.001 <0.05 <0.0501-238 52.8 <0.001 0.0 <0.001 7.3 n.a. <0.05 0.1 <0.05 67.9 <0.001 <0.05 <0.0501-239 159.0 <0.001 0.0 <0.001 27.4 n.a. <0.05 0.0 <0.05 30.6 <0.001 <0.05 <0.0501-240 116.0 <0.001 0.0 <0.001 27.6 n.a. <0.05 0.0 <0.05 2.8 <0.001 <0.05 <0.0501-241 150.0 <0.001 0.0 <0.001 30.6 n.a. <0.05 0.0 0.3 9.9 0.0 <0.05 <0.0501-242 15.0 <0.001 0.0 0.0 39.5 n.a. <0.05 0.0 <0.05 107.0 <0.001 <0.05 <0.0501-243 8.8 <0.001 0.0 <0.001 0.0 n.a. <0.05 0.9 0.3 17.2 0.0 0.1 <0.0501-244 40.2 <0.001 0.0 <0.001 0.1 n.a. <0.05 0.0 0.2 103.0 <0.001 <0.05 <0.0501-245 97.3 <0.001 0.0 <0.001 0.1 n.a. <0.05 0.0 0.1 24.0 <0.001 <0.05 <0.0501-246 17.3 <0.001 <0.001 <0.001 0.1 n.a. <0.05 <0.005 0.3 30.5 <0.001 <0.05 <0.05
07-JB-01 11.2 <0.004 0.0 0.0 0.0 5.6 <0.17 1.6 0.2 6.5 0.0 0.6 n.a.07-JB-02 n.a. n.a. n.a. n.a. n.a. dl n.a. n.a. n.a. 7.9 n.a. n.a. n.a.07-JB-03 n.a. n.a. n.a. n.a. n.a. 4.7 n.a. n.a. n.a. 5.2 n.a. n.a. n.a.07-JB-04 5.9 <0.005 0.0 0.0 0.0 4.6 <0.17 2.8 0.2 31.2 0.0 0.6 n.a.07-JB-05 11.9 <0.006 0.0 0.0 0.0 0.5 <0.17 6.8 0.0 13.8 0.0 0.6 n.a.07-JB-06 n.a. n.a. n.a. n.a. n.a. dl n.a. n.a. n.a. 31.1 n.a. n.a. n.a.07-JB-07 n.a. n.a. n.a. n.a. n.a. dl n.a. n.a. n.a. 28.6 n.a. n.a. n.a.07-JB-08 n.a. n.a. n.a. n.a. n.a. 0.7 n.a. n.a. n.a. 30.0 n.a. n.a. n.a.07-JB-09 n.a. n.a. n.a. n.a. n.a. dl n.a. n.a. n.a. 6.6 n.a. n.a. n.a.07-JB-10 n.a. n.a. n.a. n.a. n.a. dl n.a. n.a. n.a. 17.1 n.a. n.a. n.a.07-JB-11 n.a. n.a. n.a. n.a. n.a. dl n.a. n.a. n.a. 56.7 n.a. n.a. n.a.07-JB-12 n.a. n.a. n.a. n.a. n.a. 0.9 n.a. n.a. n.a. 35.1 n.a. n.a. n.a.08-JB-13 8.1 <0.007 0.0 0.0 0.1 dl <0.17 0.1 0.2 184.0 0.0 0.0 n.a.08-JB-14 n.a. n.a. n.a. n.a. n.a. dl n.a. n.a. n.a. 13.2 n.a. n.a. n.a.08-JB-15 12.1 <0.008 0.0 0.0 0.1 dl 0.2 1.2 0.2 3.4 0.0 0.4 n.a.08-JB-16 n.a. n.a. n.a. n.a. n.a. dl n.a. n.a. n.a. 12.6 n.a. n.a. n.a.08-JB-17 n.a. n.a. n.a. n.a. n.a. dl n.a. n.a. n.a. 31.8 n.a. n.a. n.a.08-JB-18 17.3 <0.009 0.0 <0.001 0.0 dl <0.17 0.0 0.0 42.0 0.0 0.0 n.a.08-JB-19 n.a. n.a. n.a. n.a. n.a. dl n.a. n.a. n.a. 76.8 n.a. n.a. n.a.08-JB-20 n.a. n.a. n.a. n.a. n.a. dl n.a. n.a. n.a. 65.9 n.a. n.a. n.a.08-JB-21 79.5 <0.010 0.0 <0.001 33.9 dl 1.0 0.0 0.1 12.8 0.8 0.0 n.a.08-JB-22 n.a. n.a. n.a. n.a. n.a. dl n.a. n.a. n.a. 34.6 n.a. n.a. n.a.08-JB-23 n.a. n.a. n.a. n.a. n.a. dl n.a. n.a. n.a. 35.2 n.a. n.a. n.a.08-JB-24 8.9 <0.011 0.0 0.0 0.2 dl <0.17 1.3 0.7 4.4 0.0 0.2 n.a.09-JB-25 n.a. n.a. n.a. n.a. 10.7 n.a. n.a. n.a. n.a. 126.6 n.a. n.a. n.a.09-JB-26 n.a. n.a. n.a. n.a. 7.4 n.a. n.a. n.a. n.a. 17.2 n.a. n.a. n.a.09-JB-27 n.a. n.a. n.a. n.a. 4.8 n.a. n.a. n.a. n.a. 123.8 n.a. n.a. n.a.

54
Element Th Ti Tl Tm U V W Y Yb Zn ZrSample ppb ppb ppb ppb ppb ppb ppb ppb ppb ppb ppb06-3810 n.a. <1 n.a. n.a. n.a. <5 132.6 <0.5 n.a. 1.4 n.a.06-3811 n.a. 6.8 n.a. n.a. n.a. <5 66.6 <0.5 n.a. 13.1 n.a.06-3812 n.a. 3.4 n.a. n.a. n.a. <5 <20 8.0 n.a. 457.5 n.a.06-3813 n.a. <1 n.a. n.a. n.a. <5 64.9 <0.5 n.a. 1.2 n.a.06-3814 n.a. <1 n.a. n.a. n.a. <5 45.6 <0.5 n.a. <1 n.a.06-3815 n.a. <1 n.a. n.a. n.a. <5 <20 4.1 n.a. 142.8 n.a.06-3816 n.a. <1 n.a. n.a. n.a. 7.5 <20 2.6 n.a. 80.4 n.a.06-3817 n.a. <1 n.a. n.a. n.a. <5 <20 2.7 n.a. 39.1 n.a.06-3818 n.a. <1 n.a. n.a. n.a. 98.2 <20 9.5 n.a. 54.8 n.a.06-3819 n.a. <1 n.a. n.a. n.a. <5 140.5 <0.5 n.a. 4.6 n.a.06-3820 n.a. <1 n.a. n.a. n.a. 74.7 <20 27.9 n.a. 136.5 n.a.06-3821 n.a. <1 n.a. n.a. n.a. <5 179.8 0.7 n.a. 14.2 n.a.06-3822 n.a. <1 n.a. n.a. n.a. <5 <20 <0.5 n.a. 1.5 n.a.06-3823 n.a. <1 n.a. n.a. n.a. <5 <20 <0.5 n.a. 3.3 n.a.06-3824 n.a. <1 n.a. n.a. n.a. <5 <20 3.8 n.a. 16.2 n.a.06-3825 n.a. <1 n.a. n.a. n.a. <5 <20 2.8 n.a. 17.7 n.a.06-3826 n.a. <1 n.a. n.a. n.a. 40.4 <20 7.7 n.a. 44.1 n.a.06-3827 n.a. <1 n.a. n.a. n.a. <5 52.2 <0.5 n.a. <1 n.a.06-3828 n.a. <1 n.a. n.a. n.a. <5 <20 <0.5 n.a. <1 n.a.06-3829 n.a. <1 n.a. n.a. n.a. <5 <20 <0.5 n.a. 2.7 n.a.06-3830 n.a. <1 n.a. n.a. n.a. <5 <20 <0.5 n.a. 2.8 n.a.06-3831 n.a. n.a. n.a. n.a. n.a. n.a. n.a. n.a. n.a. n.a. n.a.06-3832 n.a. <1 n.a. n.a. n.a. 202.4 <20 34.8 n.a. 210.2 n.a.01-229 <0.02 1.3 0.0 <0.005 0.1 0.4 1.2 <0,005 <0.005 3.9 0.101-230 <0.02 0.2 <0.03 <0.005 0.0 3.5 <0.05 0.0 <0.005 7.4 0.001-231 <0.02 0.0 <0.03 <0.005 0.0 1.1 <0.05 0.0 <0.005 10.7 <0.0301-232 <0.02 0.1 0.0 <0.005 0.0 0.2 1.5 0.0 <0.005 1.5 <0.0301-233 <0.02 0.0 0.0 <0.005 0.0 0.0 1.3 0.0 <0.005 1.1 <0.0301-234 <0.02 0.6 <0.03 <0.005 0.0 0.2 0.7 0.0 <0.005 0.8 <0.0301-235 <0.02 1.6 <0.03 <0.005 0.0 0.1 55.8 0.1 <0.005 0.7 0.301-236 <0.02 1.9 <0.03 <0.005 0.0 0.2 40.3 0.0 <0.005 0.3 0.401-237 <0.02 0.5 <0.03 <0.005 0.0 0.1 66.8 0.0 <0.005 0.9 0.101-238 <0.02 0.9 <0.03 <0.005 0.0 0.1 34.5 0.2 0.0 9.0 0.101-239 <0.02 0.4 <0.03 <0.005 <0.0005 0.9 84.7 0.0 <0.005 0.5 0.101-240 <0.02 4.4 <0.03 <0.005 0.0 0.4 82.6 0.0 <0.005 0.9 0.201-241 0.0 19.0 <0.03 <0.005 0.0 2.9 88.0 0.1 0.0 1.0 0.601-242 <0.02 3.3 <0.03 <0.005 0.0 0.1 9.6 0.0 <0.005 0.6 0.101-243 <0.02 2.8 <0.03 0.0 0.0 0.1 0.2 5.3 0.2 698.0 0.101-244 <0.02 0.7 <0.03 <0.005 0.0 0.0 1.3 0.3 0.0 2.5 0.101-245 <0.02 0.4 <0.03 <0.005 0.0 0.0 6.2 0.2 0.0 0.5 0.101-246 <0.02 0.2 <0.03 <0.005 0.0 0.9 0.2 0.0 <0.005 3.3 <0.03
07-JB-01 0.0 4.2 0.0 0.3 0.1 36.0 0.0 20.3 1.9 378.0 0.007-JB-02 n.a. dl n.a. n.a. n.a. dl dl 2.0 n.a. 50.7 n.a.07-JB-03 n.a. dl n.a. n.a. n.a. 0.0 dl 12.4 n.a. 139.7 n.a.07-JB-04 0.0 5.3 0.0 0.3 0.4 35.6 0.0 17.3 1.5 62.0 0.107-JB-05 0.0 1.7 0.0 0.1 0.4 1.1 0.0 11.2 0.6 118.0 0.007-JB-06 n.a. dl n.a. n.a. n.a. dl dl 1.2 n.a. 11.8 n.a.07-JB-07 n.a. dl n.a. n.a. n.a. dl dl dl n.a. 10.7 n.a.07-JB-08 n.a. dl n.a. n.a. n.a. 21.2 dl 8.3 n.a. 1506.0 n.a.07-JB-09 n.a. dl n.a. n.a. n.a. dl dl dl n.a. 48.8 n.a.07-JB-10 n.a. dl n.a. n.a. n.a. dl dl 3.7 n.a. 14.8 n.a.07-JB-11 n.a. dl n.a. n.a. n.a. dl dl 3.8 n.a. 3.0 n.a.07-JB-12 n.a. dl n.a. n.a. n.a. 69.3 dl 11.6 n.a. 5.2 n.a.08-JB-13 <0.004 0.5 0.0 0.0 <0.005 1.7 0.0 1.0 0.0 14.3 0.008-JB-14 n.a. dl n.a. n.a. n.a. dl dl 4.5 n.a. 452.9 n.a.08-JB-15 0.1 100.0 0.1 0.3 0.5 187.0 0.0 20.9 1.8 450.0 1.008-JB-16 n.a. dl n.a. n.a. n.a. dl dl dl n.a. 2.8 n.a.08-JB-17 n.a. dl n.a. n.a. n.a. dl dl dl n.a. 4.3 n.a.08-JB-18 <0.004 1.0 0.0 0.0 0.0 0.8 0.2 0.1 0.0 5.5 0.008-JB-19 n.a. dl n.a. n.a. n.a. dl dl 25.2 n.a. dl n.a.08-JB-20 n.a. dl n.a. n.a. n.a. dl dl dl n.a. dl n.a.08-JB-21 <0.004 0.8 0.0 0.0 <0.005 0.1 47.3 0.0 0.0 2.1 1.408-JB-22 n.a. dl n.a. n.a. n.a. dl dl dl n.a. dl n.a.08-JB-23 n.a. dl n.a. n.a. n.a. dl dl dl n.a. dl n.a.08-JB-24 0.0 4.1 0.0 0.0 0.1 8.9 0.1 2.7 0.2 33.0 0.009-JB-25 n.a. dl n.a. n.a. n.a. dl dl n.a. n.a. n.a. n.a.09-JB-26 n.a. 0.5 n.a. n.a. n.a. dl dl n.a. n.a. n.a. n.a.09-JB-27 n.a. 0.1 n.a. n.a. n.a. dl dl n.a. n.a. n.a. n.a.

55
Appendix B Apparent Gibbs free energy of selected minerals.
?GT,papp
[J/mol]
t /°C p /bar clinozoisite epidote wairakite clinochlore prehnite quartz calcite albite low microcline pyrite pyrrhotite
0.01 1 -6495817 -6068585 -6211081 -8253631 -5818160 -855469 -1126584 -3708506 -3744406 -158843 -99847
25 1 -6502980 -6076410 -6220050 -8263350 -5825130 -856460 -1128810 -3713474 -3749546 -160100 -101300
50 1 -6510861 -6084982 -6229824 -8274153 -5832794 -857543 -1131207 -3718872 -3755112 -161487 -102859
75 1 -6519439 -6094285 -6240378 -8286024 -5841133 -858716 -1133771 -3724688 -3761092 -162999 -104516
100 1.013 -6528691 -6104301 -6251689 -8298940 -5850125 -859975 -1136493 -3730907 -3767471 -164630 -106263
125 2.32 -6538577 -6114987 -6263706 -8312849 -5859732 -861316 -1139364 -3737504 -3774222 -166372 -108093
150 4.757 -6549074 -6126324 -6276409 -8327726 -5869934 -862736 -1142378 -3744466 -3781333 -168220 -110000
175 8.918 -6560151 -6138278 -6289760 -8343530 -5880703 -864231 -1145528 -3751773 -3788784 -170167 -111978
200 15.536 -6571777 -6150816 -6303725 -8360217 -5892009 -865798 -1148805 -3759406 -3796556 -172207 -114023
225 25.479 -6583918 -6163904 -6318264 -8377742 -5903821 -867431 -1152202 -3767345 -3804627 -174334 -116128
250 39.736 -6596542 -6177508 -6333338 -8396056 -5916108 -869127 -1155709 -3775569 -3812975 -176540 -118289
275 59.431 -6609613 -6191590 -6348906 -8415110 -5928837 -870881 -1159319 -3784056 -3821580 -178819 -120500
300 85.838 -6623097 -6206116 -6364925 -8434853 -5941973 -872687 -1163022 -3792784 -3830418 -181166 -122756
325 120.458 -6636957 -6221045 -6381348 -8455229 -5955482 -874541 -1166810 -3801729 -3839465 -183573 -125053
350 165.211 -6651151 -6236333 -6398123 -8476175 -5969320 -876436 -1170671 -3810865 -3848691 -186034 -127383
[1] [1] [1] [1] [1] [1] [1] [2] [2] [3] [3]
[1] Holland and Powell, 1998
[2] Arnórsson and Stefánsson, 1999
[3] Robie and Hemingway, 1995
∆

56
Appendix C Apparent Gibbs free energy of selected aqueous species.
?GT,papp
[J/mol]
t /°C p /bar Na+
K+
Ca2+
Mg2+
H4SiO4 Fe2+
OH-
H2O(l) Al(OH)4-
H2(aq) H2S(aq) CO2(aq)
0 1 -260454 -279939 -554158 -457395 -1304972 -94098 -157397.1 -235513.2 -1304148 18970 -24991 -383258.6
25 1 -261881 -282462 -552790 -453985 -1309181 -91504 -157299.6 -237182.6 -1306341 17723 -27920 -385974
50 1 -263383 -284997 -551351 -450521 -1313894 -88831 -156879.9 -239006.8 -1308833 16117 -31234 -389107.8
75 1 -264981 -287562 -549857 -447039 -1319052 -86115 -156249.5 -240977.5 -1311696 14226 -34861 -392597.3
100 1.013 -266667 -290156 -548309 -443550 -1324605 -83358 -155463.2 -243082 -1314928 12075 -38765 -396413.1
125 2.32 -268437 -292775 -546694 -440035 -1330506 -80550 -154517.9 -245316.3 -1318493 9699 -42915 -400521.8
150 4.757 -270286 -295416 -544995 -436475 -1336713 -77672 -153383.6 -247663.5 -1322295 7109 -47300 -404915
175 8.918 -272198 -298072 -543196 -432847 -1343189 -74701 -152041 -250123.7 -1326232 4318 -51894 -409571.8
200 15.536 -274165 -300742 -541280 -429128 -1349898 -71618 -150433.8 -252692.7 -1330171 1331 -56693 -414492.1
225 25.479 -276169 -303407 -539213 -425283 -1356809 -68387 -148464.2 -255353.7 -1333927 -1849 -61685 -419667.8
250 39.736 -278198 -306068 -536954 -421253 -1363892 -64965 -146027.4 -258111 -1337337 -5226 -66860 -425107
275 59.431 -280223 -308700 -534447 -416990 -1371118 -61291 -142890.9 -260960.3 -1340208 -8816 -72224 -430839
300 85.838 -282228 -311290 -531682 -412509 -1378461 -57375 -138734 -263889.1 -1342312 -12652 -77781 -436914.2
325 120.458 -284198 -313825 -528753 -407999 -1385897 -53375 -131775.6 -266901.5 -1343441 -16841 -83571 -443483.1
350 165.211 -286102 -316248 -525946 -404087 -1393401 -49790 -123250.8 -269989.3 -1343353 -21694 -89743 -451014.3
[1] [1] [1] [1] [2] [1] [1] [3] [4] [1] [1] [1]
[1] Supcrt92, slop07.dat (Johnson et al., 1992)
[2] Gunnarsson and Arnórsson (2000)
[3] Hill 1990
[4] Benezeth et al. (2001)
∆
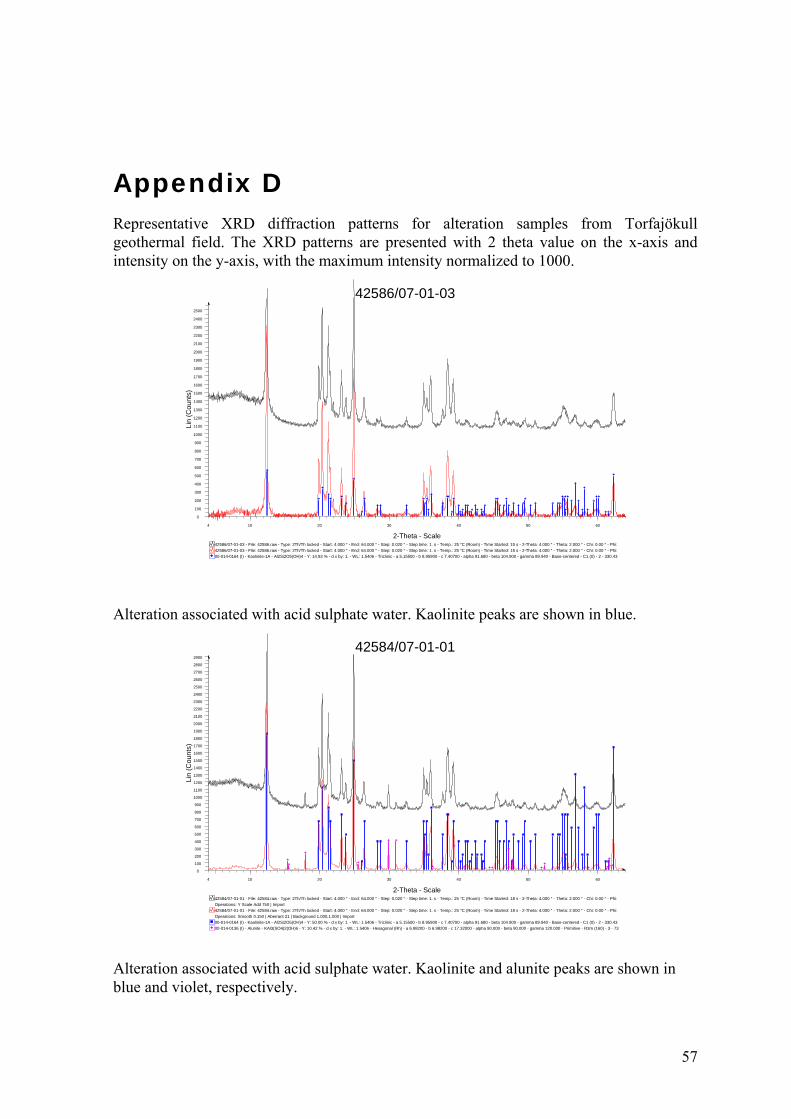
57
Appendix D Representative XRD diffraction patterns for alteration samples from Torfajökull geothermal field. The XRD patterns are presented with 2 theta value on the x-axis and intensity on the y-axis, with the maximum intensity normalized to 1000.
42586/07-01-03
00-014-0164 (I) - Kaolinite-1A - Al2Si2O5(OH)4 - Y: 14.93 % - d x by: 1. - WL: 1.5406 - Triclinic - a 5.15500 - b 8.95900 - c 7.40700 - alpha 91.680 - beta 104.900 - gamma 89.940 - Base-centered - C1 (0) - 2 - 330.4342586/07-01-03 - File: 42586.raw - Type: 2Th/Th locked - Start: 4.000 ° - End: 64.000 ° - Step: 0.020 ° - Step time: 1. s - Temp.: 25 °C (Room) - Time Started: 15 s - 2-Theta: 4.000 ° - Theta: 2.000 ° - Chi: 0.00 ° - Phi:
42586/07-01-03 - File: 42586.raw - Type: 2Th/Th locked - Start: 4.000 ° - End: 64.000 ° - Step: 0.020 ° - Step time: 1. s - Temp.: 25 °C (Room) - Time Started: 15 s - 2-Theta: 4.000 ° - Theta: 2.000 ° - Chi: 0.00 ° - Phi:
Lin
(Cou
nts)
0
100
200
300
400
500
600
700
800
900
1000
1100
1200
1300
1400
1500
1600
1700
1800
1900
2000
2100
2200
2300
2400
2500
2-Theta - Scale
4 10 20 30 40 50 60
Alteration associated with acid sulphate water. Kaolinite peaks are shown in blue.
42584/07-01-01
00-014-0136 (I) - Alunite - KAl3(SO4)2(OH)6 - Y: 10.42 % - d x by: 1. - WL: 1.5406 - Hexagonal (Rh) - a 6.98200 - b 6.98200 - c 17.32000 - alpha 90.000 - beta 90.000 - gamma 120.000 - Primitive - R3m (160) - 3 - 73
00-014-0164 (I) - Kaolinite-1A - Al2Si2O5(OH)4 - Y: 50.00 % - d x by: 1. - WL: 1.5406 - Triclinic - a 5.15500 - b 8.95900 - c 7.40700 - alpha 91.680 - beta 104.900 - gamma 89.940 - Base-centered - C1 (0) - 2 - 330.43Operations: Smooth 0.150 | Aberrant 21 | Background 1.000,1.000 | Import
42584/07-01-01 - File: 42584.raw - Type: 2Th/Th locked - Start: 4.000 ° - End: 64.000 ° - Step: 0.020 ° - Step time: 1. s - Temp.: 25 °C (Room) - Time Started: 18 s - 2-Theta: 4.000 ° - Theta: 2.000 ° - Chi: 0.00 ° - Phi: Operations: Y Scale Add 750 | Import
42584/07-01-01 - File: 42584.raw - Type: 2Th/Th locked - Start: 4.000 ° - End: 64.000 ° - Step: 0.020 ° - Step time: 1. s - Temp.: 25 °C (Room) - Time Started: 18 s - 2-Theta: 4.000 ° - Theta: 2.000 ° - Chi: 0.00 ° - Phi:
Lin
(C
oun
ts)
0
100
200
300
400
500
600
700
800
900
1000
1100
1200
1300
1400
1500
1600
1700
1800
1900
2000
2100
2200
2300
2400
2500
2600
2700
2800
2900
2-Theta - Scale
4 10 20 30 40 50 60
Alteration associated with acid sulphate water. Kaolinite and alunite peaks are shown in blue and violet, respectively.
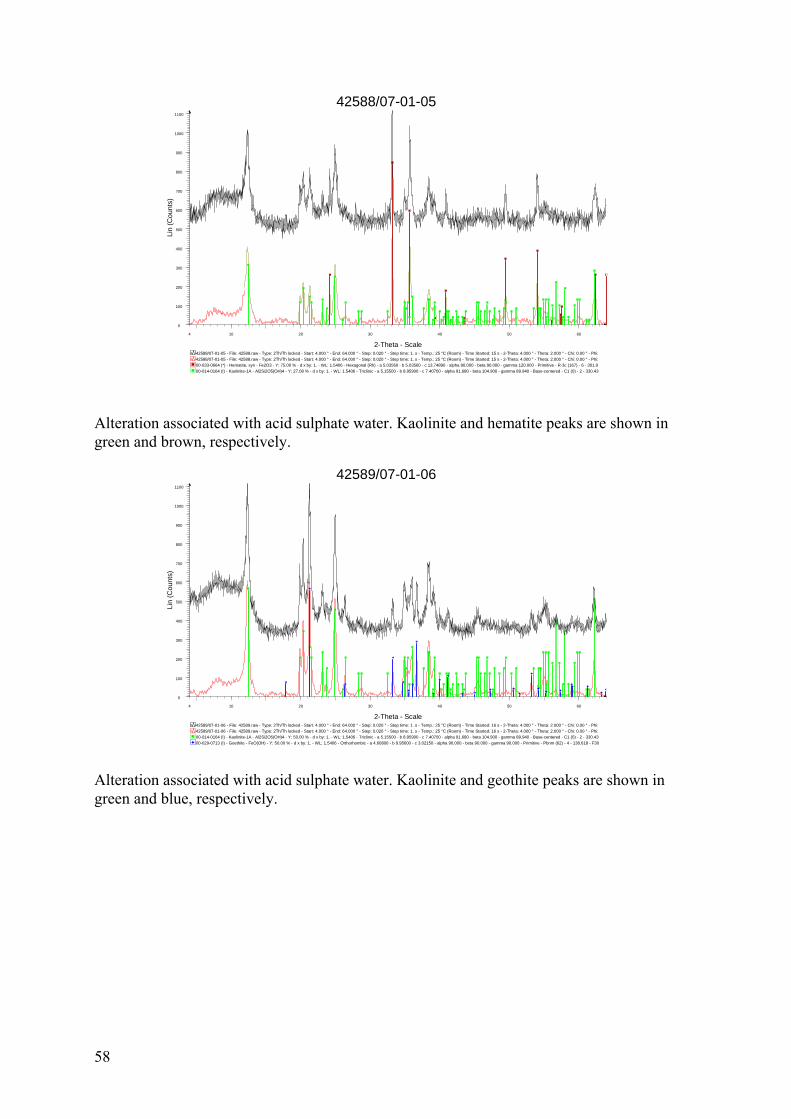
58
42588/07-01-05
00-014-0164 (I) - Kaolinite-1A - Al2Si2O5(OH)4 - Y: 27.08 % - d x by: 1. - WL: 1.5406 - Triclinic - a 5.15500 - b 8.95900 - c 7.40700 - alpha 91.680 - beta 104.900 - gamma 89.940 - Base-centered - C1 (0) - 2 - 330.43
00-033-0664 (*) - Hematite, syn - Fe2O3 - Y: 75.00 % - d x by: 1. - WL: 1.5406 - Hexagonal (Rh) - a 5.03560 - b 5.03560 - c 13.74890 - alpha 90.000 - beta 90.000 - gamma 120.000 - Primitive - R-3c (167) - 6 - 301.942588/07-01-05 - File: 42588.raw - Type: 2Th/Th locked - Start: 4.000 ° - End: 64.000 ° - Step: 0.020 ° - Step time: 1. s - Temp.: 25 °C (Room) - Time Started: 15 s - 2-Theta: 4.000 ° - Theta: 2.000 ° - Chi: 0.00 ° - Phi:
42588/07-01-05 - File: 42588.raw - Type: 2Th/Th locked - Start: 4.000 ° - End: 64.000 ° - Step: 0.020 ° - Step time: 1. s - Temp.: 25 °C (Room) - Time Started: 15 s - 2-Theta: 4.000 ° - Theta: 2.000 ° - Chi: 0.00 ° - Phi:
Lin
(Co
unts
)
0
100
200
300
400
500
600
700
800
900
1000
1100
2-Theta - Scale
4 10 20 30 40 50 60
Alteration associated with acid sulphate water. Kaolinite and hematite peaks are shown in green and brown, respectively.
42589/07-01-06
00-029-0713 (I) - Goethite - FeO(OH) - Y: 50.00 % - d x by: 1. - WL: 1.5406 - Orthorhombic - a 4.60800 - b 9.95600 - c 3.02150 - alpha 90.000 - beta 90.000 - gamma 90.000 - Primitive - Pbnm (62) - 4 - 138.618 - F30
00-014-0164 (I) - Kaolinite-1A - Al2Si2O5(OH)4 - Y: 50.00 % - d x by: 1. - WL: 1.5406 - Triclinic - a 5.15500 - b 8.95900 - c 7.40700 - alpha 91.680 - beta 104.900 - gamma 89.940 - Base-centered - C1 (0) - 2 - 330.4342589/07-01-06 - File: 42589.raw - Type: 2Th/Th locked - Start: 4.000 ° - End: 64.000 ° - Step: 0.020 ° - Step time: 1. s - Temp.: 25 °C (Room) - Time Started: 16 s - 2-Theta: 4.000 ° - Theta: 2.000 ° - Chi: 0.00 ° - Phi:
42589/07-01-06 - File: 42589.raw - Type: 2Th/Th locked - Start: 4.000 ° - End: 64.000 ° - Step: 0.020 ° - Step time: 1. s - Temp.: 25 °C (Room) - Time Started: 16 s - 2-Theta: 4.000 ° - Theta: 2.000 ° - Chi: 0.00 ° - Phi:
Lin
(C
ount
s)
0
100
200
300
400
500
600
700
800
900
1000
1100
2-Theta - Scale
4 10 20 30 40 50 60
Alteration associated with acid sulphate water. Kaolinite and geothite peaks are shown in green and blue, respectively.

59
42647/B03-4G D5MEAS - Program:MIN-MAG.DQLD5ME
42647/B03-4G D5MEAS - Program:MIN-MAG.DQLD5MEAS - Program:MIN-MAG.DQL - File: 42647.RAW - Type: 2Th/Th locked - Start: 4.000 ° - End: 64.000 ° - Step: 0.040 ° - Step time: 1. s - Temp.: 25
42647/B03-4G D5MEAS - Program:MIN-MAG.DQLD5MEAS - Program:MIN-MAG.DQL - File: 42647.RAW - Type: 2Th/Th locked - Start: 4.000 ° - End: 64.000 ° - Step: 0.040 ° - Step time: 1. s - Temp.: 25
Lin
(Cou
nts)
0
100
200
300
2-Theta - Scale
4 10 20 30 40 50 60
XRD pattern of a rhyolitic glass. The bulge in the middle is characteristic for amorphous silica.
42637/B01-1
00-037-0475 (*) - Marcasite - FeS2 - Y: 50.00 % - d x by: 1. - WL: 1.5406 - Orthorhombic - a 4.44300 - b 5.42400 - c 3.38650 - alpha 90.000 - beta 90.000 - gamma 90.000 - Primitive - Pnnm (58) - 2 - 81.6107 - F30= 00-042-1340 (*) - Pyrite - FeS2 - Y: 112.50 % - d x by: 1. - WL: 1.5406 - Cubic - a 5.41790 - b 5.41790 - c 5.41790 - alpha 90.000 - beta 90.000 - gamma 90.000 - Primitive - Pa3 (205) - 4 - 159.035 - I/Ic PDF 1.6 - F27
42637/B01-1 - File: 42637.raw - Type: 2Th/Th locked - Start: 4.000 ° - End: 64.000 ° - Step: 0.020 ° - Step time: 1. s - Temp.: 25 °C (Room) - Time Started: 15 s - 2-Theta: 4.000 ° - Theta: 2.000 ° - Chi: 0.00 ° - Phi: 0.042637/B01-1 - File: 42637.raw - Type: 2Th/Th locked - Start: 4.000 ° - End: 64.000 ° - Step: 0.020 ° - Step time: 1. s - Temp.: 25 °C (Room) - Time Started: 15 s - 2-Theta: 4.000 ° - Theta: 2.000 ° - Chi: 0.00 ° - Phi: 0.0
Lin
(C
oun
ts)
0
100
200
300
400
500
600
700
800
900
1000
1100
1200
1300
2-Theta - Scale
4 10 20 30 40 50 60
Alteration associated with acid sulphate water. Pyrite and marcasite peaks are shown in red and blue, respectively.
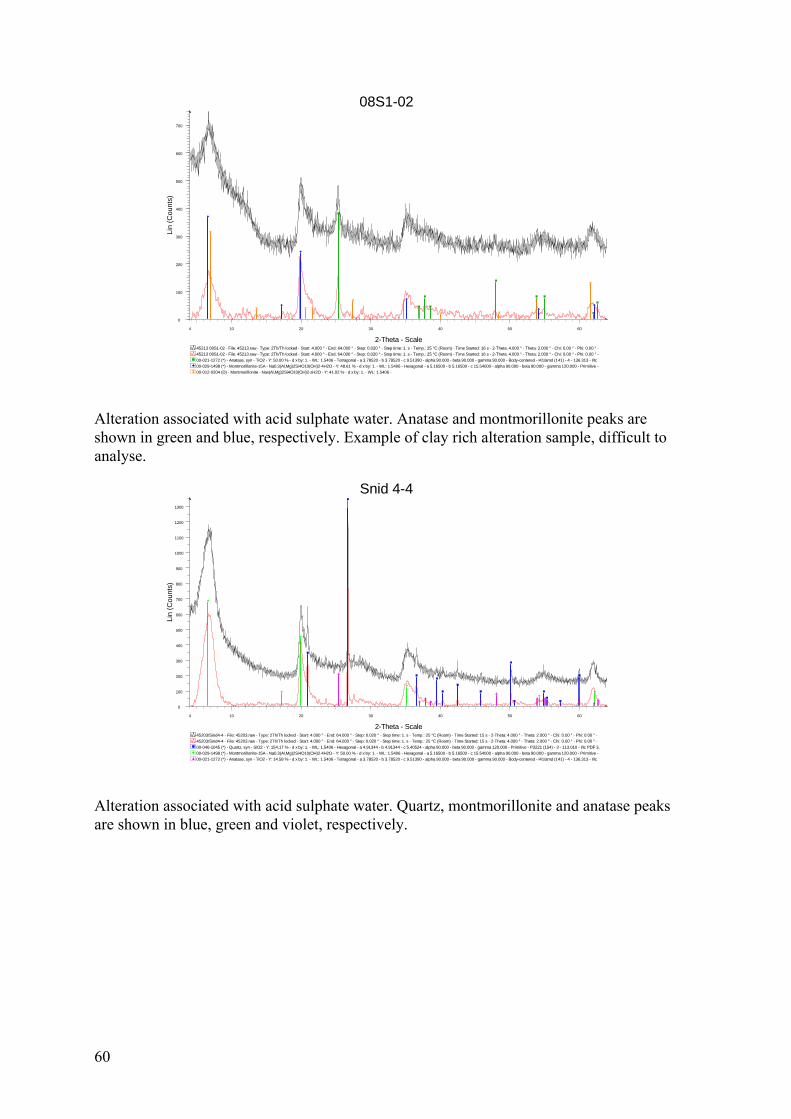
60
08S1-02
00-012-0204 (D) - Montmorillonite - Nax(Al,Mg)2Si4O10(OH)2·zH2O - Y: 41.02 % - d x by: 1. - WL: 1.5406 -
00-029-1498 (*) - Montmorillonite-15A - Na0.3(Al,Mg)2Si4O10(OH)2·4H2O - Y: 48.61 % - d x by: 1. - WL: 1.5406 - Hexagonal - a 5.16500 - b 5.16500 - c 15.54000 - alpha 90.000 - beta 90.000 - gamma 120.000 - Primitive -
00-021-1272 (*) - Anatase, syn - TiO2 - Y: 50.00 % - d x by: 1. - WL: 1.5406 - Tetragonal - a 3.78520 - b 3.78520 - c 9.51390 - alpha 90.000 - beta 90.000 - gamma 90.000 - Body-centered - I41/amd (141) - 4 - 136.313 - I/Ic
45213 08S1-02 - File: 45213.raw - Type: 2Th/Th locked - Start: 4.000 ° - End: 64.000 ° - Step: 0.020 ° - Step time: 1. s - Temp.: 25 °C (Room) - Time Started: 16 s - 2-Theta: 4.000 ° - Theta: 2.000 ° - Chi: 0.00 ° - Phi: 0.00 ° -
45213 08S1-02 - File: 45213.raw - Type: 2Th/Th locked - Start: 4.000 ° - End: 64.000 ° - Step: 0.020 ° - Step time: 1. s - Temp.: 25 °C (Room) - Time Started: 16 s - 2-Theta: 4.000 ° - Theta: 2.000 ° - Chi: 0.00 ° - Phi: 0.00 ° -
Lin
(Cou
nts)
0
100
200
300
400
500
600
700
2-Theta - Scale
4 10 20 30 40 50 60
Alteration associated with acid sulphate water. Anatase and montmorillonite peaks are shown in green and blue, respectively. Example of clay rich alteration sample, difficult to analyse.
Snid 4-4
00-021-1272 (*) - Anatase, syn - TiO2 - Y: 14.58 % - d x by: 1. - WL: 1.5406 - Tetragonal - a 3.78520 - b 3.78520 - c 9.51390 - alpha 90.000 - beta 90.000 - gamma 90.000 - Body-centered - I41/amd (141) - 4 - 136.313 - I/Ic
00-029-1498 (*) - Montmorillonite-15A - Na0.3(Al,Mg)2Si4O10(OH)2·4H2O - Y: 50.00 % - d x by: 1. - WL: 1.5406 - Hexagonal - a 5.16500 - b 5.16500 - c 15.54000 - alpha 90.000 - beta 90.000 - gamma 120.000 - Primitive -
00-046-1045 (*) - Quartz, syn - SiO2 - Y: 154.17 % - d x by: 1. - WL: 1.5406 - Hexagonal - a 4.91344 - b 4.91344 - c 5.40524 - alpha 90.000 - beta 90.000 - gamma 120.000 - Primitive - P3221 (154) - 3 - 113.010 - I/Ic PDF 3.
45203/Sind4-4 - File: 45203.raw - Type: 2Th/Th locked - Start: 4.000 ° - End: 64.000 ° - Step: 0.020 ° - Step time: 1. s - Temp.: 25 °C (Room) - Time Started: 15 s - 2-Theta: 4.000 ° - Theta: 2.000 ° - Chi: 0.00 ° - Phi: 0.00 ° -
45203/Sind4-4 - File: 45203.raw - Type: 2Th/Th locked - Start: 4.000 ° - End: 64.000 ° - Step: 0.020 ° - Step time: 1. s - Temp.: 25 °C (Room) - Time Started: 15 s - 2-Theta: 4.000 ° - Theta: 2.000 ° - Chi: 0.00 ° - Phi: 0.00 ° -
Lin
(Cou
nts)
0
100
200
300
400
500
600
700
800
900
1000
1100
1200
1300
2-Theta - Scale
4 10 20 30 40 50 60
Alteration associated with acid sulphate water. Quartz, montmorillonite and anatase peaks are shown in blue, green and violet, respectively.

61
gs-1
00-008-0247 (I) - Sulfur, syn - alpha-S - Y: 120.83 % - d x by: 1. - WL: 1.5406 - Orthorhombic - a 10.45000 - b 12.84000 - c 24.46000 - alpha 90.000 - beta 90.000 - gamma 90.000 - Face-centered - Fddd (70) - 128 - 3281.99
45227/gs-1 - File: 45227.raw - Type: 2Th/Th locked - Start: 4.241 ° - End: 64.205 ° - Step: 0.020 ° - Step time: 1. s - Temp.: 25 °C (Room) - Time Started: 19 s - 2-Theta: 4.241 ° - Theta: 2.000 ° - Chi: 0.00 ° - Phi: 0.00 ° - X: 0.
Lin
(Cou
nts)
0
100
200
300
400
500
600
700
800
900
1000
1100
1200
1300
1400
1500
1600
1700
1800
2-Theta - Scale
5 10 20 30 40 50 60
4.25
Alteration associated with NaCl water. Native sulphur peaks are in blue.
Patterns show poorly crystalline iron-oxides from three samples associated with carbonate waters.