fluid characterization using nuclear magnetic resonance...
TRANSCRIPT

May-June 2004 PETROPHYSICS 241
Unauthorized uses of copyrighted materials are prohibited by law. The PDF file of this article is provided subject to the
copyright policy of the journal. Please consult the journal or contact the publisher if you have questions about copyright policy.
Fluid Characterization using Nuclear Magnetic Resonance Logging
R. Freedman1
and N. Heaton1
INTRODUCTION
The introduction of pulsed NMR logging tools in the
early 1990s has provided the oil and gas industry with pow-
erful new methods for evaluating petroleum reservoirs. The
initial applications of pulsed NMR logging tools were
aimed at providing important rock-quality properties such
as (1) lithology-independent total porosity, (2) free- and
bound-fluid porosity, and (3) permeability.
Akkurt et al. (1996) showed that NMR diffusion meas-
urements could be used to quantify gas saturations in the
near-wellbore region investigated by NMR logging tools.
This paper stimulated much interest in NMR diffusion-
based fluid-characterization methods and led to the publi-
cation of numerous papers on the subject. Many of the early
methods relied on overly simplistic assumptions that lim-
ited their reliability and range of application. Those meth-
ods have since been replaced by more robust techniques
(Slijkerman et al., 1999; Freedman et al., 2001) that incor-
porate realistic models for NMR responses of formation
fluids.
Advanced NMR fluid characterization methods that pro-
vide fluid typing (oil, gas, and brine), flushed-zone satura-
tions, and oil viscosities in addition to the rock quality
answers mentioned above are presented in this paper. The
application of NMR to infer the wettability state of oil res-
ervoirs (Freedman et al., 2003) is also presented.
Brief description of NMR measurement principles
This section provides a brief discussion of the basic
measurement used by NMR well-logging tools for the
benefit of those readers who may not be familiar with NMR
logging technology. Those who desire more details are
referred to the extensive published literature on NMR
well-logging tools and to textbooks on NMR well-logging
methods and principles (e.g., Allen et al., 1997; Coates et
al., 1999).
To observe an NMR signal, the first step is to magnetize
the formation fluids by application of a static magnetic
field. NMR logging tools are equipped with powerful per-
manent magnets that create magnetic fields in the rock for-
PETROPHYSICS, VOL. 45, NO. 3 (MAY-JUNE 2004); P. 241–250; 11 FIGURES
ABSTRACT
This paper presents a variety of field applications that
illustrate recent advances in nuclear magnetic resonance
(NMR) logging fluid characterization methods. The main
concepts of NMR logging and the principles underlying
NMR diffusion measurements, which form the basis for
all standalone NMR fluid characterization methods, are
briefly reviewed. Field examples of the MRF2 Magnetic
Resonance Fluid characterization method are presented to
demonstrate the separation of oil and water signals, satu-
ration measurements, and oil-viscosity determination.
The MRF method is also applied in conjunction with new
diffusion NMR techniques to infer wettability states in a
suite of partially saturated core samples. The application
of two-dimensional NMR maps of relaxation times and
molecular-diffusion rates to identify fluids and determine
their properties in complex multi-fluid environments,
including oil-base mud (OBM) filtrate, light oil, and gas is
illustrated with field examples from the deepwater Gulf of
Mexico and the North Sea.
Manuscript received by the Editor January 8, 2004; revised manuscript received February 27, 2004.1Schlumberger Oilfield Services, Sugar Land, TX USA2Mark of Schlumberger
©2004 Society of Petrophysicists and Well Log Analysts. All rights reserved.

mations surrounding the borehole. The hydrogen nuclei
contained in the oil, gas, and brine filling the rock pore
spaces behave like microscopic magnets. The magnetic
moments of the hydrogen nuclei align along the direction of
the applied magnetic field thus creating a net magnetization
or polarization in the formation. The time required to align
the hydrogen nuclei along the direction of the applied mag-
netic field, referred to as the longitudinal direction, is char-
acterized by a longitudinal relaxation time denoted by T1.
In practice, a distribution of T1s is required to describe the
magnetization process. The distributions reflect the com-
plex composition of crude oils and the distribution of pore
sizes in sedimentary rocks. For bulk crude oils, the logarith-
mic mean of the T1 distribution is inversely proportional to
the viscosity and can vary from a few milliseconds or less
for heavy oils to several seconds for low-viscosity oils. In
reservoir rocks, T1’s of non-wetting phase fluids are equal
to their bulk fluid values. For the wetting phase, T1 of the
fluid can be shortened by interactions of the fluid molecules
with the pore surfaces. For water-saturated rocks, the sur-
face interaction is usually dominant and provides a mecha-
nism for estimating pore-size distributions from T1 distribu-
tions (Allen et al., 1997).
The time that the hydrogen nuclei are exposed to the
static magnetic field is referred to as the polarization time or
wait time. Prior to the wait time, the hydrogen nuclei are
randomly oriented and there is zero net magnetization in the
formation. During the wait time, the nuclear magnetization
grows exponentially towards its equilibrium value (Mo).
The porosity and the types and volumes of fluids determine
Mo. A wait time equal to three times the longest T1 produces
a magnetization equal to 95% of Mo. If too short a wait time
is used, NMR total porosities will underestimate true for-
mation porosities. Long wait times, and therefore, reduced
logging speeds are required in formations containing low-
viscosity oil or gas (i.e., fluids with long T1’s).
Following the polarization time, a train of radio-
frequency (RF) pulses is applied. Between the RF pulses,
the NMR signal is recorded using the same antenna used to
transmit the pulses. The NMR signal observed between
each pair of consecutive pulses is often called an echo
because it builds up to a maximum at the midpoint between
the pulses and then decays before the next pulse. In a typical
NMR measurement several thousand echoes are acquired
over a period of about a second. The echo amplitudes are
proportional to the net magnetization in the transverse
plane (transverse to the static magnetic field), which decays
during the course of the measurement. It is the rate of decay
of transverse magnetization that provides useful informa-
tion concerning the fluids and their environment.
T2 Distributions
The rate of decay of the NMR signal can be described by
a distribution of decay times, T2s, which are called trans-
verse relaxation times. It is customary to fit the measured
NMR signals to a sum of about 30 decaying single-expo-
nential signals each with amplitude, A(T2), and associated
decay time T2. The fitting procedure is achieved by a mathe-
matical technique known as inversion. The amplitudes
A(T2) are outputs of the inversion procedure. A semilog plot
of A(T2) versus T2 is known as a T2 distribution. Figure 1
illustrates how an exponentially decaying NMR signal is
transformed into a T2 distribution by the inversion process.
T2 distributions provide much useful information. The area
under the T2 distribution is proportional to the total poros-
ity. In water-saturated rocks the T2 distributions also can be
qualitatively related to pore-size distributions (Coates et al.,
1999). By defining appropriate T2 cut-offs, the T2 distribu-
tion can be partitioned into bound water and free water. Fig-
ure 2 shows a schematic of a typical T2 distribution in a
water-saturated rock. The T2s can span several decades
from less than one to several thousand milliseconds. The
wide range of decay times in sedimentary rocks is caused by
broad distributions of pore sizes.
For bulk crude oils, the T2 distribution reflects the molec-
ular composition of the oil. That is, each T2 in the distribu-
tion is inversely proportional to a microscopic constituent
viscosity of a particular constituent molecule (Freedman et
al., 2001). The longer T2s in a crude oil T2 distribution cor-
respond to signals from mobile molecules, whereas the
short T2s are associated with signals from larger molecules.
242 PETROPHYSICS May-June 2004
Freedman and Heaton
FIG. 1 Plot showing how a time-domain NMR signal is trans-formed into a T2 distribution by inversion.
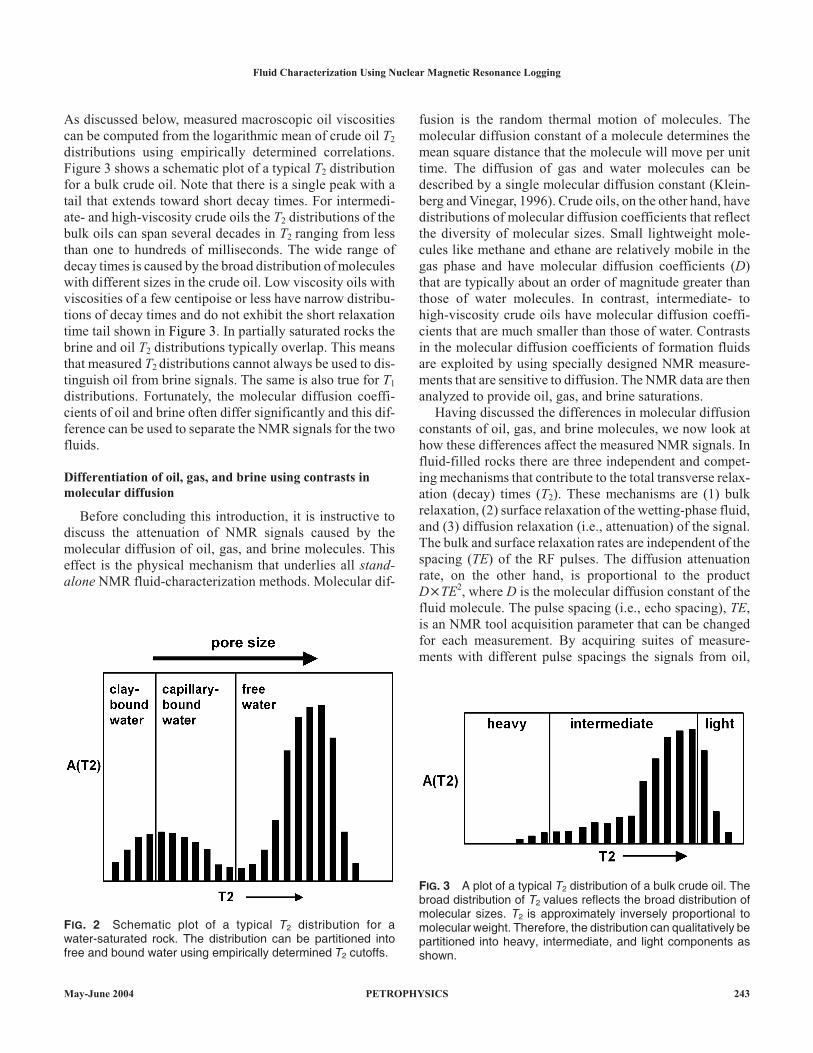
As discussed below, measured macroscopic oil viscosities
can be computed from the logarithmic mean of crude oil T2
distributions using empirically determined correlations.
Figure 3 shows a schematic plot of a typical T2 distribution
for a bulk crude oil. Note that there is a single peak with a
tail that extends toward short decay times. For intermedi-
ate- and high-viscosity crude oils the T2 distributions of the
bulk oils can span several decades in T2 ranging from less
than one to hundreds of milliseconds. The wide range of
decay times is caused by the broad distribution of molecules
with different sizes in the crude oil. Low viscosity oils with
viscosities of a few centipoise or less have narrow distribu-
tions of decay times and do not exhibit the short relaxation
time tail shown in Figure 3. In partially saturated rocks the
brine and oil T2 distributions typically overlap. This means
that measured T2 distributions cannot always be used to dis-
tinguish oil from brine signals. The same is also true for T1
distributions. Fortunately, the molecular diffusion coeffi-
cients of oil and brine often differ significantly and this dif-
ference can be used to separate the NMR signals for the two
fluids.
Differentiation of oil, gas, and brine using contrasts in
molecular diffusion
Before concluding this introduction, it is instructive to
discuss the attenuation of NMR signals caused by the
molecular diffusion of oil, gas, and brine molecules. This
effect is the physical mechanism that underlies all stand-
alone NMR fluid-characterization methods. Molecular dif-
fusion is the random thermal motion of molecules. The
molecular diffusion constant of a molecule determines the
mean square distance that the molecule will move per unit
time. The diffusion of gas and water molecules can be
described by a single molecular diffusion constant (Klein-
berg and Vinegar, 1996). Crude oils, on the other hand, have
distributions of molecular diffusion coefficients that reflect
the diversity of molecular sizes. Small lightweight mole-
cules like methane and ethane are relatively mobile in the
gas phase and have molecular diffusion coefficients (D)
that are typically about an order of magnitude greater than
those of water molecules. In contrast, intermediate- to
high-viscosity crude oils have molecular diffusion coeffi-
cients that are much smaller than those of water. Contrasts
in the molecular diffusion coefficients of formation fluids
are exploited by using specially designed NMR measure-
ments that are sensitive to diffusion. The NMR data are then
analyzed to provide oil, gas, and brine saturations.
Having discussed the differences in molecular diffusion
constants of oil, gas, and brine molecules, we now look at
how these differences affect the measured NMR signals. In
fluid-filled rocks there are three independent and compet-
ing mechanisms that contribute to the total transverse relax-
ation (decay) times (T2). These mechanisms are (1) bulk
relaxation, (2) surface relaxation of the wetting-phase fluid,
and (3) diffusion relaxation (i.e., attenuation) of the signal.
The bulk and surface relaxation rates are independent of the
spacing (TE) of the RF pulses. The diffusion attenuation
rate, on the other hand, is proportional to the product
D�TE2, where D is the molecular diffusion constant of the
fluid molecule. The pulse spacing (i.e., echo spacing), TE,
is an NMR tool acquisition parameter that can be changed
for each measurement. By acquiring suites of measure-
ments with different pulse spacings the signals from oil,
May-June 2004 PETROPHYSICS 243
Fluid Characterization Using Nuclear Magnetic Resonance Logging
FIG. 2 Schematic plot of a typical T2 distribution for awater-saturated rock. The distribution can be partitioned intofree and bound water using empirically determined T2 cutoffs.
FIG. 3 A plot of a typical T2 distribution of a bulk crude oil. Thebroad distribution of T2 values reflects the broad distribution ofmolecular sizes. T2 is approximately inversely proportional tomolecular weight. Therefore, the distribution can qualitatively bepartitioned into heavy, intermediate, and light components asshown.

gas, and brine in the formation are attenuated at different
rates because of the differences in their molecular diffusion
coefficients. This principle is illustrated schematically in
Figure 4 where a suite of diffusion-encoded data consisting
of three NMR measurements having different pulse spac-
ings is shown for a rock saturated with an intermediate-vis-
cosity oil and brine. For very short echo spacings there is
negligible diffusion attenuation and signals from the brine
and oil phases cannot be separated based on their decay
rates. As the pulse spacing is increased the brine signal is
attenuated much more strongly than the oil signal because
the water diffusion coefficient is about 10 times greater than
those of the oil. Multi-fluid relaxation models and associ-
ated inversion techniques for suites of diffusion-encoded
data similar to those in Figure 4 have been developed for
determining oil, gas, and brine saturations (Slijkerman et
al., 1999; Freedman et al., 2001).
VISCOSITY AND SATURATION
This section first reviews the empirically derived equa-
tions that relate bulk crude oil T2 and D distributions to vis-
cosities. Laboratory data comparing NMR-derived viscosi-
ties with those measured by a laboratory viscometer are dis-
cussed.
Two examples of field logs processed using the MRF
method are presented. The first example shows a depth log
acquired by the MRX* Magnetic Resonance eXpert tool
(Heaton et al., 2002). The second field example shows brine
and oil T2 distributions, saturations, and oil viscosities from
MRF analysis of station logs acquired at three depths in an
oil well.
Viscosity from T2 and D distributions
NMR viscosities are computed using empirically estab-
lished equations that relate the logarithmic means of T2 and
D distributions of crude oils to their viscosities. The two
empirical equations are
� o
LM
aT
T f�
2, ( ),
GOR(1)
and
� o
LM
bT
D� , (2)
where �o is the viscosity in cp and T is the sample tempera-
ture in Kelvin.
In equation (1), T2,LM is the logarithmic mean of the dif-
fusion-free crude oil T2 distribution in units of seconds, and
f(GOR) is a dimensionless function of the gas/oil ratio
(GOR). The function f(GOR) is discussed in detail by
Freedman et al., 2001 and Lo et al., 2002. The constant (a)
in equation (1) has been determined empirically. For a wide
variety of crude oils the value a = 0.004 s � cp � �–1 is
found to provide good agreement with measurements, as
shown in Figure 5. It should be pointed out, however, that
we have encountered crude oils for which using the value
a = 0.004 s � cp � K–1 leads to underestimation of mea-
sured viscosities by as much as a factor of 2. In equation (2),
DLM is the logarithmic mean of the crude oil D distribution
in units of cm2/s. It has been found that the constant (b) is
well approximated by the value b = 5.05 � 10– 8
cm2 � s–1 � cp � K–1 for dead and live hydrocarbon mix-
tures including crude oils.
Figure 5 shows a plot of measured versus NMR-
estimated viscosities for 31 dead crude oils from the Bel-
ridge field in California (Morriss et al., 1994) and four dead
crude oils from the Rice University database. The measure-
ments were made at 27°C. For the Rice crude oils, viscosity
estimates from both T2,LM and DLM are shown. Measure-
ments of diffusion constants were not available for the Bel-
ridge samples. The average absolute percent deviations of
the NMR-estimated viscosities from the measured viscosi-
ties for these data are 11.9% and 26.8% as computed from
DLM and T2,LM, respectively. Freedman et al. (2002) show
244 PETROPHYSICS May-June 2004
Freedman and Heaton
FIG. 4 Schematic plot of a suite of three diffusion-encodedmeasurements for a reservoir containing water and an interme-diate-viscosity oil. The diffusion-induced decay or signal attenu-ation is proportional to the square of the pulse spacing (TE) mul-tiplied by the diffusion constant (D) of the fluid molecule. As thepulse spacing is increased the water signal decays faster thanthe oil signal because the water diffusion coefficient is largerthan that of the oil. This effect is the basis underlying allstandalone NMR-based fluid characterization methods.

comparisons of NMR-estimated viscosities and measured
viscosities for a live North Sea crude oil measured at three
different GORs.
Fluid characterization example 1
The MRF logs in this example were acquired using the
MRX tool. The data were acquired in an operator well in the
East Mount Vernon field in Indiana that was drilled with a
freshwater-based mud. Figure 6 shows the results of the
MRF analysis for an oil-bearing interval of interest. Track 1
shows the gamma ray log. Track 2 contains the viscosity log
and track 3 the flushed-zone oil and water saturations, both
derived entirely from analysis of the MRX tool depth log.
Note that NMR saturation analysis does not require knowl-
edge of any input parameters such as Archie m and n expo-
nents or accurate values of Rw and Rt. Track 4 shows the for-
mation porosity partitioned into bound fluid (BFV), free
fluid (FFV), and oil volumes. Also shown in Track 4 is the
density log porosity (DPHI). Track 5 and 6 show diffu-
sion-free T2 distributions for brine and oil, respectively. The
MRF logs clearly identify the oil zone in the interval from
2895 to 2908 ft. The average MRF-predicted water satura-
tion (SXO) is 0.60 for this interval and the average viscosity
is 15 cp, in excellent agreement with the value of 16.9 cp
measured on a produced oil sample.
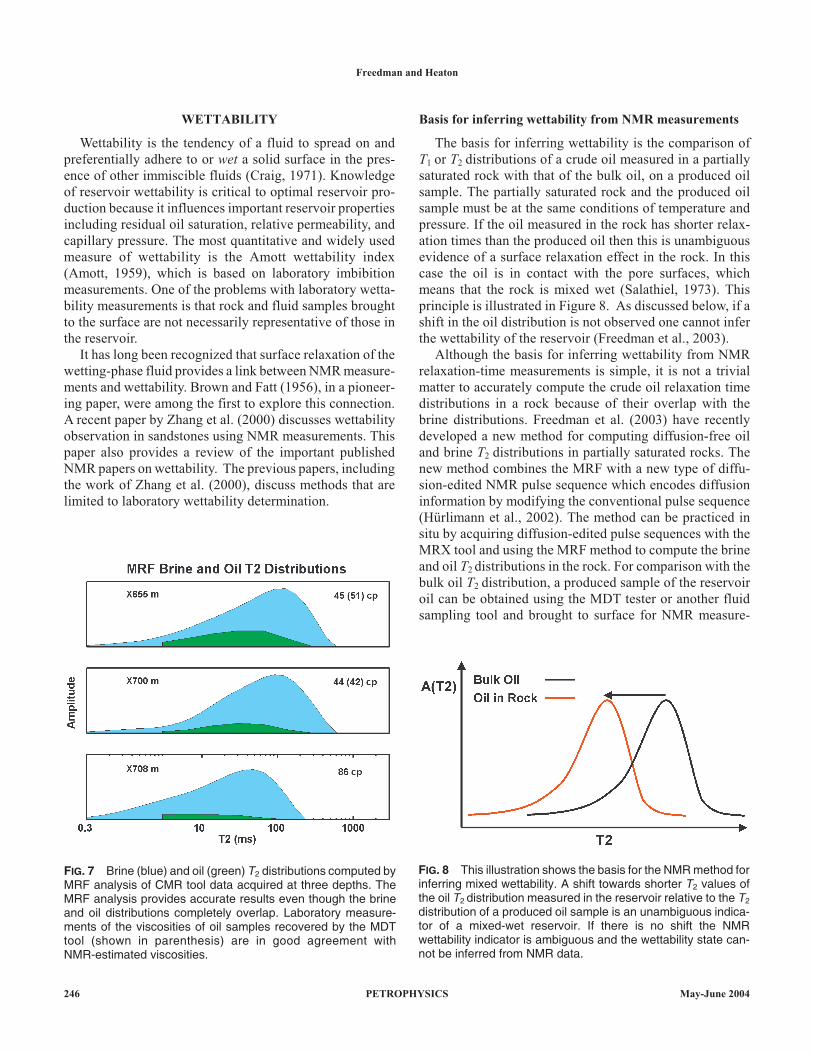
Fluid characterization example 2
In this well, drilled in China, reservoir viscosities were
known to vary widely, from roughly 10 to 1,000 cp. Con-
ventional resistivity analysis was problematic because of
uncertainties and variations in Archie parameters and deep
invasion. Moreover, it was important to determine the oil
viscosities for optimization of the well testing and comple-
tion program. The well was drilled with water-based mud.
The MRF data were acquired at three station depths
using the CMR* Combinable Magnetic Resonance tool.
The data suite acquired at each depth consisted of four dif-
fusion-encoded measurements. For the intermediate- to
high-viscosity oils found in this reservoir, the brine and oil
T2 distributions overlap. The overlap makes separation of
the oil and brine signals difficult. Initially, several compet-
ing NMR fluid characterization methods were tried by
operators in this field and gave poor results. The MRF anal-
ysis of the CMR tool data suites proved successful in sepa-
rating the overlapping brine and oil signals as shown in Fig-
ure 7. The MRF analysis also provided flushed-zone water
saturations and viscosities. Viscosities measured in the lab-
oratory on produced oil samples, acquired by the MDT*
Modular Dynamics Formation Tester, from two of the sta-
tion depths are in excellent agreement with the predicted
MRF viscosities as shown in Figure 7. Operators in this
field are using MRF logs to select depths for MDT pressure
measurements and fluid sampling as well as for a
standalone fluid characterization method. The paper by
Freedman et al. (2002) discusses this example in more
detail and also examples from other wells.
May-June 2004 PETROPHYSICS 245
Fluid Characterization Using Nuclear Magnetic Resonance Logging
FIG. 5 Plot comparing NMR-estimated viscosities from equa-tions (1) and (2) with viscosities measured with a viscometer for35 dead crude oils.
FIG. 6 MRF analysis of data acquired by the MRX tool. Theanalysis provides continuous measurements of fluid saturationsand oil viscosities.
WETTABILITY
Wettability is the tendency of a fluid to spread on and
preferentially adhere to or wet a solid surface in the pres-
ence of other immiscible fluids (Craig, 1971). Knowledge
of reservoir wettability is critical to optimal reservoir pro-
duction because it influences important reservoir properties
including residual oil saturation, relative permeability, and
capillary pressure. The most quantitative and widely used
measure of wettability is the Amott wettability index
(Amott, 1959), which is based on laboratory imbibition
measurements. One of the problems with laboratory wetta-
bility measurements is that rock and fluid samples brought
to the surface are not necessarily representative of those in
the reservoir.
It has long been recognized that surface relaxation of the
wetting-phase fluid provides a link between NMR measure-
ments and wettability. Brown and Fatt (1956), in a pioneer-
ing paper, were among the first to explore this connection.
A recent paper by Zhang et al. (2000) discusses wettability
observation in sandstones using NMR measurements. This
paper also provides a review of the important published
NMR papers on wettability. The previous papers, including
the work of Zhang et al. (2000), discuss methods that are
limited to laboratory wettability determination.
Basis for inferring wettability from NMR measurements
The basis for inferring wettability is the comparison of
T1 or T2 distributions of a crude oil measured in a partially
saturated rock with that of the bulk oil, on a produced oil
sample. The partially saturated rock and the produced oil
sample must be at the same conditions of temperature and
pressure. If the oil measured in the rock has shorter relax-
ation times than the produced oil then this is unambiguous
evidence of a surface relaxation effect in the rock. In this
case the oil is in contact with the pore surfaces, which
means that the rock is mixed wet (Salathiel, 1973). This
principle is illustrated in Figure 8. As discussed below, if a
shift in the oil distribution is not observed one cannot infer
the wettability of the reservoir (Freedman et al., 2003).
Although the basis for inferring wettability from NMR
relaxation-time measurements is simple, it is not a trivial
matter to accurately compute the crude oil relaxation time
distributions in a rock because of their overlap with the
brine distributions. Freedman et al. (2003) have recently
developed a new method for computing diffusion-free oil
and brine T2 distributions in partially saturated rocks. The
new method combines the MRF with a new type of diffu-
sion-edited NMR pulse sequence which encodes diffusion
information by modifying the conventional pulse sequence
(Hürlimann et al., 2002). The method can be practiced in
situ by acquiring diffusion-edited pulse sequences with the
MRX tool and using the MRF method to compute the brine
and oil T2 distributions in the rock. For comparison with the
bulk oil T2 distribution, a produced sample of the reservoir
oil can be obtained using the MDT tester or another fluid
sampling tool and brought to surface for NMR measure-
246 PETROPHYSICS May-June 2004
Freedman and Heaton
FIG. 7 Brine (blue) and oil (green) T2 distributions computed byMRF analysis of CMR tool data acquired at three depths. TheMRF analysis provides accurate results even though the brineand oil distributions completely overlap. Laboratory measure-ments of the viscosities of oil samples recovered by the MDTtool (shown in parenthesis) are in good agreement withNMR-estimated viscosities.
FIG. 8 This illustration shows the basis for the NMR method forinferring mixed wettability. A shift towards shorter T2 values ofthe oil T2 distribution measured in the reservoir relative to the T2
distribution of a produced oil sample is an unambiguous indica-tor of a mixed-wet reservoir. If there is no shift the NMRwettability indicator is ambiguous and the wettability state can-not be inferred from NMR data.

ments at reservoir conditions. Because OBM filtrates can
cause wettability alteration, the downhole NMR measure-
ments should be performed in wells drilled with water-base
muds.
INFERRING WETTABILITY:
EXPERIMENTAL RESULTS
Freedman et al. (2003) performed experiments on a suite
of four rocks, Bentheim and Berea sandstones and two
dolomites from the Yates field in West Texas, to verify that
wettability can be inferred from NMR measurements. The
objective was to compare the crude oil T2 distributions for
the partially saturated rocks with the T2 distribution of the
bulk oil. Each rock was first measured fully brine saturated,
then in a high oil-saturation state, and finally in a low oil-
saturation state. A North Sea crude oil with a viscosity of
about 10 cp at 27°C was used to saturate the rocks. MRF
processing was used to compute separate brine and oil T2
distributions. Imbibition experiments showed that the two
dolomite rocks were mixed wet and the two sandstones
were water wet. The paper by Freedman et al. (2003) pro-
vides the experimental details.
In mixed-wet rocks, the NMR surface relaxation of the
oil is enhanced at low oil saturations because of the reduced
thickness of the oil layer in contact with the pore walls. This
effect enhances the surface relaxation rate by increasing the
probability of surface interactions. Conversely, at high oil
saturations the surface relaxation effect in mixed-wet rocks
is reduced. The dependence of the surface relaxation rate on
wetting phase saturation was clearly demonstrated in the
experiments. Although the dolomite samples are mixed
wet, the oil T2 distributions measured in the four rocks in the
high oil-saturation state did not show any significant shifts
compared to the bulk oil distribution. Evidently, because of
the high oil saturations (i.e., 72% and 74%), surface relax-
ation in the two mixed-wet dolomite samples is insignifi-
cant compared to bulk relaxation. However, for the dolo-
mite samples measured in the low oil-saturation state (i.e.,
oil saturations of 27% and 31%), the oil T2 distributions
were shifted towards shorter T2’s relative to the bulk oil dis-
tribution. For the two water-wet sandstone samples, oil dis-
tributions measured in the sandstone rocks were not shifted
relative to the bulk oil distribution. The results are shown in
Figure 9; BEN3 and BER3 are the abbreviations used for
the Bentheim and Berea sandstones, respectively, and
Y1312 and Y1573 designate the Yates field dolomites. Note
that the oil distribution measured in the Berea sandstone
deviates from the bulk oil distribution for T2 values less
than about 20 ms as can be seen in Figure 9. This discrep-
ancy highlights a practical limitation of diffusion measure-
ments, which cannot accurately distinguish bound water
with short relaxation times from viscous oil because of the
lack of sensitivity to diffusion-induced decay for short T2
values.
One can unambiguously conclude from the results
shown in Figure 9 that samples Y1312 and Y1573 are
mixed wet: the only mechanism that can cause the observed
shifts is surface relaxation of the oil. Additional support for
this conclusion is provided by the brine T2 distributions
computed by the MRF method. They show that the brine T2
values in the oil-wet large pores are close to the T2 of bulk
water, indicating that the water is partially shielded from
the pore surface (Freedman et al., 2003).
Before concluding the discussion of wettability, it is use-
ful to summarize the experimental results. First, the NMR-
based method infers the wettability state of the reservoir by
comparing in-situ oil T2 distributions with the T2 distribu-
tion of a produced oil sample. A significant shift of the oil
T2 distribution measured in the rock towards shorter T2 val-
ues relative to that of the produced oil T2 distribution unam-
biguously implies mixed wettability. If the two distribu-
tions overlay one another then the wettability state of the
reservoir cannot be inferred from NMR data.
May-June 2004 PETROPHYSICS 247
Fluid Characterization Using Nuclear Magnetic Resonance Logging
FIG. 9 Plot comparing the oil T2 distributions computed by theMRF method with the T2 distributions of the bulk oil. The distri-butions for the two Yates field dolomite samples are shifted rela-tive to that of the bulk oil sample providing unambiguous evi-dence that these two samples are mixed wet. The oil distribu-tions computed for the two sandstone samples overlay that ofthe bulk oil.

LIGHT HYDROCARBONS AND OBM
In the previous sections we demonstrated how the MRF
method exploits differences in molecular diffusion rates to
separate contributions to the NMR signal from different flu-
ids in the formation. A principal component of the MRF
method is the relationship between diffusion rates and bulk
relaxation rates of crude oils. It is important to recognize
that these relationships are based on empirical correlations
and deviations from the correlations in equations (1) and (2)
may be encountered as a result of the broad range of compo-
sitions of crude oils that can be found. Although composi-
tional variations do place limits on the final quantitative
accuracy of viscosity and saturation predictions, they do not
usually result in major errors in interpretation.
More challenging situations can arise in wells drilled
with OBM and when significant quantities of gas are pres-
ent. Since the depth of investigation of the NMR measure-
ment is typically just a few inches, we can expect the OBM
filtrate as well as any residual native hydrocarbon and
unmoved connate water to contribute to the NMR response.
Because the filtrate is itself a hydrocarbon, it may mix with
the native fluid, creating a new mixture for which the NMR
response can be quite different from the responses of the
separate fluids. Alternatively, the invasion process may
occur without significant mixing so that the filtrate and
native hydrocarbon would make separate identifiable con-
tributions to the NMR measurements. When free gas or
high-GOR oils are present, the situation is complicated fur-
ther because the gas may also dissolve in the filtrate,
thereby altering the filtrate NMR response. Unfortunately,
it is not yet possible to predict with any certainty how these
different fluids will interact as the filtrate invasion pro-
gresses.
A new and powerful approach (Hürlimann et al., 2002)
has been developed to address these complex multi-fluid
environments. The new method consists of analyzing NMR
data suites in terms of two-dimensional distributions of
relaxation times and molecular diffusion rates. The mathe-
matical inversion that produces the two-dimensional distri-
bution is analogous to the standard T2 inversion that pro-
duces a T2 distribution from a single echo decay, as
described in Figure 1. Instead of using one NMR measure-
ment with pulse spacing, TE, the two-dimensional inver-
sion simultaneously analyses multiple NMR measurements
having different TE values. The two-dimensional distribu-
tions are typically displayed as color contour plots and are
referred to as D-T2 maps. To aid interpretation of the maps,
overlays are usually included to indicate the ideal responses
of water, oil, and gas.
Figure 10 shows a D-T2 map for a gas-bearing sand in a
North Sea well drilled with OBM. These data were acquired
as a station log using the CMR tool. The gas signal is clearly
seen in the top right corner on the red overlay gas line. Also
apparent is a small peak that is directly below the gas peak
but which falls on the green-overlay oil line. This peak cor-
responds to the OBM filtrate, which typically exhibits a T2
of about 1 s. Interestingly, there is another peak close to the
oil line with a T2 of about 80 ms, which is consistent with
residual oil of intermediate viscosity. The poorly resolved
peak below 10 ms on the T2 axis is bound water. The poor
definition of the bound-water peak and its position well
removed from the water cyan-overlay line demonstrate a
limitation of the technique for fast-relaxing (short T2) flu-
ids. In general, for fluids with T2 values less than about 20
ms, it is not possible to determine the corresponding diffu-
sion rate and the inversion tends to apportion the signal over
a broad area on the map, stretching out in the diffusion
dimension. This is discussed in detail in the Appendix of
the Freedman et al. 2003 paper.
The two D-T2 maps shown in Figure 11 were obtained in
a deepwater well drilled with OBM in the Gulf of Mexico.
The left map was acquired in a water sand and shows a typi-
cal OBM filtrate response on the oil line with a T2 of about
1.5 s. The faint peak with higher diffusion rate and shorter
T2 corresponds to water that was not flushed by the invad-
ing filtrate. The D-T2 map on the right was obtained in an
oil-bearing sand zone in the same well. Note that the strong
filtrate peak does not fall on the oil line but has now shifted
to a significantly higher diffusion rate and shorter T2 rela-
tive to its position in the water sand. This shift is the result
248 PETROPHYSICS May-June 2004
Freedman and Heaton
FIG. 10 D-T2 map from a gas-bearing sand in a North Sea welldrilled with OBM. The data were acquired as a station log usingthe CMR tool. The bright color peaks correspond to different flu-ids. The overlay lines represent the ideal responses of water, oil,and gas.

of dissolved gas, which reduces the viscosity of the filtrate
and causes an increase in its diffusion rate. The dissolved
gas also reduces the T2 of the filtrate. The same effect is
known to occur in live oils with high GOR. The second
peak that appears at the right edge (long T2) of the map
above the water diffusion line corresponds to the light
hydrocarbon. Note that the OBM filtrate and native oil yield
separate identifiable peaks, confirming in this case the flu-
ids have not mixed. The long T2 and high diffusion rate of
the native oil peak indicate the oil is very light.
SUMMARY
This paper presented a variety of field examples that
demonst ra ted recent advances in NMR fluid-
characterization methods. Processed field logs showed the
application of the MRF method to the prediction of oil and
water saturations and oil viscosities. The definition of wet-
tability in reservoir rocks and its connection to surface-
induced decay of the NMR signal in fluid-filled rocks was
discussed. Application of the MRF method to suites of
diffusion-edited data acquired in the laboratory on partially
saturated rocks was used to show how and under what con-
ditions wettability can be inferred from NMR data. A
model-independent NMR diffusion-based method for con-
structing two-dimensional maps of relaxation times and
molecular diffusion rates to analyze fluids in complex envi-
ronments, such as light oil or gas in wells drilled with OBM,
was demonstrated using field data acquired in the deepwa-
ter Gulf of Mexico and the North Sea.
ACKNOWLEDGEMENTS
We wish to express appreciation to our many colleagues
who contributed to the development of the methods dis-
cussed in this paper. We also thank Schlumberger manage-
ment for permission to publish this paper and the oil compa-
nies that kindly allowed us to use their data.
REFERENCES
Allen, D., Crary, S., Freedman, B., Andreani, M., Klopf, W.,
Badry, R., Flaum, C., Kenyon, B., Kleinberg, R., Gossenberg,
P., Horkowitz, J., Logan, D., Singer, J., and White, J., 1997,
How to use borehole nuclear magnetic resonance:
Schlumberger Oilfield Review, vol. 9, no. 2, p. 34–57.
Amott, E., 1959, Observations relating to the wettability of porous
rock: Petroleum Transactions AIME, vol. 216, p. 156–162.
Akkurt, R., Vinegar, H., Tutunjian, P., and Guillory, A., 1996,
NMR logging of natural gas reservoirs: The Log Analyst, vol.
37, no. 6, p. 33 – 42.
Coates, G., Xiao, L., and Prammer, M., 1999, NMR logging: prin-
ciples and applications: Gulf Publishing Company, Houston,
Texas.
May-June 2004 PETROPHYSICS 249
Fluid Characterization Using Nuclear Magnetic Resonance Logging
FIG. 11 D-T2 maps from a water sand (left) and oil-bearing sand (right) in a Gulf of Mexico well drilled with OBM. Note that the peakcorresponding to the OBM filtrate falls on the oil line in the water sand but moves to higher D and shorter T2 in the oil-bearing sandbecause of the effects of dissolved gas.

Brown, R.J.S. and Fatt, I., 1956, Measurement of fractional
wettability of oilfield rocks by the nuclear magnetic relaxation
method: Petroleum Transactions AIME, vol. 207, p. 262–264.
Cao Minh, C., Heaton, N., Ramamoorthy, R., Decoster, E., White,
J., Junk, E., Eyvazzadeh, R., Al-Yousef, O., Fiorini, R., and
McClendon, D., 2003, Planning and interpreting NMR
fluid-characterization logs, SPE 84478 presented at the SPE
Annual Technical Conference and Exhibition.
Craig, F., 1971, The reservoir engineering aspects of waterflood-
ing: Monograph Volume 3 of the Henry L. Doherty Series, Soci-
ety of Petroleum Engineers of AIME.
Freedman, R., Lo, S., Flaum, M., Hirasaki, G.J., Matteson, and
Sezginer, A., 2001, A new NMR method of fluid characteriza-
tion in reservoir rocks: Experimental confirmation and simula-
tion results: SPE Journal, vol. 6, no. 4, p. 452–464.
Freedman, R., Heaton, N., and Flaum, M., 2002, Field applications
of a new nuclear magnetic resonance fluid characterization
method: SPE Reservoir Evaluation & Engineering Journal,
vol. 5, no. 6, p. 455–464.
Freedman, R., Heaton, N., Flaum, M., Hirasaki, G., Flaum, C., and
Hürlimann, M., 2003, Wettability, saturation, and viscosity
from NMR measurements: SPE Journal, vol. 8, no. 4, p.
317–327.
Heaton, N., Freedman, R, Karmonik, C., Taherian, R., Walter, K.,
and de Pavia, L., 2002, Applications of a new-generation wire-
line NMR logging tool, SPE 77400 presented at the SPE
Annual Technical Conference and Exhibition.
Hürlimann, M., Venkataramanan, L., Flaum, C., Speier, P.,
Karmonik, C., Freedman, R., and Heaton, N., 2002, Diffu-
sion-editing: New NMR measurements of saturation and pore
geometry, paper FFF in 43rd Annual Logging Symposium
Transactions: Society of Professional Well Log Analysts.
Kleinberg, R., and Vinegar, H., 1996, NMR properties of reservoir
fluids: The Log Analyst, vol. 37, no. 6, p. 20–32.
Lo, S., Hirasaki, G., House, W., and Kobayashi, R., 2002, Mixing
rules and correlations of NMR relaxation time with viscosity,
diffusivity, and gas/oil ratio of methane/hydrocarbon mixtures:
SPE Journal, vol. 7, no. 1, p. 24–34.
Morriss, C., Freedman, R., Straley, C., Johnston, M., Vinegar, H.,
and Tutunjian, P., 1994, Hydrocarbon saturation and viscosity
estimation from NMR logging in the Belridge diatomite, paper
C in 35th Annual Logging Symposium Transactions: Society of
Professional Well Log Analysts.
Salathiel, R., 1973, Oil recovery by surface film drainage in
mixed-wettability rocks: Journal of Petroleum Technology,
vol. 25, no. 10, p. 1216–24.
Slijkerman, W., Looyestijn, W., Hofstra, P., and Hofman, J., 1999,
Processing of multi-acquisition NMR data, SPE 56768 pre-
sented at the SPE Annual Technical Conference and Exhibi-
tion.
Zhang, Q., Huang, C., and Hirasaki, G., 2000, Interpretation of
wettability in sandstones with NMR analysis: Petrophysics,
vol. 41, no. 3, p. 223–233.
ABOUT THE AUTHORS
Dr. Robert (Bob) Freedman is a Scientific Advisor and Pro-
ject Manager in the Resistivity/NMR Discipline at the
Schlumberger Sugar Land Product Center. Bob is a summa cum
laude graduate in physics from the University of Houston and
holds a PhD degree in physics from the University of California at
San Diego. He has 28 years of experience in formation evaluation
including five years with Shell, five years as an independent con-
sultant, and 18+ years with Schlumberger. Bob has made many
significant contributions in interpretation, signal processing, and
tool modeling in the areas of NMR and Electrical/Electromagnetic
well logging. He has been an active member of SPE for 27 years
and has served as an associate technical editor of the SPE Forma-
tion Evaluation Journal. Bob was a Distinguished SPWLA Lec-
turer (1998-1999), currently serves on the SPWLA Technology
Committee, and is a Distinguished SPE Lecturer (2003-2004).
Bob has published over 50 technical papers and has been granted
17 patents on well logging applications.
Dr. Freedman may be contacted at [email protected]
Dr. Nick Heaton received his BSc in chemistry from the
University of Leeds, UK in 1983 and a PhD in chemical physics
from the University of Southampton, UK in 1987. He then worked
in NMR research at the University of California at San Diego and
the University of Stuttgart, Germany, investigating the structure
and dynamics of complex fluids. In 1998 he joined Schlumberger
Sugar Land Product Center as NMR interpretation-development
specialist. Nick has five patents on NMR well logging applications
and has published 40 papers on NMR spectroscopy and well
logging.
250 PETROPHYSICS May-June 2004
Freedman and Heaton