flowcam: sizing cells and understanding the impact of size ... · pdf filetaxonomic...
TRANSCRIPT

AQUATIC MICROBIAL ECOLOGYAquat Microb Ecol
Vol. 65: 75–87, 2011doi: 10.3354/ame01539
Published online November 17
INTRODUCTION
Taxonomic identification and sizing of marinemicroorganisms are of great importance in the analy-sis of natural plankton food-webs. Particle size distri-bution, converted into biovolume or carbon, is one ofthe main food-web properties, and is used as statevariable in many ecological models. Using this infor-mation, interactions among various trophic levelsand export to the sea floor are quantified and stud-ied. Automated optical instrumentation for in situanalysis and quantification of plankton size distribu-tions has been developed over the last few decades.New instruments include towed platforms such asthe video plankton recorder (VPR) and the optical
plankton counter (OPC, now LOPC) (Davis et al.1992, Herman et al. 2004). Protist plankton commu-nity structures are typically analysed under aninverted microscope (Utermöhl 1958). Automatedoptical devices that operate in the <100 μm particlesize realm and are aimed at replacing invertedmicroscopy include instrumentations such as theautomatic imaging FlowCAM (Sieracki et al. 1998),the Cytobot, and CytoBuoy flow cytometer. Theseinstruments are available as submersible units (Sosik& Olson 2007, Campbell et al. 2008, Thyssen et al.2008) and as onboard instrumentation on auton o -mous underwater vehicles (Cunningham et al. 2003).Despite their potential, the use of optical planktoninstruments is often hampered by various logistical,
© Inter-Research 2011 · www.int-res.com*Email: [email protected]
FlowCAM: Sizing cells and understanding theimpact of size distributions on biovolume of
planktonic community structure
Hans Henrik Jakobsen*, Jacob Carstensen
Department of Bioscience, Aarhus University, Frederiksborgvej 399, PO Box 358, 4000 Roskilde, Denmark
ABSTRACT: Instruments for in vivo identification and quantification of marine organisms arebecoming more common, and the interpretation of data from these instruments is still evolving. Inthe present study, we compare the sizing performance of 3 instruments: (1) a black and white(B/W) FlowCAM II; (2) a BeckmanCoulter Multisizer III (MIII); and (3) an inverted microscope. Weapplied 3 different particle sizing algorithms available from the FlowCAM to suspensions of 5 dif-ferent particle morphotypes (4 different phytoplankton species and a spherical NIST calibrationbead). The FlowCAM generated size distributions similar to those reported by the MIII for thespherical calibration beads. However, differences in reported sizes emerged among FlowCAMalgorithms as well as among instruments when applied to morphologically more complex parti-cles, such as diatom chains. There was an immediate and substantial loss of cell counts when livecells were fixed in Lugol’s solution, but only minor differences in cell size distributions among thedifferent FlowCAM algorithms. The difference in sizing performance of the FlowCAM algorithmsaffects biovolume estimates of the natural plankton samples analysed. Species diversity wasapparently higher in samples analysed by microscopy than with the FlowCAM, but the cell sizedistribution from the microscope was extremely narrow compared to FlowCAM and MIII. Thepresent study demonstrates that the particle sizing algorithm has severe impact on the character-istics of the particle size distribution and on the total community biomass estimate.
KEY WORDS: FlowCAM · Particle size · Plankton spectra · Lugol’s fixation · Sizing algorithms
Resale or republication not permitted without written consent of the publisher
OPENPEN ACCESSCCESS

Aquat Microb Ecol 65: 75–87, 2011
operational, or technical problems. Furthermore, theinformation they provide and their costs must be balanced against traditional microscopic planktonanalysis. Hence, there is a need for comparisons thatdemonstrate the advantages and disadvantages ofautomated plankton particle analysis against stan-dard methods such as manual microscopic analysisand particle sizing by electronic particle counters.
The FlowCAM was developed and described indetail by Sieracki et al (1998), who conducted a thor-ough analysis of counting and sizing of beads and livecells. The main strength of the FlowCAM is the avail-ability of individual images of each particle counted.The images are tagged with optical properties such assize, fluorescence, and abundance. In this fashion,visual post inspections of the dominant species arepossible, and grouping of particles based on multipleoptical properties add to the analytical flexibility. Thedata allow rapid estimation of plankton species andbiovolume within the analysed water sample, whichin turn provides almost real-time information aboutthe dynamics of the plankton community being stud-ied. This rapid processing has been valuable for bio-volume distribution analysis in field programs such asoceanographic cruises or mesocosm experiments, andin studying phytoplankton responses on seasonaltime scales, including early warning and monitoringof potential harmful algae blooms (e.g. Sieracki et al.1998, Buskey & Hyatt 2006, Campbell et al. 2008,Nielsen et al. 2010, Pedersen et al. 2010).
The most commonly used fixative for microplank-ton is Lugol’s iodine solution added to achieve finalconcentrations of 1 to 10% (hereafter termed Lugol’ssolution). However, Lugol’s solution introduces fixa-tion artefacts that affect cell concentration and size(Klein Breteler 1985, Choi & Stoecker 1989, Jeromeet al. 1993, Wiackowski et al. 1994a,b, Menden-Deuer & Lessard 2000, Broglio et al. 2004, Zarauz &Irigoien 2008). Accessing loss in biovolume and cellsdue to Lugol’s fixations is not trivial, because directcounts of individual protist in vivo are challenging. Incontrast to most other microplankton communityanalysis methods, the FlowCAM is able to performanalysis of both single cells and whole plankton com-munities unaltered by fixation (e.g. Zarauz & Irigoien2008, Álvarez et al. 2011). Zarauz & Irigoien (2008)studied the effect of Lugol’s solution on protist com-munities using the FlowCAM and found that Lugol’ssolution preservation had adverse effects on bothbiovolume and cell numbers compared to fresh sam-ples. Among the observed effects of Lugol’s solutionwas the formation of large particle aggregates in thesizes fraction >20 μm, while the size fraction from 8
to 20 μm decreased (Zarauz & Irigoien 2008). Simi-larly, species-specific loss between 0 to 40% of cili-ates and phytoplankton cells has been observed afteraddition of Lugol’s solution (Montagnes et al. 1994,Broglio et al. 2003, 2004).
Image-based sizing also involves some challenges.Most importantly, shape affects the results, and cali-bration beads are uniformly spherical while phyto-plankton cells rarely are so. This makes comparisonof the sizing performance between the 2 types of par-ticles difficult in systems such as the FlowCAM. Inthe more recent versions of the FlowCAM softwarepackage, several particle size algorithms are avail-able. Choosing the proper particle size algorithm iscrucial, as less suitable algorithms have errors prop-agating into the biovolume estimates of the sampledparticle community. Surprisingly, very little attentionhas so far been paid to choosing the proper sizingalgorithm.
Other instruments that have been employed in thepast to analyse particles in the μm range includeCoulter counters. The technology behind Coultercounters is mature and well documented, and hasbeen used in technical and scientific oceanographi-cally applications since the mid 1950s (Coulter 1956).
The aim of the present study is to benchmark theperformance of the various sizing algorithms offeredby the FlowCAM against a Beckman Coulter Multi-sizer III (MIII). We also compare the effect of Lugol’sfixation on single cells and whole plankton commu-nities and compare Lugol’s fixed plankton analysedby inverted microscopy and by FlowCAM. The aimhere is to compare phytoplankton community struc-tures, assessed by the widely used combination ofinverted microscopy and settling chambers, with theFlowCAM. In this fashion we aim to bridge betweenmodern methods and classical community analysis.
MATERIALS AND METHODS
FlowCAM overview
We used a B/W FlowCAM™ II (Fluid ImagingTechnologies) controlled by the software packageVisualSpreadSheet (VISP) version 1.5.16. Except fora few technological improvements, this instrument isidentical to the original instrument outlined (Sierackiet al. 1998). The FlowCAM collects data either auto-matically at a fixed rate or in response to an externalfluorescence or particle scatter trigger. All measure-ments in the present study were done using the auto-matic imaging mode. However, the basic particle siz-
76

Jakobsen & Carstensen: FlowCAM cell sizing
ing algorithms of images are the same regardless ofthe data acquisition method used. In the automaticimaging mode, a black and white line-scan cameracollects and stores images ‘cut’ out of video framesthat are processed at a fixed rate of 9 frames s−1.More recent versions of the FlowCAM than the oneused here offer higher and customable image cap-ture rates. The camera is illuminated by an infraredLED. A lens collimates the infrared led light toenhance image contrast. Because the size of individ-ual frame pixels is known from a calibration proce-dure and the focal depth of the image is known, avolume of the captured frame can be calculated. Par-ticles and their sizes are extracted from the individ-ual image frames and separated into individual parti-cle images and stored, while the instrument keepstrack of the processed volume. Thus, the total cellabundance is the same irrespective of the algorithmused. However, the sample biomass and spectral distribution of a single species or a complex planktoncommunity is strongly dependent on the sizing algorithm used. The automatic mode seems mostuseful for whole plankton community assessmentsand, depending on the lens used, is limited by therather low sample volume processed. In the presentstudy, the flow cell processes in a slightly modifiedfashion that allows continuous vertical feeding of theflow cell. Thus, samples are fed through the verti-cally mounted flow cell from a beaker mountedabove, in a fashion that prevents particle sedimenta-tion in the flow system. The samples were stirred bya small lab stirrer set at the lowest speed. In thisstudy only a 10× objective was used in the Flow-CAM, but other magnifications are optional. Thedimension of the flow cell is determined by the objec-tive. We used the 2 × 0.1 mm (10×) flowcell, suppliedfrom Vitrocom (Sieracki et al. 1998).
Coulter counter reference
A Beckman Coulter Multisizer III (MIII) particlecounter was used as a reference for the FlowCAM.The MIII counts particles suspended in an electrolyte(seawater) using the particle electrical impedance(Coulter 1956). Particles are pumped through a nar-row orifice separating 2 electrodes, between which aweak current flows. The voltage across the orifice issensitive to changes in the impedance, which is pro-portional to the volume of the particles that passthrough the orifice. The MIII was fitted with a 100 μmorifice tube and regularly recalibrated using Beck-man Coulter NIST standard beads, but no drift was
found. The maximum particle concentration mea-sureable by MIII is limited to concentrations given bythe probability of 2 or more particle passing the ori-fice simultaneously (coincidence). For this reason,only particle concentrations <45 × 103 particles ml−1
are considered here.
Inverted microscope
An Olympus IX71 inverted microscope was used toexamine Lugol’s fixed samples. Samples were let set-tle for 24 h in a 25 ml Utermöhl chamber beforemicroscopic analysis was conducted. At least 20 par-ticles of each encountered species, and if possible 50particles of the dominant species, were sized using acalibrated stage micrometer. Particle volumes wereestimated by applying appropriate geometric shapes.
Calibrations
Size calibrations of the MIII and the FlowCAMwere conducted prior to initial analysis using inertparticles, 15 μm Beckman Coulter NIST calibrationbeads, supplied by Beckman Coulter. The invertedmicroscope was calibrated using a calibrated stagemicrometer. Additional parallel calibration countswere done in the microscope in gridded Sedwick-Rafter chambers. However, since counting perfor-mance of the FlowCAM was similar to resultsreported in the literature (Sieracki et al. 1998), thesedata were omitted.
Comparing FlowCAM size algorithms
Particles used to compare size algorithms werespherical 15 μm NIST calibration beads, the disc-shaped dinoflagellate Prorocentrum minimum, thebox-shaped diatom Thalassiosira weissflogii, the longitudinal-rotational-symmetrical Rhodomonas sa -lina, and the chain-forming diatom Skeletonemamarinoi. Particle sizes were estimated in the Flow-CAM by the 3 different sizing algorithms available.Briefly, these are: (1) the feret (FER) equivalentspherical diameter (ESD), (2) the area-based diame-ter (ABD) ESD, and (3) the ellipsoid (ELP) ESD calcu-lated as if the particle were an ellipsoid rotated alongthe length axis. The FER dimensions are the mea-sured distance between parallel lines tangent to theparticles profile perpendicular to the objective. TheFER ESD is calculated based on the average of 36
77

Aquat Microb Ecol 65: 75–87, 201178
measurements and output by the FlowCAM as theferet ESD (Fluid Imagine Technologies 2007). TheABD is the area-based diameter, measured as if allrecorded pixels of an analysed particle were mergedinto the cross-sectional area of a sphere. The ELPESD is calculated as the equivalent spherical diame-ter of a rotational ELP calculated from the length (L)and width (W) obtained directly from instrument out-put spreadsheet;
(1)
A dense solution containing the particles in question(>20 000 particle ml−1) was divided into 2 aliquots.One aliquot was analysed immediately in the MIII(1 ml analysed) and in the FlowCAM (0.12 mlanalysed). The second aliquot was fixed in acidLugol’s solution prepared according to Throndsen(1978) (4% final concentration) in brown glass bottlesand stored in the dark at 5°C immediately after fixa-tion. The Lugol’s fixed sample was likewise analysedin the FlowCAM less than 24 h after fixation. Thisallowed the effect of Lugol’s solution fixation to beexamined by comparing live and fixed cells analysedby the FlowCAM to parallel MIII analysis. All analy-ses were conducted in triplicate. Cell size distribu-tions were approximately normal for the 15 μm NISTcalibration beads and Prorocentrum minimum,whereas Rhodomonas salina, Thalassiosira weiss-flogii, and Skeletonema marinoi were right-skewedin their cell size distributions and therefore approxi-mated with the log-normal distribution. Differencesbetween MIII and the FlowCAM algorithms (bothfresh and Lugol’s-fixed samples) were analysed forthe calibration beads and the 4 species within themixed-model framework using standard likelihoodratio test statistic (PROC MIXED in SAS version 9.2),which is approximately χ2-distributed with degreesof freedom equal to the increase in number of para-meters for the alternative hypothesis. The modelincluded means and variances specific to each analy-sis method and a random factor for the variation be -tween triplicates. Furthermore, differences in cellabundance between fresh and Lugol’s-fixed sampleswere analysed for different size intervals and Flow-CAM algorithms using a 2 sample t-test (PROCTTEST in SAS version 9.2).
Sizing effects on natural phytoplankton communityanalysis: FlowCAM versus manual microscopy
A mixed plankton assemblage was prepared fromnatural seawater (NSW) collected at ‘Skovshoved
Havn’ at the coast north of Copenhagen, Denmark(55° 45’ N, 12° 36’ E). NSW was sieved through 80 μmgauze to remove metazoan predators. The sievedNSW was incubated on a slowly rotating planktonwheel for 2 d prior to analysis to increase cell abun-dance. A subsample was fixed with Lugol’s solution(4% final concentration) and analysed with the Flow-CAM. Another subsample was settled for 24 h in a25 ml Utermöhl chamber and analysed by an experi-enced taxonomist using an inverted microscope.
The analyses were conducted in triplicates andmeans and standard deviations were calculated. Thetaxonomist identified the genera of particles and,for the most dominant morphotypes, identified the species. At least 20 particles of each encounteredspecies, and if possible 50 particles of the dominantspecies, were sized using a calibrated stage micro-meter.
Effect of Lugol’s fixations on natural plankton size distribution
NSW were collected off the field station Søminesta-tionen situated in the Isefjord, Denmark (55°44’N,11°48’E) at a 4 m depth. At the sampling time the sitewas characterised by a well-mixed water columnwith a salinity of 21. The samples were brought to thelaboratory in a cool box to maintain approximate insitu temperatures. In the laboratory the samples weredivided into 2 aliquots. One sample aliquot was fixedwith Lugol’s solution in brown glass bottles andstored in the dark at 5°C for less than 24 h before theFlowCAM analysis. The other sample aliquot wasanalysed by the FlowCAM immediately after returnto the laboratory. Each plankton sample was countedin triplicate for 20 min. Sample biovolumes were cal-culated as outlined above in the section ‘ComparingFlowCAM size algorithms’ using the 3 algorithmsand summarised into logarithmic bin sizes.
RESULTS
Particle sizing
The particle size distributions were binned into his-tograms and visualized in bin sizes ranging from0.25 μm (Rhodomonas salina) to 1 μm (Skeletonemamarinoi). The unit ppm (parts per million, equal to1 mm3 × l−1) were used as a proxy for biovolume in allbinned histograms. Means and standard errors (SEs)of the cell size distribution were calculated for the
ELP ESD = 2LW( )1
3

Jakobsen & Carstensen: FlowCAM cell sizing
three FlowCAM algorithms (both fresh and Lugol’s-fixed samples) and MIII (Table 1). The variationbetween triplicate samples was small and not signifi-cant for any of the analyses (p > 0.15 for all compo-nents in Table 1).
15 μm NIST calibration beads
The sizing of NIST beads yielded means aroundthe expected 15 μm for the MIII and the differentFlowCAM algorithms used (Fig. 1a,b). There were
significant differences among mean sizes of theFlowCAM algorithms (χ2
2 = 5641.5; p < 0.0001) andbetween MIII and the algorithms (Table 1). However,the large number of observations allowed for detect-ing small differences in mean values despite the factthat they ranged less than 1 μm. SEs of the size distri-butions were almost 50% larger when the FlowCAMalgorithms were used, and there was no significantdifference between these SEs (χ2
2 = 2.6; p = 0.2725),but the SE of the size distribution was significantlyhigher for FlowCAM algorithms compared to MIII(χ2
1 = 9402.3; p < 0.0001).
79
Distribution mean Distribution SE SE between p (μm) (μm) triplicates (μm)
15 µm NIST calibration beadsCoulter MIII 14.88 0.624 0.006FlowCAM (FER) 15.45 0.888 0.187 <0.0001FlowCAM (ABD) 14.66 0.892 0.187 0.0390FlowCAM (ELP) 15.12 0.900 0.187 0.0274
Prorocentrum minimumCoulter MIII 12.42 1.767 0.000FlowCAM (FER) 12.97 1.658 0.061 <0.0001FlowCAM (ABD) 10.85 1.603 0.061 <0.0001FlowCAM (ELP) 12.23 1.674 0.061 <0.0001Lugol’s-fixed FlowCAM (FER) 13.42 2.554 0.124 <0.0001Lugol’s -fixed FlowCAM (ABD) 12.35 2.480 0.124 0.4642Lugol’s-fixed FlowCAM (ELP) 12.54 2.571 0.124 0.1872
Rhodomonas salinaa
Coulter MIII 6.93 0.772 0.005FlowCAM (FER) 8.32 1.106 0.005 <0.0001FlowCAM (ABD) 7.32 1.158 0.005 <0.0001FlowCAM (ELP) 7.53 1.131 0.005 <0.0001Lugol’s-fixed FlowCAM (FER) 8.59 1.936 0.017 <0.0001Lugol’s-fixed FlowCAM (ABD) 7.68 1.568 0.017 <0.0001Lugol’s-fixed FlowCAM (ELP) 7.66 1.499 0.017 <0.0001
Thalassiosira weissflogiia
Coulter MIII 12.38 1.433 0.000 <0.0001FlowCAM (FER) 11.79 1.913 0.003 <0.0001FlowCAM (ABD) 9.94 1.498 0.003 <0.0001FlowCAM (ELP) 10.73 1.567 0.003 <0.0001Lugol’s-fixed FlowCAM (FER) 12.25 2.507 0.000 <0.0001Lugol’s-fixed FlowCAM (ABD) 11.11 1.639 0.000 <0.0001Lugol’s-fixed FlowCAM (ELP) 11.08 1.750 0.000 <0.0001
Skeletonema marinoia
Coulter MIII 6.40 1.986 0.002FlowCAM (FER) 19.79 18.270 0.058 <0.0001FlowCAM (ABD) 7.72 4.023 0.058 0.0007FlowCAM (ELP) 8.22 4.727 0.058 <0.0001Lugol’s-fixed FlowCAM (FER) 13.59 10.207 0.105 <0.0001Lugol’s-fixed FlowCAM (ABD) 7.99 3.974 0.105 0.0096Lugol’s-fixed FlowCAM (ELP) 7.78 3.872 0.105 0.0316aSpecies had a right-skewed distribution and were approximated with a log-normal distribution
Table 1. Mean and standard error (SE) for cell sizes of analysed particles as well as the SE between triplicates. Differencesbetween means of MIII and FlowCAM algorithms were tested as contrasts (p-values in last column) within the mixed modelling framework. See ‘Materials and methods’ for more detail about statistical test used. FlowCAM algorithms used—
FER: feret; ABD: area-based diameter; ELP: ellipsoid
Prorocentrum minimum
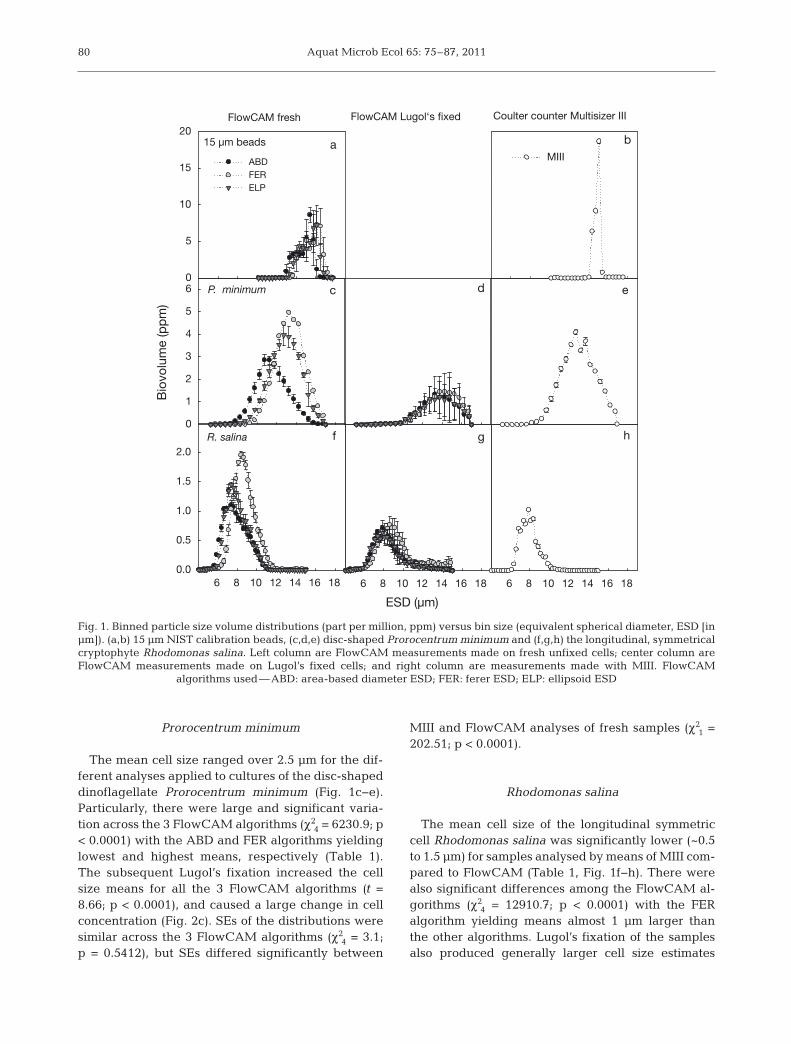
The mean cell size ranged over 2.5 μm for the dif-ferent analyses applied to cultures of the disc-shapeddinoflagellate Prorocentrum minimum (Fig. 1c−e).Particularly, there were large and significant varia-tion across the 3 FlowCAM algorithms (χ2
4 = 6230.9; p< 0.0001) with the ABD and FER algorithms yieldinglowest and highest means, respectively (Table 1).The subsequent Lugol’s fixation increased the cellsize means for all the 3 FlowCAM algorithms (t =8.66; p < 0.0001), and caused a large change in cellconcentration (Fig. 2c). SEs of the distributions weresimilar across the 3 FlowCAM algorithms (χ2
4 = 3.1;p = 0.5412), but SEs differed significantly between
MIII and FlowCAM analyses of fresh samples (χ21 =
202.51; p < 0.0001).
Rhodomonas salina
The mean cell size of the longitudinal symmetriccell Rhodomonas salina was significantly lower (~0.5to 1.5 μm) for samples analysed by means of MIII com-pared to FlowCAM (Table 1, Fig. 1f−h). There werealso significant differences among the FlowCAM al-gorithms (χ2
4 = 12910.7; p < 0.0001) with the FER algorithm yielding means almost 1 μm larger thanthe other algorithms. Lugol’s fixation of the samplesalso produced generally larger cell size estimates
Aquat Microb Ecol 65: 75–87, 201180
R. salina
6 8 10 12 14 16 18
Bio
volu
me
(pp
m)
0.0
0.5
1.0
1.5
2.0
0
1
2
3
4
5
6
6 8 10 12 14 16 18 6 8 10 12 14 16 18
P. minimum
ESD (µm)
MIII15 µm beads
0
5
10
15
20
ABDFERELP
c
a
FlowCAM fresh FlowCAM Lugol‘s fixed Coulter counter Multisizer III
b
d
f
e
g h
Fig. 1. Binned particle size volume distributions (part per million, ppm) versus bin size (equivalent spherical diameter, ESD [inμm]). (a,b) 15 μm NIST calibration beads, (c,d,e) disc-shaped Prorocentrum minimum and (f,g,h) the longitudinal, symmetricalcryptophyte Rhodomonas salina. Left column are FlowCAM measurements made on fresh unfixed cells; center column areFlowCAM measurements made on Lugol’s fixed cells; and right column are measurements made with MIII. FlowCAM
algorithms used—ABD: area-based diameter ESD; FER: ferer ESD; ELP: ellipsoid ESD

Jakobsen & Carstensen: FlowCAM cell sizing
(t = 2.18; p = 0.0290) and less cell counts (Fig. 1g). SEsof the distributions even differed between FlowCAMalgorithms (χ2
4 = 934.9; p < 0.0001), most likely due tothe wider distribution obtained with the FER algorithmapplied to Lugol’s-fixed samples (Table 1).
Thalassiosira weissflogii
The largest mean cell size for the box-shapeddiatom Thalassiosira weissflogii was obtained withMIII, which was significantly higher than the meansobtained with the FlowCAM (Table 1, Fig 1a−c).There were also significant differences betweenmeans from the three FlowCAM algorithms (χ2
4 =4400.2; p < 0.0001) with the FER algorithm yieldingmean cell sizes >1 μm higher than the other algo-rithms. The cell size distributions estimated with the
FER algorithms also had significantly higher SEsthan the other algorithms (χ2
4 = 548.7; p < 0.0001).Lugol’s fixation resulted in larger means (t = 20.93;p < 0.0001) and SEs of the cell size distribution.
Skeletonema marinoi
Cell size distributions of the chain-forming diatomSkeletonema marinoi obtained with the MIII andFlowCAM algorithms had significantly differentmeans (χ2
4 = 21539.0; p < 0.0001) and SEs (χ24 =
8796.2; p < 0.0001), with MIII having the lowestmean and lowest SE, while the FlowCAM FER algo-rithm had the largest mean and SE (Table 1,Fig. 3a,b). The FER algorithm estimated some largeparticle sizes that clearly exceeded the 2 other algo-rithms (Fig. 3). There was no general difference
81
FlowCAM fresh FlowCAM Lugol‘s fixed Coulter counter Multisizer III
ESD (µm)10 15 20 25 30 10 15 20 25 30
MIIIT. weissflogii
10 15 20 25 30
Bio
volu
me
(pp
m)
0
1
2
3
4
5
ABD
FER
ELP
a b c
Fig. 2. Binned particle size distributions of the box-shaped diatom Thalassiosira weissflogii. Panels organised similar to Fig. 1
20 40 100
Bio
volu
me
(ppm
)
0
2
510152025303540
ABD
FER
ELP
S. marinoi
ESD (µm)20 40 100 20 40 100
MIII
FlowCAM fresh FlowCAM Lugol‘s fixed Coulter counter Multisizer III
a b c
Fig. 3. Binned particle size distributions of the chain-forming diatom Skeletonema marinoi. Panels organised similar to Fig. 1

Aquat Microb Ecol 65: 75–87, 2011
in the mean cell size for fresh and Lugol’s-fixed samples (t = 1.31; p = 0.1899).
Fresh vs. Lugol’s-fixed cells at different size ranges
Although there was a general loss of cells withLugol’s fixation and distribution means were higher,this pattern was not consistent for all size intervals(Table 2). Lugol’s fixation typically reduced the num-ber of Prorocentrum minimum cells in the mid-sizerange (between 6 and 10 μm with the FER algorithm,and between 8 and 13 μm with the 2 other algo-rithms). Cell abundances of Rhodomonas salina weresignificantly lower in the range from 5 to 10 μm, butthere were significantly more cells in the Lugol’ssamples with sizes <5 μm and >11 μm. Thalassiosiraweissflogii had somewhat lower cell abundances for
sizes <13 μm, whereas there were higher abun-dances for sizes >14 μm in the Lugol’s-fixed samples.Finally, there was no effect of Lugol’s fixation onSkeletonema marinoi on cell abundance except forcell sizes >20 μm with the FER algorithm and >12 μmwith the ELP algorithm. In general, Lugol’s fixationresulted in more spread distributions of P. minimum,R. salina, and T. weissflogii, consistent with the in -creasing SE of the distributions (Table 1).
Sizing of natural plankton assemblage
The FlowCAM analysis of the Lugol’s-fixed sam-ples with mixed plankton (NSW) displayed thelargest particle abundance in the range from 10 to20 μm (Fig. 4a). A visual inspection of the corre-sponding FlowCAM image collage revealed that
82
Cell size Prorocentrum minimum Rhodomonas salina Thalassiosira weissflogii Skeletonema marinoi(μm) FRE ABD ELP FER ABD ELP FER ABD ELP FER ABD ELP
<5 0.2666 0.0127 0.0322 0.3838 0.0028 0.8938 0.3523 0.44115−6 0.6375 0.4490 0.1429 0.0002 0.2513 0.0025 0.0047 0.1054 0.8051 0.60406−7 0.0021 0.5007 0.0001 0.0000 0.0001 0.0764 0.0009 0.0185 0.1200 0.8182 0.55257−8 0.0006 0.3656 0.5062 0.0001 0.0017 0.0002 0.0200 0.0001 0.0659 0.2496 0.7260 0.94998−9 0.0003 0.0007 0.0047 0.0068 0.0712 0.0103 0.0378 0.0002 0.0901 0.2575 0.5114 0.72179−10 0.0037 0.0004 0.0008 0.0144 0.0528 0.0328 0.0043 0.0784 0.0071 0.5536 0.2865 0.278110−11 0.0595 0.0001 0.0007 0.6962 0.8360 0.4131 0.0414 0.2718 0.0653 0.6065 0.1833 0.131711−12 0.8641 0.0004 0.0013 0.0005 0.0121 0.0038 0.0122 0.2341 0.0270 0.9422 0.2387 0.057912−13 0.9753 0.0407 0.0064 0.0011 0.0374 0.0418 0.1033 0.0476 0.0234 0.6529 0.1944 0.016513−14 0.9394 0.1094 0.0609 0.0260 0.0697 0.1643 0.4979 0.3121 0.014014−15 0.4640 0.7771 0.0532 0.0336 0.2536 0.9139 0.5116 0.017115−20 0.2923 0.1217 0.0249 0.2792 0.8267 0.0090>20 0.0346 0.0026 0.8185 0.0112
Table 2. Probabilities for differences in cell abundances between fresh and Lugol’s-fixed samples for different size intervalsanalysed by t-test (n = 3 for each treatment). Variances for the 2 treatments were tested and pooled, if not significant (p ≥ 0.05).Significant differences (p < 0.05) between the 2 treatments are shown in bold, and increases in cell abundance for Lugol’s-
fixed samples are further emphasised with italics. See Table 1 for abbreviations. Cell size: cell size interval
FlowCAM
10 100
Bio
volu
me
(pp
m)
0.0
0.2
0.4
0.6
0.8
1.0
1.2MIII
10 1000
1
2
3
4
5Manual
ESD (µm)10 100
02468
101214a b c
Fig. 4. Binned particle size distributions. (a) Lugol’s-fixed natural seawater (NSW) analysed by the FlowCAM using the ELPalgorithm (ellipsoid ESD). (b) Lugol’s-fixed NSW analysed by the experienced taxonomist. (c) NSW analysed in the MIII. Errorbars show ± standard deviation (SD). Note the different scaling on the ordinate. The logarithmic size bins on the abscissa cor
respond to log (1.5) × cell volume. ESD is equal to equivalent spherical particle diameter (ESD; μm)

Jakobsen & Carstensen: FlowCAM cell sizing 83
most of the particles in the 10 to 20 μm range werechains of the diatoms Skeletonema costatum(0.47 ppm ± SD 0.12 ppm, n = 3) and Dactyliosolenfragilissimus (0.29 ppm ± SD 0.12 ppm, n = 3). Differ-ences in the biovolume estimates between the ABDand ELP algorithms were <20% (data not shown).The ABD ESD estimates of these 2 abundant speciesin the FlowCAM were 19.7 μm at 180 ± 67 cellsml−1and 12.4 μm at 1081 ± 150 cells ml−1 for D. frag-ilissimus and S. costatum, respectively. In compari-son, the microscopically analysed natural planktonassemblage displayed a characteristic biovolumepeak at around 35 μm (Fig. 4b). However, this peakin the microscopically observed distribution waslocated at cell sizes above the most common cellsizes from the FlowCAM distribution. The abun-dance peak was similar to that obtained with theFlowCAM comprised of D. fragilissimus and S. costa-tum (12 and 0.6 ppm, respectively; Table 3) with cell
ESD of 26.6 μm at 6995 ± 635 cells ml−1and 5.5 μm at1053 ± 235 cells ml−1 for D. fragilissimus and S. costa-tum, respectively. The MIII counts had a cell size distribution with a range slightly smaller than theFlowCAM and a peak similar to the manual counts(Fig. 4c). There was no camera attached to the MIII,and it was not possible to identify the dominant
species in the distribution peak tocross-check these with the FlowCAMimages or manual counts. The totalbiovolumes from the 3 methods var-ied with the FlowCAM analysis yield-ing the lowest values while the MIIIand the manual analysis generatedsimilar biovolumes (Table 4).
Effect of Lugol’s fixations on the sizedistribution
The particle size distribution ofthe FlowCAM was estimated by theABD, FER, or the ELP algorithms bothfor the freshly analysed and for theLugol’s-fixed samples on 2 separatedays (Fig. 5). On 10 October, thesmaller particle was dominated byasymmetrical dinoflagellates withmorphologies similar to Heterocapsarotundata and small diatoms, whereasthe larger size classes were domi -nated by naked dino flagellates andciliates (Fig. 5a). Four weeks later, on12 November, there was a smallbloom of H. triquetra (identified fromimage collage; data not shown) withabundances peaking around 15 to20 μm (Fig. 5b), and for the larger cellsizes the particles were mostly Skele-tonema spp. chains with a few olig-otrich ciliates in the range from 30 to
Mean biovolume SD(ppm; n = 3)
Athecate dinoflagellatesNaked dinoflagellates 10−20 μm (L/W: 2) 9.81 × 10⁻³ 4.25 × 10⁻³
Naked dinoflagellates 10−20 μm (L/W: 1.5) 4.36 × 10⁻³ 7.55 × 10⁻³
Amphidinium crassum/longum 1.17 × 10⁻² 5.49 × 10⁻³
Thecate dinoflagellatesThecate dinofl. 10−20 μm 6.98 × 10⁻² 9.91 × 10⁻²
Ceratium tripos 1.16 × 10⁻² 2.01 × 10⁻²
DiatomsAmphiprora sp. 5.56 × 10⁻³ 1.82 × 10⁻³
Centric spp. 20−30 μm 6.54 × 10⁻³ 5.67 × 10⁻³
Centric spp. 30−40 μm 1.50 × 10⁻³ 2.59 × 10⁻³
Centric spp. 60−70 μm 7.67 × 10⁻² 1.09 × 10⁻¹
Centric spp. 70−80 μm 4.42 × 10⁻² 4.42 × 10⁻²
Chatoceros socialis/radians 2.79 × 10⁻¹ 1.48 × 10⁻¹
Dactyliosolen fragilissimus 12.01 3.03Nitzschia cf. closterium 2.26 × 10⁻³ 2.86 × 10⁻³
Pennate spp. 10−20 μm 1.24 × 10⁻² 7.30 × 10⁻³
Pennate spp. 20−30 μm 3.58 × 10⁻⁴ 3.19 × 10⁻⁴
Pennate spp. 60−70 μm 1.08 × 10⁻² 1.08 × 10⁻²
Pennate spp. 70−80 μm 9.66 × 10⁻³ 1.04 × 10⁻²
Skeletonema sp. 6.09 × 10⁻¹ 1.17 × 10⁻¹
Thallassionema nitzschioides 1.55 × 10⁻² 2.59 × 10⁻³
FlagellatesFlagellates <5 μm 2.24 × 10⁻² 3.54 × 10⁻³
Flagellates 5−10 μm 1.20 × 10⁻¹ 3.76 × 10⁻²
Flagellates 10−15 μm 5.68 × 10⁻³ 9.84 × 10⁻³
CiliatesMesodinium rubrum 8.37 × 10⁻⁴ 1.45 × 10⁻³
Round ciliates (10−20 μm) 9.81 × 10⁻³ 1.70 × 10⁻²
Elongate ciliates (20−30 μm) 1.74 × 10⁻⁴ 3.02 × 10⁻⁴
Strombidinium-like (20−30 μm) (cone shaped) 1.23 × 10⁻³ 1.08 × 10⁻³
Table 3. Diversity table obtained by the microscopically analyzed mixed plankton assemblage. L: length, W: width
Biovolume (ppm) SD
FlowCAM (Lugol’s fixed) 5.29 1.7MIII (fresh unfixed) 13.34 2.9Manual count (Lugol’s fixed) 14.75 1.4
Table 4. Integrated biovolume (ppm) of natural seawater(NSW)-analysed sample generated by the FlowCAM (ellip-soid [ELP] algorithm), the MIII and manually by the taxono-mist. The FlowCAM biovolume is estimated using the ELP
particle size algorithm

Aquat Microb Ecol 65: 75–87, 2011
60 μm (Fig. 5b). When the biomasses were binned inlogarithmic bins, there was a more or less constantbiovolume distribution in each bin for the ABD andthe ELP algorithm, except for some small peaks madeby the cell mentioned above with this paragraph(Table 5, Fig. 5a,b). The FER algorithm yielded muchhigher total biovolume in all size classes and sug-gested the biovolume increased with increasing par-ticle diameter at both the studied dates (Fig. 5a,b). Inthe November sample, we also ob served an almost 4-fold higher biomass in the smallest bin category. Lu-gol’s fixation reduced abundances in all size bins re-gardless of the algorithm used (Fig. 5c,d). Moreimportant, fixation also changed the particle size
distribution towards smaller cells in all 3 algorithmsused, which in turn resulted in an underestimation ofthe plankton community biovolume (Table 5).
DISCUSSION
Optical plankton analysis can reveal importantcharacteristics of the analysed sample, but the characteristics are biased by the method employed.Comparing the sizes estimated from images by theFlowCAM to those estimated by the MIII, there are afew generalities to observe. First, the FlowCAM par-ticle analysis gave sizes that were identical to theMIII only for the 15 μm NIST and using the ABD andELP algorithms (Table 1, Fig. 1a). Among the remain-ing unfixed particle measurements, only Skele-tonema marinoi ABD size was similar to that of MIII(Table 1, Fig. 3a,c). All other cell types had significant differences be tween FlowCAM and theMIII. Second, increasing particle morphological com-plexity such as the chains ob served in the S. marinoiincreased the difference between FlowCAM algo-rithms and the MIII. In the study by Sieracki et al.(1998) of single particles, FlowCAM estimated sizes
were found to match microscopicallymeasured particles. The most likelyreasons for this are that we used MIIIas a reference rather than a micro-scope and that the morphological com-plexity of S. marinoi specimens mayhave been higher than the dia tomsused in the past.
The 3 available FlowCAM sizingalgorithms worked well and yieldedmore or less similar cell sizes whenparticles were spherical, and onlyminor differences between the FER,ABD, or the ELP algorithms werefound. Diatoms, on the other hand,seem to be the most challenging parti-cles to size. Diatom chains are made ofindividual frustules that are more orless loosely connected. In the MIII theinter-connections between the frus-tules may break by the impedance cur-rent of the MIII. Thus, MIII records theparticle volume of individual cell in thechain, while the FlowCAM imagingignores the interspaces between indi-vidual cells of the chain. MIII found anaverage particle size of about 6.5 μmfor the chain-forming diatom Skele-
84
Date ABD FER ELP(2007) Fresh Lugol’s Fresh Lugol’s Fresh Lugol’s
Oct 10 1.8 0.2 9.8 1.6 3.4 0.3Nov 12 2.5 0.3 18.3 1.8 3.3 0.4
Table 5. Community biovolume (ppm) at Søminenstationenduring the 2 sampling days. The biomasses are estimatedusing each of the 3 algorithms available with the FlowCAM.
See Table 1 for abbreviation
10 Oct 2007
Bio
volu
me
(pp
m)
0.0
0.5
1.0
1.5
2.0
2.5
3.0
ABD
FER
ELP
12 Nov 2007
10 20 30 40 50 900.0
0.5
1.0
1.5
2.0
2.5
10 Oct 2007
0.0
0.1
0.2
0.3
0.4
0.5
12 Nov 2007
ESD (µm)10 20 30 40 50 90
0.0
0.1
0.2
0.3
0.4
a
b
c
d
Fig. 5. Natural sea water analyzed by the FlowCAM. Binned biovolumes ofparticle size distribution against equivalent spherical diameter (ESD). (a,b)freshly analyzed and (c,d) corresponding samples fixed with Lugol’s solution.The logarithmic size bins on the abscissa correspond to log (1.5) × cell
volume. See Table 1 for abbreviations

Jakobsen & Carstensen: FlowCAM cell sizing
tonema marinoi, while the FlowCAM suggested thatthe chain sizes ranged between 7.5 and 8.2 μm forABD and the ELP algorithms (Fig. 3a). The FlowCAMimage collages reveal that the most dominant S.marinoi chain types were singles, doubles, andtriples, with longer chains being less abundant. Thus,the sizing of the 2 instruments does not match verywell for chain-forming species. The sizing discrep-ancy between the 2 instruments rests on instrumen-tal differences, highlighting the difficulties associ-ated with identifying the ‘true’ particle size of livecells. Finally, the FlowCAM FER algorithm produceda substantially larger size than the 2 alternative algo-rithms, with the ABD size estimate being closest tothat obtained by the MIII, suggesting that the FERalgorithm should be used with prudence.
Particle symmetry is, in fact, the most challengingsingle parameter in determining cell volumes fromimages. As an example, the average length:widthratio of Thalassiosira weissflogii is about 1.4. On theother hand, the FlowCAM images suggest that parti-cles orientate in various directions relative to thecamera during image capture, thus increasing thevariance of the estimated mean size. A similar prob-lem was presented by the disc-shaped cell Prorocen-trum minimum, which could either be displayed asan elongate ellipsoid or as a sphere. This may explainwhy the SEs of the cell sizes were slightly higher inthe FlowCAM estimates, except for Rhodomonassalina, which always oriented with the length axisperpendicular to the camera. However, the problemthat 2-dimensional images present is not differentfrom what microscopists have been handling formany of the past decades (Olenina et al. 2006).
A proper optical size estimate does not onlydepend on the sizing algorithm alone, but also on theinstrument calibration and, most important, on theimage resolution (Álvarez et al. 2011). Obviously,cells sampled at lower magnification are more diffi-cult to size than cells sampled with higher magnifica-tion. In any case, flagellates smaller than Rhodo -monas salina must be sized with the 20× objective,while larger particles are sizable with the 10× objec-tive or even with the 4× objective, and results similarto the data presented here are in fact obtained withthe 4× on large Gymnodinium sanguinium (data notshown). Thus, sizing and taxonomical resolution inthe FlowCAM is also governed by the magnificationused. It is therefore desirable to use the highest mag-nification possible for a given application to enhanceparticle sizing and to improve identification. Thetrade-off of increased magnification is a lower vol-ume to be analysed, which may impact counting sta-
tistics of the less abundant species. Alternatively, theFlowCAM analysis could be run for longer time toincrease the sample volume processed.
In microscopic studies of Lugol’s-fixed samples inthe >10 μm particle size range, size estimates arebased on an average of e.g. 50 measurements of eachspecies. This approach introduces bias in the bio -volume estimate if the sample e.g. contains diatomchains with variable chain lengths or if the diatomsfrustules vary in size. This is also supported by thediscrepancy in size distributions shown in Fig. 4.Moreover, there is a chance that a microscopicallydetermined biomass and species composition is quitedifferent from the ‘true’ biomass of the studied com-munity due to the human factor effects. These mayinclude human fatigue, boredom, and inexperienceof the operator (Culverhouse et al. 2003, Culverhouse2007). Comparing the integrated biovolumes of theLugol’s-fixed sample in the FlowCAM with the freshNSW analysed in the MIII, there was a ca. 60%reduction in integrated sample biovolume (Fig. 5).Although this is a rather high loss ratio, it is close therange found in the comparison of unfixed single cellsagainst Lugol’s-fixed single cell, e.g. reported for cil-iates (Broglio et al. 2003, 2004).
In the comparison of the total community biovol-ume between the manual microscopically analysisand the MIII, a close correspondence in total commu-nity biovolume was found (Table 4). However, thepeak of the size distributions (modus) appeared posi-tioned differently among the methods (Fig. 4). More-over, the comparison between the 2 most dominantspecies in the microscopic analysis and in the Flow-CAM suggested that abundance estimates differedbetween the 2 methods, which in turn cascaded intothe disproportion between the characteristics of theparticle size distribution and the total communitybiomass.
In the analysis of the different plankton communi-ties from NSW sampled at Søminestationen, a largedifference between the integrated plankton biovol-umes of the different algorithms was found, with theFER being larger than 2 other algorithms. FixingNSW with Lugol’s solution changed the integratedbiovolume and the particle size distributions dramat-ically. Most striking was the disappearance of largeparticles such as ciliates and single-celled largediatoms. Similar biovolume loss was also found forwhole plankton communities (Klein Breteler 1985,Zarauz & Irigoien 2008). The loss in cell counts andcommunity structure may be a result of cell break upand release of cell organelles, which may aggregateinto unrecognisable particle clusters. This is sup-
85

Aquat Microb Ecol 65: 75–87, 2011
ported by the appearance of a post-fixation peak ofsmaller particles (Klein Breteler 1985). The imageresolution was too low in the present study to identifycell organelles outside the cells in the Lugol’s-fixedtreatments, but in the case of Lugol’s-fixed Thalas-siosira weissflogii (Fig. 2a), accumulation of largerfuzzy aggregates was observed in the FlowCAM viz.the observation by Klein Breteler (1985).
An important aspect of the present study is to com-pare the FlowCAM particle sizes and biovolumeswith past measurement techniques. Such compar-isons may influence our understanding of planktonecology but also form a bridge between studies. Set-ting a FlowCAM protocol to address this type ofquestion depends on the application. However, ourwork suggests that Lugol’s solution should beavoided and that the ABD algorithm yields sizes thatcompare best with the Coulter counter Multisizer III.Additionally, the data of the present work imply thatthe Lugol’s biovolume estimates of natural phyto-plankton may be underestimated, an observationsupported by Klein Breteler (1985) who also studiedthe fixation effect on whole plankton communities.Our observations of losses up to 50% in cell biomassagree well with the observation on fixation loss in cil-iates by Broglio et al. (2004). Such underestimationultimately cascades into food-web carbon flow rateestimates that in turn impact our current understand-ing of turnover processes the ocean.
Choosing the wrong sizing algorithm stronglyinfluence the calculated bio-volumes. Additionally,to address the biomass of morphological complexplankton structures, such as chain-forming Skele-tonema marinoi investigated here or large hollowPhaeocystis colonies that typify many shelf areas, theABD algorithm seems to the most appropriateapproach when using the FlowCAM.
Acknowledgements. This research is a contribution to theWISER project (contract #FP7-226273), funded by the Euro-pean Commission. We are indebted to the 3 anonymousreviewers who carefully reviewed and provided construc-tive critique that improved an earlier manuscript draft.
LITERATURE CITED
Álvarez E, Lopez-Urrutia Á, Nogueira E, Fraga S (2011)How to effectively sample the plankton size spectrum? Acase study using FlowCAM. J Plankton Res 33: 1119−1133
Broglio E, Jónasdottir SH, Calbet A, Jakobsen HH, Saiz E(2003) Effect of heterotrophic versus autotrophic food onfeeding and reproduction of the calanoid copepod Acar-tia tonsa: relationship with prey fatty acid composition.Aquat Microb Ecol 31: 267−278
Broglio E, Saiz E, Calbet A, Trepat I, Alcaraz M (2004)Trophic impact and prey selection by crustacean zoo-plankton on the microbial communities of an olig-otrophic coastal area (NW Mediterranean Sea). AquatMicrob Ecol 35: 65−78
Buskey EJ, Hyatt CJ (2006) Use of the FlowCAM for semi-automated recognition and enumeration of red tide cells(Karenia brevis) in natural plankton samples. HarmfulAlgae 5: 685−692
Campbell L, Walpert JN, Guinasso NL (2008) A new buoy-based in situ optical early warning system for harmfulalgal blooms in the Gulf of Mexico. Nova Hedwigia 133: 161−170
Choi JW, Stoecker DK (1989) Effects of fixation on cell vol-ume of marine planktonic protozoa. Appl Environ Micro-biol 55: 1761−1765
Coulter WH (1956). High speed automatic blood cell counterand cell analyser. Nat Electr Conf 12: 1034−1040
Culverhouse PF (2007) Human and machine factors in algaemonitoring performance. Ecol Inform 2: 361−366
Culverhouse PF, Williams R, Reguera B, Herry V, Gonzalez-Gil S (2003) Do experts make mistakes? A comparison ofhuman and machine identification of dinoflagellates.Mar Ecol Prog Ser 247: 17−25
Cunningham A, Mckee D, Craig S, Tarran G, Widdicombe C(2003) Fine-scale variability in phytoplankton commu-nity structure and inherent optical properties measuredfrom an autonomous underwater vehicle. J Mar Syst 43: 51−59
Davis CS, Gallager SM, Berman MS, Haury LR, Strickler JR(1992) The Video Plankton Recorder (VPR): design andinitial results. Arch Hydrobiol Beih Ergebn Limnol 36: 67−81
Herman AW, Beanlands B, Phillips EF (2004) The next generation of optical plankton counter: the laser-OPC.J Plankton Res 26: 1135−1145
Jerome CA, Montagnes DJS, Taylor FJR (1993) The effect ofthe quantitative protagol stain and Lugol’s and Bouin’sfixatives on cell size: a more accurate estimate of ciliatespecies biomass. J Eukaryot Microbiol 40: 254−259
Klein Breteler WCM (1985) Fixation artefacts of phytoplank-ton in zooplankton grazing experiments. Hydrobiol Bull1: 13−19
Menden-Deuer S, Lessard EJ (2000) Carbon to volume rela-tionships for dinoflagellates, diatoms, and other protistplankton. Limnol Oceanogr 45: 569−579
Montagnes DJS, Berges JA, Harrison PJ, Taylor FJR (1994)Estimating carbon, nitrogen, protein, and chlorophyll afrom volume in marine phytoplankton. Limnol Oceanogr39: 1044−1060
Nielsen LT, Jakobsen HH, Hansen PJ (2010) High resilienceof two coastal plankton communities to twenty-first cen-tury seawater acidification: evidence from microcosmstudies. Mar Biol Res 6: 542−555
Olenina I, Hajdu S, Edler L, Andersson A and others (2006).Biovolumes and size-classes of phytoplankton in theBaltic Sea. HELCOM Baltic Sea Environment Proceed-ings 106
Pedersen TM, Almeda R, Fotel FL, Jakobsen HH, Mariani P,Hansen BW (2010) Larval growth in the dominant poly-chaete Polydora ciliata is food-limited in a eutrophicDanish estuary (Isefjord). Mar Ecol Prog Ser 407: 99−110
Sieracki CK, Sieracki ME, Yentsch CS (1998) An imaging-in-flow system for automated analysis of marine micro -plankton. Mar Ecol Prog Ser 168: 285−296
86

Jakobsen & Carstensen: FlowCAM cell sizing
Sosik HM, Olson RJ (2007) Automated taxonomic classifica-tion of phytoplankton sampled with imaging-in-flowcytometry. Limnol Oceanogr Methods 5: 204−216
Throndsen J (1978). Preservation and storage. In: Sournia A(ed) Monographs on oceanographic methodology.UNESCO, Paris, p 69−74
Thyssen M, Mathieu D, Garcia N, Denis M (2008) Short-term variation of phytoplankton assemblages inMediterranean coastal waters recorded with an auto-mated submerged flow cytometer. J Plankton Res 30: 1027−1040
Utermöhl H (1958) Zur Vervollkommung der quantitativen
Phytoplankton-Methodik. Mitt Int Ver Theor AngewLimnol 9:1–38
Wiackowski K, Brett MT, Goldman CR (1994a) Differentialeffects of zooplankton species on ciliate communitystructure. Limnol Oceanogr 39: 486−492
Wiackowski K, Doniec A, Fyda J (1994b) An empirical studyof the effect of fixation on ciliate cell volume. Mar MicrobFood Webs 8: 59−69
Zarauz L, Irigoien X (2008) Effects of Lugol’s fixation on thesize structure of natural nano-microplankton samples,analyzed by means of an automatic counting method.J Plankton Res 30: 1297−1303
87
Editorial responsibility: Josep Gasol,Barcelona, Spain
Submitted: August 16, 2010; Accepted: September 11, 2011Proofs received from author(s): November 10, 2011