flow assurance: gas hydrates and wax...flow assurance: gas hydrates and wax – december 2003...
TRANSCRIPT

Flow Assurance: Gas Hydrates and Wax – December 2003 Steering Committee Meeting
Flow Assurance:Gas Hydrates and Wax
December 2002-November 2005 Programme

Flow Assurance: Gas Hydrates and Wax – December 2003 Steering Committee Meeting
Objectives• Hydrate formation in low water content gases
• Hydrate inhibition, inhibitor loss and/or salt precipitation in methanol, glycol, and salt systems
• Hydrate stability zone of oil systems at high pressure conditions
• Gas hydrates in water-oil emulsions
• Hydrates in high water cut (50-90%) oil systems
• Wax phase boundary, and effect of wax on hydrates (and vice versa)

Flow Assurance: Gas Hydrates and Wax – December 2003 Steering Committee Meeting
Hydrates in low water content gases• Water content in gas systems
– Experimental measurements (gas, water, ice, hydrates)– Reliability of the measurements
– Extension to other conditions– Reliability of the assumptions
• Hydrate phase equilibria in low water content gasesProgress in the last six months• Theoretical
– Thermodynamic modelling (Lw-V, H-V, I-V regions)– Semi-empirical correlation and comparison with an existing model
• Experimental– Methane solubility in EG aqueous solutions– Water dew point measurement using QCM

Flow Assurance: Gas Hydrates and Wax – December 2003 Steering Committee Meeting
Hydrate inhibition in methanol, glycol, and salt systems• Salts and organic inhibitor systems
– Hydrate inhibition– Salting-out– Inhibitor distribution
Progress in the last six months• Thermodynamic modelling of EtOH, NaCl-EtOH and
KCl-MeOH• Hydrate phase boundary measurements (MeOH-NaCl,
MeOH-KCl, EtOH, EtOH-NaCl)• Correlation for estimating gas hydrate inhibition,
extension to MeOH-KCl

Flow Assurance: Gas Hydrates and Wax – December 2003 Steering Committee Meeting
Hydrate stability zone of oil systems at high pressure conditions• Deepwater operations and long tiebacks• Limited available data• Measurement challenges
– Visual techniques– P vs T techniques
Progress so far• Construction and commissioning of the very high
pressure hydrate cell (2,000 bar, 30,000 psia)• Nitrogen hydrate phase boundary measurements• Oil with distilled water and aqueous ethanol solutions

Flow Assurance: Gas Hydrates and Wax – December 2003 Steering Committee Meeting
Wax-hydrate combinations• Wax and hydrates in subsea pipelines• Wax phase boundary determination
– Experimental (WAT vs WDT, step-heating)– Thermodynamic modelling
Progress in the last six months• Experimental
– QCM in measuring WAT and WDT for a gas condensate and synthetic mixtures
– Effect of light components– Hydrates and wax
• Modelling– Developing a new wax semi-empirical correlation
Flow Assurance: Gas Hydrates and Wax – December 2003 Steering Committee Meeting
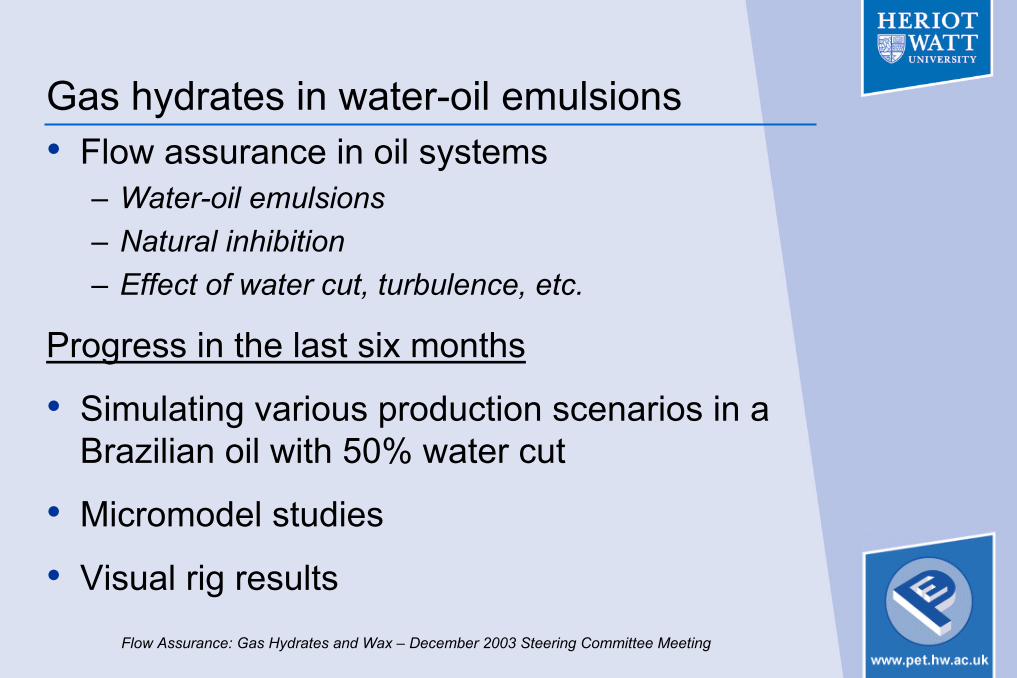
Gas hydrates in water-oil emulsions• Flow assurance in oil systems
– Water-oil emulsions– Natural inhibition– Effect of water cut, turbulence, etc.
Progress in the last six months
• Simulating various production scenarios in a Brazilian oil with 50% water cut
• Micromodel studies
• Visual rig results

Experimental Work:
HYDRATE MEASUREMENTS
Ross AndersonRod Burgass

Hydrates: Outline
Hydrate dissociation points measured for:
• Single inhibitors– Methane with Ethanol
• Mixed salt-organic inhibitor systems (480 bar)– Methane with Methanol / NaCl– Methane with Methanol / KCl– Methane with Ethanol / NaCl
• Oil systems – High pressure (1500 bar)– Crude with distilled water and with ethanol

Hydrates: Experimental Methods
• Single/mixed inhibitors with methane– Rig-1– Isochoric step-heating techniques
• Oil systems– Very High Pressure Rig– Isochoric step-heating techniques
• Experimental methods detailed in March 2003 Progress Report

Hydrates: Methane with Ethanol
10
100
1000
-10 -5 0 5 10 15 20 25 30
T / C
P / b
ar
15 mass% Ethanol, Kobayashi et al (1951)15 mass% Ethanol, Previous Project30 mass% Ethanol, This workC1, bulk
C1 bulk data:Deaton and Frost (1946)Mcleod and Campbell (1961)Jhaveri and Robinson (1965)

Hydrates: Methane with Methanol / NaCl
10
100
1000
-25 -20 -15 -10 -5 0 5 10 15 20 25 30
T / C
P / b
ar
5.63% NaCl / 9.43% MeOH4.44% NaCl / 28.64% MeOH10.56% NaCl / 8.91 % MeOHC1, bulk
C1 bulk data:Deaton and Frost (1946)Mcleod and Campbell (1961)Jhaveri and Robinson (1965)
Triangles = Jager and Sloan (2002)

Hydrates: Methane with Methanol / KCl
10
100
1000
-15 -10 -5 0 5 10 15 20 25 30
T / C
P / b
ar
10 mass% KCl / 15 mass% MeOH7 mass% KCl / 25 mass% MeOHC1, bulk
C1 bulk data:Deaton and Frost (1946)Mcleod and Campbell (1961)Jhaveri and Robinson (1965)

Hydrates: Methane with Ethanol / NaCl
10
100
1000
-20 -15 -10 -5 0 5 10 15 20 25 30
T / C
P / b
ar
10 mass% NaCl / 10 mass% Ethanol7 mass% NaCl / 30 mass% EthanolC1, bulk
C1 bulk data:Deaton and Frost (1946)Mcleod and Campbell (1961)Jhaveri and Robinson (1965)

Hydrates: High Pressure Oil Data
• Dead North Sea Crude
• Known composition (from Reservoir Fluids project)
• Added light components to make ‘live’
• Bubble point measured
• Hydrate dissociation points measured (to 1500 bar) for:– Distilled water– 16 mass% ethanol

CO
2 N2
C1
C2
C3
iC4
nC4
iC5
nC5
C6 C7 C8
C9
C10
C11
C12 C13
C14
C15
C16
C17
C18
C19
C20
C21
+
0
10
20
30
40
50
60
CO2 C1 C3
nC4
nC5 C7 C9
C11 C13 C15 C17 C19C21
+
Mol
e%High Pressure Hydrate Tests: Oil Composition
Component

High Pressure Hydrate Tests: Hydrate Stability Zone
0
500
1000
1500
0 5 10 15 20 25 30 35
T / C
P / b
ar
Distilled water16 mass% ethanolBubble Point (21C, 165.5 bar)
Abovebubble point

Flow Assurance: Gas Hydrate and Wax - December 2003 Steering Committee Meeting
Thermodynamic ModellingSalts and Organic Inhibitors
Rahim (Amir) Masoudi

Flow Assurance: Gas Hydrate and Wax - December 2003 Steering Committee Meeting
Outline• Thermodynamic modelling of EtOH,
NaCl-EtOH, and KCl-MeOH
• Validation of the model for gas hydrate
• Validation of the newly developed correlation for KCl-MeOH
• Conclusions
Flow Assurance: Gas Hydrate and Wax - December 2003 Steering Committee Meeting
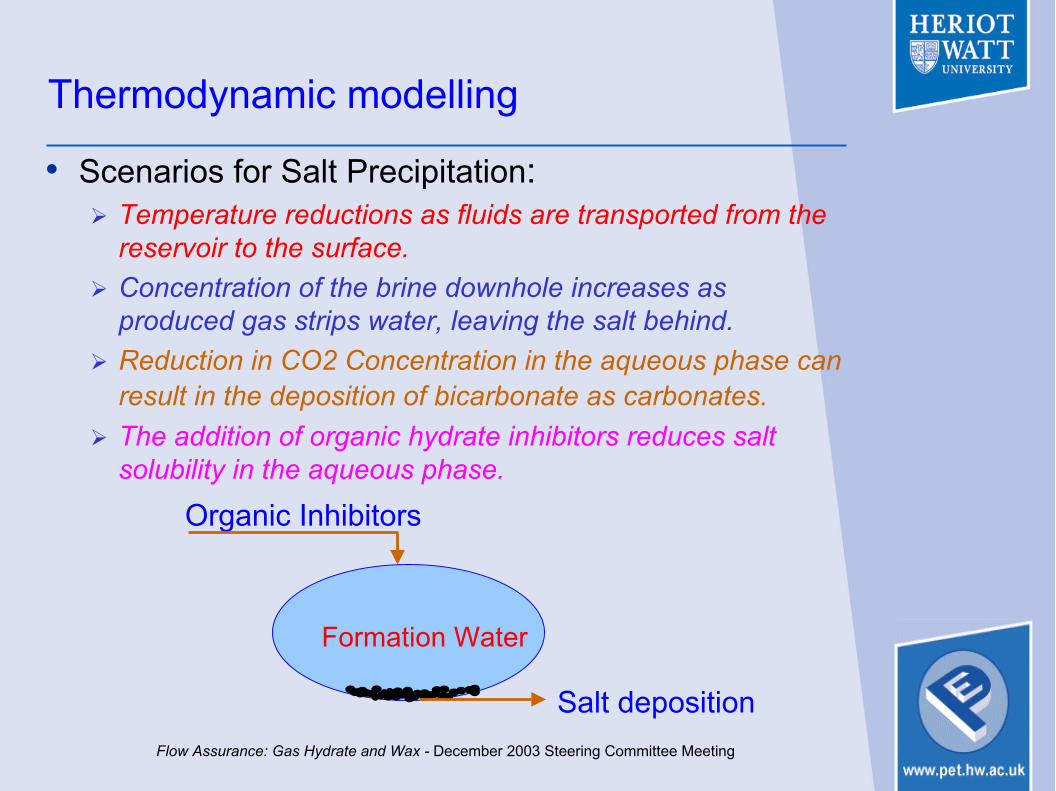
Thermodynamic modelling
• Scenarios for Salt Precipitation:Temperature reductions as fluids are transported from the reservoir to the surface.Concentration of the brine downhole increases as produced gas strips water, leaving the salt behind.Reduction in CO2 Concentration in the aqueous phase can result in the deposition of bicarbonate as carbonates.The addition of organic hydrate inhibitors reduces salt solubility in the aqueous phase.
Formation Water
Organic Inhibitors
Salt deposition

Flow Assurance: Gas Hydrate and Wax - December 2003 Steering Committee Meeting
Thermodynamic modelling
• The new thermodynamic approachSalt is treated as a pseudo component while its critical properties and acentric factor are optimised.Valderrama-Patel-Teja (VPT) EoSNon-Density Dependent (NDD) Mixing RulesSolid solution theory of van der Waals and Platteeuw
• Data requirements:Initial guess for Critical properties of salt (TC, PC, VC,ZC)Experimental data
Freezing point of salt aqueous solutionsBoiling point of salt aqueous solutionsSalt solubility

Flow Assurance: Gas Hydrate and Wax - December 2003 Steering Committee Meeting
Thermodynamic modelling
• Binary Interaction Parameters (BIPs) OptimisationWater-SaltSalt-SaltSalt-Organic InhibitorGas-Salt
• NaCl, KCl and CaCl2 as well as MEG have already been modelled.

Flow Assurance: Gas Hydrate and Wax - December 2003 Steering Committee Meeting
Summarising the capabilities of the modelSummarising the capabilities of the model
• Salt precipitation
• Hydrate stability zone
• Maximum hydrate inhibition effect
• Gas solubility
• Freezing point prediction
• Boiling point prediction
• Vapour pressure prediction
• Composition of all present equilibrium phases

Flow Assurance: Gas Hydrate and Wax - December 2003 Steering Committee Meeting
Modelling ethanolModelling ethanol
• Freezing point temperature of aqueous ethanol solutions.
-40.00
-30.00
-20.00
-10.00
0.00
0 10 20 30 40 50
EtOH / mass%
T / C
Exp., CRC
Exp., ICT
Predictions, this work

Flow Assurance: Gas Hydrate and Wax - December 2003 Steering Committee Meeting
Modelling ethanolModelling ethanol
• T-x diagram of the binary ethanol/water.
72
77
82
87
92
97
102
0 20 40 60 80 100
EtOH / mass%
T / C
Exp., 640 mmHg, ICTPrediction, 640 mmHgExp., 700 mmHg, ICTPrediction, 700 mmHgExp., 760 mmHg, ICTPrediction, 760 mmHgExp., 800 mmHg, ICTPrediction, 800 mmHg

Flow Assurance: Gas Hydrate and Wax - December 2003 Steering Committee Meeting
Modelling KCl and methanolModelling KCl and methanol
• Experimental and calculated freezing point temperature for ternary KCl/MeOH/water mixtures
KCl MeOH Experimental Calculated AD(mass%) (mass%) (C ± 0.2) ( C ) ( C )
3.0 2.7 -3.4 -3.2 0.24.9 5.2 -6.1 -6.3 0.27.1 7.7 -9.9 -9.9 0.09.7 10.2 -14.2 -14.6 0.4
Freezing Point temperature

Flow Assurance: Gas Hydrate and Wax - December 2003 Steering Committee Meeting
Modelling KCl and methanolModelling KCl and methanol
• Experimental and calculated boiling point temperature for ternary KCl/MeOH/water mixtures
KCl MeOH Experimental Calculated AD(mass%) (mass%) (C ± 0.2) ( C ) ( C )
2.6 3.6 96.2 97.0 0.819.2 4.3 94.9 94.9 0.04.9 4.5 94.9 96.0 1.19.6 10.2 89.6 90.5 0.913.8 16.4 84.0 84.4 0.46.1 27.9 81.0 81.3 0.3
Boiling Point temperature

Flow Assurance: Gas Hydrate and Wax - December 2003 Steering Committee Meeting
Modelling salt precipitationModelling salt precipitation
• Solubility of KCl in aqueous methanol solutions as a function oftemperature.
0
5
10
15
20
25
30
35
40
45
50
0 10 20 30 40 50
T / C
KCl /
mas
s%
Exp., 0 mass% MeOHExp., 10 mass% MeOHExp., 20 mass% MeOHExp., 40 mass% MeOHExp., 50 mass% MeOHPredictions
exp. data: Deepstar data (0.0 ºC); Pinho S.P. & Macedo E.A., 1996 (25, 50 ºC)

Flow Assurance: Gas Hydrate and Wax - December 2003 Steering Committee Meeting
Modelling salt precipitationModelling salt precipitation
• Solubility of KCl in aqueous methanol solutions as a function ofmethanol concentration.
0
5
10
15
20
25
30
0 10 20 30 40 50
MeOH / mass%
KCl /
mas
s%
exp., 0 deg C, Deepstar dataexp., 25 deg C, Pinho & Macedo (1996)exp., 50 deg C, Pinho & Macedo (1996)Predictions

Flow Assurance: Gas Hydrate and Wax - December 2003 Steering Committee Meeting
Modelling NaCl and ethanolModelling NaCl and ethanol
• Experimental and calculated freezing point temperature for ternary NaCl/EeOH/water mixtures
NaCl EtOH Experimental Calculated AD(mass%) (mass%) (C ± 0.2) ( C ) ( C )
2.6 3.5 -3.5 -3.3 0.25.0 5.3 -6.4 -6.2 0.28.3 7.5 -11.1 -10.9 0.2
10.1 9.9 -14.8 -15.1 0.312.7 12.7 -21.7 -21.6 0.1
Freezing Point temperature

Flow Assurance: Gas Hydrate and Wax - December 2003 Steering Committee Meeting
Modelling NaCl and ethanolModelling NaCl and ethanol
• Experimental and calculated boiling point temperature for ternary NaCl/EeOH/water mixtures
NaCl EtOH Experimental Calculated AD(mass%) (mass%) (C ± 0.2) ( C ) ( C )
2.6 3.5 95.5 95.8 0.35.0 5.3 92.5 93.5 1.0
21.0 4.1 92.0 91.6 0.410.1 9.9 87.4 88.4 0.915.1 15.9 82.8 82.8 0.06.4 33.2 81.8 82.2 0.4
Boiling Point temperature

Flow Assurance: Gas Hydrate and Wax - December 2003 Steering Committee Meeting
Modelling salt precipitationModelling salt precipitation
• Solubility of NaCl in aqueous ethanol solutions as a function oftemperature.
0
5
10
15
20
25
30
25 35 45 55 65 75
T / C
NaC
l / m
ass%
Exp., 0.0 mass% EtOHExp., 10 mass% EtOHExp., 20 mass% EtOHExp., 40 mass% EtOHExp., 50 mass% EtOHPredictions, this work
Exp. data: Pinho & Macedo , 1996

Flow Assurance: Gas Hydrate and Wax - December 2003 Steering Committee Meeting
Modelling salt precipitationModelling salt precipitation
• Solubility of NaCl in aqueous ethanol solutions as a function ofethanol concentration.
0
5
10
15
20
25
30
0 10 20 30 40 50
EtOH / mass%
NaC
l / m
ass%
Exp., 25 deg C
Exp., 50 deg C
Exp., 75 deg C
Predictions, this work
Exp. data: Pinho & Macedo , 1996

Flow Assurance: Gas Hydrate and Wax - December 2003 Steering Committee Meeting
Outline• Thermodynamic modelling of EtOH,
NaCl-EtOH, and KCl-MeOH
• Validation of the model for gas hydrate
• Validation of the newly developed correlation for KCl-MeOH
• Conclusions

Flow Assurance: Gas Hydrate and Wax - December 2003 Steering Committee Meeting
Methane hydrate dissociation point in the presence of ethanol aqueous solutions
10
1000
-8 -3 2 7 12 17 22 27
T / C
P /
bar
Exp., distilled waterExp., 15 mass% EtOH, Kobayashi (1951)Exp., 15 mass% EtOH, this workExp., 30 mass% EtOH, this workPredictions
C1-distilled water data:Deaton and Frost (1946)Mcleod and Campbell (1961)Jhaveri and Robinson (1965)
Flow Assurance: Gas Hydrate and Wax - December 2003 Steering Committee Meeting
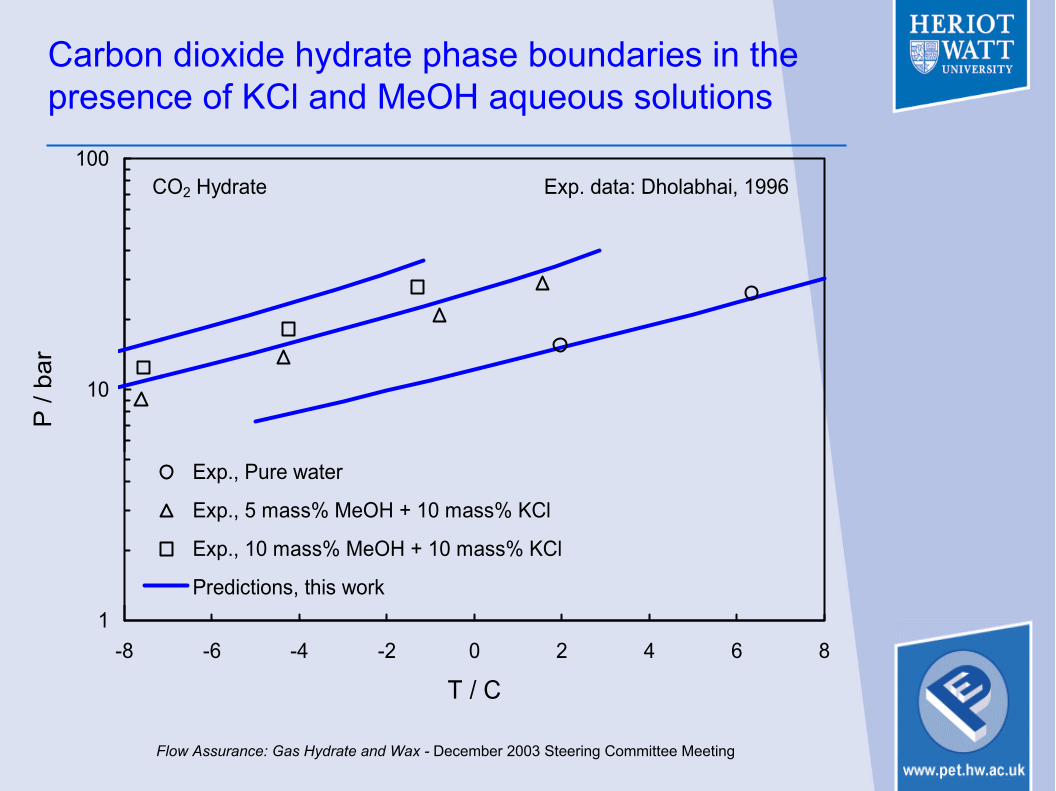
Carbon dioxide hydrate phase boundaries in the presence of KCl and MeOH aqueous solutions
1
10
100
-8 -6 -4 -2 0 2 4 6 8
T / C
P /
bar
Exp., Pure water
Exp., 5 mass% MeOH + 10 mass% KCl
Exp., 10 mass% MeOH + 10 mass% KCl
Predictions, this work
Exp. data: Dholabhai, 1996CO2 Hydrate

Flow Assurance: Gas Hydrate and Wax - December 2003 Steering Committee Meeting
80% CH4 + 20% CO2 hydrate phase boundaries in the presence of KCl and MeOH aqueous solutions
10
100
-7 -2 3 8 13
T / C
P /
bar
Exp., Pure water Exp., 5 mass% MeOH + 10 mass% KClPredictions, this work
Exp. data: Dholabhai, 1997 & 1994
80% CH4 + 20% CO2

Flow Assurance: Gas Hydrate and Wax - December 2003 Steering Committee Meeting
Methane hydrate phase boundaries in the presence of KCl and MeOH aqueous solutions
10
1000
-21 -17 -13 -9 -5 -1 3 7 11 15 19 23
T / C
P /
bar
Exp., distilled waterExp., 10 mass% KCl + 15 mass% MeOHExp., 7 mass% KCl + 25 mass% MeOHPredictions
C1-distilled water data:Deaton and Frost (1946)Mcleod and Campbell (1961)Jhaveri and Robinson (1965)

Flow Assurance: Gas Hydrate and Wax - December 2003 Steering Committee Meeting
Methane hydrate phase boundaries in the presence of NaCl and EtOH aqueous solutions
10
1000
-21 -17 -13 -9 -5 -1 3 7 11 15 19 23
T / C
P / b
ar
Exp., distilled waterExp., 10 mass% NaCl + 10 mass% EtOHExp., 7 mass% NaCl + 30 mass% EtOHPredictions
C1-distilled water data:Deaton and Frost (1946)Mcleod and Campbell (1961)Jhaveri and Robinson (1965)

Flow Assurance: Gas Hydrate and Wax - December 2003 Steering Committee Meeting
Outline• Thermodynamic modelling of EtOH,
NaCl-EtOH, and KCl-MeOH
• Validation of the model for gas hydrate
• Validation of the newly developed correlation for KCl-MeOH
• Conclusions

Flow Assurance: Gas Hydrate and Wax - December 2003 Steering Committee Meeting
Existing correlations• No general correlation for a combination
of salts and/or organic inhibitors
• Shortcomings:
Effect of the system pressure
Effect of the gas/oil composition
Effect of the type of the inhibitor

Flow Assurance: Gas Hydrate and Wax - December 2003 Steering Committee Meeting
New CorrelationNew Correlation
- P: Pressure of the system (kPa)- W: Concentration in the solution (mass%)- P0: Dissociation pressure in the presence of
distilled water at 273.15 K (kPa)- Ci and D1: Constants
PDPWW
TPWW
WT
WPWW
T ISI
IS
IS
IS
SSI *
*021.0*
**
* 1
+
+∆+
+∆+
=∆
orST∆ ( )( )( )1)1000()ln( 06543
32
21 +−+++=∆ PCCPCWCWCWCT IIII

Flow Assurance: Gas Hydrate and Wax - December 2003 Steering Committee Meeting
Methane hydrate phase boundaries in the presence of NaCl aqueous solutions
10
100
1000
-13 -8 -3 2 7
T / C
P /
bar
Exp., 11.8 mass% NaClExp., 21.5 mass% NaClNew CorrelationHammerschmidt CorrelationYousif & Young Correlation
Exp. data: de Roo et al. 1983

Flow Assurance: Gas Hydrate and Wax - December 2003 Steering Committee Meeting
Methane hydrate phase boundaries in the presence of NaCl and KCl aqueous solutions
10
100
-11 -6 -1 4 9
T / C
P / b
ar
Exp., 3 mass % NaCl + 3 mass% KClExp., 5 mass% NaCl + 10 mass% KClExp., 5 mass% NaCl + 15 mass% KClNew CorrelationYousif & Young CorrelationPure water, HWHYD model
CH4 Hydrate
exp. data: Dholabhai, 1991

Flow Assurance: Gas Hydrate and Wax - December 2003 Steering Committee Meeting
Carbon dioxide hydrate phase boundaries in the presence of KCl and MeOH aqueous solutions
1
10
100
-9 -7 -5 -3 -1 1 3 5 7 9
T / C
P /
bar
Pure Water, HWHYDExp., distilled water Exp., 5 mass% MeOH + 10 mass% KClExp., 10 mass% MeOH + 10 mass% KClNew Correlation
CO2 Hydrate exp. data: Dholabhai, 1996

Flow Assurance: Gas Hydrate and Wax - December 2003 Steering Committee Meeting
Methane hydrate phase boundaries in the presence of KCl and MeOH aqueous solutions
10
1000
-21 -17 -13 -9 -5 -1 3 7 11 15 19 23
T / C
P /
bar
Exp., distilled waterHWHYDExp., 10 mass% KCl + 15 mass% MeOHExp., 7 mass% KCl + 25 mass% MeOHNew Correlation
C1-distilled water data:Deaton and Frost (1946)Mcleod and Campbell (1961)Jhaveri and Robinson (1965)

Flow Assurance: Gas Hydrate and Wax - December 2003 Steering Committee Meeting
Conclusions• Modelling EtOH, KCl-MeOH, and NaCl-EtOH
was successfully implemented.
• Precipitation of NaCl in EtOH and KCl in the MeOH aqueous solutions was modelled.
• Comparison with the independent experimental data, has demonstrated the reliability of the developed model.
• Newly developed correlation capable of predicting hydrate inhibition effect of salts and/or organic inhibitors was validated for KCl-MeOHsystems.

EXPERIMENTAL WORK GAS/WATER EQUILIBRIA
Ross Anderson, Antonin Chopy, Rod Burgass

• Measurements of methane solubility in aqueous solutions of ethylene glycol
• Discussion on possible methodology for measurement of amount of water in gas phase in equilibrium with water/hydrates/ice
• Initial measurements of water dew point in methane water mixtures
EXPERIMENTAL WORK GAS/WATER EQUILIBRIA
Flow Assurance: Gas Hydrate and Wax – December 2003 Steering Committee Meeting
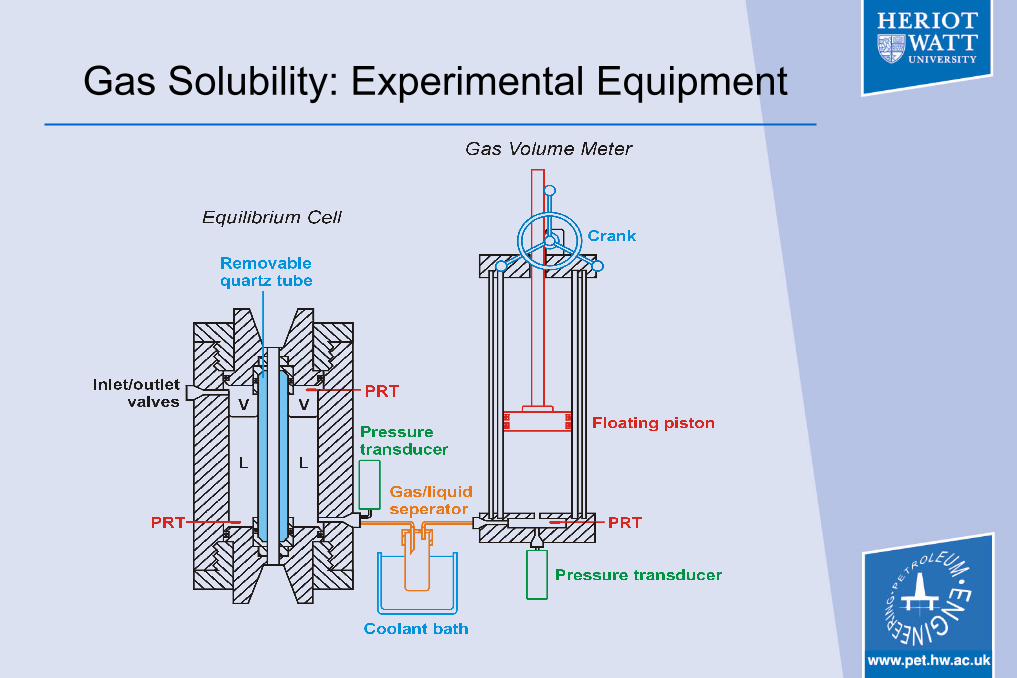
Gas Solubility: Experimental Equipment

Measured methane solubility in 20 mass% aqueous EG solutions as a function of P and T. Mole% methane is
relative to moles of the liquid phase
0.00
0.05
0.10
0.15
0.20
0.25
0 20 40 60 80 100
P / bar
Mol
e% C
H 4
0.15.09.924.849.6
Isotherms / C
20 mass% Ethylene Glycol
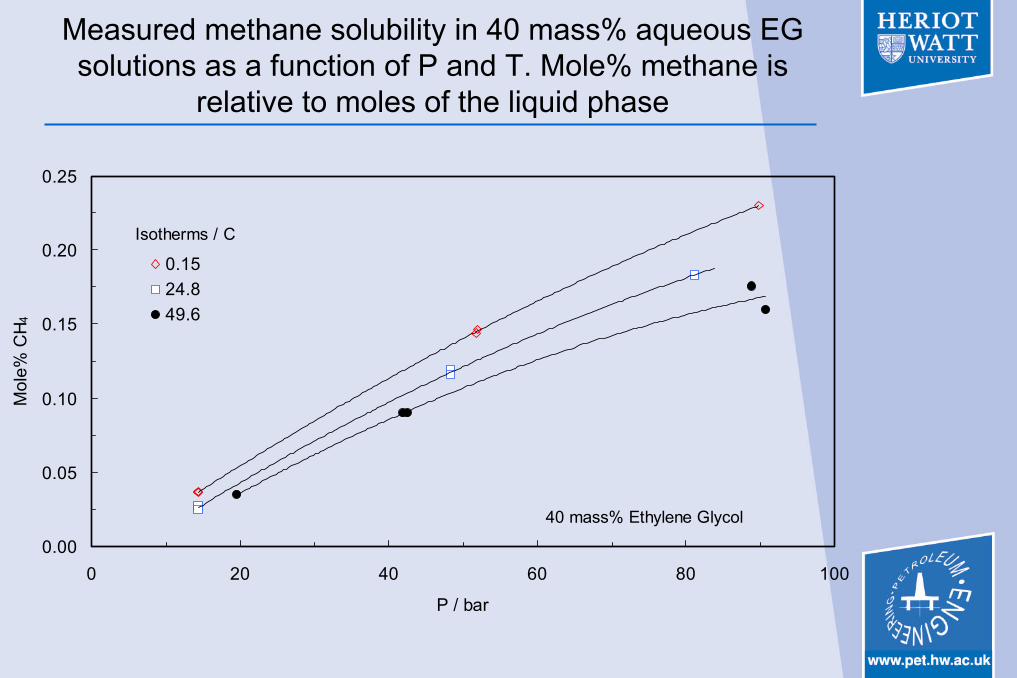
Measured methane solubility in 40 mass% aqueous EG solutions as a function of P and T. Mole% methane is
relative to moles of the liquid phase
0.00
0.05
0.10
0.15
0.20
0.25
0 20 40 60 80 100
P / bar
Mol
e% C
H 4
0.1524.849.6
Isotherms / C
40 mass% Ethylene Glycol

Experimental data (this work and literature data) showing the effect of EG on methane solubility. Mole% methane
data for EG solutions are plotted on an EG-free basis
0.00
0.05
0.10
0.15
0.20
0.25
0.30
0 20 40 60 80 100
P / bar
Mol
e% C
H 4
40 mass% EG, This work
20 mass% EG, This work
Distilled H2O, Culberson andMcKetta (1951)Distilled H2O, Yang et al. (2001)
Distilled H2O, Wang et al. (2001)
Temperature = 25 C

Methods used to make measurements of water in gasDirect methods• The gravimetric hygrometer• The dew point mirror (Chilled mirror)• Karl-Fischer titrationIndirect methods• Spectroscopic• Chromatographic • Hygroscopic methods

Water dew-point measurements using a QCM
• Importance of measurement
• Difficulty of measurement
• Conventional method for measuring amount of water in gas using QCM
• Proposed method

Plot of temperature vs resonant frequency for tests with dry methane and with methane equilibrated with water at
laboratory temperature
4975450
4975500
4975550
4975600
4975650
4975700
4975750
12 15 18 21 24 27 30 33 36 39 42 45T/C
QC
M re
sona
nt fr
eque
ncy/
Hz DRY METHANE
METHANE/WATER

Plot of temperature vs resonant frequency for test with methane equilibrated with water at laboratory temperature
4975450
4975470
4975490
4975510
4975530
4975550
13 15 17 19 21 23 25 27 29 31 33 35 37 39 41 43 45T/C
QC
M re
sona
nt fr
eque
ncy/
Hz
ADSORPTION

Peak of test with methane equilibrated with water at laboratory temperature
4975520
4975522
4975524
4975526
4975528
4975530
17 18 19 20 21 22 23 24 25 26 27 28 29T/C
QC
M re
sona
nt fr
eque
ncy/
Hz
LABORATORY TEMPERATURE

Plot of temperature vs resonant frequency for sample of laboratory air
4975460
4975480
4975500
4975520
4975540
4975560
4975580
4975600
4975620
4975640
0 5 10 15 20 25 30 35 40 45
T/C
QC
M re
sona
nt fr
eque
ncy/
Hz
ADSORPTION
DEW POINT MEASURED VISUALLY

Further work required to fully evaluate proposed method
• What type of QCM surface is best, polished, non-polished or roughened?
• Should the measurement be made with the temperature being changed step-wise or continuously?
• Should the measurement be made on cooling or heating or both?
• What is the accuracy and repeatability of the data?• Can the method be used for measurements at low
moisture contents, low temperature-high pressure?• Would a combination of methods give more reliable
results?

Flow Assurance: Gas Hydrates and Wax – December 2003 Steering Committee Meeting
Water Content of Gases

Flow Assurance: Gas Hydrates and Wax – December 2003 Steering Committee Meeting
• Collecting the existing VLE data
• Tuning the BIPs in the model for predicting the water content of gases at low temperature conditions
• Developing a semi – empirical approach
Outline

Flow Assurance: Gas Hydrates and Wax – December 2003 Steering Committee Meeting
A Typical P-T Diagram for Water – Hydrocarbon System
T
log
(P)
H - LHC
H-V
HC Vapour Pressure
I-V
LW - V
Q 2
Q 1I-H-V Water Vapour Pressure
H-V
H - LHC
L W-H-V
L W-H-L HC
Water Sublimation Pressure

Flow Assurance: Gas Hydrates and Wax – December 2003 Steering Committee Meeting
Typical Methane Solubility in Water at 25 oC
0
0.0005
0.001
0.0015
0.002
0.0025
0.003
0 20 40 60 80 100 120 140 160 180
P/bar
mol
e fra
ctio
n
Chapoy et al. (2003)aKim et al. (2003)Yang et al. (2001)Wang et al. (1995)Yokoyama et al. (1988)Duffy et al. (1961)Culberson and McKetta (1951)Culberson et al. (1950)Michels et al. (1936)

Flow Assurance: Gas Hydrates and Wax – December 2003 Steering Committee Meeting
Typical Water Content of Methane at 100 bar
1
10
100
1000
-40 -30 -20 -10 0 10 20 30 40 50
T/ °C
mg/
Nm3
Chapoy et al. (2003)cGERG (2000)KSEPL WAGA (Supplied by Shell)GPA RR45 by interpolation (Supplied by Shell)Dhima et.al. (2000)Ugrozov (1996) + Olds et.al. (1942)Yarym - Agaev et al. (1985)Kosyakov et al. (1982)STFlash phase transitions (Supplied by Shell)
H-V region
Lw- V region

Flow Assurance: Gas Hydrates and Wax – December 2003 Steering Committee Meeting
Which Data?
• Vapour-Liquid Equilibria– Gas solubility in the water rich– Water mole fraction in the gas phase
• Gas Solubility Data for Tuning the BIPs at low temperature conditions.

Flow Assurance: Gas Hydrates and Wax – December 2003 Steering Committee Meeting
Model Description
• fwH = fw
V H-V Equilibrium
• fiLw= fi
V (i = 1, N) Lw-V Equilibrium
• fwI = fw
V I-V Equilibrium

Flow Assurance: Gas Hydrates and Wax – December 2003 Steering Committee Meeting
Predictions (Water Content of Methane at 100 bar)
1
10
100
1000
-40 -30 -20 -10 0 10 20 30 40 50
T/ °C
mg/
Nm3
Chapoy et al. (2003)cGERG (2000)KSEPL WAGA (Supplied by Shell)GPA RR45 by interpolation (Supplied by Shell)Dhima et.al. (2000)Ugrozov (1996) + Olds et.al. (1942)Yarym - Agaev et al. (1985)Kosyakov et al. (1982)GERG model predictionSTFlash predictionSTFlash phase transitions (Supplied by Shell)This prediction
H-V region
Lw- V region

Flow Assurance: Gas Hydrates and Wax – December 2003 Steering Committee Meeting
Results (Water Content of Methane in the H-V Region)
Experimental data from Aoyagi et al. (1980)
1
10
100
1000
-35 -30 -25 -20 -15 -10 -5 0
T/ °C
mg/
Nm3
Experimental (34.5 bar)
Experimental (69 bar)
Experimental (103.4 bar)
This Prediction

Flow Assurance: Gas Hydrates and Wax – December 2003 Steering Committee Meeting
Results (Water Content of CO2)
900
1900
2900
3900
4900
5900
6900
7900
10 100 1000
P/bar
mg/
Nm3
Nakayama et al. (1987); 25 °CCoan and King (1971); 25 °CWiebe and Gaddy (1941); 25 °CThis Prediction; 25 °CDohrn et al. (1993); 50 °CD'Souza et al. (1988); 50 °CBriones et al. (1987); 50 °CCoan and King (1971); 50 °CSidorov et al. (1953); 50 °CWiebe and Gaddy (1941); 50 °CThis Prediction; 50 °C

Flow Assurance: Gas Hydrates and Wax – December 2003 Steering Committee Meeting
Estimation of Water Dew Point Temperature (oC) of Methane
Using Bukacek Correlation and HWHYD Model.Pressure
/ barWater Content /
mg/Nm3Bukacek
correlationHWHYD model ∆T
150 319.97 25 26.15 1.15
100 404.99 25 26.33 1.33
50 660.14 25 26.07 1.07
20 1426.58 25 25.56 0.56
130 211.82 16 17.51 1.51
90 261.81 16 17.62 1.62
40 464.99 16 17.14 1.14
20 830.96 16 16.68 0.68

Flow Assurance: Gas Hydrates and Wax – December 2003 Steering Committee Meeting
Semi – Empirical Approach
• fiLw= fi
V (i = 1, N) :VLE
• yw=
• yw=
• φw= exp(BP + CP 2)
• B = a + & C = c + Tb
Td
))(exp()1(
RTPPv
PPx sat
wLw
w
satwwg −−
φγ
))(exp(RT
PPvP
P satw
Lw
w
satw −
φ
Flow Assurance: Gas Hydrates and Wax – December 2003 Steering Committee Meeting
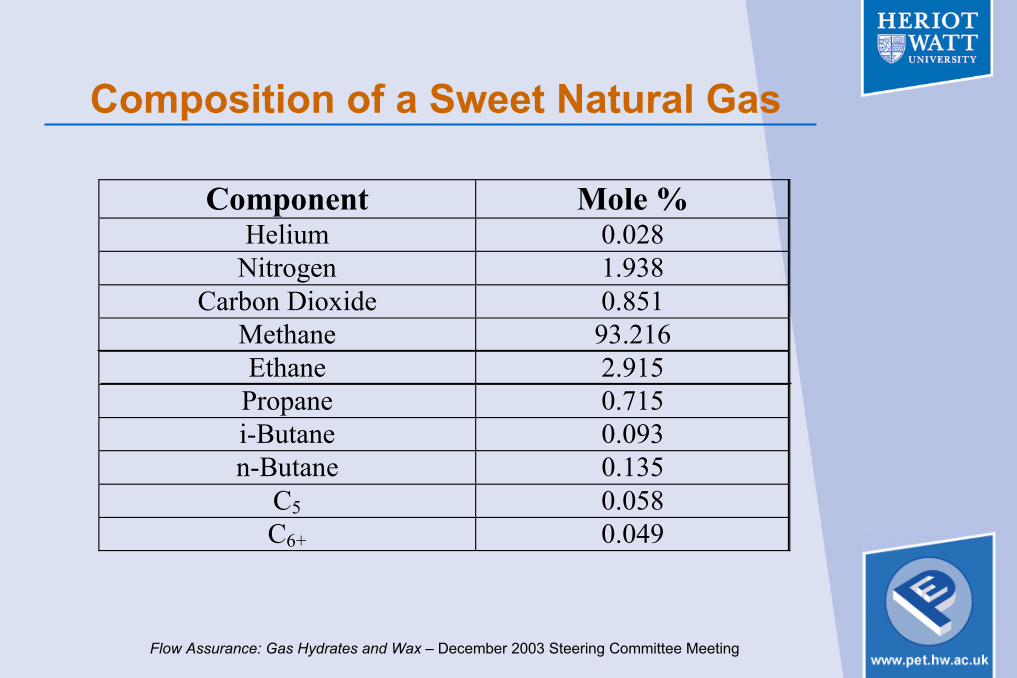
Composition of a Sweet Natural Gas
Component Mole % Helium 0.028
Nitrogen 1.938 Carbon Dioxide 0.851
Methane 93.216 Ethane 2.915
Propane 0.715 i-Butane 0.093 n-Butane 0.135
C5 0.058 C6+ 0.049

Flow Assurance: Gas Hydrates and Wax – December 2003 Steering Committee Meeting
A Comparison Between the Predictions of This Approachand Bukacek Correlation for Water Content (mole fraction)
of Natural Gas
T /K P /MPa SGg Water Content
Experimental data
Estimated Water Content (This
Approach) AD %
Estimated Water Content
(Bukacek) AD %
293.15 6 0.598 4.65E-04 4.74E-04 1.85 5.39E-04 15.81
293.15 10 0.598 3.26E-04 3.33E-04 2.23 3.83E-04 17.47
288.15 1.5 0.598 1.16E-03 1.19E-03 2.22 1.25E-03 7.73
288.15 4 0.598 4.68E-04 4.84E-04 3.53 5.44E-04 16.38
288.15 6 0.598 3.56E-04 3.47E-04 2.56 4.02E-04 12.92
288.15 8 0.598 2.72E-04 2.82E-04 3.45 3.31E-04 21.58
283.15 1.5 0.598 8.42E-04 8.57E-04 1.78 9.11E-04 8.13
283.15 6 0.598 2.51E-04 2.51E-04 0.09 2.97E-04 18.31
278.15 0.5 0.598 1.68E-03 1.77E-03 5.7 1.82E-03 8.21
278.15 1.5 0.598 6.05E-04 6.09E-04 0.72 6.53E-04 7.98
278.15 4 0.598 2.58E-04 2.49E-04 3.81 2.90E-04 12.17

Flow Assurance: Gas Hydrates and Wax – December 2003 Steering Committee Meeting
Comparison of the Results in Diagram
0
0.0004
0.0008
0.0012
0.0016
0 5 10 15 20 25
T/C
mol
frac
tion
Experimental (GERG)This approachBukacek correlation
60 bar
15 bar

Flow Assurance: Gas Hydrates and Wax – December 2003 Steering Committee Meeting
Conclusions (1)
• A comprehensive literature survey was made on the existing VLE data.
• BIPs between Methane – Water and CO2 –Water systems were tuned using gas solubility data.
• VLE data on other components of natural gases (C2, C3, N2, etc) at low temperatures conditions are necessary to further develop the thermodynamic model.

Flow Assurance: Gas Hydrates and Wax – December 2003 Steering Committee Meeting
Conclusions (2)
• The results of water content / water dew point are comparable with the recommended predictive methods.
• A semi – empirical approach was developed to predict the water content of gases in the Lw – V and I – V regions. The results are in very good agreement with experimental data.
EXPERIMENTAL WORK: WAX AND HYDRATE MEASUREMENTS
Rod Burgass

• WAX MEASUREMENTS FOR SYNTHETIC MIXTURES OF ALKANES USING QUARTZ CRYSTAL MICROBALANCE
• WAX AND HYDRATE MEASUREMENTS ON A SYNTHETIC MIXTURE OF ALKANES
EXPERIMENTAL WORK: WAX AND HYDRATE MEASUREMENTS
Flow Assurance: Gas Hydrate and Wax – December 2003 Steering Committee Meeting

Schematic of Quartz Crystal Microbalance (QCM)

Schematic of QCM rig for measurement on dead fluids

Wax Appearance Temperature (WAT) for a separator condensate using QCM
4987500
4988000
4988500
4989000
4989500
4990000
293 298 303 308 313 318 323 328T/K
Res
onan
t fre
quen
cy/H
z
COOLING 10 MINUTES PER TEMPERATURE STEP
WAT 299K

Wax Disappearance Temperature (WDT) for a separator condensate using QCM
4987500
4988000
4988500
4989000
4989500
4990000
293 298 303 308 313 318 323 328T/K
Res
onan
t fre
quen
cy/H
z
HEATING 2 HOURS PER TEMPERATURE STEP
WDT 313KVISUAL WDT 309K

Example of WAT measurement for a synthetic hydrocarbon mixture using a QCM with a roughened
surface
-800
200
1200
2200
3200
4200
5200
0 1 2 3 4 5 6 7 8
T/C
Cha
nge
in re
sona
nt fr
eque
ncy/
Hz
WAT

Composition of synthetic hydrocarbon Mixture for components heavier than C4
Component
Mass%
Mole%
C10 94.61 97.52 C21 1.71 0.84 C22 1.25 0.59 C23 0.92 0.41 C24 0.67 0.29 C25 0.49 0.20 C26 0.36 0.14

WAT measurements, using QCM, at different pressures for synthetic hydrocarbon mixture (components heavier
than C4)
0
100
200
300
400
0 1 2 3 4 5 6 7 8 9 10
T/C
P/ba
r

Composition of synthetic hydrocarbon Mixture with light components (live). Bubble point measured as 119.7 bar
at OoC.
Component
Mass%
Mole%
CO2 0.46 1.46
C1 7.13 39.42 N2 0.30 0.61 C2 0.87 2.56 C3 0.38 0.76 iC4 0.07 0.10 nC4 0.12 0.18 iC5 0.04 0.05 C10 85.76 53.49 C21 1.55 0.46 C22 1.14 0.32 C23 0.83 0.23 C24 0.61 0.16 C25 0.44 0.11 C26 0.32 0.08

WAT measurements, using QCM, at different pressures for synthetic hydrocarbon mixture without and with light
(C1-C4) components
0
100
200
300
400
0 1 2 3 4 5 6 7 8 9 10
T/C
P/ba
r
Live fluid

Summary of wax and hydrate measurements for synthetic hydrocarbon mixture
0
100
200
300
400
0 2 4 6 8 10 12 14 16 18 20
T/C
P/ba
r
Hydrate dissociation points

Flow Assurance: Gas Hydrates and Wax - December 2003 Steering Committee Meeting
Thermodynamic Modelling -Wax
Hongyan Ji

Flow Assurance: Gas Hydrates and Wax - December 2003 Steering Committee Meeting
Predictive mathematic models for wax
WAX MODELConventional thermodynamic model
Empirical model
Thermodynamic descriptionEoS &/ activity coefficient equationNumerical iterationSpecific software package?Composition data required
DetailedBothMulti-stepYesAll compounds
SimplifiedThe latterFewNoFew compounds

Flow Assurance: Gas Hydrates and Wax - December 2003 Steering Committee Meeting
• Conventional thermodynamic model: Heriot-Watt WAX (HWWAX) model – It has been developed in previous studies.– Its reliability has been validated against independent
experimental data (WDT, precipitated wax amount and composition).
• Empirical model– It is developed in this work.
Predictive mathematic models for wax

Flow Assurance: Gas Hydrates and Wax - December 2003 Steering Committee Meeting
The empirical model developed in this work
• Thermodynamic basis
• Necessary parameters
• Applications of the empirical model
• Conclusions
Outline

Flow Assurance: Gas Hydrates and Wax - December 2003 Steering Committee Meeting
• The activity coefficient equation is used to both the liquid and the solid phases.
Thermodynamic basis
∫= dPRTvexpfγxf P
P
S/LiOS/OL
iS/L
iiS/L
i O

Flow Assurance: Gas Hydrates and Wax - December 2003 Steering Committee Meeting
• For the reciprocal of SLE temperature
• For WDT
Thermodynamic basis
i,mSii
i
i,m Tsx
lnHR
T11
+
∆
−=γ i,m
i HRa
∆−=
i,mi Tb 1=
( )1201−×+
+
= P.
bsx
lnaWDT
kSkk
kk γ
Necessary parametersNecessary parameters
aa and and bb
γγ
ss

Flow Assurance: Gas Hydrates and Wax - December 2003 Steering Committee Meeting
Values of a and b
C28: (1/T)*1000 = -0.0904*ln(xk) + 2.9938 R2 = 0.994
C32: (1/T)*1000 = -0.0797*ln(xk) + 2.9346 R2 = 0.999
C36: (1/T)*1000 = -0.0677*ln(xk) + 2.8818 R2 = 0.998
2.0
2.5
3.0
3.5
4.0
-10 -8 -6 -4 -2 0
ln (xk)
(1/T
*100
0)/K
-1
C5-C28, C7-C28, C12-C28C5-C32, C7-C32, C12-C32C5-C36, C7-C36
points for several binaries (based on experimental data))xln(T k−1

Flow Assurance: Gas Hydrates and Wax - December 2003 Steering Committee Meeting
Values of a and b
points for binaries (based on data generated by HWWAX))xln(T k−1
C40: (1/T)*1000 = -0.0619*ln(xk) + 2.8321 R2 = 0.9998C50: (1/T)*1000 = -0.0471*ln(xk) + 2.7315 R2 = 0.9985C60: (1/T)*1000 = -0.0355*ln(xk) + 2.6692 R2 = 0.9928
2.0
2.5
3.0
3.5
4.0
-20 -16 -12 -8 -4 0
Ln (xk)
(1/T
*100
0)/K
-1
C10-C40C10-C50C10-C60

Flow Assurance: Gas Hydrates and Wax - December 2003 Steering Committee Meeting
Values of a and b
Values of a and b for C21 – C80
-13.0
-11.0
-9.0
-7.0
-5.0
-3.0
-1.0
1.0
3.0
20 30 40 50 60 70 80
carbon number
a*1
05
2.5
2.6
2.7
2.8
2.9
3.0
3.1
3.2
3.3
b*1
03

Flow Assurance: Gas Hydrates and Wax - December 2003 Steering Committee Meeting
Value of γ (solid activity coefficient)
Experimental and estimated SLE data for C18-C19 binaries
10
15
20
25
30
35
0 0.2 0.4 0.6 0.8 1
C19 mole fraction
WD
T/o C
exp. data, Robles et al. (1996)T1: est. data, assuming pure C18 solidT2: est. data, assuming pure C19 solidT: est. data, solid mixture and gama=1T: est. data, solid mixture and gama=1.1

Flow Assurance: Gas Hydrates and Wax - December 2003 Steering Committee Meeting
Correlation for s (solid composition)
y = 0.0248x3 - 0.1691x2 + 1.1443x
0.0
0.2
0.4
0.6
0.8
1.0
0 0.2 0.4 0.6 0.8 1
X2
S 2
C29-C30C39-C40C59-C60
Solid concentration as a function of liquid concentration
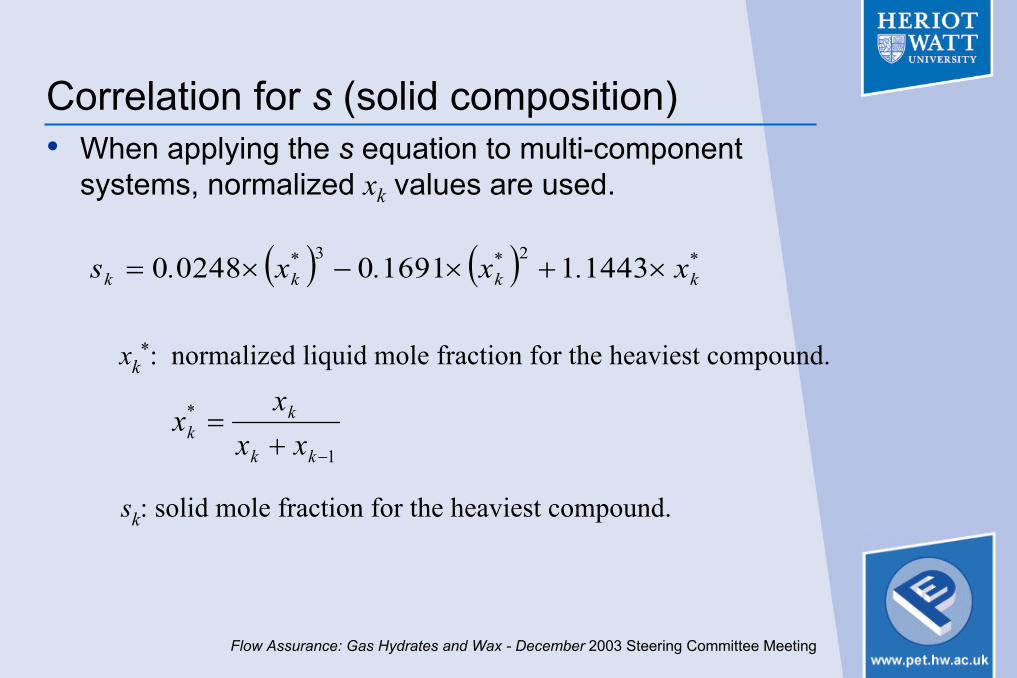
Flow Assurance: Gas Hydrates and Wax - December 2003 Steering Committee Meeting
Correlation for s (solid composition)• When applying the s equation to multi-component
systems, normalized xk values are used.
( ) ( ) *k
*k
*kk x.x.x.s ×+×−×= 144311691002480 23
xk*: normalized liquid mole fraction for the heaviest compound.
1−+=
kk
k*k xx
xx
sk: solid mole fraction for the heaviest compound.

Flow Assurance: Gas Hydrates and Wax - December 2003 Steering Committee Meeting
Application 1: WDT estimation
( )1201−×+
+
= P.
bsx
lnaWDT
kSkk
kk γ
•Input data–Liquid compositions for the two heaviest compounds.
–Operation pressure (P).
•Output data–WDT.

Flow Assurance: Gas Hydrates and Wax - December 2003 Steering Committee Meeting
• This is shown using synthetic multi-component mixtures.
• Mixtures contain hydrocarbons between C1 and C30.
• Molar concentrations for Cn>C20 follow exponential decay functions ( ), representing highly simplified crude oil.
• q values are between 0.68 and 0.95.
Application 1: WDT estimation
1−×= ii xqx
Flow Assurance: Gas Hydrates and Wax - December 2003 Steering Committee Meeting
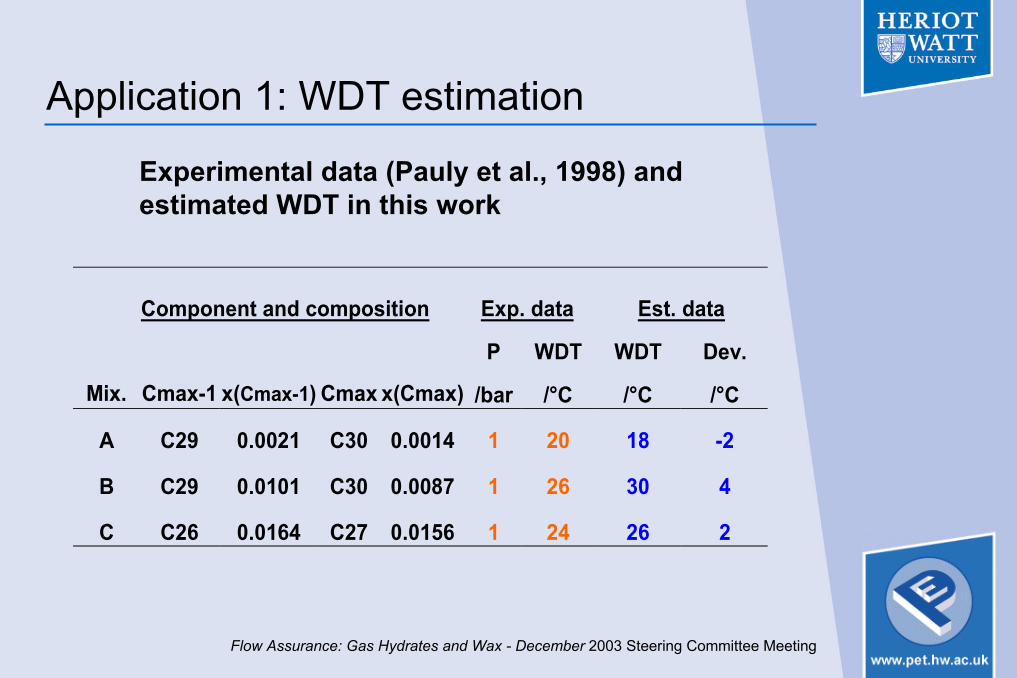
Application 1: WDT estimation
Component and composition Exp. data Est. data
P WDT WDT Dev.
Mix. Cmax-1 x(Cmax-1) Cmax x(Cmax) /bar /°C /°C /°C
A C29 0.0021 C30 0.0014 1 20 18 -2
B C29 0.0101 C30 0.0087 1 26 30 4
C C26 0.0164 C27 0.0156 1 24 26 2
Experimental data (Pauly et al., 1998) and estimated WDT in this work
Flow Assurance: Gas Hydrates and Wax - December 2003 Steering Committee Meeting
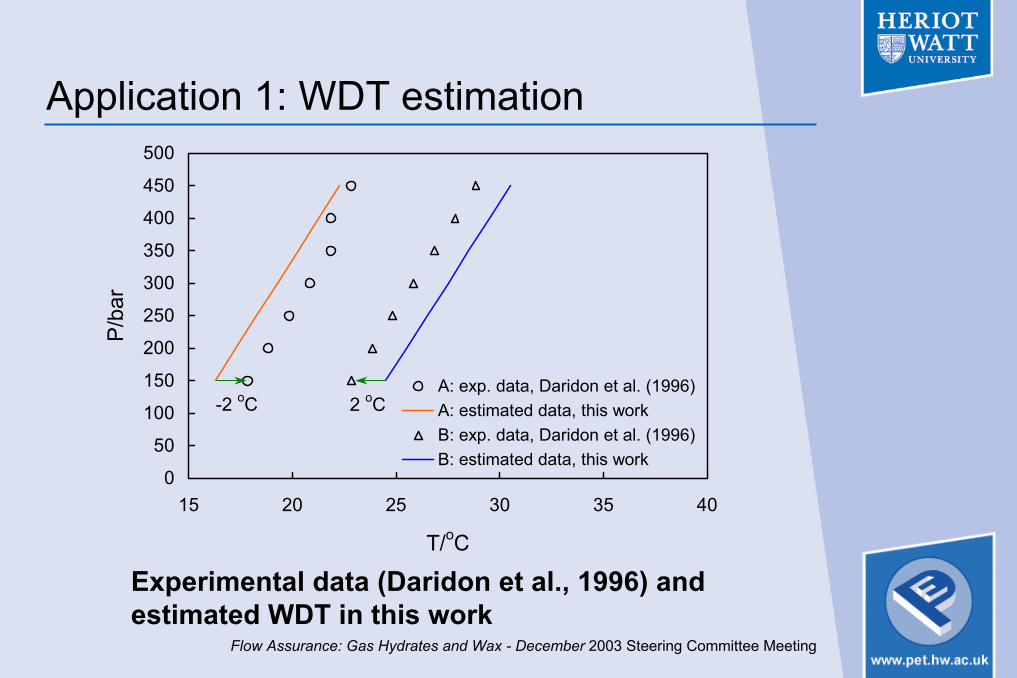
Application 1: WDT estimation
Experimental data (Daridon et al., 1996) and estimated WDT in this work
0
50
100
150
200
250
300
350
400
450
500
15 20 25 30 35 40
T/oC
P/ba
r
A: exp. data, Daridon et al. (1996)A: estimated data, this workB: exp. data, Daridon et al. (1996)B: estimated data, this work
-2 oC 2 oC

Flow Assurance: Gas Hydrates and Wax - December 2003 Steering Committee Meeting
Experimental composition data and WDT estimation deviations (dev.)
Pauly et al. (1998) Daridon et al. (1996) A B C A' B' C' C1 43.70 43.80 43.60 C10 80.02 66.59 80.29 46.10 45.90 46.15 C18 0.00 5.59 2.45 0.00 1.65 1.33 C19 0.00 4.74 2.32 0.00 1.43 1.27 C20 6.41 4.03 2.21 3.27 1.25 1.16 C21 4.39 3.45 2.10 2.24 1.15 1.10 C22 3.00 2.96 2.00 1.53 0.91 1.04 C23 2.05 2.54 1.90 1.05 0.78 0.98 C24 1.40 2.18 1.81 0.72 0.67 0.92 C25 0.96 1.87 1.72 0.49 0.58 0.87 C26 0.66 1.61 1.64 0.34 0.50 0.81 C27 0.45 1.38 1.56 0.23 0.43 0.77 C28 0.31 1.20 0.16 0.37 0.00 C29 0.21 1.01 0.11 0.31 0.00 C30 0.14 0.87 0.07 0.27 0.00 C20+ 19.98 23.09 14.93 10.20 7.22 7.66
q 0.68 0.86 0.95 0.68 0.86 0.94 Dev./oC -2 4 2 -2 2 2

Flow Assurance: Gas Hydrates and Wax - December 2003 Steering Committee Meeting
Application 2: estimation of increased/reduced WDT• For a system which WDT is available (referred as
basic system)– Input data
– WDT and P.– Output data
– Liquid compositions for the heaviest two compounds.
• For systems obtained by concentrating/diluting the basic system (referred as related systems) – Input data
– Increased/reduced liquid compositions that are calculated using– The basic system composition data.– The concentration/dilution ratio.
– Pressure (P).– Output data
– increased/decreased WDT.
( )1201−×+
+
= P.
bsx
lnaWDT
kSkk
kk γ

Flow Assurance: Gas Hydrates and Wax - December 2003 Steering Committee Meeting
Application 2: estimation of increased/reduced WDTBasic system
• Distillate fractions are obtained from crude oil.
• WDTs are measured for these distillate fractions.
Experimental data: Srivastava et al. (2001)
• xk for the basic system is estimated using the empirical model.
Fraction 4 Fraction 5Boiling Temperature
range/oC 325 - 350 350 - 375
n-Cn up to n-C25 n-C26
WDT/oC 34 44

Flow Assurance: Gas Hydrates and Wax - December 2003 Steering Committee Meeting
Application 2: estimation of increased/reduced WDTRelated systems• Sub-fractions of n-paraffin, iso- & cyclo- paraffin, and
aromatic are separated from the distillate fractions.• WDTs are measured for these sub-fractions.
• WDTs for n-paraffin sub-fractions are estimated using the empirical model, and compared with experimental data.
sub-fraction Experimental WDT/oC Fra. 4 Fra. 5
n-paraffin 45 53 iso-&cyclo- paraffin -4 -4
aromatic 10
Flow Assurance: Gas Hydrates and Wax - December 2003 Steering Committee Meeting
Application 2: estimation of increased/reduced WDTRelated systems• Mixtures are prepared by mixing different proportions of
sub-fractions.• WDTs are measured for these mixtures.
– These data are used for validating the model.
• WDTs are estimated using the empirical model, and compared with experimental data.

Flow Assurance: Gas Hydrates and Wax - December 2003 Steering Committee Meeting
Application 2: estimation of increased/reduced WDT
Experimental (Srivastava et al., 2002) and estimated WDT data for mixtures based on the fraction 4
-5
5
15
25
35
45
55
0 10 20 30 40 50 60 70 80 90 100
n-paraffins concentration /mass%
WD
T/C
Exp. data, mixtures consisiting of n-, iso-, & cyclo-paraffinsExp. data, fraction 4 distillated from crude oil Estimated data, this work
Trendline of exp. data

Flow Assurance: Gas Hydrates and Wax - December 2003 Steering Committee Meeting
Application 2: estimation of increased/reduced WDT
Experimental (Srivastava et al., 2002) and estimated WDT data for mixtures based on the fraction 5
-5
5
15
25
35
45
55
0 10 20 30 40 50 60 70 80 90 100
n-paraffins concentration/mass%
WD
T/C
Exp. data, mixtures consisiting of n-, iso-, & cyclo-paraffinsExp. data, mixtures consisiting of n-paraffins and aromaticsExp. data, fraction 5 distillated from crude oil Estimated data, this work
Trendline of exp. data

Flow Assurance: Gas Hydrates and Wax - December 2003 Steering Committee Meeting
• An empirical wax model based on simplified thermodynamic formula and empirically determined parameters has been developed in this work.
• The model capability for estimating WDT has been shown by comparing its predictions with independent experimental WDT data. A general agreement is obtained.
• The empirical model developed at this stage also shows a limitation. Further investigation and improvement are in progress.
Conclusions

Flow Assurance: Gas Hydrates and Wax – December 2003 Steering Committee Meeting
GAS HYDRATES IN MULTIPHASE TRANSPORTATION
Shaoran Ren

Flow Assurance: Gas Hydrates and Wax – December 2003 Steering Committee Meeting
Well head
Well
Tie-back pipeline Seabed
Subsea multiphase transportation: a tie-back pipeline

Flow Assurance: Gas Hydrates and Wax – December 2003 Steering Committee Meeting
Gas/oil/water/hydrate
Flowing, Shut-in & Restart
Viscosity increaseDeposition ?Blockage ?
Pump Pressure Increase
Flow Assurance: Gas Hydrates and Wax – December 2003 Steering Committee Meeting
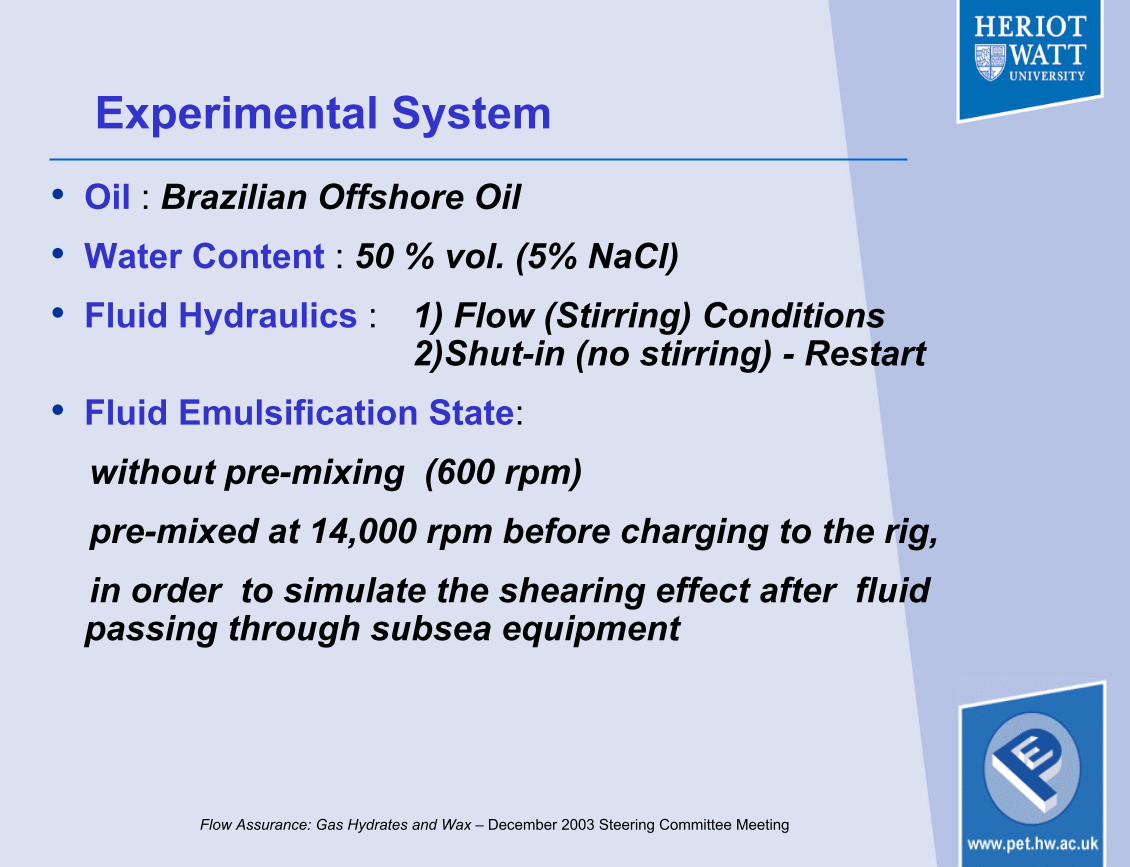
Experimental System• Oil : Brazilian Offshore Oil• Water Content : 50 % vol. (5% NaCl)• Fluid Hydraulics : 1) Flow (Stirring) Conditions
2)Shut-in (no stirring) - Restart • Fluid Emulsification State:
without pre-mixing (600 rpm)pre-mixed at 14,000 rpm before charging to the rig, in order to simulate the shearing effect after fluid passing through subsea equipment

Flow Assurance: Gas Hydrates and Wax – December 2003 Steering Committee Meeting
Hydrate Kinetics Rig-1: Modified stirrer blade
Magnetic MotorTorque Measurement
PC
Samplein & out
gas
P
T

Flow Assurance: Gas Hydrates and Wax – December 2003 Steering Committee Meeting
TestHigh speed Pre-mixing (14K rpm)
Hydrate formed at P/T, bar/oC
Pressure drop due
to hydrate∆P
Torque increase
Induction time
1 no 79/4 23 18% 5 hours
2 yes 86/7 26 38% 0
3 no 129/7.5 31 49% 0
4 yes 129/10 24 49% 0
Experimental results for Brazilian oil with 50% water cut (5% NaCl), Flowing (or mixing at 600 rpm in Kinetics Rig-1)

Flow Assurance: Gas Hydrates and Wax – December 2003 Steering Committee Meeting
Brazilian oil, 50% water, without high speed mixing, tested at a low pressure (9 oC subcooling)
time/hr.0 5 10 15 20
P/ba
r
50
60
70
80
90
100
110
T/o C
0
5
10
15
20
25
30
35
40
45
50
Torq
ue/N
.cm
30
35
40
45
50
55
60PTTorque

Flow Assurance: Gas Hydrates and Wax – December 2003 Steering Committee Meetingtime/hr.
0 5 10 15 20 25
P/ba
r
60
70
80
90
100
110
120
130
140
150
160
T/o C
0
5
10
15
20
25
30
35
40
45
50
Torq
ue/N
.cm
30
35
40
45
50
55
60
PTTorque
Brazilian oil, 50% water, without high speed mixing, tested at a high pressure (10-11 oC subcooling)

Flow Assurance: Gas Hydrates and Wax – December 2003 Steering Committee Meeting
Brazilian oil, 50% water, without High Speed pre-mixing, tested at low and high pressures
tim e/hr.0 5 10 15 20 25 30
P/ba
r
405060708090
100110120130140150160
Torq
ue/N
.cm
20
30
40
50
60
70∆P=23 bar, LP∆P=31 bar, HPTorque, LPTorque, HP
28% water to hydrate
21% water to hydrate

Flow Assurance: Gas Hydrates and Wax – December 2003 Steering Committee Meeting
Brazilian oil, 50% water, High Speed pre-mixed, tested at low and high pressures
tim e/hr.0 2 4 6 8 10 12
P/ba
r
405060708090
100110120130140150160
Torq
ue/N
.cm
20
30
40
50
60
70∆P=26 bar, LP∆P=24 bar, H PTorque, LPTorque, HP
22% w ater to hydrate
23% w ater to hydrate
Flow Assurance: Gas Hydrates and Wax – December 2003 Steering Committee Meeting
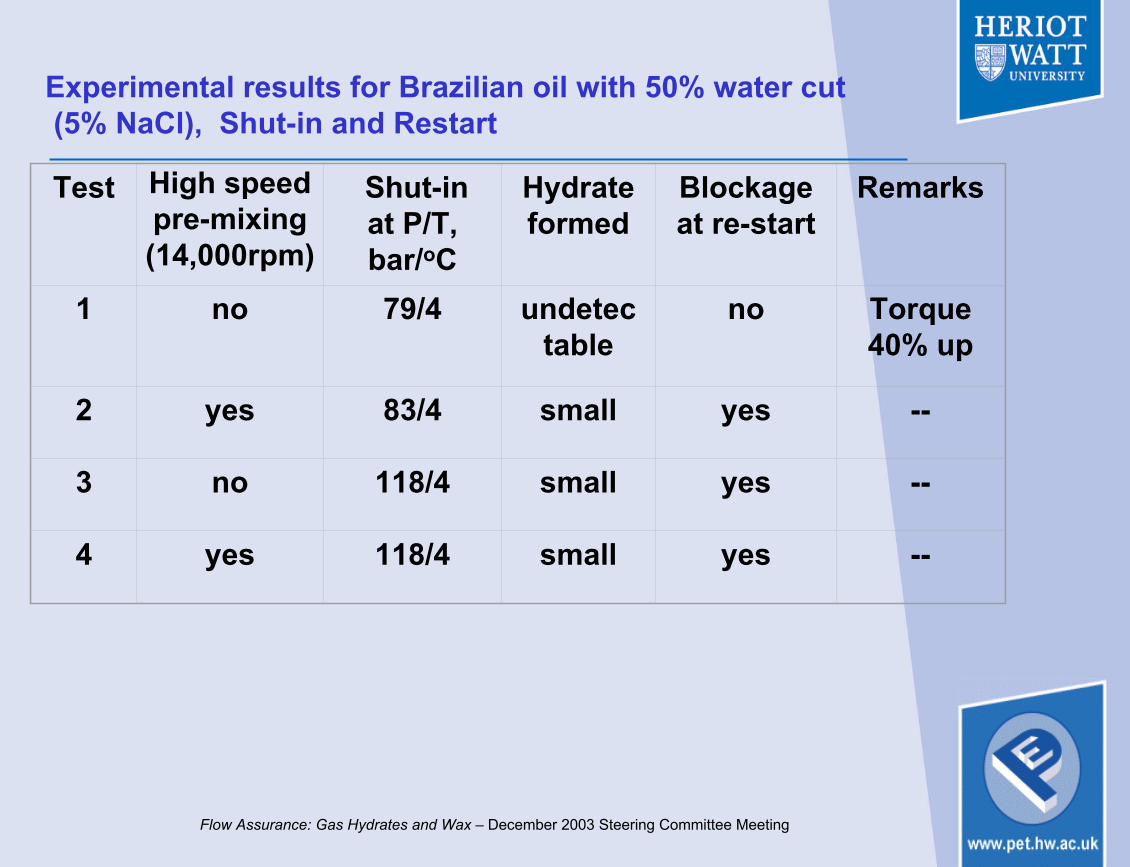
Test High speed pre-mixing (14,000rpm)
Shut-in at P/T, bar/oC
Hydrateformed
Blockage at re-start
Remarks
1 no 79/4 undetectable
no Torque 40% up
2 yes 83/4 small yes --
3 no 118/4 small yes --
4 yes 118/4 small yes --
Experimental results for Brazilian oil with 50% water cut(5% NaCl), Shut-in and Restart

Flow Assurance: Gas Hydrates and Wax – December 2003 Steering Committee Meeting
Shut-In Restart, Low Pressure, without Pre-mixing,Subcooling 9 oC, not blocked
time/hr.0 10 20 30 40 50
P/ba
r
50
60
70
80
90
100
T/o C
0
5
10
15
20
25
30
35
40
45
50
Torq
ue/N
.cm
0
10
20
30
40
50
60PTTorque
Restart

Flow Assurance: Gas Hydrates and Wax – December 2003 Steering Committee Meeting
Shut-In Restart , Low Pressure, with Pre-mixing,Subcooling 9.2 oC, blocked
time/hr.0 5 10 15 20 25
P/ba
r
50
60
70
80
90
100
110
T/o C
0
5
10
15
20
25
30
35
40
45
50
Torq
ue/N
.cm
0
10
20
30
40
50
60PTTorque restart-blocked

Flow Assurance: Gas Hydrates and Wax – December 2003 Steering Committee Meeting
High Pressure Visual Rig Observation
• Oil emulsion with 50% water pre-mixed at 10K rpm
• At static condition (shut-in), P=120 bar, T=4 oC. Pressure drops only 3 bar
• An solid-like gel was formed

Flow Assurance: Gas Hydrates and Wax – December 2003 Steering Committee Meeting
Glass Micromodel

Flow Assurance: Gas Hydrates and Wax – December 2003 Steering Committee Meeting
Micromodel Experimental Rig Set-up
TV / VCR PC
CAMERA
MODEL
TEST GAS / LIQUID TEST GAS / LIQUID
PRESSURE TRANSDUCER
TEMPERATUREPROBEBATH

Flow Assurance: Gas Hydrates and Wax – December 2003 Steering Committee Meeting
Original Oil (without added water) in the Micromodel
45 bar, 30 oC 50 bar, 0.3 oC

Flow Assurance: Gas Hydrates and Wax – December 2003 Steering Committee Meeting
Formation of hydrate in the Micromodel: Brazilian oil, 20% water, Natural gas, 60 bar (Pre-mixed at 14K rpm)
Hydrates Gas
0.6 oC 17 oC 17 oC, after 130 hours

Flow Assurance: Gas Hydrates and Wax – December 2003 Steering Committee Meeting
Conclusions• With 50% water cut, hydrate can readily form at over
70 bar (< 9 oC subcooling). There will be a significant torque or fluid viscosity increase (over 50%). However this may not cause a blockage because of dispersion of hydrate particles in oil.
• Stirrer blockage was observed during shut in –restarts. This may be attributed to the agglomeration of hydrate (and other solid) particles formed during static conditions.
• For the oil/water emulsion with 50% water content, high degree of emulsification (pre-mixed at high speed) did not appear to improve the rheology of the hydrate dispersion.

Flow Assurance: Gas Hydrates and Wax – December 2003 Steering Committee Meeting
Helical Tube Stirrer

Flow Assurance: Gas Hydrates and Wax – December 2003 Steering Committee Meeting
Brazilian oil, 50% Water cut (5% NaCl), Lab-NG, 650 ml oil inKinetics Rig-1: Helical Tube (stirrer)
time/hr.0 2 4 6 8 10 12 14 16
P/ba
r
404550556065707580859095
100105110115120125
T/o C
0
5
10
15
20
25
30
35
40To
rque
/N.c
m
0
10
20
30
40
50
60
PTTorque
Flow Assurance: Gas Hydrates and Wax – December 2003 Steering Committee Meeting
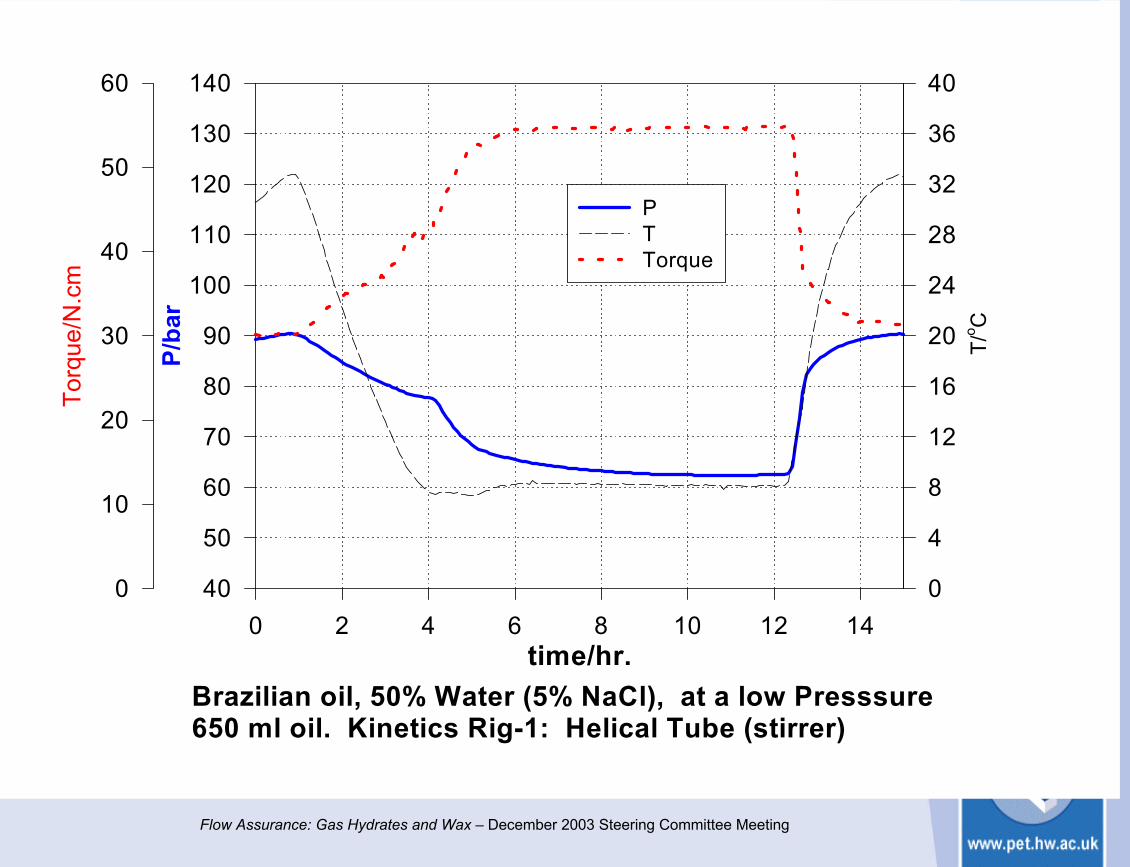
Brazilian oil, 50% Water (5% NaCl), at a low Presssure650 ml oil. Kinetics Rig-1: Helical Tube (stirrer)
time/hr.0 2 4 6 8 10 12 14
P/ba
r
40
50
60
70
80
90
100
110
120
130
140
T/o C
0
4
8
12
16
20
24
28
32
36
40To
rque
/N.c
m
0
10
20
30
40
50
60
PTTorque

Flow Assurance: Gas Hydrates and Wax – December 2003 Steering Committee Meeting