floridan aquifer system test well programfloridan aquifer system test well program city of south...
TRANSCRIPT

Floridan Aquifer System Test Well Program
City of South Bay, Florida
Technical Publication WS-2
John Lukasiewicz, P.G., Milton Paul Switanek, P.G.,Robert T. Verrastro, P.G.
February 2001
South Florida Water Management District3301 Gun Club Road
West Palm Beach, FL 33306(561) 686-8800
www.sfwmd.gov
Cover Photo: S-2 Pump Station (foreground) and Lake Okeechobee (background)


Floridan Aquifer Test Well Program, South Bay Executive Summary
EXECUTIVE SUMMARY
This report documents the results of construction and testing of two new FloridanAquifer System (FAS) wells by the South Florida Water Management District (District orSFWMD). The wells were constructed north of the City of South Bay, near the District’sS-2A pump station in Palm Beach County, Florida. This site was selected to augment dataavailable from other wells and to provide broad, spatial coverage within the District’sLower East Coast (LEC) planning area. The purpose of the drilling and testing programwas to assess the subsurface hydrogeologic and water quality properties and to evaluatethe water resource potential of the FAS at the site.
The scope of the investigation consisted of constructing and testing two FAS wells.The first well (Well PBF-7) was drilled to a total depth of 2,504 feet below land surface(bls). It was completed as a dual-zone monitor well into two distinct hydrogeologic zones- an upper zone between 992 and 1,447 feet bls, and a lower zone between 1,968 and2,040 feet bls. The second well (Well PBF-9) was constructed in stages to allow aquiferperformance tests to be conducted at depths corresponding to the monitor intervals of WellPBF-7.
The main findings of the construction and testing program were as follows:
• Surficial sediments extended from land surface to a depth of 208feet bls and the Hawthorn Group (Upper Confining Unit) wasfound to extend to approximately 900 feet bls.
• Limestone comprising the uppermost FAS was identified at adepth of approximately 900 feet bls based on lithologic andhydrogeologic observations.
• The uppermost 300 feet of the FAS exhibited a relatively lowhydraulic conductivity (between approximately 8 and 22 feet perday [ft/day]). Water sampled from that interval was more salinethan immediately underlying zones.
• An upper producing zone was identified in the upper FASbetween 1,200 and 1,450 feet bls. This zone exhibited atransmissivity of 71,000 gallons per day per foot and a hydraulicconductivity of approximately 38 ft/day. The chlorideconcentration of water collected from that zone wasapproximately 1,400 milligrams per liter (mg/L).
• A brown, crystalline dolomite unit was identified at 1,956 feetbls. This is probably the top of the Oldsmar formation. Secondarysolutioning and fractures cause this interval to exhibit atransmissivity of approximately 504,000 gallons per day per foot.This interval is referred to as a lower producing zone within theupper FAS. Water collected from this zone contained a chlorideconcentration of 9,350 mg/L.
i

Executive Summary Floridan Aquifer Test Well Program, South Bay
• The base of the Underground Source of Drinking Water (USDW)was identified by water quality analysis from straddle-packertests and geophysical log analysis to occur at approximately1,900 feet bls at the site.
• The potentiometric surfaces of the upper and lower FASproducing zones during the period from October 1997 toDecember 1999 were approximately 56 and 43 feet above theNational Geodetic Vertical Datum of 1929 (NGVD), respectively(unadjusted for density).
• Water levels fluctuated an average of 1 to 4 feet in upper andlower zones over a period of nearly two years.
• When adjusted for density, the groundwater gradient between theupper and lower FAS producing zones is upward.
ii

Floridan Aquifer Test Well Program, South Bay Table of Contents
TABLE OF CONTENTS
Introduction.....................................................................................................1
Construction Details........................................................................................3Well PBF-7 Construction Summary ........................................................................3Well PBF-9 Construction Summary ........................................................................6
Formation Testing Program ............................................................................8Cuttings Collection During Drilling ........................................................................8Geophysical Logging .............................................................................................10
Site Geology..................................................................................................15Undifferentiated Holocene, Pleistocene, and Pliocene Series ...............................15Miocene and Oligocene Series – Hawthorn Group ...............................................15Suwannee Limestone .............................................................................................17Eocene Group ........................................................................................................17Ocala Limestone ....................................................................................................17Avon Park Formation.............................................................................................18Oldsmar Formation ................................................................................................18
Formation Testing Results ............................................................................18Water Quality and Flow Rates with Drilled Depth................................................18Geophysical Logs ..................................................................................................19Straddle-Packer Pumping Test Results..................................................................22Aquifer Performance Tests ....................................................................................24Water Quality from the Pumping Tests .................................................................25Depth of Base of Underground Source of Drinking Water ...................................26Water Levels ..........................................................................................................26Equivalent Freshwater Head Correction................................................................29
Conclusions...................................................................................................31
References.....................................................................................................33
iii

Table of Contents Floridan Aquifer Test Well Program, South Bay
TABLE OF CONTENTS (CONTINUED)
APPENDICES
Appendix A: Lithologic Description for Well PBF-7 ................................ A-1
Appendix B: Geophysical Log Traces ........................................................B-1
Appendix C: Packer Test Data and Analyses..............................................C-1
Appendix D: Aquifer Performance Test Data and Analyses ..................... D-1
iv

Floridan Aquifer Test Well Program, South Bay List of Figures
LIST OF FIGURES
Figure 1. Project Location Map.................................................................................... 1-2
Figure 2. Vicinity Map ................................................................................................. 1-4
Figure 3. Completion Diagram for Well PBF-7............................................................ 1-7
Figure 4. Completion DIagram for Well PBF-9 ........................................................... 1-9
Figure 5. Well Configuration During Each Aquifer Performance Test ...................... 1-14
Figure 6. Hydrostratigraphic Summary of Well PBF-7. ............................................. 1-16
Figure 7. Wellhead Water Quality and Flow Rate as a Function of Depth................. 1-19
Figure 8. Hydrogeological Interpretation and Aquifer Characteristics of Site ........... 1-21
Figure 9. Trilinear Diagram of PBF-7 Upper and Lower Zones................................. 1-28
Figure 10. Hydrograph of PBF-7 Upper and Lower Aones with Associated BarometricPressure ........................................................................................................ 1-29
Figure 11. Freshwater Equivalent Head Hydrograph.................................................... 1-30
Figure B-1.Geophysical Log of PBF-7 (Sheet 1 of 5) .....................................................B-2
Figure B-2.Geophysical Log of PBF-7 (Sheet 2 of 5) .....................................................B-3
Figure B-3.Geophysical Log of PBF-7 (Sheet 3 of 5) .....................................................B-4
Figure B-4.Geophysical Log of PBF-7 (Sheet 4 of 5) .....................................................B-5
Figure B-5.Geophysical Log of PBF-7 (Sheet 5 of 5) .....................................................B-6
Figure C-1. Water Level Plot for Packer Test No. 1, 01/10/01 .......................................C-3
Figure C-2. Water Level Plot for Packer Test No. 1, 02/03/00 .......................................C-5
Figure C-3. Water Level Plot for Packer Test No. 2 .......................................................C-6
Figure C-4. Water Level Plot for Packer Test No. 5 .......................................................C-9
Figure D-1. Aquifer Test No. 1 Displacement Data ....................................................... D-3
Figure D-2. Aquifer Test No. 1 Drawdown Data (Cooper-Jacob) ................................. D-4
Figure D-3. Aquifer Test No. 1 Drawdown Data (Hantush) .......................................... D-6
Figure D-4. Aquifer Test No. 2 Drawdown Data (Hantush) .......................................... D-7
v

List of Figures Floridan Aquifer Test Well Program, South Bay
vi

Floridan Aquifer Test Well Program, South Bay List of Tables
vii
LIST OF TABLES
Table 1. Well PBF-7 Elevation Information................................................................ 1-6
Table 2. Geophysical Log Summary at Well PBF-7 ................................................. 1-10
Table 3. South Bay Straddle Packer Pumping Test Logistics Summary ................... 1-22
Table 4. South Bay Straddle-Packer Pumping Test Hydraulic Results Summary .... 1-22
Table 5. South Bay Aquifer Performance Test Analysis Summary .......................... 1-24
Table 6. Summary of Water Quality Data from Aquifer Performance Tests ............ 1-25
Table 7. Summary of Water Quality Data from Packer Tests ................................... 1-25
Table 8. Ionic Balance Analysis ................................................................................ 1-27
Table 9. Specific Gravity Calculation for Water from Well PB-7 ............................ 1-29
Table B-1. Video Survey for PBF-7 ................................................................................B-1
Table C-1. PBF-7 Packer Test No. 1 ...............................................................................C-2
Table C-2. PBF-7 Packer Test No. 2 ...............................................................................C-4
Table C-3. PBF-7 Packer Test No. 3 ...............................................................................C-7
Table C-4. PBF-7 Packer Test No. 4 ...............................................................................C-8
Table C-5. PBF-7 Packer Test No. 5 .............................................................................C-10
Table D-1. PBF-7 Aquifer Test No. 1............................................................................. D-2
Table D-2. PBF-7 Aquifer Test No. 2............................................................................. D-5

viii
List of Tables Floridan Aquifer Test Well Program, South Bay

Floridan Aquifer Test Well Program, South Bay Acknowledgements
ACKNOWLEDGEMENTS
The authors gratefully acknowledge the many people that aided in the successfulcompletion of this project. During the well construction and testing, Robert Tinselyprovided guidance and advice to the drilling crews and onsite observers. We would like tothank those outside the South Florida Water Management District (District or SFWMD)who reviewed the manuscript or lent technical expertise to the writing of the report. Theyinclude: Helen Hickman, P.G., Brown and Caldwell; Ron Reese, P.G., United StatesGeological Survey; Jon Arthur, P.G., Florida Geological Survey; and Tom Tessier, P.G.,Arcadis Geraghty & Miller, Inc.
Appreciation is also extended to the technical and professional staff of the SFWMDwho assisted in the compilation and analysis of data and the production of this report.They include Cindy Bevier, Cynthia Geffert, Linda Lindstrom, Steven Anderson, MichaelBennett, Peter Kwiatkowski, and John Lockwood. We thank Felicia Berger and theTechnology Resource Team for their editorial assistance in preparing this report forpublication.
ix
Acknowledgements Floridan Aquifer Test Well Program, South Bay
x

Floridan Aquifer Test Well Program, South Bay Introduction
1
INTRODUCTION
The South Florida Water Management District (District or SFWMD) constructedtwo new wells near the southern end of Lake Okeechobee as part of a Floridan AquiferSystem (FAS) exploratory drilling program. The wells are located near the S-2 pumpstation just north of the City of South Bay in Palm Beach County, Florida. The site islocated in Section 26, Township 43 South, Range 36 East, Latitude 26 degrees, 41’58”,and Longitude 80 degrees north, 42’57”. Figure 1 presents the locations of the wellsdescribed in this report as well as all the wells installed during the exploratory program.The wells were constructed to obtain hydrogeologic and water quality data from the FASwithin the District’s Lower East Coast planning area. This information can be combinedwith data from other FAS wells to obtain a better understanding of the water resourcepotential of the FAS. In addition, this information will be used to assist in the conceptualdevelopment and calibration of regional ground water flow models. Aquifer storage andrecovery wells have been proposed by the U.S. Army Corp of Engineers and the Districtin the Comprehensive Everglades Restoration Plan (CERP). Therefore, the local FASinformation obtained from these wells will be particularly useful.
Well PBF-7 was first drilled to a total depth of 2,504 feet below land surface (bls),then completed as a dual-zone monitor/observation well. The well taps two zones withinthe FAS: an upper zone (992 to 1,447 feet bls), and a lower zone (1,968 to 2,040 feet bls).Well PBF-9 was constructed as a dual-zone test-production well. The purpose of this wellwas to facilitate performance of two aquifer performance tests (APTs), which wereconducted to estimate hydraulic properties and water quality within different portions ofthe FAS. After the pumping tests were performed, Well PBF-9 was completed with anopen hole between 1,962 and 2,040 feet bls.
District staff served as overall project managers during this investigation, preparingthe well designs and technical specifications, and performing construction oversight of thedrilling contractor. All-Webb’s Enterprises (AWE), Inc. of Jupiter, Florida was selected asthe low-bid contractor to construct the wells. A District drilling contract (C-7660) wasexecuted in December 1995, and a Notice to Proceed was issued in May 1996.Construction began in June 1996 and was completed in April 1997. The contract includeddrilling, construction, and testing of Well PBF-7 and PBF-9, and installation of associatedwellhead piping and appurtenances.

2
Introduction Floridan Aquifer Test Well Program, South Bay
Figure 1. Project Location Map

Floridan Aquifer Test Well Program, South Bay Construction Details
3
CONSTRUCTION DETAILS
Two FAS wells were installed near the City of South Bay between June 1996 andApril 1997. The locations of the wells, relative to the Hillsboro and Rim Canals, areshown in the vicinity map (Figure 2). The drilling schedule and well casing setting depthswere designed to conform to the hydrogeologic features observed at the site. Datacollected during construction and testing of the wells included lithology, geophysicalproperties, water quality, water levels, transmissivity, storage, and leakance coefficientsthat corresponded to the producing zones within the FAS. The data were obtained fromcollection and description of drill cuttings, borehole geophysical logs, straddle-packerpumping tests, and two APTs.
Well PBF-7 Construction Summary
Construction of Well PBF-7 was initiated in June 1996 and completed in March1997. Well PBF-7 was initially drilled and tested to a total depth of 2,504 feet bls, thenback-plugged with cement to 2,040 feet bls, and completed as a dual-zone monitor well.The upper monitor zone was completed from 992 to 1,447 feet bls; the lower monitor zonewas completed from 1,968 to 2,040 feet bls.
Construction included the installation of four concentric casings (24-, 18-, 12-, and7-inch diameters). The 24-inch diameter pit casing first was vibrated into place to a depthof 15 feet bls. A nominal 10-inch diameter pilot hole was drilled into the top of theHawthorn Group to a total depth of 242 feet bls, using the mud-rotary method. The pilothole was reamed to a nominal 24-inch diameter, and a caliper log was conducted. The18-inch diameter steel surface casing was subsequently cemented in place to a depth of242 feet bls. The casing was pressure grouted with neat cement containing 12 percentbentonite. Pilot hole drilling resumed using the mud-rotary method to a depth of 1,115 feetbls. Geophysical logs, including the long- and short-normal (LSN) resistivity, naturalgamma ray, temperature, fluid resistivity, spontaneous potential (SP), and caliper wereconducted. A casing setting depth of 992 feet bls was selected for the 12-inch intermediatecasing, based on the presence of a hard, clean, competent limestone at this depth.
The geophysical logs indicated that the top of a limestone-rich interval, as identifiedby a low gamma ray response, occurred at a depth of 820 feet bls. However, the lithologicsamples, between 790 and 900 feet bls, indicated a high content of sand, clay, and siltwithin the limestone. The first competent, hard limestone was present at 990 feet bls.These data were used to select the setting depth of 990 feet bls for 12-inch diametercasing. The interval between 775 and 890 feet bls was straddle-packer tested later toconfirm a relatively low transmissivity, as discussed later in this report in the section onFormation Testing Results.

4
Construction Details Floridan Aquifer Test Well Program, South Bay
Figure 2. Vicinity Map

Floridan Aquifer Test Well Program, South Bay Construction Details
5
The pilot hole subsequently was reamed to a nominal 18-inch diameter to a depth of992 feet bls. The 12-inch diameter intermediate casing was installed to a depth of 990 feetbls and cemented to land surface. Once the cement cured, the pilot hole was advanced to adepth of 1,297 feet bls using the reverse-air, closed-circulation drilling method. The drillpipe was removed, and the borehole (from 990 to 1,297 feet bls) was developed untildischarge water was clear of cuttings. Geophysical logging operations were conducted byAWE. Logs included: gamma ray, LSN, SP, caliper, flowmeter, temperature, and fluidresistivity. Following the geophysical logging, Straddle-Packer Test No. 1 was conductedon the open-hole interval between 992 and 1,297 feet bls. The results of the straddle-packer testing are discussed later in this report in the section on Formation TestingResults.
Following Straddle-Packer Test No. 1, pilot-hole drilling resumed using the reverse-air drilling method to a depth of 1,789 feet. The drill pipe was again removed; geophysicallogs were conducted between the casing, set at 990 and 1,789 feet bls. Logs included:natural gamma ray, LSN, SP, caliper, temperature, flowmeter, fluid resistivity, andborehole video survey. Results of these logs were used to identify zones for additionalpacker testing. The intervals between 1,633 and 1,762 feet bls (Straddle-Packer Test No.2), and between 1,263 and 1,392 feet bls (Straddle-Packer Test No. 3) were tested.
Upon completion of Straddle-Packer Tests Nos. 2 and 3, pilot-hole drilling continuedto a total depth of 2,504 feet bls. The drill pipe was withdrawn, and the borehole was air-developed in preparation for geophysical logging and packer testing. Geophysical logswere conducted on January 15, 1997. Logs included: natural gamma ray, LSN, SP, statictemperature, static fluid resistivity, flowmeter, caliper, and a downhole video survey. OnJanuary 21, 1997, Halliburton Energy Services conducted the following logs: dualinduction, spectral density, dual-spaced neutron, sonic, and televiewer. Based oninterpretation of these logs, a zone between 1,913 and 2,020 feet bls was selected forfurther straddle-packer testing. Straddle-Packer Test No. 4 was conducted on February 2,1997.
The water quality results of Packer Test No. 4 were used, together with other datacollected from the well, to establish the setting depth for the 7-inch diameter final casingto a depth of 1,968 feet bls. A nominal 12-inch diameter bit was used to ream the pilothole to a depth of 1,968 feet bls. A caliper log was then conducted, and the final casingwas installed to a depth of 1,968 feet bls. The annular space around the lower-most 100feet of the final casing was pressure-grouted with neat cement. The remaining portion ofthe annular space to 1,447 feet bls was cemented using the tremie method, resulting in thecreation of an upper monitor zone between 992 and 1,447 feet bls.
The borehole between 2,504 to 2,040 feet bls was backfilled with a slurry of peagravel and cement. After the cement cured, the lower monitor interval between 1,968 and2,040 feet bls was cleaned out by reverse air drilling with a 6-inch diameter bit. The lowermonitor zone of the well would extend between 1,968 to 2,040 feet bls. Both monitorintervals were air-developed until discharge water was clear of suspended solids.

6
Construction Details Floridan Aquifer Test Well Program, South Bay
Subsequently, the wellhead was equipped with monitoring ports for the measurementof potentiometric heads and water quality sampling. The elevation of the monitoring portsand land surface elevations, relative to the National Geodetic Vertical Datum (NGVD) of1929, were obtained by the District. Table 1 presents some wellhead elevationmeasurements from Well PBF-7.
A reinforced concrete pad was built around the wellhead, and a chain-link fence withlocking hinged gate was installed. An as-built drawing for Well PBF-7 is shown inFigure 3.
Well PBF-9 Construction Summary
Construction of PBF-9 was initiated in December 1996 and completed in April 1997.Well PBF-9 was designed and constructed as a dual-zone test-production well. Thisconfiguration allowed for the performance of pumping tests at depths corresponding to themonitor zones of Well PBF-7. The upper test zone of Well PBF-9 was completed between1,202 and 1,447 feet bls; the lower test zone was completed between 1,968 and 2,040 feetbls. The upper monitor zone of Well PBF-7 was completed between 992 and 1,447 feetbls, which was slightly different than the upper test zone in Well PBF-9. The intervalbetween 992 and 1,202 feet bls in Well PBF-7 contained a high silt and chalk content. Siltand chalk have the potential to foul; subsequently, they cause submersible pumps to fail.Since this interval appeared to have relatively low permeability, based on the geophysicallogs and lithologic samples collected from Well PBF-7, it would likely not contributesignificant flow in the well.
Construction of Well PBF-9 began when the 24-inch diameter pit casing wasvibrated in place to an approximate depth of 15 feet bls. A nominal 24-inch diameter holewas drilled by the mud-rotary method to a depth of 242 feet bls, and the borehole wascaliper-logged. An 18-inch diameter steel surface casing was installed to a depth of 242feet bls. The casing was pressure grouted with neat cement. After the cement cured, anominal 10-inch diameter pilot hole was drilled using the mud-rotary method to a depth of890 feet bls. Caliper and gamma ray logs were run to verify hole diameter and forcorrelation purposes before conducting a straddle-packer pumping test.
Table 1. Well PBF-7 Elevation Information
Measuring Point Elevation in Feet Above NGVD
Land Surface 19.17
Upper FAS Monitor Zone Petcock 24.25
Lower FAS Monitor Zone Petcock 24.37

Floridan Aquifer Test Well Program, South Bay Construction Details
7
Figure 3. Completion Diagram for Well PBF-7

8
Formation Testing Program Floridan Aquifer Test Well Program, South Bay
Straddle-Packer Test No. 5 was conducted on February 19, 1997 between 775 and890 feet bls to verify the hydraulic properties and water quality within the uppermost FAS.Following Packer Test No. 5, the borehole was reamed to a nominal 18-inch diameter to adepth of 1,202 feet bls. This depth corresponds to the top of the first significant producingzone observed in Well PBF-7. Caliper and gamma ray logs were run from 242 to 1,202feet bls to verify hole diameter, and for correlation before setting the casing.
A 14-inch diameter steel intermediate casing was pressure grouted using a 12 percentbentonite-cement slurry from 1,202 feet bls to land surface. After the cement cured, theborehole was drilled using the reverse-air method with a nominal 12-inch diameter drillbit to a depth of 1,447 feet bls. This depth was selected since it was near the base of theuppermost producing zones within the upper FAS. The open-hole interval between 1,202and 1,447 feet bls was developed until discharge water was clear of particulates. On April3, 1997, APT No. 1 was conducted over the open-hole interval from 1,202 to 1,447 feetbls.
Following APT No. 1, a nominal 14-inch diameter borehole was drilled with theclosed-circulation reverse-air method to a depth of 1,960 feet bls. This depth correspondedto the top of a producing zone within the lower FAS observed in Well PBF-7. Uponcompletion of drilling the nominal 14-inch borehole, a 7-inch (inner) diameter fiberglassreinforced plastic (FRP) casing was installed in the interval between 1,004 and 1,960 feetbls. This final casing was pressure-grouted with neat cement containing 12 percentbentonite up to a depth of 1,005 feet bls. After the cement cured, the borehole wasadvanced with a 7-inch nominal diameter drill bit using the reverse-air, closed-circulationdrilling method to a total depth of 2,040 feet bls. The drill pipe was withdrawn from thewell, and the open hole was developed until discharge water was clear of particulates inpreparation for APT No. 2.
On May 14, 1997, APT No. 2 was conducted within the open-hole interval from1,960 to 2,040 feet bls. Once APT No. 2 was complete, a 14-inch diameter iron yolk valvewas installed and equipped with a monitoring port for the measurement of piezometricheads and water quality sampling. The wellhead was completed with a reinforced concretepad surrounded by a locked, chain-link fence, as shown in Figure 4. The contractorrestored the wellsite and demobilized in October 1997.
FORMATION TESTING PROGRAM
Cuttings Collection During Drilling
Lithologic samples (well cuttings) from Wells PBF-7 and PBF-9 were circulated toland surface while drilling to total depth. The mud-rotary drilling method was used fromland surface to a depth of approximately 1,115 feet bls. Below this depth, the reverse-airmethod was used. During mud-rotary drilling, formation cuttings were circulated from thebottom of the drilled hole to land surface. The cuttings were collected at 10-foot intervalsin a sieve that was suspended at the end of the mud discharge line. Cuttings were rinsedwith fresh water and described by the site geologist. The cuttings were compared with

Floridan Aquifer Test Well Program, South Bay Formation Testing Program
9
other information collected from the drilling process, such as penetration rate and flowingwellhead rates, to create a characterization of the penetrated formations. The pilot holebelow 1,115 feet bls was drilled using the reverse-air drilling method. The drilled cuttingswere collected at 10-foot intervals and/or at formation changes. Cuttings were describedby the District’s site geologist, noting particularly lithologic type, color, grain size,sorting, accessory minerals, fossils, etc. Observations of bit penetration rate, changes inflow rate observed at the discharge line, and miscellaneous drilling information wererecorded in these notes.
Figure 4. Completion DIagram for Well PBF-9

10
Formation Testing Program Floridan Aquifer Test Well Program, South Bay
After they were described, cuttings were bagged and hung to dry onsite. At the endof each week, the cuttings were transported back to the District warehouse located in WestPalm Beach. After processing, the cuttings were transferred to the Florida GeologicalSurvey (FGS) in Tallahassee, which is under contract with the District. The FGS provideda detailed FGS lithologic description for Well PBF-7 (FGS Well No. W-17542). Thisdescription is available in the FGS geologic database and is provided in Appendix A.
Geophysical Logging
Geophysical logs were conducted in the pilot holes of Wells PBF-7 and PBF-9 tocorrelate formation samples collected during drilling, identify lithologic and formationboundaries, correlate formation boundaries between wells, and obtain data pertinent to theunderlying stratigraphic formations and aquifers. These data were used in the selection ofthe optimum straddle-packer test intervals and for the determination of casing settingdepths. Geophysical logging was performed by two different logging companies. AWEran the logs during the well construction portion of the project. Halliburton EnergyServices, a specialty geophysical logging service company, ran a series of high-resolutionlogging tools in the pilot hole of Well PBF-7 between 990 and 2,504 feet bls. Thegeophysical logs performed on Well PBF-7 are listed in Table 2.
The following descriptions briefly define the uses and interpretations of thegeophysical logs performed:
Caliper Log: Measures the diameter of the borehole. This log is useful in identifyingwashouts, fractures, and competency (mechanical strength) of the strata.
Gamma Ray Log: Measures the natural gamma radiation produced by the rock,which is normally a function of the clay or phosphate content (in South Florida).
Table 2. Geophysical Log Summary at Well PBF-7
Date Log(s)
Casing Depth(ft bls)
Total Log Depth (ft bls)
6/1/96 Gamma, LSN Electric, SP, Temperature, Fluid Resistivity 15 241
8/29/96 Gamma, LSN Electric, SP, Temperature, Fluid Resistivity 240 1,115
9/6/96 Caliper 990 1,290
11/21/96Gamma, LSN Electric, SP, Temperature, Fluid Resistivity, Flowmeter, Caliper
990 1,785
12/9/96Gamma, LSN Electric, SP, Temperature, Fluid Resistivity, Flowmeter, Caliper, Video
990 2,504
1/15/97Gamma, LSN Electric, SP, Temperature, Fluid Resistivity, Flowmeter, Caliper, Video
990 2,504
1/21/97Gamma, SP, Dual Induction, Spectral Density, Neutron, Sonic, Fracture Finder
990 2,504

Floridan Aquifer Test Well Program, South Bay Formation Testing Program
11
Spontaneous Potential (SP) Log: Measures the natural potential fields that arecreated between borehole fluids and the surrounding rock materials. These logs are usedprimarily for correlation purposes.
LSN/Dual Induction/Electric Log: Measures the electrical properties of theformation. The resistivity of the formation is affected by lithology, porosity, and waterquality. These logs are comprised of shallow-, medium-, and deep-penetrating sondes thatinvestigate at various distances from the borehole into the formation.
Temperature Log: Measures the temperature of the fluid filling the borehole orcasing. It is also used to determine the elevation of emplaced cement during casinginstallation and provides information about the movement of fluids within drilledboreholes.
Fluid Resistivity Log: Provides a measurement of the in-hole liquid between the logprobes, which is a general indicator of the chemical quality of the water within theborehole.
Sonic Log: Measures the acoustic properties of the formation, which is a function oflithology and porosity.
Borehole Television (Video) Log: Provides a visual image of the borehole andcasing.
Flowmeter Log: Measures the contribution of water from various sections of thedrilled borehole. Useful in determining flow zones and confining units within thepenetrated strata.
Cement Bond Log: Measures the acoustic properties of the cemented casing to: (1)evaluate the strength and continuity of the cement bond to the outside of the casing, and(2) detect potential voids in the grout sheath around the casing.
Spectral Density Log: Is primarily used for formation matrix composition/lithologyidentification. It can differentiate between natural radioactive species in formation matrix,such as uranium, thorium, and potassium.
Neutron Log: Measures the hydrogen content of the borehole environment, which (inwater well applications) is an indirect measure of total porosity of the formation.
Fracture Finder Log: Is a sonic waveform log that presents an image of the boreholethat is dependent on the amplitude and travel time of a sonic wave transmitted from sourceto receiver. Fractures tend to disrupt and dampen the signal.
During geophysical logging, the caliper sonde indicated that the majority of theborehole (between 1,000 and 1,900 feet bls) was enlarged to a diameter that exceeded 23inches. The enlarged borehole caused the pad-type logging probes to lose contact with theborehole wall, generating less reliable density and neutron log responses. Other type of

12
Formation Testing Program Floridan Aquifer Test Well Program, South Bay
logs (such as the sonic log) also are negatively affected by an enlarged borehole. Intervalsof the borehole that were not enlarged were those consisting of well-indurated andcrystalline limestones and dolostones. In these intervals, the hole was less than or equal to12 inches in diameter, causing the probe’s pad to come in contact with the borehole wall,resulting in good geophysical log data. Geophysical logs traces for the pilot-hole of WellPBF-7 are provided in Appendix B. A complete set of geophysical logs is on file at theDistrict headquarters in West Palm Beach, Florida.
Water Sampling During Drilling
Flowing wellhead water samples were collected during reverse-air drilling at the endof each drill rod (usually at 30-foot intervals). Field water quality parameters, includingpH, specific conductance and temperature, were measured on these samples using aHydrolab multiparameter probe. Chloride concentrations also were determined using aHach field titration kit. These test results were recorded as part of the data acquisition.
Reverse-air drilling affords the opportunity to collect water samples from near thedrill bit as it penetrates the aquifer system. However, these samples do not alwaysaccurately reflect the discrete formation water quality. Interpretation of water qualitychanges within the FAS must, therefore, be made using all available pilot-holeinformation, including the geophysical logs. The information is confirmed using the waterquality results from actual samples obtained during straddle-packer testing and APTs.
Straddle-Packer Pumping Tests
Four separate straddle-packer pumping tests were conducted on the pilot hole ofWell PB-7 from 790 to 2,505 feet bls. One straddle-packer pumping test was conductedduring construction of Well PBF-9. The purpose of packer testing was to identifyhydraulic properties and confirm the water quality of discrete intervals within the pilothole. Tested intervals were selected using all available field information, includinglithologic cuttings, drill reports, reverse-air water sampling results, water-levelmeasurements, and geophysical logs.
During a straddle-packer pumping test, two inflatable packers were attached to aperforated portion of drill pipe and lowered in the well to a preselected depth. Once theinflatable elements were positioned properly, they were inflated with a high pressurenitrogen line from the surface. Water entered the perforated portion of the drill pipe fromthe isolated interval. A 4-inch diameter submersible pump was lowered approximately 90feet down into the pipe assembly. This pump had a maximum sustained pumping capacityof approximately 260 gallons per minute (gpm). A discharge hose ran from the pumpthrough an in-line flowmeter and into storage tanks at the surface. Pressure transducerswere installed in the drill pipe below the static water level and remained submerged for theduration of the pumping tests. The transducer cables were connected to in situ data-loggers to record water levels as a function of time. Water levels also were manuallyrecorded for all transducers before pumping.

Floridan Aquifer Test Well Program, South Bay Formation Testing Program
13
The submersible pump was started, and water level data were recorded. The pumpedflow rate, as measured by the in-line flowmeter, also was recorded periodically to ensurethat a constant pumping rate was maintained during the test. After the pumped well wasevacuated a minimum of three borehole volumes, water samples were collected from thedischarge line. These samples were collected using all applicable District QualityAssurance/Quality Control (QA/QC) standards and transported to the District lab foranalysis. Major ions were analyzed by the District lab for all water samples; the results ofthose analyses are discussed in Formation Testing Results section.
After steady-state water level was established and maintained for a minimum periodof 24 hours, the pump was shut down, and a recovery period commenced. When waterlevels reached prepumping background conditions, the test was terminated and the packerassembly removed. Field data recorded during the straddle-packer tests are shown inAppendix C.
Aquifer Performance Tests
Two APTs were conducted within the FAS at this site. Well PBF-9 served as thepumped well during the APTs, and Well PBF-7 served as the observation well. The APTswere conducted by installing a 10-inch diameter submersible pump into Well PBF-9. Thefirst APT was conducted to test the upper Floridan aquifer producing zone, while theintermediate casing of Well PBF-9 was set at 1,202 feet bls and the open hole extended to1,447 feet bls. The pumping test was conducted at a pumping rate of 1,550 gpm and apumping duration of 55 hours.
The second APT was conducted to test the middle Floridan aquifer producing zoneafter the final casing of Well PBF-9 was set to 1,960 feet bls and the open hole extended to2,040 feet bls. The pumping test was conducted at a rate of 1,030 gpm for a duration of 69hours. Figure 5 presents the configuration of the wells during each of the APTs. The testpump was lowered approximately 100 feet into the well on 10-inch diameter steeldischarge pipe. Three-phase electricity was applied to the pump by an onsite generator.Flow rate was measured using a 10-inch diameter orifice weir with an 8-inch diameterorifice plate and verified by an in-line flow meter.
Background water levels were recorded for approximately one day before the start ofeach APT. During the tests, water levels in the pumped well and observation well weremeasured with an in situ (30 and 50 pounds per square inch [psi]) pressure transducersconnected to a Hermit Series 2000 data logger. APT details are provided in Appendix D.A barometer also was used to measure atmospheric pressure variations during the APTs todetermine if a barometric correction should have been applied to the data.
Water samples were collected after several hours of continuous pumping during eachof the APTs to provide composite water quality data on the pumped interval. The sampleswere analyzed for standard field parameters with a Hydrolab water quality meter, andtransported to the District’s laboratory for further analysis. The results of these analysesare provided in the Formation Testing Results section.

14
Formation Testing Program Floridan Aquifer Test Well Program, South Bay
Figure 5. Well Configuration During Each Aquifer Performance Test

Floridan Aquifer Test Well Program, South Bay Site Geology
15
SITE GEOLOGY
Strata encountered during the construction of Wells PBF-7 and PBF-9 ranged in agefrom Eocene to Holocene. The stratigraphic units (in descending order) were as follows:undifferentiated Holocene, Pleistocene, and Pliocene age sediments; the Hawthorn Groupof Pliocene-Miocene age; and the Ocala Group and Avon Park Formation of Eocene age.Figure 6 presents a hydrostratigraphic summary of the site, including depth, lithologiccolumn, geologic age, formation name, hydrogeologic unit, accompanied by a naturalgamma-ray, caliper, and resistivity logs. The stratigraphic interpretation was derived fromthe correlation of formation samples with geophysical logs conducted during pilot-holedrilling of Well PBF-7.
Undifferentiated Holocene, Pleistocene, and Pliocene Series
From land surface to a depth of approximately 208 feet bls, the lithology consists ofpoorly to well consolidated shells, sands, silts, and limestone. Although not differentiated,formations comprising the Holocene to Pliocene series at this site may include portions ofthe Pamlico Sand, Fort Thompson, and Tamiami Formations. The top of the HawthornGroup was not uniquely distinguishable on the natural gamma-ray log, but was identifiedat a depth of 208 feet bls, based on the first occurrence of olive-green sandstone and clays.
Miocene and Oligocene Series – Hawthorn Group
Peace River and Arcadia Formations
The top of the Hawthorn Group was found at 208 feet bls at the site. The HawthornGroup is commonly characterized by a variable siliclastic and phosphate content, a gray toolive green color, and a relatively high gamma-ray log response. The Hawthorn Group, asdefined by Scott (1988), is divided into the Peace River and Arcadia Formations. Reeseand Memberg (2000) identified two distinct units within the lower portion of theHawthorn Group, based on gamma-ray log responses and lithologic character. The upperunit, designated as a marker unit, contains thin beds with higher gamma-ray activitymarking its upper and lower boundaries, and contains lower phosphate content and fewershells. It is generally finer grained than the overlying and underlying beds. This unit ispresent throughout Palm Beach County and extends west of the study area into Lee,Hendry, and Collier Counties (Reese, 1999); it occurs between 630 and 730 feet bls at thissite.
The basal Hawthorn unit is Oligocene in age and lies beneath the marker unit. Thetop of the basal unit is characterized on the gamma-ray log by relatively high gamma-rayactivity, and at its base by moderate to low gamma ray activity. The basal Hawthorn unitwas identified between 730 and 900 feet bls at Well PBF-7. The lithology is highlyvariable, consisting of calcareous clay or silt; sandy, fossiliferous limestone; quartz sandor sandstone; dolomite; shells; and phosphatic sand.

16
Site G
eology F
loridan Aquifer T
est Well P
rogram, S
outh BayFigure 6. Hydrostratigraphic Summary of Well PBF-7.

Floridan Aquifer Test Well Program, South Bay Site Geology
17
Suwannee Limestone
The Suwannee Limestone was not recognized in the cuttings recovered from thewells at the site. The typical lithology of the Suwannee Limestone in Southwestern Floridais pale-orange to tan, fossiliferous, medium-grained calcarenite with minor amounts ofquartz sand. Phosphatic mineral grains are rare within the formation. According to Reeseand Memberg (2000), the Suwannee Limestone pinches out in the eastern portion of PalmBeach County, although it is possible that the formation is not present in most of thecounty. Reese and Memberg included what is often referred to as the SuwanneeLimestone along the southeast coast of Florida as part of the basal Hawthorn Group; thenomenclature is used in this report.
Eocene Group
The boundary between the Hawthorn Group and the Eocene Group at the site wasdetermined to be at a depth of 900 feet bls. Identification of distinct Eocene-aged geologicformations in South Florida is difficult due to similarities in lithology and geophysical logresponses. Difficulties in differentiating individual formations within the Eocene sectionfrom well cuttings has long been recognized by workers in the area, and was most recentlydiscussed by Powers and McNeal (2000). Therefore, these formations have been groupedtogether and are informally referred to as the Eocene Group in this report. Descriptions ofthree geologic units within the Eocene Group and their occurrence at the site aresummarized below.
Ocala Limestone
Between the depths of 900 and 980 feet bls, poorly indurated, chalky, silty, andsandy clay and packstone were observed. This transitional Ocala interval probablyrepresents reworked sediments as part of a regional unconformity that exists at the top ofthe Eocene section of South Florida. The first occurrence of a clean, competent limestoneat the site was found at a depth of 980 feet bls. The lithology of the Ocala Limestonevaries from micritic or chalky limestone, to a medium-grained calcarenitic or coquinoidlimestone. It is characterized by abundant larger benthic foraminifera, such asOperculinoids sp., Camerina sp., and Lepidocyclina sp. (Peacock, 1983). Lepidocyclinasp. were observed in the cuttings by the field geologist from 848 to 940 feet bls. However,the top of the Ocala Limestone was placed at 900 feet bls at Well PBF-7, based primarilyon correlation with other wells in the vicinity. The base of the Ocala Limestone wasidentified at 980 feet bls.

18
Formation Testing Results Floridan Aquifer Test Well Program, South Bay
Avon Park Formation
The Avon Park Formation consists predominantly of calcarenitic to micritic,fossiliferous limestone. Occasionally, it contains a large percentage of fine- to medium-grained, moderately- to well-sorted carbonate sand. Characteristic foraminifera includeDictyoconus cookei and Dictyoconous americanus. The first occurrence of these indicatorfossils at Well PBF-7 was at a depth of 980 feet bls, providing the only tangible evidenceof this formation’s occurrence in the section. This interval was present between 980 and1,950 feet bls.
Oldsmar Formation
The Oldsmar Formation is typically a massive dolomitic interval near the lowerportion of the Avon Park Formation in this area of Palm Beach County. This unit containsoccasional thin limestone beds and was identified between 1,950 and 2,504 feet bls atWell PBF-7. This interval has been interpreted as representing the uppermost member ofthe Oldsmar Formation. The lower portion of this formation contains a highlytransmissive dolomitic interval locally known as the Boulder Zone. This interval is usuallypresent at a depth of approximately 3,000 feet bls in western Palm Beach County and wasnot penetrated by the wells at this site.
FORMATION TESTING RESULTS
The formation testing program at the site included lithologic examination,measurements while drilling (rate of penetration, weight on bit, drilling characteristics,and wellhead water flow), geophysical surveys, straddle packer pumping tests, APTs,water quality analyses, and subsequent measurements of water levels. Raw data andlaboratory analyses are contained in the appendices of this report; a summary of the resultsis provided in this section.
Water Quality and Flow Rates with Drilled Depth
Artesian flow data and water-quality samples were collected at the wellhead of WellPBF-7 at 30-foot intervals. Reverse-air drilling was performed through the FAS. Therecorded data consisted of artesian flow rate measured in gallons per minute (gpm),chloride concentration, temperature, and specific conductivity data. The purpose ofcollecting and analyzing the flowing wellhead water samples was to provide a generalizedprofile of water-producing zones and water quality, with respect to depth.
Figure 7 graphically represents wellhead water quality and flow rate as a function ofdepth. This graph demonstrates that wellhead flow rate increased gradually with depth, asadditional producing zones within the FAS were penetrated. Distinct increases in flowrates were observed below 1,200 and 1,900 feet bls. These intervals would later becomedefined as the upper and lower producing zones.

Floridan Aquifer Test Well Program, South Bay Formation Testing Results
19
Water quality parameters remained fairly consistent during the drilling operationsuntil the depth of approximately 1,900 feet bls. At 1,900 feet bls, the salinity of the waterbegan to increase significantly. This depth was later established at the base of theUnderground Source of Drinking Water (USDW). Below a depth of 2,200 feet bls, thesalinity of the water was near that of the concentration of seawater.
Geophysical Logs
Geophysical logs were conducted in Well PBF-7 and Well PBF-9 to complementlithologic samples, identify formation boundaries, correlate between wells, and obtainspecific information pertaining to the geologic formations and aquifers, includingdelineation of producing zones. Geophysical log traces for several of the logging runswere digitized and are provided in Appendix B. A description of the video log is providedin Appendix B, Table B-1. Original geophysical log and video surveys are archived andavailable at the District headquarters in West Palm Beach.
Video Survey and Flowmeter and Fluid Resistivity Logs: The producing zones withinthe FAS are commonly characterized by secondary features, such as solution cavities andvertical fracturing. Discrete flow zones exist throughout the vertical section of mostFloridan wells, which cumulatively contribute to the total flow observed at the wellhead.
Figure 7. Wellhead Water Quality and Flow Rate as a Function of Depth

20
Formation Testing Results Floridan Aquifer Test Well Program, South Bay
Logs particularly useful in delineating flow zones, while the well is flowing, include thedown-hole video survey, flowmeter, fluid resistivity, and temperature logs. Dual-induction and sonic logs are useful in delineating layers of higher permeability where flowis more likely. Review of these logs indicated that flow zones in Well PBF-7 occurredwithin the following intervals:
• 1,246 to 1,325 feet bls
• 1,975 to 2,024 feet bls
• 2,124 to 2,198 feet bls
• 2,363 to 2,424 feet bls.
Most of the flow zones were observed in the crystalline dolomite found below 1,950feet bls. A visual display of the depths at which the flow zones occurred, as well as anoverall hydrogeologic interpretation summary of the site, are presented in Figure 8.
Induction Log: The dual-induction log indicated a spread between the shallow,medium, and deep investigation curves between the depths of 1,000 and 1,900 feet bls.This indicated that the limestone within this interval exhibited some permeability.Between 1,900 and 2,200 feet bls, the resistivity increased and displayed multiple spikesas a result of the hard, dense, thinly-bedded, fractured dolomite within this interval. Thelow resistivity (~2 ohm-meters) exhibited on the Dual-Induction log at 2,200 feet blscorresponds to degrading (higher salinity) water quality observed while drilling.
Caliper Log: The caliper log of Well PBF-7 indicated a rather uniform boreholediameter of 20 to 24 inches from the base of final casing (992 feet bls) to 1,675 feet bls.Below this depth, the borehole enlarged to approximately 30 inches to 1,800 feet bls.Increases in borehole diameter are observed on the caliper log between 2,180 and 2,280feet bls, consistent with fractured dolomite layers.
Sonic Log: The sonic log read an average interval velocity of 120 microseconds perfoot within the interval from 1,000 to 1,400 feet bls. This velocity could be equated to aprimary porosity of approximately 37 percent within a clean limestone formation. Theinterval between 1,450 and 1,600 feet bls was not recorded by the log, due to largeborehole conditions. The interval between 1,600 and 1,900 feet bls read an averageinterval velocity of 100 microseconds per foot, which was equated to a limestone porosityof 32 percent. The interval below 1,900 feet bls read velocities of approximately 70microseconds per foot, which was a result of dolomite comprising the formation matrix.
Gamma-Ray Log: The gamma-ray log exhibits low counts (less than 15 API units)throughout the interval between 800 and 1,900 feet bls. This indicated a relatively cleanlimestone, containing little clay or phosphate. The dolomitic interval between 1,950 and2,200 feet bls is evident by the slightly higher gamma counts. Below the dolomiticinterval, the gamma-ray counts indicate relatively clean limestone matrix.

Floridan Aquifer Test Well Program, South Bay Formation Testing Results
21
Figure 8. Hydrogeological Interpretation and Aquifer Characteristics of Site

22
Formation Testing Results Floridan Aquifer Test Well Program, South Bay
Temperature Log: The temperature profile indicates a gradual increase from 25.5oCat 1,078 feet bls to 26.3oC at 2,504 feet bls. Subtle deviations from this gradualtemperature increase coincide with flow zones.
Straddle-Packer Pumping Test Results
Straddle-packer pumping tests were conducted during the drilling operations toisolate four selected FAS zones in Well PBF-7, and one FAS zone in Well PBF-9. Asummary of the packer test logistics and analyses results is provided in Tables 3 and 4.Packer-test field summary sheets and time drawdown plots are provided in Appendix C.
Table 3. South Bay Straddle Packer Pumping Test Logistics Summary
Packer Test Number Tested Well
Interval (ft bls)
Static Water Level*
(ft above NGVD)
Q (gpm)
Maximum Drawdown
(ft)
Total Pumping
Time (min)
1 PBF-7 1,012-1,297 54.8 250 14.7 600
2 PBF-7 1,633-1,762 53.1 204 80 270
3 PBF-7 1,263-1,392 49.5 210 65 540
4 PBF-7 1,913-2,020 54.4 206 2 240
5 PBF-9 775-890 51.3 94 79 360
* Static water level is reported uncorrected for equivalent freshwater head.
Table 4. South Bay Straddle-Packer Pumping Test Hydraulic Results Summary
Packer Test Number
Interval (ft bls)
Test Interval
Thickness (ft)
Q (gpm)
Specific Capacity (gpm/ft)
Transmissivity (gpd/ft)
Hydraulic Conductivity
(ft/day)
1 1,012-1,297 285 250 17 47,020 22
2 1,633-1,762 129 204 2.6 11,400 12
3 1,263-1,392 129 210 3.2 37,210 38
4 1,913-2,020 107 206 103 206,000 (est.) 257
5 775-890 115 94 1.2 5,556 6.5

Floridan Aquifer Test Well Program, South Bay Formation Testing Results
23
Straddle-Packer Test No. 1: Packer Rest No. 1, conducted November 26, 1996,consisted of pumping the interval between 1,012 and 1,297 feet bls (upper portion of FAS)in Well PBF-7. This interval was pumped for 10 hours at an average discharge rate of 250gpm. The static water level before pumping the well was measured as 54.8 feet NGVD.The land surface at the site was approximately 19.2 feet above NGVD. The maximummeasured drawdown, while pumping was 14.7 feet. The specific capacity was calculatedas 17 gpm/ft. A transmissivity of 47,020 gpd/ft was estimated based on a plot of the time-drawdown data using the straight-line Jacob method. Chlorides and total dissolved solids(TDS) sampled from the zone were 1,464 and 3,070 mg/L, respectively.
Straddle-Packer Test No. 2: Packer Test No. 2 isolated the interval between 1,633and 1,762 feet bls in Well PBF-7. The drawdown test was conducted by pumping thisinterval for 4.5 hours at an average rate of 204 gpm. The static water level was measuredat 53.1 feet above NGVD. Maximum drawdown measured while pumping was 80 feet,and the specific capacity calculated as 2.6 gpm/ft. A transmissivity of 11,400 gpd/ft wasestimated using the Jacob straight line method. Chlorides and TDS sampled from the zonewere 1,446 and 3,120 mg/L, respectively.
Straddle-Packer Test No. 3: Packer Test No. 3 isolated the interval between 1,263and 1,392 feet bls in Well PBF-7. The drawdown test was conducted by pumping thisinterval for 9 hours at an average rate of 210 gpm. The static water level was measured at49.4 feet above NGVD. The maximum drawdown was 64.9 feet, and the specific capacitycalculated as 3.2 gpm/ft. A transmissivity of 37,210 gpd was using the Jacob straight linemethod. Chlorides and TDS sampled from the zone were 1,390 and 3,090 mg/L,respectively.
Straddle-Packer Test No. 4: Packer Test No. 4 isolated the interval between 1,913and 2,020 feet bls in Well PBF-7. The drawdown test was conducted by pumping thisinterval for 3.4 hours at an average rate of 206 gpm. The static water level was measuredas 54.4 feet above NGVD. The maximum measured drawdown was 1.7 feet, and thespecific capacity calculated as 103 gpm/ft. The water level recovered too quickly in thewell for application of conventional methods for the computation of aquifercharacteristics. However, this is evidence of very high transmissivity exhibited by theinterval. For purposes of estimation, a transmissivity of 206,000 gpd/ft was estimated forthis interval by multiplying the specific capacity by 2,000 using a method described byFetter (1992). Chlorides and TDS sampled from the zone were 8,179 and 13,800 mg/L,respectively. The water quality results from this test were used in combination with thegeophysical log analysis to determine that the base of the USDW was at a depth ofapproximately 1,900 feet at the site.
Straddle-Packer Test No. 5: Packer Test No. 5 consisted of pumping the intervalbetween 775 and 890 feet bls in Well PBF-9. This was the only packer test conducted inWell PBF-9, and the only test conducted in a mud-filled borehole. This test wasparticularly important since it provided information about the productivity of theuppermost portion of the upper Floridan aquifer. The test was conducted by pumping thisinterval for 6 hours at an average discharge rate of 94 gpm. The static water level wasmeasured as 51.3 feet above NGVD. Maximum drawdown was 78.5 feet and the specific

24
Formation Testing Results Floridan Aquifer Test Well Program, South Bay
capacity calculated as 1.2 gpm/ft. A transmissivity of 5,556 gpd/ft was estimated using theJacob straight-line method. Chlorides and TDS sampled from the zone were 1,998 and4,100 mg/L, respectively.
Aquifer Performance Tests
Two APTs were conducted to evaluate subsurface flow and water qualitycharacteristics of the FAS. The results of these tests are provided in Table 5. In addition,detailed APT summary sheets and time-drawdown plots are provided in Appendix D.
APT No. 1: The first test, begun April 3, 1997, consisted of pumping the intervalbetween 1,202 to 1,447 feet bls (upper portion of FAS) in Well PBF-9 for 55 hours at aconstant discharge rate of 1,550 gpm, while monitoring water levels in the uppermonitoring zone of Well PBF-7. The static water level in Well PBF-9 was measured as53.2 above NGVD before the initiation of pumping. The specific capacity in the pumpedwell was estimated at 127 gpm/ft.
The maximum drawdown during pumping recorded at the observation well (located398 feet away) was 12.2 feet. A transmissivity of 71,100 gpd/ft and storage coefficient of2.9 X 10-4 were estimated based on a log-log plot of the time-drawdown data (AppendixD) using the Hantush-Jacob curve matching method. Since the tested interval had athickness of 245 feet, a hydraulic conductivity of 39 feet per day was estimated for theinterval. This estimate was in good agreement with that derived from the straddle-packerpumping tests. A leakance of 0.0047 gpd per cubic foot (gpd/ft3) was estimated using theWalton (1960) method.
APT No. 2: The second APT was conducted on May 14, 1997, and consisted ofpumping the interval between 1,968 to 2,040 feet bls (middle portion of upper FAS) inWell PBF-9 for 69 hours at a constant discharge rate of 1,030 gpm, while monitoringwater levels in the lower monitoring zone of Well PBF-7. The static water level in WellPBF-9 was measured as 44.3 above NGVD prior to the initiation of pumping.
Table 5. South Bay Aquifer Performance Test Analysis Summary
Interval (ft bls)
Thickness (ft)
Static Water Level
(NGVD)
Observation Well Max
Dd (ft) Q (gpm) T (gpd/ft)
Hydraulic Conductivity
(ft/day)Storage
Coefficient r/BLeakance (gpd/cu ft)
Pumping Test 1
1202-1447 245 53.2 12.2 1,550 71,100 39 2.9 X 10⁻⁴ 0.1004 0.0048
Pumping Test 2
1960-2040 80 44.3 1.1 1,030 504,100 842 2.6 X 10⁻⁵ (t) 0.1 (t) 0.032(t)
t = tentative

Floridan Aquifer Test Well Program, South Bay Formation Testing Results
25
The maximum drawdown measured in the observation well during pumping was 1.1feet. The drawdown was achieved after only 30 minutes of pumping, and remained fairlystable for the remaining 68 hours of the test. The tested interval was a fractured dolomitewith extensive secondary porosity, so some contribution from conduit-type flow wasprobably occurring during the test. A transmissivity of 504,100 gpd/ft and storagecoefficient of 2.6 X 10⁻⁵ was calculated using the Theis recovery method. Since the testedinterval had a thickness of 80 feet, a hydraulic conductivity of 842 feet per day wasestimated for the interval. This estimate was not in very good agreement with that derivedfrom the straddle-packer pumping tests, however, the estimate from the straddle-packerpumping test was based on empirical relationships based on specific capacity information.A leakance of 0.032 gpd/ft3 was tentatively estimated using the Walton (1960) method.
Water Quality from the Pumping Tests
Chlorides and TDS concentrations in water sampled from the zone between 1,202and 1,447 feet bls during APT No. 1 were 1,481 and 3,210 mg/L, respectively. Chloridesand TDS concentrations in water sampled from the zone between 1960 and 2,040 feet blsduring APT No. 2 were 9,350 and 15,900 mg/L, respectively. Table 6 lists the analyticalresults of water quality samples collected during the APTs and Table 7 describes theresults of water quality analyses from packer pumping tests. Examination of the tablesindicates that water in the uppermost FAS is more saline than water in the middle portionof the upper FAS. This indicates that water in the uppermost zone may be more “relict”and less well flushed than water in the middle portion of the upper FAS.
Table 6. Summary of Water Quality Data from Aquifer Performance Tests
Well Name/Sample Depth
Na(Mg/L)
K(Mg/L)
Ca(Mg/L)
Mg2+
(Mg/L)Cl
(Mg/L)SO4
(Mg/L)
Alkalin.As
CaCO3(Mg/L)
F(Mg/L)
Sr(Mg/L)
TDS(Mg/L) pH
SC(mmhos/
cm)
PBF-7U/1202-1447 861 43.3 133.0 112.0 1481.0 528 117.7 1.4 25.8 3,210 7.7 5,484
PBF-7L/1960-2040 4695 221.0 473.0 558.0 9350.5 1076 108.8 0.5 47.1 15,900 6.8 27,030
SC = Specific conductivity (micromhos/centimeter)
Table 7. Summary of Water Quality Data from Packer Tests
Well Name/Sample Depth #
Na(Mg/L)
K(Mg/L)
Ca(Mg/L)
Mg(Mg/L)
Cl(Mg/L)
SO4(Mg/L)
Alkalin. As
CaCO3(Mg/L)
F(Mg/L)
Sr(Mg/L)
TDS (Mg/L)
SC (mmhos/
cm)
PBF-7/1012-1297 1 556 17.1 105.6 90.8 1463.7 511.7 120.8 0.745 21,800 3,070 5,550
PBF-7/1633-1762 2 604 21 111 104 1445.8 513.6 133.3 0.788 20,000 3,120 5,340
PBF-7/1263-1392 3 837 35.1 114 1390.8 475.3 275.8 0.844 20,600 3,090 5,340
PBF-7/1913-2020 4 3780 141.2 380 448 8179.1 977.6 108.4 0.486 41,200 13,800 23,310
PBF-9/775-890 5 1060 51.4 138 170 1997.9 660.0 255.5 1.06 11,320 4,100 7,110

26
Formation Testing Results Floridan Aquifer Test Well Program, South Bay
The chemical composition of groundwater within the FAS is influenced by severalfactors, including lithology, flow patterns, presence of solution features, and residencetime. The hydrochemical facies of groundwater can be classified on the basis of thedominant ions by means of a trilinear diagram and an ionic strength analysis described byFrazee (1982). Table 8 presents the computation of the relative strengths of the majorcations and anions in the water samples collected during the straddle-packer tests and theAPTs. Water samples obtained from Well PBF-7 during the two APTs were plotted in thetrilinear diagram shown in Figure 9. Data from the straddle-packer tests were not used forthe trilinear diagram analysis because several of the anion-cation balance computationsresulted in errors of greater than the recommended 5 percent range. The points plotted insimilar positions on the diagram defined as of “lateral intrusion or seawater origin” facies,which is dominated primarily by the sodium and chloride ion species.
Depth of Base of Underground Source of Drinking Water
The base of the Underground Source of Drinking Water (USDW) is defined by theState as the depth to which water containing a TDS concentration of less than 10,000 mg/L extends. The concentration of TDS sampled from between 1,913 and 2,020 feet blsduring straddle-packer Test No. 4 was 13,800 mg/L, which was therefore below the baseof the USDW. The concentration of TDS sampled from between 1,633 and 1,762 feet blsduring straddle-packer test No. 2 was 3,120 mg/L, which is above the base of the USDW.The water quality results from these tests were used in combination with the geophysicallog analysis to determine that the base of the USDW was at a depth of approximately1,900 feet at the site. The depth correlates very closely with the depth of the base of theUSDW determined at the City of Belle Glade Wastewater Treatment Plant deep injectionwell system, located approximately three miles to the east, by Geraghty and Miller (1991).
Water Levels
Water levels in both zones of Well PBF-7 were measured monthly during the periodfrom October 1997 to December 1999. Water levels referenced to NGVD of 1929 areplotted on a hydrograph presented in Figure 10. The hydrograph illustrates how waterlevels (unadjusted for density) in the upper Floridan aquifer are approximately 14 feethigher than those in the lower Floridan aquifer. Most of this differential was subsequentlyfound to be a result of the different densities of the fluids within zones of the aquifer.Water from the lower zone is more saline, and thus heavier than water in the upper zone.The mean water level for the period of record (October 1997 to December 1999) for theupper and lower Floridan aquifers at the site were 56.5 and 42.7 feet above NGVD,respectively. The minimum and maximum water levels recorded for the same period in theupper Floridan aquifer were 51.9 (March 1998) and 58.5 (February 1999) feet aboveNGVD, respectively. The minimum and maximum water levels for the lower Floridanwere 40.3 (April 1999) and 44.7 (February 1999) feet above NGVD, respectively. Overall,levels fluctuate seasonally, increasing to an annual high in the months preceding Marchand April. In March and April, they decline to their annual lows by approximately 3 to 4feet in the upper and 1 to3 feet in the lower Floridan aquifers.

Floridan Aquifer Test Well Program, South Bay Formation Testing Results
27
Conversion to milliequivalents per liter (me/L) - Frazee Method Input data on yellow line
Packer Test No. 1 (1,012' - 1,297')Ca Mg Na K Cation Total Cl SO4 CaCO3 CO3 Anion Total
mg/L 106 91 556 17 1464 511 120 0me/L 5.29 7.49 24.19 0.43 37.40 41.30 10.64 2.40 0.00 54.34% 14.14 20.02 64.68 1.16 100.00 76.00 19.59 4.42 0.00 100.00
Error % = -18.47
Packer Test No. 2 (1,633' - 1,762')Ca Mg Na K Cation Total Cl SO4 CaCO3 CO3 Anion Total
mg/L 111 104 604 21 1445 513 133 0me/L 5.54 8.56 26.27 0.54 40.90 40.76 10.69 2.66 0.00 54.11% 13.54 20.91 64.23 1.31 100.00 75.34 19.75 4.92 0.00 100.00
Error % = -13.90
Packer Test No. 3 (1,263' - 1,392')Ca Mg Na K Cation Total Cl SO4 CaCO3 CO3 Anion Total
mg/L 156 114 837 35 1390 475 275 0me/L 7.78 9.38 36.41 0.89 54.47 39.21 9.89 5.50 0.00 54.61% 14.29 17.22 66.85 1.64 100.00 71.81 18.12 10.07 0.00 100.00
Error % = -0.13
Packer Test No. 4 (1,913' - 2,020')Ca Mg Na K Cation Total Cl SO4 CaCO3 CO3 Anion Total
mg/L 380 448 3780 141 8179 977 108 0me/L 18.96 36.85 164.43 3.61 223.85 230.73 20.35 2.16 0.00 253.24% 8.47 16.46 73.46 1.61 100.00 91.11 8.04 0.85 0.00 100.00
Error % = -6.16Packer Test No. 5 (775' - 890')
Ca Mg Na K Cation Total Cl SO4 CaCO3 CO3 Anion Total mg/L 138 170 1060 51 1998 660 255 0me/L 6.89 13.98 46.11 1.30 68.28 56.36 13.75 5.10 0.00 75.21% 10.08 20.48 67.53 1.91 100.00 74.94 18.28 6.78 0.00 100.00
Error % = -4.83
APT No. 1 (1,202' - 1,447')Ca Mg Na K Cation Total Cl SO4 CaCO3 CO3 Anion Total
mg/L 133 112 861 43 1481 528 117 0me/L 6.64 9.21 37.45 1.10 54.40 41.78 11.00 2.34 0.00 55.12% 12.20 16.94 68.84 2.02 100.00 75.80 19.95 4.25 0.00 100.00
Error % = -0.65
APT No. 2 (1,960' - 2,040')Ca Mg Na K Cation Total Cl SO4 CaCO3 CO3 Anion Total
mg/L 473 558 4695 221 9350 1076 108 0me/L 23.60 45.90 204.23 5.65 279.39 263.76 22.41 2.16 0.00 288.34% 8.45 16.43 73.10 2.02 100.00 91.48 7.77 0.75 0.00 100.00
Error % = -1.58
Note: Alkalinity is expressed as CaCO3, and milliequivalents per liter were computed with a conversion multipier of 0.02.
Table 8. Ionic Balance Analysis

28
Formation Testing Results Floridan Aquifer Test Well Program, South Bay
Sulfa
te (S
0 4) +
Chl
orid
e (C
l- )
20 40 60 80
20
80
60
40
80
20
60
40
80
60
4
0
20
Calcium
(Ca
) + Ma
gnesium (M
g)
80
60
40
20
80 60 40 20
20 40 60 80
80
20
60
40
Ca 80 60 40 20 Na+K HC03+C03 20 40 60 80 Cl+N03
Car
bona
te (C
0 3)+
Bic
arb
ona
te (H
C0 3
)
Sodium (N
a)+Potassium
(K)
CATIONS ANIONS
Calcium (Ca) Chloride (Cl-)
Sulfate (S0
4 )
Ma
gnes
ium
(Mg)
%me/L
Geochemical Interpretation of Water from Pumping Testsat South Bay, Florida
April and May, 1997
Transitional Connate Water (TCW) Connate Water (CW)Lateral Intrusion or Salt WaterFresh Water or Marine Water Freshwater Type II (FW2)Freshwater Type I (FW1)Transitional Water (TW)
PBF-7U PBF-7L
PBF-7L
PBF-7U
PBF-7L
PBF-7U
Figure 9. Trilinear Diagram of PBF-7 Upper and Lower Zones

Floridan Aquifer Test Well Program, South Bay Formation Testing Results
29
Equivalent Freshwater Head Correction
The raw water levels recorded at the wellhead were converted to equivalentfreshwater heads using the Ghyben-Herzberg method. To perform the correction, thespecific gravity of the water collected from each of the monitor zones was computed, theresults of which are presented in Table 9.
Table 9. Specific Gravity Calculation for Water from Well PB-7
Monitoring Total Dissolved Solids Specific Gravity
Zone Concentration (mg/L) (g/cm3)
PB-7 Upper 3,210 1.002
PB-7 Lower 15,900 1.009
Figure 10. Hydrograph of PBF-7 Upper and Lower Aones with Associated BarometricPressure
30
40
50
60
Oct-97
Dec-97
Feb-9
8
Apr-9
8
Jun-9
8
Aug-9
8
Oct-98
Dec-98
Feb-9
9
Apr-9
9
Jun-9
9
Aug-9
9
Oct-99
Dec-99
Po
ten
tio
met
ric
Su
rfac
e (f
eet
abo
ve N
GV
D)
700
750
800
850
900
950
1,000
PBF-7U PBF-7L Barometric Pressure

30
Formation Testing Results Floridan Aquifer Test Well Program, South Bay
A freshwater equivalent hydrograph for both the upper and lower Floridan zones isshown in Figure 11. The average water levels (converted to equivalent freshwater head)over the period of record for the upper and lower zones in PBF-7 were 59.2 and 60.8,respectively. The groundwater gradient between the upper and lower Floridan aquifers ison average, 1.6 feet in an upward direction. This upward gradient is consistent withobservations of head differences in the FAS documented elsewhere in the literature for St.Lucie County (Lukasiewicz, 1992) and the Orlando area (Tibbals, 1991).
The minimum and maximum equivalent fresh water heads recorded for the period ofrecord in the upper Floridan aquifer were 54.6 (March 1998) and 61.1 (February 1999)feet NGVD, respectively. This is a 6.5-foot difference between the recorded highs andlows. The minimum and maximum equivalent fresh water heads for the lower Floridanwere 58.3 (April 1999) and 61.8 feet (February 1999) NGVD, respectively, equating to a3.5-foot differential.
Figure 11. Freshwater Equivalent Head Hydrograph
50.00
52.00
54.00
56.00
58.00
60.00
62.00
64.00
Oct-97
Dec-97
Feb-9
8
Apr-98
Jun-9
8
Aug-98
Oct-98
Dec-98
Feb-9
9
Apr-99
Jun-9
9
Aug-99
Oct-99
Dec-99
Hea
d (
feet
ab
ove
NG
VD
)
PBF-7U PBF-7L

Floridan Aquifer Test Well Program, South Bay Conclusions
31
CONCLUSIONS
Two exploratory wells were constructed near the City of South Bay as part of aprogram to obtain hydrogeologic and water quality data from the FAS within the District’sLower East Coast planning area. Hydrogeologic information was obtained to a depth of2,500 feet bls from the wells. The main findings of the construction and testing programare summarized in the paragraphs below:
Surficial sediments extended from land surface to a depth of 208 feet bls and theclay-rich Hawthorn Group (Upper Confining Unit) was found to extend to approximately790 feet bls.
The Ocala Limestone, comprising the uppermost FAS, was identified at a depth ofapproximately 900 feet (bls) based on lithologic and hydrogeologic observations. Theuppermost 300 feet of the FAS exhibited a relatively low hydraulic conductivity(approximately 8 ft/day). Water sampled from that interval was slightly more saline thanimmediately underlying zones.
One “upper” producing zone was identified in the upper FAS between 1,202 and1,447 feet bls. This zone exhibited a transmissivity of 71,000 gpd/ft and a hydraulicconductivity of approximately 38 ft/day. The chloride concentration of water collectedfrom that zone was approximately 1,400 mg/L. A dolomite-rich “lower” producing zonewas identified at 1,956 feet bls. This is probably the top of the Oldsmar Formation.Secondary solutioning and fractures cause this interval to exhibit a relatively hightransmissivity – approximately 504,000 gpd/ft. However, water collected from this zonecontained a chloride concentration of 9,350 mg/L.
The base of the USDW was identified by geophysical logs and water quality analysisfrom packer tests to occur at approximately 1,900 feet bls at the site. The potentiometricsurfaces of the upper and middle FAS producing zones were approximately 56 and 43 feetabove the NGVD (unadjusted for density), respectively, during the period from October1997 to December 1999. Water levels fluctuated an average of 1 to 4 feet in upper andlower zones over a period of nearly two years. When adjusted for density, the groundwatergradient between the upper and middle FAS producing zones is upward.

32
Conclusions Floridan Aquifer Test Well Program, South Bay

Floridan Aquifer Test Well Program, South Bay References
REFERENCES
Fetter, C.W. 1988. Applied Hydrogeology. Merrill Publishing Company, Columbus, OH.
Frazee, J.M. Jr. 1982. Geochemical Pattern Analysis: Method of Describing theSoutheastern Limestone Regional Aquifer System. Technical Memorandum, SaintJohns River Water Management District.
Geraghty and Miller. 1991. Construction and Testing of Injection Well No. 1 withAssociated Deep Monitor Well. Consultant’s Report, City of Belle Glade WastewaterTreatment Plant.
Lukasiewicz, J. 1992. A Three-Dimensional Finite Difference Ground Water Flow Modelof the Floridan Aquifer System in Martin, St. Lucie, and Eastern OkeechobeeCounties, Florida. Technical Publication 92-03, South Florida Water ManagementDistrict, West Palm Beach, FL.
Peacock, R. 1983. The Post Eocene Stratigraphy of Southern Collier County, Florida.Technical Publication 83-5, South Florida Water Management District, West PalmBeach, FL.
Piper, Arthur M. 1953. A Graphic Procedure in the Geochemical Interpretation of WaterAnalysis. Ground Water Notes Geochemistry No. 12, United States Geological Survey,Tallahassee, FL.
Powers, J.A. and M.B. McNeal. 1999. Florida Carbonate “Formations” and ConflictingInterpretations of Injection Well Regulations. Proceedings from the AnnualConference of the Florida Section of the American Water Works Association.
Reese, R.S. 1994. Hydrogeology and the Distribution of Salinity in the Floridan AquiferSystem, Southeastern Florida. Water Resources Investigation Report 94-4010, UnitedStates Geological Survey, Tallahassee, FL.
Reese, R.S. and S.J. Memberg. 2000. Hydrogeology and the Distribution of Salinity in theFloridan Aquifer System, Palm Beach County, Florida. Water Resources InvestigationReport 99-4061, United States Geological Survey, Tallahassee, FL.
Reese, R.S. 2000. Hydrogeology and the Distribution of Salinity in the Floridan AquiferSystem, Southwestern Florida. Water Resources Investigation Report 98-4253, UnitedStates Geological Survey, Tallahassee, FL.
Scott, T.M. 1988. The Lithostratigraphy of the Hawthorn Group (Miocene) of Florida.Bulletin 59, Florida Geological Survey, Tallahassee, FL.
Tibbals, C.H. 1981. Computer Simulation of the Steady-State Flow System of the Tertiary(Floridan) Limestone Aquifer System in East-Central Florida. Water ResourcesInvestigation Report 81-681, United States Geological Survey, Tallahassee, FL.
Tibbals, C.H. 1991. Hydrology of the Floridan Aquifer System in East-Central Florida.Professional Paper 1403-E, United States Geological Survey, Tallahassee, FL.
USACE and SFWMD. 1999. Central and Southern Florida Project ComprehensiveReview Study, Final Integrated Feasibility Report and Programmatic EnvironmentalImpact Statement. United States Army Corps of Engineers, Jacksonville District,
33

References Floridan Aquifer Test Well Program, South Bay
Jacksonville, FL, and the South Florida Water Management District, West PalmBeach, FL.
Walton, W.W. 1960. Leaky Artesian Aquifer Conditions in Illinois. Report ofInvestigations No. 39, Illinois State Water Survey.
34

Floridan Aquifer Test Well Program, South Bay Appendix A
APPENDIX A
LITHOLOGIC DESCRIPTION FOR WELL PBF-7
The detailed Florida Geological Survey (FGS) lithologic description for WellPBF-7 (FGS Well No. W-17542) is available in the FGS geologic database and is providedin this appendix.
LITHOLOGIC WELL LOG PRINTOUT SOURCE - FGS
WELL NUMBER: W-17542 COUNTY - PALM BEACH
TOTAL DEPTH: 2504 FT. LOCATION: T.44S R.36E S. 1
SAMPLES - NONE LAT = 26D 41M 58S
LON = 80D 42M 57S
COMPLETION DATE: 10/01/97 ELEVATION: 10 FT
OTHER TYPES OF LOGS AVAILABLE - NONE
OWNER/DRILLER:099-64
WORKED BY:STEPHEN PALMES
WELL NAME- PBF-7
0. - 20.8 121PCPC PLIOCENE-PLEISTOCENE
208. - 94.0 122HTRN HAWTHORN GROUP
940. - 98.0 124OCAL OCALA GROUP
980. - . 124AVPK AVON PARK FM.
0. - .7 000NOSM NO SAMPLES
273. - 28.0 000NOSM NO SAMPLES
525. - 53.5 000NOSM NO SAMPLES
930. - 94.0 000NOSM NO SAMPLES
111.6 - 112.4 000NOSM NO SAMPLES
241.5 - 243.5 000NOSM NO SAMPLES
0 - 7 NO SAMPLES
7 - 10 SHELL BED; YELLOWISH GRAY TO DARK GRAY
30% POROSITY: INTERGRANULAR, POSSIBLY HIGH PERMEABILITY
POOR INDURATION
CEMENT TYPE(S): CALCILUTITE MATRIX
ACCESSORY MINERALS: ORGANICS-20%, CALCILUTITE-15%
OTHER FEATURES: FOSSILIFEROUS
FOSSILS: MOLLUSKS
GASTROPODS COMMON
A-1

Appendix A Floridan Aquifer Test Well Program, South Bay
10 - 20 PACKSTONE; YELLOWISH GRAY TO MODERATE DARK GRAY
30% POROSITY: INTERGRANULAR, POSSIBLY HIGH PERMEABILITY
GRAIN TYPE: CALCILUTITE, SKELETAL
30% ALLOCHEMICAL CONSTITUENTS
GRAIN SIZE: VERY FINE; RANGE: MICROCRYSTALLINE TO COARSE
POOR INDURATION
CEMENT TYPE(S): CALCILUTITE MATRIX
ACCESSORY MINERALS: ORGANICS-05%
OTHER FEATURES: FOSSILIFEROUS
FOSSILS: MOLLUSKS
GASTROPODS COMMON
20 - 33 PACKSTONE; YELLOWISH GRAY
25% POROSITY: INTERGRANULAR, INTRAGRANULAR
GRAIN TYPE: SKELETAL, CALCILUTITE
35% ALLOCHEMICAL CONSTITUENTS
GRAIN SIZE: VERY FINE; RANGE: MICROCRYSTALLINE TO MEDIUM
POOR INDURATION
CEMENT TYPE(S): CALCILUTITE MATRIX
OTHER FEATURES: FOSSILIFEROUS
FOSSILS: MOLLUSKS
GASTROPODS COMMON
33 - 40 SHELL BED; YELLOWISH GRAY
30% POROSITY: INTERGRANULAR, POSSIBLY HIGH PERMEABILITY
UNCONSOLIDATED
ACCESSORY MINERALS: CALCILUTITE-25%, ORGANICS-02%
OTHER FEATURES: FOSSILIFEROUS
FOSSILS: MOLLUSKS
GASTROPODS COMMON
40 - 50 SHELL BED; VERY LIGHT ORANGE TO MODERATE LIGHT GRAY
30% POROSITY: INTERGRANULAR, POSSIBLY HIGH PERMEABILITY
UNCONSOLIDATED
ACCESSORY MINERALS: CALCILUTITE-10%
OTHER FEATURES: FOSSILIFEROUS
FOSSILS: MOLLUSKS
GASTROPODS COMMON; FOSSIL SHELLS BROKEN AND ABRADED
50 - 94 SHELL BED; LIGHT OLIVE GRAY TO LIGHT GRAY
30% POROSITY: INTERGRANULAR, POSSIBLY HIGH PERMEABILITY
UNCONSOLIDATED
ACCESSORY MINERALS: SPAR-02%, CALCILUTITE-05%
FOSSILS: MOLLUSKS, BRYOZOA
GASTROPODS COMMON; FOSSIL SHELLS BROKEN
A-2

Floridan Aquifer Test Well Program, South Bay Appendix A
94 - 100 SHELL BED; LIGHT OLIVE GRAY TO LIGHT GRAY
30% POROSITY: INTERGRANULAR, MOLDIC
POSSIBLY HIGH PERMEABILITY; UNCONSOLIDATED
ACCESSORY MINERALS: QUARTZ SAND-02%, CALCILUTITE-05%
FOSSILS: MOLLUSKS, BRYOZOA
15% OF INTETVALIS A WELL-INDURATED SANDSTONE
100 - 123 SHELL BED; LIGHT OLIVE GRAY TO LIGHT GRAY
30% POROSITY: INTERGRANULAR, POSSIBLY HIGH PERMEABILITY
INTRAGRANULAR; UNCONSOLIDATED
ACCESSORY MINERALS: CALCILUTITE-10%, QUARTZ SAND-04%
PHOSPHATIC SAND-01%
FOSSILS: MOLLUSKS
SOME ALLOCHEMS ARE RECRYSTALLIZED.
123 - 130 WACKESTONE; LIGHT OLIVE GRAY
20% POROSITY: INTERGRANULAR
GRAIN TYPE: SKELETAL, CRYSTALS, CALCILUTITE
30% ALLOCHEMICAL CONSTITUENTS
GRAIN SIZE: FINE; RANGE: VERY FINE TO VERY COARSE
POOR INDURATION
CEMENT TYPE(S): CALCILUTITE MATRIX
ACCESSORY MINERALS: PHOSPHATIC SAND-02%, QUARTZ SAND-05%
SPAR-03%
OTHER FEATURES: LOW RECRYSTALLIZATION
FOSSILS: MOLLUSKS
GASTROPODS PRESENT
130 - 160 WACKESTONE; VERY LIGHT GRAY TO LIGHT GRAY
20% POROSITY: INTERGRANULAR
GRAIN TYPE: SKELETAL, CRYSTALS
40% ALLOCHEMICAL CONSTITUENTS
GRAIN SIZE: FINE; RANGE: VERY FINE TO MEDIUM
POOR INDURATION
CEMENT TYPE(S): CALCILUTITE MATRIX
ACCESSORY MINERALS: SPAR-07%, PHOSPHATIC SAND-03%
QUARTZ SAND-%
OTHER FEATURES: MEDIUM RECRYSTALLIZATION
FOSSILS: FOSSIL MOLDS, MOLLUSKS
A-3

Appendix A Floridan Aquifer Test Well Program, South Bay
160 - 186 PACKSTONE; VERY LIGHT ORANGE TO GRAYISH ORANGE
20% POROSITY: INTERGRANULAR, INTRAGRANULAR
INTERCRYSTALLINE
GRAIN TYPE: SKELETAL, CRYSTALS
70% ALLOCHEMICAL CONSTITUENTS
GRAIN SIZE: MEDIUM; RANGE: FINE TO COARSE;POOR INDURATION
CEMENT TYPE(S): CALCILUTITE MATRIX
ACCESSORY MINERALS: PHOSPHATIC SAND-01%
OTHER FEATURES: DOLOMITIC
FOSSILS: FOSSIL FRAGMENTS, MOLLUSKS, BRYOZOA
DOLOMITE CONTENT IS COMPLETELY RECRYSTALLIZED.
186 - 208 PACKSTONE; LIGHT OLIVE GRAY
20% POROSITY: INTERGRANULAR, INTERCRYSTALLINE
GRAIN TYPE: SKELETAL, CRYSTALS
60% ALLOCHEMICAL CONSTITUENTS
GRAIN SIZE:MEDIUM;RANGE:FINE TO COARSE; POOR INDURATION
CEMENT TYPE(S): CALCILUTITE MATRIX
ACCESSORY MINERALS: PHOSPHATIC SAND-02%
OTHER FEATURES: DOLOMITIC
FOSSILS: FOSSIL FRAGMENTS, MOLLUSKS
208 - 242 CLAY; LIGHT OLIVE GRAY
POOR INDURATION
CEMENT TYPE(S): CLAY MATRIX
ACCESSORY MINERALS: QUARTZ SAND-02%
OTHER FEATURES: CALCAREOUS
FOSSILS: FOSSIL FRAGMENTS, MOLLUSKS
GASTROPODS PRESENT; PHOSPHATIC SILT PRESENT
242 - 260 CLAY; LIGHT OLIVE
POOR INDURATION
CEMENT TYPE(S): CLAY MATRIX
ACCESSORY MINERALS: LIMESTONE-05%, QUARTZ SAND-%
OTHER FEATURES: CALCAREOUS
FOSSILS: FOSSIL FRAGMENTS, MOLLUSKS
PHOSPHATIC SILT PRESENT
260 - 273 CLAY; YELLOWISH GRAY
POOR INDURATION
CEMENT TYPE(S): CLAY MATRIX, CALCILUTITE MATRIX
ACCESSORY MINERALS: LIMESTONE-10%
OTHER FEATURES: CALCAREOUS
FOSSILS: FOSSIL FRAGMENTS, MOLLUSKS
PHOSPHATIC SILT PRESENT
273 - 280 NO SAMPLES
A-4

Floridan Aquifer Test Well Program, South Bay Appendix A
280 - 306 CLAY; YELLOWISH GRAY
POOR INDURATION
CEMENT TYPE(S): CLAY MATRIX, CALCILUTITE MATRIX
ACCESSORY MINERALS: SHELL-15%, QUARTZ SAND-02%
OTHER FEATURES: CALCAREOUS
FOSSILS: FOSSIL FRAGMENTS, MOLLUSKS
GASTROPODS PRESENT; PHOSPHATIC SILT PRESENT
306 - 338 PACKSTONE; YELLOWISH GRAY
20% POROSITY: INTERGRANULAR, INTRAGRANULAR
GRAIN TYPE: CRYSTALS, SKELETAL
40% ALLOCHEMICAL CONSTITUENTS
GRAIN SIZE:MEDIUM; RANGE: FINE TO COARSE; POOR INDURATION
CEMENT TYPE(S): CLAY MATRIX, CALCILUTITE MATRIX
ACCESSORY MINERALS: CLAY-05%, QUARTZ SAND-03%
PHOSPHATIC SAND-02%
OTHER FEATURES: LOW RECRYSTALLIZATION
FOSSILS: FOSSIL FRAGMENTS, BARNACLES, FOSSIL MOLDS
MOLLUSKS
GASTROPODS PRESENT
338 - 368 CLAY; LIGHT OLIVE GRAY TO YELLOWISH GRAY
POOR INDURATION
CEMENT TYPE(S): CLAY MATRIX
ACCESSORY MINERALS: SPAR-03%, PHOSPHATIC SAND-02%
SHELL-10%, QUARTZ SAND-%
OTHER FEATURES: CALCAREOUS
FOSSILS: FOSSIL FRAGMENTS, MOLLUSKS
GASTROPODS PRESENT
368 - 400 CLAY; LIGHT OLIVE GRAY TO GRAYISH GREEN
POOR INDURATION
CEMENT TYPE(S): CLAY MATRIX, CALCILUTITE MATRIX
ACCESSORY MINERALS: QUARTZ SAND-05%, SHELL-03%, SPAR-07%
PHOSPHATIC SAND-01%
OTHER FEATURES: CALCAREOUS
FOSSILS: FOSSIL FRAGMENTS, MOLLUSKS
400 - 462 CLAY; LIGHT OLIVE GRAY
POOR INDURATION
CEMENT TYPE(S): CLAY MATRIX
ACCESSORY MINERALS: QUARTZ SAND-02%, PHOSPHATIC SAND-%
MICA-%
OTHER FEATURES: CALCAREOUS
FOSSILS: FOSSIL FRAGMENTS, MOLLUSKS, BRYOZOA
GASTROPODS PRESENT
A-5

Appendix A Floridan Aquifer Test Well Program, South Bay
462 - 525 CLAY; YELLOWISH GRAY
POOR INDURATION
CEMENT TYPE(S): CLAY MATRIX
ACCESSORY MINERALS: SPAR-03%, QUARTZ SAND-%
OTHER FEATURES: CALCAREOUS
FOSSILS: FOSSIL FRAGMENTS
525 - 535 NO SAMPLES
535 - 566 CLAY; YELLOWISH GRAY
POOR INDURATION
CEMENT TYPE(S): CLAY MATRIX
ACCESSORY MINERALS: SPAR-07%, QUARTZ SAND-%
DOLOMITE-03%, LIMESTONE-15%
OTHER FEATURES: CALCAREOUS
FOSSILS: MOLLUSKS, FOSSIL FRAGMENTS
566 - 587 CLAY; LIGHT OLIVE GRAY TO YELLOWISH GRAY
POOR INDURATION
CEMENT TYPE(S): CLAY MATRIX
ACCESSORY MINERALS: SPAR-08%, PHOSPHATIC SAND-02%
QUARTZ SAND-%
OTHER FEATURES: CALCAREOUS
FOSSILS: MOLLUSKS, FOSSIL FRAGMENTS
GASTROPODS PRESENT
587 - 629 WACKESTONE; LIGHT OLIVE GRAY
GRAIN TYPE: CALCILUTITE, CRYSTALS, SKELETAL
20% ALLOCHEMICAL CONSTITUENTS
GRAIN SIZE: VERY FINE; RANGE: MICROCRYSTALLINE TO MEDIUM
POOR INDURATION
CEMENT TYPE(S): CALCILUTITE MATRIX
ACCESSORY MINERALS: CLAY-05%, SPAR-04%
PHOSPHATIC SAND-01%
FOSSILS: SHARKS TEETH, MOLLUSKS, FOSSIL FRAGMENTS
629 - 650 MUDSTONE; YELLOWISH GRAY TO LIGHT OLIVE
GRAIN TYPE: CALCILUTITE, CRYSTALS, SKELETAL
10% ALLOCHEMICAL CONSTITUENTS
GRAIN SIZE: VERY FINE; RANGE: MICROCRYSTALLINE TO MEDIUM
POOR INDURATION
CEMENT TYPE(S): CALCILUTITE MATRIX
ACCESSORY MINERALS: PHOSPHATIC SAND-05%, QUARTZ SAND-02%
SPAR-05%
PHOSPHATIC FOSSIL MOLDS
A-6

Floridan Aquifer Test Well Program, South Bay Appendix A
650 - 660 WACKESTONE; LIGHT GRAYISH GREEN
25% POROSITY: INTERGRANULAR, INTRAGRANULAR
GRAIN TYPE: CALCILUTITE, CRYSTALS, SKELETAL
25% ALLOCHEMICAL CONSTITUENTS
GRAIN SIZE: VERY FINE; RANGE: MICROCRYSTALLINE TO MEDIUM
POOR INDURATION
CEMENT TYPE(S): CALCILUTITE MATRIX
ACCESSORY MINERALS: SPAR-03%, PHOSPHATIC GRAVEL-02%
PHOSPHATIC SAND-02%
FOSSILS: CORAL, MOLLUSKS
GASTROPODS PRESENT
660 - 775 WACKESTONE; YELLOWISH GRAY
25% POROSITY: INTERGRANULAR, INTRAGRANULAR
GRAIN TYPE: CALCILUTITE, CRYSTALS, SKELETAL
20% ALLOCHEMICAL CONSTITUENTS
GRAIN SIZE: FINE; RANGE: MICROCRYSTALLINE TO MEDIUM
POOR INDURATION
CEMENT TYPE(S): CALCILUTITE MATRIX
ACCESSORY MINERALS: SPAR-<5%, PHOSPHATIC SAND-%
OTHER FEATURES: CHALKY
FOSSILS: MOLLUSKS, FOSSIL MOLDS
775 - 826 WACKESTONE; YELLOWISH GRAY
25% POROSITY: INTERGRANULAR, INTRAGRANULAR
GRAIN TYPE: CALCILUTITE, CRYSTALS
20% ALLOCHEMICAL CONSTITUENTS
GRAIN SIZE: FINE; RANGE: VERY FINE TO MEDIUM
POOR INDURATION
CEMENT TYPE(S): CALCILUTITE MATRIX
ACCESSORY MINERALS: SPAR-03%, PHOSPHATIC SAND-%
FOSSILS: BRYOZOA, MOLLUSKS
30% OF SAMPLE IS A WELL-INDURATED LIMESTONE
826 - 848 PACKSTONE; YELLOWISH GRAY
25% POROSITY: INTERGRANULAR, MOLDIC
GRAIN TYPE: CRYSTALS, SKELETAL, SKELTAL CAST
60% ALLOCHEMICAL CONSTITUENTS
GRAIN SIZE: MEDIUM; RANGE: FINE TO VERY COARSE
MODERATE INDURATION
CEMENT TYPE(S): CALCILUTITE MATRIX, SPARRY CALCITE CEMENT
ACCESSORY MINERALS: PHOSPHATIC SAND-02%
FOSSILS: FOSSIL MOLDS
A-7

Appendix A Floridan Aquifer Test Well Program, South Bay
848 - 899 PACKSTONE; YELLOWISH GRAY
25% POROSITY: INTERGRANULAR, INTRAGRANULAR
GRAIN TYPE: CRYSTALS, SKELETAL
80% ALLOCHEMICAL CONSTITUENTS
GRAIN SIZE: FINE; RANGE: FINE TO VERY COARSE
POOR INDURATION
CEMENT TYPE(S): CALCILUTITE MATRIX
ACCESSORY MINERALS: CLAY-03%
OTHER FEATURES: LOW RECRYSTALLIZATION
FOSSILS: MOLLUSKS, FOSSIL FRAGMENTS
RECRYSTALLIZED CARBONATE SAND PRESENT; PHOSPHATIC SILT
PRESENT
899 - 930 WACKESTONE; YELLOWISH GRAY
20% POROSITY: INTERGRANULAR, INTRAGRANULAR
GRAIN TYPE: CRYSTALS, SKELETAL, CALCILUTITE
20% ALLOCHEMICAL CONSTITUENTS
GRAIN SIZE: FINE; RANGE: VERY FINE TO MEDIUM
POOR INDURATION
CEMENT TYPE(S): CALCILUTITE MATRIX
ACCESSORY MINERALS: SPAR-02%
930 - 940 NO SAMPLES
940 - 980 PACKSTONE; VERY LIGHT ORANGE
20% POROSITY: INTERGRANULAR, INTRAGRANULAR
GRAIN TYPE: CRYSTALS, SKELETAL
60% ALLOCHEMICAL CONSTITUENTS
GRAIN SIZE: MEDIUM; RANGE: FINE TO MEDIUM
MODERATE INDURATION
CEMENT TYPE(S): CALCILUTITE MATRIX
OTHER FEATURES: CHALKY
FOSSILS: BENTHIC FORAMINIFERA, FOSSIL MOLDS
NUMMULITES SP PRESENT
980 - 1030 WACKESTONE; VERY LIGHT ORANGE
25% POROSITY: INTERGRANULAR, INTRAGRANULAR
GRAIN TYPE: SKELETAL, CALCILUTITE, CRYSTALS
40% ALLOCHEMICAL CONSTITUENTS
GRAIN SIZE: FINE; RANGE: VERY FINE TO MEDIUM
POOR INDURATION
CEMENT TYPE(S): CALCILUTITE MATRIX
ACCESSORY MINERALS: SPAR-05%
OTHER FEATURES: CHALKY
FOSSILS: BENTHIC FORAMINIFERA, FOSSIL MOLDS, ECHINOID
DICTYOCONUS AMERICANUS PRESENT;UP TO 40% OF INTERVAL IS A
PACKSTONE ECHINOID SPINES PRESENT
A-8

Floridan Aquifer Test Well Program, South Bay Appendix A
1030 - 1054 PACKSTONE; VERY LIGHT ORANGE
25% POROSITY: INTERGRANULAR, INTRAGRANULAR
GRAIN TYPE: SKELETAL, BIOGENIC
65% ALLOCHEMICAL CONSTITUENTS
GRAIN SIZE:MEDIUM;RANGE:FINE TO COARSE; POOR INDURATION
CEMENT TYPE(S): CALCILUTITE MATRIX
ACCESSORY MINERALS: SPAR-03%
OTHER FEATURES: CHALKY
FOSSILS: FOSSIL MOLDS, BENTHIC FORAMINIFERA, ECHINOID
DICTYOCONUS AMERICANUS PRESENT
1054 - 1070 PACKSTONE; VERY LIGHT ORANGE
25% POROSITY: INTERGRANULAR, INTRAGRANULAR
GRAIN TYPE: SKELETAL, BIOGENIC
80% ALLOCHEMICAL CONSTITUENTS
GRAIN SIZE: COARSE; RANGE: FINE TO COARSE
MODERATE INDURATION
CEMENT TYPE(S): CALCILUTITE MATRIX
ACCESSORY MINERALS: SPAR-02%
FOSSILS: FOSSIL MOLDS, BENTHIC FORAMINIFERA, ECHINOID
DICTYOCONUS AMERICANUS PRESENT; 5% ACCESSORY DOLOMITE
OCCURS FROM 1060 - 1065 FEET
1070 - 1116 PACKSTONE; VERY LIGHT ORANGE
25% POROSITY: INTERGRANULAR, INTRAGRANULAR
GRAIN TYPE: SKELETAL, CALCILUTITE, BIOGENIC
60% ALLOCHEMICAL CONSTITUENTS
GRAIN SIZE: COARSE; RANGE: FINE TO COARSE
MODERATE INDURATION
CEMENT TYPE(S): CALCILUTITE MATRIX
FOSSILS: BENTHIC FORAMINIFERA, FOSSIL MOLDS, ECHINOID
DICTYOCONUS AMERICANUS PRESENT
1116 - 1124 NO SAMPLES
1124 - 1173 PACKSTONE; VERY LIGHT ORANGE
20% POROSITY: INTERGRANULAR, INTRAGRANULAR
GRAIN TYPE: SKELETAL, BIOGENIC
70% ALLOCHEMICAL CONSTITUENTS
GRAIN SIZE:MEDIUM; RANGE: FINE TO COARSE; GOOD INDURATION
CEMENT TYPE(S): SPARRY CALCITE CEMENT, CALCILUTITE MATRIX
ACCESSORY MINERALS: DOLOMITE-02%
FOSSILS: BENTHIC FORAMINIFERA, ECHINOID, FOSSIL MOLDS
DICTYOCONUS AMERICANUS PRESENT
A-9

Appendix A Floridan Aquifer Test Well Program, South Bay
1173 - 1185 PACKSTONE; VERY LIGHT ORANGE TO LIGHT GRAY
20% POROSITY: INTERGRANULAR, INTRAGRANULAR
GRAIN TYPE: SKELETAL, BIOGENIC
80% ALLOCHEMICAL CONSTITUENTS
GRAIN SIZE: COARSE; RANGE: FINE TO VERY COARSE
GOOD INDURATION
CEMENT TYPE(S): SPARRY CALCITE CEMENT, CALCILUTITE MATRIX
ACCESSORY MINERALS: SPAR-03%, DOLOMITE-05%
FOSSILS: BENTHIC FORAMINIFERA, FOSSIL MOLDS, ECHINOID
MOLLUSKS
1185 - 1201 PACKSTONE; GRAYISH ORANGE
20% POROSITY: INTERGRANULAR, MOLDIC, INTRAGRANULAR
GRAIN TYPE: SKELETAL, BIOGENIC
70% ALLOCHEMICAL CONSTITUENTS
GRAIN SIZE:MEDIUM; RANGE:FINE TO COARSE; GOOD INDURATION
CEMENT TYPE(S): SPARRY CALCITE CEMENT, CALCILUTITE MATRIX
ACCESSORY MINERALS: DOLOMITE-05%, SPAR-05%
OTHER FEATURES: LOW RECRYSTALLIZATION
FOSSILS: ECHINOID, BENTHIC FORAMINIFERA, FOSSIL MOLDS
MOLLUSKS
1201 - 1205 GRAINSTONE; GRAYISH ORANGE
25% POROSITY: INTERGRANULAR, INTRAGRANULAR
GRAIN TYPE: SKELETAL, BIOGENIC
90% ALLOCHEMICAL CONSTITUENTS
GRAIN SIZE:COARSE; RANGE: FINE TO COARSE; GOOD INDURATION
CEMENT TYPE(S): SPARRY CALCITE CEMENT, CALCILUTITE MATRIX
ACCESSORY MINERALS: DOLOMITE-05%
OTHER FEATURES: LOW RECRYSTALLIZATION
FOSSILS: BENTHIC FORAMINIFERA, ECHINOID
1205 - 1233 PACKSTONE; GRAYISH ORANGE
20% POROSITY: INTERGRANULAR, INTRAGRANULAR
GRAIN TYPE: SKELETAL, BIOGENIC
60% ALLOCHEMICAL CONSTITUENTS
GRAIN SIZE:MEDIUM; RANGE: FINE TO COARSE; GOOD INDURATION
CEMENT TYPE(S): SPARRY CALCITE CEMENT, CALCILUTITE MATRIX
ACCESSORY MINERALS: DOLOMITE-15%
OTHER FEATURES: LOW RECRYSTALLIZATION
FOSSILS: BENTHIC FORAMINIFERA, ECHINOID
LITUONELLA FLORIDANA PRESENT; D. AMERICANUS PRESENT
A-10

Floridan Aquifer Test Well Program, South Bay Appendix A
1233 - 1265 PACKSTONE; GRAYISH ORANGE TO LIGHT GRAY
20% POROSITY: INTERGRANULAR, INTRAGRANULAR, VUGULAR
GRAIN TYPE: SKELETAL, BIOGENIC
75% ALLOCHEMICAL CONSTITUENTS
GRAIN SIZE:MEDIUM; RANGE: FINE TO COARSE; GOOD INDURATION
CEMENT TYPE(S): SPARRY CALCITE CEMENT, CALCILUTITE MATRIX
OTHER FEATURES: DOLOMITIC, LOW RECRYSTALLIZATION
FOSSILS: BENTHIC FORAMINIFERA, ECHINOID
DOLOMITE CONTENT RANGES FROM 0-20%. UP TO 20% OF INTERVAL
IS A GRAINSTONE
1265 - 1285 GRAINSTONE; GRAYISH ORANGE TO LIGHT GRAY
20% POROSITY: INTERGRANULAR, VUGULAR
GRAIN TYPE: SKELETAL, BIOGENIC
90% ALLOCHEMICAL CONSTITUENTS
GRAIN SIZE:MEDIUM; RANGE: FINE TO COARSE; GOOD INDURATION
CEMENT TYPE(S): SPARRY CALCITE CEMENT, CALCILUTITE MATRIX
FOSSILS: BENTHIC FORAMINIFERA, ECHINOID
DOLOMITE RANGES FROM 5 - 10% OF INTERVAL
1285 - 1300 DOLOSTONE; LIGHT GRAY TO GRAYISH ORANGE
15% POROSITY: INTERGRANULAR, LOW PERMEABILITY
50-90% ALTERED; ANHEDRAL
GRAIN SIZE: VERY FINE; GOOD INDURATION
CEMENT TYPE(S): DOLOMITE CEMENT
ACCESSORY MINERALS: LIMESTONE-20%
ACCESSORY LIMESTONE IS A PACKSTONE
1300 - 1325 PACKSTONE; GRAYISH ORANGE
20% POROSITY: INTERGRANULAR, INTRAGRANULAR, VUGULAR
GRAIN TYPE: SKELETAL, BIOGENIC
75% ALLOCHEMICAL CONSTITUENTS
GRAIN SIZE: MEDIUM; RANGE: FINE TO COARSE
MODERATE INDURATION
CEMENT TYPE(S): SPARRY CALCITE CEMENT, CALCILUTITE MATRIX
OTHER FEATURES: LOW RECRYSTALLIZATION
FOSSILS: BENTHIC FORAMINIFERA, ECHINOID, FOSSIL MOLDS
UP TO 10% DOLOMITE
1325 - 1340 GRAINSTONE; GRAYISH ORANGE
25% POROSITY: INTERGRANULAR, INTRAGRANULAR
GRAIN TYPE: SKELETAL, BIOGENIC
95% ALLOCHEMICAL CONSTITUENTS
GRAIN SIZE:FINE; RANGE: VERY FINE TO MEDIUM
UNCONSOLIDATED
CARBONATE SAND
A-11

Appendix A Floridan Aquifer Test Well Program, South Bay
1340 - 1365 PACKSTONE; GRAYISH ORANGE
20% POROSITY: INTERGRANULAR, MOLDIC, INTRAGRANULAR
GRAIN TYPE: SKELETAL, BIOGENIC
85% ALLOCHEMICAL CONSTITUENTS
GRAIN SIZE:MEDIUM; RANGE: FINE TO COARSE; GOOD INDURATION
CEMENT TYPE(S): SPARRY CALCITE CEMENT
OTHER FEATURES: LOW RECRYSTALLIZATION
FOSSILS:BENTHIC FORAMINIFERA, ECHINOID, FOSSIL MOLDS
D.AMERICANUS PRESENT
1365 - 1425 PACKSTONE; VERY LIGHT ORANGE
20% POROSITY: INTERGRANULAR, MOLDIC, VUGULAR
GRAIN TYPE: SKELETAL, BIOGENIC
75% ALLOCHEMICAL CONSTITUENTS
GRAIN SIZE:MEDIUM; RANGE: FINE TO COARSE; GOOD INDURATION
CEMENT TYPE(S): SPARRY CALCITE CEMENT
OTHER FEATURES: LOW RECRYSTALLIZATION, DOLOMITIC
FOSSILS: BENTHIC FORAMINIFERA, ECHINOID
D. AMERICANUS PRESENT
1425 - 1460 PACKSTONE; VERY LIGHT ORANGE
20% POROSITY: INTERGRANULAR, INTRAGRANULAR
GRAIN TYPE: SKELETAL, BIOGENIC
70% ALLOCHEMICAL CONSTITUENTS
GRAIN SIZE: MEDIUM; RANGE: FINE TO MEDIUM
MODERATE INDURATION
CEMENT TYPE(S): CALCILUTITE MATRIX
ACCESSORY MINERALS: SPAR-03%
FOSSILS: BENTHIC FORAMINIFERA
D. AMERICANUS PRESENT
1460 - 1470 GRAINSTONE; VERY LIGHT ORANGE
25% POROSITY: INTERGRANULAR, INTRAGRANULAR
GRAIN TYPE: SKELETAL, BIOGENIC
90% ALLOCHEMICAL CONSTITUENTS
GRAIN SIZE: MEDIUM; RANGE: VERY FINE TO COARSE
UNCONSOLIDATED
ACCESSORY MINERALS: SPAR-01%
1470 - 1570 PACKSTONE; VERY LIGHT ORANGE
20% POROSITY: INTERGRANULAR, INTRAGRANULAR, MOLDIC
GRAIN TYPE: SKELETAL, BIOGENIC
75% ALLOCHEMICAL CONSTITUENTS
GRAIN SIZE: MEDIUM; RANGE: VERY FINE TO MEDIUM
GOOD INDURATION
CEMENT TYPE(S): SPARRY CALCITE CEMENT
ACCESSORY MINERALS: SPAR-02%
FOSSILS: BENTHIC FORAMINIFERA
D. AMERICANUS PRESENT
A-12

Floridan Aquifer Test Well Program, South Bay Appendix A
1570 - 1590 PACKSTONE; VERY LIGHT ORANGE
20% POROSITY: INTERGRANULAR, INTRAGRANULAR
GRAIN TYPE: SKELETAL, BIOGENIC, CALCILUTITE
55% ALLOCHEMICAL CONSTITUENTS
GRAIN SIZE:MEDIUM; RANGE: FINE TO COARSE; GOOD INDURATION
CEMENT TYPE(S): SPARRY CALCITE CEMENT
ACCESSORY MINERALS: SPAR-01%
FOSSILS: BENTHIC FORAMINIFERA, ECHINOID
1590 - 1653 PACKSTONE; VERY LIGHT ORANGE
25% POROSITY: INTERGRANULAR, INTRAGRANULAR
GRAIN TYPE: SKELETAL, BIOGENIC
80% ALLOCHEMICAL CONSTITUENTS
GRAIN SIZE: MEDIUM; RANGE: FINE TO VERY COARSE
GOOD INDURATION
CEMENT TYPE(S): SPARRY CALCITE CEMENT
ACCESSORY MINERALS: SPAR-05%
FOSSILS: BENTHIC FORAMINIFERA
D. AMERICANUS PRESENT
1653 - 1665 PACKSTONE; VERY LIGHT ORANGE TO LIGHT OLIVE GRAY
20% POROSITY: INTERGRANULAR, INTRAGRANULAR
GRAIN TYPE: CRYSTALS, SKELETAL
65% ALLOCHEMICAL CONSTITUENTS
GRAIN SIZE: MEDIUM; RANGE: FINE TO VERY COARSE
GOOD INDURATION
CEMENT TYPE(S): SPARRY CALCITE CEMENT, DOLOMITE CEMENT
OTHER FEATURES: DOLOMITIC
1665 - 1670 DOLOSTONE; GRAYISH BROWN
15% POROSITY: INTERCRYSTALLINE, VUGULAR; 90-100% ALTERED
EUHEDRAL
GRAIN SIZE: VERY FINE; RANGE: MICROCRYSTALLINE TO FINE
GOOD INDURATION
CEMENT TYPE(S): DOLOMITE CEMENT
1670 - 1675 PACKSTONE; VERY LIGHT ORANGE
20% POROSITY: INTERGRANULAR, INTRAGRANULAR
GRAIN TYPE: SKELETAL, BIOGENIC
60% ALLOCHEMICAL CONSTITUENTS
GRAIN SIZE: FINE; RANGE: VERY FINE TO MEDIUM
GOOD INDURATION
CEMENT TYPE(S): SPARRY CALCITE CEMENT
ACCESSORY MINERALS: DOLOMITE-05%
OTHER FEATURES: LOW RECRYSTALLIZATION
A-13

Appendix A Floridan Aquifer Test Well Program, South Bay
1675 - 1680 GRAINSTONE; VERY LIGHT ORANGE
25% POROSITY: INTERGRANULAR, INTRAGRANULAR
GRAIN TYPE: SKELETAL, CRYSTALS
95% ALLOCHEMICAL CONSTITUENTS
GRAIN SIZE: MEDIUM; RANGE: FINE TO MEDIUM; UNCONSOLIDATED
FOSSILS: BENTHIC FORAMINIFERA
CARBONATE SAND; D. AMERICANUS PRESENT
1680 - 1747 WACKESTONE; YELLOWISH GRAY
20% POROSITY: INTERGRANULAR, INTRAGRANULAR
GRAIN TYPE: SKELETAL, CRYSTALS
80% ALLOCHEMICAL CONSTITUENTS
GRAIN SIZE:MEDIUM; RANGE: FINE TO COARSE; GOOD INDURATION
CEMENT TYPE(S): SPARRY CALCITE CEMENT
OTHER FEATURES: FOSSILIFEROUS
FOSSILS: BENTHIC FORAMINIFERA, FOSSIL MOLDS
D. AMERICANUS PRESENT
1747 - 1770 GRAINSTONE; VERY LIGHT ORANGE
20% POROSITY: INTERGRANULAR, INTRAGRANULAR, MOLDIC
GRAIN TYPE: SKELETAL, CRYSTALS
90% ALLOCHEMICAL CONSTITUENTS
GRAIN SIZE:MEDIUM; RANGE: FINE TO COARSE; GOOD INDURATION
CEMENT TYPE(S): SPARRY CALCITE CEMENT
OTHER FEATURES: FOSSILIFEROUS, LOW RECRYSTALLIZATION
FOSSILS: BENTHIC FORAMINIFERA, FOSSIL MOLDS, ECHINOID
SOME ALLOCHEMS RECRYSTALLIZED; D. AMERICANUS PRESENT
1770 - 1789 PACKSTONE; VERY LIGHT ORANGE
20% POROSITY: INTERGRANULAR, INTRAGRANULAR
GRAIN TYPE: SKELETAL, CRYSTALS
75% ALLOCHEMICAL CONSTITUENTS
GRAIN SIZE:MEDIUM; RANGE: FINE TO MEDIUM; GOOD INDURATION
CEMENT TYPE(S): SPARRY CALCITE CEMENT
SEDIMENTARY STRUCTURES: LAMINATED
OTHER FEATURES: PLATY
FOSSILS: BENTHIC FORAMINIFERA, FOSSIL MOLDS, ECHINOID
D. AMERICANUS PRESENT
1789 - 1794 DRILLERS MUD
A-14

Floridan Aquifer Test Well Program, South Bay Appendix A
1794 - 1810 PACKSTONE; VERY LIGHT ORANGE
20% POROSITY: INTERGRANULAR, INTRAGRANULAR
GRAIN TYPE: CALCILUTITE, SKELETAL
60% ALLOCHEMICAL CONSTITUENTS
GRAIN SIZE: COARSE; RANGE: FINE TO VERY COARSE
MODERATE INDURATION
CEMENT TYPE(S): CALCILUTITE MATRIX
ACCESSORY MINERALS: DOLOMITE-05%, SPAR-02%
OTHER FEATURES: FOSSILIFEROUS
FOSSILS: BENTHIC FORAMINIFERA, ECHINOID
D. AMERICANUS PRESENT; SOME ALLOCHEMS RECRYSTALLIZED
1810 - 1820 PACKSTONE; VERY LIGHT ORANGE
20% POROSITY: INTERGRANULAR, INTRAGRANULAR, MOLDIC
GRAIN TYPE: SKELETAL, CRYSTALS
80% ALLOCHEMICAL CONSTITUENTS
GRAIN SIZE:MEDIUM; RANGE: FINE TO COARSE; GOOD INDURATION
CEMENT TYPE(S): SPARRY CALCITE CEMENT
OTHER FEATURES: MEDIUM RECRYSTALLIZATION
FOSSILS: BENTHIC FORAMINIFERA, FOSSIL MOLDS
D. AMERICANUS PRESENT
1820 - 1851 PACKSTONE; VERY LIGHT ORANGE
20% POROSITY: INTERGRANULAR, INTRAGRANULAR
GRAIN TYPE: SKELETAL, CALCILUTITE
55% ALLOCHEMICAL CONSTITUENTS
GRAIN SIZE: FINE; RANGE: VERY FINE TO MEDIUM
POOR INDURATION
CEMENT TYPE(S): CALCILUTITE MATRIX
OTHER FEATURES: CHALKY, FOSSILIFEROUS
FOSSILS: BENTHIC FORAMINIFERA
SOME ALLOCHEMS RECRYSTALLIZED; D. AMERICANUS PRESENT
1851 - 1856 PACKSTONE; VERY LIGHT ORANGE
20% POROSITY: INTERGRANULAR, INTRAGRANULAR
GRAIN TYPE: SKELETAL, CRYSTALS
80% ALLOCHEMICAL CONSTITUENTS
GRAIN SIZE: MEDIUM; RANGE: FINE TO MEDIUM
MODERATE INDURATION
CEMENT TYPE(S): CALCILUTITE MATRIX
D. AMERICANUS PRESENT
1856 - 1881 GRAINSTONE; VERY LIGHT ORANGE
25% POROSITY: INTERGRANULAR, INTRAGRANULAR
GRAIN TYPE: SKELETAL, CRYSTALS
95% ALLOCHEMICAL CONSTITUENTS
GRAIN SIZE: MEDIUM; RANGE: FINE TO COARSE; UNCONSOLIDATED
FOSSILS: BENTHIC FORAMINIFERA
CARBONATE SAND; D. AMERICANUS PRESENT
A-15

Appendix A Floridan Aquifer Test Well Program, South Bay
1881 - 1913 PACKSTONE; VERY LIGHT ORANGE
20% POROSITY: INTERGRANULAR, INTRAGRANULAR
GRAIN TYPE: SKELETAL, CRYSTALS
75% ALLOCHEMICAL CONSTITUENTS
GRAIN SIZE: MEDIUM; RANGE: FINE TO GRAVEL
MODERATE INDURATION
CEMENT TYPE(S): CALCILUTITE MATRIX
FOSSILS: BENTHIC FORAMINIFERA
D. AMERICANUS PRESENT
1913 - 1923 DOLOSTONE; GRAYISH BROWN
15% POROSITY: INTERCRYSTALLINE; 50-90% ALTERED; EUHEDRAL
GRAIN SIZE: MICROCRYSTALLINE
RANGE: MICROCRYSTALLINE TO VERY FINE; GOOD INDURATION
CEMENT TYPE(S): DOLOMITE CEMENT
FOSSILS: BENTHIC FORAMINIFERA, ECHINOID
20% PACKSTONE
1923 - 1950 PACKSTONE; VERY LIGHT ORANGE
20% POROSITY: INTERGRANULAR
GRAIN TYPE: SKELETAL, CALCILUTITE
55% ALLOCHEMICAL CONSTITUENTS
GRAIN SIZE:MEDIUM; RANGE: FINE TO MEDIUM; POOR INDURATION
CEMENT TYPE(S): CALCILUTITE MATRIX
FOSSILS: BENTHIC FORAMINIFERA
D. AMERICANUS PRESENT
1950 - 1955 DOLOSTONE; GRAYISH BROWN
15% POROSITY: INTERCRYSTALLINE, LOW PERMEABILITY
50-90% ALTERED; ANHEDRAL
GRAIN SIZE: MICROCRYSTALLINE; GOOD INDURATION
CEMENT TYPE(S): DOLOMITE CEMENT
ACCESSORY MINERALS: LIMESTONE-04%
1955 - 1980 DOLOSTONE; DARK YELLOWISH BROWN
15% POROSITY: INTERCRYSTALLINE, LOW PERMEABILITY
90-100% ALTERED; EUHEDRAL
GRAIN SIZE: VERY FINE; GOOD INDURATION
CEMENT TYPE(S): DOLOMITE CEMENT
1980 - 2005 DOLOSTONE; GRAYISH BROWN
10% POROSITY: INTERCRYSTALLINE, LOW PERMEABILITY
90-100% ALTERED; ANHEDRAL
GRAIN SIZE: MICROCRYSTALLINE; GOOD INDURATION
CEMENT TYPE(S): DOLOMITE CEMENT
A-16

Floridan Aquifer Test Well Program, South Bay Appendix A
2005 - 2020 DOLOSTONE; GRAYISH ORANGE TO GRAYISH BROWN
15% POROSITY: INTERCRYSTALLINE, LOW PERMEABILITY
PIN POINT VUGS; 90-100% ALTERED; EUHEDRAL
GRAIN SIZE: FINE; GOOD INDURATION
CEMENT TYPE(S): DOLOMITE CEMENT
2020 - 2097 DOLOSTONE; VERY LIGHT ORANGE
10% POROSITY: INTERCRYSTALLINE, LOW PERMEABILITY
90-100% ALTERED; ANHEDRAL
GRAIN SIZE: MICROCRYSTALLINE; GOOD INDURATION
CEMENT TYPE(S): DOLOMITE CEMENT
2097 - 2115 DOLOSTONE; GRAYISH BROWN TO LIGHT YELLOWISH ORANGE
10% POROSITY: INTERCRYSTALLINE, LOW PERMEABILITY
90-100% ALTERED; SUBHEDRAL
GRAIN SIZE: VERY FINE; GOOD INDURATION
CEMENT TYPE(S): DOLOMITE CEMENT
2115 - 2128 DOLOSTONE; OLIVE GRAY
10% POROSITY: INTERCRYSTALLINE, LOW PERMEABILITY
90-100% ALTERED; EUHEDRAL
GRAIN SIZE: VERY FINE; RANGE: MICROCRYSTALLINE TO MEDIUM
GOOD INDURATION
CEMENT TYPE(S): DOLOMITE CEMENT
2128 - 2175 DOLOSTONE; LIGHT OLIVE GRAY TO YELLOWISH GRAY
10% POROSITY: INTERCRYSTALLINE, LOW PERMEABILITY
90-100% ALTERED; SUBHEDRAL
GRAIN SIZE: VERY FINE; GOOD INDURATION
CEMENT TYPE(S): DOLOMITE CEMENT
2175 - 2185 DOLOSTONE; YELLOWISH GRAY
10% POROSITY: INTERCRYSTALLINE, LOW PERMEABILITY
90-100% ALTERED; ANHEDRAL
GRAIN SIZE: MICROCRYSTALLINE; GOOD INDURATION
CEMENT TYPE(S): DOLOMITE CEMENT
2185 - 2210 PACKSTONE; VERY LIGHT ORANGE TO GRAYISH BROWN
20% POROSITY: INTERGRANULAR, INTRAGRANULAR
GRAIN TYPE: SKELETAL, BIOGENIC
75% ALLOCHEMICAL CONSTITUENTS
GRAIN SIZE:MEDIUM; RANGE: FINE TO COARSE; POOR INDURATION
CEMENT TYPE(S): CALCILUTITE MATRIX
ACCESSORY MINERALS: DOLOMITE-25%
FOSSILS: BENTHIC FORAMINIFERA
ACCESSORY DOLOMITE AS ABOVE
A-17

Appendix A Floridan Aquifer Test Well Program, South Bay
2210 - 2240 DOLOSTONE; DARK YELLOWISH ORANGE
15% POROSITY: INTERCRYSTALLINE, VUGULAR; 90-100% ALTERED
EUHEDRAL
GRAIN SIZE: FINE; RANGE: VERY FINE TO MEDIUM
GOOD INDURATION
CEMENT TYPE(S): DOLOMITE CEMENT
2240 - 2245 PACKSTONE; VERY LIGHT ORANGE TO GRAYISH BROWN
20% POROSITY: INTERGRANULAR, INTRAGRANULAR, MOLDIC
GRAIN TYPE: SKELETAL, CRYSTALS
80% ALLOCHEMICAL CONSTITUENTS
GRAIN SIZE: MEDIUM; RANGE: FINE TO COARSE
MODERATE INDURATION
CEMENT TYPE(S): CALCILUTITE MATRIX
ACCESSORY MINERALS: DOLOMITE-20%
FOSSILS: BENTHIC FORAMINIFERA, FOSSIL MOLDS
2245 - 2260 DOLOSTONE; GRAYISH ORANGE
15% POROSITY: INTERCRYSTALLINE; 90-100% ALTERED; EUHEDRAL
GRAIN SIZE: FINE; RANGE: VERY FINE TO FINE
GOOD INDURATION
CEMENT TYPE(S): DOLOMITE CEMENT
ACCESSORY MINERALS: LIMESTONE-05%
2260 - 2270 GRAINSTONE; VERY LIGHT ORANGE
25% POROSITY: INTERGRANULAR, INTRAGRANULAR
GRAIN TYPE: SKELETAL, CRYSTALS
95% ALLOCHEMICAL CONSTITUENTS
GRAIN SIZE: MEDIUM; RANGE: FINE TO COARSE; UNCONSOLIDATED
OTHER FEATURES: LOW RECRYSTALLIZATION
SOME ALLOCHEMS RECRYSTALLIZED
2270 - 2280 PACKSTONE; VERY LIGHT ORANGE TO YELLOWISH GRAY
20% POROSITY: INTERGRANULAR, INTRAGRANULAR
GRAIN TYPE: SKELETAL, CRYSTALS
75% ALLOCHEMICAL CONSTITUENTS
GRAIN SIZE: MEDIUM; RANGE: FINE TO MEDIUM
MODERATE INDURATION
CEMENT TYPE(S): CALCILUTITE MATRIX
FOSSILS: ECHINOID, FOSSIL MOLDS
DOLOMITE < 40%
2280 - 2290 DOLOSTONE; MODERATE YELLOWISH BROWN
15% POROSITY: INTERCRYSTALLINE, VUGULAR, LOW PERMEABILITY
90-100% ALTERED; EUHEDRAL
GRAIN SIZE: FINE; RANGE: VERY FINE TO MEDIUM
GOOD INDURATION
CEMENT TYPE(S): DOLOMITE CEMENT
A-18

Floridan Aquifer Test Well Program, South Bay Appendix A
2290 - 2300 GRAINSTONE; VERY LIGHT ORANGE
25% POROSITY: INTERGRANULAR, INTRAGRANULAR
GRAIN TYPE: SKELETAL, CRYSTALS
95% ALLOCHEMICAL CONSTITUENTS
GRAIN SIZE: MEDIUM; RANGE: FINE TO COARSE; UNCONSOLIDATED
DOLOMITE < 15%
2300 - 2415 DOLOSTONE; DARK YELLOWISH BROWN
10% POROSITY: INTERCRYSTALLINE, LOW PERMEABILITY
90-100% ALTERED; SUBHEDRAL
GRAIN SIZE: VERY FINE; RANGE: VERY FINE TO MEDIUM
GOOD INDURATION
CEMENT TYPE(S): DOLOMITE CEMENT
ACCESSORY MINERALS: LIMESTONE-<5%
2415 - 2435 NO SAMPLES
2435 - 2471 PACKSTONE; VERY LIGHT ORANGE TO GRAYISH BROWN
20% POROSITY: INTERGRANULAR, INTRAGRANULAR
GRAIN TYPE: SKELETAL, CALCILUTITE
75% ALLOCHEMICAL CONSTITUENTS
GRAIN SIZE: MEDIUM; RANGE: FINE TO GRANULE
GOOD INDURATION
CEMENT TYPE(S): SPARRY CALCITE CEMENT, CALCILUTITE MATRIX
ACCESSORY MINERALS: DOLOMITE-10%
FOSSILS: BENTHIC FORAMINIFERA, ECHINOID
2471 - 2490 DOLOSTONE; GRAYISH ORANGE TO VERY LIGHT ORANGE
15% POROSITY: INTERCRYSTALLINE; 90-100% ALTERED; EUHEDRAL
GRAIN SIZE:MEDIUM; RANGE: FINE TO COARSE; GOOD INDURATION
CEMENT TYPE(S): DOLOMITE CEMENT
ACCESSORY MINERALS: LIMESTONE-10%
2490 - 2504 GRAINSTONE; VERY LIGHT ORANGE TO GRAYISH BROWN
25% POROSITY: INTERGRANULAR, INTRAGRANULAR
GRAIN TYPE: SKELETAL, CRYSTALS, CALCILUTITE
90% ALLOCHEMICAL CONSTITUENTS
GRAIN SIZE: MEDIUM; RANGE: FINE TO GRANULE
MODERATE INDURATION
CEMENT TYPE(S): CALCILUTITE MATRIX
ACCESSORY MINERALS: DOLOMITE-20%
2504 TOTAL DEPTH
A-19

Appendix A Floridan Aquifer Test Well Program, South Bay
A-20

Floridan Aquifer Test Well Program, South Bay Appendix B
B-1
APPENDIX B
GEOPHYSICAL LOG TRACES
The geophysical logs of PBF-7 are shown in Figures B-1 through B-5. Avideotaping of PBF-7, conducted January 17, 1996, is summarized in Table B-1.
Table B-1. Video Survey for PBF-7
Videotaping Date January 17, 1997Depth Taped 985-2367 feet below sea level (ft bls)Depth Correction Videotape and these notes up to 17 ft deeper than geophysical logs (Haliburton) at
base of holeFeet bls Description993 Base of casing993-1110 Well indurated, white packstone; no flow evident; wallowed out hole1110-1292 As above, more white and chalky; less wallowed hole, smaller diameter1292-1294 Very thin, minor flow zone; cream-white, undulating lense.
Visible, minor flow evidenced by fuzzy water clarity as in isohaline change; trace rust staining in rock
1294-1325 Well indurated, white packstone as above1325-1326 ~1 foot thick, very minor flow zone; grey and white mottled limestone; well indurated
packstone, without trace rust staining; flow possible but not strong1326-1812 Packstone, well indurated as above; increased whiteness due apparently to more
chalk content; mottled black concentric rings intermittently down the section1812-1870 Packstone, increased hardness, better indurated than above, grey and white, and
tan brown color, no evident flow.1870-1924 Packstone, white, softer, chalkier than above; no visible flow zones1924-1925 Dolomite, dark brown and black mottled; crystalline; no apparent flow1925-1970 Packstone, white; well-indurated with black concentric rings interbedded1970-2199 Dolomite, brown, hard, crystalline, black mottled; dramatic change in lithology from
above; Flow zones evidenced by hazy, isohaline water clarity changes, swirling eddy currents, rust staining, mounds of white precipitate, etc., occurred at the following thin intervals ranging from 1 to 3 feet thick: 1975, 1979, 1986, 2001, 2005, 2012, 2024, 2124, 2129, 2140, 2177, 2188, 2198
2199-2210 Packstone, white-tan, well indurated; dramatic lithology change from dolomite above2210-2248 Dolomite, brown, crystalline; no visible flow zones2248-2363 Packstone and crystalline dolomite interbedded; visible fracturing in sidewalls in
places2363-2367 Dolomite, gray, crystalline; large flow zone evident2367 Loss of signal, end of tape; remainder of borehole not on video

Appendix B Floridan Aquifer Test Well Program, South Bay
B-2
Figure B-1. Geophysical Log of PBF-7 (Sheet 1 of 5)

Floridan Aquifer Test Well Program, South Bay Appendix B
Figure B-2. Geophysical Log of PBF-7 (Sheet 2 of 5)
B-3

Appendix B Floridan Aquifer Test Well Program, South Bay
Figure B-3. Geophysical Log of PBF-7 (Sheet 3 of 5)
B-4

Floridan Aquifer Test Well Program, South Bay Appendix B
Figure B-4. Geophysical Log of PBF-7 (Sheet 4 of 5)
B-5

Appendix B Floridan Aquifer Test Well Program, South Bay
Figure B-5. Geophysical Log of PBF-7 (Sheet 5 of 5)
B-6

Floridan Aquifer Test Well Program, South Bay Appendix C
APPENDIX C
PACKER TEST DATA AND ANALYSES
Packer test details are provided in Tables C-1 through C-5 and Figures C-1through C-4.
C-1

Appendix C Floridan Aquifer Test Well Program, South Bay
P
S
M
D
M
A
M
P
I.D
In
In
T
T
M
S
S
F
S
F
C
TTe
pH
G
hp
dd
b.
Table C-1. PBF-7 Packer Test No. 1
Background Dataacker Test No.: 1 Date: 26 Nov 96 Interval Tested: 1012-1297 ft
tatic Water Level (G.L.) Before Pumping: +35.68 ft After Recovery:
easuring Point Distance to Kelly Bushing: +27.00 ft
istance from G.L. to Rig's Kelly Bushing: 8.68 ft
aximum Drawdown During Pumping: 14.72 ft Total Pumping: 600 minutes
verage Pumping Rate (gpm): 250
inimum Pumping Rate (gpm): 248 Max. Pumping Rate (gpm): 254
ump Type: 3-inch submersible 3 hp Depth to Pump Intake from K.B.: 64.15 ft
. Drill Pipe: 3.5 inch Tester: Baker Driller: RST Inc.
Hermit #put #1 Transducer #: 1544DB Range: 30 psi Depth Lowered to: 20.00 ft b.toc
put #2 Transducer #: 1835DD Range: 30 psi Depth Lowered to: 20.00 ft b.toc
ime Pumping Started: 1100 Time Pumping Ended: 2100 Total Pumping Time: 10 hours
Aquifer Analysis
ransmissivity: 47,020 gpd/ft
ethod of Analysis: Jacob
oftware Used: Fetter & Aqtesolv
pecific Capacity: 31.75 gpm/ft/dd
riction Loss (Observed): 6.72 ft
tatic Head: +35.68 ft
Water Quality
ield Paramaters Major Ion Concentrations (mg/L)Cations (mg/L) Anions (mg/L)
ond.: 5550 MG = 91 ALCO3 = 121
DS: 3070 NA = 556 CL = 1464mp.: 26.1 K = 17 SO4 = 512
: 7.1 F = 0.75Definitions
.L. = ground level
= horsepower
= drawdown
toc = below top of casing
C-2

Floridan Aquifer Test Well Program, South Bay Appendix C
Figure C-1. Water Level Plot for Packer Test No. 1, 01/10/01
C-3

Appendix C Floridan Aquifer Test Well Program, South Bay
P
S
M
D
M
A
M
P
I.D
In
In
T
T
M
S
S
F
S
F
C
TTe
pH
Table C-2. PBF-7 Packer Test No. 2
Background Dataacker Test No.: 2 Date: 16 Nov 96 Interval Tested: 1633-1762 ft
tatic Water Level (G.L.) Before Pumping: +33.90 ft After Recovery:
easuring Point Distance to Kelly Bushing: +43.90 ft
istance from G.L. to Rig's Kelly Bushing: 9.30 ft
aximum Drawdown During Pumping: 79.86 ft Total Pumping: 270 minutes
verage Pumping Rate (gpm): 204
inimum Pumping Rate (gpm): 202 Max. Pumping Rate (gpm): 212
ump Type: 3-inch submersible 3 hp Depth to Pump Intake from K.B.: 122 ft
. Drill Pipe: 3.5 inch Tester: Baker Driller: RST Inc.
Hermit #put #1 Transducer #: 5395GH Range: 50 psi Depth Lowered to: 110.00 ft b.toc
put #2 Transducer #: 4073FD Range: 50 psi Depth Lowered to: 110.00 ft b.toc
ime Pumping Started: 0930 Time Pumping Ended: 1408 Total Pumping Time: 4.5 hours
Aquifer Analysis
ransmissivity: 11,400 gpd/ft
ethod of Analysis: Theis Recovery
oftware Used: Fetter & Aqtesolv
pecific Capacity: 2.6 gpm/ft/dd
riction Loss (Observed): 58.80 ft
tatic Head: +33.90 ft
Water Quality
ield Paramaters Major Ion Concentrations (mg/L)Cations (mg/L) Anions (mg/L)
ond.: 5340 MG = 104 ALCO3 = 133
DS: 3120 NA = 604 CL = 1446mp.: 26.26 K = 21 SO4 = 514
: 7.1 F = 0.79
C-4

Floridan Aquifer Test Well Program, South Bay Appendix C
Figure C-2. Water Level Plot for Packer Test No. 1, 02/03/00
C-5

Appendix C Floridan Aquifer Test Well Program, South Bay
Figure C-3. Water Level Plot for Packer Test No. 2
C-6

Floridan Aquifer Test Well Program, South Bay Appendix C
P
S
M
D
M
A
M
P
I.D
In
In
T
T
M
S
S
F
S
F
C
TTe
pH
Table C-3. PBF-7 Packer Test No. 3
Background Dataacker Test No.: 3 Date: 19 Dec 96 Interval Tested: 1263-1392 ft
tatic Water Level (G.L.) Before Pumping: +30.18 ft After Recovery:
easuring Point Distance to Kelly Bushing: +34.00 ft
istance from G.L. to Rig's Kelly Bushing: 9.30 ft
aximum Drawdown During Pumping: 64.86 ft Total Pumping: 540 minutes
verage Pumping Rate (gpm): 210
inimum Pumping Rate (gpm): 208 Max. Pumping Rate (gpm): 236
ump Type: 3-inch submersible 3 hp Depth to Pump Intake from K.B.: 128 ft
. Drill Pipe: 3.5 inch Tester: Baker Driller: RST Inc.
Hermit #put #1 Transducer #: 5395GH Range: 50 psi Depth Lowered to: 110.00 ft b.toc
put #2 Transducer #: 4073FD Range: 50 psi Depth Lowered to: 110.00 ft b.toc
ime Pumping Started: 0941 Time Pumping Ended: 1803 Total Pumping Time: 9 hours
Aquifer Analysis
ransmissivity: 37,210 gpd/ft
ethod of Analysis: Theis Recovery
oftware Used: Fetter & Aqtesolv
pecific Capacity: 3.2 gpm/ft/dd
riction Loss (Observed): 48.15 ft
tatic Head: +20.88 ft
Water Quality
ield Paramaters Major Ion Concentrations (mg/L)Cations (mg/L) Anions (mg/L)
ond.: 5340 MG = 114 ALCO3 = 275
DS: 3090 NA = 837 CL = 1390mp.: 25.63 K = 35.1 SO4 = 475
: 7.24 F = 0.84
C-7

Appendix C Floridan Aquifer Test Well Program, South Bay
P
S
M
D
M
A
M
P
I.D
In
In
T
T
M
S
S
F
S
F
C
TTe
pH
Table C-4. PBF-7 Packer Test No. 4
Background Dataacker Test No.: 4 Date: 7 Feb 97 Interval Tested: 1913-2020 ft
tatic Water Level (G.L.) Before Pumping: +35.15 ft After Recovery:
easuring Point Distance to Kelly Bushing: +33.65 ft
istance from G.L. to Rig's Kelly Bushing: 9.50 ft
aximum Drawdown During Pumping: 1.65 ft Total Pumping: 240 minutes
verage Pumping Rate (gpm): 206
inimum Pumping Rate (gpm): 204 Max. Pumping Rate (gpm): 206
ump Type: 3-inch submersible 3 hp Depth to Pump Intake from K.B.: 112 ft
. Drill Pipe: 3.5 inch Tester: Baker Driller: RST Inc.
Hermit #put #1 Transducer #: 1835DD Range: 30 psi Depth Lowered to: 70 ft b.toc
put #2 Transducer #: 5395GH Range: 50 psi Depth Lowered to: 110.00 ft b.toc
ime Pumping Started: 1115 Time Pumping Ended: 1503 Total Pumping Time: 4.0 hours
Aquifer Analysis
ransmissivity: High gpd/ft
ethod of Analysis:
oftware Used: Fetter & Aqtesolv
pecific Capacity: 103 gpd
riction Loss (Observed):
tatic Head: +43.10 ft
Water Quality
ield Paramaters Major Ion Concentrations (mg/L)Cations (mg/L) Anions (mg/L)
ond.: 23310 MG = 448 ALCO3 = 108
DS: 13800 NA = 1060 CL = 8179mp.: 27.23 K = 141.2 SO4 = 977
: 7.44 F = 0.486
C-8

Floridan Aquifer Test Well Program, South Bay Appendix C
Figure C-4. Water Level Plot for Packer Test No. 5
C-9

Appendix C Floridan Aquifer Test Well Program, South Bay
P
S
M
D
M
A
M
P
I.D
In
In
T
T
M
S
S
F
S
F
C
TTe
pH
Table C-5. PBF-7 Packer Test No. 5
Background Dataacker Test No.: 5 Date: 19 Feb 97 Interval Tested: 775 - 890 ft
tatic Water Level (G.L.) Before Pumping: +32.14 ft After Recovery: 27.74 ft
easuring Point Distance to Kelly Bushing: +29.74 ft
istance from G.L. to Rig's Kelly Bushing: 4.40 ft
aximum Drawdown During Pumping: 78.50 ft Total Pumping: 360 minutes
verage Pumping Rate (gpm): 94
inimum Pumping Rate (gpm): 94 Max. Pumping Rate (gpm): 96
ump Type: 3-inch submersible 3 hp Depth to Pump Intake from K.B.: 120 ft
. Drill Pipe: 3.5 inch Tester: Baker Driller: RST Inc.
Hermit # 2put #1 Transducer #: 4073FD Range: 50 psi Depth Lowered to: 110.00 ft b.toc
put #2 Transducer #: 5395GH Range: 50 psi Depth Lowered to: 110.00 ft b.toc
ime Pumping Started: 1404 Time Pumping Ended: 2000 Total Pumping Time: 6 hours
Aquifer Analysis
ransmissivity: 5,556 gpd/ft
ethod of Analysis: Cooper-Jacob
oftware Used: Fetter & Aqtesolv
pecific Capacity: 1.2 gal/ft/dd
riction Loss (Observed): 6.87 ft
tatic Head: +26.74 ft
Water Quality
ield Paramaters Major Ion Concentrations (mg/L)Cations (mg/L) Anions (mg/L)
ond.: 7110 MG = 170 ALCO3 = 255.5
DS: 4100 NA = 1060 CL = 1998mp.: 27.23 K = 51.4 SO4 = 660
: 7.4 F = 1.06
C-10

Floridan Aquifer Test Well Program, South Bay Appendix D
APPENDIX D
AQUIFER PERFORMANCE TEST DATA
AND ANALYSES
Aquifer performance test (APT) details are provided in Tables D-1 and D-2 andFigures D-1 through D-4.
D-1
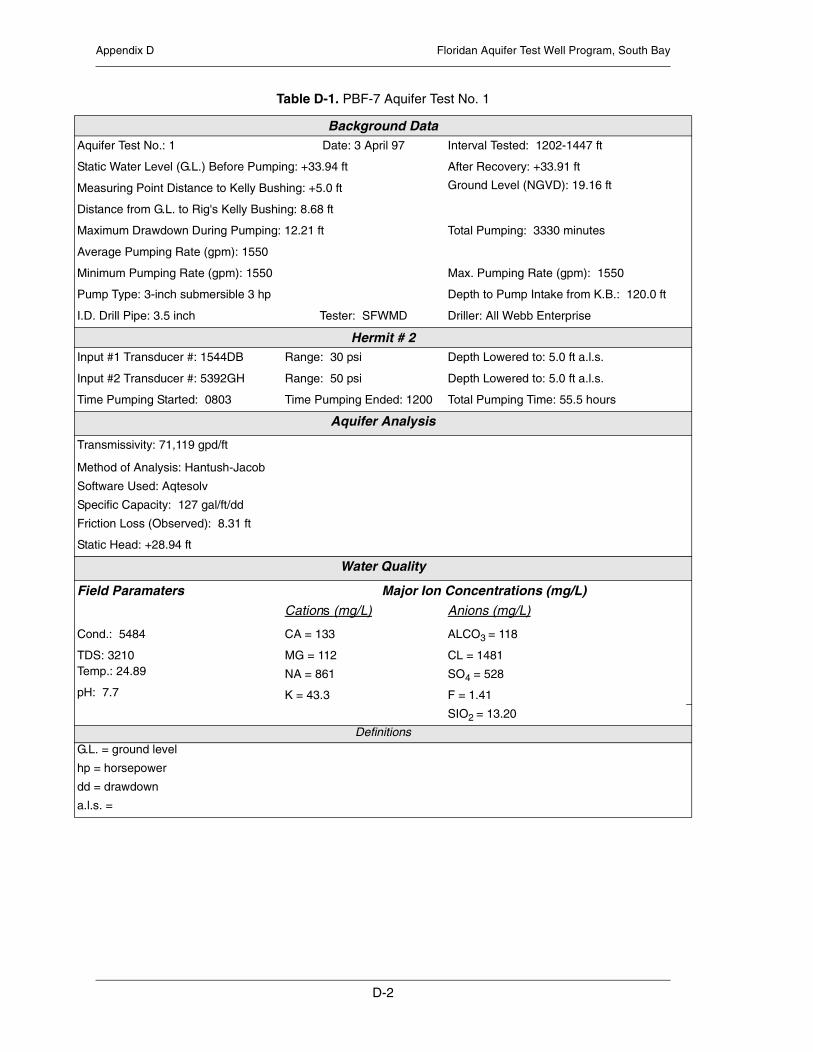
Appendix D Floridan Aquifer Test Well Program, South Bay
A
S
M
D
M
A
M
P
I.D
In
In
T
T
M
S
S
F
S
F
C
TTe
pH
G
hp
dd
a.
Table D-1. PBF-7 Aquifer Test No. 1
Background Dataquifer Test No.: 1 Date: 3 April 97 Interval Tested: 1202-1447 ft
tatic Water Level (G.L.) Before Pumping: +33.94 ft After Recovery: +33.91 ft
easuring Point Distance to Kelly Bushing: +5.0 ft Ground Level (NGVD): 19.16 ft
istance from G.L. to Rig's Kelly Bushing: 8.68 ft
aximum Drawdown During Pumping: 12.21 ft Total Pumping: 3330 minutes
verage Pumping Rate (gpm): 1550
inimum Pumping Rate (gpm): 1550 Max. Pumping Rate (gpm): 1550
ump Type: 3-inch submersible 3 hp Depth to Pump Intake from K.B.: 120.0 ft
. Drill Pipe: 3.5 inch Tester: SFWMD Driller: All Webb Enterprise
Hermit # 2put #1 Transducer #: 1544DB Range: 30 psi Depth Lowered to: 5.0 ft a.l.s.
put #2 Transducer #: 5392GH Range: 50 psi Depth Lowered to: 5.0 ft a.l.s.
ime Pumping Started: 0803 Time Pumping Ended: 1200 Total Pumping Time: 55.5 hours
Aquifer Analysis
ransmissivity: 71,119 gpd/ft
ethod of Analysis: Hantush-Jacob
oftware Used: Aqtesolv
pecific Capacity: 127 gal/ft/dd
riction Loss (Observed): 8.31 ft
tatic Head: +28.94 ft
Water Quality
ield Paramaters Major Ion Concentrations (mg/L)Cations (mg/L) Anions (mg/L)
ond.: 5484 CA = 133 ALCO3 = 118
DS: 3210 MG = 112 CL = 1481mp.: 24.89 NA = 861 SO4 = 528
: 7.7 K = 43.3 F = 1.41
SIO2 = 13.20
Definitions.L. = ground level
= horsepower
= drawdown
l.s. =
D-2

Floridan Aquifer Test Well Program, South Bay Appendix D
Figure D-1. Aquifer Test No. 1 Displacement Data
D-3

Appendix D Floridan Aquifer Test Well Program, South Bay
Figure D-2. Aquifer Test No. 1 Drawdown Data (Cooper-Jacob)
D-4

Floridan Aquifer Test Well Program, South Bay Appendix D
A
S
M
D
M
A
M
P
I.D
In
In
T
T
M
S
S
F
S
F
C
TTe
pH
Table D-2. PBF-7 Aquifer Test No. 2
Background Dataquifer Test No.: 2 Date: 14 May 97 Interval Tested: 1960-2040 ft
tatic Water Level (G.L.) Before Pumping: +25.1 ft After Recovery: +20.38 ft
easuring Point Distance to Kelly Bushing: +3.80 ft (land surface to petcock valve)
istance from G.L. to Rig's Kelly Bushing: 8.68 ft Ground Level (NGVD): 19.16 ft
aximum Drawdown During Pumping: 1.10 ft Total Pumping: 4140 minutes
verage Pumping Rate (gpm): 1030
inimum Pumping Rate (gpm): 1030 Max. Pumping Rate (gpm): 1030
ump Type: 3-inch submersible 3 hp Depth to Pump Intake from K.B.: 120.0 ft
. Drill Pipe: 3.5 inch Tester: SFWMD Driller: All Webb Enterprise
Hermit #put #1 Transducer #: 205283 Range: 30 psi Depth Lowered to: 3.80 ft a.l.s.
put #2 Transducer #: 1836DD Range: 30 psi Depth Lowered to: 5.0 ft a.l.s.
ime Pumping Started: 1258 Time Pumping Ended: 1120 Total Pumping Time: 69.0 hours
Aquifer Analysis
ransmissivity: 504,100 gpd/ft
ethod of Analysis: Theis Recovery
oftware Used: Aqtesolv
pecific Capacity: 17.34 gal/ft/dd
riction Loss (Observed):
tatic Head: +21.28 ft
Water Quality
ield Paramaters Major Ion Concentrations (mg/L)Cations (mg/L) Anions (mg/L)
ond.: 27,030 CA = 473 ALCO3 = 109
DS: 15,900 MG = 558 CL = 9350mp.: 27.89 NA = 4695 SO4 = 1076
: 6.8 K = 221 F = 0.496
SIO2 = 10.84
D-5

Appendix D Floridan Aquifer Test Well Program, South Bay
Figure D-3. Aquifer Test No. 1 Drawdown Data (Hantush)
D-6

Floridan Aquifer Test Well Program, South Bay Appendix D
Figure D-4. Aquifer Test No. 2 Drawdown Data (Hantush)
D-7

Appendix D Floridan Aquifer Test Well Program, South Bay
D-8