florida passenger rail system study - oppaga.state.fl.us · rfp request for proposal rhcp...
TRANSCRIPT
www.cpcstrans.com
CPCS Ref: 18330 October 31, 2018
FINAL REPORT
Florida Passenger Rail System Study (Client Ref: RFP No. 917)
Final Report
Prepared for:
Office of Program Policy Analysis and Government Accountability (OPPAGA)
Prepared by:

FINAL REPORT | Florida Passenger Rail System Study Client Ref: RFP Number 917
Quality Assurance
Florida Passenger Rail System Study – Final Report
CPCS Ref: 18330
Final Report
Version Date Responsible Approval
1.0 Oct 26, 2018 Camille Wu, Aleksandr Prodan, George Kaulbeck Donald Ludlow
2.0 Oct 26, 2018 Camille Wu, Aleksandr Prodan, George Kaulbeck Donald Ludlow
3.0 Oct 31, 2018 Camille Wu, Aleksandr Prodan, George Kaulbeck Donald Ludlow

FINAL REPORT | Florida Passenger Rail System Study Client Ref: RFP Number 917
Acknowledgments / Confidentiality
CPCS would like to acknowledge input provided by OPPAGA for the development of the Final Report. CPCS also wishes to thank all other stakeholders consulted during the research process. Any errors of fact or interpretation are ours.
This report may include information which is deemed by some to be commercially sensitive and should be treated as confidential, unless otherwise approved for release.
Cover image source: CPCS/A. Prodan

FINAL REPORT | Florida Passenger Rail System Study Client Ref: RFP Number 917
| iv
Table of Contents Acronyms / Abbreviations ............................................................................................................. vii
Executive Summary ........................................................................................................................ ix
1 Introduction ................................................................................................................................. 1
Authority of the Assignment .................................................................................................... 1
The Assignment ........................................................................................................................ 1
Scope ........................................................................................................................................ 1
Methodology ............................................................................................................................ 2
Limitations ................................................................................................................................ 2
2 Florida Passenger Rail System Inventory ...................................................................................... 3
Introduction .............................................................................................................................. 3
Florida Rail System History ....................................................................................................... 3
Distinction between Conventional, Higher-Speed and High-Speed Rail ................................. 3
Florida Passenger Rail System .................................................................................................. 4
Overview ........................................................................................................................... 4
Amtrak ............................................................................................................................... 6
SunRail ............................................................................................................................... 6
Tri-Rail ............................................................................................................................... 7
Brightline ........................................................................................................................... 7
Other Proposed Commuter Rail Systems ................................................................................. 7
Orange Blossom Express ................................................................................................... 7
First Coast Commuter Rail ................................................................................................ 8
Comparing Financial Operating Performance of Commuter Rail Systems .............................. 8
Conclusions on the Existing Rail System ................................................................................ 11
3 Florida Rail Safety Record ........................................................................................................... 12
Introduction ............................................................................................................................ 12
Methodology for Evaluating Florida’s Rail Safety Record ...................................................... 12
Assessing Data Availability and Quality .................................................................................. 13
Overview of Florida’s Safety Record Analysis ........................................................................ 14
Florida Passenger Rail Accident Inventory ............................................................................. 16
Comparison between Florida and the United States...................................................... 16
Casualties Incurred by Train Passengers ................................................................................ 17
Florida Railroad Casualty Rates by Rail Service ...................................................................... 18
Intercity Services (Amtrak and Brightline) ...................................................................... 18

FINAL REPORT | Florida Passenger Rail System Study Client Ref: RFP Number 917
| v
Commuter Rail (SunRail and Tri-Rail) .............................................................................. 20
Probable Causes of Florida Passenger Rail Incidents ............................................................. 21
Rail Network Density .............................................................................................................. 23
Florida Grade Crossing Inventory ........................................................................................... 24
Importance of Grade Crossings in Densely-Populated Areas ................................................ 28
Grade Crossing Incident Distribution ..................................................................................... 29
Top 11 Crossings with Highest Number of Incidents ............................................................. 30
Grade Crossing Characteristics ............................................................................................... 33
Chapter Conclusions ............................................................................................................... 36
4 Safety Initiatives – Florida and Other Jurisdictions ..................................................................... 37
Introduction ............................................................................................................................ 37
Federal Highway Administration (FHWA) Safety Initiatives .................................................. 37
Positive Train Control (PTC) Implementation ................................................................. 37
Highway Safety Improvement Program (HSIP) ............................................................... 39
Railway-Highway Crossings Program (RHCP) .................................................................. 39
State Safety Initiatives ............................................................................................................ 41
Education – Operation Lifesaver and Beyond ................................................................ 41
Engineering ..................................................................................................................... 41
Enforcement.................................................................................................................... 42
Grade Crossing Safety: Best Practice and State of the Art ..................................................... 43
Best Practices in Other Passenger Rail Systems ............................................................. 43
Innovative Technologies for Grade Crossing Protection ................................................ 46
International Research Projects on Grade Crossing Safety ............................................ 50
Problem Responsibility and Mitigation .................................................................................. 52
Trespassing Mitigation .................................................................................................... 52
Unplanned Train Stops .................................................................................................... 52
Hazardous Materials ....................................................................................................... 52
Chapter Conclusions ............................................................................................................... 54
Grade Crossing Safety: Best Practice and State of the Art ............................................. 54
Putting to Use Best Practices in Grade Crossing Design and Management ................... 55
5 Florida Rail Regulations .............................................................................................................. 56
Introduction ............................................................................................................................ 56
Review of Jurisdictional and Regulatory Powers ................................................................... 56
Federal Government Rail Regulation .............................................................................. 57
Florida State Rail Regulation ........................................................................................... 58
Relevant Regulation on Railroad Operations .................................................................. 59
Shortcomings of Existing Regulations ............................................................................. 67
FINAL REPORT | Florida Passenger Rail System Study Client Ref: RFP Number 917
| vi
Regulations on Railroad-Highway Grade Crossings ........................................................ 68
Regulations for Faster Operation ........................................................................................... 69
Federal Regulations for Higher and High-Speed Operations .......................................... 70
Comparing European and US Regulations for High-Speed Rail ...................................... 71
Assessment of Adequacy of Existing State and Federal Regulations for Higher- and High-Speed Operations .................................................................................................................. 72
Regulations on Enforcement and Incident Reporting ............................................................ 73
Incident Reporting Requirements ................................................................................... 74
Enforcement of Regulations ........................................................................................... 77
Railroad Accident Reporting by the International Union of Railways (UIC) ................... 78
Possible Shortcomings in Existing Regulations ...................................................................... 79
6 Key Issues and Recommendations .............................................................................................. 80
Overview................................................................................................................................. 80
Trespassing, Injuries, and Fatalities ....................................................................................... 80
Gaps in Regulations ................................................................................................................ 82
Higher-Speed Rail Regulations ........................................................................................ 82
Shortcomings in State-Level Rail Regulation .................................................................. 82
Institutional Gaps ................................................................................................................... 83
The Need to Clarify FDOT’s Mandate ............................................................................. 83
Improving the Planning Process for Local Governments ................................................ 83
Potential Conflict in FDOT’s Existing Mandate ............................................................... 84
Recommendations ................................................................................................................. 85
Overview ......................................................................................................................... 85
Recommendations .......................................................................................................... 85
Appendix A. Economic Conditions and Outlook in Florida ......................................................... 91
Appendix B. Florida Passenger Rail Systems outside the Scope of the Study ............................. 96
Appendix C. Detailed Analysis of Florida Passenger Rail System Financial Figures .................. 101
Appendix D. FRA Incident Classification Categories ................................................................. 136
Appendix E. Top 50 Florida Grade Crossings with Highest Number of Incidents ...................... 138
Appendix F. US Rail Safety Trends .......................................................................................... 140
Appendix G. Detailed Field Safety Assessment (DSA) of Grade Crossing Safety in Canada ....... 145
Appendix H. Review of Relevant Federal Legislation ............................................................... 147

FINAL REPORT | Florida Passenger Rail System Study Client Ref: RFP Number 917
| vii
Acronyms / Abbreviations Acronym Definition
ACE Altamont Corridor Express
AADT Annual Average Daily Traffic
AAF All Aboard Florida
AAR American Association of Railroads
AASHTO American Association of State Highway and Transportation officials
ABS Automatic Block Signal
ADA American Disabilities Act
AUM Assets Under Management
BTS Bureau of Transportation Statistics
CARE Citizens Against Rail Expansion
CFR Code of Federal Regulations
CTA Canada Transportation Act
CTC Centralized Traffic Control
CUTR Center for Urban Transportation Research
DSA Detailed Field Safety Assessment
EBITDA Earnings Before Interest, Taxes, Depreciation, and Amortization
EDP Employer Discount Program
EIR Environmental Impact Review
ENS Emergency Notification System
EPA Environmental Protection Agency
FAA Federal Aviation Administration
FAST Fixing America’s Surface Transportation Act
FDOT Florida Department of Transportation
FECI Florida East Coast Industries, LLC
FECR Florida East Coast Railway
FEMA Federal Emergency Management Agency
FHWA Federal Highway Administration
FLL Hollywood International Airport
FRA Federal Railroad Administration
FRSA Federal Railroad Safety Act of 1970
FTA Federal Transit Administration
GCR Grade Crossing Regulations
GDP Gross Domestic Product
GMXT Grupo México Transportes
HSIP Highway Safety Improvement Program
HTF Highway Trust Fund
ICCTA The Interstate Commerce Commission Termination Act of 1995
JRPA Joint Rail Participation Agreements
LRTP Long Range Transportation Plans
MCO Orlando International Airport
MIA Miami International Airport
MPO Metropolitan Planning Organization

FINAL REPORT | Florida Passenger Rail System Study Client Ref: RFP Number 917
| viii
Acronym Definition
MUTCD Manual on Uniform Traffic Control Devices
NCA Noise Control Act of 1972
NEPA National Environmental Policy Act
NHS National Highway System
NOI Notice of Inquiry
NPRM Notice of Proposed Rulemaking
NTSB National Transportation Safety Board
OIG Office of Inspector General
OPPAGA Office of Program Policy and Government Accountability
OUC Orlando Utilities Commission
PAB Private Activity Bonds
PBI Palm Beach International Airport
PRRIA Passenger Rail reform and Investment Act
PTC Positive Train Control
RCL Remote Control Locomotive
RFP Request for Proposal
RHCP Railway-Highway Crossings Program
RHM Remote Health Monitoring
RRIF Railroad Rehabilitation and Infrastructure Financing Program
RSIA Railroad Safety Improvement Act of 2008
RTD Denver Regional Transportation District
SFRTA South Florida Regional Transportation Authority
SSPP System Safety Program Plan
STB Surface Transportation Board
TIGER Transportation Investment Generating Economic Recovery
TRDML Tri-Rail Downtown Miami Link
TRE Trinity Railway Express
U.S.C. US Code
USDOT US Department of Transportation
UIC International Union of Railways
VMT Vehicle Miles Traveled
VOMS Vehicles Operated in Measurable Service
VRE Virginia Railway Express

FINAL REPORT | Florida Passenger Rail System Study Client Ref: RFP Number 917
| ix
Executive Summary The Florida Passenger Rail System Study examined all existing and planned passenger rail systems in Florida that are under the jurisdiction of the Federal Railroad Administration. This includes 4 systems: Amtrak, Brightline, SunRail, and Tri-Rail. The study includes three components:
A detailed inventory and description of the Florida Passenger Rail System focusing on operating passenger railroad companies and planned passenger rail projects.
An analysis of incident data involving passenger rail operations and grade crossings.
An overview of jurisdictions that regulate passenger rail operations on a federal, state, regional and local level, including the establishment and expansion of services; reporting of railroad incidents and rectification of safety issues; and maintenance of tracks, crossing and safety equipment.
Based on the findings of the three parts of the study, this report introduces a set of recommendations to improve passenger rail operations, safety, and railroad policy in Florida.
Identified Issues:
The key issues with Florida’s passenger rail system are as follows.
Florida’s passenger rail system incurs a higher rate of severe injuries and fatalities than the national average. Over the last 10 years, Florida’s passenger railroads experienced a total of 1,395 incidents. Forty-nine percent of these incidents involved severe injuries and fatalities – 1,317 severe injuries and 137 fatalities over this time period.1 Florida’s average severe injury rate is 1.5 times higher and its average fatality rate is 3.5 times higher than the overall national rate over the analysis period (2009-2018). This higher rate of severe injuries and fatalities is primarily attributable to a higher count of trespassing incidents for both pedestrians and vehicles. Trespassing cases represent 27 percent of Florida incidents resulting in severe injuries and fatalities, compared to 19 percent nationwide.
Two new passenger rail services, SunRail and Brightline, began operating in Florida within the last three years. Each service has experienced a series of incidents during its start-up period. The high rate of incidents for each service may be explained by passengers and drivers getting used to the presence of more trains and trains operating at higher speeds. However, these incidents have not had a significant effect on the state’s average fatality and injury rates. Brightline began operations in January 2018 and will be the first privately-owned, higher-speed rail service in the United States, defined by a speed between 81 mph and 125 mph. A number of expansion projects are underway.
1 Data for passenger railroad severe injuries and fatalities between January 2009 and June 2018. See definition of severe injuries in Appendix D.
High rate of severe injuries and fatalities and high levels of trespassing incidents on railroad right of way due to rail services operating in dense urban areas
Gaps in regulations that are specific to higher-speed rail operations and a series of rail expansion projects
The need to clarify FDOT’s mandate on oversight of passenger rail with respect to maintenance, safety, revitalization, and expansion
The lack of resources for local governments for planning rail projects

FINAL REPORT | Florida Passenger Rail System Study Client Ref: RFP Number 917
| x
While Florida passenger rail incident rates are higher than the rest of the country, rail operations take place in much more population-dense areas than the US average. Florida ranks 8th in the country for its grade crossing density index2 which accounts for both the number of grade crossings and population density in the state. Furthermore, rail operations are concentrated in Central and South Florida where the majority of Florida’s population resides.
There is also a gap in federal and state regulations governing higher-speed rail. While the Federal Railroad Administration and the Florida Department of Transportation have in place regulations for conventional (up to 80 mph) and high-speed (126 mph to 220 mph) rail, neither agency has developed additional regulations that are specific to higher-speed rail (81 mph to 125 mph).3 The state of Florida may adopt laws and regulations and issue orders that are compatible with and more stringent than those of the federal government to address local hazards, as long as the laws do not unreasonably burden interstate commerce.
The Florida Department of Transportation (FDOT)’s mandate on passenger rail oversight also needs to be clarified. FDOT is directed by Florida statutes to coordinate with railroads in developing and implementing the statewide rail program to ensure the proper maintenance, safety, revitalization, and expansion of the rail system. FDOT has the right to establish regulations on any issue where there are no federal regulations, as long as they are not incompatible with another law, regulation, or order of the US government, and as long as they do not unreasonably burden interstate commerce. FDOT can also implement non-mandatory federal guidelines and in some cases, state law codifies these guidelines. However, the agency tends to defer to federal minimum standards in practice, in the view of consultations with local governments.
Finally, while some local governments may address road, pedestrian and highway issues frequently, few counties and municipalities have expertise in railroad engineering and planning. Local jurisdictions may lack the necessary resources, knowledge, or expertise in addressing railroad engineering issues or in working with railroads. Consultations with local governments revealed that their concerns are not necessarily addressed by railroads.
Recommendations:
Based on study findings, the six key recommendations proposed by this study with accompanying Legislative and Florida Department of Transportation (FDOT) considerations include the following.
Group Specific Recommendations
1. Updating FDOT’s Mandate
The Legislature may consider three approaches to creating a better regulatory system.
1.1 Providing funding for and directing FDOT to administer a committee to liaise with local governments, communities, and railroads on safety issues.
1.2 Updating FDOT’s mandate to more clearly define its regulatory role in implementing safety regulation on a state level and supplementing the updated mandate with adequate resources (human and financial) to allow FDOT to implement this mandate.
1.3 Creating an independent regulatory body with an independent funding source. The regulatory body would assume FDOT’s existing safety oversight functions, and be responsible for strategic, tactical and operational state-level safety regulation for rail and other modes.
2. Setting New Regulations for Higher-Speed Rail
FDOT may consider:
2.1 Creating a review process to certify new passenger rail lines.
2.2 Setting minimum grade crossing design standards.
2.3 Setting requirements for fencing along railroad corridors.
2.4 Creating guidelines for sealed corridor treatment along railroad corridors.
2 Grade Crossing Density Index is defined as the number of grade crossings × population density / 1 million 3 For the difference in maximum operating speeds between a higher-speed and high-speed line see Figure 2-1.

FINAL REPORT | Florida Passenger Rail System Study Client Ref: RFP Number 917
| xi
Group Specific Recommendations
3. Implementing State-of-the-Art Practices
The Legislature may consider:
3.1 Creating a mandatory requirement that local counties and municipalities with fiber optic networks along local, non-state controlled roads make them available for signal “pre-pre-emption” in order to reduce road congestion and increase grade crossing safety.
3.2 Creating a requirement for navigation applications to include audio and visual alerts of upcoming railroad crossings.
3.3 Setting regulations on quiet zone implementation in urban areas to address railroad system noise.
FDOT may consider:
3.4 Developing and updating (as needed) a set of guidelines that discuss state-of-the-art railroad crossing and corridor treatments and their applicability to Florida railroads, which would allow local governments to be informed about the latest technologies available.
3.5 Implementing Remote Health Monitoring (RHM) requirements for at-grade crossings with higher road and rail traffic volumes and/or train speeds.
4. Enforcing Railroad Crossing Trespass Violations
The Legislature may consider:
4.1 Requiring the establishment of inter-jurisdictional law enforcement working groups in railroad corridors with a high number of crossings and incidents to ensure that law enforcement agencies are coordinating with each other on trespassing enforcement.
4.2 Granting greater authority to each railroad’s security officials to address trespassing along railroads.
4.3 Establishing harsher penalties for grade crossing trespassing.
4.4 Establishing a photo/video enforcement program for at-grade crossings.
5. Reviewing Rail Safety Resources
The Legislature may consider:
5.1 Assessing current resources of the Department of Children and Families and of the Department of Health to determine whether statewide suicide prevention activities could be leveraged to greater effect.
5.2 Requiring railroads to allow owners of grade crossings the right to use open procurement for contracting maintenance of grade crossing, fencing, etc.
FDOT may consider:
5.3 Reviewing local planning resources for rail activity and continuing to liaise with local counties and municipalities to identify funding opportunities for rail safety treatments.
5.4 Requesting an evaluation of funding levels for rail safety in its annual legislative budget request to highlight needs at the state and local level.
6. Continuing Research to Promote Public Safety Along Railroads
FDOT may consider:
6.1 Developing a methodology for analytically evaluating grade crossing closures. Florida’s development patterns resulted in numerous closely-spaced grade crossings. FDOT lacks an analytical methodology for determining which crossings should be consolidated and where strategic investment should be made. The methodology should have a component that would consider impacts on traffic congestion.

FINAL REPORT | Florida Passenger Rail System Study Client Ref: RFP Number 917
| 1
1Introduction Authority of the Assignment
This Final Report was prepared pursuant to the contract signed between the Office of Program Policy and Government Accountability (OPPAGA) and CPCS Transcom Inc. (CPCS) on June 28, 2018, for the Project, “Florida Passenger Rail System Study” (RFP No. 917).
The Assignment
Based on Ch. 2018-9, Laws of Florida, the General Appropriations Act of 2018 (2018 Appropriations Act), the Florida Office of Program Policy Analysis and Government Accountability (OPPAGA) must conduct a study to examine existing and planned passenger rail operations, including high-speed passenger rail in Florida.
“From the funds in Specific Appropriation 2673, the Office of Program Policy Analysis and Government Accountability (OPPAGA) shall contract for a study to examine existing and planned passenger rail operations, including high-speed passenger rail, in this state, and submit a report to the Governor, the President of the Senate, and the Speaker of the House of Representatives by November 1, 2018.”
The recommendations from this study will be used to inform the Florida Legislature on future legislation about passenger rail operations, rail safety, and regulation.
Scope
The scope of this study includes:
A detailed inventory and description of the Florida Passenger Rail System focusing on operating passenger railroad companies and planned passenger rail projects. Only systems under the jurisdiction of the Federal Railroad Administration are included in the scope. This includes Amtrak, SunRail, Tri-Rail, and Brightline systems.
An analysis of incident data involving passenger rail operations and grade crossings.
An overview of jurisdictions that regulate passenger rail operations on a federal, state, regional and local level, including the establishment and expansion of services, reporting of railroad incidents and rectification of safety issues, and maintenance of tracks, crossing and safety equipment.
Based on the findings of the three parts of the study, this report introduces a set of recommendations to improve passenger rail operations, safety, and railroad policy in Florida. The scope of the study also includes providing testimony, if needed, to the Legislature in order to better inform lawmakers on this subject.

FINAL REPORT | Florida Passenger Rail System Study Client Ref: RFP Number 917
| 2
Methodology
Findings in this report are based on a desk study of available literature, analysis of FRA safety database, field analysis of rail lines and crossings in the state, and consultations with the following stakeholders:
Florida Department of Transportation, Office of Freight, Logistics, and Passenger Operations - Freight and Multimodal Operations (Rail and Motor Carrier)
Florida Department of Transportation, Office of the General Counsel
Brightline (All Aboard Florida)
South Florida Regional Transportation Authority (Tri-Rail)
Central Florida Commuter Rail Commission (SunRail)
Amtrak
Operation Lifesaver
Federal Railroad Administration, Rail Safety Analysis Office
Federal Motor Carrier Safety Administration
Florida League of Cities
Florida Emergency Preparedness Association
Interested Legislators
Martin County Director of Public Works and County Attorney’s Office
Indian River County Director of Public Works and County Attorney’s Office
Brevard County Assistant County Manager
Illinois High-Speed Rail Safety Team
Citizens Against Rail Expansion (CARE)
We also requested consultations to the following organizations who declined or did not respond as of the date of this report:
Florida East Coast Railway (deferred questions to Brightline)
CSX Corporation
American Association of Railroads
Surface Transportation Board
Florida Association of Counties
Miami-Dade County Public Works
Broward County Public Works
Palm Beach County Engineers
St. Lucie County Public Works and County Engineer
Orange County Public Works
County Sheriff/Police Departments
County Fire Departments
Metrolink
Caltrain
Limitations
Some of the findings in this report are based on the analysis of third-party data. While CPCS makes efforts to validate data and rectify any discrepancies, CPCS cannot warrant the accuracy of third-party data.

FINAL REPORT | Florida Passenger Rail System Study Client Ref: RFP Number 917
| 3
2 Florida Passenger Rail System Inventory
Introduction
This section provides a brief overview of the current passenger rail system in Florida. Additional details on the Economic Conditions and Outlook in Florida can be found in Appendix A, a summary of Urban Rail Systems is provided in Appendix B, and a description of Passenger Rail Services is located in Appendix C.
Florida Rail System History
While Florida’s first railroad opened in 1836, most significant rail network development happened in the late 19th and early 20th century. After playing an important role during World War II for moving troops, and throughout the post-war period for moving passengers, by the 1960s, with the advent of the Interstate highway system and auto-centric suburban development patterns, passenger rail was on the decline both in Florida and nationwide.
Based on the analysis presented in Appendix A, Florida has experienced positive population growth trends, concentrated population density, a vibrant economy, and the state is expecting ongoing future growth. These trends may also explain why since the early 1990s, Florida’s passenger rail system has seen a revival, with the opening of two new commuter rail lines and the first privately-funded intercity passenger railroad in recent decades.
Distinction between Conventional, Higher-Speed and High-Speed Rail
The Federal Railroad Administration (FRA) classifies passenger rail operations into three categories.
Any line operating at a top speed of less than 80 mph is considered to be conventional rail.
Any line that operates at a top speed between 81 mph and 125 mph is classified as Higher (than conventional)-speed rail.
High-speed rail lines operate at a top speed of 126 mph to 220 mph.4
Rail lines are also classified by track class, as described in sections 213.9 and 213.307 under Title 49 of the Code of Federal Regulations. These track classes and line types are listed in Figure 2-1.
4 FRA and APTA, 2011

FINAL REPORT | Florida Passenger Rail System Study Client Ref: RFP Number 917
| 4
Figure 2-1: FRA Speed Classes
FRA Class
Max. Speed for Passenger Service (mph)
Line Type
1 15
Conventional Rail 2 30
3 60
4 80
5 90 Higher (than
conventional) Speed 6 110
7 125
8 160 High-Speed
9 220
Source: Code of Federal Regulations, FRA
The FRA defines different maintenance and operating standards for each track class. One important distinction includes the presence of grade crossings: high-speed rail generally does not allow for grade crossings, while higher-speed rail may allow for grade crossings.
Florida Passenger Rail System
Overview
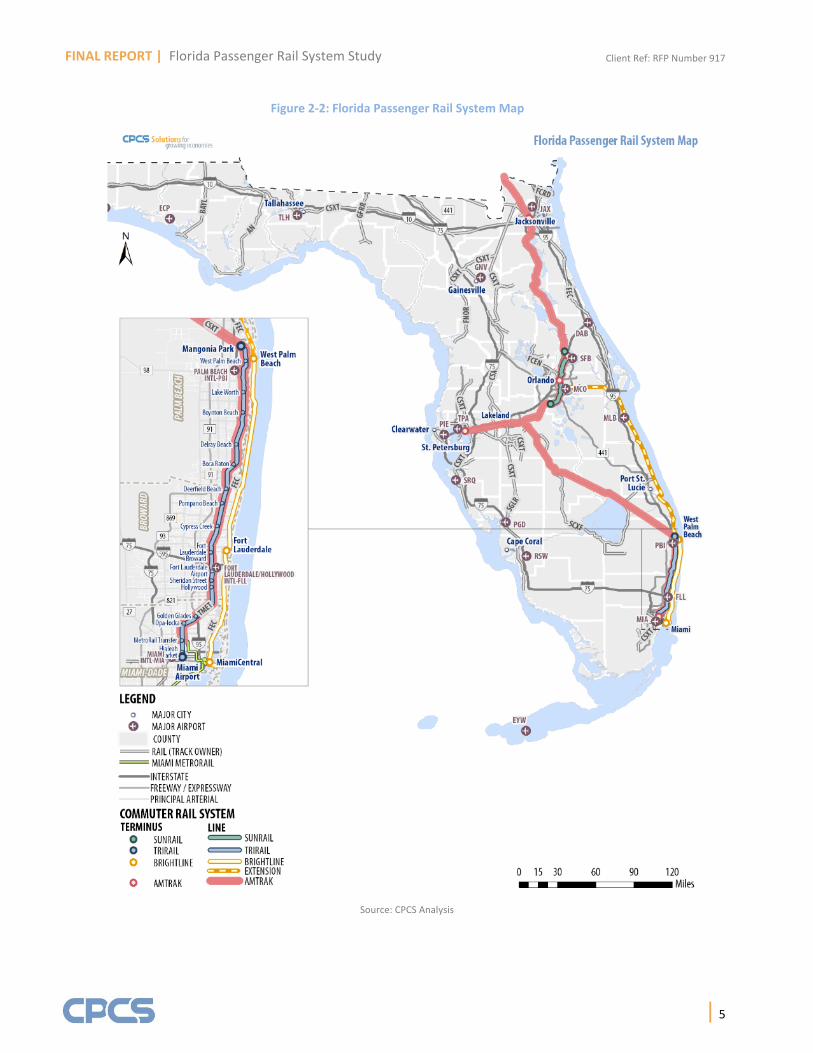
Four passenger rail systems operating in Florida are within the scope of this study: Amtrak, Brightline, SunRail, and Tri-Rail. Collectively, they operate on over 600 route miles of lines in Florida and include two intercity operators (Amtrak and Brightline), both operating on track owned by other railroads, and two commuter rail operators (SunRail and Tri-Rail), both operating on their own tracks.
Along with intercity and commuter rail, Florida also has four major urban rail systems that are not connected to the national rail system and as such, are not under the jurisdiction of the FRA. These urban rail systems are thus excluded from this study. A brief description of these systems is presented in Appendix B.
This report focuses on intercity and commuter passenger rail operations, maintenance, infrastructure, new developments and expansion, safety record, regulation, grade crossings, and recommendations for improvement. Figure 2-2 presents the Florida passenger rail system and Figure 2-3 provides a summary of operating characteristics for each service.
Intercity Rail: rail service that operates longer distances between major cities Commuter Rail: rail service that operates shorter distances between a city center and suburban areas
FINAL REPORT | Florida Passenger Rail System Study Client Ref: RFP Number 917
| 5
Figure 2-2: Florida Passenger Rail System Map
Source: CPCS Analysis

FINAL REPORT | Florida Passenger Rail System Study Client Ref: RFP Number 917
| 6
Figure 2-3: Existing Florida Passenger Rail System Overview
Service / Owner Route Length
(miles) Type of Service
Route/Location Round Trips
Wkday (Wkend) Annual Ridership
(Year) Start Year
Silver Meteor / Amtrak 527.1 Intercity New York – Miami 1 (1) 339,407 (2016) 1939
1971*
Silver Star / Amtrak 664.8 Intercity New York – Tampa – Miami 1 (1) 364,271 (2016) 1947
1971*
Auto Train / Amtrak 855 Intercity Lorton, VA – Sanford, FL 1 (1) 238,448 (2016) 1983
Tri-Rail / SFRTA 72 Commuter Miami – W. Palm Beach 25 (15) 4,240,699 (2016) 1989
SunRail / FDOT 48.9 Commuter Greater Orlando 20 (0) 957,800 (2015) 2014
Brightline / AAF 66.5 Intercity Miami – W. Palm Beach 16 (7-8) 360,000 (2018**) 2018
SFRTA – South Florida Regional Transportation Authority FDOT – Florida Department of Transportation AAF – All Aboard Florida
* - as Amtrak ** - expected
Source: CPCS Analysis of Amtrak, Tri-Rail, SunRail, and Brightline
The characteristics of each system are described below, and more details about their financial performance are provided in Appendix C.
Amtrak
The National Railroad Passenger Corporation (Amtrak) is the national rail operator and a federally chartered corporation, with the federal government as majority shareholder. It has provided intercity passenger service to Florida since the company was founded in 1971. Amtrak operates 3 services in the state, linking Florida cities to destinations in the Northeast. In Florida, Amtrak handled a total of 923,483 boardings and alightings in Fiscal Year 2017, serving 18 stations and generating $64 million in revenue. The railroad supports 2,780 jobs in the state, contributing $31.8 million of Gross Domestic Product (value-added) to the region.
In addition to ticket revenues, Amtrak receives funding for operating train services and maintaining its infrastructure from various federal funds, directly from some states (Florida does not contribute directly to Amtrak) and from other sources. Nationally, in Fiscal Year 2017, Amtrak covered 95 percent of its qualified operating expenses through ticket sales, payments from state partners and agencies, and from other revenue. 5
SunRail
SunRail is a 48.9-mile, 16-station commuter railroad in the Greater Orlando area and is Florida’s second commuter rail operation. The system opened in 2014 and was expanded in July 2018. SunRail operates 20 round trips per weekday (no weekend service) on a line that is mostly double-track. In 2015, the system carried just under 1 million riders. The system is operated using funding from the City of Orlando and Osceola as well as Seminole, Volusia, and Orange Counties. SunRail is currently operated by FDOT but will hand operations and maintenance over
5 Does not include depreciation and amortization expenses, capital project related expenditures, post-retirement employee benefit cost, and Office of Inspector General expenses

FINAL REPORT | Florida Passenger Rail System Study Client Ref: RFP Number 917
| 7
to the Central Florida Commuter Rail Commission (currently acting as the advisory board) by 2022.
Tri-Rail
Tri-Rail is a 72-mile, 18-station commuter rail line that serves Palm Beach, Broward, and Miami-Dade Counties and was the first rail system of its kind in the state. The system links Miami, Fort Lauderdale, and West Palm Beach as well as the region’s three major airports. Tri-Rail began operations on January 9, 1989, and currently provides 25 weekday and 15 weekend round-trips between Miami Airport and Mangonia Park. In Fiscal Year 2017, Tri-Rail ridership totaled 4.26 million riders.
Brightline
Brightline is a private higher-speed, intercity rail service developed by All Aboard Florida, using the 66.5-mile Florida East Coast Railway (FECR) corridor.6 All Aboard Florida is a subsidiary of Florida East Coast Industries LLC (FECI), which is, in turn, owned by the Fortress Investment Group. Grupo México Transportes (GMXT) acquired the Florida East Coast Railway (FECR), which owns the infrastructure and operates freight trains along the corridor, from Fortress in July 2017. FECR (the infrastructure owner and freight operator) and FECI (owner of Brightline) no longer have a common owner, although they have an agreement in place to jointly operate the rail corridor.
Phase 1, which cost $600 million, connects Miami to West Palm Beach at a top speed of 79 mph. Brightline operates 16 round-trips per weekday, 8 round-trips on Saturdays and 7 round-trips on Sundays. The railroad expects a total ridership of 360,000 for 2018. A $3.7 billion Phase 2 expansion will extend the service to the Orlando International Airport. Together with other funding, private-activity bonds (PAB) were used for Phase 1 and have been approved for Phase 2, using infrastructure and real estate as collateral. In mid-2018, Brightline submitted an unsolicited proposal to FDOT to extend service from Tampa to Orlando. FDOT responded by issuing an open RFP for the service.
Other Proposed Commuter Rail Systems
Orange Blossom Express
Orange Blossom Express is a proposed 36-mile commuter rail system in Central Florida that would connect Eustis, Tavares, Mount Dora, Apopka, and downtown Orlando. In 2012, FDOT proposed conducting a feasibility study, but this was never completed. No further information on funding, operations or projected ridership is available.
6 When complete, Brightline will be the second fastest rail system in North America after Amtrak’s Acela Express service between Washington, DC and Boston, though still below the internationally-accepted top operating speed of 185-220 mph for high-speed trains.

FINAL REPORT | Florida Passenger Rail System Study Client Ref: RFP Number 917
| 8
First Coast Commuter Rail
First Coast Commuter Rail is a proposed rail system that would serve the Jacksonville region. A feasibility study was completed in 2009. The study identified three potential corridors in the region, totaling over 91 miles.7 The predicted ridership for 2015 was approximately 9,800 daily riders and a predicted farebox recovery ratio of 34.1 percent. As of 2018, the system is still in the planning stages and no funding for its implementation has been identified.
Comparing Financial Operating Performance of Commuter Rail Systems
According to Federal Transit Administration (FTA) data, SunRail and Tri-Rail have low passenger fares compared to their peer group’s median (shown in Figure 2-4 below) and a corresponding low farebox recovery ratio (Tri-Rail at 15 percent, SunRail at 6 percent, peer group median at 32 percent), though SunRail is a relatively new service, which may explain the low figures.8 Commuter rail operating costs have a relatively high fixed part (engineer, conductor, fuel, etc.) that largely does not depend on the number of passengers in the short and medium term. This observation may explain why both railroads have high unit costs (e.g. per passenger or passenger-mile).
Figure 2-4 compares SunRail and Tri-Rail to a selection of US commuter rail lines. Due to Amtrak’s nationwide reach and Brightline’s recent launch, they are not included in this commuter rail service comparison. While dated, SFRTA’s Transit Development Plan for Fiscal Year 2005-2010 uses the following commuter rail services in its peer group: Altamont Corridor Express (ACE), Caltrain, Coaster, Sounder, Trinity Railway Express (TRE), and Virginia Railway Express (VRE).9 Consultations with SunRail revealed that the rail service benchmarks its performance against RTD (Denver) and TRE (Dallas). The analysis also considers Metro Transit (Minneapolis) and Rio Metro (Albuquerque) due to their service and ridership similarities with SunRail.
As a rule, commuter, urban and suburban rail worldwide requires some level of subsidy to operate.10 The level of subsidy tends to decrease as ridership increases within the same service offering. However, at a certain point when new capacity is required, the subsidy level may also need to increase.
The metrics shown in Figure 2-5 will be used to compare Florida commuter rail agencies to others from Figure 2-4.
7 Final Report. First Coast Commuter Rail Feasibility Study. Gannett Fleming for the Jacksonville Transportation Authority, July 2009 8 Farebox recovery ratio is the ratio of operating expenses that is covered by fares. 9 SFRTA Transit Development Plan, Fiscal Year 2005-2010 10 Lalive et al., “Does Supporting Passenger Railways Reduce Road Traffic Externalities?” University of Zurich Working Paper No. 110, 2013.

FINAL REPORT | Florida Passenger Rail System Study Client Ref: RFP Number 917
| 9
Figure 2-4: Commuter Rail Comparison Group (2016)
Service Name Agency Name City Population (millions)*
VOMS** Unlinked Trips
Tri-Rail South Florida Regional Transportation Authority Pompano Beach, FL 5.5 42 4,241,486
SunRail Central Florida Commuter Rail Commission Sanford, FL 1.5 18 910,380
Metrolink So. California Regional Rail Authority Los Angeles, CA 12.2 195 13,758,419
Caltrain Peninsula Corridor Joint Powers Board San Carlos, CA 3.3 105 18,355,641
Coaster North County Transit District Oceanside, CA 3.0 24 1,556,056
ACE Altamont Corridor Express Stockton, CA N/A 26 1,290,085
Sounder Sound Transit (Central Puget Sound Regional Transit Authority)
Seattle, WA 3.1 67 4,312,113
TRE Trinity Railway Express (Dallas Area Rapid Transit) Dallas, TX 5.1 23 2,054,001
VRE Virginia Railway Express Alexandria, VA 4.6 97 4,352,814
Metro Transit Metro Transit Minneapolis, MN 2.7 20 711,167
RTD Denver Regional Transport. District Denver, CO 2.4 18 4,317,405
Rio Metro Rio Metro Regional Transit District Albuquerque, NM 0.7 25 886,386
* Urbanized Area Population as defined by the FTA ** VOMS: Vehicles Operated in Measurable Service as defined by the FTA. The maximum number of cars needed for peak of peak service (excludes locomotives)
Source: FTA 2016 Transit Metrics and Service
Figure 2-5: Operating Metrics Used and Definitions
Metric Definition
Cost Per Hour Average cost to operate one passenger car for one hour of passenger service
Cost Per Passenger Average cost to transport one passenger from the beginning of their trip to the end
Cost Per Passenger-Mile Average cost to transport one passenger one mile
Farebox Recovery Ratio Percentage of operating costs funded by passenger fares
Passengers Per Car Per Hour Average number of passengers that board a passenger car during one hour of service
Source: FTA 2016 Transit Metrics
Using this analysis, the following conclusions can be made about Tri-Rail and SunRail’s operations:
Comparatively-Low Passenger Fares: Tri-Rail and SunRail passenger fares ($3.09 and $2.17 respectively) are lower than their peer group median of $3.75. Among peers, Tri-Rail fares are similar to Metro Transit in Minneapolis and the Sounder in Seattle. SunRail’s fares are lower than all peers except for Rio Metro in Albuquerque.
Low Farebox Recovery Ratio: Tri-Rail and SunRail’s farebox recovery (15 percent and 6 percent, respectively) is lower than their peer group’s median of 32 percent. Tri-Rail’s farebox recovery ratio is similar to that of Metro Transit in Minneapolis and RTD in Denver. SunRail’s farebox recovery ratio is in line with Rio Metro in Albuquerque and can be explained by the relative newness of the service.
High Costs per Passenger: Tri-Rail and SunRail both have high costs per passenger ($21.22 and $34.28, respectively) compared to the peer group median of $13.62. Metro Transit in Minneapolis and Rio Metro in Albuquerque are similar in costs per passenger ($23.45 and $33.78).

FINAL REPORT | Florida Passenger Rail System Study Client Ref: RFP Number 917
| 10
Tri-Rail-Specific: Low number of passengers per car per hour. A low average of 34 passengers per car per hour is second-lowest in its peer group. Rio Metro in Albuquerque has the lowest number of passengers per car per hour of 24.1. Because Tri-Rail runs relatively short trains already, reducing the number of cars will not have a positive impact on this metric. Instead, Tri-Rail should focus on building its ridership.
SunRail-Specific: High Cost per Passenger-Mile. While Tri-Rail has a cost per passenger-mile ($0.77) that is more in line with the peer group median of $0.51, SunRail has the highest cost per passenger-mile out of the group at $2.38. Because SunRail’s fixed costs are amortized over a small number of passengers, this results in a relatively high cost per passenger-mile. As ridership increases, it is expected that this metric will improve.
SunRail-Specific: High Cost per Car per Hour. SunRail’s cost per car-hour of $1,525 is the highest in its peer group. Metro Transit in Minneapolis has the second highest cost per hour at $1,222. This number can be explained by the relatively short trains that SunRail runs, which does not allow it to amortize its short-term fixed operating costs (engineer, conductor(s) and fuel costs) over a larger number of cars.
Figure 2-6 provides an analysis of these metrics for each line. Green cells represent values that are within the top 33.3 percentile of the group for each column, white cells represent values that are in the middle 33.3 percentile of the group for each column, and red cells represent values that are in the bottom 33.4 percentile of the group for each column.
Figure 2-6: Commuter Rail Operating Statistics Comparison (2016)
Name Fare Revenues Per Unlinked
Passenger Trip
Farebox Recovery
Ratio
Cost Per Car Per Service Hour
Average Passengers Per
Car Per Hour
Cost Per Passenger
Cost Per Passenger
Mile
↑ = better ↑= better ↓= better ↑= better ↓ = better ↓ = better
Tri-Rail $3.09 15% $722 34 $21.22 $0.77
SunRail $2.17 6% $1,525 45 $34.28 $2.38
ACE $6.63 49% $621 46 $13.47 $0.31
Caltrain $4.85 79% $549 90 $6.11 $0.23
Coaster $4.42 41% $483 45 $10.76 $0.38
Metro Transit $3.18 14% $1,222 52 $23.45 $0.95
Metrolink $6.14 39% $609 39 $15.85 $0.51
Rio Metro $2.60 8% $814 24 $33.78 $0.75
RTD $1.31 12% $620 57 $10.82 $1.12
Sounder $3.15 31% $749 73 $10.30 $0.42
TRE $4.31 32% $564 41 $13.62 $0.69
VRE $8.66 54% $975 61 $16.05 $0.48
Average $4.59 35% $860 55 $19.06 $0.82
Median $3.75 31.5% $672 46 $13.62 $0.51
Legend: For each column, Green - best 33⅓ percentile, white - middle 33⅓ percentile, red - worst 333⅓ percentile of compared systems. Source: FTA 2016 Transit Metrics

FINAL REPORT | Florida Passenger Rail System Study Client Ref: RFP Number 917
| 11
Conclusions on the Existing Rail System
In the last 30 years, commuter and intercity passenger rail has made a comeback in Florida, with four current operators. This includes two commuter lines (Tri-Rail and SunRail), a long-standing intercity passenger operator (Amtrak) and a new intercity passenger train operator (Brightline), the first private passenger railroad to open in many decades. Both SunRail and Brightline are relatively new rail services, opening in 2015 and 2018 respectively.
The state’s rail system continues to evolve: SunRail, Brightline, and Tri-Rail all have active rail expansion projects. Additionally, Orange Blossom Express and First Coast Commuter Rail are two proposed commuter lines, which currently lack funding for implementation.
Both commuter rail operators require subsidies for their operations that are high compared to their peers elsewhere around the country. Subsidy levels are typically determined by passenger fares, ridership levels, and operational costs.
Having assessed financial and operating performance in this chapter, the next chapter evaluates the safety performance record for Florida’s commuter and intercity passenger rail system.

FINAL REPORT | Florida Passenger Rail System Study Client Ref: RFP Number 917
| 12
3Florida Rail Safety Record Introduction
This chapter assesses Florida’s safety record by measuring the number of severe injuries and fatalities passenger railroads experienced, normalized by the number of train miles, between January 2009 and June 2018. This chapter also includes an analysis of the nationwide passenger safety record, an analysis of the passenger safety record for individual railroads in Florida, and an analysis of grade crossing incidents in Florida. A classification table of all types of severe injuries is found in Appendix D, the top 50 Florida crossings by incident count is provided in Appendix E, and overall US rail safety trends are presented in Appendix F.
Methodology for Evaluating Florida’s Rail Safety Record
The analysis of the Florida safety record, as presented in this chapter, focuses on Florida passenger rail services: Amtrak in Florida, Brightline, SunRail, and Tri-Rail. Intercity and commuter systems were analyzed separately due to the different nature of their operations. The comparison for Amtrak in Florida and Brightline included other inter-city systems, including Amtrak service outside Florida and the Alaska Railroad Corporation.
SunRail and Tri-Rail were compared with the commuter systems identified previously in Figure 2-4. While these commuter rail services can be considered peers of Tri-Rail and SunRail, each has unique attributes. While it is difficult to identify comparable commuter rail systems, this safety assessment examines Metrolink and Caltrain, operating in the Los Angeles and San Francisco Bay Areas, respectively. These two systems may be the most comparable due to line profiles, urban density, a high number of grade crossings (on portions of the networks), and similar operating characteristics.
The primary data sources used in this analysis are the Federal Railroad Administration (FRA) railroad casualty database (compiled using the FRA form 6180.55a) and the highway-rail incident database (compiled using the FRA form 6180.57). FRA data spanned the period between January 2009 and June 2018 (the most recent month available).
To provide a common basis for comparison between systems and geographic areas, casualty counts were normalized by passenger train miles, calculated from the operational data as reported by individual railroads. Since operational data is reported by the operator and not by state, passenger train miles for Amtrak’s Florida portion of the Silver-Star, Silver Meteor, and Auto-train services were calculated manually.11 It was assumed that Amtrak services have
11 The length of the lines was calculated in GIS, multiplied by the number of daily round trips (1 per day per service), and per number of non-holiday days per year.

FINAL REPORT | Florida Passenger Rail System Study Client Ref: RFP Number 917
| 13
remained constant over the past 10 years, and so current totals were used for each year of the study period.
Next, casualties were classified as either severe or non-severe based on the event circumstance attribute included in the railroad casualties dataset.12 Casualties were also classified as either within or outside railroad control based on the probable cause.13 These codes and classifications assigned to them are included in Appendix D. Non-severe casualties are excluded from this analysis.
Assessing Data Availability and Quality
The Federal Railroad Administration (FRA)’s safety database represents a complete collection of data for every reportable incident. The data is reported on a monthly basis by U.S. railroads to the FRA. There is a two-month processing time before incidents are reported in the database, and this data is updated frequently to reflect new knowledge.
All incidents that result in a death, injury, or financial damage of $25,000 or higher trigger a mandatory report to the FRA. Railroads can provide preemptive reports even if these criteria are not met, which may then be amended or canceled, once the circumstances of the incident become known.
The FRA defines accidents/incidents as:
“Collisions, derailments, and other events involving the operation of on-track equipment and causing reportable damage above an established threshold; impacts between railroad on-track equipment and highway users at crossings; and all other incidents or exposures that cause a fatality or injury to any person, or an occupational illness to a railroad employee.”
These incidents are reported as:
Train Accidents: A safety-related event involving on-track rail equipment (both standing and moving), causing monetary damage to the rail equipment and track above $25,000.
Highway-rail grade crossing incidents: Any impact between a rail and highway user (both motor vehicles and other users of the crossing) at a designated crossing site, including walkways, sidewalks, etc., associated with the crossing.
Other incidents that do not fit in the two above-mentioned categories, resulting in any death, injury to any person that requires medical treatment, or occupational illness or injury of a railroad employee.14 This category includes incidents involving persons trespassing on the railroad right-of-way, but not within a crossing.
12 FRA “EVENT” variable. 13 FRA “INJCAUS” variable. 14 FRA Office of Safety Analysis Definitions

FINAL REPORT | Florida Passenger Rail System Study Client Ref: RFP Number 917
| 14
All railroad incidents, injuries, and fatalities are required to be reported by law. FRA incident databases provide substantial detail on reported incidents, allowing for a comprehensive safety analysis of the state’s rail system. The Florida Department of Transportation (FDOT) relies only on the FRA database for safety data to provide a common basis for incident reporting and to ensure that all reportable incidents are captured.
FRA’s safety database is less detailed for the most recent two years, as each case goes through an investigation before the probable cause is determined. Probable cause is initially self-reported by the railroad, but even after an investigation, it can be difficult to determine the precise cause of an accident. As a result, detailed 2017 and 2018 data are not as comprehensive until after the investigation for each incident is complete and these data are updated. For example, while basic information on the 2018 incidents occurring on the Brightline system is present in the database, incident causes may not have been determined as of this writing.
Rail suicide incidents tend to be reported as trespass incidents rather than as suicides, due to reporting sensitivities.15 FDOT is working with the FRA and Operation Lifesaver to document incidents and support outreach to railroads, local communities, and the public to encourage more responsible reporting practices between trespassing and suicide incidents.
FRA’s database also provides details of grade crossing infrastructure inventory, such as the gate configuration, warning system, and so on. However, many of these fields are not mandatory for reporting purposes. Our analysis includes statistics for the crossing attributes that are reported frequently and excludes those where most Florida incident cases leave the characteristic field blank.
The database used for this analysis is comprehensive and provides a record of all significant incidents. However, the cause of the incident is not always clear, especially for more recent incidents, due to ongoing investigations.
Overview of Florida’s Safety Record Analysis
Between January 2009 and June 2018, Florida passenger railroads experienced a total of 1,395 safety incidents. Among these, 677 safety incidents (49 percent of the total) involved severe injuries and fatalities. There were 1,317 severe injuries (approximately 2 severe injuries per incident) and 137 fatalities over this time period. These numbers include serious injuries and fatalities among passengers, non-passengers, and railroad employees.
Figure 3-1 shows what defines the injury rate, the fatality rate, and the overall casualty rate. This report excludes non-severe injuries.16
15 USDOT Volpe Center Rail Suicide Prevention 16 Classification of severe injuries is located in Appendix D.

FINAL REPORT | Florida Passenger Rail System Study Client Ref: RFP Number 917
| 15
Figure 3-1: Terminology Definitions
Term Definition
Injury Rate Severe injuries (passengers, non-passengers and employees) per 10,000 passenger train miles
Fatality Rate Fatalities (passengers, non-passengers and employees) per 10,000 passenger train miles
Casualty Rate Severe Injuries and fatalities (passengers, non-passengers and employees) per 10,000 passenger train miles
Source: Federal Railroad Administration (FRA)
This safety analysis compares severe injuries and fatalities in Florida and the United States by using the number of passenger train miles for standardization. Based on this approach, Florida’s injury rate is 1.5 times higher and its fatality rate is 3.5 times higher than the overall nationwide rate. Fatalities include suicides, though the classification of deaths as suicides tends to be underreported.17
Figure 3-2 shows casualty rates for each Florida passenger rail line. Amtrak in Florida and Brightline are compared with the US intercity average casualty rate (Amtrak and Alaska Railroad Corporation) while Tri-Rail and Sun-Rail are compared with the commuter rail peer group average, as seen in Figure 3-3.
Figure 3-2: Casualty Rates in Florida (January 2009 – June 2018)
Rail Service Average Annual
Casualty Rate US Intercity Average Annual Casualty Rate
Commuter Peer Group Average Annual Casualty Rate
Amtrak (in Florida) 0.66 0.30
Brightline 0.57 0.30
Tri-Rail 0.15 0.12
SunRail 0.24 0.12
Source: CPCS analysis of FRA data
Figure 3-3: Commuter Rail Peer Group (January 2009 – June 2018)
Rail Service Code Agency Average Annual
Casualty Rate Location
Tri-Rail SFRV South Florida Regional Transportation Authority 0.15 Pompano Beach, FL
SunRail CFRC Central Florida Commuter Rail 0.24 Sanford, FL
ACE ACEX Altamont Corridor Express 0.12 Stockton, CA
Caltrain PCMZ Peninsula Corridor Joint Powers Board 0.11 San Carlos, CA
Coaster NCTC North County Transit District 0.12 Oceanside, CA
Metrolink SCAX So. California Regional Rail Authority 0.15 Los Angeles, CA
Metro Transit MRTV Metro Transit N/A* Minneapolis, MN
Rio Metro NMRX Rail Runner Express (Rio Metro Regional Transit District)
0.05 Albuquerque, NM
Sounder SCR Sound Transit (Central Puget Sound Regional Transit Authority)
0.04 Seattle, WA
TRE TRE Trinity Railway Express (Dallas Area Rapid Transit) 0.07 Dallas, TX
VRE VREX Virginia Railway Express 0.08 Alexandria, VA
Source: CPCS analysis of FRA data, *MRTV FRA records are unavailable and are not included in the commuter rail average casualty rate.
17 Tøllefsen, Ingvild Maria, Erlend Hem, and Øivind Ekeberg. "The reliability of suicide statistics: a systematic review." BMC psychiatry 12.1 (2012): 9.

FINAL REPORT | Florida Passenger Rail System Study Client Ref: RFP Number 917
| 16
Based on the comparisons, we find that
Amtrak’s average annual casualty rate in Florida is 121 percent higher than the rest of the US intercity passenger rail over the last 10 years.
Brightline’s casualty rate during its first six months of operations is 89 percent higher than the rest of the US intercity passenger rail.
Tri-Rail’s annual casualty rate has generally been lower than its US commuter rail peer group until 2014. In 2014, 2016, and 2017, Tri-Rail’s average annual casualty rate was 21 percent higher than its commuter rail peer group.
SunRail’s average annual casualty rate is 96 percent higher than its commuter rail peer group. For both Tri-Rail and SunRail, more casualties were found to be within railroad control when compared to the peer group.
Probable causes of railroad casualties indicate that:
Florida’s casualties arise predominantly from trespassing (27 percent), a rate much higher than the US (19 percent).
Florida suffers fewer casualties from environmental causes (6 percent) than the US (11 percent).
Equipment issues on Florida’s passenger railroads are the probable cause for casualties 9 percent of the time, in line with the rest of the US at 9 percent.
The next sections describe the detailed methodology and an analysis of data availability and quality before providing additional information on Florida’s safety record.
Florida Passenger Rail Accident Inventory
Comparison between Florida and the United States
Casualty rates (combining the number of serious injuries/fatalities) were calculated for both the United States and for Florida per 10,000 passenger train miles to control for track mileage in the state. On average, injury, fatality, and casualty rates for Florida were higher than the nation as a whole. Figure 3-4 provides a comparison of severe injuries/fatalities and passenger train miles.
Figure 3-4: Total Injuries and Fatalities Nationwide and in Florida (January 2009 – June 2018)
Location Injuries Fatalities Total Passenger
Train Miles
Injury Rate Fatality Rate Casualty Rate
Per 10,000 passenger train miles
Florida 1,317 137 19,332,341 0.68 0.07 0.93
Nationwide 41,933 2,072 912,645,372 0.46 0.02 0.48
Source: CPCS Analysis of FRA Safety Data

FINAL REPORT | Florida Passenger Rail System Study Client Ref: RFP Number 917
| 17
By tracking the trends in Florida and nationwide, Figure 3-5 shows how the casualty rate per 10,000 passenger train miles has changed between 2009 and June 2018. Overall, Florida’s casualty rate is nearly double the national casualty rate.
Over the last 10 years, the collective severe injury rate on Florida’s passenger rail system is 1.5 times higher and the fatality rate is 3.5 times higher than national averages.
Figure 3-5: Passenger System Casualty Rate in Florida and the United States (January 2009 – June 2018)
Note: 2018 rates are comparable to other years and only consider incidents in the first 6 months of the year
Source: CPCS Analysis of FRA Safety Data
Casualties Incurred by Train Passengers
This section considers a subset of all casualties that were incurred only by train passengers. Figure 3-6 compares Florida-specific and nationwide casualty rates for passengers, indicating that Florida’s train passenger casualty rate exceeds the US casualty rate. The two fatalities incurred by train passengers in Florida occurred in incidents involving Tri-Rail trains.
Figure 3-6: Florida and US Railroad Train Passenger-Only Casualty Rates (January 2009 – June 2018)
Location Injuries Fatalities Casualty Rate per 10,000 Passenger Train Miles
Florida 326 2 0.17
Nationwide 6,743 53 0.07
Source: FRA Safety Database
Among severe passenger injuries occurring in Florida, between January 2009 and June 2018, Amtrak had the highest number at 270 injuries. None of Brightline’s passengers suffered injuries or deaths during the first six months of operation of the new train service. Figure 3-7 provides
0.0
0.2
0.4
0.6
0.8
1.0
1.2
2009 2010 2011 2012 2013 2014 2015 2016 2017 2018*
Cas
ual
ity
Rat
e p
er1
0,0
00
pas
sen
ger
trai
n-m
iles
Injury Rate US Fatality Rate US Injury Rate Florida Fatality Rate Florida

FINAL REPORT | Florida Passenger Rail System Study Client Ref: RFP Number 917
| 18
a breakdown of rail services that incurred passenger injuries, up to June 2018, the most recent date with available data.
Figure 3-7: Florida Railroad Passenger Injuries by Passenger Rail Service (January 2009 – June 2018)
Source: FRA Safety Database
Florida Railroad Casualty Rates by Rail Service
This section compares casualty rates by each of the four passenger rail services in Florida. Brightline and Amtrak are compared to the US intercity average, while SunRail and Tri-Rail are compared with the commuter peer group average.
Intercity Services (Amtrak and Brightline)
Figure 3-8 compares casualty rates for Amtrak in Florida with intercity systems in the U.S. (Amtrak and Alaska Railroad Corporation). During the last decade, the casualty rate per 10,000 passenger train-miles was higher in Florida than nationwide, though year-to-date in 2018, the two rates are comparable.
Figure 3-8: Amtrak Florida Compared with US Intercity Systems Casualty Rate (January 2009 – June 2018)
Note: 2018 rates are comparable to other years and only consider incidents in the first 6 months of the year
Source: CPCS Analysis of FRA Safety Data
Amtrak, 270 injuries
83%
Tri-Rail, 50 injuries
15%
SunRail, 6 injuries2%
0.0
0.2
0.4
0.6
0.8
1.0
1.2
2009 2010 2011 2012 2013 2014 2015 2016 2017 2018
Cas
ual
ty R
ate
per
1
0,0
00
pas
sen
ger
trai
n m
iles
Amtrak (Florida) Intercity Total

FINAL REPORT | Florida Passenger Rail System Study Client Ref: RFP Number 917
| 19
Amtrak’s average annual casualty rate in Florida is 121 percent higher than the rest of the US intercity passenger rail over the last 10 years. This may be attributable to higher traffic and population density in Florida when compared to other regions of the US, where intercity passenger rail services are available.
Figure 3-9 focuses on the subset of casualties found to be within railroad control, as defined by the FRA. Within railroad control means any cause within the railroad’s control, including
issues with infrastructure condition;
issues with signals and communication;
mechanical and electrical failures; and
train operation issues, including problems caused by human factors.
Amtrak has a higher casualty rate in Florida due to a higher proportion of incidents that are within the railroad’s control. Over the last 10 years, Amtrak in Florida had a casualty rate that was 139 percent higher than the US intercity passenger rail average.
Figure 3-9: Amtrak Florida Compared with US Intercity Systems: Casualty Rate within Railroad Control (January 2009 – June 2018)
Note: 2018 rates are comparable to other years and only consider incidents in the first 6 months of the year
Source: CPCS Analysis of FRA Safety Data
For the first half of 2018, Brightline’s casualty rate per 10,000 passenger train miles was approximately 0.57 with a total of 10 severe casualties. This is higher than the nationwide casualty rate of 0.32 but lower than the rate for Amtrak in Florida of 0.66 casualties per 10,000 passenger train miles.
Brightline’s casualty rate within the railroad’s control is 0.06 casualties per 10,000 passenger train miles, which is much lower than the rate for Amtrak in Florida, which stood at 0.47 casualties per 10,000 passenger train miles. Details of some cases are not yet available.
0.0
0.2
0.4
0.6
0.8
1.0
1.2
2009 2010 2011 2012 2013 2014 2015 2016 2017 2018
Cas
ual
ty R
ate
per
1
0,0
00
pas
sen
ger
trai
n m
iles
Amtrak (Florida) Intercity Total

FINAL REPORT | Florida Passenger Rail System Study Client Ref: RFP Number 917
| 20
Commuter Rail (SunRail and Tri-Rail)
Next, the analysis considered commuter rail casualty rate trends for SunRail and Tri-Rail and measured them against their peer group in the US. Figure 3-10 compares SunRail and Tri-Rail in Florida to their peer group in the US. Figure 3-11 focuses on the subset of casualties found to be within railroad control, as defined by the FRA.
Tri-Rail’s casualty rates were lower than its peer group up until 2014. Between 2014 and 2017, Tri-Rail’s casualty rates increased significantly from less than 0.1 to 0.4 casualties per 10,000 passenger train miles in 2016. Tri-Rail casualties increased primarily due to casualties outside of the railroad’s control – the vast majority of the increase in casualties between 2014 and 2017 are due to an uptick in trespassing.
SunRail has generally experienced higher casualty rates compared to the commuter peer group. SunRail had a high of 0.6 casualties per 10,000 passenger train miles in 2017. There is not an obvious explanation for the higher casualty rate. The high rate may be explained by the number of grade crossings and the volume of traffic over these crossings. It may also be explained by the fact that those that are living or working near the line may not be used to the presence of trains. SunRail should continue to monitor the incident trends as they are currently doing, and identify any patterns that may emerge over time.
Figure 3-10: SunRail and Tri-Rail Compared to Commuter Peer Group – Casualty Rate (January 2009 – June 2018)
Note: 2018 rates are comparable to other years and only consider incidents in the first 6 months of the year
Source: CPCS Analysis of FRA Safety Data
0.0
0.2
0.4
0.6
0.8
1.0
1.2
2009 2010 2011 2012 2013 2014 2015 2016 2017 2018
Cas
ual
ty R
ates
per
1
0,0
00
pas
sen
ger
trai
n m
iles
SunRail Tri-Rail Commuter Total

FINAL REPORT | Florida Passenger Rail System Study Client Ref: RFP Number 917
| 21
Figure 3-11: SunRail and Tri-Rail Compared to Commuter Peer Group – Casualty Rate within Railroad Control (January 2009 – June 2018)
Note: 2018 rates are comparable to other years and only consider incidents in the first 6 months of the year
Source: CPCS Analysis of FRA Safety Data
Probable Causes of Florida Passenger Rail Incidents
Between January 2009 and June 2018, the cause of 54 percent of incidents in Florida was identified as “undefined.” It is thus difficult to fully track the causes of railroad incidents due to incomplete reporting. Of the remaining 46 percent of Florida incidents where a probable cause was determined, 35 percent of incidents were found to be outside the railroad’s control and 12 percent were within the railroad’s control. During the same period, the cause of 51 percent of incidents nationwide was declared as “undefined.” Of those where a probable cause could be determined, 33 percent of incidents were outside the railroad’s control, and 16 percent were within the railroad’s control.
The most frequent probable causes for incidents in Florida and the entire nation are as follows.
Trespassing: Florida 27 percent, nationwide 19 percent (outside of railroad control)
Equipment: Florida 9 percent, nationwide 9 percent (within railroad control)
Environmental: Florida 6 percent, nationwide 11 percent (outside of railroad control)
Figure 3-12 provides a list of probable causes for incidents in Florida. A full list of probable incident causes can be found in Appendix F. Incidents by passenger rail service (Amtrak, Brightline, SunRail, and Tri-Rail) are also provided for Florida.
0.0
0.2
0.4
0.6
0.8
1.0
1.2
2009 2010 2011 2012 2013 2014 2015 2016 2017 2018
Cas
ual
ty R
ate
per
1
0,0
00
pas
sen
ger
trai
n m
iles
SunRail Tri-Rail Commuter Total

FINAL REPORT | Florida Passenger Rail System Study Client Ref: RFP Number 917
| 22
Figure 3-12: Probable Cause of Florida Passenger Railroad Incidents (January 2009 – June 2018)
Probable Cause FL Total % of Total
Amtrak
(Florida) Brightline SunRail Tri-Rail
Outside Railroad Control 196 34.8% 107 10 15 64
Trespassing 154 27.3% 76 10 9 59
Environmental 34 6.0% 31 2 1
Trespassing, unrelated to using RCL* 3 0.5% 1 2
Object fouling track 3 0.5% 2 1
Outside cause (e.g., assault/attack) 1 0.2% 1
Outside cause (e.g. assault/attack), related to using RCL*
1 0.2% 1
Within Railroad Control 65 11.5% 50 1 12 2
Equipment 49 8.7% 49
Procedures for operating/using equipment not followed
7 1.2% 1 4 2
Human factor, unrelated to using RCL*
5 0.9% 5
Signal 2 0.4% 2
Failure to provide adequate space between equipment during switching operation
1 0.2% 1
Lack of communication 1 0.2% 1
Undefined 303 53.7% 235 2 15 51
Human factor 233 41.3% 228 1 2 2
Undetermined 70 12.4% 7 1 13 49
*RCL: Remote-controlled Locomotive. Yellow cells are highlighted to show importance. Source: CPCS Analysis of FRA Safety Data
The following observations can be made:
Severe injuries arise predominantly from trespassing: over 27 percent of Florida passenger rail incidents are related to trespassing. This rate is much higher than the US (19 percent), which is partly explained by the higher density urban areas that passenger lines traverse and the higher grade crossing density. Trespassing is the cause of 76.9 percent of incidents on Brightline, while the figure for Tri-Rail is also high at 50.4 percent.
28.6 percent (12 incidents) of the total number of incidents are within the railroad’s control on SunRail whereas, on Tri-Rail, the figure is 1.7 percent (2 incidents).
No railroad, other than Amtrak, has had an equipment-caused incident. Most incidents are outside of railroad control. This may be indicative of the newness of equipment (in some cases) and proper adherence to operating rules.
58.2 percent of Amtrak incidents are classified as an undefined – with human factor involvement, whereas the other railroads range from 15.4 to 43.6 percent.

FINAL REPORT | Florida Passenger Rail System Study Client Ref: RFP Number 917
| 23
The most pressing issue in Florida is the high frequency of trespassing that occurs along passenger railroad tracks, especially when compared to lower frequency in the entire country.
Rail Network Density
Another way to benchmark Florida’s safety record is by examining grade crossing density. Due to a number of factors, Florida has a higher-than-average number of grade crossings. Factors include dense urban areas, existing grade crossings as part of the existing street network, less grade separation due in part to the high water table and limestone topography, among others.
Rail density is the measurement of rail track miles per square mile and encompasses both freight and passenger rail lines. Figure 3-13 shows the top five states by rail density and also includes density for Florida and the US.
Figure 3-13: Top 5 States by Rail Density
Rank State Rail Density*
1 Illinois 0.12
2 Ohio 0.12
3 Indiana 0.12
4 New Jersey 0.11
5 Pennsylvania 0.11
33 Florida 0.04
National Average 0.04
* - rail density is defined as track miles per square mile of land area
Source: CPCS Analysis of 2010 AAR data
While Florida’s rail network density of 0.04 mirrors the national average, its rail corridors tend to operate in densely built-up areas.
States that are most comparable to Florida’s rail network density include North Dakota, Oklahoma, New Hampshire, Washington, Nebraska, and Texas. These states have a rail network density between 0.039 and 0.047 track miles per square mile of land area.
Florida’s rail network density is similar to the rest of the country and does not have a disproportionate number of at-grade crossings for a state its size. However, the number of grade crossings in Florida is significant when accounting for its high population density, compared to the rest of the country.

FINAL REPORT | Florida Passenger Rail System Study Client Ref: RFP Number 917
| 24
Florida Grade Crossing Inventory
This section assesses grade crossings in Florida by the number of incidents incurred. Grade crossing analysis includes both passenger and freight rail operations.
Between January 2009 and June 2018, 35 percent of the crossings along the existing Brightline segment (which is shared with FECR freight trains) had at least one incident. During the same period, 30 percent of crossings along Tri-Rail’s line (which shares track with CSX) and 27 percent of crossings along SunRail’s line (which also shares track with CSX) had at least one incident.18
Figure 3-14 lists grade crossings with at least one incident by passenger rail segment.
Figure 3-14: Grade Crossings by Passenger Rail Line with At Least One Incident (January 2009 to June 2018)
Passenger Rail Segment Freight
Railroad
Total Grade
Crossings
# Crossings with
1+ Incidents
% Crossings with
1+ Incidents
Brightline (existing) FECR 171 59 35%
Tri-Rail CSX 150 45 30%
SunRail (existing) CSX 157 42 27%
Amtrak CSX 791 155 20%
Brightline Extension (proposed, currently FECR only)
FECR 192 22 11%
SunRail Extension (proposed,
currently CSX only) CSX 20 2 10%
Freight Operator: Freight railroad operating in the segment Source: CPCS Analysis of FRA Safety Data
The locations of these grade crossing incidents are illustrated in the maps below. Figure 3-15 is a heat map of grade crossing incidents across the state over the last 10 years, where blue represents a lower concentration of incidents and red represents a higher concentration of incidents. Figure 3-16 provides a close-up map for Central Florida, and Figure 3-17 provides a close-up map for South Florida and a grade crossing incident map of the Florida East Coast Railway along the planned Brightline extension. Each dot represents a railroad crossing where at least one incident was reported between January 2009 and June 2018. The number of incidents at that crossing varies by dot color (from light blue – lower to red – higher). The dots that represent a higher number of incidents (red) are larger in size.
18 Incidents are defined as resulting in at least one severe injury or fatality.

FINAL REPORT | Florida Passenger Rail System Study Client Ref: RFP Number 917
| 25
Figure 3-15: Concentration of Grade Crossing Incidents in the State (January 2009 – June 2018)
Source: CPCS Analysis of FRA Safety Data

FINAL REPORT | Florida Passenger Rail System Study Client Ref: RFP Number 917
| 26
Figure 3-16: Concentration of Grade Crossing Incidents in Central Florida (January 2009 – June 2018)
Source: CPCS Analysis of FRA Safety Data
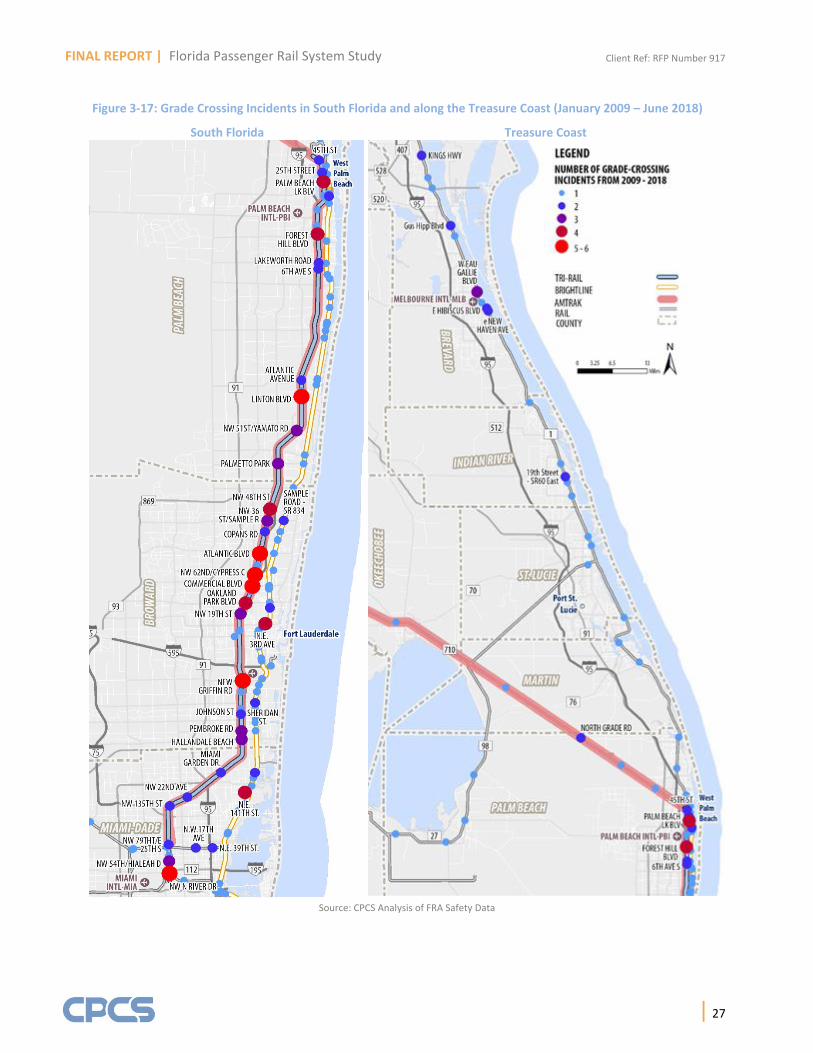
FINAL REPORT | Florida Passenger Rail System Study Client Ref: RFP Number 917
| 27
Figure 3-17: Grade Crossing Incidents in South Florida and along the Treasure Coast (January 2009 – June 2018)
South Florida Treasure Coast
Source: CPCS Analysis of FRA Safety Data

FINAL REPORT | Florida Passenger Rail System Study Client Ref: RFP Number 917
| 28
Importance of Grade Crossings in Densely-Populated Areas
The number of grade crossings by itself provides no meaningful information that could be used to understand the risk exposure. When comparing the number of grade crossings to the population, Florida is not present in the top 10 states. However, this comparison fails to capture the state’s area. Instead of looking only at population, we will compare the number of railroad grade crossings and population density (population per area).
All else being equal, if two states have the same number of grade crossings, the state with a higher population (assuming the population density is the same) is more likely have a higher number of incidents due to higher traffic volumes.
In order to capture these two factors, the study utilizes a grade crossing density index. This index multiplied the number of grade crossings in each state by the population density, to determine how population dense each state’s grade crossings are. The rationale for multiplying the two numbers is to show the states with both a high number of rail crossings and high population density. The higher the index, the more traffic each grade crossing is likely to experience.
𝐺𝑟𝑎𝑑𝑒 𝐶𝑟𝑜𝑠𝑠𝑖𝑛𝑔 𝐷𝑒𝑛𝑠𝑖𝑡𝑦 𝐼𝑛𝑑𝑒𝑥 = 𝑛𝑢𝑚𝑏𝑒𝑟 𝑜𝑓 𝑔𝑟𝑎𝑑𝑒 𝑐𝑟𝑜𝑠𝑠𝑖𝑛𝑔𝑠 × 𝑝𝑜𝑝𝑢𝑙𝑎𝑡𝑖𝑜𝑛 𝑑𝑒𝑛𝑠𝑖𝑡𝑦
1 000 000,
where population density is measured as average population per square mile.
When calculating this index for Florida (the 10th densest state by population in the country), it ranks 8th for this index as shown in Figure 3-18. This means that Florida has both high population density and a high number of grade crossings compared to other states, which may increase the probability of having a larger number of grade crossing incidents.
Figure 3-18: Top States in Grade Crossings x Population Density
Rank State Grade Crossing
count
Population Density
(Population per sq. mi.)
Grade Crossing
Density Index*
1 Illinois 26,006 225 5.85
2 Ohio 20,281 280 5.67
3 New Jersey 5,007 1036 5.19
4 Pennsylvania 16,858 277 4.68
5 New York 12,728 359 4.57
6 California 18,149 242 4.39
7 Indiana 16,715 185 3.10
8 Florida 9,577 311 2.98
9 Texas 27,032 103 2.78
10 North Carolina 12,638 191 2.41
*Grade crossing density index = number of grade crossings × population density / 1 million
Source: CPCS Analysis of FRA Safety Database (as of Sep 2018)

FINAL REPORT | Florida Passenger Rail System Study Client Ref: RFP Number 917
| 29
Grade Crossing Incident Distribution
All 9,511 grade crossings in Florida were ordered by number of incidents as well as by number of casualties. The distribution of grade-crossings in Florida by number of incidents incurred is shown in Figure 3-19.
Figure 3-19: Distribution of Grade Crossings (January 2009 – June 2018)
Incident Count Number of Crossings
0 9,005
1 393
2 69
3 24
4 11
5 7
6 2
Total 9,511
Source: CPCS Analysis of FRA Safety Data
Over the last 10 years, about 5 percent of Florida grade crossings incurred incident(s) with a severe injury or fatality.
Along the Tri-Rail line in South Florida, there are seven crossings that ranked in the top 11 for the number of incidents. Five of these are in Broward County, one is in Palm Beach County and another in Miami-Dade County. Along the SunRail line, one crossing in Seminole County ranked within the top 11. Along the Amtrak routes, two crossings ranked within the top 11, one in Hillsborough County and another in Duval County. One additional crossing along Brightline in Broward County had a large number of incidents and was also examined.
A summary table of the crossings analyzed is included below in Figure 3-20.
Figure 3-20: Top-11 Grade Crossings in Florida by Number of Incidents (January 2009 – June 2018)
Crossing ID Rank Street Highway County Incidents Fatalities Injuries Main Causes
628177F 1 Atlantic Blvd. SR 814 Broward 6 2 1 Trespassers
620891F 2 Timuquana Rd. SR 134 Duval 6 1 0 Trespassers
628183J 3 NW 62nd/Cypress CR Broward 5 3 8 Trespassers
628160C 4 Linton Blvd. SR 782 Palm Beach 5 3 7 Trespassers
624365G 5 Tampa East Blvd. LS Hillsborough 5 0 4 Trespassers
628186E 6 Commercial Blvd. SR 870 Broward 5 2 2 Trespassers
628272B 7 New Griffin Rd. SR 818 Broward 5 2 1 Trespassers
628378W 8 NW N River Dr. LS Miami-Dade 5 0 3 Trespassers
622072W 9 CR 427 CR 427 Seminole 5 0 1 Trespassers
628191B 10 Oakland Park Blvd. SR 816 Broward 4 1 3 Trespassers / Employee Inattentiveness
272550B 11 NE 3rd Ave. 0 Broward 4 1 2 Trespassers / Vehicles stuck on tracks
Source: CPCS Analysis of FRA Safety Data

FINAL REPORT | Florida Passenger Rail System Study Client Ref: RFP Number 917
| 30
Top 11 Crossings with Highest Number of Incidents
This section details Florida’s top 11 crossings with the highest number of incidents.
Broward County:
1. Atlantic Boulevard (Rank 1)
The incidents at the Atlantic Boulevard crossing occurred between 2009 and 2017. One incident resulted in two fatalities and another in a severe injury. Based on the narratives included in the FRA database, all incidents involved a highway vehicle collision with a train and were due to improper maneuvers by road users (i.e. failure to stop at a crossing, stopped vehicle fouling mainline). One incident that occurred in 2017 was due to the driver attempting to beat the train to the crossing, resulting in death to both the driver and passenger. Another incident that resulted in a severe injury was caused by a stopped vehicle fouling the mainline.
The type of safety devices at the Atlantic Boulevard crossing include a W10-1 advanced warning sign as shown in Figure 3-21, 4 gates, 2 bells, and an Emergency Notification System (ENS) sign19. Pavement markings at this crossing include Stop Lines and Railroad Crossing (RR Xing) Symbols. The highway has nearby traffic signals but these are not integrated with the crossing protection.
2. Commercial Blvd (Rank 6)
Five incidents occurred at the Commercial Blvd crossing, all of them prior to 2013. One incident resulted in two fatalities and a severe injury and another incident resulted in a non-severe injury. The severe incident involved an improper manoeuver by a driver who crossed the tracks as the crossing arm was lowering. The vehicle was struck by a train, killing both the driver and passenger. The driver of a third affected vehicle also sustained severe injuries. The non-severe injury was sustained by a trespasser who claims they were struck by a train. Other incidents involved a vehicle mistakenly turning onto the railroad tracks and another stopping inside the gates when they were down.
The type of safety devices at the Commercial Blvd crossing include a W10-1 advanced warning system, 4 gates, 2 bells, and an ENS Sign. Pavement markings at this crossing include Stop Lines and Railroad Crossing (“RR Xing”) Symbols. The highway has nearby traffic signals but these are not integrated with the crossing protection.
19 A sign noting a phone number of where problems with crossing can be reported.
W10-1 Advanced Warning Sign
A W10-1 Sign is a railroad crossing advance warning sign shown as a round
yellow sign with a black border and legend. A black “X” covers the sign and
two “R’s” are shown in the left and right
quadrants of the sign.
Figure 3-21: Example of a W10-1 Railroad Crossing Advanced Warning Sign

FINAL REPORT | Florida Passenger Rail System Study Client Ref: RFP Number 917
| 31
3. NW 62nd Street/Cypress C (Rank 3)
Five incidents occurred at the NW 62nd Street crossing, resulting in three fatalities and 8 injuries. All three fatalities resulted from roadway users circumventing the downed gates, two of whom were cyclists while the third was driving a vehicle. Another incident was caused by a vehicle collision with a train, resulting in 5 injuries. The last incident was caused by a driver striking the side of a locomotive. The driver sustained no injuries, although 3 train passengers later reported injuries due to the crash.
The type of safety devices at the Cypress Creek crossing include a W10-1 advanced warning system, 4 gates, 4 bells, and ENS Sign. Pavement markings at this crossing include Stop Lines and Railroad Crossing (RR Xing) Symbols. The highway has nearby traffic signals but these are not integrated with the crossing protection.
4. New Griffin Road (Rank 7)
Five incidents occurred at New Griffin Rd crossing in the past 10 years. These occurred between 2011 and 2018. The incidents resulted in two fatalities and one injury. Both fatalities resulted from trespassers being struck by trains, one of whom went around a lowered crossing gate. Another injury was sustained by a trespasser crossing the tracks while the train was pulling out of the station. The engineer sounded the horn but the trespasser did not move away in time. The other two incidents involved an abandoned vehicle fouling the tracks and another involved a bicycle tire being struck by a train, neither has any reported injuries.
The type of safety devices at the Cypress Creek crossing include a W10-1 advanced warning system, 7 gates, 3 bells, and an ENS Sign. Pavement markings at this crossing include Stop Lines and Railroad Crossing (RR Xing) Symbols. The highway has nearby traffic signals but these are not integrated with the crossing protection.
5. Oakland Park Boulevard (Rank 10)
There were four incidents at this crossing within the past 10 years. These resulted in three injuries and one fatality. Two incidents involved railroad employees, one of whom drove through the gates due to inattentiveness and struck an unoccupied vehicle, the other employee was stuck behind the gates and was struck by a train, sustaining injuries. The other two incidents involved train-vehicle collisions, one of which resulted in a fatality.
The type of safety devices at the Oakland Park Boulevard crossing include a W10-1 advanced warning system, 4 gates, 2 bells, and 5 crossbucks. Pavement markings at this crossing include Stop Lines and Railroad Crossing (RR Xing) Symbols. The highway has nearby traffic signals but these are not integrated with the crossing protection. There are six traffic lanes crossing the railroad.
6. NE 3rd Avenue (Rank 11)
Four incidents occurred at the NE 3rd Avenue crossing, resulting in two injuries and 1 fatality. These occurred between 2013 and 2018. Two incidents resulted from vehicles getting stuck on

FINAL REPORT | Florida Passenger Rail System Study Client Ref: RFP Number 917
| 32
the tracks. The other two incidents resulted from a bicycle trespasser and another from a pedestrian trespasser who was lying on the tracks and failed to move as the train approached.
The type of safety devices at the NE 3rd Avenue crossing include a W10-1 advanced warning system, 2 gates, 1 bell, and 2 crossbucks. Pavement markings at this crossing include Stop Lines and Railroad Crossing (RR Xing) Symbols. The highway has nearby traffic signals but these are not integrated with the crossing protection. There are four traffic lanes crossing the railroad.
Palm Beach County:
7. Linton Boulevard (Rank 4)
Five incidents occurred at Linton Boulevard crossing in the past 10 years, all of them before 2015. These incidents resulted in 3 fatalities and 7 injuries. The three fatalities were caused by highway vehicle operators driving through the crossing gate. The impact of one of these incidents resulted in 7 additional injuries to passengers. The other two incidents were caused by vehicles either stopped on the tracks or fouling the mainline.
The type of safety devices at the Linton Boulevard crossing include a W10-1 advanced warning system, 6 gates, 2 bells, and an ENS Sign. Pavement markings at this crossing include Stop Lines and Railroad Crossing (RR Xing) Symbols. The highway has nearby traffic signals but these are not integrated with the crossing protection.
Miami-Dade County:
8. NW North River Drive (Rank 8)
Five incidents occurred at this crossing within the past 10 years. These occurred from 2010 to 2016. These incidents resulted in three injuries. Four incidents involved trespassing vehicles, three of which resulted in injuries. The fourth incident involved a truck pulling out of a nearby industrial facility.
The type of safety devices at the NW N River Drive crossing include a W10-1 advanced warning system, 2 gates, 1 bell, 2 crossbucks, and an ENS Sign. Pavement markings at this crossing include Stop Lines and Railroad Crossing (RR Xing) Symbols. The highway has nearby traffic signals but these are not integrated with the crossing protection.
Seminole County:
9. County Road 427 (Rank 9)
Five incidents occurred at this crossing within the past 10 years, resulting in one injury. The incidents were caused mainly by vehicles fouling the track. The injury was sustained by a trespasser cyclist who was struck by a vehicle.
The type of safety devices at the County Road 427 crossing include a W10-1 advanced warning system, 4 gates, 2 bells, 4 crossbucks, and an ENS Sign. Pavement markings at this crossing include Stop Lines and Railroad Crossing (RR Xing) Symbols. The highway has nearby traffic

FINAL REPORT | Florida Passenger Rail System Study Client Ref: RFP Number 917
| 33
signals but these are not integrated with the crossing protection. There are 4 road lanes intersecting the crossing.
Hillsborough County:
10. Tampa East Boulevard (Rank 5)
There were five incidents at this crossing within the past 10 years, resulting in 4 injuries. These were all due to vehicle trespassers. One incident involved a tanker-truck being towed by a tow truck.
The type of safety devices at the Tampa East Boulevard crossing include a W10-1 advanced warning system, 2 gates, 1 bell, no crossbucks, and an ENS Sign. The road across the railroad track has no median. Pavement markings at this crossing include Stop Lines and Railroad Crossing (RR Xing) Symbols. The highway has nearby traffic signals but these are not integrated with the crossing protection. There are 2 road lanes intersecting the crossing.
Duval County:
11. Timuquana Road (Rank 2)
There were six incidents at this crossing within the past 10 years, resulting in 1 injury. Four of these were caused by vehicle trespassers, and two others were caused by unoccupied vehicles fouling tracks.
The type of safety devices at the Timuquana Road crossing include a W10-1 and W10-2 advanced warning system, 4 gates, 2 bells, no crossbucks, and an ENS Sign. The road across the railroad track has no median. Pavement markings at this crossing include Stop Lines and Railroad Crossing (RR Xing) Symbols. The highway has traffic signals, which control the crossing. There are 6 road lanes intersecting the crossing. This is at a non-NHS Federal-Aid highway.
More information on the top 50 Florida crossings by incident count is provided in Appendix E.
Grade Crossing Characteristics
This section analyzes the characteristics of all Florida grade crossings by the number of incidents they have incurred over the last 10 years. Figure 3-22 provides transportation characteristics for this set of grade crossings.
Figure 3-22: Transportation Characteristics by Grade Crossing Incidents (January 2009 – June 2018)
Number of Incidents at crossing
Annual Average Daily Traffic (AADT)
Average Trains Avg. School Buses Per Day Per day Per night
0 14,660 2.1 1.7 4.7
1 15,023 6.7 5.3 15.1
2 18,779 11.0 8.1 19.2
3 22,623 13.5 8.3 30.6
4 27,390 17.2 10.8 19.5
5 32,842 23.0 12.1 37.0
6 37,900 20.0 10.0 70.5
Source: CPCS Analysis of FRA Safety Data & FDOT 2017 AADT values
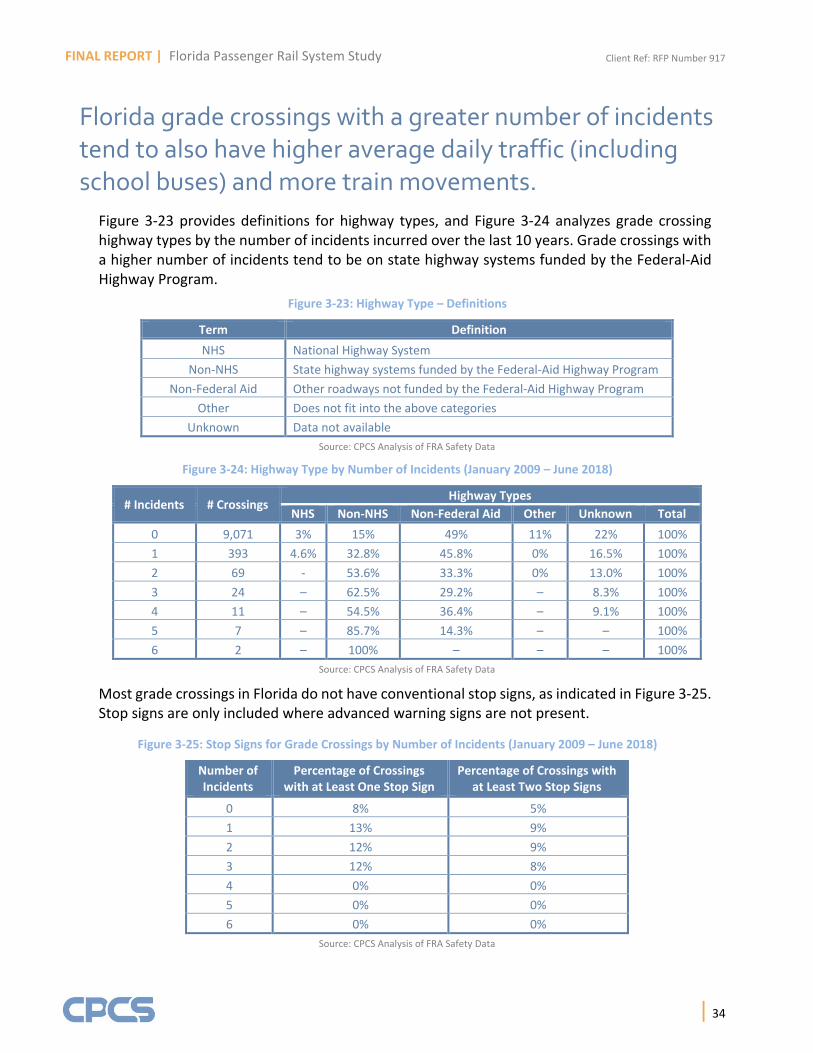
FINAL REPORT | Florida Passenger Rail System Study Client Ref: RFP Number 917
| 34
Florida grade crossings with a greater number of incidents tend to also have higher average daily traffic (including school buses) and more train movements.
Figure 3-23 provides definitions for highway types, and Figure 3-24 analyzes grade crossing highway types by the number of incidents incurred over the last 10 years. Grade crossings with a higher number of incidents tend to be on state highway systems funded by the Federal-Aid Highway Program.
Figure 3-23: Highway Type – Definitions
Term Definition
NHS National Highway System
Non-NHS State highway systems funded by the Federal-Aid Highway Program
Non-Federal Aid Other roadways not funded by the Federal-Aid Highway Program
Other Does not fit into the above categories
Unknown Data not available
Source: CPCS Analysis of FRA Safety Data
Figure 3-24: Highway Type by Number of Incidents (January 2009 – June 2018)
# Incidents # Crossings Highway Types
NHS Non-NHS Non-Federal Aid Other Unknown Total
0 9,071 3% 15% 49% 11% 22% 100%
1 393 4.6% 32.8% 45.8% 0% 16.5% 100%
2 69 - 53.6% 33.3% 0% 13.0% 100%
3 24 – 62.5% 29.2% – 8.3% 100%
4 11 – 54.5% 36.4% – 9.1% 100%
5 7 – 85.7% 14.3% – – 100%
6 2 – 100% – – – 100%
Source: CPCS Analysis of FRA Safety Data
Most grade crossings in Florida do not have conventional stop signs, as indicated in Figure 3-25. Stop signs are only included where advanced warning signs are not present.
Figure 3-25: Stop Signs for Grade Crossings by Number of Incidents (January 2009 – June 2018)
Number of Incidents
Percentage of Crossings with at Least One Stop Sign
Percentage of Crossings with at Least Two Stop Signs
0 8% 5%
1 13% 9%
2 12% 9%
3 12% 8%
4 0% 0%
5 0% 0%
6 0% 0%
Source: CPCS Analysis of FRA Safety Data

FINAL REPORT | Florida Passenger Rail System Study Client Ref: RFP Number 917
| 35
Many grade crossings in Florida are marked by other types of advanced warning signs, shown in Figure 3-26. The percentages represent the number of crossings where each sign is present, and 100 percent represents all the crossings that have seen the number of incidents, listed on the left side of the table. These crossings are categorized based on the number of incidents they have incurred between January 2009 and June 2018. Some grade crossings also have more than one advanced warning sign, while others do not report what signs they have.
Figure 3-26: Advanced Warning Signs in Florida (in addition to the minimum required) for Grade Crossings by Number of Incidents (January 2009 – June 2018)
Number of Incidents
No Additional Warning
Signs
W10-1
W10-2
W10-3
0 8% 37% 0.2% --
1 9% 62% 1% --
2 9% 67% 6% 6%
3 4% 71% 4% --
4 9% 73% 9% --
5 -- 100% -- --
6 -- 100% 50% -- Source: CPCS Analysis of FRA Safety Data
The vast majority of incident cases in the FRA accident database do not report whether the gate provides full barrier resistance or is a set of median gates. However, some incident cases do provide the type of gate quadrant. Figure 3-27 provides the gate quadrant configuration for Florida grade crossings by the number of incidents over the last 10 years. The data on gate configuration is also not complete. Grade crossings with a 4-quadrant gate configuration do not allow going around railroad gates as easily as at crossings with 2-quadrant gates. Most incidents have occurred at crossings with 2-quadrant gate configuration.
Figure 3-27: Gate Configuration for Controlled Grade Crossings in Florida by Number of Incidents (Jan 2009-Jun 2018)
Item
Un
kno
wn
Co
nfi
gura
tio
n
Un
con
tro
lled
Cro
ssb
uck
s
Sto
p S
ign
Be
ll O
nly
Ligh
ts O
nly
2 Quadrant Gate
4 Quadrant Gate
Total Incidents 90 10 38 7 1 23 476 48
% of total 13% 1% 5% 1% 0.1% 3% 69% 7%
Source: CPCS Analysis of FRA Safety Data

FINAL REPORT | Florida Passenger Rail System Study Client Ref: RFP Number 917
| 36
Chapter Conclusions
The following two key conclusions can be made from the analysis in this chapter:
Florida has a large number of grade crossings in populated areas, which contributes to its higher casualty rate than the national median.
Trespassing is a serious issue in Florida and needs to be addressed in a comprehensive manner, including a further detailed study of underlying causes.

FINAL REPORT | Florida Passenger Rail System Study Client Ref: RFP Number 917
| 37
4Safety Initiatives – Florida and Other Jurisdictions
Introduction
This chapter provides an overview of safety initiatives on the federal and state level pertaining to Florida, grade crossing best practices from our jurisdictions, and a discussion of Florida’s railroad safety problem responsibility and mitigation efforts.
Federal Highway Administration (FHWA) Safety Initiatives
Positive Train Control (PTC) Implementation
Positive Train Control (PTC) is a new performance requirement that includes a set of next-generation signaling and communication systems intended to reduce the risk of train to train collisions, derailments due to excessive speed, incursion into work zones, and movement through a misaligned route. Trains will be tracked using a number of sensors and will only be allowed to move after receiving positive authorization for this movement. FRA has mandated that railroads implement the system by the end of 2018.
As part of the implementation process, railroads must install the necessary equipment on the locomotives and on or near the track, and update their train control center to ensure that it is capable of operating the equipment. Equipment will be installed on locomotives and next to the track. The type of equipment is dependent on the system: some systems use track circuits, while others use GPS and cellular devices to monitor train movement. The latter type of system requires radio antenna towers to be installed and a band of radio wave spectrum to be allocated to the system. All types of PTC systems can be overlaid on top of existing signaling systems. Not all systems are interoperable, and additional certification is required if multiple types of PTC systems are operating on the same stretch of track.
After the installation, the system must undergo a period of testing, which depends on the technology and the equipment manufacturer. In addition to the installation and testing of equipment, a railroad must submit a PTC Safety Plan (PTC-SP) and receive a PTC System Certification, as specified in 49 CFR 236.1015. Railroads also need to train their staff for PTC operation.
Signaling systems with similar requirements have been part of the industry standard for decades in Europe with proven accident-free operation.
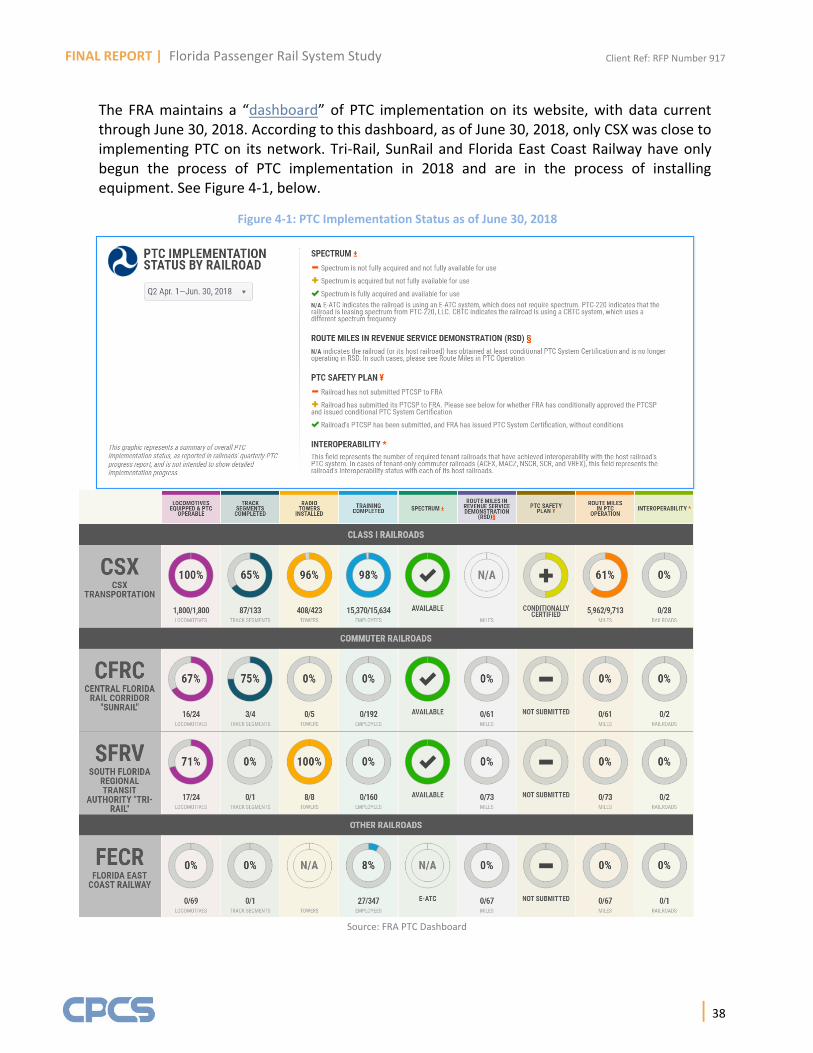
FINAL REPORT | Florida Passenger Rail System Study Client Ref: RFP Number 917
| 38
The FRA maintains a “dashboard” of PTC implementation on its website, with data current through June 30, 2018. According to this dashboard, as of June 30, 2018, only CSX was close to implementing PTC on its network. Tri-Rail, SunRail and Florida East Coast Railway have only begun the process of PTC implementation in 2018 and are in the process of installing equipment. See Figure 4-1, below.
Figure 4-1: PTC Implementation Status as of June 30, 2018
Source: FRA PTC Dashboard

FINAL REPORT | Florida Passenger Rail System Study Client Ref: RFP Number 917
| 39
SunRail and Tri-Rail have signed contracts with Wabtec in February 2018 and May 2018, respectively, to implement PTC and equipment installation is proceeding. It is expected that both these lines will receive an extension to 2020 for full system implementation.
Florida East Coast Railway (where Brightline operates) has begun to implement PTC. Because of its existing advanced signaling system, it received a waiver from the FRA that allows it to postpone the completion of implementation by the end of 2020.
Amtrak’s information was not immediately available. However, as Amtrak uses other railroads’ track, it is up to the host railroad to ensure that PTC is implemented.
All rail systems in Florida are expected to be fully compliant with PTC requirements by the end of 2020. If a rail system does not implement PTC by the deadline, it may face penalties of up to $25,000 per day of operation.
Highway Safety Improvement Program (HSIP)
The FHWA’s Highway Safety Improvement Program is a federal-aid program aimed at reducing traffic fatalities and serious injuries on all public roads, including non-state-owned roads and roads on tribal land. This includes highway-rail grade crossings. Some funding components are continuous and ongoing whereas others are grant-based. The HSIP is legislated under Section 148 of Title 23, was established in 1966 as the first Highway Safety Act and later reauthorized through the SAFETEA-LU (2005), MAP-21 (2012), and Fixing America's Surface Transportation (FAST) Act (2015). HSIP’s budget is authorized by Congress from the Highway Trust Fund (HTF) and is subject to Federal-Aid obligation limitation.
The FAST Act authorizes a pre-apportionment set-aside (of $3.5 million per year) for safety-related activities. Then each state receives a lump sum of the fund to divide among different safety improvement programs. The states’ apportionments are based on calculated percentages as defined in the Federal-Aid highway program funds under Section 104(c) (1) of Title 23.20
Railway-Highway Crossings Program (RHCP)
The Railway-Highway Crossings Program (RHCP) is a component of the HSIP and is also known as Section 130 Grade Crossing Funding. RHCP apportions funds to states (including Florida) by a federal formula, pursuant to the FAST Act for reducing/eliminating safety hazards at railroad-highway crossings. The Section 130 funds are available for all public crossing improvement projects whether the road involved in the crossing is a highway, secondary roadway, bike path, or even a pedestrian trail.
Under Section 130 program requirements, each state is required to conduct a survey of all railroad crossings to identify the need of relocation, grade separation, and improvement of safety devices. Any safety-related deficiencies are required to be corrected. States should also
20 USDOT “About Highway Safety Improvement Program (HSIP)” (August 2018).

FINAL REPORT | Florida Passenger Rail System Study Client Ref: RFP Number 917
| 40
report their RHCP implementation process to USDOT. Section 130 allocates 2 percent of the funding for data analysis and development of the supporting documents.21 The following table shows the annual set-aside allocated for the RHCP nationwide. Florida funding levels are not available, as they vary depending on the percentage of gas tax raised.
Figure 4-2 shows the amount of funding that has been set aside for 2018-2020.
Figure 4-2: Annual US Funding Set-Aside for the RHCP
Fiscal Year Set-Aside in Millions of Dollars
2018 $235
2019 $240
2020 $245
Source: USDOT “Railway-Highway Crossings (Section 130) Program Overview” (August 2018).
FDOT reports on Statewide Highway-Rail Grade Crossing Safety Improvement program annually to the FHWA. This program uses an algorithm to identify crossings with the highest risk in order to generate a list of possible candidates for crossing improvements. Improvement needs for these high-risk crossings are then verified by field diagnostic reviews conducted through collaboration between federal, state, local, and railroad participants. While safety-critical aspects that are identified as part of these reviews are required to be rectified, field diagnostic reviews operate on a consensus basis between the FRA, FDOT, local governments, and the railroads. The review results may be influenced by the railroad and any identified item that is not deemed to be absolutely safety-critical would be presented as a recommendation. Railroads can, therefore, choose to not implement field diagnostic review recommendations and the onus for funding recommended but not safety-critical improvements often are the responsibility of the county or municipality.
FDOT generates an annual Highway Safety Improvement Program report to the FHWA to demonstrate the effectiveness of improvements made for the timeframe spanning 12 years (6 years prior to the upgrade and 6 years after the upgrade) to evaluate the effectiveness of the program.22 Part of this report focuses on the Statewide Highway-Rail Grade Crossing Safety Improvement Program. FDOT found that grade crossing incident totals decreased 61 percent after the implementation of numerous safety projects, falling from 23 to 9 from 2004 and 2016. Of those incidents, fatalities declined from 2 to 0. Incidents with serious injuries also decreased from 8 to 0 during the same time period. This data is summarized in Figure 4-3, which shows the implementation years 2001-2010 for the Highway Safety Improvement Program. Incident counts are shown for the 6 years before and after each implementation year.
21 USDOT “Railway-Highway Crossings (Section 130) Program Overview” (August 2018). 22 FDOT Highway-Rail Grade Crossing Safety Action Plan, 2011

FINAL REPORT | Florida Passenger Rail System Study Client Ref: RFP Number 917
| 41
Figure 4-3: Incident Totals 6 Years Before and After Implementation of the Statewide Highway-Rail Grade Crossing Safety Improvement Program
Source: FDOT, in response to a data request
State Safety Initiatives
Education – Operation Lifesaver and Beyond
Operation Lifesaver is a national nonprofit education and awareness program that is focused on ending collisions, fatalities, and injuries at highway-rail grade crossings and on railroad rights-of-way. FDOT partners with this program to raise awareness of the dangers of trespassing on railroad rights-of-way. FDOT states that Operation Lifesaver is the most important educational tool nationally and in Florida to inform people of the tragic results that can occur by entering railroad right-of-way illegally.
Each of the passenger rail operators in Florida collaborates with Operation Lifesaver to raise awareness on trespassing dangers. FDOT coordinates with local communities, railroad officials, and volunteers to put together outreach events.
Tri-Rail and Brightline provide additional localized and tailored safety outreach campaigns through collaboration with FDOT to create local safety videos that speak to particular communities, Train Safety Week, social media initiatives, etc.
Engineering
Joint Rail Participation Agreements (JRPA)
JRPA’s are funding agreements between FDOT and railroads to improve safety and railroad capacity. FDOT works with railroads within Florida to identify candidate projects that provide safety and capacity benefits to the state. After the project is identified and approved, the railroad and FDOT sign a JRPA. This grants FDOT authority to function adequately in all areas of appropriate jurisdiction, and associated funding is provided by FDOT to the railroad. The project costs, eligible for FDOT participation, are subject to legislative approval of appropriation requests, availability of funds, approval of all plans, specifications, contracts, or other obligating documents and all other terms of the JRPA, and FDOT approval of the project scope and budget.
0
10
20
30
40
50
2001 2002 2003 2004 2005 2006 2007 2008 2009 2010
Tota
l In
cid
ents
Project Implementation Year
6 Years Before Implementation
6 Years After Implementation

FINAL REPORT | Florida Passenger Rail System Study Client Ref: RFP Number 917
| 42
These agreements generally provide a percentage of a project’s funding by the state with the rest of the funding to be provided by other parties (railroads, local municipalities/counties). Railroads under a JRPA are subject to audits and/or monitoring by the department in accordance with Section 215.97 of Florida Statutes.
Optimization Model to Upgrade Rail Crossings
FDOT is currently conducting a study to create an optimization model for improving safety at grade crossings in the state. This new decision-support tool is intended to identify rail crossing candidates for upgrades, determine countermeasures for accident and severity reduction at selected rail crossings, account for operational constraints, and assist FDOT with efficient decision-making while taking into account available budget constraints. This study aims to identify the appropriate countermeasures that should be implemented at rail crossings such as:
installation of flashing lights at passive rail crossings with stop signs only
installation of gates at passive rail crossings with stop signs only
installation of gates at active rail crossings with flashing lights
grade separation (construction of bridges, overpasses, underpasses) and
implementation of methods aiming to improve traffic pre-emption before the arrival of trains at rail crossings such as advanced train detection systems, better coordination between signals at rail crossings and adjacent intersections, implementation of advanced traffic signal control systems, installation of appropriate warning devices, and so on
FDOT currently uses the FRA’s crash prediction algorithm to prioritize railroad crossings improvements suggested by field diagnostic teams. FDOT is developing a more comprehensive model that will go beyond the FRA’s algorithm by helping to determine countermeasures for safety incidents
Enforcement
State Rail Safety Participation Program – Inspection Performance Data
Florida’s State Rail Safety Participation Program provides rail safety inspection performance data. Florida’s Program includes at least one rail safety inspector for each of the five FRA inspection disciplines.
Track: inspections to ensure railroads meet minimum track standards, along with bridge and roadway worker inspections;
Motive Power and Equipment: inspections on passenger locomotives and cars, freight locomotives, and industries that conduct inspections and repairs of railroad rolling stock;

FINAL REPORT | Florida Passenger Rail System Study Client Ref: RFP Number 917
| 43
Signal and Train Control: inspections on signal and train control, periodic tests on signal equipment, and diagnostic review for signal safety enhancements;
Operating Practices: unannounced monitoring/surveillance activities to ensure compliance with operational regulations, along with scheduled audits;
Hazardous Materials: inspections in cooperation with FRA, Homeland Security, Transportation Security Agency, and local authorities; review of industry waiver requests; and conduct statewide hazardous material compliance inspections.
Pilot Study in Broward County: Law Enforcement Strategies to Reduce Trespassing
FDOT is currently conducting a pilot grant program with Broward County on law enforcement strategies to reduce trespassing. FDOT reports that Broward County’s railroads have a high prevalence of homeless and intellectually disabled individuals around its tracks which leads to higher foot traffic. This program increases patrols in areas in and around the railway lines, utilizing specially trained law enforcement staff to reduce the number of trespass-related incidents and casualties.
Grade Crossing Safety: Best Practice and State of the Art
Best Practices in Other Passenger Rail Systems
Florida’s rail system is unique due to the state’s geology and high water table (which makes grade separation difficult) and the historical development of the urban fabric around railroads. While perfectly comparable systems are difficult to determine, Metrolink and Caltrain in California face similar circumstances as Florida. Due to the large concentration of at-grade crossings and high urban density surrounding these rail lines in California, both of these rail services have developed practices to improve safety over the last decades. Of note, California High-Speed Rail will share track with both Caltrain and Metrolink in the San Francisco Bay Area and in the Los Angeles area, respectively, with the plan in both cases to operate at higher than conventional speeds. The Illinois High-Speed Rail project is also comparable to Florida’s higher speed rail plans due to its corridor upgrade project to 110 miles per hour with at-grade crossings.
Metrolink
Metrolink in Southern California is the nation’s third-largest commuter rail system, serving the Los Angeles and Inland Empire region with a total of 409 unduplicated route miles. Metrolink operates a total of 2.8 million train miles per year and 400 million passenger miles per year.
After a number of high-profile crashes, in its 2015 fiscal year, Metrolink was the first railroad in the country to implement Positive Train Control (PTC) across its entire 341 route-mile network. PTC is a predictive collision avoidance technology that helps Metrolink avoid collisions and prevent over-speeding by stopping a train before an accident occurs. The main challenges with PTC implementation at Metrolink included the acquisition of 220MHz spectrum after bankruptcy by the holding firm; technology availability including special radios, a new

FINAL REPORT | Florida Passenger Rail System Study Client Ref: RFP Number 917
| 44
computer-aided dispatch (CAD) system, and a back office server (BOS) to support system interoperability; and a qualified technical workforce to implement PTC. The system cost an estimated $201.6 million.
Caltrain
Caltrain is a commuter rail system in Northern California, serving the peninsula between San Francisco and San Jose. Part of the original transcontinental railroad that was developed in the 19th century, Caltrain’s corridor runs 51 miles with 31 stations and 134 passenger cars, operating in a dense urban area, similar to Florida. Over 18.5 million passengers ride the system’s trains each year. Caltrain has historically experienced high levels of trespassing and grade crossing incidents. To reduce this problem, the railroad has been focusing on three aspects: engineering, education, and enforcement.
Caltrain has completed a number of grade separation projects along its line, including a $160 million grade separation above three streets in downtown San Bruno and a $25 million station reconfiguration and pedestrian underpass construction in Santa Clara.23 It has added fencing in key locations to prevent trespassing. As the segment will share the right of way with the California High-Speed Rail line, it is planned to add vehicle detection and quad gates at grade crossings to further improve safety. The eventual (unfunded) goal is to develop a fully grade-separated railroad corridor.
In its education campaigns, Caltrain actively educates the public by giving rail safety presentations to schools and community organizations, by conducting a safety awareness campaign, and participating in rail safety organizations and mental health and suicide prevention organizations. This is similar to Tri-Rail and SunRail’s efforts.
The system’s Transit Police have been effective at enforcement. In 2016, the Transit Police removed more than 265 people from Caltrain property. They also prevented 32 possible suicide attempts by taking the person into protective custody and transporting them to an emergency treatment facility. The Transit Police also provide one-on-one education to people found illegally accessing Caltrain property.
Illinois High-Speed Rail
Illinois High-Speed Rail is a 284-mile long higher-speed rail line upgrade project from Chicago to St. Louis with a $1.95 billion overall budget, coordinated by Illinois DOT (IDOT) and regulated by the Illinois Commerce Commission; $194 million of this budget is designated for grade crossing, fencing, and overhead bridge work.24 Union Pacific is the owner and dispatcher, while Amtrak is the service provider.
23 Caltrain Fact Sheet Fiscal Year 2017 24 Unlike FDOT, which is both a planning agency and a safety regulator, IDOT’s rail mandate is limited to planning, while the role of the safety regulator is performed by the Illinois Commerce Commission.

FINAL REPORT | Florida Passenger Rail System Study Client Ref: RFP Number 917
| 45
As part of program development, IDOT conducted grade crossing and line safety analysis using field diagnostic teams. In addition to IDOT, these teams also included members from municipalities and counties, the Illinois Commerce Commission, the FRA, Union Pacific, and Amtrak. During the analysis, the Illinois Commerce Commission required a number of grade crossing upgrades and installation of fencing along key sections of the corridor.
The Illinois program’s budget provided for identifying crossings for closure and approaching local counties and municipalities with incentive funding to voluntarily close grade crossings. A total of 38 grade crossings were closed as a result, and a further 213 grade crossings were upgraded. Pedestrian treatments were added to 80 crossings. Grade crossing upgrades include:
4-quadrant gates: this includes two entrance gates and two exit gates. The exit gates are activated a few seconds after the entrance gates to prevent trapping vehicle on the crossing. This configuration prevents drivers from going around gates, as is more common with 2-quadrant gates;
pedestrian gates and escape swing gates where needed;
vehicle detection systems through inductive loops and tie-in into the signaling system. Vehicle presence detectors open exit gates if vehicles are detected in the crossing;
increased warning time to account for higher-speed trains;
improved roadway approaches to improve sightline profiles;
traffic signal interconnections with the signaling system; and
new signs and pavement markers.
Because it is guided by the FRA, IDOT’s process is similar to FDOT’s for new and upgraded grade crossings. However, as FDOT’s mandate includes rail regulation, Florida does not have a separate rail regulator, unlike Illinois. The benefit of an independent railroad regulator in Illinois’ high-speed rail project was direct and proactive involvement to require a series of safety improvements along key sections of the corridor.
As part of the Brightline expansion project, the FRA conducted a field grade crossing and line safety analysis, both for the initial operating segment and for the proposed expansion. The field assessment was performed together with FDOT, Brightline, Florida East Coast Railway, county and municipality representatives (usually county engineers).
In the US, these assessments are not conducted on a regular basis. While the FRA requires states with the highest highway-rail grade crossing collisions to develop a grade crossing action plan under 49 CFR 234.11, there are no requirements to perform such assessments on a regular basis. In Canada, Detailed Field Safety Assessments (DSA) are performed regularly. More information on the DSA process is described in Appendix G.

FINAL REPORT | Florida Passenger Rail System Study Client Ref: RFP Number 917
| 46
Innovative Technologies for Grade Crossing Protection
A number of innovative grade crossing protection technologies are being deployed across the United States and around the world. The practices that may be useful and not currently present in Florida include the following: innovative passive grade crossing treatments, vehicle wedge road barriers, vehicle presence detection, enforcement cameras, and possible pedestrian crossing treatments.
Innovative Passive Grade Crossing Treatment
Passive crossings (where no electronic warning devices are present) are statistically more dangerous than active crossings (where gates and/or lights are present). According to an FRA report from May 2017:
Crossings protected only by stop signs and/or crossbucks have more than five times the accident rate crossings with active protections; and
Crossings with no protection signs have 27 times the accident rate of crossings with gates.
Those rates were determined by a “per car and per train” analysis of the more than 211,000 crossings in the FRA database. Approximately 30 percent of crossings in Florida are passive, though this includes industrial lines and sidings, where few incidents occur. Most mainline passive crossings in Florida are located in rural areas, with little car traffic going across the tracks.25
Recent developments in passive warning devices (none of which are used in Florida) include the following:
“Buckeye Crossbuck” (also known as a Conrail Shield or IdaSheild) – is an aluminum panel coated with highly-reflective chevron stripes (typically red and silver), attached to the main post supporting a stop sign or crossbuck. The left and right sides of the panel are bent backward at a 45-degree angle so as to reflect the headlights of an approaching train toward the line of sight of approaching motorists. An example is shown in Figure 4-4. These have been proven to be effective in reducing incidents at uncontrolled grade crossings in Idaho.26
Electronically-enhanced stop, yield, and crossbuck signs fitted with flashing, high-intensity LEDs along their edges. Optional solar power makes them relatively easy and inexpensive to install and
maintain, especially at remote locations.
25 FRA Office of Research, Development, and Technology, 2017 26 RP 223, Idaho Transportation Department, 2014
Figure 4-4: Example of a Buckeye Crossbuck
Source: Bureau of Transportation
Statistics

FINAL REPORT | Florida Passenger Rail System Study Client Ref: RFP Number 917
| 47
Vibration Detection Technology is being developed by a European Union-funded project. The project developed a prototype of vibration detection sensors that could be installed at grade crossings with passive control to detect approaching trains and provide a cheaper way to signalize uncontrolled and non-signalized crossings.27 This project is still in the development stage. This technology may be useful for installation at uncontrolled low-traffic railroad crossings in Florida in the future.
Vehicle Wedge Road Barriers
In some countries, wedge road vehicle barriers are used at railroad crossings to prevent vehicles from going around gates. Two examples of such devices are shown in Figure 4-5. While their installation became common after 2001 to control vehicle entrances to high profile public buildings, they are not routinely used in the US or Florida at railroad grade crossings.
When the crossing is activated by a train, the boom gates are first lowered, and then the hydraulically-operated barriers are raised automatically. If a vehicle becomes trapped, it can slowly drive over the barrier to exit the crossing.
These devices are usually placed at high-risk crossings with high levels of traffic. They are effective at preventing most 4-wheeled vehicles (including trucks and buses) from driving around lowered boom gates.
Wedge barriers are more expensive to install and require more maintenance than a typical boom gate. They can generally replace quad gates and can be integrated with vehicle presence detection sensors (see next section).
Wedge barriers could be considered for grade crossings in Florida with a high number of incidents and/or high traffic volumes.
Vehicle Presence Detection
Vehicle presence detection uses an inductive loop to detect vehicle presence within the crossing area. This sensor is usually installed together with quadrant boom gates (2 entrance gates to
27 https://cordis.europa.eu/result/rcn/226583_en.html
Figure 4-5: Vehicle Barriers at a Railroad Crossing
Source: Wikimedia Commons / Damir8888 (License: CC-BY-SA-3.0)

FINAL REPORT | Florida Passenger Rail System Study Client Ref: RFP Number 917
| 48
prevent vehicles from entering, and 2 exit gates to prevent vehicles from going around boom gates). The vehicle presence sensor identifies when it is acceptable to close the two exit gates.
The sensor can also be into the train control system to alert the train engineer of a detected vehicle at an upcoming crossing, and, if the signaling system allows it (as would some PTC systems), slow the train down automatically. FRA suggests using these sensors at grade crossings with higher-speed train operation.
The higher-speed rail project in Illinois between Chicago and St. Louis has installed vehicle presence detection sensors at all grade crossings with planned higher-speed operation. These sensors are tied to the signaling system as described above.
An example of a vehicle presence detection system installation at a grade crossing in Illinois is shown in Figure 4-6. In Florida, Brightline is planning to install vehicle presence detectors along its extension between West Palm Beach and Cocoa.
Figure 4-6: Vehicle Presence Detection Installation Sensors
Source: 2014 Global Level Crossing Safety & Trespass Prevention Symposium, Urbana, IL
Enforcement Cameras
Cameras can be installed to capture vehicle violations at grade crossings. The camera works like a red light camera: when a vehicle crosses a pre-defined threshold (boom gates), the camera records a series of images and/or video. The vehicle owner is then identified and a citation is issued against the vehicle, with photo and/or video proof of the violation.
Enforcement cameras are not substitutes for 4-quadrant gates, or other safety features, but can work in conjunction with other treatments. In the US, the North Carolina Department of Transportation (NCDOT) has tested video citations for violations at-grade crossings, as part of its sealed corridor program.28 The goal of the program was to minimize the number of potential interactions of road vehicles and pedestrians with trains by minimizing the number of crossings, upgrading other crossings and installing deterrents (e.g. fencing) to prevent trespassing. NCDOT found other measures to be more effective at deterring violations at grade crossings.
28 https://connect.ncdot.gov/resources/Rail-Division-Resources/Documents/Sealed%20Corridor%20Handout.pdf

FINAL REPORT | Florida Passenger Rail System Study Client Ref: RFP Number 917
| 49
A recent court decision in Florida confirmed the legality of red light cameras.29 However, enforcement cameras are not used at railroad crossings in Florida.
Possible Pedestrian Crossing Treatments
The 2007 edition of the FHWA Railroad-Highway Grade Crossing Handbook discusses a number of treatments that should be considered for pedestrian crossings. Some suggestions include
ensuring that pedestrian crossings are provided at appropriate intervals to discourage pedestrians from taking shortcuts;
installing fencing at key locations to prevent pedestrians from crossing in-between crossings;
designing grade crossings to channel pedestrians through appropriate gates; and
ensuring that the crossings are adequately engineered and that educational campaigns and enforcement efforts are in place.
The handbook discusses some treatments for high-pedestrian areas, such as those around light-rail stations. These treatments may also be applicable to crossing designs for heavy rail systems. Some design treatments include
creating an obstacle in approaching the crossing to force pedestrians to look in both directions before crossing;
fencing off areas around crossings to prevent pedestrians from walking around gates; and
adding exit swing gates to ensure that pedestrians are not trapped when the gates are down.
Florida’s railroads currently use pedestrian boom gates when pedestrian sidewalks are present. However, at most crossings, little to no fencing around these pedestrian gates is present, with nothing preventing pedestrians from walking around gates that are down. In Florida, exit swing gates are usually not installed because no fencing is present.Figure 4-7 provides examples of pedestrian treatments at grade crossings, including fencing around a crossing and escape push gates (left), obstacles that deflect a pedestrian’s intended path and require them to look in both directions before crossing the tracks (center and bottom) and a Z-shaped crossing, nudging pedestrians to look in the direction of approaching trains.
29 Jimenez v State of Florida (May 3, 2018)

FINAL REPORT | Florida Passenger Rail System Study Client Ref: RFP Number 917
| 50
Figure 4-7: Possible Treatments to Improve Pedestrian Safety at Grade Crossings
Source: Korve, et al, TCRP 17, Transportation Research Board, 199630
International Research Projects on Grade Crossing Safety
SAFER-LC
Safety at grade crossings is an issue for railroads worldwide. The European Union is funding a research project, SAFER-LC, which aims to improve safety and minimize risk by developing a set of solutions and tools for level-crossing infrastructure.31 Its main objectives include the following.
Developing a toolbox to help both rail and road managers to improve safety at level crossings.
30 Korve, Hans W., Jose I. Farran, Douglas M. Mansel, et al. Integration of Light Rail Transit into City Streets. Washington, DC: Transit Cooperative Research Report 17, Transportation Research Board, 1996. 31 http://safer-lc.eu/

FINAL REPORT | Florida Passenger Rail System Study Client Ref: RFP Number 917
| 51
Developing and demonstrating how new technological and non-technological solutions can be integrated into level crossings.
Delivering a bundle of recommended technical specifications, human processes, and organizational and legal frameworks to improve safety.
Developing innovative solutions to enhance the safety of level crossings for road and rail users.
The project is being coordinated by the International Union of Railways (UIC) and is comprised of 17 industry and academic partners from 10 different countries, including Belgium, Finland, France, Germany, Greece, Hungary, Italy, Norway, Spain, and Turkey.
The project work packages include:
analyzing best practices worldwide and developing a set of requirements and recommendations to be taken into account for developing and evaluating grade crossing treatments and developing a risk analysis tool that will be applied to further work in the project
developing a framework for evaluating human factors and using the framework for producing a set of low-cost high-impact technological and non-technological measures to improve safety
developing and piloting a set of high-tech solutions to improve grade crossing safety
performing a cost-benefit analysis for suggested solutions
disseminating results
The project began in 2017 and is currently half-way through its process. While the project is focused on the European Union, it should provide a number of recommendations that can be implemented in other parts of the world. FDOT and the FRA should follow this project and determine if its recommendations are applicable in Florida.
Problem Responsibility and Mitigation
Florida is experiencing unprecedented population growth, particularly in southern and central parts of the state. This contributes to traffic congestion along roadways that are largely integrated with rail crossings. This section focuses on related safety issues.
Trespassing Mitigation
It is more difficult to enforce trespassing laws along railroads in Florida due to weaker trespassing statutes than in other states.32 Additionally, because there is not a dedicated
32 https://www.fra.dot.gov/StateLaws

FINAL REPORT | Florida Passenger Rail System Study Client Ref: RFP Number 917
| 52
railroad police force with enforcement powers, Florida municipal and county law enforcement agencies are responsible for ensuring that trespassers are identified, detained and then prosecuted. This creates a gap in coordination, especially if counties and municipalities do not see this issue as a priority. While a number of Florida passenger rail systems have security guards on their trains, this personnel does not have arrest powers. Furthermore, coordination within a rail system is needed to ensure that information about trespassers is passed on to both train engineers and law enforcement personnel.
Camera installation at Florida crossings was considered in 1995, but the Federal Railroad Administration delayed this process due to liability issues associated with privacy and state law. Red light cameras at Florida intersections were considered unconstitutional until May 2018.33 Many municipalities are choosing to continue their bans on cameras, and the Florida Department of Transportation has chosen to hold off on camera installation at crossings to ensure that they would be compliant with state law.
Unplanned Train Stops
Local cities in Florida have raised the issue of unplanned train stops at highway-rail crossings. Such stops make it difficult to plan and coordinate emergency response. They also contribute to traffic congestion in areas urban areas. In response, many local jurisdictions conduct annual tabletop emergency response exercises to find alternate routes when roads are blocked by a train. Florida Statutes, section 351.034 regulates how railroads must address the issue of prolonged stops, including separating the train and allowing the emergency vehicle to proceed through the crossing. There are no time limits on how long a train may occupy a crossing.
Hazardous Materials
Cities along existing passenger lines are also concerned about the release of hazardous materials for both rail-rail and vehicle-rail collisions. The FRA regulates railcar design requirements to mitigate hazardous material releases. The FRA also regulates the transportation of hazardous material that is used for fuel as part of the Locomotive Inspection Act. Additionally, the FRA sets notification requirements from railroads to first responders when hazardous material is released. The requirements are detailed in Chapter I of subtitle B of Title 49 of the Code of Federal Regulations (CFR), and they require carrying a manifest that identifies what types of hazardous materials are carried in the train and the location of the cars within the train consist.
To reduce coordination issues with first responders during an incident, the Florida East Coast Railway offers a secure website, which gives local emergency service staff access to real-time data to identify specific hazardous materials carried by each train. To our knowledge, other railroads do not have similar information systems. There are no requirements to have such a system in place.
33 Jimenez v. Florida, Florida Supreme Court

FINAL REPORT | Florida Passenger Rail System Study Client Ref: RFP Number 917
| 53
Vehicles and railroad cars carrying hazardous materials are required to be labeled with hazardous material placards, ensuring that hazardous materials can be identified and treated in an appropriate and timely manner by local first responders. Train engineers and conductors must also carry manifests that identify which cars in the train carry hazardous materials and what the hazardous material is.
Figure 4-8 provides a high-level flowchart of what must happen when a hazardous materials incident occurs in Florida. For both rail-rail and rail-vehicle incidents involving hazardous materials, rail traffic is stopped on the line until first responders remove any damaged hazardous materials and clear trains to resume operations.
Figure 4-8: Florida Hazardous Material Incident Management Flowchart
Source: Consultations with Railroads, FHWA Traffic Incident Management – 6.0 Documented Practices (Florida)

FINAL REPORT | Florida Passenger Rail System Study Client Ref: RFP Number 917
| 54
Chapter Conclusions
Grade Crossing Safety: Best Practice and State of the Art
A number of innovative technologies could be implemented in Florida in certain locations. These include innovative treatments for passive crossings such as the Buckeye Crossbuck or vibration detection sensors, vehicle wedge road barriers that can be supplemented by vehicle presence detectors and/or crossing enforcement cameras.
The FHWA has developed a guidebook that includes innovative pedestrian treatments. FDOT should consider approaches from this guidebook and provide related guidance to local communities regarding how and when to use such treatments.
As the topic of grade crossing safety is important worldwide, the State of Florida should look at international work on this subject. One such project, SAFER-LC, is funded by the European Union. It aims to develop both technological and non-technological innovations in this area by bringing together industry and academia from 10 different countries.
Putting to Use Best Practices in Grade Crossing Design and Management
While there are federal guidelines for railroad grade crossing design, the highway asset owner (Florida DOT, county, or municipality) must ultimately work with railroads to develop appropriate grade crossing treatments. Defining grade crossing treatment standards falls under the jurisdiction of FDOT. As many localities lack the resources and expertise in rail engineering, FDOT should provide guidance and assistance on this issue by:
developing state-wide grade crossing design standards and/or guidelines as well as a set of best practices;
developing an analytical tool to assist local and county governments in evaluating whether existing grade crossing treatments are adequate and what other treatments are possible (including crossing closure);
providing local communities with resources and information on sources of funding for upgrading grade crossing safety (e.g. federal grants); and
creating and facilitating an environment for open dialogue between local communities and railroads.

FINAL REPORT | Florida Passenger Rail System Study Client Ref: RFP Number 917
| 55
5Florida Rail Regulations Introduction
This chapter summarizes the delineation of federal and state jurisdictional and regulatory powers pertaining to passenger rail safety, regulations for faster rail operations, and regulations for enforcement and incident management. It also summarizes consultations with regulatory agencies that were conducted to understand agency viewpoints and assess overall regulatory capacity.
Review of Jurisdictional and Regulatory Powers
When federal standards for railroad operation and safety requirements exist, they preempt state standards. States may adopt laws and regulations and issue orders that are compatible with and are more stringent than those of the Federal Government in order to eliminate local hazards, as long as the laws do not unreasonably burden interstate commerce. States may adopt laws and regulations and issue orders for any areas of railroad safety and security where the Federal Government has not provided such laws, regulations, and orders.
The Federal Railroad Administration (FRA) is responsible for regulating railroads at the federal level, while the Florida Department of Transportation (FDOT) is responsible for regulations at the state level. A combination of federal, state and local laws fulfills rail safety requirements and sets out appropriate responsibilities. Most regulations relate to engineering and operational safety.
Generally, if a railroad is engaged in transportation-related activities, federal law will likely pre-empt state and local attempts to regulate railroad operations and safety.
Paragraph 20106 of Title 49 of the US Code deals with preemption of regulation at the federal level. The paragraph requires nationally-uniform railroad laws, regulations, and orders, related to railroad safety and security. This paragraph, however, also allows states to implement more stringent state laws, regulations and orders than those at the federal level in order to “eliminate or reduce an essentially local safety or security hazard” provided that they are “not incompatible with a law, regulation, or order of the United States Government” and the state law or regulation “does not unreasonably burden interstate commerce.”
This implies the following for railroad safety laws, regulations, or orders.

FINAL REPORT | Florida Passenger Rail System Study Client Ref: RFP Number 917
| 56
States may adopt laws and regulations and issue orders for any areas of railroad safety and security where the Federal Government has not provided such laws, regulations, and orders.
States may adopt laws and regulations and issue orders that are compatible with and more stringent than those of the Federal Government to eliminate local hazards, provided that these laws do not “unreasonably burden interstate commerce.” The level of burden to interstate commerce has in the past been defined by case law.
As an example, a number of states have laws that require fencing along the railroad right of way in rural areas (against cattle) and/or urban areas (against trespassers). Through court cases, these laws have been found not to be burdensome to interstate commerce.34
After different states adopt different rules/regulations about a specific issue, railroads may ask the FRA through a rulemaking process to create a uniform rule and/or regulation.
Federal Government Rail Regulation
Generally, relevant up-to-date federal-level legislation is written into the US Code Title 49 for transportation-related issues. Most railroad-related federal legislation is found in Title 49, Subtitle V of that title (§§ 20101 to 28505). Title 49 resulted from an effort to streamline transportation-related laws and regulations (including Title 45 of the USC) by Public Law 103-272 of 1994.
Mandate of the Federal Railroad Administration (FRA)
FRA develops and enforces regulations codified in parts 200-299 of Title 49 of the Code of Federal Regulations that are related to safe operation of railroads. These sections deal with railroad certification, operations, and safety.
The mandate of the FRA is established by 49 USC 103. Its mandate includes ensuring the safe operation of railroads as prescribed by Chapters 203 through 211 of 49 USC. It has the authority to penalize entities when safe operations are not performed. Additionally, the FRA’s mandate includes developing, promoting and supporting the development of the rail sector in the US, as prescribed by subsection (j) of 49 USC 103.
FRA assists other agencies with enforcement of some laws for entities that come under its jurisdiction. Examples include noise emissions as regulated by the EPA through the Noise Control Act and accessibility as required by the Department of Justice through the Americans with Disabilities Act (ADA). In both cases, other agencies develop standards and regulations while the FRA develops in-kind regulations to enforce these standards and regulations for railroads under the jurisdiction of the FRA.
34 New York State Railroad Law 52; Nebraska Revised Statute Ch. 74 Sect. 74-601 and 74-602; Oklahoma 2017 Statute, Title 66. Railroads §66-141.

FINAL REPORT | Florida Passenger Rail System Study Client Ref: RFP Number 917
| 57
FRA Jurisdiction
FRA’s jurisdiction includes the interstate railroad network and generally does not include railroad systems that are not connected to the national rail network. Urban railroads (e.g. subways) come under the jurisdiction of the Federal Transit Administration (FTA). Jurisdiction over passenger commuter rail lines tends to overlap between the FRA and the FTA, where they are subject to FRA safety and operating requirements and FTA funding requirements. Appendix A to 49 CFR 209 delineates the line between the FTA and the FRA. If a conflict occurs, FRA’s safety rules prevail over FTA’s safety rules.
FRA Rulemaking Process
FRA can amend the Code of Federal Regulations through its rulemaking process. Once a potential rule is identified, the agency may issue a notice of inquiry (NOI) to gather comments from stakeholders, followed by a Notice of Proposed Rulemaking (NPRM). After a mandatory comment period, an amended NPRM may be issued to gather further comments, before a rule is adopted.35
Relevant Federal Legislation
Appendix H provides an overview of some relevant acts that govern railroads at the Federal level that have been codified in Title 49 of the US Code.
Florida State Rail Regulation
Relevant Florida statutes include Title XXVI, which defines how all types of public transportation are regulated, and Title XXVII, Chapter 351, which deals specifically with railroads. A combination of these statutes provides the regulatory rail safety authority for state organizations, including regulatory authority and guidance for grade crossing safety, crossing access for emergency vehicles, track and equipment rules and penalties, safety inspections, and responsibilities of the state versus the federal government.
Florida Statutes direct FDOT to coordinate with railroads in developing and implementing a statewide rail program to ensure the proper maintenance, safety, revitalization and expansion of the rail system.
Section 20.23 of Florida Statutes gives the Florida Department of Transportation (FDOT) powers to regulate and enforce federal and state-level legislation.
35 https://www.federalregister.gov/uploads/2011/01/fr_101.pdf

FINAL REPORT | Florida Passenger Rail System Study Client Ref: RFP Number 917
| 58
Section 341.302 of Florida Statutes prescribes the duties and responsibilities of the Florida Department of Transportation (FDOT) in relation to Florida’s transit, commuter and intercity passenger rail program.
FDOT is able to regulate on a state level through its rulemaking process, by adopting regulatory rules in the Florida Administrative Code (F.A.C.).
FDOT has produced a number iterations of the Florida Rail System Plan, the most recent one in 2010, as well as a Rail Handbook that identifies and designates responsibility for rail processes within Florida.36
Another important state rule specific to rail safety is Chapter 14-57 of the Florida Administrative Code: Railroad Safety and Clearance Standards, and Public Railroad-Highway Grade Crossings.37 This rule adopts the federal minimum rail safety standards and prescribes reasonable requirements governing clearances above, beside, and between railroad tracks in Florida.
Relevant Regulation on Railroad Operations
New Rail Line Application/Certification Process
Regulations
New rail lines are required to seek Surface Transportation Board (STB) certification in order to comply with the federal regulatory process. This process generally includes an environmental review, as prescribed by the National Environmental Policy Act (NEPA). Decisions regarding new rail service are governed under Title 49 USC 10901 and 10902 as well as 49 CFR 1150. An application is required:
“…for a certificate of public convenience and necessity authorizing the construction, acquisition or operation of railroad lines. Noncarriers require Board approval under section 10901 to construct, acquire or operate a rail line in interstate commerce. Existing carriers require approval under section 10901 only to construct a new rail line or operate a line owned by a noncarrier, since acquisition by a carrier of an active rail line owned by a carrier is covered by 49 U.S.C. 11323. We have exempted from these requirements the acquisition by a state entity of a rail line that has been approved for abandonment, as well as operations over these lines.”38
Applications filed must include the information set forth in 49 CFR 1150.39 The applicant must also comply with the Energy and Environmental Regulations described in 49 CFR 1105 and 1106, including consulting with the Board's Office of Environmental Analysis at least 6 months prior to filing an application to begin the scoping process to identify environmental issues and outline
36 Rail Handbook, FDOT, January 2012 37 Florida Department of State, Florida Administrative Code & Florida Administrative Register 38 Subpart A – Applications Under 49 U.S.C. 10901 39 Includes: Overview, Information about applicant(s), information about the proposal, operational data, financial information, environmental and energy data, summary of proposal for notice, and other procedures.

FINAL REPORT | Florida Passenger Rail System Study Client Ref: RFP Number 917
| 59
procedures for analysis of this aspect of the proposal. As part of the procedure, an emergency preparedness plan must be developed and certified.
The procedure involves a final certification prior to commencing commercial service. The final inspections may be done together with FDOT to ensure that the new railroad is compliant with both federal and state laws and regulations.
FDOT was required to get approval from the STB to purchase the SunRail and Tri-Rail right of way. The STB ruled that FDOT could proceed without the Board’s involvement, as the requirement to provide freight rail services to customers was to remain with the freight operator CSX. Brightline/All Aboard Florida successfully argued that the STB did not need to provide approval for its services, as the system was not an interstate one. In all three cases, a required NEPA process was completed.
FRA New Start Passenger Rail Program
The FRA runs this program to provide development and support to new passenger railroads. The program
assists with the development of regulatory compliance programs;
provides support for system safety and hazard analysis;
provides support for passenger rail equipment; and
provides coordination between FTA, state oversight, railroad management, and other stakeholders.
FRA’s goal is to assist the new railroad in ensuring that the new railroad can assume full responsibility for safe operation.
The program typically covers a period of 3 to 5 years, during which an FRA team works with the railroad on a safety checklist, and discusses all relevant legislation and requirements that apply to the new service. There is no formal certification process for operations or rolling stock. However, the FRA works with the new railroad to ensure that the new railroad complies with all regulations and requirements (e.g. track and vehicle maintenance plans). While the FRA may provide input on best practices, it is ultimately up to the railroad to decide how to deal with some issues (e.g. trespassing). Both SunRail and Brightline went through this process during their start-up periods.
The applicable regulations that are present in the checklist are shown in Figure 5-1.
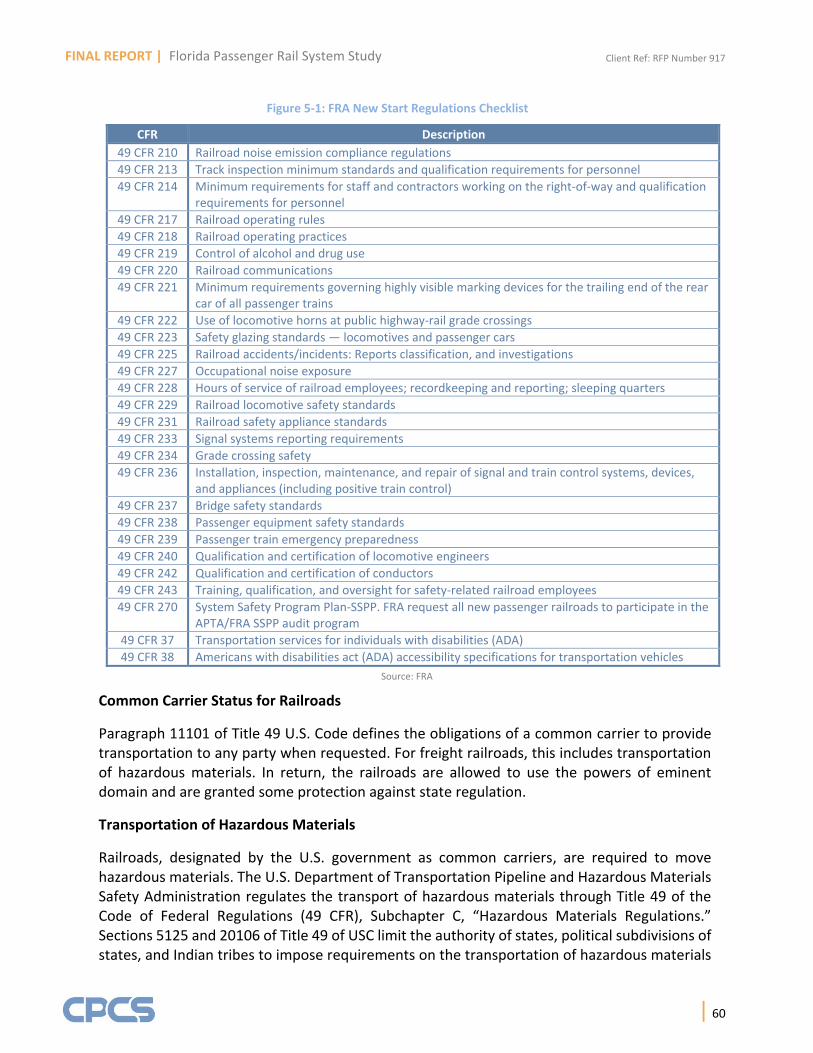
FINAL REPORT | Florida Passenger Rail System Study Client Ref: RFP Number 917
| 60
Figure 5-1: FRA New Start Regulations Checklist
CFR Description
49 CFR 210 Railroad noise emission compliance regulations
49 CFR 213 Track inspection minimum standards and qualification requirements for personnel
49 CFR 214 Minimum requirements for staff and contractors working on the right-of-way and qualification requirements for personnel
49 CFR 217 Railroad operating rules
49 CFR 218 Railroad operating practices
49 CFR 219 Control of alcohol and drug use
49 CFR 220 Railroad communications
49 CFR 221 Minimum requirements governing highly visible marking devices for the trailing end of the rear car of all passenger trains
49 CFR 222 Use of locomotive horns at public highway-rail grade crossings
49 CFR 223 Safety glazing standards — locomotives and passenger cars
49 CFR 225 Railroad accidents/incidents: Reports classification, and investigations
49 CFR 227 Occupational noise exposure
49 CFR 228 Hours of service of railroad employees; recordkeeping and reporting; sleeping quarters
49 CFR 229 Railroad locomotive safety standards
49 CFR 231 Railroad safety appliance standards
49 CFR 233 Signal systems reporting requirements
49 CFR 234 Grade crossing safety
49 CFR 236 Installation, inspection, maintenance, and repair of signal and train control systems, devices, and appliances (including positive train control)
49 CFR 237 Bridge safety standards
49 CFR 238 Passenger equipment safety standards
49 CFR 239 Passenger train emergency preparedness
49 CFR 240 Qualification and certification of locomotive engineers
49 CFR 242 Qualification and certification of conductors
49 CFR 243 Training, qualification, and oversight for safety-related railroad employees
49 CFR 270 System Safety Program Plan-SSPP. FRA request all new passenger railroads to participate in the APTA/FRA SSPP audit program
49 CFR 37 Transportation services for individuals with disabilities (ADA)
49 CFR 38 Americans with disabilities act (ADA) accessibility specifications for transportation vehicles
Source: FRA
Common Carrier Status for Railroads
Paragraph 11101 of Title 49 U.S. Code defines the obligations of a common carrier to provide transportation to any party when requested. For freight railroads, this includes transportation of hazardous materials. In return, the railroads are allowed to use the powers of eminent domain and are granted some protection against state regulation.
Transportation of Hazardous Materials
Railroads, designated by the U.S. government as common carriers, are required to move hazardous materials. The U.S. Department of Transportation Pipeline and Hazardous Materials Safety Administration regulates the transport of hazardous materials through Title 49 of the Code of Federal Regulations (49 CFR), Subchapter C, “Hazardous Materials Regulations.” Sections 5125 and 20106 of Title 49 of USC limit the authority of states, political subdivisions of states, and Indian tribes to impose requirements on the transportation of hazardous materials

FINAL REPORT | Florida Passenger Rail System Study Client Ref: RFP Number 917
| 61
in commerce. A state, local, or Indian tribe requirement on the transportation of hazardous materials by rail may be pre-empted by federal jurisdiction under either section.
Federal law requires rail customers to properly disclose and label hazmat shipments, to ensure that appropriate railcars are used, and to assist emergency responders in case of an accident. The train crew must have a document that reflects the hazmat contents of specific railcars and the current position of each rail car containing hazardous materials on the train.
Notification of hazardous materials transported by rail must be in accordance with the routing requirements set forth in § 172.820 of the hazardous materials regulations. A rail carrier must identify a point of contact for routing issues that may arise with the movement of covered materials, and provide contact information to the following entities.
State and/or regional centers that have been established to coordinate with state, local, and tribal officials on security issues within the area encompassed by the carrier’s rail system
State, local, and tribal officials in jurisdictions that may be affected by a rail carrier’s routing decisions and who have contacted the carrier regarding routing decisions
While railroads do not generally make public the contents of each train for security reasons, Florida East Coast Railway provides this information on a need-to-know basis (e.g. through a secured website) to local law enforcement and emergency responders so that swift and adequate response can be provided in case of an incident.
Passenger trains may operate on the same tracks as freight trains transporting hazardous materials. Many trains carrying hazardous materials are limited to 50 mph. Higher- and high-speed operations generally avoid mixing trains with different operating speeds to maximize line capacity use, which, in turn, reduces the possibility of an incident involving a passenger train and a freight train carrying hazardous materials.
In Florida, all passenger rail systems that are a subject of this study share track with freight trains carrying hazardous materials.
Responsibility for Maintaining Infrastructure on Shared Right-of-Ways
49 CFR 213 regulates the minimum safety requirements for railroad track, responsibility for ensuring compliance, classification of track as well as maximum speed limits, penalties, waivers, and other relevant regulations.
A railroad that owns the track and infrastructure is responsible for maintaining this infrastructure to FRA standards.
FRA segments their tracks into different classes from 1 to 9, with increasing speed limits for each class (49 CFR 213.9 and 213.307). The speed limits within each class may vary between passenger and freight train operation. Generally, the track owner is responsible for ensuring

FINAL REPORT | Florida Passenger Rail System Study Client Ref: RFP Number 917
| 62
that railroad track is within the relevant standards for a specific FRA track class, as prescribed in 49 CFR 213. If a track is leased to another party and that party retains the responsibility for track maintenance, the owner must notify the FRA at least 30 days prior to handover of responsibility.
Grade Crossings
Jurisdiction on Regulation
Part 234 of Title 49 of the CFR sets out a number of regulations on inspection, testing, maintenance, and reporting for grade crossings between railroads and roadways. The FRA publishes a Railroad-Highway Grade Crossing Handbook (last updated in 2007) that provides guidelines for assessing the needed signage and signaling systems at each railroad crossing but does not require that these guidelines be implemented.40
FHWA’s Manual on Uniform Traffic Control Devices (MUTCD) serves as a guide for providing a set of standard signage and lighting at railroad crossings. Section 316.0745 of Florida Statutes codifies the MUTCD. Installation of warning devices at grade crossings incorporates the MUTCD requirements in Rule 14-57.013, Florida Administrative Code, and opening of a new public highway-rail crossing incorporates the design of the proposed crossing and other criteria listed in Rule 14-57.012, Florida Administrative Code. In addition to the MUTCD, the American Railway Engineering and Maintenance of Way Association (AREMA) manual provides other design concepts for analyzing the appropriate design of grade crossings.
Warning Signs and Markings
Section 351.03 of Florida Statutes provides language laying out the responsibilities for railroad-highway grade-crossing warning signs and signals; audible warnings; exercise of reasonable care, and; blocking of highways, roads, and streets during darkness.
Section 316.171 places the responsibility on rail owners for erecting and maintaining cross buck grade-crossing warning signs at all highway-rail grade crossings in accordance with the standards consistent with the Manual on Uniform Traffic Control Devices (MUTCD). It also states that advanced railroad warning signs and pavement markings shall be installed and maintained at public railroad-highway grade crossings in accordance with the uniform system of traffic control devices by the governmental entity having jurisdiction over or maintenance responsibility for the highway or street.
Chapter 6 of the FDOT Plans Preparation Manual (Volume 1) provides a set of requirements that are complemented by FDOT design standards mentioned in the FDOT Design Manual, and design standards 509-070, 509-100, 830-T01, 560 and 11782 in defining what must be installed
40 https://www.fra.dot.gov/Elib/Document/1464

FINAL REPORT | Florida Passenger Rail System Study Client Ref: RFP Number 917
| 63
at a railroad grade crossing.41,42 Additionally, Florida Administrative Code Rule 14-57.013 provides an overview of what equipment must be installed at a railroad crossing.
FDOT standards for grade crossings do not differentiate railroad grade crossing equipment and design requirements by railroad operating speed.
However, FDOT is working with diagnostic teams to require a sealed corridor in Florida in an area of higher-speed train operations. This includes additional requirements within the rail corridor and design improvements along the road right of way.
Responsibility for Grade Crossing Maintenance
Figure 5-2 provides a summary of the responsibilities of different agencies for grade crossing oversight, enforcement and inspections, funding, and project execution.
Rail infrastructure providers and their contractors are responsible for executing grade crossing building, maintenance, and upgrading. However, oversight, enforcement, inspection, and funding responsibilities come from various parties. The FRA, FHWA, FDOT, and other public agencies generally set oversight standards for all of these activities.
The FRA and FDOT are jointly responsible for inspecting built grade crossings and ensuring that they meet appropriate standards. FDOT also issues permits for grade crossing opening and closure. Various parties are responsible for funding the construction of a grade crossing depending on the agreed-upon funding structure. This can include railroads, federal and state-level grants, local government entity funding, funding from the State Transportation Trust Fund, public and private sources of debt, and private grants.
Grade crossings must be properly maintained. The FRA and FDOT are responsible for ensuring that maintenance is properly performed and may inspect grade crossings from time to time. The crossing owner is responsible for paying for crossing maintenance if the railroad pre-dates the crossing. Funds for maintenance may be obtained from various sources. Ultimately, the responsibility for grade crossing maintenance rests with the owner. In practice, the owner and the railroad usually have a subject crossing agreement in place, where the grade crossing maintenance is performed by the railroad with funding from FDOT and/or the crossing owner (e.g. municipality and county).
Upgrades to grade crossings can be required or voluntary based on specific FRA, FHWA, FDOT, and other public agency standards. To determine which grade crossings need to be upgraded, FDOT uses a crash prediction algorithm to prioritize railroad crossings. FDOT also coordinates field diagnostic teams to compile data, request information, analyze data, and visit each
41 http://fdot.gov/roadway/PPMManual/2017/Volume1/2017Volume1.pdf 42 http://fdot.gov/roadway/fdm/current/2018FDM220RR.pdf

FINAL REPORT | Florida Passenger Rail System Study Client Ref: RFP Number 917
| 64
crossing. These field diagnostic teams include the FRA, FDOT, Railroad, and local government entities, though safety improvements recommended are not necessarily requirements.
Figure 5-2: Responsibility Matrix Regarding Activities at Public Rail/Highway Grade Crossings
Activity Oversight (Standards) Enforcement and
Inspections Funding Execution
Building
FRA (minimum signage requirements)
FHWA (signage guidelines)
FDOT (design standards)
Department of Justice (ADA compliance)
Other public agencies for specific issues relating to highways, environment, etc.
FDOT issues permits for grade crossing opening and closure.
FRA and FDOT inspect built grade crossings to ensure they meet appropriate standards.
Local jurisdictions are responsible for ensuring that roads leading up to the crossings are designed properly.
A combination of:
Grants from various federal and state programs including the State Transportation Trust Fund
Local Government Entity funding
Public and Private Sources of Debt
Private Grants
Railroads
Rail Infrastructure Providers and
their Contractors
Maintenance
FRA and FDOT inspect grade crossings to ensure they are properly maintained.
Local jurisdictions are responsible for maintaining roads leading up to crossings
Crossing owner (who may receive funding from numerous sources), including state and federal grants
Upgrades
FDOT identifies top priority crossings using data and stakeholder input
Field Diagnostic Teams (FRA, FDOT, Railroad, and Local city/county) recommend safety improvements for priority crossings by consensus
Depending on the crossing ownership and type of upgrade, a combination of grants from:
FTA
FHWA
Railroad (for line upgrades)
Local Government Entities
State Transportation Trust Fund
Public and Private Sources of Debt
Private Grants
Operations
Railroads are responsible for ensuring the crossing protection is operating properly
Law enforcement is responsible for ensuring vehicles and pedestrians do not trespass.
Grade Crossing Operations: Railroads Railroads
Source: CPCS Analysis
Crossing agreements are entered into with the state, counties, and cities with the rail companies for grade crossings depending on whether the road is a state, county, city, or private road. These agreements specify responsibilities for costs of the road safety improvements on

FINAL REPORT | Florida Passenger Rail System Study Client Ref: RFP Number 917
| 65
the railroad property for specific grade crossings. Mandatory upgrades to grade crossings are funded by rail infrastructure providers with accompanying public support, whereas voluntary upgrades to grade crossings are primarily funded by local municipalities and counties. Railroads are responsible for operating grade crossing equipment, while law enforcement personnel is responsible for enforcing vehicle and pedestrian trespass laws at crossings.
Grade Crossing Blockage
The state has regulatory authority to ensure safety at public grade crossings between roads and railroads when a train blocks the crossing by requiring warning signs and devices. If a crossing is blocked to emergency vehicles, any train or equipment that has come to a complete stop and is blocking a railroad-highway grade crossing must be cut, separated, or moved to clear the crossing upon the approach of an emergency vehicle (Florida Statutes, section 351.034). An exception is made for trains or equipment stopped due to mechanical failure where separation or movement is not possible.
Traffic Signal Preemption at Grade Crossings
A traffic signal preemption system detects trains at a longer distance than a classic detection system, predicts the train’s arrival time at a crossing and adjusts nearby traffic lights accordingly, to activate signal pre-emption at the proper time. This system’s overall aim is to minimize delays and dissipate queues that form as a result of crossing blockage.
The State of Florida defines how traffic signals function in Chapter 316 of Florida Statutes. This chapter, however, does not require local jurisdictions to provide traffic signal preemption at grade crossings. A report by the Center for Urban Transportation Research (CUTR) defined how a coordinated traffic signal preemption program could work.43 FDOT works with local transportation partners through its Regional Transportation Management Centers to ensure compliance with Signalization Pre-Emption Design Standards on state roads. Currently, FDOT has no authority to require local roads that are not controlled by the state (“off-system roads”) to participate in such a program.
Railroad Noise
Noise regulations
Train noise is regulated through the federal Noise Control Act (NCA). It establishes the maximum noise levels for rail cars engaged in interstate commerce. In general, if the noise generated by a train has a transportation purpose and is within the NCA’s noise limits, state and local regulation is pre-empted by federal statute. Noise emissions are regulated by the Environmental Protection Agency (EPA). This law limits railroad vehicle noise and precludes states, including Florida, from regulating on this issue in favor of nationwide standards. Unlike railroad noise laws in many European countries, this law only deals with noise emissions from
43 http://www.fdot.gov/research/Completed_Proj/Summary_TE/FDOT-BDK85-977-44-rpt.pdf

FINAL REPORT | Florida Passenger Rail System Study Client Ref: RFP Number 917
| 66
railroad vehicles and does not deal with noise emissions of the railroad system as a whole (wheel-rail contact, pantograph, etc.).
Some states, such as California, have implemented noise control laws, where a state agency is required to implement noise regulations. In California specifically, these noise regulations are also tied to the State’s environmental review process.
The State of Florida can enact regulations that deal with other aspects of noise control if noise is found to be a safety hazard, subject to federal pre-emption laws. However, to date, no such regulations have been implemented.
Use of Locomotive Horns
Locomotive horn use is regulated by 49 CFR Part 222. Except as specifically exempted, a train must blow its horn within 1,500 feet of a public railroad-highway grade crossing and that horn should be audible for that distance. Exemptions to establish ‘quiet zones’ may be granted by the FRA to a local municipality after an administrative process has determined that safety at the crossing will not be compromised.
Fencing
The FRA does not have any regulations on fencing along a railroad right of way. While some states have regulations on fencing along a railroad right of way in rural areas (against cattle) or in urban areas (against trespassers), Florida does not have any such laws.
Shortcomings of Existing Regulations
Grade Crossing Minimum Design Standards
The FHWA defines a minimum set of signage and signals at railroad crossings for operations below 125 mph, and the FRA defines a set of needed incursion detection systems for operations at or above 125 mph.44 Outside of these requirements, minimum design standards for grade crossing equipment should be defined by the State of Florida.
While standards exist both at a federal and state level, the State of Florida has not codified requirements for grade crossings above and beyond FHWA regulations and guidance, along with the MUTCD (Rule 14-57.012 of the Florida Administrative Code). There is a gap in defining the minimum required equipment at grade crossings for higher-speed operations with a top speed of 81 mph to 125 mph. FRA guidelines for high-speed (above 125 mph) operation could be used as a starting point to develop codified grade-crossing equipment and design standards for this range of higher-speeds.
44 Grade Crossings, FHWA https://www.fhwa.dot.gov/federalaid/0646bsu1.cfm

FINAL REPORT | Florida Passenger Rail System Study Client Ref: RFP Number 917
| 67
Certification of New Passenger Rail Lines
The FRA New Start Rail Program is a non-mandatory program that the FRA offers to ensure that new passenger railroads meet all the safety operating requirements. While a new railroad must meet all operating requirements at the start of service, this FRA program does not provide certification to ensure that these standards have been met. The FTA requires some certification for any passenger services that fall under its jurisdiction. A number of states (e.g. Illinois, California) have implemented a process for intrastate passenger railroads. In Florida, a certification process for new lines could be required at the state level and would be implemented by FDOT.
Railroad Noise and Quiet Zones
Existing railroad noise regulations are set by the EPA and focus on vehicle design. They do not, however, consider noise emissions of the entire rail system, which would include standards considering noise levels felt by a person at a certain distance from the railroad, similar to how airports are required by the Federal Aviation Administration (FAA) to study noise exposure around an airport. Unlike for highways, railroads have no statutory requirements for installation of noise walls and other noise absorption devices.45 Some states, including California, go beyond the FRA’s requirements by mandating that railroad system noise emissions be reviewed as part of any environmental review.
Application for a quiet zone is made by the local jurisdiction. The FRA currently has exclusive jurisdiction of railroad quiet zones and provides a calculator that calculates what is needed to implement a quiet zone. However, because there are no standards for rail system noise emissions, there are also no mandatory requirements for quiet zones.
Fencing
There are no fencing requirements at the State or Federal level. Some states (e.g. Oklahoma, Nebraska, and New York) have enacted fencing laws that have been upheld in court.46
Regulations on Railroad-Highway Grade Crossings
Federal Railroad Administration (FRA) CFR 234.1 imposes minimum maintenance, inspection, and testing standards for highway-rail grade crossing warning systems; prescribes standards for the reporting of failures of such systems, and prescribes minimum actions railroads must take when such warning systems malfunction. The same section also provides a minimum set of requirements for signage at crossings and a set of non-prescriptive recommendations for crossing design. FRA regulations do not identify requirements at new or existing crossings but “preempts any State law, rule, regulation, order, or standard covering the same subject matter,
45 23 CFR 772 46 New York State Railroad Law 52; Nebraska Revised Statute Ch. 74 Sect. 74-601 and 74-602; Oklahoma 2017 Statute, Title 66. Railroads §66-141.

FINAL REPORT | Florida Passenger Rail System Study Client Ref: RFP Number 917
| 68
except a provision directed at an essentially local safety hazard.” FDOT’s authority over railroad-highway grade crossings rests in Statute 335.141, which states that the FDOT has regulatory authority over all public railroad-highway grade crossings in the state, including the authority to issue permits which shall be required prior to the opening and closing of such crossings.
The Federal Highway Administration (FHWA) provides a set of railroad crossing design guidelines, while the Manual on Uniform Traffic Control Devices (MUTCD), which is codified in Florida in a state-level manual, defines the signage and signaling that must be adhered to. While FDOT has required some higher-speed guidelines be implemented, currently, there are no codified requirements for railroad level crossing design specifically for higher-speed operation beyond those for conventional rail.
Regulations for Faster Operation
A high speed rail system is defined in Section 341.8203, Florida Statutes, to mean “any high-speed fixed guideway system for transporting people or goods which is, by definition of the United States Department of Transportation, reasonably expected to reach speeds of at least 110 miles per hour, including but not limited to, a monorail system, dual track rail system, suspended rail system, magnetic levitation system, pneumatic repulsion system, or other system…” The 110 mph threshold differs from the FRA’s and international definitions of what is considered to be high-speed rail.
On a federal level, the FRA administers a number of regulations for high-speed operations, as defined in Title 49 of the Code of Federal Regulations (CFR). The FRA does not have separate regulations for higher (than conventional) speed rail (top speed between 80 mph and 110 mph). Internationally, high-speed rail is defined by the International Union of Railways (UIC) to be any railroad line with a top speed of 250 km/h (approximately 155 mph) or above.
Under Florida Statutes, Title XXVI, Ch. 341.822 and 341.8225, FDOT is the sole government entity to acquire, construct, or operate high-speed rail projects. This does not preclude private companies from building their own rail projects. Outside of Florida Statutes Ch. 341, the State of Florida has no additional higher- or high-speed regulations or statutes.
After studying similar regulations worldwide, the FRA has recently added regulations that pertain to operations of high-speed services. These have been codified in the Code of Federal Regulations and are prescriptive in nature.
Overall, the US railroad system has a comprehensive set of federal and state regulations for both conventional and high-speed operations that have been developed and modified over time. These regulations help ensure that the rail system is operated and maintained in a safe manner and that railroads have an interest in following existing regulations.
The FRA has adopted a number of regulations for high-speed operations (above 125 mph). However, there is a gap in regulations for some aspects of safety and operations between 81 mph and 125 mph. While there are guidelines, this gap includes lack of prescriptive regulations on a federal and state level about the design of railroad crossings for higher-speed operation, and the nature of required sealed corridor treatments, such as fencing.

FINAL REPORT | Florida Passenger Rail System Study Client Ref: RFP Number 917
| 69
Federal Regulations for Higher and High-Speed Operations
Federal high-speed rail regulations related to safety are provided in select sections of the Federal Railroad Administration (FRA) Code of Federal Regulation Title 49 CFR Transportation. The FRA regulations specifically deal with high-speed operations where relevant. The pertinent sections include the following.
Part 200 Informal Rules of Practice for Passenger Service – Prescribes procedures, under which applications will be received and heard and by which rules and orders will be issued
Part 210 Railroad Noise Emission Compliance Regulations – Prescribes minimum compliance regulations for the enforcement of the Railroad Noise Emission Standards established by the Environmental Protection Agency
Part 213 Track Safety Standards – Addresses many of the essential requirements that affect track safety through design, materials, roadbed, rolling stock, assembly, maintenance, monitoring, etc.
Part 221 Rear End Marking Device – Passenger, Commuter and Freight Trains – Prescribes minimum requirements governing highly visible marking devices for the trailing end of the rear car of all passenger, commuter and freight trains
Part 223 Safety Glazing Standards – Locomotives, Passenger Cars and Cabooses – Provides minimum requirements for glazing materials in order to protect railroad employees and railroad passengers from injury as a result of objects striking the windows of locomotives, caboose and passenger cars
Part 229 Railroad Locomotive Safety Standards – Intended to ensure the safety of the train operator
Part 231 Railroad Safety Appliance Standards – Prescribes minimum federal safety standards for all locomotives, brake systems, suspension systems, electrical systems, cabs and cab equipment, crashworthiness, etc.
Part 238 Passenger Equipment Safety Standards – Provided to prevent collisions, derailments, and other occurrences involving railroad passenger equipment that cause injury or death to railroad employees, railroad passengers, or the general public; and to mitigate the consequences of such occurrences to the extent they cannot be prevented
Part 239 Passenger Train Emergency Preparedness – Provided to reduce the magnitude and severity of casualties in railroad operations by ensuring that railroads involved in passenger train operations can effectively and efficiently manage passenger train emergencies
The FRA does not have a comprehensive set of regulations for higher-speed operation (top-speed between 81 mph and 125 mph).

FINAL REPORT | Florida Passenger Rail System Study Client Ref: RFP Number 917
| 70
Comparing European and US Regulations for High-Speed Rail
Comparison of Regulations
Because the US does not have high-speed rail (defined as rail operating at a top speed above 155 mph by the UIC), the Passenger Rail Investment and Improvement Act of 2008 mandated that a review of other jurisdictions worldwide to understand federal standards and regulatory requirements.
The FRA conducted a comparison of US regulations to international high-speed rail standards in May 2013.47 It was determined that gaps and inconsistencies exist due to US regulations being prescriptive while European standards are performance-based, and may be codified differently in different countries. There are also differences for operating on a dedicated right-of-way vs. shared right-of-way (passenger and freight), and procedural differences related to inspections or maintenance and their documentation. The US standards, which have been implemented on a national level, tend to be more stringent than European Union standards. European standards are performance-based, with prescriptive standards defined within each European country. Figure 5-3 provides a list of areas with the most substantial differences.
Figure 5-3: Differences between US and European High-Speed Rail Standards
Subject Differences
Vehicle/Track Interaction
Operating speed limits: multiple FRA classes vs. 3 classes – conventional,
upgraded, purpose-built high-speed
Compliance responsibility: nationally in the US vs. country-specific in the EU
Gradients: FRA regulations do not address gradients
High-speed requirements: differences in certain requirements, though
these do not substantially affect performance
Noise European limits are based on rolling stock class and speed vs. the US, where
standards are based on moving vehicles below and above a 45 mph threshold.
Window Safety Glazing
The European standard allows an impact test for window glazing at an angle
rather than requiring a right angle impact test, as required in the United States.
The U.S. qualification test will impose a much higher glazing strength
requirement on trains operated in the United States.
Locomotive Safety Prescriptive versus performance specifications
Locomotive
Crashworthiness
Differences in collision scenarios and US codes are primarily specific to
locomotives and not passenger cars
Track Safety Aerodynamic No U.S. regulations for tunnels, crosswinds, etc.
Emergency Exit
Requirements
Differences in required number and locations of exits. For example, European
emergency exits need not be window exits
Source: FRA47
47 Comparison of FRA Regulations to International High-Speed Rail Standards – Final Report, DOT/FRA/ORD-13/30, US DOT, May 2013

FINAL REPORT | Florida Passenger Rail System Study Client Ref: RFP Number 917
| 71
Higher-Speed Operation and Roadway-Railroad Grade Crossings
49 CFR 213.361 requires that Class 8 and 9 (high-speed) track owners submit a barrier plan, termed a ‘right-of-way plan,’ to the FRA to include provisions in areas of demonstrated need for the prevention of vandalism; the launching of objects from overhead bridges or structures into the path of trains; and intrusion of vehicles from adjacent rights of way at roadway-rail grade crossings. No such regulations exist for higher-speed operation (class 6 or 7 track).
While European regulations prohibit at-grade crossings for high-speed rail (lines with top speeds above 250 km/h or 155 mph), US standards for high-speed rail do not explicitly prohibit at-grade crossings for speeds below 110 mph and require FRA approval for lines with top speeds between 110 mph and 125 mph.
The Federal Highway Administration (FHWA) provides considerations and actions for evaluating grade crossings for passenger rail operations above 100 mph, which generally discourage grade crossings.48 The FHWA desires that all crossings located on high-speed rail corridors either be closed, grade separated, or equipped with automatic gates with the appropriate detection technology to provide adequate warning time. In addition, the FRA recommends improvements in sight distance, improved crossing geometry to provide the best braking and acceleration distances for vehicles, and a coordinated public education campaign to provide safety information and on-going local coordination.
According to 49 USC 213.347, grade crossings on class 7 track (top speed between 110 mph and 125 mph) require approval from the FRA, while crossings are prohibited for track with a higher top speed (class 8 and 9).
Assessment of Adequacy of Existing State and Federal Regulations for Higher- and High-Speed Operations
Key areas that need to be examined include grade crossing regulations, requirements for a sealed corridor, and signaling system requirements.
Grade Crossing Regulations
While the FRA provides a set of guidelines for designing crossings, including those that will be used on lines with higher-speed operations, these guidelines are not prescriptive in nature. FDOT, which has the jurisdiction to regulate the matter, does not provide any additional minimum design requirements for grade crossings for higher-speed operations beyond the FRA’s minimum design requirements. In consultation with local stakeholders, local governments rarely have enough resources and experience to dedicate staff to this issue and are looking to FDOT for guidance.
48 https://safety.fhwa.dot.gov/hsip/xings/com_roaduser/07010/sec09.cfm#d

FINAL REPORT | Florida Passenger Rail System Study Client Ref: RFP Number 917
| 72
Sealed Corridor Requirements
Presently, there are no requirements for sealing a corridor when operating higher-speed trains. This design philosophy is used to minimize the number of trespassers in between grade crossings and eliminate obstacles that may end up on the railroad track. FDOT does not have any requirements for sealing a railroad corridor for higher-speed operations, though they are working to require a sealed corridor with partnership from field diagnostic teams.
Signaling System Requirements
Neither the FRA nor FDOT have additional signaling system requirements for higher-speed operation. However, sufficient requirements have been built into those of Positive Train Control (PTC) to provide safe train operation on any stretch of track where the system is implemented.
Regulations on Enforcement and Incident Reporting
Rail safety enforcement is performed by state and federal enforcement agencies, FDOT and FRA, respectively. Each has inspectors who enforce their agency’s regulations and have authority to issue penalty actions that may include fines and would require corrective actions to be taken. The agencies also have authority to suspend service until needed rectifications have been performed. Incidents that involve injury, death or serious damage to property must be reported and a procedure exists for performing these reports.
As FDOT and FRA inspectors cooperate, FDOT inspectors may also enforce federal laws and regulations. FRA areas of inspections include: Track, Motive Power and Equipment, Signal and Train Control, Operating Practices and Hazardous Materials, further discussed in section 5.4.2. In the case of an incident, a clear line of reporting must be established between the agencies that are involved in the subsequent investigation.
Serious incidents must be reported immediately (or almost immediately) to an FRA National Reporting Center, and the level of investigation and the agency responsible will be determined based on incident severity. Investigative teams include members of one or more agencies: local law enforcement, state Department of Transportation, the Federal Railroad Administration, and the National Transportation Safety Board. The FRA publishes incident details in an online database.
When a serious incident occurs between a train and a person or a vehicle, a specific sequence of events usually includes an investigation. The sequence and the party that is responsible for each step is outlined in Figure 5-4.

FINAL REPORT | Florida Passenger Rail System Study Client Ref: RFP Number 917
| 73
Figure 5-4: Steps in Investigating a Railroad Incident
Event Actions Responsibility
Incident Occurs
Conductor or engineer notifies train dispatchers about the incident
Railroad contacts first responders
Railroad nominates an incident manager who is responsible until the arrival of first responders
Dispatchers stop other rail traffic around the affected area
Railroad
First Responders Arrive at the Scene
First responders render assistance (as needed)
Local law enforcement takes control of the scene and maintains control until the investigation is completed
Law enforcement conducts an investigation, no train movements are permitted, except as directed by law enforcement officials; railroad may be allowed to operate on a parallel track around the incident if the track is present and if the conditions allow for safe operation
Local Law Enforcement
Incident Report Filed with the National Reporting Center
Railroad files an incident report with the National Reporting Center, which is then transmitted to the FRA
Railroad
Involvement of NTSB For serious incidents, an NTSB or FRA field team may visit the scene. In that case, control of the scene is handed over to NTSB.
FRA, NTSB
Completion of Investigation
Law enforcement completes the investigation, the track is handed back over to the Railroad
Law Enforcement and/or NTSB
Inspection of Track and Systems
Railroad conducts an inspection of the track, signals, and other relevant systems to ensure that safe movement may be conducted. Any needed corrections are made prior to the opening of the line to train traffic.
Railroad
Line opened to traffic The line opened to traffic Railroad
Report Filed with the FRA
Railroad provides a detailed report to the FRA Railroad
Further Investigation is Conducted
Investigation Team (consisting of one or more of: the FRA, NTSB, local law enforcement) conducts a further investigation
Investigation Team
Incident Report Released
An incident report is released either by the local law enforcement (for less serious incidents) and by the FRA and/or NTSB (for more serious incidents).
Investigation Team
Source: CPCS Analysis of Stakeholder Consultations with Passenger Railroads, FDOT, and FRA
Incident Reporting Requirements
Part 225 of Title 49 of the Code of Federal Regulations (CFR) titled Railroad Accidents/Incidents, Reports Classification, and Investigations requires railroads to report on impacts between

FINAL REPORT | Florida Passenger Rail System Study Client Ref: RFP Number 917
| 74
railroad on-track equipment and a highway user at a highway-rail grade crossing. The Federal Railroad Administration (FRA) uses this information to carry out its regulatory responsibilities (such as safety inspection) and comply with safety statutes.
The purpose of the regulations is to provide the FRA with information about the hazards and risks that exist on the nation’s railroads. The purpose of collecting this information is to enable the FRA to carry out its regulatory and enforcement responsibilities under the federal railroad safety statutes. FRA also uses this information to determine rail safety trends and to develop programs that focus on preventing railroad injuries and accidents.
Federal Requirements for Reporting Incidents
Railroads are required to provide the FRA with immediate notification for various incident types.49 There are 4 different and sometimes overlapping reporting requirements, depending on the type of incident. The following lists the reporting requirements as defined in the Code of Federal Regulations (CFR).
49 CFR 225.9 requires immediate (as soon as safely possible) reporting of events involving death or certain injuries, accidents, and incidents
49 CFR 840.3 requires reporting of a passenger, employee or grade crossing fatality within 2 hours, an evacuation of a passenger train, or damage to a tank car that results in the release of hazardous materials or an evacuation. The time limit is raised to 4 hours if the conditions in the previous sentence do not apply, but if there is monetary damage above $150,000 to property or $25,000 to a passenger train
49 CFR 229.17 requires the reporting of incidents that involve locomotives or persons coming into contact with locomotives
49 CFR 171.15 requires reporting of incidents involving hazardous materials
Railroads must report incidents to a National Response Center by phone within the time period provided in each section of the CFR. The National Response Center relays the reported information to the FRA. The phone report must be later followed- up with a written one, directly to the FRA.
Responsibility for Investigating Incidents
Under 49 CFR 225.31, the FRA is responsible for conducting incident investigations, including issuing corrective actions, penalties and/or fines.
Additionally, under 49 USC 1131, the National Transportation Safety Board (NTSB) is responsible for investigating railroad incidents that involve fatalities or substantial property damage. Thus, it is only responsible for a small subset of all reported incidents.
49 49 CFR Part 225 and FRA's Guide for Preparing Accident Incident Reports (May 2003)
FINAL REPORT | Florida Passenger Rail System Study Client Ref: RFP Number 917
| 75
In practice, the FRA investigates more incidents than the NTSB. If both the FRA and the NTSB are involved in an investigation, the two agencies cooperate and issue a joint report.
A state-level agency (e.g. state police) can also be involved though Florida does not require such involvement. Local police and other first responders are involved in obtaining initial statements and performing an initial assessment of the severity of the incident, before turning the responsibility over to the FRA and/or the NTSB. Local law enforcement remains engaged in the investigation throughout its course by providing support to the lead agencies.
The FRA investigates accidents and incidents as determined by the Accident Analysis Branch or regional management. Generally, the FRA investigates accidents and incidents meeting the following criteria.
Collisions, derailment, or passenger train incident resulting in at least one fatality or serious injury
Railroad-related accident resulting in death to an on-duty railroad employee or contractor
Highway-rail grade crossing accident resulting in death to one or more people in a commercial vehicle or school bus, serious injury to three or more people in a commercial vehicle or school bus, death to three or more people in a private highway vehicle, and/or accidents involving grade crossing signal failure or allegations of grade crossing signal failure
A non-casualty train accident resulting in a derailment of a locomotive or 15 or more cars, and extensive property damage
A train accident/incident resulting in a fire, explosion, evacuation, or release of regulated hazardous materials
An accident/incident involving a train transporting nuclear materials
A train incident involving runaway or rollaway equipment
A collision involving maintenance equipment
An accident caused by the failure of a locomotive or a person coming in contact with an electrically energized infrastructure that resulted in serious injury or death
Accidents resulting from signal failure including Positive Train Control-related failures and malfunctions
Any other train accident/incident likely to generate considerable public interest, and most Amtrak accidents/incidents

FINAL REPORT | Florida Passenger Rail System Study Client Ref: RFP Number 917
| 76
Incident Data Compilation and Reporting
The FRA compiles incident reports into a database to allow data analysis and trend identification.50 The purpose of the database is to make railroad safety information, including accident and incident inventory, and highway-rail crossing data readily available to the public. The database allows performing queries by railroad, as well as location and type of incident. The primary groups of accidents and incidents to be reported monthly by railroads are:
highway-rail grade crossing accidents/incidents
rail equipment accidents/incidents, and
casualties to persons (i.e., death and non-fatal injuries to all types of persons, and occupational illnesses involving railroad employees)
The FRA also maintains a visualization tool for collisions between 2008 and 2018.51
Enforcement of Regulations
Railroad Safety Inspections and Inspectors
The FRA Office of Railroad Safety employs approximately 600 inspectors who are distributed among its 8 regional divisions. FDOT employs eight (8) state rail safety inspectors that supplement FRA’s inspectors. The number of FRA inspectors may vary depending, depending on FRA District 3 (Atlanta-based) monitoring priorities.52 Currently, there is at least one state rail safety inspector for each of the 5 FRA inspection disciplines (track, motive power and equipment, signal and train control, operating practices, and hazardous materials).
All FDOT inspectors participate in FRA’s State Rail Safety Participation Program as set out in Title 49 Code of Federal Regulations (CFR) Part 212. As part of this program, state inspectors carry the same authority for issuing notices, defects, and assessing civil and criminal penalties as the FRA inspectors. FRA also provides state inspectors with a system for reporting and tracking reported issues.
The state supplements, but does not replace, the responsibility of the Federal Government in inspecting physical conditions of railroad facilities to determine compliance with federal standards and regulations. The FRA and state inspectors coordinate to cover as much ground as possible during inspections.
Each FRA geographical division decides how to best utilize its limited inspection resources by conducting a risk assessment on different railroads and by using historical inspection data. When performed, inspections may be conducted with or without prior notification of the railroad.
50 FRA Office of Safety Analysis 51 FRA Highway Crossing Collisions 2008-2018 52 Florida Statutes, s. 351.36
FINAL REPORT | Florida Passenger Rail System Study Client Ref: RFP Number 917
| 77
FDOT is responsible for enforcing any state-level regulations, based on FDOT procedures.
FRA and FDOT Enforcement Powers
If FRA or FDOT inspectors participating in the State Rail Safety Participation Program find non-compliance with FRA regulations, they may:
issue a notice of defect and provide the railroad a set time period to fix the defect (appeal is possible through a procedure in 49 CFR 216.17)
assess penalties: criminal or civil, depending on the nature of the violation; or
issue an emergency order, suspending or modifying services (may be reviewed through a procedure given in 49 CFR 216.25)
Railroad Accident Reporting by the International Union of Railways (UIC)
The International Union of Railways (UIC) compiles a safety database on a continuous basis, which collects information on all significant accidents.53 The initiative is open to all UIC members, and most European railroads and infrastructure managers are members of this initiative. Triggers for reporting an accident with the presence of at least one rail vehicle in motion include:
at least one serious injury or death;
damages of over $175,000 to infrastructure, rolling stock or the environment; or
extensive disruptions to traffic (more than 6 hours).
The Safety Database records the location, type, and cause of the accident, as well as information about the train(s) and infrastructure involved.54 Accidents are grouped under one of six categories of causes: infrastructure, rolling stock, human factors, railroad users, weather and environment, third parties.55
In its latest report for 2017, UIC provides a summary of significant railroad accidents. Most reported accidents that were classified as significant occurred due to trespassing (52 percent of all significant reported accidents) and accidents at level crossings (nearly 24 percent of all significant reported accidents). The overall number of reported accidents has been trending downward (down to approximately 1,600 accidents in 2016 from 2,009 accidents in 2011), with the number of fatalities per million train-km down from 0.27 in 2011 to 0.22 in 2016.56 Data in this report points to the problematic nature of grade crossing accidents and trespassers on a worldwide scale.
53 UIC Safety Database 54 http://safetydb.uic.org/IMG/pdf/Definitions_Europe_EN_2016.pdf 55 http://safetydb.uic.org/IMG/pdf/Causes_EUROPE_EN_2014.pdf 56 http://safetydb.uic.org/IMG/pdf/sdb_2017_public.pdf

FINAL REPORT | Florida Passenger Rail System Study Client Ref: RFP Number 917
| 78
Possible Shortcomings in Existing Regulations
This chapter presents an overview of the institutional context regulating railroads in Florida. Possible shortcomings in existing regulations pertaining to faster rail operations are as follows.
Grade Crossing Minimum Design Standards – While there are guidelines, there are no state-level railroad crossing design standards or requirements for higher-speed operations (top speed of 81 mph to 125 mph) beyond the minimum requirements that exist for conventional trains. FDOT is the entity that is responsible for issuing such regulations, taking into account the recommendations proposed by the FRA, FHWA, and AASHTO.
Certification of New Passenger Rail Lines – While the FRA has a review process for any new passenger rail line and the FTA has a certification process for transit systems, the FRA process is not a certification process, and the FTA certification process does not cover all types of new passenger rail services. The Surface Transportation Board (STB) has sole jurisdiction over interstate lines. This leaves a gap for intra-state passenger rail lines that are not subject to the FTA’s certification process. Currently, the principal role of FDOT in the national railroad safety effort is to provide enhanced investigative and surveillance capability for planned routine compliance inspections.
Fencing – Fencing is regulated on a state level. Florida has no guidelines or requirements for installing fencing along a railroad corridor. The development of such requirements falls under the jurisdiction of FDOT as well as local governments.
Sealed Corridor Regulations – There are FRA guidelines but no regulations on a federal or state level for implementing sealed corridor treatment for higher-speed operation. The jurisdiction for implementing regulations for when sealed corridor treatments should be implemented along a railroad corridor would fall to FDOT. FDOT can look to North Carolina (NCDOT) as a baseline for developing such regulations.
Railroad Noise and Quiet Zones – The EPA regulates rail vehicle noise emissions but does not regulate rail system noise emissions, like the FAA does with airports. In Florida, there are no state requirements for implementing quiet zones in urban areas. The regulation of railroad system noise could fall under the jurisdiction of FDOT or the Florida Department of Health, while the mandate of implementing quiet zones falls under the regulatory mandate of FDOT.

FINAL REPORT | Florida Passenger Rail System Study Client Ref: RFP Number 917
| 79
6 Key Issues and Recommendations
Overview
Four passenger rail systems operate on over 600 route miles of railroad lines in Florida. These include two intercity operators (Amtrak and Brightline), both operating on track owned by freight railroads, and two commuter rail operators (SunRail and Tri-Rail), both operating on state-owned track.
The key issues with Florida’s passenger rail system are as follows.
1. High rate of severe injuries and fatalities and high levels of trespassing incidents on railroad right-of-way due to rail services operating in dense urban areas
2. Gaps in regulations that are specific to higher-speed rail operations
3. The need to clarify FDOT’s mandate on oversight of passenger rail with respect to maintenance, safety, revitalization, and expansion
4. The lack of resources for local governments for planning rail projects
This chapter describes these issues in more detail.
Trespassing, Injuries, and Fatalities
As described in Chapter 3, Florida’s passenger rail system incurs a higher rate of severe injuries and fatalities than the national average. Over the last 10 years, Florida passenger railroads experienced a total of 1,395 incidents. Forty-nine percent of these incidents involved severe injuries and fatalities – 1,317 severe injuries and 137 fatalities over this time period.
Florida’s severe injury rate is 1.5 times higher and its fatality rate is 3.5 times higher than the national average rate for the evaluation period (2009-2018).57 The state’s average rates for injuries and fatalities have not been significantly impacted by new rail services (SunRail and Brightline), though each service has experienced a series of incidents during the service start-up period. Figure 6-1 compares passenger rail severe injury and fatality (collectively “casualties”) rates in Florida with nationwide rates, while Figure 6-2 compares each of the four
57 Data for passenger railroad severe injuries and fatalities between January 2009 and June 2018. See definition of severe injuries in Appendix D.

FINAL REPORT | Florida Passenger Rail System Study Client Ref: RFP Number 917
| 80
passenger rail services in Florida against average national intercity rail casualty rate and the average commuter rail peer group casualty rate.
Figure 6-1: Total Injuries and Fatalities Nationwide and in Florida (January 2009 – June 2018)
Source: CPCS Analysis of FRA Safety Data
Figure 6-2: Comparison of Casualty Rates (January 2009 – June 2018)
Florida Passenger Rail Average Annual Casualty Rate
US Intercity Average Annual Casualty Rate
Commuter Peer Group Average Annual Casualty Rate
Amtrak (in Florida) 0.66 0.30
Brightline 0.57 0.30
Tri-Rail 0.15 0.12
SunRail 0.24 0.12
Source: CPCS Analysis of FRA Safety Data
This higher rate of severe injuries and fatalities is primarily attributable to a higher count of trespassing for both pedestrians and vehicles. Trespassing cases represent 27 percent of Florida incidents resulting in severe injuries and fatalities, compared to 19 percent nationwide.
Two new passenger rail services, SunRail and Brightline, began operating in Florida within the last three years. Each service has experienced a series of incidents during its start-up period. The high rate of incidents for each service may be explained by passengers and vehicles who are unaccustomed to the presence of more trains, and trains operating at higher speeds. However, these incidents have not had a significant effect on the state’s average fatality and injury rates.
Brightline began operations in January 2018 and will be the first privately-owned, higher-speed rail service in the United States, defined by a speed between 81 mph and 125 mph. It has a number of expansion projects underway.
While Florida passenger rail incident rates are higher than the rest of the country, rail operations take place in much more population-dense areas than the US average. As seen in Figure 6-3, Florida ranks 8th in the country for its grade crossing density index (Grade crossing density index = number of grade crossings × population density / 1 million), which accounts for both the number of grade crossings and population density in the state.
Location Injuries Fatalities Total Passenger
Train Miles Injury Rate Fatality Rate
Casualty Rate per 10,000 passenger train miles
Nationwide 41,933 2,072 912,645,372 0.46 0.02 0.48
Florida 1,317 137 19,332,341 0.68 0.07 0.93

FINAL REPORT | Florida Passenger Rail System Study Client Ref: RFP Number 917
| 81
Figure 6-3: Top States in Grade Crossing Density
Rank State Grade Crossing count
Population Density (Population per sq. mi.)
Grade Crossing Density Index*
1 Illinois 26,006 225 5.85
2 Ohio 20,281 280 5.67
3 New Jersey 5,007 1036 5.19
4 Pennsylvania 16,858 277 4.68
5 New York 12,728 359 4.57
6 California 18,149 242 4.39
7 Indiana 16,715 185 3.10
8 Florida 9,577 311 2.98
9 Texas 27,032 103 2.78
10 North Carolina 12,638 191 2.41
*Grade crossing density index = number of grade crossings × population density / 1 million
Source: CPCS Analysis of FRA Safety Database (as of Sep 2018)
Gaps in Regulations
Higher-Speed Rail Regulations
Existing state and federal-level regulations for railroads were detailed in Chapter 5. While Brightline will be introducing Florida’s first higher-speed rail service with top speeds of 110 mph between West Palm Beach and Cocoa, and 125 mph between Cocoa and Orlando, there is a gap in federal and state regulations governing higher-speed rail. While the Federal Railroad Administration and the Florida Department of Transportation have in place regulations for conventional (up to 80 mph) and high-speed (126 mph to 220 mph) rail, neither agency has developed additional regulations that are specific to higher-speed rail (81 mph to 125 mph).58
Shortcomings in State-Level Rail Regulation
When federal standards for railroad operation and safety requirements exist, they preempt state standards. The state of Florida may adopt laws and regulations and issue orders that are compatible with and more stringent than those at the federal government to address local hazards, as long as the laws do not unreasonably burden interstate commerce. This study identifies a number of shortcomings in existing regulations between federal and state levels for higher-speed rail operations.
There are no codified, minimum standards specific to higher-speed operations. While FDOT has implemented some higher-speed guidelines in Florida, there is no law mandating adherence to these guidelines.
There is no formal certification of new passenger rail lines that are not under the jurisdiction of the Federal Transit Authority (FTA) and the Surface Transportation Board (though the FRA does have a process to ensure that a large number of safety-critical elements are in place).
58 For the difference in maximum operating speeds between a higher-speed and high-speed line see Figure 2-1.

FINAL REPORT | Florida Passenger Rail System Study Client Ref: RFP Number 917
| 82
Florida has no regulations or guidelines for when fencing should be installed and who should be responsible for its installation and maintenance costs outside of individual crossing agreements between railroads, state, and local government entities.
There are FRA Sealed Corridor Guidelines but no mandatory regulations on corridor treatment for higher-speed operations. While FDOT has required a sealed corridor for higher-speed service in the past, these requirements are not codified.
There are no state-level regulations on railroad system noise and quiet zones, which can be regulated at a state level.
Given the existing institutional setup, FDOT is responsible for implementing regulations in each of these areas.
Institutional Gaps
The Need to Clarify FDOT’s Mandate
Consultations with local counties and municipalities revealed that recommendations that are above the minimum requirements are not always implemented by railroads as they are seen as non-mandatory. Instead, the FRA’s minimum standards are followed by railroads.
FDOT has the right to establish regulations on any issue where there are no federal regulations, as long as they are not incompatible with another law, regulation, or order of the US government, and as long as they do not unreasonably burden interstate commerce. FDOT can also implement federal guidelines as state-level regulations. In some cases, state law codifies federal guidelines such as the state’s grade crossing minimum design standards. However, the agency tends to defer to the FRA minimum standards as has been revealed through consultations with local counties and municipalities. Also, in the current model, railroads present projects to the local counties and municipalities, but local feedback is not necessarily addressed by the railroad.
While FDOT works extensively with the FRA on performing safety inspections at operational and tactical levels, FDOT has not developed additional Florida-specific safety regulations, deferring instead to federal standards and guidelines. FDOT’s mandate on this issue needs to be clarified and additional resources would likely need to be allocated to allow FDOT to establish and oversee state-level regulations.
Improving the Planning Process for Local Governments
While some local governments may address road, pedestrian and highway issues frequently, few counties and municipalities have expertise in railroad engineering and planning. It was observed in a number of consultations with local governments that local jurisdictions may lack the necessary resources, knowledge, or expertise in addressing railroad engineering issues or in working with railroads. A number of counties mentioned that they were looking to FDOT to provide the necessary knowledge resources, leadership, and guidance for railroad project development.

FINAL REPORT | Florida Passenger Rail System Study Client Ref: RFP Number 917
| 83
While FDOT has a Freight and Multimodal Operations Office which deals with Rail Operations and Safety, the office currently does not appear to have adequate resources (e.g. staffing levels and financial resources) to be the able to provide the level of leadership and knowledge that local governments are looking for.
Potential Conflict in FDOT’s Existing Mandate
In addition to providing program administration and planning functions, the mandate of the Florida Department of Transportation as written in Title XXVI, Section 341.302 of the 2018 Florida Statutes includes two clauses that may be potentially conflicting:
“(2) Promote and facilitate the implementation of advanced rail systems, including high-speed rail and magnetic levitation systems.”
“(9) Assess penalties, in accordance with the applicable federal regulations, for the failure to adhere to the state standards.”
While the conflict is not currently observable in practice (and is unlikely to be observed in the near future), the existing set-up could, in theory, prevent FDOT from properly exercising its strategic safety regulatory functions in a situation where the department is acting as a promoter for a rail project.
To avoid such conflicts, some states separate the regulatory function from the planning and program administration function of its department of transportation. Figure 6-4 shows the agencies that are responsible for planning and program administration and regulatory authorities in states with significant railroad presence.
Figure 6-4: Railroad Administration and Regulatory Authority for Selected States
State Program Administration Regulatory Authority
California California DOT (Caltrans) Public Utilities Commission
Colorado Colorado DOT Public Utilities Commission
Illinois Illinois DOT (IDOT) Illinois Commerce Commission
Florida Florida DOT (FDOT) Florida DOT (FDOT)
Georgia Georgia DOT Public Service Commission
Indiana Indiana DOT Indiana DOT
Massachusetts Massachusetts DOT Massachusetts DOT
Michigan Michigan DOT Public Utilities Commission
Minnesota Minnesota DOT Minnesota DOT
New Mexico New Mexico DOT Public Regulation Commission
New Jersey New Jersey DOT New Jersey DOT
New York New York State DOT New York State DOT
North Carolina North Carolina DOT Public Utilities Commission
Ohio Ohio DOT Public Utilities Commission of Ohio
Pennsylvania Pennsylvania DOT Public Utilities Commission
Texas Texas DOT Railroad Commission of Texas
Virginia Virginia DOT State Corporation Commission
Washington Washington DOT Washington Utilities and Transport. Commission
Source: CPCS Analysis

FINAL REPORT | Florida Passenger Rail System Study Client Ref: RFP Number 917
| 84
While there may be an additional cost to manage a separate regulator, which should have an independent funding source for exercising its duties, such a separation would provide a clear delineation of responsibility for implementing and enforcing state-level safety regulations.
Internationally, the approach is also different in establishing and measuring regulations.59 Some key themes include the need to have adequate levels of regulation, the need to consult stakeholders when establishing regulation, and the need for adequate resources to enforce existing regulation.60
Recommendations
Overview
Based on the gaps presented in the previous section, we propose recommendations grouped into six categories for the Legislature and FDOT’s consideration to improve passenger rail safety in Florida.
1. Recommendations on institutional design
2. Recommendations on the regulation of specific issues
3. Recommendations on implementing state-of-the-art practices
4. Recommendations on enforcing railroad crossing trespassing violations
5. Recommendations for rail safety resources
6. Recommendations for further research
Recommendations
Recommendation 1: The Legislature may consider updating FDOT’s mandate
The Legislature may consider three approaches to creating a better regulatory system.
1.1 Providing funding for and directing FDOT to administer a committee to liaise with local governments, communities, and railroads on safety issues.
1.2 Updating FDOT’s mandate to more clearly define its regulatory role in implementing safety regulations at the state level and supplementing the updated mandate with adequate resources (human and financial) to allow FDOT to implement this mandate.
1.3 Creating an independent regulatory body with an independent funding source. The regulatory body would assume FDOT’s existing safety oversight functions, and be responsible for strategic, tactical and operational state-level safety regulation for rail and other modes.
59 International approaches to transport regulation, Webb Henderson, Legal and Regulatory Advisors, 2015 60 Measuring Regulatory Performance. Evaluating the Impact of Regulation and Regulatory Policy, OECD, 2012

FINAL REPORT | Florida Passenger Rail System Study Client Ref: RFP Number 917
| 85
Recommendation 2: FDOT may consider setting new state-level regulations for higher-speed rail
As higher-speed rail services begin operations in Florida, specific higher-speed rail regulations are needed to ensure safety. The FRA currently does not have set standards for higher-speed rail. FDOT should consider the following recommendations.
2.1 Creating a review process to certify new passenger rail lines
FDOT may consider creating a process for evaluating new passenger rail lines to ensure that they are safe to operate. This process would build on other safety review processes performed by other organizations (e.g. FTA, FRA, and STB) and could provide additional requirements on top of these processes, as needed, tailored to the needs of Florida’s unique passenger rail system attributes.
2.2 Setting minimum grade crossing design standards
FDOT should build upon its existing minimum grade crossing design standards and existing grade crossing design guidelines to create a more comprehensive set of grade crossing design standards for different types of grade crossings and operating speeds, including higher-speed operations.
2.3 Setting requirements for fencing along railroad corridors
FDOT may consider creating a set of standards for fencing along rail corridors, defining the location of where fencing would be required, and who would be responsible for installing and maintaining the fencing. These standards may depend on the top operating speed of a line.
2.4 Creating guidelines for sealed corridor treatment along railroad corridors
FDOT may consider creating a set of operating standards for higher-speed rail operation, including what treatments must be used along the corridor to ensure a safe train operation. FDOT can look to FRA for design guidelines, as well as North Carolina and Illinois for implementation examples.
Recommendation 3: Implementing State-of-the-Art Practices
The Florida legislature can take a number of concrete steps to put some of the proven state-of-the-art ideas into practice. At the same time, FDOT and Florida passenger railroads should consider continuously improving rail safety by monitoring and implementing the most applicable state-of-the-art safety practices.
3.1 The Legislature may consider creating a mandatory requirement that local counties and municipalities with fiber optic networks along local, non-state-controlled roads make them available for railroad signal “pre-pre-emption” in order to reduce road congestion and increase grade crossing safety

FINAL REPORT | Florida Passenger Rail System Study Client Ref: RFP Number 917
| 86
Currently, train detection sensors use existing rails to send frequencies to the nearest grade crossing to activate grade crossing arms. While this system works, it can be improved by sending these signals longer distances using municipal fiber-optic networks, which often run parallel to the railroad. In addition to enhancing safety at grade crossings, this could also lead to a reduction of road congestion in the surrounding areas.
Traffic signals along state roads are required to comply with Signalization Pre-Emption Design Standards. Currently, some municipalities along local roads are participating in this on a voluntary basis, but they are not required to participate or provide access to their fiber-optic network. FDOT raised this gap as a concern during consultations.
3.2 The Legislature may consider creating a requirement for navigation applications to include audio and visual alerts of upcoming railroad crossings
Given the high number of crossings in the state, the legislature may consider requiring navigation/mapping applications to include auditory and visual warnings of upcoming railroad crossings. This requirement would be included in the state’s vehicle code.
3.3 The Legislature may consider setting regulations on quiet zone implementation in urban areas to address railroad system noise
A mandate for implementing quiet zones in urban areas would reduce noise and disturbance for surrounding communities. Quiet zones should be required at the beginning of a new service in order to improve the quality of life of surrounding communities and to avoid having to re-educate surrounding communities about changes in expected train behavior (e.g. no horns) after the implementation of quiet zones. While the FRA is responsible for regulating the standards for how quiet zones are to be implemented, the Legislature could mandate a set of grade crossing improvements that would make a crossing to be quiet-zone eligible. The Legislature could also mandate when and how local communities must apply for quiet zone recognition.
3.4 FDOT may consider developing and updating on a regular basis a set of guidelines that discuss state-of-the-art railroad crossing and corridor treatments and their applicability to Florida railroads. This would allow local governments to be informed about the latest technologies available
We recommend that FDOT continuously monitor state-of-the-art grade crossing treatments and develop guidance on which practices they recommend for Florida railroads and local governments. Some areas for consideration include various pedestrian crossing treatments (e.g. AASHTO guidelines), innovative passive crossing treatments, vehicle wedge road barriers at grade crossings, vehicle presence detection at grade crossings, etc. This would allow local governments to be informed about the latest technologies available. FDOT should also consider liaising with other state DOTs and international organizations (e.g. UIC) for working on grade crossing safety.
3.5 FDOT may consider implementing Remote Health Monitoring (RHM) requirements for at-grade crossings with higher road and rail traffic volumes and/or train speeds

FINAL REPORT | Florida Passenger Rail System Study Client Ref: RFP Number 917
| 87
Remote Health Monitoring (RHM) detects crossing signal malfunctions to directly notify the dispatcher and maintenance staff of grade crossing equipment malfunctions. This ensures that equipment issues are identified in real-time and fixed in a timely manner. Florida does not currently mandate Remote Health Monitoring at its grade crossings.
Recommendation 4: Enforcing Railroad Crossing Trespassing Violations
Florida has a higher rate of trespassing incidents that incur severe injuries and fatalities compared to the nation. The state also has weaker enforcement statutes for highway-rail grade crossing trespassing when compared to states such as Ohio, which has automatic arrest powers. We recommend the Legislature consider the following recommendations to strengthen trespassing violation enforcement.
4.1 The Legislature may consider requiring the establishment of inter-jurisdictional law enforcement working groups in railroad corridors with a high number of crossings and incidents to ensure that law enforcement agencies are coordinating with each other on trespassing enforcement
Trespassing enforcement is currently the responsibility of local law enforcement. However, railroads have unique security issues and require law enforcement training. In the past decade, the ranking officers at some local law enforcement agencies have been changing frequently, making the enforcement system complex and difficult for railroads. We recommend that the Legislature consider encouraging inter-jurisdictional law enforcement working groups along railroad corridors with a higher number of crossings and incidents to facilitate trespassing enforcement coordination.
4.2 The Legislature may consider granting greater authority to each railroad’s security officials to address trespassing along railroads
We also recommend that the Legislature consider granting greater authority to railroad security officials to address trespassing along the railroads. While railroad security officials are not local law enforcement members and lack the same arrest powers, these officials are certified and carry firearms in the state. Providing railroad security officials with greater authority to detain trespassers, for example, may deter trespassing along railroads.
4.3 The Legislature may consider establishing harsher penalties for grade crossing trespassing
Trespassing can only be enforced if there are penalties associated with trespass violations. Florida suffers from habitual trespassing along grade crossings in traffic congested areas. To address this issue, the Legislature could consider a provision to fund enforcement cameras at-grade crossings to capture trespass violations. These enforcement cameras can identify vehicle owners and issue citations against the vehicle. Funds generated from trespass violations can go towards Operation Lifesaver and other local outreach programs to educate the public on rail safety.

FINAL REPORT | Florida Passenger Rail System Study Client Ref: RFP Number 917
| 88
4.4 The Legislature may consider establishing a photo/video enforcement program for at-grade crossings
Efforts began in 1995 to install cameras at highway-rail grade crossings. However, due to liability issues, this effort was stalled. The state also experienced a stringent ban on red light intersection cameras which was withdrawn earlier this year. Cameras can be installed to capture vehicle violations at grade crossings. When a vehicle crosses a pre-defined threshold (boom gates), the camera records a series of images and/or video. This camera identifies the vehicle owner, subsequently issuing a citation against the vehicle. Enforcement cameras are not substitutes for quadrant gates or other safety features but can work in conjunction with other grade crossing safety features to prevent trespassing.
Recommendation 5: Reviewing Rail Safety Resources
Railroad safety can only be assured with sufficient funding to build, maintain, and upgrade railroad safety features. The Legislature may consider evaluating funding adequacy for suicide prevention activities and requiring railroads to grant owners of grade crossings the right to use open procurement for grade crossing maintenance. We also recommend that FDOT continue to actively assist local communities in identifying funding opportunities.
5.1 The Legislature may consider assessing the current resources of the Department of Children and Families and of the Department of Health to determine whether statewide suicide prevention activities could be leveraged to greater effect
While Operation Lifesaver provides a good baseline, Florida should go a step further and consider establishing a comprehensive suicide prevention program. The program should include
i. more accurate and comprehensive collection of data on suicides on railroad track;
ii. a requirement for suicide prevention/intervention training for railroad employees working in suicide “cluster” areas (e.g. signal maintainers and track maintenance workers);
iii. suicide prevention signage along key rail corridors at key locations, and linking these to suicide prevention hotlines; and
iv. use of innovative technologies, such as drones or other detection systems to monitor stretches of track for individuals potentially contemplating suicide in railroad suicide “cluster” areas and urban areas.
5.2 The Legislature may consider requiring railroads to allow owners of grade crossings the right to use open procurement for contracting maintenance of grade crossings, fencing, etc.
While private railroads may not use public grants, they require grade crossing and adjacent property owners to fund the construction and maintenance of grade crossing treatments, fencing, and pedestrian crossings.

FINAL REPORT | Florida Passenger Rail System Study Client Ref: RFP Number 917
| 89
A number of funding discrepancies were observed between local counties and railroads on these issues due to what has been perceived to be unreasonable costs for maintenance of grade crossings.
We recommend the Legislature consider requiring railroads to allow for open procurement of grade crossing and fencing maintenance providers to promote transparency and competition between maintenance providers and lower the use of public funds.
5.3 FDOT may consider reviewing local planning resources for rail activity and continuing to liaise with local governments to identify funding opportunities for rail safety treatments
FDOT may consider reviewing the types of local planning resources for rail activity and continuing to work with local governments in identifying potential funding sources for improving rail safety treatments, including grade crossing safety. Review of planning capacity and funding availability may prove helpful for local governments that do not have rail expertise on staff or readily available otherwise with knowledge of specific funding mechanisms to promote rail safety in their jurisdictions.
5.4 FDOT may consider requesting an evaluation of funding levels for rail safety in its annual legislative budget request to highlight needs at the state and local level
Continued funds should be available to support not only technical treatments but also critical evaluation efforts such as FDOT’s Operation Lifesaver and other local outreach programs.
Recommendation 6: Continuing Research to Promote Public Safety Along Railroads
This study recommends further research on the following topic.
6.1 FDOT may consider developing a methodology for analytically evaluating grade crossing closures.
Florida’s development patterns resulted in numerous closely-spaced grade crossings. FDOT lacks an analytical methodology to determine which crossings should be consolidated and where strategic investment should be made. The methodology should have a component that would consider impacts on traffic congestion. This study can follow the ongoing FDOT Optimization Model Study, which prioritizes grade crossings for upgrade treatments based on risk factors.

FINAL REPORT | Florida Passenger Rail System Study Client Ref: RFP Number 917
| 90
Appendix A. Economic Conditions and Outlook in Florida
This section examines the current economic conditions and trends in Florida. Florida is the third most populous state in the country. As of 2017, the state had a population of roughly 21 million people with an annual growth rate of 1.5 percent.61 Approximately 20 percent of Florida’s residents are 65 years and over, and this percentage is expected to continue to rise.
Figure A-1 lists the top Florida counties by population growth for 2010 to 2017.
Figure A-1: Top Florida Counties by Population Growth (2010-2017)
County 2010 Population 2017 Population Annualized Growth Rate
Sumter County 93,420 125,165 4.27%
Osceola County 268,685 352,180 3.94%
St. Johns County 190,039 243,812 3.62%
Walton County 55,043 68,376 3.15%
Lee County 618,754 730.224 2.57%
Manatee County 322,833 385,571 2.57%
Orange County 1,145,956 1,348,975 2.36%
Source: US Census American FactFinder Data62
Between 2010 and 2017, the state’s total population grew by 11.6 percent, primarily attributable to net migration flows into the state. Anecdotally, U-Haul data suggest that Florida had the second highest migration growth in 2017, after Texas.63
The state’s overall economic condition and outlook remain robust. Employment of 9,845,859 as of June 2018 is the highest in state history, with growth particularly notable in professional and business services, tourism, and healthcare sectors. The unemployment rate is at an 18-year low of 3.8 percent as of June 2018. Florida’s Real Gross State Product is projected to expand at an average annual rate of 3.3 percent from 2018 to 2021.
Figure A-2 illustrates the state’s population density by county, in relation to the passenger rail network. Florida’s population is most concentrated in the tri-county South Florida region along
61 US Census Bureau QuickFacts – Florida 62 US Census American FactFinder Data 63 U-Haul Migration Trends: Florida No. 2 Growth State for 2017

FINAL REPORT | Florida Passenger Rail System Study Client Ref: RFP Number 917
| 91
with the Central Florida region. Of note, the tri-county region (Miami-Dade, Broward, and Palm Beach), Hillsborough County where Tampa is located, and Orange County where Orlando is, are of the most populated counties in the state. The three county area of Miami-Dade, Broward, and Palm Beach counties represents approximately a third of all Florida population and household income.64
Figure A-2: Florida Population by County
Source: CPCS Analysis of US Census Bureau 2017 Data
64 Board of Directors Meeting, Florida Development Finance Corporation, October 27, 2017

FINAL REPORT | Florida Passenger Rail System Study Client Ref: RFP Number 917
| 92
Figure A-3 provides an overview of annual population growth in Florida between 2010 and 2017. The highest growth occurred around Orlando, south of Jacksonville and around Fort Myers.
Figure A-3: Annual Population Growth in Florida (2010-2017)
Source: CPCS Analysis

FINAL REPORT | Florida Passenger Rail System Study Client Ref: RFP Number 917
| 93
Payroll job growth will continue to outpace national job growth. The total number of jobs in the state is expected to grow 11.3 percent from 2017-2025 due to consistently strong payroll job creation. Figure A-4 indicates the sectors projected for the strongest average job growth from 2017 to 2025.
Figure A-4: Sectors Projected for the Strongest Job Growth for the period 2017-2025
Source: US Bureau of Labor Statistics via Florida Department of Economic Opportunity
Visitors to Florida increased by 3.6 percent in 2017 compared to the year before. This is reflected by a 4.5 percent increase in domestic visitors to the state, partially offset by a decline in the number of overseas visitors as seen in Figure A-5.
Figure A-5: 2017 Estimates of Visitors to Florida (millions)
Visitor Origin Million Trips Year Over Year Change
Domestic 102.35 +4.5%
Canadian 3.48 +4.0%
Overseas 10.68 -4.3%
Total 116.49 +3.6%
Source: VISIT Florida
Below, Figure A-6 provides an illustration of Florida visitor contributions to the state economy in tourism/recreation between 2012 and 2017.
Figure A-6: Florida Visitor Contribution to the Economy, 2012-2017
Source: CPCS Analysis of “The Economic Impact of Out-of-State Visitors in Florida”, VISIT Florida, 2016
2.5%
6.1%
8.8%
9.3%
9.5%
10.5%
12.2%
15.0%
15.7%
18.8%
0% 2% 4% 6% 8% 10% 12% 14% 16% 18% 20%
Manufacturing
Government
Trade, Transportation, and Utilities
Other Services (Except Government)
Financial Activities
Self-Employed and Unpaid Family Workers
Leisure and Hospitality
Professional and Business Services
Construction
Education and Health Services
91
.5 M
94
.3 M
98
.5 M
10
6.6
M
11
2.4
M
11
6.5
M
$9
1.4
bn
$9
8.5
bn
$1
04
.7 b
n
$1
08
.8 b
n
$1
11
.7 b
n
0
20
40
60
80
100
120
2012 2013 2014 2015 2016 2017Visitor Numbers (Million) Visitor Spending in Tourism/Recreation ($Billion)

FINAL REPORT | Florida Passenger Rail System Study Client Ref: RFP Number 917
| 94
Despite the high density of settlement, Florida has a lower percentage of people using transit for work commutes, compared to the rest of the country. While the rates for solo driving and carpooling is similar to the rest of the US, twice as many Floridians travel to work by other means. This includes walking, bicycling, working from home, ride-hailing, and other means. Figure A-7 compares mode of travel for work commute between Florida and the entire US.
Figure A-7: Mode of Travel for Work Commute, 2016
Source: CPCS Analysis of US Census Data
79%
9%2%
19%
76%
9% 5%10%
0%
20%
40%
60%
80%
100%
Drive Alone Carpool Transit Other Means
Florida US

FINAL REPORT | Florida Passenger Rail System Study Client Ref: RFP Number 917
| 95
Appendix B. Florida Passenger Rail Systems outside the Scope of the Study
This section summarizes urban rail systems that are present in Florida. As these systems fall outside the scope of this study, they will be presented here for informational purposes only. Figure B-1 lists urban rail systems in Florida.
Figure B-1: Urban Rail Systems
Name Ownership Operating Agency
Length (mi)
Type of Service Location Annual Ridership
Miami Metrorail
Miami-Date County
Miami-Dade Transit
25 Heavy Rail Rapid Transit
Miami-Dade County
20 million
Miami Metromover
Miami-Date County
Miami-Dade Transit
4.4 Automated Peoplemover
Miami-Dade County
360 thousand
JTA Skyway Jacksonville Transportation
Authority
Jacksonville Transportation
Authority
2.5 Automated Peoplemover
(Monorail)
Jacksonville 481 thousand65
TECO Line Streetcar
City of Tampa Hillsborough Area Reg. Transit
2.7 Heritage Streetcar Tampa 278 thousand
Source: CPCS Analysis of Metrorail, Metromover, TECO Streetcar, and Skyway Websites
Other passenger rail systems in Florida (not presented here) include:
1. Amusement Park Rail – Walt Disney World Monorail, Walt Disney World Railroad, Okavango Railroad (Jacksonville Zoo), and Serengeti Railway (Busch Gardens).
2. Tourist or Excursion Rail – Florida Gulf Coast Railroad Museum, Inland Lakes Railway, Florida Railroad Museum, Gold Coast Railroad Museum, Railroad Museum of South Florida, Seminole Gulf Railway, Orlando and North Western Railway, and Star Clipper Dinner Train.
65 Advanced Transit Presentation, Oct 2015

FINAL REPORT | Florida Passenger Rail System Study Client Ref: RFP Number 917
| 96
Source: Miami Miami-Dade Transit
Miami Metrorail is a 25-mile two-line heavy rail rapid transit system connecting the urban center of Miami with its northern and southern suburbs.
The system is part of Miami-Dade Transit (MDT) and is integrated with Metromover, a peoplemover in Downtown Miami and with bus services run by MDT.
The Green and Orange Metrorail lines have 23 stations and carry approximately 20 million passengers annually.
The Strategic Miami Area Rapid Transit Plan (SMART), developed by Miami-Dade County and the Planning Organization (TPO) in 2016, includes six new rail transit corridors and a series of Bus Rapid Transit (BRT) lines.
Type: Heavy Rail Rapid Transit Track Length: 25 miles Lines: 2 Stations: 23 Power System: Third Rail Service Hours: 5AM to Midnight Train Frequency: Peak: 5-10 min Off-Peak: 7-15 min Annual Ridership: 20 million
Miami Metrorail

FINAL REPORT | Florida Passenger Rail System Study Client Ref: RFP Number 917
| 97
Source: Miami Miami-Dade Transit
Metromover is a 3-line 21-station automated peoplemover (APM) system that provides free service in Downtown Miami. Annual ridership is 360 thousand passengers each year. Metromover connects with Metrorail at Government Center and Brickell stations. Metromover began operating 1986 and was expanded in 1994. In 2002 Miami-Date Transit made Metromover free to ride. There are plans to expand service to South Beach and the Midtown area, as part of the SMART plan.
Miami Metromover
Type: Automated Peoplemover (APM) Track Length: 4.4 miles Lines: 3 Stations: 21 Power System: Third Rail Service Hours: 5AM to Midnight
Train Frequency: 1.5 to 6 min
Annual Ridership: 360 thousand
Task 1.1.3: Sources: System Map and Information –

FINAL REPORT | Florida Passenger Rail System Study Client Ref: RFP Number 917
| 98
Source: Jacksonville Transportation Authority
The Skyway is an elevated and automated people mover monorail serving Downtown Jacksonville that began operating in 1989 and was subsequently extended in 1996, 1998, and 2000. Currently, the 2-line monorail has eight stations on both sides of the St. John River, providing free service to nearly 5,000 passengers on a daily basis. Jacksonville Transit Authority (JTA) operates and maintains the Skyway. After considering closure, in 2017, the JTA announced that the Skyway would keep operating for at least another five years.
Jacksonville Skyway
Type: Automated Monorail Track Length: 2.5 miles Lines: 2 Stations: 8 Power System: Side Rail Service Hours: M-F 6AM-9PM S/Su Special Events Only
Train Frequency: Peak: 4 min
Off-peak: 8 min
Annual Ridership: 481 thousand Task 1.1.5: Source: Jacksonville Transit Authority

FINAL REPORT | Florida Passenger Rail System Study Client Ref: RFP Number 917
| 99
Source: Hillsborough Area Regional Transportation Authority
Task 1.1.6: Sources: System Map and Information –
The Hillsborough Area Regional Transportation Authority operates the historic TECO Line Streetcar System in Tampa and owned by the City of Tampa.
The current system opened 2002 and was extended in 2010 to a total of 2.7 miles.
In 2016, the streetcar carried 278 thousand passengers with an average daily ridership of 780 passengers. Additional extensions north are planned.
Type: Heritage Streetcar Track Length: 2.7 miles Lines: 1 Power System: Overhead Wire Service Hours: Mon-Thu 12P-10:30P Fri-Sat 11A-2A Sun 12P-9P Frequency: 20-30 min Annual Ridership: 278 thousand
TECO Line Streetcar System

FINAL REPORT | Florida Passenger Rail System Study Client Ref: RFP Number 917
| 100
Appendix C. Detailed Analysis of Florida Passenger Rail System Financial Figures

FINAL REPORT | Florida Passenger Rail System Study Client Ref: RFP Number 917
| 101
C1. Amtrak 1. Background, Ownership and History
Originally created in 1970 as a for-profit government corporation with trackage rights over all freight railroads, Amtrak was converted to a private entity in 1997 in an effort to make the railroad more self-sufficient. Since 1997, Amtrak has continued to receive public funds through annual appropriations to continue operating, although the funding has been far below requested levels.
At its inception, Amtrak began a series of rail services linking Florida with other U.S. destinations. These included the Silver Star (New York-Miami – St. Petersburg), Silver Meteor (New York-Miami), Champion (New York – St. Petersburg), and Floridian (Chicago – St. Petersburg/Miami). Among these, the Silver Star and the Silver Meteor are still in service, along with the addition of the Auto Train (Lorton, Virginia – Sanford, Florida). While the first Silver Meteor and the Silver Star are conventional passenger intercity rail services, the Auto Train is an overnight service that provides car drivers with a way to transport themselves and their cars without having to drive, acting as a car shuttle between the Northeast and Florida.
Overall, Amtrak covered 95 percent of its qualified operating expenses in Fiscal Year 2017 through ticket sales, payments from state partners and agencies, and other revenue.
Figure C-1: Amtrak in the 1970s: Florida-Bound Silver Meteor Train (Left) and Jacksonville Station (Right)
Source: (Florida-Bound Train with Palmettos, Jacksonville, Fla., Amtrak Station) Amtrak Archives
2. Infrastructure
Amtrak trains operate over track that is owned by other railroads for 72 percent of its line miles nationally. Most of the Amtrak-owned line mileage is located between Washington, DC and Boston (Northeast Corridor) and between Philadelphia, PA and Harrisburg, PA (Keystone Corridor).
Amtrak does not own any track in Florida, but operates a maintenance facility in Hialeah. Amtrak’s Southern Division, which is responsible for Amtrak’s operations in the Southeastern

FINAL REPORT | Florida Passenger Rail System Study Client Ref: RFP Number 917
| 102
United States, is headquartered in Jacksonville. The railroad also has train and engine crews based in Miami, Sanford, and Jacksonville, an onboard service crew based in Hialeah, as well as contractor-operated commissaries in Hialeah and Sanford.
3. Operations
Nationally, Amtrak operates over 300 daily trains each day, serving over 500 destinations on over 21,400 miles of routes. In Fiscal Year 2017 (October 2016 to September 2017), Amtrak transported over 31.7 million passengers over its entire route network.
In Florida, Amtrak handled a total of 923,483 boardings and alightings in Fiscal Year 2017. Amtrak serves 18 stations in Florida. In Fiscal Year 2016, Amtrak transported 468,214 intra-state riders, traveling a total of 273,181,646 rail passenger-miles and generating $64 million in revenue for Amtrak. The railroad supports 2,780 jobs in the state, contributing $31.8 million GDP (value-add) to the region (Amtrak Contribution to Florida, 2016).
In Florida, Amtrak operations provided $16.3 million in public safety cost savings from the lower risk of traveling by train compared to traveling by car. Half of Amtrak riders were tourists in 2016, generating $860,000 in tourist spending. Nearly 67 percent of Florida's population lives within 30 miles of an Amtrak station.
4. Florida Services
Amtrak operates three services within Florida. A service map of existing and discontinued service is shown in Figure C-2.
Existing Services
Amtrak operates three services in Florida: the Silver Meteor, Silver Star, and Auto Train.
1. Silver Meteor runs daily from New York to Miami, a total of 527.1 miles. The train makes Florida stops in Jacksonville, DeLand, Orlando, Winter Haven, Sebring, Okeechobee, West Palm Beach, Delray Beach, Deerfield Beach, Fort Lauderdale, and Hollywood, before terminating in Miami.
2. Silver Star runs daily from New York to Miami, a total of 664.8 miles. The Silver Star makes Florida stops in Palatka, Winter Park, Kissimmee, Lakeland, and Tampa, before circling back onto the same route as Silver Meteor between Winter Haven and Miami.
3. Auto Train is an 855-mile rail service that runs daily between Lorton, Virginia (near Washington, DC) and Sanford, Florida on a 16.5-hour overnight trip. The train consists of Superliner coaches and sleepers for passengers and auto carrier cars for their vehicles. In Fiscal Year 2017, this train carried 228,943 passengers and 123,772 vehicles.66 In Florida, this train uses track owned by SunRail and CSX.
66 Amtrak State Fact Sheet: Florida 2017

FINAL REPORT | Florida Passenger Rail System Study Client Ref: RFP Number 917
| 103
Figure C-2: Amtrak Service Map in Florida
Source: CPCS Analysis
Expansion Plans: Discontinued Sunset Limited Service
Amtrak’s Sunset Limited line is the Country’s second longest passenger train. In 2005, due to track damage from Hurricane Katrina, Amtrak’s Sunset Limited Service east of New Orleans was suspended. The service is yet to be reinstated, despite repairs to the line in 2006 by CSX. Currently, BNSF and UP each own parts of the line from Los Angeles, CA to New Orleans, LA. CSX owns the line from New Orleans, LA to Jacksonville, FL.
In 2015, Amtrak, the Federal Railroad Administration (FRA) and the Southern Rail Commission analyzed the feasibility of restoring passenger service to parts of the line between New Orleans and Jacksonville. Later in 2016, Amtrak ran a test train on the restored tracks as a result of those studies. Due to projected low ridership levels and new safety and reliability requirements, the service has not been restored.

FINAL REPORT | Florida Passenger Rail System Study Client Ref: RFP Number 917
| 104
The final report to Congress submitted by the FRA in July 2017 estimated that $117 million in capital costs were required to restore service and additional budget was required for planning and development of the project. According to the Southern Rail Commission, the time frame for restoring passenger service between New Orleans and Jacksonville is 2020 or later.
5. Ticket Revenue
On a national level, Amtrak achieved record system-wide ridership and ticket revenues in Fiscal Year 2017. This was due to improved market demand, better revenue management, and higher state/agency capital amortization.67
Amtrak fares vary by expected demand, distance, and ticket type. Amtrak offers the following ticket types from lowest to highest cost: Saver, Value, Flexible, Business, and Premium. Within the Premium class, different rooms are offered at different price points: Viewliner Roomette and Viewliner Bedroom (Silver Line); and Superliner Roomette, Family Bedroom, and Superliner Bedroom (Auto Train).
The full length of the journey costs anywhere between $124-$340 for Saver, Value, and Flexible tickets on both Silver Star and Silver Meteor trains. Business and Premium tickets for the full length of the journey will vary between $342 and $1043. Silver Star Premium tickets are priced slightly less expensive than the Silver Meteor Premium tickets, because Silver Meteor has a full-service dining car with all meals included in fares paid by sleeping car passengers.
Auto Train passenger tickets for a full-length journey range from $112 to $272 for the Saver, Value, and Flexible tickets. Premium tickets can go as high as $1084 for the Superliner Bedroom.
6. Revenue from the Government for Operating Train Services
Amtrak is dependent on funding from the Federal Government to operate the national passenger rail system and to maintain the infrastructure that it owns (Amtrak owns no rail line infrastructure in the State of Florida and has trackage rights on other railroads’ tracks for operating its trains). This federal funding usually flows through annual appropriations and is then provided to Amtrak by the FRA, pursuant to annual grant agreements.
The Passenger Rail Reform and Investment Act (PRRIA) in 2015 authorized $8.1 billion in annual grants to Amtrak for Fiscal Year 2016 – 2020. $2.6 billion supports Amtrak’s Northeast Corridor and $5.5 billion supports Amtrak’s National Network. An additional $2.2 billion is authorized for other rail grant programs that Amtrak may participate in. These appropriations began in Fiscal Year 2017 due to deferred implementation based on when the FAST Act was enacted.
Several states provide direct funding to support operations, totaling $224.0 million in Fiscal Year 2017. States providing funding include: California, Connecticut, Illinois, Indiana, Maine, Massachusetts, Michigan, Missouri, New York, North Carolina, Oklahoma, Oregon, Pennsylvania, Texas, Vermont, Virginia, Washington, and Wisconsin. The State of Florida does
67 Amtrak Fiscal Year 2017 Financial Statements

FINAL REPORT | Florida Passenger Rail System Study Client Ref: RFP Number 917
| 105
not provide direct revenues to Amtrak and Amtrak does not provide intra-state trains, except for those mentioned previously.
7. Revenue for Infrastructure Maintenance and Improvements
The National Surface Transportation and Innovative Finance Bureau of the Federal Government (Build America Bureau) also provides financing to Amtrak through the Railroad Rehabilitation and Infrastructure Financing (RRIF) Program.
Authorized competitive and partnership grant programs where Amtrak may apply for Fiscal Year 2016 – Fiscal Year 2020 include a total of $1.1 billion authorized for rail infrastructure and safety improvements, $1.0 billion for federal-state partnership grants for state-of-good-repair projects, and $100 million for rail restoration and enhancement grants. No funds were received through these programs in Fiscal Year 2016 or Fiscal Year 2017. Most of these funds are appropriated for infrastructure projects, and Amtrak owns little infrastructure in Florida.
The Continuing Appropriations Act, 2018, and Supplemental Appropriations for Disaster Relief Requirements Act, 2017, provide funding for Amtrak for Fiscal Year 2018. No federal funds have been appropriated subsequent to February 8, 2018.
8. Other Revenues
Amtrak also receives funds for engineering and capital improvement projects, revenue for providing access to Amtrak-owned tracks for other railroads, commercial development revenue from retail, parking, advertising, real property leases/easements/sales and access fees, contractual agreements to operate commuter rail services, amortization of state funds to acquire depreciable assets, and freight access fee revenue from freight railroad companies (Amtrak Fiscal Year 2017 Financial Statements).68
9. Capital and Operating Costs
Funds from state and local entities and federal appropriations are used for capital spending programs. Figure C-3 provides Amtrak’s capital expenditures broken down by department for its entire network for Fiscal Year 2017. Amtrak financial statements do not break out expenditure by state.
Figure C-3: Amtrak Capital Expenditures (in millions) – Fiscal Year 2017 and Fiscal Year 2016 Comparison
Expenditure Fiscal Year 2017 ($M)
Fiscal Year 2016 ($M)
Engineering $1,010.0 $863.5
Mechanical $265.7 $322.1
Information Technology (IT) $124.3 $43.2
Other $515.9 $367.2
Total $1,915.9 $1,596.0
Source: Amtrak Fiscal Year 2017 Financial Statements
68 Amtrak Fiscal Year 2017 Financial Statements

FINAL REPORT | Florida Passenger Rail System Study Client Ref: RFP Number 917
| 106
Capital expenditures increased by $320 million in Fiscal Year 2017 due to various major expenditures needed to continue to provide safe, efficient, and reliable service. This includes various right-of-way (track, signals, substations) replacement and upgrade projects, station and facility as well as other upgrades.
Mechanical expenditures include overhauls and conversions of AmFleet (single-level intercity passenger cars built in the 1970s and 1980s), Superliners (bi-level passenger cars built in the 1970s and 1990s), locomotives, and other passenger cars.
Information Technology (IT) programs to improve operations and customer experience, and other major capital expenditures through Next-Generation High-Speed trainsets, also contributed to this higher level of capital expenditures in Fiscal Year 2017.
Figure C-4 provides a summary of total operating expense in millions for both Fiscal Year 2017 and Fiscal Year 2016. Operating costs decreased by 1.2 percent in Fiscal Year 2017, primarily due to lower depreciation and amortization as well as lower casualty and other claims, partially offset by higher costs for fuel, power, utilities, and materials.
Figure C-4: Total Operating Expenses (in Millions) – Fiscal Year 2017 and Fiscal Year 2016 Comparison
Expense 2017 ($M) 2016 ($M) $M Change % Change
Salaries, Wages, and Benefits $2,084.6 $2,087.6 (3.0) (0.1)%
Train Operations 287.6 300.2 (12.6) (4.2)
Fuel, Power, and Utilities 239.7 230.4 9.3 4.0
Materials 165.3 157.9 7.4 4.7
Facility, Communication, and Office-Related 179.9 174.9 5.0 2.9
Advertising and Sales 106.9 104.4 2.5 2.4
Casualty and Other Claims 70.7 72.9 (2.2) (3.0)
Depreciation and Amortization 767.0 813.4 (46.4) (5.7)
Other 454.5 468.7 (14.2) (3.0)
Indirect Cost Capitalized to Property and Equipment (145.8) (149.1) 3.3 (2.2)
Total Operating Expenses 4,210.4 4,261.3 (50.9) (1.2)
Source: Amtrak Fiscal Year 2017 Financial Statements
Overall, Amtrak covered 95 percent of its qualified operating expenses in Fiscal Year 2017 through ticket sales, payments from state partners and agencies, and other revenue.
This does not include depreciation and amortization expenses, capital project related expenditures, post-retirement employee benefit cost, and Office of Inspector General (OIG) expenses.
Figure C-5 provides Amtrak’s Fiscal Year 17 Consolidated Results of Operations, indicating that Amtrak continues to operate at a net loss. The service ended Fiscal Year 2017 with a net loss of $968.7 million, which was a 10.3 percent decrease from the prior fiscal year net loss of $1.08

FINAL REPORT | Florida Passenger Rail System Study Client Ref: RFP Number 917
| 107
billion. These losses are compensated from various sources mentioned previously in this chapter.
Figure C-5: Amtrak Consolidated Results of Operations (In Millions)
Item Fiscal Year 2017 ($M)
Fiscal Year 2016 ($M)
$M change % change
Total Revenues $3,305.7 $3,240.6 $61.5 2.0%
Total Operating Expenses $4,210.4 $4,261.3 (50.9) (1.2)
Net Other Expense $61.9 $58.0 3.9 6.7
Loss Before Income Taxes $966.6 $1,078.7 (112.1) (10.4)
Income Tax Expense $2.1 $1.8 0.3 16.7
Net Loss $968.7 $1,080.5 (111.8) (10.3)
Ridership 31.7 million 31.3 million 0.4 1.3%
Source: Amtrak Fiscal Year 17 Financial Statements

FINAL REPORT | Florida Passenger Rail System Study Client Ref: RFP Number 917
| 108
C2. Tri-Rail 1. Background, Ownership and History
Tri-Rail originally began operations on January 9, 1989, as a temporary commuter rail service to alleviate highway congestion during Interstate 95 and turnpike construction work. Higher than expected ridership made Tri-Rail a permanent service. Tri-Rail is managed by the South Florida Regional Transportation Authority (SFRTA), and the line is wholly owned by the Florida Department of Transportation (FDOT). The existing map is shown in Figure C-6.
Figure C-6: Tri-Rail Service Map
Source: CPCS Analysis
Tri-Rail operates on a right-of-way that was used in the early 1920s by the Seaboard-All Florida Railway for intercity passenger rail service from New York City. Later, this right-of-way became

FINAL REPORT | Florida Passenger Rail System Study Client Ref: RFP Number 917
| 109
the Miami subdivision of CSX, which was purchased by the Florida Department of Transportation in 1988.69
CSX handled dispatch services, track maintenance, and had exclusive freight trackage rights (which was used for approximately 10 daily freight trains) until March 29, 2015. Dispatch and maintenance are now managed by the South Florida Regional Transportation Authority (SFRTA). In Fiscal Year 2017, Tri-Rail transported 4.26 million passengers and required a subsidy per passenger of $18.12, which is $0.65 per passenger-mile.
2. Infrastructure and Rolling Stock
The system is 72 miles long with 18 stations, running parallel the Southeast Florida Coast. The system connects directly to Amtrak at six stations and to Miami Metrorail at two stations. Tri-Rail also provides connections to the region’s three major airports: Miami International Airport (MIA) via a peoplemover system, Fort Lauderdale – Hollywood International Airport (FLL) via a bus shuttle, and Palm Beach International Airport (PBI) via a bus shuttle. In addition to Tri-Rail trains, the rail line is shared with Amtrak’s Silver Meteor and Silver Star. CSX Transportation continues to run freight trains on this line.
As shown in Figure C-7, Tri-Rail’s total active fleet consists of 10 trainsets. Each trainset is made up of a single locomotive, two trailer cars, and a cab car. Tri-Rail has 24 active locomotives, 21 active cab cars, and 29 active trailer cars. Tri-Rail also operates 28 commuter buses that connect to its stations.70
Figure C-7: Tri-Rail Fleet
Manufacturer Type Qty.
Locomotives
Morrison-Knudsen MK F40PHL-2 3
MPI MK F40PH-2C 3
EMD* EMD F40PH (Originally Amtrak F40PHs, rebuilt by MPI) 2
EMD EMD GP49PH-3 6
Brookville BL36PH 10
Total Locomotives 24
Passenger Cars
Bombardier Bi-Level Cab 11
Bombardier Bi-Level Trailer 15
Hyundai/Rotem Control Trailer Coach BTC-5 (Cab) 10
Hyundai/Rotem Blind Trailer Coach BTC-5 (Trailer) 14
Total Cars 50
Source: Tri-Rail Coastal Link Study71 and SFRTA Forward Plan Fiscal Year 2018 - 202772
69 South Florida East Coast Corridor Transit Analysis Study: Environmental Impact Assessment, FTA, USDOT and FDOT, 2006 70 Tri-Rail Fact Sheet, September 2017 71 Preliminary Project Development Report, Tri-Rail Coastal Link Study, 2014 72 Transit Development Plan. SFRTA Forward Plan. Fiscal Year 2018-2027.

FINAL REPORT | Florida Passenger Rail System Study Client Ref: RFP Number 917
| 110
3. Operations
Tri-Rail currently operates 25 round-trips between Miami Airport and Mangonia Park on weekdays and 15 round-trips on weekends over a 72-mile line. In Fiscal Year 2017, Tri-Rail ridership totaled 4.26 million riders. Assuming the average train consists of three, 162-seat cars, Tri-Rail has a 27.1 percent average load factor, assuming that on average passengers travel for half the line distance.
4. Maintenance
In 2017, a 10-year contract for Operating Services, which includes Maintenance of Equipment, Train Operations, Station Maintenance, and Dispatching was awarded to Herzog Transit Services.
Maintenance of Way for track and signals is contracted to VMTI, wholly owned by Transdev, under a 7-year contract, which began in 2015. VMTI has subcontracted the signaling part of the contract to Xorail.
5. Expansion Plans
In a 2015 document, SFRTA identified a number of capacity-improvement projects, including connecting Tri-Rail to Miami Central Station by Q3 2019 and a capacity improvement project for a single-track bridge, north of Miami International Airport (SFRTA Miami-Dade County Rail Opportunities, 2015). SFRTA has also identified a number of corridors which should be studied in the medium- to long-term. A summary of these projects is provided in Figure C-8 and a map of these projects and corridors is provided below in Figure C-9. More information on two of these projects is provided below.
Figure C-8: Proposed Expansion Projects by SFRTA
Source: Miami-Dade County Rail Opportunities. Improving Mobility in Miami-Dade County.73
73 Miami-Dade County Rail Opportunities. Improving Mobility in Miami-Dade County. SFRTA, 2015
Expansion Project / Corridor Length (mi)
Ownership New Stations
Grade Crossings
Timeline Estimated Cost
Status
Downtown Miami Station 8 All Aboard
Florida 1 19 Q3 2019 $68.9M Under Construction
Rail Bridge expansion north of Miami Intermodal Center
<1 State of Florida
– – 2019-2020 $27M to
$50M In Planning. EIR
completed as of 02/2018.
Coastal Link Extension 85 TBD 25 TBD <6 years TBD Negotiations between SFRTA and Brightline
Dolphin/East-West Extension 11 State of FL
and CSX 6 12 3-6 years
$150M to $190M
Proposed
Okeechobee Link 9.5 FCC Railway 3 TBD >6 years $325M Proposed
Kendall/Homestead Extension
29 State of FL
and CSX 8 34 3-6 years $300M Proposed
Miami Int’l Airport/ Port Miami Extension
12 State of FL
and FEC 1-2 37 3-6 years $25M Proposed

FINAL REPORT | Florida Passenger Rail System Study Client Ref: RFP Number 917
| 111
Figure C-9: South Florida Passenger Rail Expansion Projects
Source: CPCS Analysis
Downtown Miami Link
This 9-mile section of the Coastal Link Expansion project is known as the Tri-Rail Downtown Miami Link (TRDML). The TRDML line will provide a connection from the existing Tri-Rail line to the new Miami Central Station in Downtown Miami. Once the link is complete, the transit hub will serve both Tri-Rail and Brightline trains as well as other local public transit. Tri-Rail’s connection to the station is expected to be complete sometime in 2019.

FINAL REPORT | Florida Passenger Rail System Study Client Ref: RFP Number 917
| 112
Coastal Link Expansion
South Florida Regional Transportation Authority (SFRTA) announced plans for a second commuter rail line along the along the Florida East Coast Railway corridor in 2010. This project was also envisioned in the 2025 and 2030 Long Range Transportation Plans (LRTP).
In a collaboration with FDOT and local Metropolitan Planning Organizations, SFRTA published a preliminary study of alternatives for a commuter rail service from Miami to Jupiter that would operate on existing tracks of Florida East Coast (FEC) Railway, the same corridor that Brightline uses to run its trains. The purpose of this expansion is to provide additional capacity to Tri-Rail’s existing commuter rail services, which currently operate in a parallel corridor, west of the I-95 corridor.
The Coastal Link project is planned to be implemented in multiple phases and the service would operate daily between 4 AM and midnight, with 30-minute peak and 60-minute off-peak headways.74
FDOT estimated a $600-$800 million capital cost for the entire Coastal Link system (2014 projections) with an additional $40 million annual budget for operation and maintenance. Tri-Rail expected to be able to cover 50 percent of the capital costs through federal funding programs and the other 50 percent through State and local funding. The Coastal Link Expansion project received a federal Transportation Investment Generating Economic Recovery (TIGER) grant for the construction of Norwood and IRIS connection tracks.75 The initial environmental work on this project has been completed.
In 2017, negotiations stalled between SFRTA and Brightline as Brightline was looking to explore the possibility of running commuter service independent of SFRTA along its tracks. Currently, this project is on hold until FDOT finds a viable funding source for operating and maintaining the expanded commuter rail system and negotiates a way forward with Brightline.
6. Farebox Revenue
As shown in Figure C-10, in Fiscal Year 2017, 4.26 million passengers rode Tri-Rail, a 0.5 percent increase from the previous year. Riders increased most significantly on Saturdays (2.48 percent) and Sundays (2.69 percent). Holiday ridership fell by 17.15 percent year-over-year, but this amounted to just a decline of 4,693 passengers.
Tri-Rail fares are dependent on the number of zones traveled and whether purchasing a one-way or round-trip ticket. Twelve-ride and monthly tickets are also available. Figure C-11 provides Tri-Rail’s fare chart.
Discounts on full fare products are provided for purchasing a round-trip fare (12-17 percent discount compared to 2 one-way tickets), or 12-trip tickets (approximately a 30 percent
74 Tri-Rail Coastal Study, FDOT, July 2018 75 Moving Our Region Forward, SFRTA, Fiscal Year 2018-2027

FINAL REPORT | Florida Passenger Rail System Study Client Ref: RFP Number 917
| 113
discount over 12 one-way fares). Discounts of 25 percent are available to participating employers who are members of the Employer Discount Program (EDP).
Figure C-10: Tri-Rail Ridership (in Millions) Fiscal Year 2008 – Fiscal Year 2017
Source: SFRTA Fiscal Year 2017 Comprehensive Annual Financial Report
Discounts are also available for riders who are 65 years old or above, persons with disabilities and children up to 18 years of age. Riding is free for those below 5 years of age.
Groups of 25 or more are also eligible to receive a 15 percent discount if Tri-Rail is notified two weeks prior to the trip.
Figure C-11: Tri-Rail Fare Chart
Number of Zones Traveled
One Way Discount One Way
Round Trip Discount Round Trip
12-Trip
Single Fares
1 $2.50 $1.25 $4.40 $2.50 $21.25
2 $3.75 $1.90 $6.25 $3.75 $31.25
3 $5.00 $2.50 $8.45 $5.00 $41.90
4 $5.65 $2.80 $9.70 $5.65 $47.50
5 $6.25 $3.15 $10.65 $6.25 $52.50
6 $6.90 $3.45 $11.55 $6.90 $57.50
Type Full Fare Discount
Passes
Weekend and Holiday Day Pass (regardless of the number of zones) $5.00 $2.50
Tri-Rail Monthly Pass (regardless of the number of zones) $100 $50
Regional Monthly Pass – Unlimited rides on Tri-Rail, Miami-Dade Transit $145 $72.50
Source: Tri-Rail Website
0
1
2
3
4
5
2008 2009 2010 2011 2012 2013 2014 2015 2016 2017
Mill
ion
s o
f A
nn
ual
Rid
ers

FINAL REPORT | Florida Passenger Rail System Study Client Ref: RFP Number 917
| 114
Tri-Rail and Miami Dade Transit use an interoperable smart card that can be used as an e-wallet (charged with money that can be deducted based on use) or can be loaded with tickets and passes.
7. Other Revenue
In addition to farebox revenue, Tri-Rail also receives subsidies from the three counties, non-capital grants from the state and federal governments and other funding sources.
Each of the three counties contributes $1.6 million annually in operating funds and $2.67 million annually for future capital projects to SFRTA, following state legislation in June 2004. The three counties have made a cumulative total of $112.1 million in contributions.
Additionally, SFRTA also receives funding from the state, which helps fill the gap between the county statutory funding requirement and Tri-Rail’s annual operating costs as shown in Figure C-12.
Figure C-12: SFRTA Funding from the State
Dates Authorization Description Amount
Fiscal Years 2011 – 2015
FL Statutes-Title XXVI Public Transportation Section 343.51 (2009)
Dedicated funding source for Tri-Rail from the State Transportation Trust Fund
$30.6 million total
($13.3 million annual transfer for operations, maintenance, and dispatch + $17.3 million in additional funding for operating assistance)
Fiscal Year 2016 – present
FL Statutes-Title XXVI Public Transportation Section 343.58(4)(a)2. (2015)
Amended State Transportation Trust Fund annual funding requirements to Tri-Rail. Excess costs to be shared with FDOT based on operating agreement percentages between FDOT and SFRTA.
$42.1 million total
($15 million for operations, maintenance, and dispatch + $27.1 million additional funding for operating assistance)
Source: SFRTA Fiscal Year 2017 Comprehensive Annual Financial Report
Tri-Rail also receives various federal grants from the FTA (Preventive Maintenance and Planning) grants program and the FHWA grants. Other funding from private companies and other local funding sources constitute $100,000 and $85,000 respectively. A summary of Tri-Rail’s total revenue is shown in Figure C-13.
Figure C-13: Tri-Rail Total Revenue Summary Fiscal Years 2017, 2016, and 2015 (in $ Millions)
Revenue Source 2017 ($M) 2016 ($M) 2015 ($M)
Operating Revenue $14.1 $13.6 $13.2
Interest Income $0.4 $0.3 $0.1
FTA $24.6 $24.2 $26.0
FHWA $4.0 $4.0 $4.0
State Grants (FDOT) $55.2 $55.3 $43.1
County Contribution $4.7 $4.7 $4.7
Other $0.2 $0.2 $0.2
Total Revenues $103.3 $102.2 $91.2
Source: SFRTA Fiscal Year 2017 Comprehensive Annual Financial Report

FINAL REPORT | Florida Passenger Rail System Study Client Ref: RFP Number 917
| 115
8. Capital Costs
SFRTA’s commitments for construction projects as of June 30, 2017, include the following listed in Figure C-14.
Figure C-14: SFRTA Construction Commitments as of June 30, 2017 (in millions)
Contractor Name Project Contract Amount
($M)
Completed to Date
($M)
Balance ($M)
HDR Engineering The Wave $19.97 $15.61 $4.4
Xorail Positive Train Control $39.72 $1.19 $38.5
All Aboard Florida Track Improvements at Miami Central Station $16.19 $1.45 $14.74
Transdev (VTMI) Northwood Crossover $4.81 $0.73 $4.08
All Aboard Florida Downtown Miami Central Station $48.90 $32.45 $16.46
Total $129.59 $51.43 $78.16
Source: SFRTA Fiscal Year 2017 Comprehensive Annual Financial Report
All construction in progress as of the end of Fiscal Year 2017 total approximately $131.2 million. This includes station improvement projects of $30.3 million, $39.4 million for the All Aboard Downtown Miami Station, other projects making up $44.6 million, and rolling stock of $16.8 million.
SFRTA has a State Infrastructure Bank Loan Agreement in the amount of $19.3 million for the New SFRTA Operations Center. The loan term is 5 years with an interest rate of 1.55 percent per annum compounded annually, and a $14.0 million draw was made in July 2017.
SFRTA also has a Loan and Security Agreement worth $48.63 million with FECI EC Holding Company, LLC in order to fund the total cost of Tri-Rail station improvements. This line of credit is payable one year after the completion of the project at an annual rate of 9.65 percent. A $9.1 million balance exists as of June 30, 2017, representing the total amount funded by SFRTA.
Lastly, SFRTA also has a Note and Security Amount worth $22 million with Bank United, N.A. to fund the Tri-Rail Downtown Miami Service, specifically the 8.5-mile trackage improvements, access/easement fees, and PTC equipment on the rolling track. The term on the note is 5 years with an interest rate of 2.25 percent per annual, compounded annually. There is no outstanding balance as of June 30, 2017.
9. Operating Costs
Operating Ratio is a profitability measurement calculated by taking operating expenses and dividing it by operating revenues. Figure C-15 provides the operating ratios for Tri-Rail from Fiscal Year 2010 to Fiscal Year 2017. In 2015, Tri-Rail saw a jump in operating costs, compared to the previous year as Tri-Rail took over dispatch and maintenance from CSX. In these figures, operating revenues include revenues from ticket sales and other revenues (e.g. advertising, concessions, and vending machines).

FINAL REPORT | Florida Passenger Rail System Study Client Ref: RFP Number 917
| 116
Figure C-15: Tri-Rail Operating Revenues and Expenses 2010-2017
Year Operating
Revenues ($M)
Year over Year Change
Operating Expenses
($M)
Year over Year Change
Operating Ratio (Operating Expenses /
Operating Revenues) ($M)
2017 $14.1 +3.9% $143.8 +6.91% 10.2
2016 $13.1 +2.6% $134.5 +11.43% 10.3
2015 $12.8 -0.1% $120.7 +13.33% 9.4
2014 $12.8 +6.3% $106.5 +6.29% 8.3
2013 $12.0 +0.9% $100.2 +4.38% 8.4
2012 $11.9 +9.5% $96.0 +2.78% 8.1
2011 $10.9 +5.9% $93.4 +7.48% 8.6
2010 $10.3 +5.6% $86.9 +20.69% 8.4
Source: SFRTA Fiscal Year 2017 Comprehensive Annual Financial Report
An operating subsidy is financial support extended from the government to fund rail operations. Using this general definition of subsidies, Tri-Rail received approximately $88.73 million in operating subsidies in Fiscal Year 2017:
$4.7 million from the counties annually
$184,795 in other local funding
$55.22 million from the state in Fiscal Year 2017
$24.63 million from the FTA (Preventive Maintenance Grant and Planning Grant)
$4 million from the Federal Highway Administration (FHWA)
In Fiscal Year 2017, Tri-Rail required a subsidy per passenger of $18.12 and subsidy per passenger mile of $0.65.
This level of farebox recovery is lower and the level of subsidy is higher than comparable systems around the country.

FINAL REPORT | Florida Passenger Rail System Study Client Ref: RFP Number 917
| 117
C3. SunRail 1. Background, Ownership, and History
SunRail is owned by the Florida Department of Transportation and overseen by the Central Florida Commuter Rail Commission, an advisory board of elected leaders from five local funding partners – the City of Orlando and Osceola, as well as Seminole, Volusia and Orange counties. The current system map is shown in Figure C-16.
Figure C-16: SunRail System Map
Source: CPCS Analysis
In 2009, the state of Florida purchased a 61-mile segment between DeLand and Poinciana from CSX in order to construct the SunRail commuter rail line. Phase 1 officially opened in May 2014 and Phase 2 South (the “Southern Expansion”) opened in July 2018.

FINAL REPORT | Florida Passenger Rail System Study Client Ref: RFP Number 917
| 118
The opening of Phase 2 South (delivered as a design-build contract) increased the rail system to a total of 48.9 miles. Funding for an additional 12-mile Phase 2 North extension from DeBary to DeLand is being sought on with no set timetable for opening the line.
While the Florida Department of Transportation (FDOT) currently owns this rail service, it will be transferring ownership of SunRail to the counties by 2021. The Central Florida Commuter Rail Commission retained H.W. Lochner beginning in July 2018, to help plan the ownership transition of SunRail from FDOT to the counties.
2. Infrastructure
SunRail operates on a mostly double-track line between DeBary and Poinciana via Orlando, with small segments of single track. Centralized Traffic Control (CTC) signaling system, together with an Automatic Block Signal (ABS) system provides safe train separation. Train dispatching and control is performed by Bombardier Operations & Maintenance (a contractor who is also responsible for maintenance-of-way and equipment servicing – see Maintenance below) from the Operations Control Center in Sanford.
Trains consist of double-decker Bombardier BiLevel cars, operating in a push-pull system with MP32PH-Q re-built diesel-electric locomotives. There are a total of 11 locomotives and a total of 20 double-decker cars (13 cab cars and 7 trailers). Trains normally operate in a locomotive + 2-car configuration (locomotive + trailer car + cab car).
3. Operations
SunRail currently operates 20 daily round-trips on weekdays only. On-time performance between January and April 2018 stood at 96 percent, surpassing SunRail’s goal of 95 percent or better. In 2015, SunRail carried a total of 957,800 passengers. More recent numbers show that over the 10-month period between July 2017 and April 2018 there were a total of 684,397 riders. Extrapolating to July 2018, the annual ridership in the latest year is likely to be between 820,000 and 830,000 riders, depending on the monthly variation. Phase 1 ridership of 3,400-3,500 boardings per day was below the initial ridership forecast of 4,300 daily boardings.76
First 3 weeks of operating the Phase 2 South expansion added 2,000 boardings per day to this figure. Ridership on the new extension is expected to grow, as usually happens with new lines in the initial months of operation, during what is known as the ramp-up period.
Assuming ridership figures from 2017-2018, that each train can hold 278 passengers, and that riders on average travel half the distance of the entire line, SunRail’s load factor can be estimated at 14.3 percent.
SunRail maximum speeds vary between 30 and 80 miles per hour with an average (commercial) speed of 33 miles per hour.
76 Consultation with SunRail, August 13, 2018

FINAL REPORT | Florida Passenger Rail System Study Client Ref: RFP Number 917
| 119
In addition to SunRail trains, three daily round-trip Amtrak trains (Silver Meteor, Silver Star, and the Auto Train) use SunRail’s line. Between 10 and 20 CSX freight trains operate nightly, between midnight and 5 AM.
4. Maintenance
The following provides a list of maintenance contractors that are used by SunRail:
Amtrak is under contract with the Florida DOT to conduct periodic, and heavy maintenance and repair of SunRail equipment at their Sanford maintenance facility (7-year contract).
Bombardier is a SunRail contractor, providing operations and maintenance services (7-year contract with a 3-year extension).
Conduent (a spin-off of Xerox) provides back-office hosting and fare equipment maintenance and operations. During the start-up period in 2014, SunRail users experienced problems with Conduent’s ticketing systems.
Herzog provides signal maintenance of way services (7-year contract).
5. Expansion Plans
Additional extension plans include Phase 2 North, a 12.2-mile, one station extension north to DeLand, and Phase 3, a 5.5-mile extension to Orlando International Airport, along an existing spur line.
Three more extensions are under consideration: north to Daytona Beach (approximately 22 mi), east to Sanford Airport via an existing spur (approximately 7.5 mi), and a third to Haines City, Auburndale, and Lakeland (an approximate total of 35 miles).
SunRail has undertaken some level of a preliminary study for each extension, but funding has not been identified and a timetable has not been set for any of these extensions.
Phase 2 North
In 2014, FDOT proposed the Phase 2 North project to extend SunRail service 12.2 miles north of DeBary station, on tracks owned by FDOT. These tracks are also used by CSX for freight and Amtrak for passenger service. Figure C-17 shows a map of proposed expansion projects. When built, one station (DeLand) will be added. The proposed project had an estimated capital cost of about $69 million with an estimated annual operating cost increase of $6.4 million. The estimated costs included finance costs, capital costs for building a new station adjacent to Amtrak’s stop in Volusia County and costs for purchasing three rail cars.77
77 SunRail Phase 2 North, FTA, July 2018

FINAL REPORT | Florida Passenger Rail System Study Client Ref: RFP Number 917
| 120
Figure C-17: Map of Proposed SunRail Expansion Projects
Source: CPCS Analysis
Like the rest of the line, the new station would operate on weekdays only, with 30-minute peak headways and 150-minute off-peak headways, similar to the current timetable elsewhere in the system. The 2011 estimations of ridership forecasted 200 daily boardings at the new station, with potential to increase this number to 600 daily boardings by 2030.
In October 2015, low ridership projections made the project ineligible for a $35 million federal grant, causing the station construction to stop. Currently, FDOT is looking for other options for increasing ridership in order to qualify for federal funding programs. One option includes adding another station in Orange City.

FINAL REPORT | Florida Passenger Rail System Study Client Ref: RFP Number 917
| 121
Phase 3 Orlando International Airport
SunRail officials proposed this 5.5-mile extension to Orlando International Airport (MCO) in 2010. Initial plans suggested using an existing 3.5-mile spur, owned by Orlando Utilities Commission (OUC), and building an additional 2 miles of new track or a transfer station with a 2-mile light rail system to the airport. From the airport station, passengers would have the option to ride an airport peoplemover to the north terminal or transfer to the Brightline service between Miami and Orlando (expected to begin service by 2021). Currently, SunRail passengers can reach Orlando International Airport via a bus shuttle from Sand Lake Road Station.
In a 2017 study, FDOT estimated a $256 million budget for this project.78 The estimated budget included the cost of building 3 miles of new double track, upgrading the OUC corridor, and building the boarding/transfer platforms. The study also provided an analysis of the no-build option, in line with NEPA requirements.
FDOT’s preliminary projections estimated 2,250 daily passengers during the first year of operation and 1,000 more daily passengers by the end of 2030. Due to higher-than-expected capital cost projections by the Project Development and Environmental Study, Phase 3 has been postponed indefinitely. Metroplan Orlando, the region’s Metropolitan Planning Organization (MPO), will be establishing an executive committee to review rail transit priorities in the Orlando area, including SunRail’s Phase 3 expansion to Orlando International Airport (MCO).
6. Farebox Revenue
SunRail calculates fares based on the number of zones traveled. Each zone roughly represents a county. One-way tickets range from $2 (1 zone) to $5 (4 zones). Round-trip tickets as well as weekly, monthly and annual passes are available at a discount. Figure C-18 below provides SunRail’s current fare chart.
Figure C-18: SunRail Fares
Source: SunRail Website
Additionally, children age 6 and under ride for free with a paying adult (limit of 3). 50 percent discounts are also available for riders 65 and over, youth between the ages of 7-18, and those
78 SunRail Extension to Orlando International Airport (Phase 3) PD&E Study Preliminary Engineering Report, FDOT District 5, 2018

FINAL REPORT | Florida Passenger Rail System Study Client Ref: RFP Number 917
| 122
with disabilities. Additionally, those using a pre-paid multi-use smart card receive a 10 percent bonus on any amount charged over $10.
7. Other Revenue
SunRail derives most of its revenue through Urbanized Area Grant Funds from the Federal Transit Administration. Additionally, SunRail obtains operating revenue from the farebox, from CSX, Amtrak, and FCEN usage fees, from right-of-way lease revenue, ancillary revenues, and smart card revenues. Funding percentages are shown in Figure C-19.
Figure C-19: SunRail Phase 1 Funding – Capital Costs
Funding Percentage
Source
50% Federal Transit “New Starts” Grant
25% Florida State
25% Central Florida Counties
Source: SunRail
Figure C-20 provides SunRail’s planned annual operating revenue and expenses from January 1 to June 30, 2018. SunRail’s Fiscal Year 2018 operating revenue is budgeted at $16.3 million, of which $15.9 million has been received as of June 30, 2018. The rail service’s operating costs for Fiscal Year 2018 are budgeted at $47.0 million and include operations, capital maintenance and consultant support. As of April 30, 2018, $33.5 million has been spent.
Figure C-20: SunRail January – June 30, 2018 Operating Revenue
Revenue Source Budget Actual
Farebox Revenue $2.0 million $1.8 million
CSX Usage Fees $3.2 million $3.0 million
Amtrak Usage Fees $1.1 million $0.9 million
FCEN Usage Fees $21,671 $22,703
Right-of-Way Lease Revenue $225,000 $107,221
Ancillary Revenue $167,830 $348,773
Subtotal – System Revenue $6.7 million $6.2 million
FTA 5307 – Urbanized Area Grant Funds $9.6 million $9.6 million
Total Operating Revenue $16.3 million $15.9 million
Source: SunRail, TAC Meeting Materials, August 8, 2018; Note – unaudited values above
8. Capital Costs
Phase 1 costs include right-of-way acquisition ($432 million) and construction costs ($615 million).
Half of Phase 2 South (now known as “Southern Expansion”) costs were sourced from federal grants, while half from the state, for a total of $187 million for the 17.2-mile extension. The

FINAL REPORT | Florida Passenger Rail System Study Client Ref: RFP Number 917
| 123
federal funds were secured through a Full Funding Grant Agreement with FTA.79 The project’s federal, state, and local funding programs are presented in Figure C-21 below.
Figure C-21: Phase 2 South Extension Funding Sources
Program Legislative Authority Amount ($M)
Section 5309 New Starts Federal $93.43
Florida Transportation Trust Fund State $50.03
Orange County General Funds Local $16.30
Osceola County State Infrastructure Bank Loan Local $27.10
Source: FTA’s proposed plan for Phase 2 South extension, July 2018
The nearly $187 million project budget included the construction costs for 4 new stations, a storage/maintenance facility, park and ride lots, signaling and other grade crossing equipment, a communication system and acquisition costs for 2 new locomotives, 4 passenger cars.80
The extension opened for revenue service in July 2018 with the same service levels as the rest of the line (operating hours from 5 AM to 10:30 PM on weekdays, with 30-minute peak headways and 2-2.5 hour off-peak headways). FDOT forecasts a minimum of 2,000 passenger boardings at the new stations during the opening year.
9. Operating Costs
SunRail’s operating expenses are predominantly in operations and maintenance contracted out to Bombardier, with an annual budget of $20.35 million this year. Capital maintenance and consultant costs constitute another $14.6 million.
79 Full-Funding Grant Agreements Guidance, FTA, July 2018 80 Proposed Plan for Phase 2 South Extension, FTA, July 2018

FINAL REPORT | Florida Passenger Rail System Study Client Ref: RFP Number 917
| 124
Figure C-22 provides the breakdown of these actual and budgeted expenses for Fiscal Year 2018, with the year ended on June 30, 2018.
SunRail came in under budget by approximately $13.3 million in Fiscal Year 2018. For Fiscal Year 2019, SunRail has budgeted $57.9 million in total operating costs, capital maintenance, and consultant support, an increase of approximately 23 percent due to the new Southern Expansion line.

FINAL REPORT | Florida Passenger Rail System Study Client Ref: RFP Number 917
| 125
Figure C-22: SunRail Fiscal Year 2019 and Fiscal Year 2018 Operating and Capital Maintenance Costs, Consultant Support
Item Fiscal Year 2019 Budget
Year ending June 30, 2018 Budget Actual
Bombardier – Operations $10.3 million $6.85 million $6.8 million
Bombardier – Maintenance $15.9 million $13.5 million $13.5 million
Bombardier – Incentive/Disincentive $1.3 million $1.0 million $1.0 million
Conduent – Back-of-the-House Hosting $0.9 million $0.9 million $0.9 million
Conduent – Fare Equipment Maintenance $2.2 million $1.7 million $1.8 million
Herzog – Signal Maintenance of Way $3.1 million $2.6 million $2.9 million
Green’s Energy – Fuel $2.2 million $1.0 million $1.1 million
Gallagher Insurance $2.1 million $2.0 million $1.6 million
Amtrak – Heavy Vehicle Maintenance $1.7 million $1.2 million $0.9 million
Wells Fargo – Banking Services $6,880 $5,160 $4,636
Bank of America – Merchant Services (Banking) $90,000 $60,000 $49,324
MidFlorida – Armored Car Service $52,480 $42,480 $35,565
AT&T/Verizon – Wi-Fi Service $34,400 $33,600 $22,761
Fare Media Smart Card $ - $134,800 $ -
Limited Use Smart Card $269,600 $30,000 $215,680
Incomm – Card Distribution and Packaging $ - $ - $ -
Subtotal – System Operating Costs $40.0 million $31.0 million $30.9 million
Feeder Bus Expenses $1.8 million $1.5 million $1.3 million
Capital Maintenance $7.2 million $7.1 million $2.2 million
Consultant Support $8.8 million $7.5 million $5.4 million
Total Oper. and Capital Maint. Costs, Consultant Support $57.9 million $47.1 million $33.8 million
Source: SunRail, TAC Meeting Materials, August 8, 2018; Note – unaudited values above

FINAL REPORT | Florida Passenger Rail System Study Client Ref: RFP Number 917
| 126
C4. Brightline 1. Background, Ownership, and History
Background
Brightline is a private passenger rail company that is owned by All Aboard Florida, a subsidiary of Florida East Coast Industries (FECI). Figure C-23 shows the existing system map.
Figure C-23: South Florida Rail System Map
Source: CPCS Analysis

FINAL REPORT | Florida Passenger Rail System Study Client Ref: RFP Number 917
| 127
Phase 1 between Fort Lauderdale and West Palm Beach opened on January 13, 2018, and was extended south to Miami on May 19, 2018.
Phase 2 between West Palm Beach and Orlando is planned to open by 2021.
Ownership History
Florida East Coast Industries (FECI) was renamed from “Foxx Holdings” in 2006 and was acquired in 2007 by Fortress Investment Group, a private equity firm with over $46 billion assets under management (AUM) based in New York City. Fortress Investment Group was subsequently acquired in 2017 by SoftBank, a Japanese telecommunications firm.
Figure C-24 shows Brightline’s corporate ownership relationships.
Figure C-24: Brightline Corporate Ownership Diagram
Source: CPCS Analysis
Grupo México Transportes (GMXT) acquired Florida East Coast Railway, which owns the infrastructure and operates freight trains along the corridor, from Fortress in July 2017. This is the second acquisition of a US railroad by GMXT, which also owns Texas Pacifico Transportation Ltd. in West Texas. Florida East Coast Railway (the freight operator) and Florida East Coast Industries (owner of Brightline) no longer have a common owner, although they have an agreement in place to jointly operate the rail corridor.
2. Infrastructure and Rolling Stock
Infrastructure
Brightline uses the existing 66.5-mile rail corridor owned by Florida East Coast Railway (FECR), between Miami and West Palm Beach. FECR and Brightline have a joint ownership agreement in place that distributes rights and responsibilities to each party.

FINAL REPORT | Florida Passenger Rail System Study Client Ref: RFP Number 917
| 128
Currently, trains operate at a top speed of 80 mph between Miami and West Palm Beach, making this line a conventional rail line. Trains are expected to reach 110 mph between West Palm Beach and Cocoa and 125 mph between Cocoa and Orlando when these two extensions open.
Once built out, the system will not be considered a high-speed rail system, but rather a “higher-speed” rail system.
Yet, when complete, Brightline will be the second fastest rail system in North America after Amtrak’s Acela Express service between Washington, DC and Boston, though still below the internationally-accepted top operating speed of 185-220 mph, common among high-speed rail lines.
The initial operating segment between Miami and West Palm Beach, currently classified as FRA Class 4 track, required major renovations. This included renovating 7 bridges, all 170 level railroad-roadway crossings, adding a second track, replacing wooden ties with more durable concrete ties, and replacing the signaling system with a state-of-the-art Alstom cab signaling system.
Rolling Stock
Brightline owns 5 diesel-electric Siemens Mobility train sets, built in 2017. These trainsets are made up of two SCB-40 locomotives (one on each end) and four passenger cars, for a total train capacity of 240 passengers per trainset with 2 classes of service: Smart (2nd class) and Select (1st class). The trains are fully ADA compliant and the locomotives meet all current noise and emissions standards.
Brightline plans to purchase 5 more trains by the time the extension to Orlando opens. The existing trains will be expanded to 7 cars each.
3. Operations
After expanding service in August 2018, Brightline now operates 16 round-trips per weekday, 8 round-trips on Saturday and 7 on Sunday over 66.5 miles of mainline track. The rail service estimates that it will carry a total of 360,000 passengers in 2018.
FECR has the exclusive right to operate freight trains in the corridor, while Brightline (through its parent company Florida East Coast Industries – FECI) has the exclusive right to operate passenger trains in the corridor. The two companies have created a joint venture for train dispatching. Freight trains operate mostly at night (11 PM to 5:30 AM) while passenger trains operate during the day. Some freight trains may operate during the day and passenger trains use passing tracks to overtake freight trains.
4. Expansion Plans – West Palm Beach to Orlando
Brightline is currently working to expand its route from West Palm Beach to Orlando International Airport. The route between West Palm Beach and Cocoa will use the Florida East Coast Railway (FECR) corridor and Brightline is building a new 40 mile stretch along the State

FINAL REPORT | Florida Passenger Rail System Study Client Ref: RFP Number 917
| 129
Route 528 corridor between Cocoa and Orlando International Airport, with a target opening date of 2021.
West Palm Beach-Orlando Expansion
After the Brightline service extension to Downtown Miami in early 2018, All Abroad Florida proceeded with the new 3-station expansion from West Palm Beach to Orlando after receiving FRA’s approval on December 2017. This extension is shown in Figure C-25. The Brightline station at the Orlando International Airport is currently under construction and will eventually connect to a future expansion of the SunRail.
All Abroad Florida has estimated a $3.5 billion budget for the expansion project, including the capital costs of purchasing the land and the trains, the costs of planning and engineering services, upgrading the line between West Palm Beach and Cocoa to 110 mph (FRA class 6) operation, and laying new track from Cocoa to Orlando International Airport. The segment on FECR includes adding a second track, renovating the existing track, renovating all railroad crossings, among other items. The 40-mile (15 miles of single track line and 25 miles of double track line) segment west of Cocoa will be completely new construction without grade crossings, to FRA Class 7 track standards (operations up to 125 mph).
In a 2015 study of the potential ridership and revenue of the Brightline service expansion from Downtown Miami to Orlando, All Abroad Florida estimated nearly 2.8 million short-distance and 2.5 million long-distance annual riders by the time the entire system is operating. The estimated total annual revenue from collecting fares for both short and long distance trips is $293.6 million.81
Other Expansion Plans
Brightline is also considering to expand its service from Orlando International Airport station to Tampa, along I-4. Brightline submitted an unsolicited bid to the State of Florida, which is now conducting a Request for Proposals to identify any other bidders who may be interested in participating in the process.
81 2015 Ridership and Revenue Study, All Aboard Florida

FINAL REPORT | Florida Passenger Rail System Study Client Ref: RFP Number 917
| 130
Figure C-25: Brightline Expansion Plans
Source: CPCS Analysis
5. Farebox Revenue
Brightline’s ridership is still in the process of “ramping up” due to the recent launch of the service. In the first 2.5 months of operations, Brightline carried 74,780 riders and collected $663,700 in ticket revenue.82
Figure C-26 provides Brightline’s income statement for the quarter ended March 31, 2018. This includes the first 2.5 months of operations after Phase 1’s launch on January 13, 2018. As of the close of the quarter, Brightline ended with a net operating loss of $28.184 million.
82 Quarterly Unaudited Financial Statements For the Quarter Ended 3/31/2018, Brightline

FINAL REPORT | Florida Passenger Rail System Study Client Ref: RFP Number 917
| 131
Brightline trains have two classes of service: Smart (2nd class) and Select (1st class). The latter provides wider seats, complimentary beverages and snacks, and free parking at stations. Figure C-27 provides a summary of the Phase 1 fares. A 10 percent pricing discount is offered to seniors, active military and veterans, and 50 percent discount is offered to kids 12 years and under.
Currently, pricing varies little by time of day and day of the week. This will change as Brightline introduces demand-based pricing, similar to what is used by airlines.
Figure C-26: Brightline Trains LLC Income Statement (In Thousands) January – March 31, 2018
Operating Revenue (in thousands of dollars)
Ticket Revenue 664
Other Revenue 104
Total Revenue 764
Less Cost of Sales 178
Gross Profit 590
Operating Expenses (in thousands of dollars)
Salaries and Benefits 8,951
Professional Fees 2,368
General, Administrative, and Other 13,488
Depreciation and Amortization 4,013
Total Operating Expenses 28,820
Operating Loss (28,230)
Other (Income) Expenses (in thousands of dollars)
Miscellaneous Income (46)
Total Other (Income Expense) (46)
Net Loss (28,184)
Source: Brightline Quarterly Unaudited Financial Statements
Figure C-27: Brightline Phase 1 Fares
Source: Brightline website
In the first 2.5 months of operations, 18 percent of Brightline passengers opted for the lower-fare Smart Ticket compared to the Select Ticket.
Prior to Brightline’s launch, Louis Berger US conducted a Ridership Study for the South Segment project in October 2017. The firm forecasted that after ramp-up time, ridership market share would be 0.74 percent of total annual trips taken by all modes of transportation, approximately 365 million trips per year. This ridership forecast breakdown by route is shown in Figure C-28 and ridership information by month and type of ticket is shown in Figure C-29 and Figure C-30, respectively.
Route Smart (2nd Class) Select (1st Class)
West Palm Beach – Fort Lauderdale $10-$15 $20
West Palm – Miami $20 $30

FINAL REPORT | Florida Passenger Rail System Study Client Ref: RFP Number 917
| 132
Figure C-28: Brightline Ridership Forecast by Route
Source: Florida Development Finance Corporation Board Meeting Notes, sourcing Louis Berger Ridership Study
Figure C-29: Brightline January 19-March 31, 2018 Ridership and Revenue Information
Month Ridership Revenue
January 2018 (Jan 19-31) 17,800 $146,500
February 2018 24,100 $220,000
March 2018 32,900 $297,300
Source: Brightline
Figure C-30: Brightline January 19-March 31, 2018 Ridership and Revenue by Ticket Type
Type of Ticket Ridership Revenue
Smart 40,600 $275,000
Select 34,200 $388,600
Source: Brightline
In February and March 2018, Brightline operated 10 round-trips on weekdays and 9 on weekends, making the capacity for both months a total of 271,200 available seats, making the resulting load factor 21 percent (based on passengers traveling the entire length of the line) for a train that is operating in its ramp-up period. For comparison purposes, for true high-speed train lines in Europe, average system load factors for mature services are generally in the 55 to 75 percent range.83
6. Other Revenue
Brightline leveraged a $600 million, 30-year private-activity bond (PAB) offering to complete Phase 1 of the project and is currently seeking another $1.15 billion PAB offering to complete Phase 2. These private activity bonds are federal tax-exempt bonds issued by state or local governments to private investors. Collateral used for the $600 million PAB include new track infrastructure, station buildings (Miami, Fort Lauderdale, and West Palm Beach), land for
83 Campos J., de Rus G. “Some stylized facts about high-speed rail: A review of HSR experiences around the world.” Transport Policy. Volume 16, Issue 1, January 2009, Pages 19-28.
Miami-Fort Lauderdale
58%
Fort Lauderdale-West Palm Beach
26%
Miami-West Palm Beach
16%

FINAL REPORT | Florida Passenger Rail System Study Client Ref: RFP Number 917
| 133
stations and corridor from Miami-to-Cocoa, and rolling stock. The target investors are “select institutional investors and other sophisticated counterparties” and interest payments are made semi-annually.84
The Florida Department of Transportation provided the Orlando International Airport (MCO) with a total of $159 million in grants and $52 million in loans to build a new station to serve Brightline trains. All Aboard Florida also provided $10 million for the station and will pay $2.8 million per year in rent as well as per-passenger fees to the Orlando International Airport (MCO) in return.85
Brightline’s projected ridership and revenue are provided in Figure C-31 and Figure C-32 (Based on a ridership study by Louis Berger).
Figure C-31: Brightline Forecasted Ridership by Route
Figure C-32: Brightline Forecasted Revenue by Route
Note, ramp-up period assumes 40% of expected revenue in 2018, 80% in 2019, and 100% subsequently.
A Ramp-Up Reserve Fund funded from Brightline funds covers shortfalls in ramp-up periods. Sources: Florida Development Finance Corporation Board Meeting Notes, Originally Louis Berger Ridership Study.
Based on this study, Brightline’s Phase 1 projections are at $79 million in annual Earnings Before Interest, Taxes, Depreciation and Amortization (EBITDA) with a 33 percent loan-to-value ratio. By 2020, the railroad anticipates 2.9 million passengers and 1 percent of market share, with an average fare of $37.
84 Board of Directors Meeting, Florida Development Finance Corporation, October 27, 2018 85 Vock, D. “All Aboard? The Uncertain Future of America’s First Privately Built Railroad in Decades”, February 2018.
0.0
1.0
2.0
3.0
4.0
2018 2019 2020 2021 2022
Pas
sen
gers
in M
illio
ns
Fort Lauderdale-West Palm Beach Miami-Fort Lauderdale Miami-West Palm Beach
0
50
100
150
200
2018 2019 2020 2021 2022
Mill
ion
s o
f D
olla
rs
Farebox Revenue Ancillary Revenue

FINAL REPORT | Florida Passenger Rail System Study Client Ref: RFP Number 917
| 134
7. Capital Costs
In 2015, Brightline estimated Miami-to-Orlando capital costs at $3.1 billion. In 2017, Brightline provided a second estimate of $1.8 billion, but only covering the Miami-West Palm Beach phase.86
On June 1, 2018, All Abroad Florida estimated a $3.7 billion project cost for the West Palm Beach to Orlando expansion project including the capital costs of purchasing the land and the trains, the costs of planning and engineering services, upgrading tracks between West Palm Beach and Cocoa, and laying out new tracks to Orlando International Airport.87 Initially, Brightline intended to apply for a $1.6 billion loan from Build America under the Railroad Rehabilitation and Improvement Financing (RRIF) program, but eventually, All Abroad Florida decided to pursue other funding options due to the complexity of rules and review processes.88 The company’s current plan is to cover the costs through equity and debt financing.
Recently (June 2018) USDOT provided a seven-month extension period to allow Brightline to sell $1.75 billion of its tax-exempt private activity bonds offered by the Florida Development Finance Corporation. About $600 million of the revenue from selling these bunds will fund the loan repayments for the Miami to West Palm Beach portion of the Brightline expansion while the rest will support the West Palm Beach to Orlando expansion. However, due to uncertainties around successfully selling these bonds, All Abroad Florida is considering a new RRIF loan application in the amount of $3.7 billion.89
8. Operating Costs
As previously discussed, Brightline is currently going through a ramp-up period with a high level of investment required during this time period relative to ridership and fare revenue. In the first 2.5 months of service, Brightline’s operating expenses amounted to $28.8 million as shown in Figure C-33, resulting in a net loss of $28.184 million dollars. It is expected that ridership will grow over time.
Figure C-33: Brightline Operating Costs for January – March 31, 2018
Item USD (thousands)
Total Operating Expenses 28,820
Operating Loss (28,230)
Miscellaneous Income (46)
Total Other (Income Expense) (46)
Net Loss (28,184)
Source: Brightline Quarterly Unaudited Financial Statements
86 Board of Directors Meeting, Florida Development Finance Corporation, October 27, 2018 87 Railroad Rehabilitation and Improvement Financing (RRIF) Program Draft Applications, June 1, 2018 88 The RRIF program, Administered by FRA, provides direct loans and loan guarantees up to $35.0 billion to finance development of railroad infrastructure. 89 The Railroad Rehabilitation and Improvement Financing (RRIF) Program, Congressional Research Service, January 2018.

FINAL REPORT | Florida Passenger Rail System Study Client Ref: RFP Number 917
| 135
Appendix D. FRA Incident Classification Categories
This section provides a listing of the classification of incident types that are used by the FRA. Figure D-1 lists incident types that are considered as severe and are included in casualty rate calculations, while Figure D-2 provides a listing of incidents considered to be within railroad control.
Figure D-1: Severe Events Included in Casualty Rate Calculations
Event Code
Description Event Code
Description
73 Burned 28 Exposure to poisonous plants
81 Caught Between Equipment 31 Exposure to welding light
79 Caught Between Machinery 32 Highway-rail collision/impact
82 Caught Between Material 36 Needle puncture/prick/stick
8 Caught in or compressed by hand tools 69 On track equipment, other incidents
9 Caught in or compressed by other machinery 37 Other impacts - on-track equipment
12 Caught in or compressed by powered hand tools 49 Shot
10 Caught in or crushed by materials 50 Slack action, draft, compressive buff/coupling
11 Caught in or crushed in excavation, landslide, cave-in, etc.
80 Slack adjustment during switching operation
68 Caught, crushed, pinched, other. 52 Slipped, fell, stumbled, etc. due to climatic condition (rain, snow, ice, etc.)
13 Cave in, slide, etc. 51 Slipped, fell, stumbled, etc. due to irregular face, e.g., depression, slope, etc.
16 Climatic condition, exposure to environmental cold 54 Slipped, fell, stumbled, etc. due to object, e.g., ballast, spike, material, etc.
15 Climatic condition, exposure to environmental heat 53 Slipped, fell, stumbled, etc. on oil, grease, other slippery substance
14 Climatic conditions, other (e.g., high winds) 55 Stabbing, knifing, etc.
17 Collision - between on-track equipment 61 Struck against object
18 Collision/impact - auto, truck, bus, van, etc. 77 Struck by other remote control locomotive controlled equipment
19 Committing vandalism/theft 76 Struck by own remote control locomotive controlled equipment
20 Defective/malfunctioning equipment 60 Struck by falling object
21 Derailment 58 Struck by object
23 Electrical shock due to contact with 3rd rail, catenary, pantograph
59 Struck by on-track equipment
25 Electrical shock from hand tool 57 Struck by thrown or propelled object
22 Electrical shock while operating welding equipment 62 Sudden release of air
24 Electrical shock, other 75 Sudden/Unexpected Movement of tools
27 Exposure to chemicals - external 63 Sudden/unexpected movement of material
26 Exposure to fumes - inhalation 64 Sudden/unexpected movement of on-track equipment
30 Exposure to noise - single incident 65 Sudden/unexpected movement of vehicle
29 Exposure to noise over time 71 Sudden, unexpected movement, other

FINAL REPORT | Florida Passenger Rail System Study Client Ref: RFP Number 917
| 136
Figure D-2: Events within Railroad Control
Event Code
Description
2 Safety equipment not worn or in place
3 Procedures for operating/using equipment not followed
4 Equipment
5 Signal
6 Track
8 Impairment, physical condition, e.g., fatigue
9 Human factor
13 Lack of communication
14 Slack adjustment during switching operation
15 Insufficient training
16 Failure to provide adequate space between equipment during switching operation
17 Close or no clearance
18 Slipped, fell, stumbled due to Passenger Station Platform Gap
99 Undetermined
21 Environmental, related to using RCL
22 Safety equipment not worn or in place, related to using RCL
23 Procedures for operating/using equipment not followed, related to using RCL
24 Equipment, related to using RCL
25 Signal, related to using RCL
26 Track, related to using RCL
29 Human factor, related to using RCL
R1 Object fouling track, related to using RCL
R3 Lack of communication, related to using RCL
R4 Slack adjustment during switching operation, related to using RCL
R5 Insufficient training, related to using RCL
R6 Failure to provide adequate space between equipment during switching operation, related to using RCL
R7 Close or no clearance, related to using RCL
39 Undetermined, related to using RCL
42 Safety equipment not worn or in place, unrelated to using RCL
43 Procedures for operating/using equipment not followed, unrelated to using RCL
44 Equipment, unrelated to using RCL
45 Signal, unrelated to using RCL
46 Track, unrelated to using RCL
48 Impairment, physical condition, e.g., fatigue, unrelated to using RCL
49 Human factor, unrelated to using RCL
U1 Object fouling track, unrelated to using RCL
U3 Lack of communication, unrelated to using RCL
U4 Slack adjustment during switching operation, unrelated to using RCL
U5 Insufficient training, unrelated to using RCL
U6 Failure to provide adequate space between equipment during switching operation, unrelated to using RCL
U7 Close or no clearance, unrelated to using RCL
59 Undetermined, unrelated to using RCL

FINAL REPORT | Florida Passenger Rail System Study Client Ref: RFP Number 917
| 137
Appendix E. Top 50 Florida Grade Crossings with Highest Number of Incidents
Figure E-1 lists the top-50 grade crossings in Florida by the highest number of incidents, during the period between 2009 and 2017.
Figure E-1: 50 Florida Grade Crossings with Highest Number of Incidents & Casualties (2009-2017)
Crossing ID Rank Street Highway County Incident Count
Fatality Count
Injury Count
628177F 1 ATLANTIC BLVD SR 814 BROWARD 6 2 1
620891F 2 TIMUQUANA ROAD SR 134 DUVAL 6 1 0
628183J 3 NW 62ND/CYPRESS C CR BROWARD 5 3 8
628160C 4 LINTON BLVD SR 782 PALM BEACH 5 3 7
624365G 5 TAMPA EAST BLVD LS HILLSBOROUGH 5 0 4
628186E 6 COMMERCIAL BLVD SR 870 BROWARD 5 2 2
628272B 7 NEW GRIFFIN RD SR 818 BROWARD 5 2 1
628378W 8 NW N RIVER DR LS MIAMI-DADE 5 0 3
622072W 9 CR 427 CR 427 SEMINOLE 5 0 1
628191B 10 OAKLAND PARK BLVD SR 816 BROWARD 4 1 3
272550B 11 N.E. 3RD AVE 0 BROWARD 4 1 2
339664E 12 EAST QUINTETTE ROAD CR 184 ESCAMBIA 4 0 3
621216V 13 MCDUFF AVE SR 129 DUVAL 4 1 2
621525H 14 NW 48TH ST CR BROWARD 4 0 3
628118D 15 PALM BEACH LK BLV CR PALM BEACH 4 3 0
624304R 16 COUNTY LINE ROAD LS POLK 4 0 2
272609N 17 N.E. 141TH ST. 0 MIAMI-DADE 4 0 0
273145P 18 YARD XINGS YARD DUVAL 4 0 0
622307E 19 WEST MICHIGAN ST CR 5104 ORANGE 4 0 0
628139W 20 FOREST HILL BLVD SR 882 PALM BEACH 4 0 0
626405J 21 S POINCIANNA BLVD 0 OSCEOLA 3 0 14
623083M 22 NEPTUNE RD PRIVATE POLK 3 0 9
620986N 23 BUFFALO BLUFF Road CR 309B PUTNAM 3 0 4
628168G 24 NW 36 ST/SAMPLE RD SR 834 BROWARD 3 1 3
623066W 25 DAIRY RD/LK ALFRED LS POLK 3 1 2
628165L 26 PALMETTO PARK CR 798 PALM BEACH 3 1 2
271970C 27 WASHINGTON ST LS VOLUSIA 3 1 1

FINAL REPORT | Florida Passenger Rail System Study Client Ref: RFP Number 917
| 138
Crossing ID Rank Street Highway County Incident Count
Fatality Count
Injury Count
272124T 28 W EAU GALLIE BLVD SR 518 BREVARD 3 1 1
339691B 29 E KINGSFIELD ROAD CR 186 ESCAMBIA 3 0 2
622067A 30 N RONALD REAGAN BLVD CR 427 SEMINOLE 3 1 1
622181A 31 WEST COLONIAL DR SR 50 ORANGE 3 1 1
628192H 32 NW 19TH ST CR BROWARD 3 0 2
628355P 33 NW 54TH/HIALEAH DR SR 944 MIAMI-DADE 3 0 2
918536V 34 PRIVATE INDUSTRY PRIVATE DUVAL 3 0 2
622192M 35 WEST SOUTH ST CR 5098 ORANGE 3 0 1
624350S 36 KINGSWAY RD LS HILLSBOROUGH 3 0 1
628163X 37 NW 51ST/YAMATO RD SR 794 PALM BEACH 3 1 0
628282G 38 PEMBROKE RD SR 824 BROWARD 3 0 1
620619F 39 LANE AVENUE SR 103 DUVAL 3 0 0
622187R 40 WEST JEFFERSON ST 0 ORANGE 3 0 0
622944J 41 S CLYDE AVE 0 OSCEOLA 3 0 0
622992Y 42 HAINES COURT LS POLK 3 0 0
625013E 43 SE 221ST STREET SR 200A ALACHUA 3 0 0
628290Y 44 HALLANDALE BEACH SR 858 BROWARD 3 0 0
622318S 45 GLENROSE AVE 0 ORANGE 2 1 36
628146G 46 6TH AVE ST CR PALM BEACH 2 0 23
628088N 47 NORTH GRADE RD LS PALM BEACH 2 0 9
339808G 48 ROSEBUD DRIVE PRIVATE OKALOOSA 2 1 3
627561Y 49 SR 700 US-98 POLK 2 3 1
628116P 50 25TH STREET LS PALM BEACH 2 1 3
Source: CPCS Analysis of FRA Data

FINAL REPORT | Florida Passenger Rail System Study Client Ref: RFP Number 917
| 139
Appendix F. US Rail Safety Trends
1. Analysis of National Railroad Safety Trends
In analyzing the Federal Railroad Administration’s national safety database and Bureau of Transportation Statistics data, we found that:
Over the last three decades (1990-2017), US railroads have seen a 33 percent decrease in fatalities and 66 percent decrease in injuries nationally.
There has been a 61 percent decline in grade-crossing fatalities between 1990 and 2017, while railroad-only fatalities have seen virtually no change (599 fatalities in 1990 and 598 fatalities in 2017). However, when population and track mileage is taken into account, the result is a downward trend in the figures.
Over the last 9 years (2009-2017), however, fatalities and injuries have been on the rise for both grade-crossing incidents as well as for other incidents.
In 2017, most fatalities on railroad property were due to trespassers (83 percent of all fatalities) and 49 percent of all injuries could be attributed to employees on duty, the largest victim group compared to trespassers, non-trespassers, passengers on trains, and other employees.
In 1990, the US railroad system experienced 1,297 fatalities and 25,143 injuries nationally. Between 1990 and 2009, this number trended downward to a record low number in 2009 with 696 fatalities and 8,017 injuries, a decline of 46 percent in fatalities and 68 percent in injuries from 1990. From 2009 to 2017, fatalities and injuries were on the rise again with a 25 percent increase in fatalities and 6 percent increase in injuries within that time period.
Figure F-1 provides US trends for railroad and grade-crossing fatalities (1990-2017) in the black frame of the previous figure.
While grade-crossing fatalities have declined 60 percent from 698 in 1990 to 273 in 2017 nationally, railroad-only fatality counts have not seen improvement. Railroad-only fatalities declined 27 percent from 599 in 1990 to 438 in 2012, but increased 37 percent between 2012 and 2017 back to 598 fatalities as shown in Figure F-2.

FINAL REPORT | Florida Passenger Rail System Study Client Ref: RFP Number 917
| 140
Figure F-1: US Railroad and Grade-Crossing Fatalities and Injuries (1990-2017)
Source: CPCS Analysis of BTS Railroad Safety Data.90 “Railroad-only” includes fatalities from train and non-train accidents and incidents, and excludes highway-rail grade crossings. This table includes information for both freight and passenger railroad operations.
Figure F-2: US Railroad and Grade-Crossing Fatalities (1990-2017)
Source: CPCS Analysis of BTS Railroad Safety Data.90 “Railroad-only” includes fatalities from train and non-train accidents and incidents and excludes highway-rail grade crossings. This table includes information for both freight and passenger railroad operations.
US population and railroad track miles are not stagnant over time – population has increased while railroad track miles have fallen between 1990 and 2017. The number of fatalities per 1 million inhabitants has declined from 5.20 fatalities in 1990 down to 2.42 fatalities in 2014 (the latest available year for track miles). Fatalities per 1,000 track miles have also decreased from 6.48 fatalities in 1990 down to 4.78 fatalities in 2014. Fatalities based on grade crossing incidents have declined faster than railroad fatalities, as indicated in Figure F-3.
90 Railroad and Grade-Crossing Fatalities by Victim Class, Bureau of Transportation Statistics (up to 2017)
0
5,000
10,000
15,000
20,000
25,000
30,000
19
90
19
91
19
92
19
93
19
94
19
95
19
96
19
97
19
98
19
99
20
00
20
01
20
02
20
03
20
04
20
05
20
06
20
07
20
08
20
09
20
10
20
11
20
12
20
13
20
14
20
15
20
16
20
17
Railroad Fatalities Grade Crossing Fatalities Railroad Injuries Grade Crossing Injuries
0
200
400
600
800
1,000
1,200
1,400
19
90
19
91
19
92
19
93
19
94
19
95
19
96
19
97
19
98
19
99
20
00
20
01
20
02
20
03
20
04
20
05
20
06
20
07
20
08
20
09
20
10
20
11
20
12
20
13
20
14
20
15
20
16
20
17
Railroad Fatalities Grade Crossing Fatalities

FINAL REPORT | Florida Passenger Rail System Study Client Ref: RFP Number 917
| 141
Figure F-3: US Railroad and Grade-Crossing Fatalities per 1 Million People and Per 1,000 Track Miles
Source: CPCS Analysis of BTS Railroad Safety Data, US Census Bureau, and Association of American Railroads Data. “Railroad-only” includes fatalities from train and non-train accidents and incidents, and excludes highway-rail grade crossings. This table includes information for both freight and
passenger railroad operations.
In 2017, the nation experienced 871 fatalities and 8,482 injuries at highway-railroad at-grade crossings. Trespassers were the largest category, nearly 83 percent of all fatalities. When looking at non-fatal injuries, the largest category is attributable to employees on duty, with 49 percent of all injuries. Figure F-4 provides 2017 fatalities (left) and injuries (right) by affected party.
Figure F-4: US Railroad and Grade-Crossing Fatalities (Left) and Injuries (Right) (2017)
* Nontrespassers – persons lawfully present on railroad property that is used in railroad operation that do not fit into other categories (e.g. a maintenance contractor);
** Trespasser – any person on a part of railroad property used in railroad operations whose presence is prohibited, forbidden, or unlawful. Employees who are trespassing on railroad property are reported as Trespassers.
Source: CPCS Analysis of BTS Railroad Safety Data
0
0.5
1
1.5
2
2.5
3
3.5
4
19
90
19
91
19
92
19
93
19
94
19
95
19
96
19
97
19
98
19
99
20
00
20
01
20
02
20
03
20
04
20
05
20
06
20
07
20
08
20
09
20
10
20
11
20
12
20
13
20
14
Nu
mb
er o
f Fa
talit
ies
Railroad Fatalities per 1 million people Railroad Fatalities per 1,000 Track Miles
Grade Crossing Fatalities per 1 million people Grade Crossing Fatalities per 1,000 track miles
Contractor Employees,
4, 0%
Passengers on Trains, 8, 1%
Employees on Duty,
Nontrespassers*, 126, 15%
Trespassers ** 721,
83%
Volunteer Employees
Employees Not on Duty
101, 1%
Contracted Employees
454, 5%
Trespassers **755, 9%
Nontrespassers*1472, 18%
Passengers on Trains1555, 18%
Employees on Duty
4144, 49%

FINAL REPORT | Florida Passenger Rail System Study Client Ref: RFP Number 917
| 142
The probable cause of incidents nationwide from January 2009 to June 2018 is provided in Figure F-5 below. Trespassing (19 percent) and environmental (11 percent) causes of incidents represent the largest percentage of incidents nationwide outside of railroad control. Across the country, incidents that are within railroad control are most commonly due to equipment issues (9 percent).
Figure F-5: Probable Cause of Passenger Railroad Incidents Nationwide (January 2009 – June 2018)
Probable Cause US Total % of total
Outside of Railroad Control 17,746 33.3%
Trespassing 10,009 18.8%
Environmental 5,581 10.5%
Object fouling track 1,192 2.2%
Outside caused (e.g., assaulted/attacked) 495 0.9%
Impairment, substance use 158 0.3%
Act of God 113 0.2%
Environmental, unrelated to using RCL 83 0.2%
Trespassing, unrelated to using RCL 83 0.2%
Act of God, unrelated to using RCL 13 0.0%
Outside caused (e.g., assaulted/attacked), unrelated to using RCL 11 0.0%
Impairment, substance use, unrelated to using RCL 3 0.0%
Impairment, substance use, related to using RCL 1 0.0%
Impairment, physical condition, e.g., fatigue, related to using RCL 1 0.0%
Outside caused (e.g., assaulted/attacked), related to using RCL 1 0.0%
Trespassing, related to using RCL 1 0.0%
Act of God, related to using RCL 1 0.0%
Within Railroad Control 8,525 16.0%
Equipment 4,498 8.4%
Procedures for operating/using equipment not followed 1,565 2.9%
Track 757 1.4%
Safety equipment not worn or in place 415 0.8%
Lack of communication 193 0.4%
Human factor, unrelated to using RCL 188 0.4%
Slack adjustment during switching operation 136 0.3%
Close or no clearance 116 0.2%
Slipped, fell, stumbled due to Passenger Station Platform Gap 111 0.2%
Signal 95 0.2%
Equipment, unrelated to using RCL 94 0.2%
Human factor, related to using RCL 65 0.1%
Insufficient training 45 0.1%
Procedures for operating/using equipment not followed, unrelated to using RCL 40 0.1%
Procedures for operating/using equipment not followed, related to using RCL 32 0.1%
Failure to provide adequate space between equipment during switching operation 32 0.1%
Equipment, related to using RCL 22 0.0%
Object fouling track, unrelated to using RCL 22 0.0%
Track, unrelated to using RCL 19 0.0%
Slack adjustment during switching operation, related to using RCL 12 0.0%
Safety equipment not worn or in place, unrelated to using RCL 11 0.0%
Close or no clearance, unrelated to using RCL 9 0.0%

FINAL REPORT | Florida Passenger Rail System Study Client Ref: RFP Number 917
| 143
Probable Cause US Total % of total
Impairment, physical condition, e.g., fatigue, unrelated to using RCL 8 0.0%
Environmental, related to using RCL 6 0.0%
Safety equipment not worn or in place, related to using RCL 6 0.0%
Slack adjustment during switching operation, unrelated to using RCL 6 0.0%
Failure to provide adequate space between equipment during switching operation, unrelated to using RCL
5 0.0%
Object fouling track, related to using RCL 4 0.0%
Lack of communication, related to using RCL 4 0.0%
Lack of communication, unrelated to using RCL 3 0.0%
Track, related to using RCL 3 0.0%
Signal, unrelated to using RCL 1 0.0%
Close or no clearance, related to using RCL 1 0.0%
Failure to provide adequate space between equipment during switching operation, related to using RCL
1 0.0%
Undetermined 27,016 50.7%
Human factor 21,373 40.1%
Undetermined 5,306 10.0%
Impairment, physical condition, e.g., fatigue 237 0.4%
Undetermined, unrelated to using RCL 80 0.2%
Undetermined, related to using RCL 20 0.0%
*RCL: Remote Control Locomotive Source: CPCS Analysis of FRA Safety Data

FINAL REPORT | Florida Passenger Rail System Study Client Ref: RFP Number 917
| 144
Appendix G. Detailed Field Safety Assessment (DSA) of Grade Crossing Safety in Canada
Regulation of railroad crossings in Canada has both safety and economic dimensions. The safety-related regulations are the Grade Crossings Regulations (GCR) made pursuant to the Railway Safety Act (RSA). The responsible regulatory authority here is Transport Canada. The economic dimension is covered under the Canada Transportation Act (CTA). The responsible regulatory authority here is the Canadian Transportation Agency.
Grade crossing safety in Canada is a complex, multi-jurisdictional matter. In August 2010, the Transportation Safety Board indicated on its watch list that the “risk of passenger trains colliding with vehicles remains too high in busy rail corridors.” It recommended that the federal government develop a comprehensive solution for mitigating risk at grade crossings that include new grade crossing safety regulations.91
One of these solutions is a Detailed Field Safety Assessment (DSA) – a systematic process performed at regular intervals, used to evaluate the safety of a road/rail line grade crossing. While not a regulatory requirement, a crossing safety program that incorporates a DSA program is recommended as a best engineering practice. Class I railroads have this assessment included as part of their Safety Management System (SMS).
The DSA consists of a review of the site characteristics, traffic control system and the roadway and railroad operational characteristics. An assessment of existing or potential hazards is based on this review. If safety deficiencies are identified, countermeasures can be recommended.
Recommended frequency for DSAs are:
(a) Within seven years of the GCR coming into force (e.g., by November 28, 2021), and at least every five years thereafter, railroads and road authorities should jointly conduct a DSA of their public grade crossings.
91 Transport Canada, Grade Crossings – Handbook

FINAL REPORT | Florida Passenger Rail System Study Client Ref: RFP Number 917
| 145
(b) Within seven years of the GCR coming into force, and at least every five years thereafter, it is considered good practice for a railroad to conduct a DSA of private crossings on its network.
Authorities for a given crossing are responsible for jointly establishing the schedule for DSAs. Notwithstanding (a) above, the authorities may agree at the time of a DSA to extend the deadline for the next DSA to more than five years, but not more than 10 years, if they have reason to believe that the safety conditions at or in the vicinity of the crossing will remain stable.
If a responsible authority identifies a developing situation that could affect safety at or in the vicinity of the crossing, it must notify the other authorities and request the next DSA be conducted sooner. Likewise, a DSA may need to be conducted sooner if conditions change that could impact crossing safety such as changes in volumes and types of vehicle and pedestrian traffic, road traffic patterns, physical surroundings, volumes and types of railroad traffic, railroad operations, crossing accident history, etc.
If the DSA reveals conditions that could eventually affect safety at the crossing, the next DSA should be scheduled sooner than what is stipulated in (a) and (b) above.
In the US, the FRA and state DOTs conduct similar assessments using field diagnostic teams only when line upgrades are performed or new lines are built. No routine assessments are performed.

FINAL REPORT | Florida Passenger Rail System Study Client Ref: RFP Number 917
| 146
Appendix H. Review of Relevant Federal Legislation
Laws (named and/or numbered acts), as passed by the US Congress are usually amendments to the US Code. Key regulations include the following:
The Federal Railroad Safety Act of 1970;
The Noise Control Act of 1972;
The Interstate Commerce Commission Termination Act of 1995;
The Rail Safety Improvement Act of 2008; and
Passenger Rail Investment and Improvement Act of 2008.
1. The Federal Railroad Safety Act (FRSA) of 1970
The purpose of the FRSA is to “promote safety in every area of railroad operations and reduce railroad-related accidents and incidents.92” The law addresses issues regarding state and local regulation of train speed and the duration that railroad crossings can be blocked.
This law ensured that state and local governments would generally be precluded from regulating on any matter unless it is not yet regulated by the US Secretary of Transportation. The law itself regulates train speeds and pre-empts state and local laws and regulations that pertain to the blocking of roadway crossings. These issues are to be regulated by the US Department of Transportation. Just like for other states, this law limits Florida’s ability to regulate its railroads in favor of nationwide standards.
2. The Interstate Commerce Commission Termination Act (ICCTA) of 1995
The ICCTA abolished the Interstate Commerce Commission and gave the Surface Transportation Board (STB) oversight of:
Rail carriers and their rates, classifications, rules (including car service, interchange, and other operating rules), practices, routes, services, and facilities of such carriers; and
92 49 U.S.C. §20101

FINAL REPORT | Florida Passenger Rail System Study Client Ref: RFP Number 917
| 147
Construction, acquisition, operation, abandonment, or discontinuance of spur, industrial, team, switching or side tracks, or facilities.93
The ICCTA provides that the STB has direct oversight of state statutes regulating railroad operations and contracts between rail carriers, condemnation of railroad tracks or nearby land, and state negligence and nuisance claims. There are state and local activities that are not pre-empted by the ICCTA such as:
Voluntary agreements entered into by the railroad and the local jurisdictions (optional);
Traditional police powers over the development of railroad property to the extent that the regulations protect the public health and safety (e.g. local police have jurisdiction over railroad property);
Zoning regulations applied to railroad-owned land used for non-railroad purposes by a third party (e.g. a parcel of land may be developed subject to local zoning regulations);
Other laws with no pertinence to transportation.
This law lets STB regulate certain aspects of interstate commerce, mentioned above, which the State of Florida has no jurisdiction over.
3. The Rail Safety Improvement Act (RSIA) of 2008
After multiple fatal rail incidents around the US (none of which were in Florida), including two incidents that involved commuter trains in California, the US Congress passed the RSIA to address the underlying causes of these incidents.94 The issues addressed include:
Hours of service requirements for railroad workers;
Implementation of a next-generation train control system called Positive Train Control;
Changes in the way locomotive conductors are certified; and
Issues in roadway-railroad grade crossing safety.
The law includes seven major sections:
Title I – Railroad Safety Improvements: Includes directions to the FRA to develop a series of strategies specific to increasing railroad safety. This part of the legislation also includes a risk-reduction program and the requirement of railroads with passenger rail service to implement Positive Train Control (PTC) to be administered and overseen by the FRA.95 (PTC is a rule-based train control system that ensures safe train operation by preventing train-with-train collisions,
93 Kamptner, Greg; The Albemarle County Land Use Law Handbook, Albemarle County Attorney’s Office, Feb. 2018. 94 Public Law 110-432, October 16, 2008 95 Public Law 110-432, October 16, 2008, § 20157. Implementation of positive train control systems.

FINAL REPORT | Florida Passenger Rail System Study Client Ref: RFP Number 917
| 148
derailments due to train overspeed, incursions into work zones and movements through a misaligned track switch).
Title II – Highway-Rail Grade Crossing and Pedestrian Safety and Trespasser Prevention: Includes Pedestrian crossing safety, state grade crossing action plans, sight distances at-grade crossings, grade crossing inventory, identification/notification of grade crossing issues, funding for Operation Lifesaver, and funding for states to improve safety.
Title III – Federal Railroad Administration: Includes FRA staffing increases specifically for safety administration and inspection and updates to the FRA website to include additional rail safety information.
Title IV – Railroad Safety Enhancements: Includes minimum safety training standards for rail employees; certification of conductors; conduct of studies to improve the safety of rail track, locomotive cab environments, and station platforms; bridge safety program, and; rail infrastructure improvement grants.
Title V – Rail Passenger Disaster Family Assistance: Includes actions and information for rail accident victims and their families.
Title VI – Clarification of Federal Jurisdiction over Solid Waste Facilities – Includes language that compels compliance of operators of solid waste rail transfer facilities to comply with all applicable federal and state requirements.
Title VII – Technical Corrections – Includes various corrections and amendments to a few sections.
This law requires states (including Florida) to file state-specific action plans to improve grade crossing safety and implement laws on sight obstructions at passively signed highway-rail grade crossings. To meet this requirement, FDOT has developed a Highway-Rail Grade Crossing Safety Action Plan in 2011.
The law also provides grants for technology and safety improvements to railroads as well as state and local governments.
4. Passenger Rail Investment and Improvement Act (PRIIA) of 2008
While this act deals mostly with Amtrak performance, appropriations for rail-related projects, and a number of research grants and studies, it requires states to develop state rail plans. Prior to PRIIA, states had no statutory role in planning and implementation for intercity passenger rail outside of occasional FRA grants. Through the passage of this act, states are given an explicit role to oversee rail planning and implementation.96
96 The Passenger Rail Investment and Improvement Act of 2008