florida gulf coast university board of trustees ... · 2015-16. the number of master’s degrees...
TRANSCRIPT

Florida Gulf Coast University
Board of Trustees Information System
Quarterly Briefing
March 2018 Volume 17 Number 3
II
Introduction
The Quarterly Briefing shall provide the Board of Trustees with a set of periodic reports and performance indicators designed to give an overview of the University's major goals and achievements in academic affairs, faculty and student body demographics, research, economic development activities, facilities development, institutional advancement, and financial management.
The Quarterly Briefing will be updated as necessary and distributed to the Board of Trustees prior to each of its quarterly meetings.
Notes and Highlights
The final fall 2017 headcount enrollment was 14,943, 1% above fall 2016. The final 2017-18 annual fundable FTE is 9557, or 1.6% ahead of 2016-
17. The number of new freshmen is 2624, or 3% above 2016-17. In 2016-17, 2399 bachelor’s degrees were awarded compared to 2331 in
2015-16. The number of master’s degrees for 2016-17 was 286, compared to 269 in
2015-16. FGCU awarded 42 doctorates in 2016-17, bringing the total to 212. Undergraduates make up 93% of the total student population. Freshmen make up 21% of the student body. Among undergraduates, 78% are full time. Students 24 or under represent 84% of the student body. The fastest rate
of growth is among students 20 to 24. Hispanic students make up 20% of the total student population, increasing
6.3% over last fall. Majors in the College of Arts and Sciences represent 38% of the student
population. Section 4 has the 2017-18 Operating Budget. Tables 4.1 through 4.4
provide actual expenditures through 2016-17 and estimated budget for2017-18.

Page
Introduction II
1 - Student Enrollment1.1 Headcount Enrolled by Class, Fall Term 11.2 Full-Time Attendance, Fall Terms 11.3 Headcount Enrolled by College, Fall Term 21.4 International Students, Enrolled Fall Terms 21.5 Headcount Enrolled by Age, Fall Terms 31.6 Headcount Enrolled by Gender, Fall Terms 31.7 Headcount Enrolled by Class, Fall Terms 41.8 Headcount Enrolled by Ethnicity, Fall Terms 41.9 Degrees Granted by Academic Year 51.10 First Time in College Student Profile 61.11 FTIC Applicants by High School 71.12 Enrollment by County 81.13 Enrollment by State 9
2 - Enrollment Funding, FTE, Financial Aid2.1 Comparison of Fall Term Headcount and FTE 102.2 Actual and Planned Enrollment Growth 112.3 Student Financial Aid--Type 122.4 Student Financial Aid--Source and Criteria 132.5 Average SUS Section Size 142.6 SUS Cost Per Credit Hour 152 7 Instruction by Faculty Type 16
TABLE OF CONTENTS
2.7 Instruction by Faculty Type 16
3 - Faculty and Staff3.1 Count of Regular Employees 173.2 Ethnicity, Gender, and Category of Regular Employees 18
4 - Budget4.1 State Funding by Source 194.2 Grants and Auxiliaries 204.3 Local Funds 204.4 Operating Budget Summary 214.5 FGCU Foundation University Support 224.6 Public Education Capital Outlay Budget 23
5 - Campus5.1 Campus Crime Report 24

Table 1.1 - Headcount Enrolled by Class, Fall Terms
Fall Term 2006 2007 2008 2009 2010 2011 2012 2013 2014 2015 2016 2017Undergraduate 6,962 7,986 8,659 9,486 10,303 11,134 12,064 12,775 13,226 13,604 13,544 13,582Graduate 795 822 986 1,047 1,153 1,089 1,048 987 997 980 986 1,014Nondegree 559 580 593 572 582 432 330 312 240 240 291 347Total 8,316 9,388 10,238 11,105 12,038 12,655 13,442 14,074 14,463 14,824 14,821 14,943
Table 1.2 - Full-time Attendance by Level, Fall Terms
Undergraduate** 2006 2007 2008 2009 2010 2011 2012 2013 2014 2015 2016 2017Full-time 5,450 6,278 7,027 7,838 8,443 9,101 9,694 10,124 10,540 10,764 10,773 10,905Part-time 2,071 2,288 2,225 2,220 2,442 2,465 2,700 2,963 2,926 3,080 3,062 3,024
% Full-time 72% 73% 76% 78% 78% 79% 78% 77% 78% 78% 78% 78%
Graduate 2006 2007 2008 2009 2010 2011 2012 2013 2014 2015 2016 2017Full-time 244 253 323 399 435 403 393 365 359 367 411 449Part-time 551 569 663 648 718 686 655 622 638 613 575 565
% Full-time 31% 31% 33% 38% 38% 37% 38% 37% 36% 37% 42% 44%
**Undergraduate includes Non-degree seeking studentsSource: BOG Student Data Course Files.
0
2,000
4,000
6,000
8,000
10,000
12,000
14,000
16,000
2006 2007 2008 2009 2010 2011 2012 2013 2014 2015 2016 2017Nondegree Graduate Undergraduate
0%10%20%30%40%50%60%70%80%90%
2006 2007 2008 2009 2010 2011 2012 2013 2014 2015 2016 2017
Percent Full-time
Undergraduate** Graduate
1
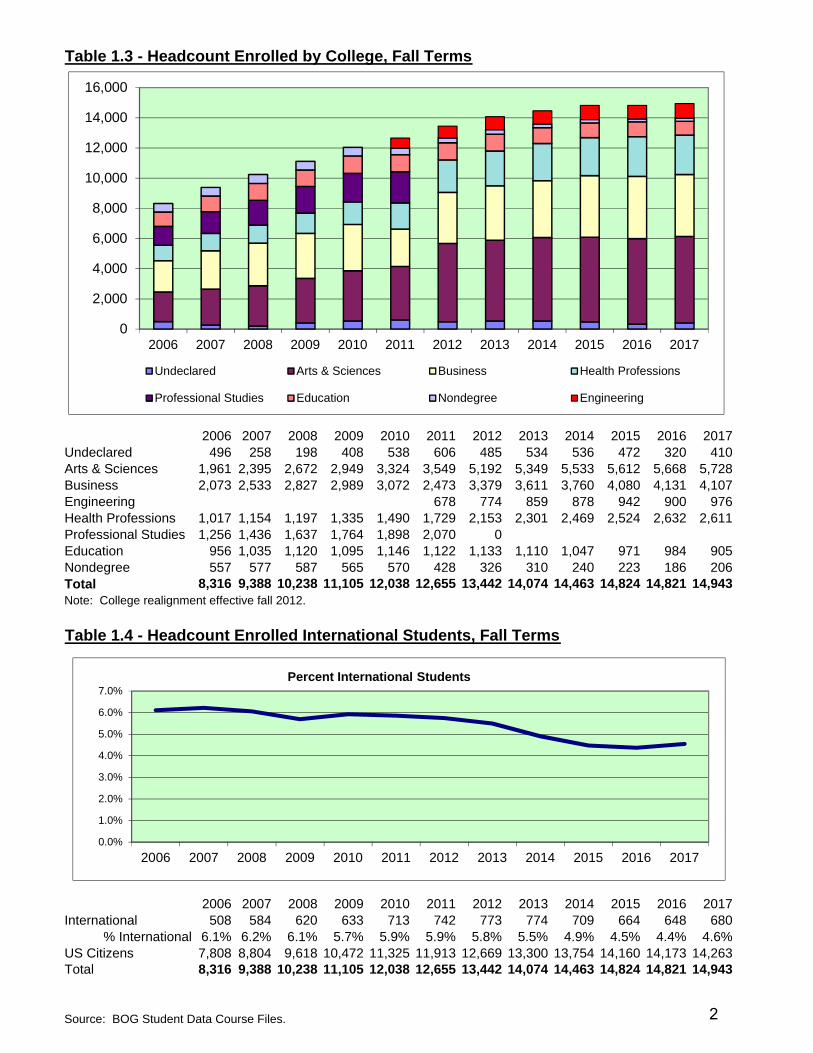
Table 1.3 - Headcount Enrolled by College, Fall Terms
2006 2007 2008 2009 2010 2011 2012 2013 2014 2015 2016 2017Undeclared 496 258 198 408 538 606 485 534 536 472 320 410Arts & Sciences 1,961 2,395 2,672 2,949 3,324 3,549 5,192 5,349 5,533 5,612 5,668 5,728Business 2,073 2,533 2,827 2,989 3,072 2,473 3,379 3,611 3,760 4,080 4,131 4,107Engineering 678 774 859 878 942 900 976Health Professions 1,017 1,154 1,197 1,335 1,490 1,729 2,153 2,301 2,469 2,524 2,632 2,611Professional Studies 1,256 1,436 1,637 1,764 1,898 2,070 0Education 956 1,035 1,120 1,095 1,146 1,122 1,133 1,110 1,047 971 984 905Nondegree 557 577 587 565 570 428 326 310 240 223 186 206Total 8,316 9,388 10,238 11,105 12,038 12,655 13,442 14,074 14,463 14,824 14,821 14,943Note: College realignment effective fall 2012.
Table 1.4 - Headcount Enrolled International Students, Fall Terms
2006 2007 2008 2009 2010 2011 2012 2013 2014 2015 2016 2017International 508 584 620 633 713 742 773 774 709 664 648 680
% International 6.1% 6.2% 6.1% 5.7% 5.9% 5.9% 5.8% 5.5% 4.9% 4.5% 4.4% 4.6%US Citizens 7,808 8,804 9,618 10,472 11,325 11,913 12,669 13,300 13,754 14,160 14,173 14,263Total 8,316 9,388 10,238 11,105 12,038 12,655 13,442 14,074 14,463 14,824 14,821 14,943
Source: BOG Student Data Course Files.
0
2,000
4,000
6,000
8,000
10,000
12,000
14,000
16,000
2006 2007 2008 2009 2010 2011 2012 2013 2014 2015 2016 2017
Undeclared Arts & Sciences Business Health Professions
Professional Studies Education Nondegree Engineering
0.0%
1.0%
2.0%
3.0%
4.0%
5.0%
6.0%
7.0%
2006 2007 2008 2009 2010 2011 2012 2013 2014 2015 2016 2017
Percent International Students
2

Table 1.5 - Headcount Enrolled by Age, Fall Terms
2006 2007 2008 2009 2010 2011 2012 2013 2014 2015 2016 2017Less than 20 2,424 2,854 2,962 3,126 3,354 3,888 4,264 4,342 4,402 4,434 4,251 4,19920 to 24 3,561 4,201 4,737 5,363 5,852 6,080 6,537 7,079 7,500 7,881 8,134 8,35325 to 29 915 976 1,110 1,217 1,314 1,262 1,253 1,308 1,295 1,314 1,318 1,32830 to 34 387 409 429 463 533 529 544 537 531 486 443 42035 to 39 320 301 326 314 312 284 280 279 257 257 256 23640 or greater 709 647 674 622 673 612 564 529 478 452 419 407Total 8,316 9,388 10,238 11,105 12,038 12,655 13,442 14,074 14,463 14,824 14,821 14,943
Table 1.6 - Headcount Enrolled by Gender, Fall Terms
2006 2007 2008 2009 2010 2011 2012 2013 2014 2015 2016 2017Female 5,212 5,745 6,053 6,446 6,794 7,163 7,608 7,964 8,166 8,322 8,389 8,438
% Female 63% 61% 59% 58% 56% 57% 57% 57% 56% 56% 57% 56%Male 3,104 3,643 4,185 4,659 5,244 5,492 5,834 6,110 6,297 6,502 6,432 6,505Total 8,316 9,388 10,238 11,105 12,038 12,655 13,442 14,074 14,463 14,824 14,821 14,943
Source: BOG Student Data Course Files.
0
2,000
4,000
6,000
8,000
10,000
12,000
14,000
16,000
2006 2007 2008 2009 2010 2011 2012 2013 2014 2015 2016 2017Less than 20 20 to 24 25 to 29 30 to 34 35 to 39 40 or greater
0
2,000
4,000
6,000
8,000
10,000
12,000
14,000
16,000
2006 2007 2008 2009 2010 2011 2012 2013 2014 2015 2016 2017
Female Male
3

Table 1.7 - Headcount Enrolled by Class, Fall Terms
2006 2007 2008 2009 2010 2011 2012 2013 2014 2015 2016 2017Freshman 2,393 2,762 2,810 2,905 3,087 3,534 3,881 4,024 3,983 3,853 3,447 3,150Sophomore 1,133 1,414 1,648 1,868 1,942 2,060 2,307 2,521 2,694 2,784 2,903 2,781Junior 1,624 1,807 2,015 2,222 2,476 2,551 2,725 2,983 3,090 3,251 3,520 3,731Senior 1,812 2,003 2,186 2,491 2,798 2,989 3,151 3,247 3,459 3,716 3,674 3,920Graduate 795 822 986 1,047 1,153 1,089 1,048 987 997 980 986 1,014Nondegree 559 580 593 572 582 432 330 312 240 240 291 347Total 8,316 9,388 10,238 11,105 12,038 12,655 13,442 14,074 14,463 14,824 14,821 14,943
Table 1.8 - Headcount Enrolled by Ethnicity, Fall Term
2006 2007 2008 2009 2010 2011 2012 2013 2014 2015 2016 2017Asian 162 179 181 237 263 303 339 363 377 395 405 420African American 385 423 444 568 719 865 1,012 1,109 1,226 1,263 1,233 1,263Hispanic 856 1,027 1,208 1,469 1,788 1,992 2,310 2,521 2,638 2,727 2,829 3,009Native American 28 33 34 94 93 101 109 112 113 110 111 129Non-resident alien 83 112 103 177 185 184 201 229 230 255 253 289White 6,566 7,197 7,839 8,493 8,866 9,085 9,295 9,574 9,707 9,867 9,775 9,619Not Reported 236 417 429 67 124 125 176 166 172 207 215 214Total 8,316 9,388 10,238 11,105 12,038 12,655 13,442 14,074 14,463 14,824 14,821 14,943
Note: These are the traditional race/ethnicity codes.
Asian2.8%
African American8.5%
Hispanic20.1%
Native American0.9%
Non-resident alien1.9%
White64.4%
Not Reported1.4%
Fall 2017
0
2,000
4,000
6,000
8,000
10,000
12,000
14,000
16,000
2006 2007 2008 2009 2010 2011 2012 2013 2014 2015 2016 2017Freshman Sophomore Junior Senior Graduate Nondegree
4
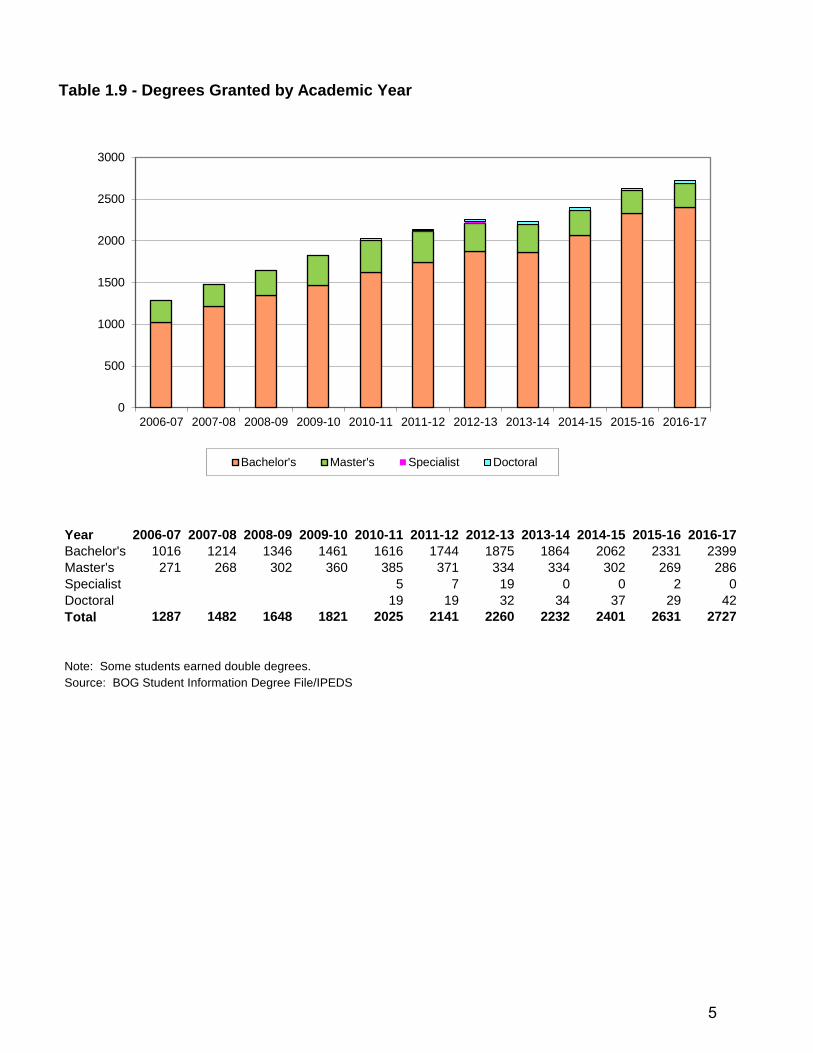
Table 1.9 - Degrees Granted by Academic Year
Year 2006-07 2007-08 2008-09 2009-10 2010-11 2011-12 2012-13 2013-14 2014-15 2015-16 2016-17Bachelor's 1016 1214 1346 1461 1616 1744 1875 1864 2062 2331 2399Master's 271 268 302 360 385 371 334 334 302 269 286Specialist 5 7 19 0 0 2 0Doctoral 19 19 32 34 37 29 42Total 1287 1482 1648 1821 2025 2141 2260 2232 2401 2631 2727
Note: Some students earned double degrees.Source: BOG Student Information Degree File/IPEDS
0
500
1000
1500
2000
2500
3000
2006-07 2007-08 2008-09 2009-10 2010-11 2011-12 2012-13 2013-14 2014-15 2015-16 2016-17
Bachelor's Master's Specialist Doctoral
5
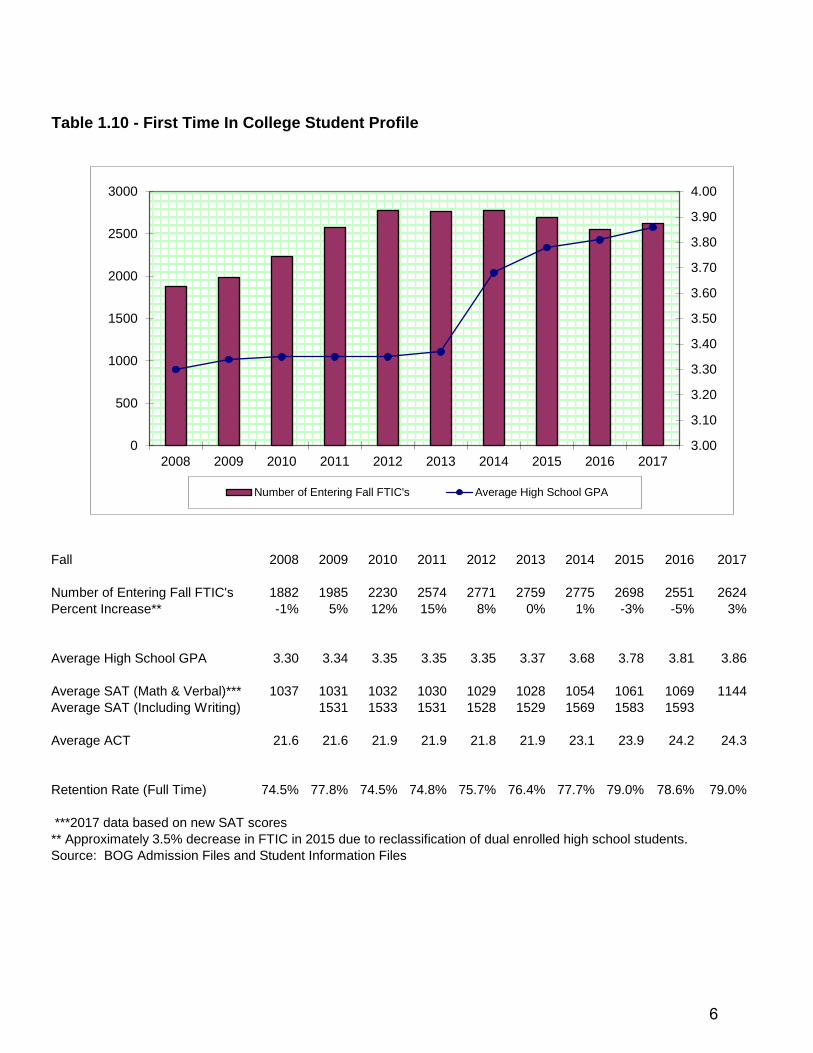
Table 1.10 - First Time In College Student Profile
Fall 2008 2009 2010 2011 2012 2013 2014 2015 2016 2017
Number of Entering Fall FTIC's 1882 1985 2230 2574 2771 2759 2775 2698 2551 2624Percent Increase** -1% 5% 12% 15% 8% 0% 1% -3% -5% 3%
Average High School GPA 3.30 3.34 3.35 3.35 3.35 3.37 3.68 3.78 3.81 3.86
Average SAT (Math & Verbal)*** 1037 1031 1032 1030 1029 1028 1054 1061 1069 1144Average SAT (Including Writing) 1531 1533 1531 1528 1529 1569 1583 1593
Average ACT 21.6 21.6 21.9 21.9 21.8 21.9 23.1 23.9 24.2 24.3
Retention Rate (Full Time) 74.5% 77.8% 74.5% 74.8% 75.7% 76.4% 77.7% 79.0% 78.6% 79.0%
***2017 data based on new SAT scores** Approximately 3.5% decrease in FTIC in 2015 due to reclassification of dual enrolled high school students.Source: BOG Admission Files and Student Information Files
3.00
3.10
3.20
3.30
3.40
3.50
3.60
3.70
3.80
3.90
4.00
0
500
1000
1500
2000
2500
3000
2008 2009 2010 2011 2012 2013 2014 2015 2016 2017
Number of Entering Fall FTIC's Average High School GPA
6

Table 1.11 - FTIC Applicants by High SchoolFall 2017Top 40
HIGH_SCHOOL_NAME NUMBER_OF_APPLICANTSNon-Florida High School 3260GULF COAST HIGH SCHOOL 183ESTERO HIGH SCHOOL 124BARRON COLLIER HIGH SCHOOL 122RIVERDALE HIGH SCHOOL 117FORT MYERS HIGH SCHOOL 104DUNBAR HIGH SCHOOL 104NAPLES HIGH SCHOOL 103PALMETTO RIDGE HIGH SCHOOL 93CYPRESS BAY HIGH SCHOOL 92NORTH FORT MYERS HIGH SCHOOL 83VENICE HIGH SCHOOL 83CAPE CORAL HIGH SCHOOL 81NEWSOME HIGH SCHOOL 78LEHIGH SENIOR HIGH SCHOOL 77CYPRESS LAKE HIGH SCHOOL 74MARJORY STONEMAN DOUGLAS HS 72RIVERVIEW HIGH SCHOOL 69IDA S BAKER HIGH SCHOOL 65COOPER CITY HIGH SCHOOL 63SAINT THOMAS AQUINAS HS 62Completed Home Schooling Program 61PARK VISTA COMMUNITY HS 59LAKEWOOD RANCH HIGH SCHOOL 58GOLDEN GATE HIGH SCHOOL 58WEST ORANGE HIGH SCHOOL 58WEST BROWARD HIGH SCHOOL 57MARINER HIGH SCHOOL 56WESTERN HIGH SCHOOL 56WIREGRASS RANCH HIGH SCHOOL 56CORAL REEF SENIOR HIGH SCHOOL 54BISHOP VEROT HIGH SCHOOL 53SOUTH FORT MYERS HIGH SCHOOL 53BRADEN RIVER HIGH SCHOOL 49OASIS SENIOR HIGH SCHOOL 49PALM HARBOR UNIVERSITY HS 49IMMOKALEE HIGH SCHOOL 48LELY HIGH SCHOOL 48BOCA RATON COMMUNITY HIGH SCH 47FORT LAUDERDALE HIGH SCHOOL 47ARCHBISHOP MCCARTHY HIGH SCHL 47
7

Table 1.12 Enrollment by CountyFall 2017 Top 40COUNTY CURRENT_TERM PRIOR_YR_TERM DIFFERENCE
Lee 4117 4086 31
Collier 2088 2045 43
Non‐Florida 1638 1545 93
Broward 1374 1451 ‐77
Palm Beach 787 853 ‐66
Hillsborough 596 597 ‐1
Sarasota 434 415 19
Pinellas 426 426 0
Dade 421 460 ‐39
Charlotte 360 356 4
Manatee 321 293 28
Orange 266 267 ‐1
Pasco 205 208 ‐3
Polk 176 187 ‐11
Non‐USA 144 131 13
Seminole 139 138 1
Brevard 135 133 2
Duval 118 109 9
Hendry 104 83 21
Martin 98 97 1
St. Lucie 91 84 7
St. Johns 83 82 1
Monroe 82 74 8
Lake 81 96 ‐15
Alachua 65 64 1
Volusia 63 63 0
Marion 60 65 ‐5
Hernando 59 48 11
Highlands 59 45 14
Osceola 59 52 7
Indian River 41 44 ‐3
Clay 34 33 1
Desoto 25 27 ‐2
Leon 21 20 1
Okeechobee 21 20 1
Flagler 20 19 1
Citrus 19 23 ‐4
Hardee 13 6 7
Okaloosa 13 4 9
Nassau 11 11 0
Source: SUS Student Instruction File/SUDS.
8

Table 1.13 Enrollment by StateFall 2017 STATE_NAME CURRENT_TERM PRIOR_YR_TERM DIFFERENCE
Alabama 6 5 1
Alaska 0 0 0
Arizona 3 3 0
Arkansas 0 0 0
California 34 34 0
Colorado 14 13 1
Connecticut 95 82 13
Delaware 5 6 ‐1
District of Columbia 0 5 ‐5
Florida 13160 13143 17
Georgia 33 29 4
Hawaii 3 3 0
Idaho 0 0 0
Illinois 199 181 18
Indiana 51 47 4
Iowa 13 13 0
Kansas 12 7 5
Kentucky 18 19 ‐1
Louisiana 2 0 2
Maine 16 13 3
Maryland 45 53 ‐8
Massachusetts 83 74 9
Michigan 51 52 ‐1
Minnesota 45 46 ‐1
Mississippi 4 7 ‐3
Missouri 22 22 0
Montana 1 0 1
Nebraska 4 4 0
Nevada 3 3 0
New Hampshire 26 22 4
New Jersey 186 187 ‐1
New Mexico 4 3 1
New York 153 157 ‐4
North Carolina 38 31 7
North Dakota 3 2 1
Ohio 124 103 21
Oklahoma 9 8 1
Oregon 3 3 0
Pennsylvania 122 119 3
Rhode Island 22 21 1
South Carolina 12 6 6
South Dakota 1 1 0
Tennessee 12 12 0
Texas 25 30 ‐5
Utah 2 3 ‐1
Vermont 11 14 ‐3
Virginia 47 36 11
Washington 3 5 ‐2
West Virginia 3 3 0
Wisconsin 49 41 8
Wyoming 2 3 ‐1
None 164 147 17
Source: SUS Student Instruction File/SUDS.
9

Table 2.1 - Comparison of Fall Term Headcount and Annual FTE
2005-06 2006-07 2007-08 2008-09 2009-10 2010-11 2011-12 2012-13 2013-14 2014-15 2015-16 2016-17 2017-18*Headcount 7,254 8,316 9,388 10,238 11,105 12,038 12,655 13,442 14,074 14,463 14,824 14,821 14,943 Annual FTE 4,313 5,018 5,731 6,439 7,019 7,598 8,045 8,355 8,745 9,090 9,300 9,404 9,557
HeadcountPer FTE 1.68 1.66 1.64 1.59 1.58 1.58 1.57 1.61 1.61 1.59 1.59 1.58 1.56FTE PerHeadcount 0.59 0.60 0.61 0.63 0.63 0.63 0.64 0.62 0.62 0.63 0.63 0.63 0.64*Preliminary dataSource: BOG Reported Data.
-
2,000
4,000
6,000
8,000
10,000
12,000
14,000
16,000
2005-06 2006-07 2007-08 2008-09 2009-10 2010-11 2011-12 2012-13 2013-14 2014-15 2015-16 2016-17 2017-18*
Headcount Annual FTE
1.0
1.1
1.2
1.3
1.4
1.5
1.6
1.7
1.8
2005‐06 2006‐07 2007‐08 2008‐09 2009‐10 2010‐11 2011‐12 2012‐13 2013‐14 2014‐15 2015‐16 2016‐17 2017‐18*
Headcount Per FTE
10

Actual and Planned FTE Enrollment Growth
Approved Enrollment Plan2007-08 2008-09 2009-10 2010-11 2011-12 2012-13 2013-14 2014-15 2015-16 2016-17
Lower 2,224 2,224 2,224 2,224 2,224 2,224 2,224 2,404 2,404 2,404Upper 2,319 2,319 2,319 2,319 2,319 2,319 2,319 2,427 2,427 2,427Grad I 510 510 510 510 510 510 510 532 532 532Grad II 10 10 10 10 10 10 10 10 10 10NonRes 310 310 310 310 310 310 310Total 5,373 5,373 5,373 5,373 5,373 5,373 5,373 5,373 5,373 5,373
Official/Submitted Projections2017-18 2018-19 2019-20 2020-21 2021-22 2022-2023
Lower 4,548 4,594 4639 4686 4733 4780Upper 4,332 4,375 4419 4463 4508 4553Grad I 467 472 477 482 486 491Grad II 144 145 147 148 150 151NonResTotal 9,491 9,586 9682 9,779 9,877 9,976
Actual FTE Enrollment2007-08 2008-09 2009-10 2010-11 2011-12 2012-13 2013-14 2014-15 2015-16 2016-17
Lower 2,807 3,100 3,383 3,418 3,729 4,036 4280 4645 4558 4506Upper 2,410 2,712 2,954 3,105 3,282 3,324 3477 3839 4146 4294Grad I 513 604 630 636 579 517 492 491 480 462Grad II 23 52 79 100 122 111 115 117 142NonRes 361 355 356 386Actual 5,731 6,439 7,019 7,598 8,045 8,355 8746 9090 9300 9404
Note: There are occasional rounding errrors./**Traditional SUS FTESource: BOG Enrollment Plan, Student Information Files.
Table 2.2
0
2,000
4,000
6,000
8,000
10,000
12,000
2007-08 2008-09 2009-10 2010-11 2011-12 2012-13 2013-14 2014-15 2015-16 2016-17 2017-18 2018-19 2019-20 2020-21 2021-22 2022-23
Fund
able
FTE
Fundable FTE, Actual and Projected**
Funded Actual Projected
11

Financial Aid Summary 2016-17 % of % of % of AllType Amount Total $ Recipients Recipients Students
Grants $25,033,221 27% 5572 55% 38%Loans $54,086,930 59% 6223 61% 42%Scholarships $11,552,070 13% 3859 38% 26%Work Study $453,334 0.5% 271 3% 2%
TOTAL $91,125,555 100% 10,188 69%
Recipients are unduplicated within each category and when totaled.Source: BOG Student Financial Aid File.
Table 2.3 - Student Financial Aid
Grants27%
Loans59%
Scholarships13%
Work Study0.5%
Distribution of Aid Amounts 2016-17
Grants50%
Loans59%
Scholarships51%
Work Study2%
Distribution of Recipients Receiving Aid 2016-17
12
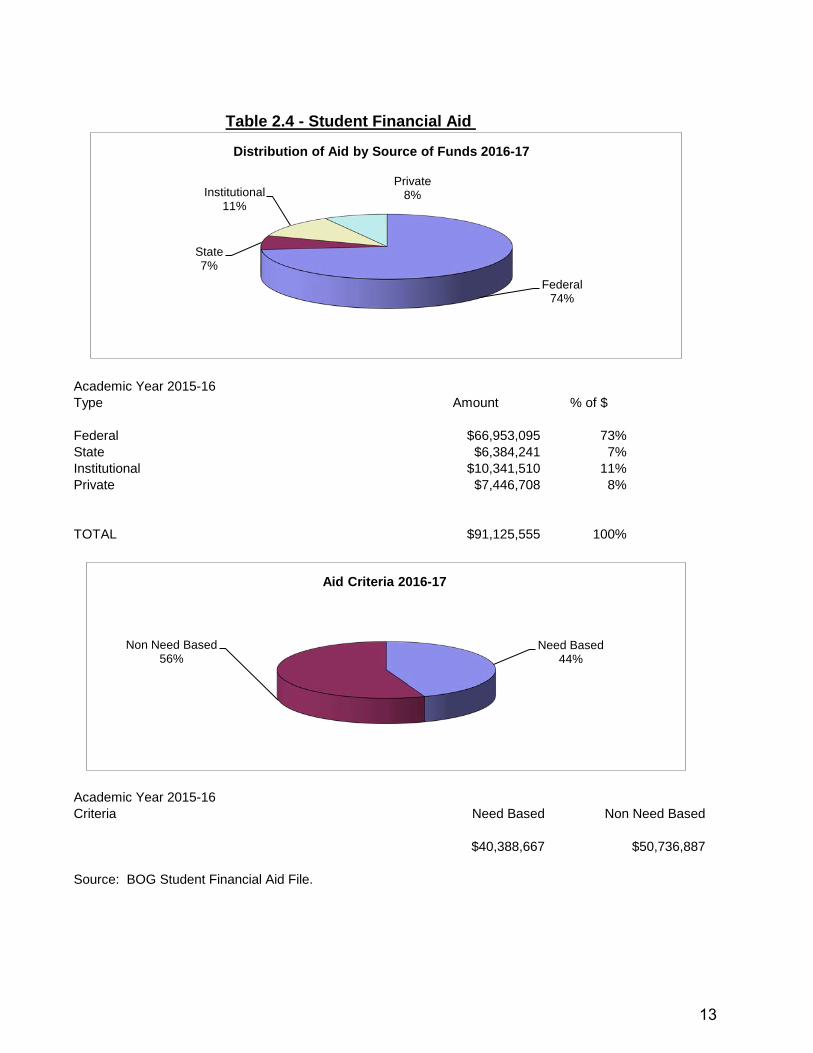
Academic Year 2015-16Type Amount % of $
Federal $66,953,095 73%State $6,384,241 7%Institutional $10,341,510 11%Private $7,446,708 8%
TOTAL $91,125,555 100%
Academic Year 2015-16Criteria Need Based
$40,388,667
Source: BOG Student Financial Aid File.
$50,736,887
Non Need Based
Table 2.4 - Student Financial Aid
Federal74%
State7%
Institutional11%
Private8%
Distribution of Aid by Source of Funds 2016-17
Need Based44%
Non Need Based56%
Aid Criteria 2016-17
13

Table 2.5 - Average SUS Section Size
Average Section Size by University & Level
Fall Fall Fall Fall Fall Fall Fall Fall Fall Fall Fall Fall Fall Fall Fall Fall FallUNIV LEV 2000 2001 2002 2003 2004 2005 2006 2007 2008 2009 2010 2011 2012 2013 2014 2015 2016FAMU UG 28 29 29 31 31 30 30 30 31 32 33 33 30 29 27 27 26FAMU GR 10 9 10 12 12 13 14 15 16 16 15 15 15 14 13 13 14FAMU ALL 25 25 26 27 27 27 27 27 28 29 29 29 27 25 23 23 23
FAU UG 27 28 30 28 29 28 28 29 29 30 31 32 33 34 34 34 34FAU GR 10 12 13 11 11 11 11 11 11 12 12 12 13 12 12 12 13FAU ALL 23 25 27 25 25 25 24 25 25 26 27 28 29 29 29 30 30
FGCU UG 20 21 23 24 24 26 29 32 33 34 34 34 34 35 36 35 35FGCU GR 11 13 14 14 13 13 14 15 15 16 15 16 15 16 16 15 16FGCU ALL 18 20 22 22 22 24 27 30 30 31 31 32 32 33 34 34 33
FIU UG 30 32 32 32 31 33 34 33 35 36 38 38 38 37 37 36 38FIU GR 13 14 14 13 12 13 13 14 16 17 17 17 16 16 15 15 15FIU ALL 27 28 28 28 27 28 29 28 30 31 32 33 32 32 31 31 32
FPU UG 24 24 24FPU GR 15 9 9FPU ALL 24 23 24
FSU UG 30 30 32 31 31 31 31 32 31 32 33 32 31 33 33 34 34FSU GR 10 10 10 10 10 9 9 10 9 10 10 9 9 10 10 10 10FSU ALL 24 24 25 25 24 24 24 24 24 24 25 25 24 26 26 26 27
UCF UG 37 38 38 39 39 41 41 43 45 47 47 48 48 48 49 51 51UCF GR 12 13 14 15 15 14 14 14 14 16 16 16 16 16 15 15 15UCF ALL 32 33 33 34 34 36 36 37 39 41 41 42 42 42 42 44 44
UF UG 37 38 39 39 38 38 38 37 34 34 33 33 32 32 31 31 32UF GR 19 18 18 19 20 20 21 21 21 21 20 19 18 17 17 17 17UF ALL 33 33 33 33 33 33 33 32 30 30 28 28 27 27 26 26 26
UNF UG 28 30 30 30 30 29 30 30 30 32 31 31 31 30 29 28 29UNF GR 14 14 15 15 14 14 14 15 15 16 15 15 15 14 14 14 14UNF ALL 26 27 28 27 28 27 28 28 28 30 29 29 29 28 27 26 27
USF UG 31 31 34 35 35 35 35 35 36 35 35 33 33 34 33 34 34USF GR 14 14 14 14 14 13 13 13 14 14 14 13 13 13 14 14 14USF ALL 27 27 29 30 30 30 30 29 31 30 30 28 28 29 28 28 29
UWF UG 22 24 23 23 24 23 23 25 26 27 28 27 27 27 27 27 26UWF GR 12 12 11 11 11 11 12 11 11 12 12 12 11 12 13 12 12UWF ALL 21 22 21 21 22 21 21 23 24 24 25 25 24 24 24 24 23
SUS UG 31 32 34 33 33 33 33 34 34 35 35 35 35 35 35 35 36SUS GR 13 13 14 14 14 14 14 14 14 15 15 14 14 14 14 14 14SUS ALL 27 28 28 29 28 28 29 29 29 30 30 30 30 30 30 30 30
Note: Excludes independent study courses.Source: SUS Instructional Activity File/SUDS.
14

SUS UF FSU FAMU USF FAU UWF UCF FIU UNF FGCU NCF FPU1998-99 306.46 299.42 328.12 329.91 343.98 324.29 305.12 258.52 278.97 260.69 540.561999-00 317.49 313.02 349.08 344.06 343.96 333.69 322.84 278.52 279.66 265.63 507.172000-01 324.98 318.86 372.92 394.41 346.48 335.96 320.81 270.46 285.87 270.61 465.282001-02 304.67 316.16 334.68 363.94 316.73 309.51 295.03 257.67 274.94 248.65 375.32 465.902002-03 315.31 330.25 338.44 393.48 316.12 331.14 314.48 275.92 287.04 249.26 333.07 505.572003-04 317.03 342.15 329.74 384.44 324.24 328.25 323.52 269.26 295.10 250.79 326.85 573.622004-05 328.47 360.75 334.25 391.25 308.62 351.34 345.07 300.94 299.58 258.13 357.95 628.612005-06 338.34 370.39 351.73 425.82 324.48 364.74 363.77 301.07 300.30 269.80 351.13 616.832006-07 357.70 401.39 361.83 477.75 343.37 395.77 368.67 318.03 307.69 288.71 347.44 771.192007-08 352.21 385.81 358.97 497.03 339.22 400.52 357.46 295.15 322.61 293.46 337.00 806.152008-09 344.52 377.58 372.22 499.70 318.18 407.21 320.22 274.39 317.44 299.38 314.34 780.852009-10 335.64 393.63 361.16 473.98 320.07 376.87 304.96 258.66 315.87 284.38 287.50 742.792010-11 341.86 418.48 373.71 441.29 330.25 383.65 302.44 260.37 311.25 300.61 278.95 789.002011-12 321.70 398.09 325.57 408.30 328.06 370.80 288.42 246.44 288.79 298.46 276.48 712.632012-13 361.11 423.28 397.16 486.57 363.50 363.91 343.34 304.92 324.09 323.54 280.22 763.902013-14 380.20 465.63 417.65 598.45 380.00 359.07 364.67 312.92 330.39 349.71 291.08 859.782014-15 406.23 496.89 461.30 629.05 412.73 349.46 351.11 340.84 338.12 385.88 334.27 848.09 1,308.912015-16 418.13 503.21 475.52 625.37 440.43 344.55 341.43 368.46 343.79 404.91 340.85 877.09 1,080.602016-17 433.08 512.04 493.56 611.55 462.30 371.25 369.96 378.83 366.72 394.26 361.87 900.23Source: SUS Expenditure Analysis
Table 2.6 - SUS Cost Per Credit Hour
$200
$300
$400
$500
$600
$700
$800
$900
$1,000
1998-99
1999-00
2000-01
2001-02
2002-03
2003-04
2004-05
2005-06
2006-07
2007-08
2008-09
2009-10
2010-11
2011-12
2012-13
2013-14
2014-15
2015-16
2016-17
Total Expenditure Per Student Credit Hour
SUS UF FSU FAMU USF FAUUWF UCF FIU UNF FGCU NCF
15

Table 2.7 - Instruction by Faculty Type
Distribution of Classroom Sections by Faculty Type
Sections % Sections % Sections % Sections % Sections % Sections %Faculty 2767 79% 2915 81% 2926 80% 2919 79% 2883 79% 2938 79%Adjuncts 665 19% 626 17% 658 18% 731 20% 660 18% 691 19%Other 81 2% 56 2% 68 2% 58 1% 104 3% 70 2%Total 3513 3597 3652 3708 3647 3699
Distribution of Student Credit Hours by Faculty Type
Hours % Hours % Hours % Hours % Hours % Hours %Faculty 246254 78% 265549 81% 276489 80% 281895 79% 292259 80% 294576 79%Adjuncts 63389 20% 59257 18% 63178 18% 72770 20% 64680 18% 70437 19%Other 6454 2% 4078 1% 5107 1% 4084 1% 10292 2% 6301 1%Total 316097 328884 344774 358749 367231 371314
Source: BOG Instruction & Research Data Files
2015-16
2015-16
2014-15
2014-15
2016-17
2016-17
2012-13
2012-13
2011-12
2011-12
2013-14
2013-14
Faculty79%
Adjuncts19%
Other2%
Classroom Sections 2016-17
16

Table 3.1 - Count of Full-time Employees
Pay Plan Classification 2005 2006 2007 2008 2009 2010 2011 2012 2013 2014 2015 2016 2017Support Staff 248 257 277 278 285 286 297 302 315 343 329 348 355Adm & Professional Staff 247 273 280 295 301 315 340 358 377 400 439 446 476Faculty 301 335 361 380 402 427 452 484 488 513 526 540 541Total 796 865 918 953 988 1028 1089 1144 1180 1256 1294 1334 1372
Percent Increase 2005 2006 2007 2008 2009 2010 2011 2012 2013 2014 2015 2016 2017Support Staff 9% 4% 8% 0% 3% 0% 4% 2% 4% 9% -4% 6% 2%Adm & Professional Staff 19% 11% 3% 5% 2% 5% 8% 5% 5% 6% 10% 2% 7%Faculty 10% 11% 8% 5% 6% 6% 6% 7% 1% 5% 3% 3% 0%Total 12% 9% 6% 4% 4% 4% 6% 5% 3% 6% 3% 3% 3%
Source: University Personnel-Payroll-Budget system and BOG Employment Report.
0
200
400
600
800
1000
1200
1400
1600
2005 2006 2007 2008 2009 2010 2011 2012 2013 2014 2015 2016 2017
Support Staff Adm & Professional Staff Faculty
17

Source: BOG/IPEDS.
Table 3.2 - Ethnicity, Gender, and Category of Full-time Employees
Male43.1%
Female56.9%
Fall 2017 GenderAsian4.1% African-
American6.7%
Hispanic8.7%
Native American
0.4%
White78.2%
2+ Races1.7%
Pacific Isl0.1%
Fall 2017 Ethnicity
Mgt Occupations6%
Faculty34%
Athl, Legal, Media16%
Business, Finance7%
Computer, Engr, Sci7%
Health1%
Library3%
Maintenance2%
Office Support12%
Svc Occupations4%
Oth Teach, Instrl Supp8%
Standard Occupational Classifications
18

Table 4.1 - State Funding by Source of Funds
BudgetEducation & General Revenue 2013-14 2014-15 2015-16 2016-17 2017-18
General Revenue 53,700,676 57,188,688 65,633,915 67,640,897 65,760,187 Lottery Trust Fund 5,790,116 7,293,122 6,826,428 7,684,070 6,383,204 Student Tuition 52,131,259 53,387,296 55,704,415 57,701,143 57,453,104
Total 111,622,051 117,869,106 128,164,758 133,026,110 129,596,495
Source: FGCU Operating Budget, End of Year Budget Report
-
20,000,000
40,000,000
60,000,000
80,000,000
100,000,000
120,000,000
140,000,000
2013-14 2014-15 2015-16 2016-17 2017-18
General Revenue Lottery Trust Fund Student Tuition
19

Table 4.2 - Grants and Auxiliaries
BudgetGrants and Auxiliaries 2013-14 2014-15 2015-16 2016-17 2017-18
Sponsored Research & Pgms 13,347,269 12,117,532 12,473,104 12,815,349 12,454,674 Auxiliaries 42,872,304 48,898,271 49,260,516 49,401,602 50,015,039
Total 56,219,573 61,015,803 61,733,620 62,216,951 62,469,713
Source: FGCU Operating Budget, End of Year Budget Report
Table 4.3 - Local Funds
BudgetLocal Funds 2013-14 2014-15 2015-16 2016-17 2017-18
Student Activities 4,195,332 4,008,199 4,116,947 4,179,946 4,236,983 Financial Aid 25,988,465 27,059,370 27,292,827 27,207,439 27,323,428 Concession 300,165 340,515 322,642 345,504 335,000 Intercollegiate Athletics 9,085,002 9,194,949 10,557,329 10,941,835 11,870,840
Total 39,568,964 40,603,033 42,289,745 42,674,724 43,766,251 Source: FGCU Operating Budget, End of Year Budget Report
-
10,000,000
20,000,000
30,000,000
40,000,000
50,000,000
60,000,000
70,000,000
2013-14 2014-15 2015-16 2016-17 2017-18
Sponsored Research & Pgms Auxiliaries
-
5,000,000
10,000,000
15,000,000
20,000,000
25,000,000
30,000,000
35,000,000
40,000,000
45,000,000
50,000,000
2013-14 2014-15 2015-16 2016-17 2017-18
Student Activities Financial Aid Concession Intercollegiate Athletics
20

Table 4.4 - Operating Budget Summary
BudgetOperating Budget Summary 2013-14 2014-15 2015-16 2016-17 2017-18
Education & General 111,622,051 117,869,106 128,164,758 133,026,110 129,596,495 Auxiliary Trust Fund 42,872,304 48,898,271 49,260,516 49,401,602 50,015,039 Sponsored Research & Pgms 13,347,269 12,117,532 12,473,104 12,815,349 12,454,674 Local Funds 40,759,040 40,603,033 42,289,745 42,674,724 43,766,251
Total 208,600,664 219,487,942 232,188,123 237,917,785 235,832,459
Source: FGCU Operating Budget, End of Year Budget Report
Education & General
55%
Auxiliary Trust Fund 21%
Sponsored Research &
Pgms5%
Local Funds 19%
2017-18
21
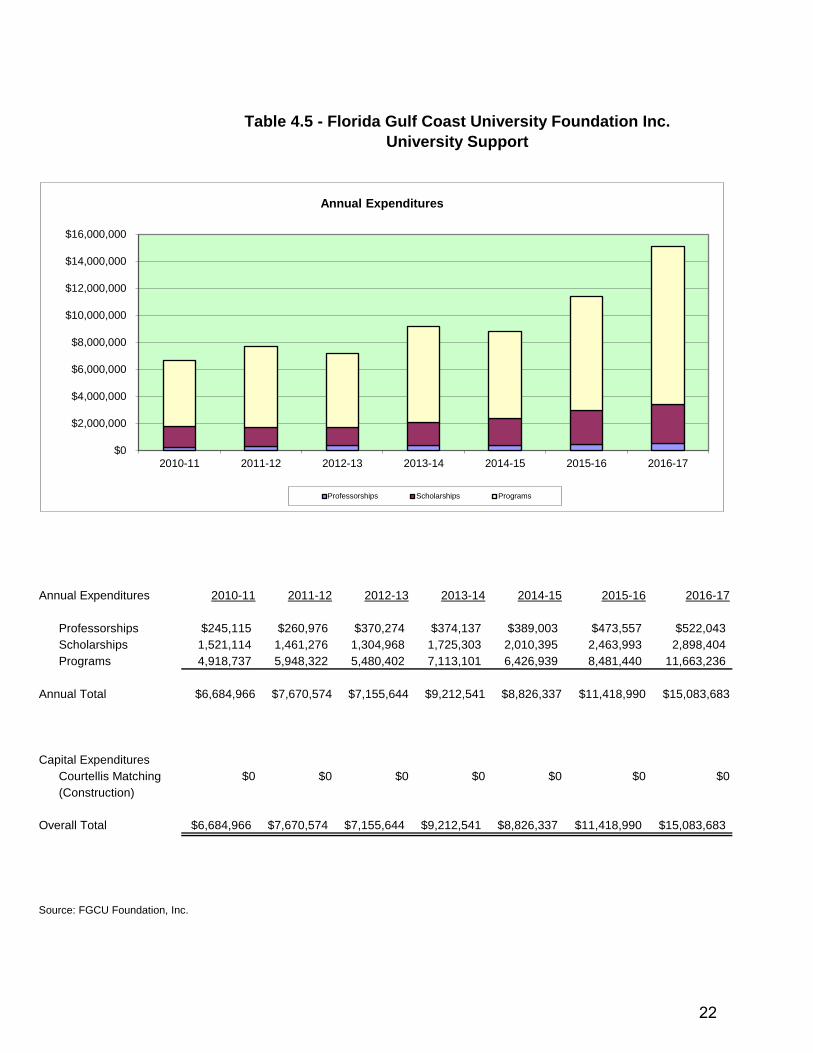
Annual Expenditures 2010-11 2011-12 2012-13 2013-14 2014-15 2015-16 2016-17
Professorships $245,115 $260,976 $370,274 $374,137 $389,003 $473,557 $522,043Scholarships 1,521,114 1,461,276 1,304,968 1,725,303 2,010,395 2,463,993 2,898,404 Programs 4,918,737 5,948,322 5,480,402 7,113,101 6,426,939 8,481,440 11,663,236
Annual Total $6,684,966 $7,670,574 $7,155,644 $9,212,541 $8,826,337 $11,418,990 $15,083,683
Capital ExpendituresCourtellis Matching $0 $0 $0 $0 $0 $0 $0(Construction)
Overall Total $6,684,966 $7,670,574 $7,155,644 $9,212,541 $8,826,337 $11,418,990 $15,083,683
Source: FGCU Foundation, Inc.
Table 4.5 - Florida Gulf Coast University Foundation Inc.University Support
$0
$2,000,000
$4,000,000
$6,000,000
$8,000,000
$10,000,000
$12,000,000
$14,000,000
$16,000,000
2010-11 2011-12 2012-13 2013-14 2014-15 2015-16 2016-17
Annual Expenditures
Professorships Scholarships Programs
22

University: Florida Gulf Coast University
PECO-ELIGIBLE PROJECT REQUESTS
PriorityNo Project 2018-19 2019-20 2020-21 2021-22 2022-23 Total
1
Integrated Watershed and Coastal Studies (Prev. Classrooms/Offices/Labs -Academic 9) (C,E) 31,441,730 4,500,000 35,941,730
2Health Sciences (Prev. Multipurpose Education Facility) (P,C,E) 3,842,000 42,820,950 4,500,000 51,162,950
3Road/Parking/Infrastructure/Mitigation (P,C,E) 3,000,000 4,000,000 5,000,000 7,000,000 19,000,000
4Central Energy Plant Expansion Phase 3 (C,E) 9,000,000 9,000,000
TOTAL 31,441,730 20,342,000 46,820,950 9,500,000 7,000,000 115,104,680
CITF PROJECT REQUESTS
1
Student Health and Life Fitness Center - Phase 1 (Prev. Student Recreation Center) (C,E) 4,941,728 4,941,728
TOTAL 4,941,728 0 0 0 0 4,941,728
REQUESTS FROM OTHER STATE SOURCES
1 Performing Arts Center (P,C,E) 3,480,000 32,520,000 4,000,000 40,000,000
2 Alumni Center (P,C,E) 2,200,000 23,800,000 26,000,000
3 Land Acquisiton (LA) 5,000,000 5,000,000 5,000,000 15,000,000
4 Academic 10(P,C,E) 3,000,000 32,000,000 35,000,000
TOTAL 0 10,680,000 61,320,000 12,000,000 32,000,000 116,000,000
REQUESTS FROM NON-STATE SOURCES,INCLUDING DEBT
Student Housing-Phase 14 30,000,000 30,000,000
Parking Garage 5 11,000,000 11,000,000
TOTAL 0 0 0 11,000,000 30,000,000 41,000,000
Source: Facilities Planning
Table 4.6Florida Gulf Coast University
Five-Year Capital Improvement Plan (CIP-2) and Legislative Budget RequestPeriod: 2018-19 through 2022-23
23

Table 5.1 - Annual Report of Crime Statistics
2009 2010 2011 2012 2013 2014 2015 2016 2017Homicide Offenses 0 0 0 0 0 0 0 0 0Manslaughter 0 0 0 0 0 0 0 0 0Rape 2 0 2 2 4 3 0 2 4Forcible Fondling 0 0 0 0 0 0 6 0 0Robbery 0 0 0 0 0 2 1 1 0Aggravated Assault 1 1 0 3 0 0 2 0 2Burglary/Breaking & Entering 3 2 7 7 2 0 3 1 2Larceny/Theft Offenses 59 71 77 79 71 64 67 53 65Arson 0 0 0 0 0 1 0 0 0Motor Vehicle Theft 1 0 1 0 0 1 1 0 2
Race 0 0 0 0 0 0 0 0 0Gender 0 0 0 0 0 0 0 0 0Religion 0 0 0 0 0 0 0 0 1Sexual Orientation 0 0 0 1 0 0 0 0 0Ethnicity 0 0 0 0 0 0 0 0 0Disability 0 0 0 0 0 0 0 0 0
Liquor Law Violations 6 19 7 11 2 5 0 2 1Drug Law Violations 7 7 4 7 16 20 39 38 38Weapons Law Violations 0 0 0 0 0 0 0 0 0**
Liquor Law Violations 455 398 683 885 415 427 681 558Drug Law Violations 116 166 101 107 125 227 288 220Weapons Law Violations 3 8 7 3 0 1 5 1
** Weapons arrests- several arrests involved weapons, but had higher charges.Source: University Police and Safety Department
Offense
Number of Arrests – Select Offenses
Referrals to Student Code of Conduct – Select Offenses
Hate Crimes (by Prejudices)
24