florida department of law enforcement april 2016
TRANSCRIPT

FLORIDA DEPARTMENT OF LAW ENFORCEMENT APRIL 2016

2015 Medical Examiners Commission Interim Drug Report Page i
Data Collection
The State of Florida’s Bureau of Vital Statistics reported 100,189 deaths occurred in Florida during the first six months of 2015. Of the cases seen by the state’s medical examiners, toxicology results determined that the drugs listed below were present at the time of death in 4,682 cases. The medical examiners assessed whether the drug(s) identified was the cause of death or merely present at the time of death. The data were then submitted to the Medical Examiners Commission for presentation in this report. It is important to note that each death is a single case, while each time a drug is detected represents an occurrence. The vast majority of the 4,682 cases (decedents) had more than one drug occurrence. When reporting the data, the state’s medical examiners were asked to distinguish between the drugs determined to be the cause of death, and those drugs that were present in the body at the time of death. A drug is indicated as the cause of death only when, after examining all evidence, the autopsy, and toxicology results, the medical examiner determines the drug played a causal role in the death. It is not uncommon for a decedent to have multiple drugs listed as a cause of death. However, a drug may not have played a causal role in the death even when the medical examiner determines the drug is present or identifiable in the decedent. Therefore, a decedent often is found to have multiple drugs listed as present; these are drug occurrences and are not equivalent to cases (decedents). Data were collected on the following drugs:
•Buprenorphine •Codeine •Fentanyl •Heroin •Hydrocodone •Hydromorphone •Meperidine •Methadone •Morphine •Oxycodone •Oxymorphone •Tramadol
Opioids
•Cannabinoids •Carisoprodol/
Meprobamate •Cathinones •Cocaine •GHB •Ketamine •Sympathomimetic Amines •Synthetic Cannabinoids •Zolpidem
Other
•Ethyl Alcohol Ethanol
•Phencyclidine (PCP)
•Phenethylamines/ Piperazines
•Tryptamines
Hallucinogenics
•Halogenated •Helium •Hydrocarbon •Nitrous Oxide
Inhalants
•Amphetamine
•Methamphetamine Amphetamines
•Alprazolam •Chlordiazepoxide •Clonazepam •Diazepam •Estazolam •Flunitrazepam •Flurazepam •Lorazepam •Midazolam •Nordiazepam •Oxazepam •Temazepam •Triazolam
Benzodiazepines

2015 Medical Examiners Commission Interim Drug Report Page ii
Report Summary
Some general statewide trends for the first half of 2015 (January – June) are listed below. Please note: comparisons to 2014 are based on data for January through June.
Total drug-related deaths increased by 13.9 percent (570 more) when compared with the first half of 2014.
2,548 individuals (261 more deaths than the first half of 2014) died with one or more prescription drugs in their system. The drugs were identified as
both the cause of death and present in the decedent. These drugs may have also been mixed with illicit drugs and/or alcohol.
1,155 individuals (179 more deaths than the first half of 2014) died with at least one prescription drug in their system that was identified as the cause
of death. These drugs may have been mixed with other prescription drugs, illicit drugs, and/or alcohol.
Prescription drugs (benzodiazepines, carisoprodol/meprobamate, zolpidem, and all opioids, excluding heroin) continued to be found more often than
illicit drugs, both as the cause of death and present at death. Prescription drugs account for 68.9 percent of all drug occurrences in this report when
ethyl alcohol is excluded.
Heroin (93.3 percent), fentanyl (72.8 percent), methadone (66.1 percent), morphine (57.8 percent), cocaine (52.5 percent), and oxycodone (52.2
percent) were listed as causing death in more than 50 percent of the deaths in which these drugs were found.
The five most frequently occurring drugs found in individuals were ethyl alcohol (2,288), benzodiazepines (2,182, including 666 alprazolam deaths),
cocaine (840), cannabinoids (785), and morphine (670). The increase in positive cannabinoid findings is due to the increased surveillance by medical
examiner offices and not a direct reflection of the increased use of cannabis by decedents.
The drugs that caused the most deaths were benzodiazepines (558, including 281 alprazolam deaths), cocaine (441), morphine (387), ethyl alcohol
(384), heroin (320), fentanyl (289), and oxycodone (274).
Occurrences of heroin increased by 107.9 percent (178 more) and deaths caused by heroin increased by 114.8 percent (171 more) compared with the
first half of 2014; 94 percent of all heroin occurrences were in accidental deaths.
Occurrences of fentanyl increased by 97.5 percent (196 more) and deaths caused by fentanyl increased by 105.0 percent (148 more) compared with
the first half of 2014.
Occurrences of methadone decreased by 4.8 percent (12 less) and hydrocodone remained the same compared with the first half of 2014. Deaths
caused by methadone decreased by 8.7 percent (15 less) and hydrocodone decreased by 12.9 percent (16 less) during the same period.

2015 Medical Examiners Commission Interim Drug Report Page iii
(Report Summary Continued)
Occurrences of oxycodone increased by 8.2 percent (40 more) and deaths caused by oxycodone increased by 21.2 percent (48 more) compared with
the first half of 2014.
Occurrences of cocaine increased by 12.1 percent (91 more) and deaths caused by cocaine increased by 23.5 percent (84 more) compared with the
first half of 2014.
Alprazolam (Xanax) and nordiazepam dominate the category of benzodiazepines. Occurrences of alprazolam increased by 11.7 percent (70 more) and
nordiazepam increased by 3.9 percent (12 more) compared to the first half of 2014. Alprazolam and nordiazepam are rarely the sole cause of death,
but are common as contributing to the cause of multi-drug deaths. Note that since the drugs diazepam (Valium) and chlordiazepoxide (Librium) are
normally broken down in the body into the drug nordiazepam, many occurrences of nordiazepam may represent ingestion of these other
benzodiazepines.
Occurrences of methamphetamine increased by 16.1 percent (18 more) and amphetamine increased by 34.6 percent (46 more) compared with the
first half of 2014.
Reporting of occurrences of illicit fentanyl analogs was not specifically requested by the Commission in 2015. Due to the rapid rise of deaths
associated with fentanyl analogs, many districts voluntarily reported data; however, the data is not complete. A total of 49 occurrences of fentanyl
analogs were reported for the period of January through June 2015, with the majority identified as acetyl fentanyl (53 percent). Refer to page 24 of
the report for a representation of the frequency of occurrence of fentanyl analogs. Reporting of fentanyl analogs by all districts will begin with the
2016 Drugs Identified in Deceased Persons Reports.

2015 Medical Examiners Commission Interim Drug Report Page iv
Medical Examiners Commission Members
Stephen J. Nelson, M.A., M.D., F.C.A.P. Chairman
District 10 Medical Examiner 1021 Jim Keene Boulevard
Winter Haven, Florida 33880 (863) 298-4600
Email: [email protected]
Barbara C. Wolf, M.D. Robin Giddens Sheppard, L.F.D. District 5 Medical Examiner Vice President/Funeral Director, Hardage-Giddens Funeral Home Honorable James S. Purdy, J.D. Honorable Angela B. Corey, J.D. Public Defender, Seventh Judicial Circuit State Attorney, Fourth Judicial Circuit Honorable Paul “Rick” Beseler, M.S.C.J. Wesley Heidt, J.D. Sheriff, Clay County Office of the Attorney General Kenneth T. Jones Honorable Carol Whitmore, R.N. State Registrar, Department of Health Manatee County Commissioner
Medical Examiners Commission Staff - Florida Department of Law Enforcement
Post Office Box 1489
Tallahassee, Florida 32302 (850) 410-8600 MEC Website
Chief of Policy and Special Programs Vickie Koenig Government Analyst II Doug Culbertson (850) 410-8600 (850) 410-8609 [email protected] [email protected]
Research and Training Specialist Beth McNeil Administrative Assistant Kathy Ashmore (850) 410-8608 (850) 410-8614 [email protected] [email protected]

2015 Medical Examiners Commission Interim Drug Report Page v

2015 Medical Examiners Commission Interim Drug Report Page 1
District 1 Escambia Okaloosa Santa Rosa Walton
District 2 Franklin Gadsden Leon Liberty Jefferson Taylor Wakulla
District 3 *Covered by Columbia *4 Dixie *8 Hamilton *4 Lafayette *2 Madison *2 Suwannee *2
District 4 Duval Nassau Clay
District 5 Citrus Hernando Lake Marion Sumter
District 6 Pinellas Pasco
District 7 Volusia
District 8 Alachua Baker Bradford Gilchrist Levy Union
District 9 Orange Osceola
District 10 Hardee Highlands Polk
District 11 Miami-Dade
District 12 DeSoto Manatee Sarasota
District 13 Hillsborough
District 14 Bay Calhoun Gulf Jackson Washington Holmes
District 15 Palm Beach
District 16 Monroe
District 17 Broward
Okalo
osa
Walto
n
Holmes
Bay
Jackson
Calhoun
Gulf
Leon Gadsden
Liberty
Franklin
Wakulla Taylor
Baker
Dixie
Suwannee
Citrus
Alachua Clay
St.
Joh
ns
Putnam
Marion Levy
Lake
Sum
ter
Hernando
Hillsboroug
Seminole
Orange
Polk Osceola
Manatee
Desoto
Hardee Highlands
Charlotte
Glades
Hendry
Collier
Lee
Miami-Dade
Broward
Palm Beach
Monroe
Martin
St. Lucie
Indian River
Pasco
1 14
2 3 4
23
5
7
6
13 10
9 18
12
22 21
17
11 16
24
20
8
19
15
Colu
mbia
Madison
Coverage Map Florida Medical Examiner
Districts
District 18 Brevard
District 19 Indian River Martin Okeechobee St. Lucie
District 20 Collier
District 21 Glades Hendry Lee
District 22 Charlotte
District 23 Flagler Putnam St. Johns
District 24 *Covered by Seminole *7

2015 Medical Examiners Commission Interim Drug Report Page 2
Summary of Drug Occurrences in Decedents January – June 2015
DRUG PRESENT IN BODY CAUSE PRESENT TOTAL OCCURRENCES
Am
ph
etam
ines
Amphetamine 43 136 179
Methamphetamine 63 67 130
Ben
zod
iaze
pin
es
Alprazolam 281 385 666
Chlordiazepoxide 7 44 51
Clonazepam 30 188 218
Diazepam 80 194 274
Estazolam 0 2 2
Flunitrazepam 0 1 1
Flurazepam 0 4 4
Lorazepam 18 94 112
Midazolam 5 88 93
Nordiazepam 59 263 322
Oxazepam 33 156 189
Temazepam 45 203 248
Triazolam 0 2 2
Ethanol 384 1,904 2,288
Hal
luci
no
gen
ics Phencyclidine (PCP) 0 0 0
Phenethylamines/Piperazines 4 7 11
Tryptamines 1 0 1

2015 Medical Examiners Commission Interim Drug Report Page 3
Summary of Drug Occurrences in Decedents (continued)
DRUG PRESENT IN BODY CAUSE PRESENT TOTAL OCCURRENCES
Inh
alan
ts Halogenated 22 3 25
Helium 13 0 13
Hydrocarbon 2 0 2
Nitrous Oxide 1 0 1
Op
ioid
s
Buprenorphine 8 21 29
Codeine 28 181 209
Fentanyl 289 108 397
Heroin 320 23 343
Hydrocodone 108 245 353
Hydromorphone 84 156 240
Meperidine 0 5 5
Methadone 158 81 239
Morphine 387 283 670
Oxycodone 274 251 525
Oxymorphone 47 124 171
Tramadol 57 182 239
Oth
er
Cannabinoids 2 783 785
Carisoprodol/Meprobamate 20 44 64
Cathinones 25 64 89
Cocaine 441 399 840
GHB 0 0 0
Ketamine 1 10 11
Sympathomimetic Amines 6 9 15
Synthetic Cannabinoids 3 7 10
Zolpidem 25 79 104
Note: The total occurrences for buprenorphine and cannabinoids are under reported due to the variability in analytical protocols in place at medical examiner offices. Medical examiners were asked to identify any metabolites of parent drugs. Since heroin is rapidly metabolized to morphine, this may lead to a slight over-reporting of morphine-related deaths.

2015 Medical Examiners Commission Interim Drug Report Page 4
Frequency of Occurrence of Drugs in Decedents January – June 2015
Buprenorphine, carisoprodol/meprobamate, cathinones, GHB, ketamine, meperidine, other sympathomimetic amines, synthetic cannabinoids, all tracked inhalants, and all tracked hallucinogenics individually constituted less than 1% of the drug frequencies and were not included.
Note: In many deaths, several drugs contributed to the death; thus, the count of specific drugs is greater than the number of cases.
Amphetamine 1.8%
Benzodiazepines 22.1%
Cannabinoids 7.9%
Cocaine 8.5%
Codeine 2.1%
Ethanol 23.1%
Fentanyl 4.0%
Heroin 3.5%
Hydrocodone 3.6%
Hydromorphone 2.4%
Methadone 2.4%
Methamphetamine 1.3%
Morphine 6.8%
Oxycodone 5.3%
Oxymorphone 1.7% Tramadol
2.4% Zolpidem 1.1%

2015 Medical Examiners Commission Interim Drug Report Page 5
Comparison of Drug Occurrences in Decedents
DRUG PRESENT IN BODY JANUARY-JUNE 2014 JANUARY-JUNE 2015 PERCENTAGE CHANGE
Am
ph
etam
ines
Amphetamine 133 179 34.6%
Methamphetamine 112 130 16.1%
Ben
zod
iaze
pin
es
Alprazolam 596 666 11.7%
Chlordiazepoxide 48 51 6.3%
Clonazepam 176 218 23.9%
Diazepam 277 274 -1.1%
Estazolam 0 2 *
Flunitrazepam 0 1 *
Flurazepam 6 4 *
Lorazepam 91 112 23.1%
Midazolam 83 93 12.0%
Nordiazepam 310 322 3.9%
Oxazepam 193 189 -2.1%
Temazepam 240 248 3.3%
Triazolam 0 2 *
Ethanol 2,026 2,288 12.9%
Hal
luci
no
gen
ics Phencyclidine (PCP) 0 0 *
Phenethylamines/Piperazines 7 11 *
Tryptamines 0 1 *
*Due to the small number of occurrences, percent changes were not calculated. Note: Many of the deaths were found to have several drugs contributing to the death, thus the count of specific drugs listed is greater than the number of cases.

2015 Medical Examiners Commission Interim Drug Report Page 6
Comparison of Drug Occurrences in Decedents (continued)
DRUG PRESENT IN BODY JANUARY-JUNE 2014 JANUARY-JUNE 2015 PERCENTAGE CHANGE
Inh
alan
ts Halogenated 19 25 *
Helium 11 13 *
Hydrocarbon 5 2 *
Nitrous Oxide 0 1 *
Op
ioid
s
Buprenorphine 17 29 *
Codeine 128 209 63.3%
Fentanyl 201 397 97.5%
Heroin 165 343 107.9%
Hydrocodone 353 353 0.0%
Hydromorphone 213 240 12.7%
Meperidine 5 5 *
Methadone 251 239 -4.8%
Morphine 540 670 24.1%
Oxycodone 485 525 8.2%
Oxymorphone 127 171 34.6%
Tramadol 309 239 -22.7%
Oth
er
Cannabinoids 509 785 54.2%
Carisoprodol/Meprobamate 93 64 -31.2%
Cathinones 74 89 20.3%
Cocaine 749 840 12.1%
GHB 1 0 *
Ketamine 14 11 *
Sympathomimetic Amines 12 15 *
Synthetic Cannabinoids 3 10 *
Zolpidem 116 104 -10.3%
*Due to the small number of occurrences, percent changes were not calculated. Note: Many of the deaths were found to have several drugs contributing to the death, thus the count of specific drugs listed is greater than the number of cases.

2015 Medical Examiners Commission Interim Drug Report Page 7
Drug Caused Deaths January 2014 – June 2015
Note: Not all drugs are included in the above chart.
0
50
100
150
200
250
300
350
400
450
January - June 2015 July - December 2014 January - June 2014

2015 Medical Examiners Commission Interim Drug Report Page 8
Frequency of Occurrence of Benzodiazepines January – June 2015
Estazolam, flunitrazepam, flurazepam, and triazolam individually constituted less than 1% of the benzodiazepine occurrences and were not included. Note: Several benzodiazepines (for example, diazepam) are metabolized to other benzodiazepines in the body (for example, nordiazepam, oxazepam, and temazepam). Thus, occurrences of nordiazepam, oxazepam, and temazepam may be due to the ingestion of diazepam, chlordiazepoxide, and/or temazepam.
Alprazolam 31%
Chlordiazepoxide 2%
Clonazepam 10%
Diazepam 13%
Lorazepam 5%
Midazolam 4%
Nordiazepam 15%
Oxazepam 9%
Temazepam 11%

2015 Medical Examiners Commission Interim Drug Report Page 9
Alprazolam Deaths
January – June 2015
Medical Examiner District & Area of Florida
Total Deaths with Alprazolam Deaths with Alprazolam Only Deaths with Alprazolam in
Combination with Other Drugs
District Area of Florida Total Cause Present Total Cause Present Total Cause Present
1 Pensacola 33 20 13 0 0 0 33 20 13
2 Tallahassee 6 2 4 0 0 0 6 2 4
3 Live Oak 5 1 4 0 0 0 5 1 4
4 Jacksonville 37 20 17 3 1 2 34 19 15
5 Leesburg 20 5 15 0 0 0 20 5 15
6 St. Petersburg 66 36 30 7 3 4 59 33 26
7 Daytona Beach 19 2 17 1 0 1 18 2 16
8 Gainesville 5 2 3 1 0 1 4 2 2
9 Orlando 51 17 34 4 2 2 47 15 32
10 Lakeland 39 13 26 2 0 2 37 13 24
11 Miami 81 22 59 7 1 6 74 21 53
12 Sarasota 28 15 13 2 1 1 26 14 12
13 Tampa 74 31 43 14 4 10 60 27 33
14 Panama City 11 8 3 0 0 0 11 8 3
15 West Palm Bch 38 24 14 0 0 0 38 24 14
16 Florida Keys 5 1 4 1 0 1 4 1 3
17 Ft. Lauderdale 39 28 11 2 1 1 37 27 10
18 Melbourne 31 15 16 0 0 0 31 15 16
19 Ft. Pierce 16 2 14 1 0 1 15 2 13
20 Naples 9 3 6 0 0 0 9 3 6
21 Ft. Myers 19 6 13 1 0 1 18 6 12
22 Port Charlotte 10 4 6 2 1 1 8 3 5
23 St. Augustine 9 2 7 0 0 0 9 2 7
24 Sanford 15 2 13 1 0 1 14 2 12
Statewide Totals 666 281 385 49 14 35 617 267 350

2015 Medical Examiners Commission Interim Drug Report Page 10
Alprazolam Deaths by Age January – June 2015
Medical Examiner District and Area of Florida
Alprazolam Caused Death Alprazolam Present at Death
Age of Decedent Age of Decedent
District Area of Florida Total Total <18 18-25 26-34 35-50 >50 Total <18 18-25 26-34 35-50 >50
1 Pensacola 33 20 0 0 6 9 5 13 1 4 3 4 1
2 Tallahassee 6 2 0 0 0 1 1 4 0 1 0 1 2
3 Live Oak 5 1 0 0 0 1 0 4 0 0 1 2 1
4 Jacksonville 37 20 0 2 8 4 6 17 1 1 5 2 8
5 Leesburg 20 5 0 1 0 3 1 15 0 6 2 4 3
6 St. Petersburg 66 36 0 3 6 10 17 30 2 0 4 4 20
7 Daytona Beach 19 2 0 1 0 0 1 17 0 1 1 7 8
8 Gainesville 5 2 0 0 0 1 1 3 0 1 0 0 2
9 Orlando 51 17 0 1 4 7 5 34 1 4 4 17 8
10 Lakeland 39 13 0 0 1 7 5 26 0 6 2 12 6
11 Miami 81 22 0 4 2 7 9 59 1 6 10 14 28
12 Sarasota 28 15 0 1 6 5 3 13 0 1 0 3 9
13 Tampa 74 31 0 3 5 14 9 43 1 3 4 12 23
14 Panama City 11 8 0 0 1 2 5 3 0 0 1 0 2
15 West Palm Bch 38 24 0 1 7 9 7 14 0 4 1 5 4
16 Florida Keys 5 1 0 0 0 1 0 4 0 0 1 1 2
17 Ft. Lauderdale 39 28 0 4 7 9 8 11 0 0 1 1 9
18 Melbourne 31 15 0 0 3 6 6 16 0 1 2 5 8
19 Ft. Pierce 16 2 0 0 0 1 1 14 0 2 3 7 2
20 Naples 9 3 0 0 2 1 0 6 0 0 2 1 3
21 Ft. Myers 19 6 0 0 2 2 2 13 0 0 3 7 3
22 Port Charlotte 10 4 0 1 0 1 2 6 0 0 0 3 3
23 St. Augustine 9 2 0 0 1 0 1 7 0 2 1 2 2
24 Sanford 15 2 0 0 0 0 2 13 0 1 2 5 5
Statewide Totals 666 281 0 22 61 101 97 385 7 44 53 119 162
2015 Medical Examiners Commission Interim Drug Report Page 11
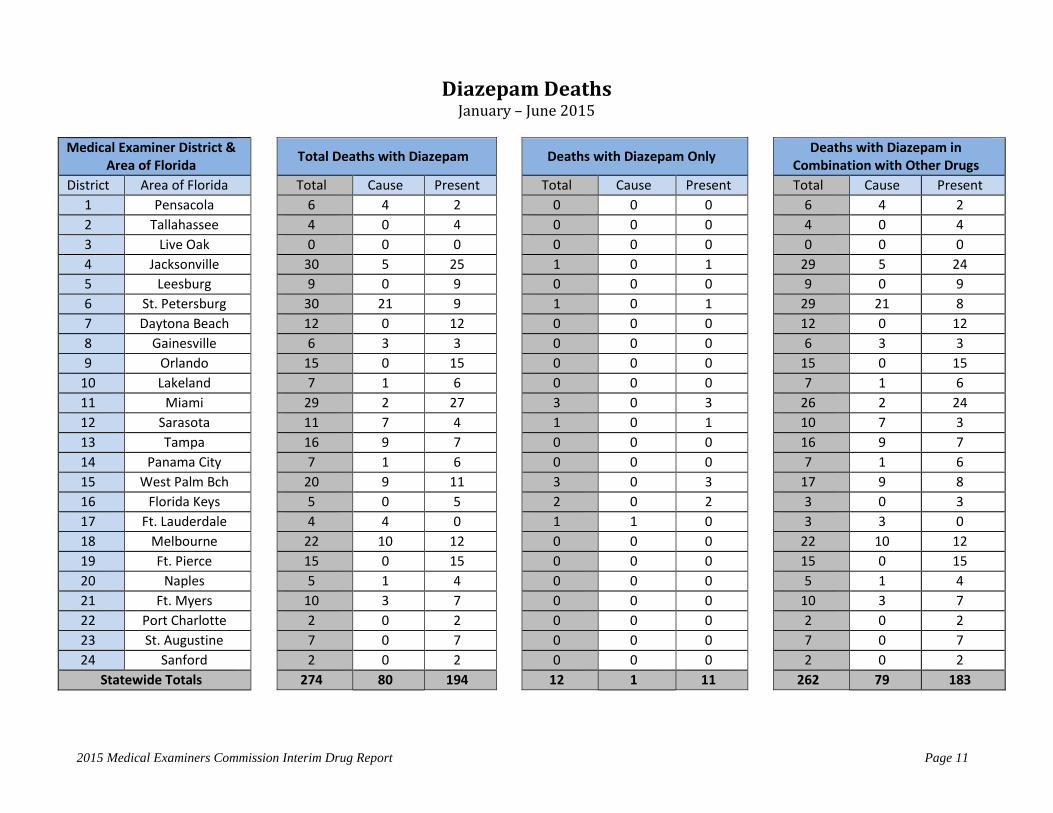
Diazepam Deaths January – June 2015
Medical Examiner District & Area of Florida
Total Deaths with Diazepam Deaths with Diazepam Only Deaths with Diazepam in
Combination with Other Drugs
District Area of Florida Total Cause Present Total Cause Present Total Cause Present
1 Pensacola 6 4 2 0 0 0 6 4 2
2 Tallahassee 4 0 4 0 0 0 4 0 4
3 Live Oak 0 0 0 0 0 0 0 0 0
4 Jacksonville 30 5 25 1 0 1 29 5 24
5 Leesburg 9 0 9 0 0 0 9 0 9
6 St. Petersburg 30 21 9 1 0 1 29 21 8
7 Daytona Beach 12 0 12 0 0 0 12 0 12
8 Gainesville 6 3 3 0 0 0 6 3 3
9 Orlando 15 0 15 0 0 0 15 0 15
10 Lakeland 7 1 6 0 0 0 7 1 6
11 Miami 29 2 27 3 0 3 26 2 24
12 Sarasota 11 7 4 1 0 1 10 7 3
13 Tampa 16 9 7 0 0 0 16 9 7
14 Panama City 7 1 6 0 0 0 7 1 6
15 West Palm Bch 20 9 11 3 0 3 17 9 8
16 Florida Keys 5 0 5 2 0 2 3 0 3
17 Ft. Lauderdale 4 4 0 1 1 0 3 3 0
18 Melbourne 22 10 12 0 0 0 22 10 12
19 Ft. Pierce 15 0 15 0 0 0 15 0 15
20 Naples 5 1 4 0 0 0 5 1 4
21 Ft. Myers 10 3 7 0 0 0 10 3 7
22 Port Charlotte 2 0 2 0 0 0 2 0 2
23 St. Augustine 7 0 7 0 0 0 7 0 7
24 Sanford 2 0 2 0 0 0 2 0 2
Statewide Totals 274 80 194 12 1 11 262 79 183
2015 Medical Examiners Commission Interim Drug Report Page 12
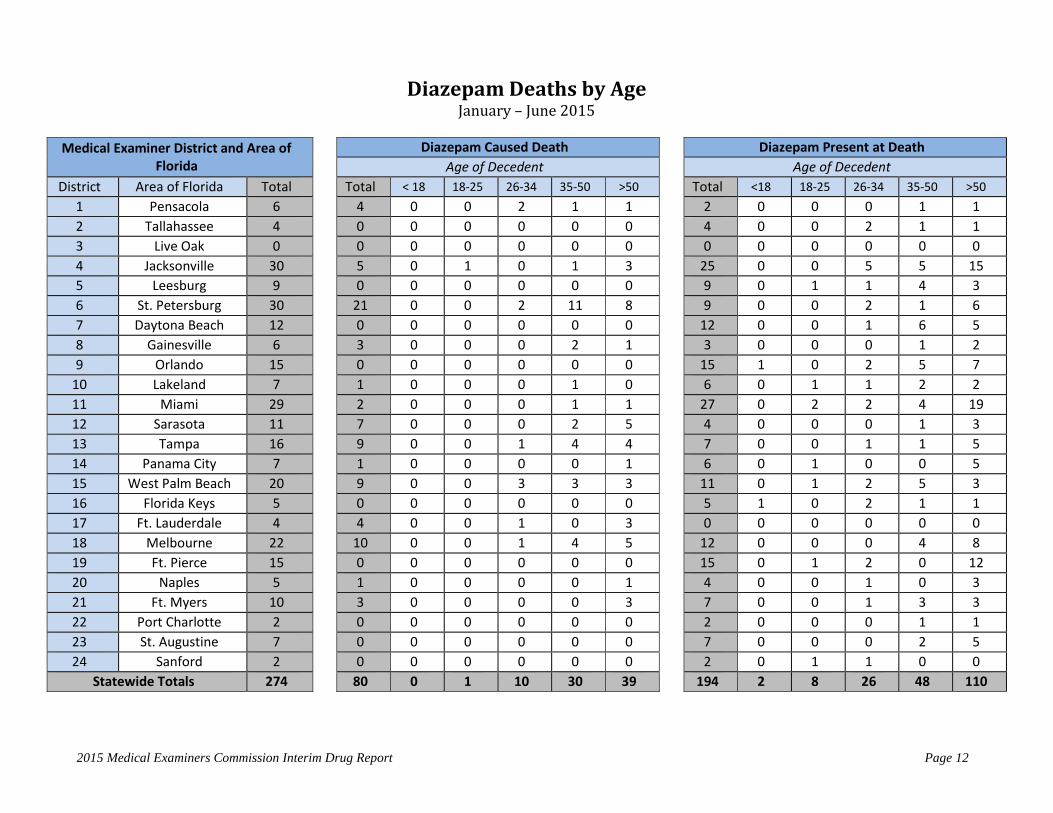
Diazepam Deaths by Age January – June 2015
Medical Examiner District and Area of Florida
Diazepam Caused Death Diazepam Present at Death
Age of Decedent Age of Decedent
District Area of Florida Total Total < 18 18-25 26-34 35-50 >50 Total <18 18-25 26-34 35-50 >50
1 Pensacola 6 4 0 0 2 1 1 2 0 0 0 1 1
2 Tallahassee 4 0 0 0 0 0 0 4 0 0 2 1 1
3 Live Oak 0 0 0 0 0 0 0 0 0 0 0 0 0
4 Jacksonville 30 5 0 1 0 1 3 25 0 0 5 5 15
5 Leesburg 9 0 0 0 0 0 0 9 0 1 1 4 3
6 St. Petersburg 30 21 0 0 2 11 8 9 0 0 2 1 6
7 Daytona Beach 12 0 0 0 0 0 0 12 0 0 1 6 5
8 Gainesville 6 3 0 0 0 2 1 3 0 0 0 1 2
9 Orlando 15 0 0 0 0 0 0 15 1 0 2 5 7
10 Lakeland 7 1 0 0 0 1 0 6 0 1 1 2 2
11 Miami 29 2 0 0 0 1 1 27 0 2 2 4 19
12 Sarasota 11 7 0 0 0 2 5 4 0 0 0 1 3
13 Tampa 16 9 0 0 1 4 4 7 0 0 1 1 5
14 Panama City 7 1 0 0 0 0 1 6 0 1 0 0 5
15 West Palm Beach 20 9 0 0 3 3 3 11 0 1 2 5 3
16 Florida Keys 5 0 0 0 0 0 0 5 1 0 2 1 1
17 Ft. Lauderdale 4 4 0 0 1 0 3 0 0 0 0 0 0
18 Melbourne 22 10 0 0 1 4 5 12 0 0 0 4 8
19 Ft. Pierce 15 0 0 0 0 0 0 15 0 1 2 0 12
20 Naples 5 1 0 0 0 0 1 4 0 0 1 0 3
21 Ft. Myers 10 3 0 0 0 0 3 7 0 0 1 3 3
22 Port Charlotte 2 0 0 0 0 0 0 2 0 0 0 1 1
23 St. Augustine 7 0 0 0 0 0 0 7 0 0 0 2 5
24 Sanford 2 0 0 0 0 0 0 2 0 1 1 0 0
Statewide Totals 274 80 0 1 10 30 39 194 2 8 26 48 110

2015 Medical Examiners Commission Interim Drug Report Page 13
Frequency of Occurrence of Opioids January – June 2015
Other category includes buprenorphine and meperidine, which individually constituted less than 1% of opioid occurrences.
Note: Oxycodone is metabolized to oxymorphone, and thus, occurrences of oxymorphone may represent oxycodone ingestion rather than oxymorphone ingestion. Heroin is metabolized to morphine, and thus, occurrences of morphine may represent heroin ingestion rather than morphine ingestion. Codeine is frequently present in heroin, and thus, codeine occurrences may represent heroin ingestion rather than codeine ingestion.
Codeine 6%
Fentanyl 12%
Heroin 10%
Hydrocodone 10%
Hydromorphone 7%
Methadone 7%
Morphine 20%
Oxycodone 15%
Oxymorphone 5%
Tramadol 7% Other 1%

2015 Medical Examiners Commission Interim Drug Report Page 14
Oxycodone Deaths January – June 2015
Medical Examiner District & Area of Florida
Total Deaths with Oxycodone Deaths with Oxycodone Only Deaths with Oxycodone in
Combination with Other Drugs
District Area of Florida Total Cause Present Total Cause Present Total Cause Present
1 Pensacola 19 13 6 3 1 2 16 12 4
2 Tallahassee 10 5 5 0 0 0 10 5 5
3 Live Oak 3 1 2 2 1 1 1 0 1
4 Jacksonville 37 19 18 4 1 3 33 18 15
5 Leesburg 19 7 12 4 1 3 15 6 9
6 St. Petersburg 56 33 23 4 2 2 52 31 21
7 Daytona Beach 15 7 8 0 0 0 15 7 8
8 Gainesville 13 9 4 3 0 3 10 9 1
9 Orlando 28 13 15 4 0 4 24 13 11
10 Lakeland 26 13 13 3 1 2 23 12 11
11 Miami 30 14 16 2 0 2 28 14 14
12 Sarasota 18 9 9 3 1 2 15 8 7
13 Tampa 38 20 18 1 0 1 37 20 17
14 Panama City 10 4 6 0 0 0 10 4 6
15 West Palm Bch 34 17 17 5 1 4 29 16 13
16 Florida Keys 6 2 4 1 0 1 5 2 3
17 Ft. Lauderdale 32 21 11 4 3 1 28 18 10
18 Melbourne 40 25 15 1 1 0 39 24 15
19 Ft. Pierce 32 20 12 1 0 1 31 20 11
20 Naples 9 5 4 0 0 0 9 5 4
21 Ft. Myers 28 11 17 3 0 3 25 11 14
22 Port Charlotte 11 1 10 0 0 0 11 1 10
23 St. Augustine 5 3 2 0 0 0 5 3 2
24 Sanford 6 2 4 0 0 0 6 2 4
Statewide Totals 525 274 251 48 13 35 477 261 216

2015 Medical Examiners Commission Interim Drug Report Page 15
Oxycodone Deaths by Age January – June 2015
Medical Examiner District and Area of Florida
Oxycodone Caused Death Oxycodone Present at Death
Age of Decedent Age of Decedent
District Area of Florida Total Total < 18 18-25 26-34 35-50 >50 Total <18 18-25 26-34 35-50 >50
1 Pensacola 19 13 0 1 2 6 4 6 0 0 3 1 2
2 Tallahassee 10 5 1 1 3 0 0 5 0 0 0 1 4
3 Live Oak 3 1 0 0 0 0 1 2 0 0 1 0 1
4 Jacksonville 37 19 0 1 6 7 5 18 0 2 2 4 10
5 Leesburg 19 7 0 0 1 3 3 12 0 1 3 3 5
6 St. Petersburg 56 33 0 1 2 11 19 23 0 1 4 4 14
7 Daytona Beach 15 7 0 1 1 2 3 8 0 0 1 4 3
8 Gainesville 13 9 0 0 2 3 4 4 0 0 0 2 2
9 Orlando 28 13 0 1 2 4 6 15 0 2 0 8 5
10 Lakeland 26 13 1 0 0 7 5 13 0 0 0 7 6
11 Miami 30 14 0 1 1 2 10 16 0 0 1 5 10
12 Sarasota 18 9 0 1 0 3 5 9 0 0 3 2 4
13 Tampa 38 20 0 1 3 6 10 18 0 3 1 3 11
14 Panama City 10 4 0 0 0 1 3 6 0 0 1 0 5
15 West Palm Bch 34 17 0 0 5 4 8 17 0 1 5 3 8
16 Florida Keys 6 2 0 0 0 2 0 4 0 0 1 0 3
17 Ft. Lauderdale 32 21 0 1 4 9 7 11 0 1 1 2 7
18 Melbourne 40 25 0 0 2 13 10 15 0 0 5 3 7
19 Ft. Pierce 32 20 0 1 1 9 9 12 0 0 1 3 8
20 Naples 9 5 0 0 1 0 4 4 0 0 2 1 1
21 Ft. Myers 28 11 0 2 3 2 4 17 1 0 1 6 9
22 Port Charlotte 11 1 0 0 0 1 0 10 0 0 0 5 5
23 St. Augustine 5 3 0 1 1 1 0 2 0 0 0 1 1
24 Sanford 6 2 1 0 0 0 1 4 0 1 1 2 0
Statewide Totals 525 274 3 14 40 96 121 251 1 12 37 70 131

2015 Medical Examiners Commission Interim Drug Report Page 16
Hydrocodone Deaths January – June 2015
Medical Examiner District & Area of Florida
Total Deaths with Hydrocodone Deaths with Hydrocodone Only Deaths with Hydrocodone in
Combination with Other Drugs
District Area of Florida Total Cause Present Total Cause Present Total Cause Present
1 Pensacola 23 11 12 3 1 2 20 10 10
2 Tallahassee 7 2 5 3 1 2 4 1 3
3 Live Oak 9 2 7 2 0 2 7 2 5
4 Jacksonville 37 8 29 3 0 3 34 8 26
5 Leesburg 15 6 9 2 0 2 13 6 7
6 St. Petersburg 34 12 22 4 1 3 30 11 19
7 Daytona Beach 20 4 16 2 0 2 18 4 14
8 Gainesville 7 3 4 3 0 3 4 3 1
9 Orlando 31 6 25 11 0 11 20 6 14
10 Lakeland 15 3 12 1 0 1 14 3 11
11 Miami 18 3 15 2 0 2 16 3 13
12 Sarasota 7 2 5 0 0 0 7 2 5
13 Tampa 27 7 20 4 0 4 23 7 16
14 Panama City 5 1 4 0 0 0 5 1 4
15 West Palm Bch 15 9 6 3 0 3 12 9 3
16 Florida Keys 3 0 3 0 0 0 3 0 3
17 Ft. Lauderdale 11 6 5 1 0 1 10 6 4
18 Melbourne 24 12 12 0 0 0 24 12 12
19 Ft. Pierce 10 4 6 2 0 2 8 4 4
20 Naples 7 2 5 2 0 2 5 2 3
21 Ft. Myers 11 2 9 3 0 3 8 2 6
22 Port Charlotte 2 0 2 0 0 0 2 0 2
23 St. Augustine 6 1 5 3 0 3 3 1 2
24 Sanford 9 2 7 0 0 0 9 2 7
Statewide Totals 353 108 245 54 3 51 299 105 194

2015 Medical Examiners Commission Interim Drug Report Page 17
Hydrocodone Deaths by Age January – June 2015
Medical Examiner District and Area of Florida
Hydrocodone Caused Death Hydrocodone Present at Death
Age of Decedent Age of Decedent
District Area of Florida Total Total < 18 18-25 26-34 35-50 >50 Total <18 18-25 26-34 35-50 >50
1 Pensacola 23 11 0 1 3 2 5 12 0 1 3 3 5
2 Tallahassee 7 2 0 0 0 1 1 5 0 0 1 3 1
3 Live Oak 9 2 0 0 0 2 0 7 0 0 1 2 4
4 Jacksonville 37 8 0 2 2 0 4 29 0 1 4 9 15
5 Leesburg 15 6 0 0 0 3 3 9 0 0 1 4 4
6 St. Petersburg 34 12 0 0 2 4 6 22 0 1 2 6 13
7 Daytona Beach 20 4 0 0 0 1 3 16 0 0 1 7 8
8 Gainesville 7 3 0 0 0 0 3 4 0 0 0 1 3
9 Orlando 31 6 0 0 1 2 3 25 0 0 1 4 20
10 Lakeland 15 3 0 0 0 0 3 12 0 0 0 6 6
11 Miami 18 3 0 0 1 0 2 15 0 0 0 5 10
12 Sarasota 7 2 0 0 0 1 1 5 0 0 1 1 3
13 Tampa 27 7 0 0 3 2 2 20 0 2 1 4 13
14 Panama City 5 1 0 0 0 1 0 4 0 0 1 0 3
15 West Palm Bch 15 9 0 0 0 3 6 6 1 0 1 3 1
16 Florida Keys 3 0 0 0 0 0 0 3 0 0 0 0 3
17 Ft. Lauderdale 11 6 0 0 0 3 3 5 0 0 0 1 4
18 Melbourne 24 12 0 0 1 7 4 12 0 1 0 4 7
19 Ft. Pierce 10 4 0 0 1 0 3 6 0 0 0 4 2
20 Naples 7 2 0 0 1 0 1 5 0 0 0 2 3
21 Ft. Myers 11 2 0 0 0 0 2 9 0 0 0 5 4
22 Port Charlotte 2 0 0 0 0 0 0 2 0 0 0 0 2
23 St. Augustine 6 1 0 0 0 0 1 5 0 0 0 0 5
24 Sanford 9 2 0 0 1 1 0 7 0 0 2 2 3
Statewide Totals 353 108 0 3 16 33 56 245 1 6 20 76 142

2015 Medical Examiners Commission Interim Drug Report Page 18
Methadone Deaths January – June 2015
Medical Examiner District & Area of Florida
Total Deaths with Methadone Deaths with Methadone Only Deaths with Methadone in
Combination with Other Drugs
District Area of Florida Total Cause Present Total Cause Present Total Cause Present
1 Pensacola 11 6 5 1 0 1 10 6 4
2 Tallahassee 2 1 1 0 0 0 2 1 1
3 Live Oak 2 1 1 0 0 0 2 1 1
4 Jacksonville 18 11 7 2 2 0 16 9 7
5 Leesburg 13 7 6 0 0 0 13 7 6
6 St. Petersburg 28 23 5 3 3 0 25 20 5
7 Daytona Beach 12 10 2 2 1 1 10 9 1
8 Gainesville 9 7 2 1 1 0 8 6 2
9 Orlando 18 12 6 2 0 2 16 12 4
10 Lakeland 10 7 3 0 0 0 10 7 3
11 Miami 6 0 6 0 0 0 6 0 6
12 Sarasota 13 8 5 1 0 1 12 8 4
13 Tampa 26 20 6 6 2 4 20 18 2
14 Panama City 5 1 4 1 0 1 4 1 3
15 West Palm Bch 10 9 1 0 0 0 10 9 1
16 Florida Keys 0 0 0 0 0 0 0 0 0
17 Ft. Lauderdale 6 4 2 1 0 1 5 4 1
18 Melbourne 12 8 4 0 0 0 12 8 4
19 Ft. Pierce 12 6 6 2 1 1 10 5 5
20 Naples 3 3 0 0 0 0 3 3 0
21 Ft. Myers 12 6 6 1 1 0 11 5 6
22 Port Charlotte 4 2 2 0 0 0 4 2 2
23 St. Augustine 2 2 0 0 0 0 2 2 0
24 Sanford 5 4 1 1 1 0 4 3 1
Statewide Totals 239 158 81 24 12 12 215 146 69

2015 Medical Examiners Commission Interim Drug Report Page 19
Methadone Deaths by Age January – June 2015
Medical Examiner District and Area of Florida
Methadone Caused Death Methadone Present at Death
Age of Decedent Age of Decedent
District Area of Florida Total Total < 18 18-25 26-34 35-50 >50 Total <18 18-25 26-34 35-50 >50
1 Pensacola 11 6 0 0 2 3 1 5 0 0 1 3 1
2 Tallahassee 2 1 0 0 0 1 0 1 0 0 0 1 0
3 Live Oak 2 1 0 0 0 1 0 1 0 0 0 1 0
4 Jacksonville 18 11 1 0 3 4 3 7 0 0 3 1 3
5 Leesburg 13 7 0 0 1 4 2 6 0 2 0 3 1
6 St. Petersburg 28 23 0 2 7 9 5 5 0 1 2 1 1
7 Daytona Beach 12 10 0 1 1 4 4 2 0 0 0 2 0
8 Gainesville 9 7 0 1 1 4 1 2 0 0 0 2 0
9 Orlando 18 12 0 1 3 5 3 6 1 0 0 1 4
10 Lakeland 10 7 0 0 1 4 2 3 0 0 0 1 2
11 Miami 6 0 0 0 0 0 0 6 0 0 0 1 5
12 Sarasota 13 8 0 0 0 4 4 5 0 0 0 3 2
13 Tampa 26 20 0 1 3 8 8 6 0 0 0 1 5
14 Panama City 5 1 0 0 0 0 1 4 0 1 0 1 2
15 West Palm Bch 10 9 0 0 0 5 4 1 0 0 0 0 1
16 Florida Keys 0 0 0 0 0 0 0 0 0 0 0 0 0
17 Ft. Lauderdale 6 4 0 0 1 1 2 2 0 0 1 1 0
18 Melbourne 12 8 0 0 1 3 4 4 0 0 0 1 3
19 Ft. Pierce 12 6 0 0 1 4 1 6 0 1 0 2 3
20 Naples 3 3 0 0 1 1 1 0 0 0 0 0 0
21 Ft. Myers 12 6 0 0 1 2 3 6 0 0 0 3 3
22 Port Charlotte 4 2 0 0 0 1 1 2 0 0 0 0 2
23 St. Augustine 2 2 0 0 0 1 1 0 0 0 0 0 0
24 Sanford 5 4 1 0 0 0 3 1 0 0 0 1 0
Statewide Totals 239 158 2 6 27 69 54 81 1 5 7 30 38

2015 Medical Examiners Commission Interim Drug Report Page 20
Morphine Deaths January – June 2015
Medical Examiner District & Area of Florida
Total Deaths with Morphine Deaths with Morphine Only Deaths with Morphine in
Combination with Other Drugs
District Area of Florida Total Cause Present Total Cause Present Total Cause Present
1 Pensacola 23 16 7 1 0 1 22 16 6
2 Tallahassee 5 1 4 1 0 1 4 1 3
3 Live Oak 3 1 2 2 1 1 1 0 1
4 Jacksonville 33 21 12 2 0 2 31 21 10
5 Leesburg 13 7 6 1 0 1 12 7 5
6 St. Petersburg 57 27 30 9 1 8 48 26 22
7 Daytona Beach 25 13 12 1 1 0 24 12 12
8 Gainesville 18 7 11 4 1 3 14 6 8
9 Orlando 81 50 31 7 1 6 74 49 25
10 Lakeland 26 7 19 5 1 4 21 6 15
11 Miami 71 40 31 2 0 2 69 40 29
12 Sarasota 54 23 31 7 2 5 47 21 26
13 Tampa 51 29 22 4 2 2 47 27 20
14 Panama City 11 3 8 2 1 1 9 2 7
15 West Palm Bch 28 19 9 3 3 0 25 16 9
16 Florida Keys 2 2 0 1 1 0 1 1 0
17 Ft. Lauderdale 40 37 3 4 3 1 36 34 2
18 Melbourne 29 22 7 0 0 0 29 22 7
19 Ft. Pierce 17 10 7 1 1 0 16 9 7
20 Naples 15 12 3 1 0 1 14 12 2
21 Ft. Myers 29 22 7 0 0 0 29 22 7
22 Port Charlotte 13 2 11 2 0 2 11 2 9
23 St. Augustine 8 5 3 1 0 1 7 5 2
24 Sanford 18 11 7 1 0 1 17 11 6
Statewide Totals 670 387 283 62 19 43 608 368 240

2015 Medical Examiners Commission Interim Drug Report Page 21
Morphine Deaths by Age January – June 2015
Medical Examiner District and Area of Florida
Morphine Caused Death Morphine Present at Death
Age of Decedent Age of Decedent
District Area of Florida Total Total < 18 18-25 26-34 35-50 >50 Total <18 18-25 26-34 35-50 >50
1 Pensacola 23 16 1 2 6 4 3 7 0 0 5 1 1
2 Tallahassee 5 1 0 0 0 0 1 4 0 0 1 0 3
3 Live Oak 3 1 0 0 0 0 1 2 0 0 0 1 1
4 Jacksonville 33 21 0 0 6 10 5 12 0 1 1 5 5
5 Leesburg 13 7 0 1 1 2 3 6 0 0 0 1 5
6 St. Petersburg 57 27 0 0 4 11 12 30 0 2 4 8 16
7 Daytona Beach 25 13 0 0 3 5 5 12 0 0 1 6 5
8 Gainesville 18 7 0 1 0 2 4 11 0 1 1 4 5
9 Orlando 81 50 0 5 13 20 12 31 1 4 3 10 13
10 Lakeland 26 7 0 0 0 3 4 19 0 1 3 5 10
11 Miami 71 40 0 8 11 15 6 31 1 0 2 5 23
12 Sarasota 54 23 0 4 9 6 4 31 1 3 9 12 6
13 Tampa 51 29 0 4 8 10 7 22 0 1 2 4 15
14 Panama City 11 3 0 0 0 0 3 8 0 0 2 1 5
15 West Palm Bch 28 19 0 0 1 8 10 9 0 1 0 4 4
16 Florida Keys 2 2 0 0 0 1 1 0 0 0 0 0 0
17 Ft. Lauderdale 40 37 0 7 6 16 8 3 0 0 1 0 2
18 Melbourne 29 22 0 0 2 12 8 7 0 1 2 1 3
19 Ft. Pierce 17 10 0 0 2 3 5 7 0 1 0 3 3
20 Naples 15 12 0 1 6 2 3 3 0 0 0 0 3
21 Ft. Myers 29 22 0 4 8 4 6 7 0 0 0 4 3
22 Port Charlotte 13 2 0 0 1 1 0 11 0 0 0 2 9
23 St. Augustine 8 5 0 2 0 2 1 3 0 0 0 1 2
24 Sanford 18 11 0 3 4 4 0 7 0 1 1 1 4
Statewide Totals 670 387 1 42 91 141 112 283 3 17 38 79 146

2015 Medical Examiners Commission Interim Drug Report Page 22
Fentanyl Deaths January – June 2015
Medical Examiner District & Area of Florida
Total Deaths with Fentanyl Deaths with Fentanyl Only Deaths with Fentanyl in
Combination with Other Drugs
District Area of Florida Total Cause Present Total Cause Present Total Cause Present
1 Pensacola 11 9 2 0 0 0 11 9 2
2 Tallahassee 5 1 4 1 0 1 4 1 3
3 Live Oak 1 1 0 0 0 0 1 1 0
4 Jacksonville 30 25 5 6 4 2 24 21 3
5 Leesburg 6 3 3 0 0 0 6 3 3
6 St. Petersburg 27 20 7 3 3 0 24 17 7
7 Daytona Beach 13 5 8 1 0 1 12 5 7
8 Gainesville 5 3 2 1 1 0 4 2 2
9 Orlando 50 26 24 5 1 4 45 25 20
10 Lakeland 4 2 2 0 0 0 4 2 2
11 Miami 37 29 8 2 1 1 35 28 7
12 Sarasota 46 42 4 5 4 1 41 38 3
13 Tampa 15 10 5 1 0 1 14 10 4
14 Panama City 3 3 0 1 1 0 2 2 0
15 West Palm Bch 36 32 4 3 3 0 33 29 4
16 Florida Keys 1 1 0 0 0 0 1 1 0
17 Ft. Lauderdale 42 41 1 6 6 0 36 35 1
18 Melbourne 22 12 10 4 2 2 18 10 8
19 Ft. Pierce 9 4 5 0 0 0 9 4 5
20 Naples 2 2 0 0 0 0 2 2 0
21 Ft. Myers 16 8 8 5 0 5 11 8 3
22 Port Charlotte 8 4 4 0 0 0 8 4 4
23 St. Augustine 1 0 1 0 0 0 1 0 1
24 Sanford 7 6 1 1 0 1 6 6 0
Statewide Totals 397 289 108 45 26 19 352 263 89

2015 Medical Examiners Commission Interim Drug Report Page 23
Fentanyl Deaths by Age January – June 2015
Medical Examiner District and Area of Florida
Fentanyl Caused Death Fentanyl Present at Death
Age of Decedent Age of Decedent
District Area of Florida Total Total < 18 18-25 26-34 35-50 >50 Total <18 18-25 26-34 35-50 >50
1 Pensacola 11 9 0 0 3 5 1 2 0 1 0 1 0
2 Tallahassee 5 1 0 0 0 0 1 4 0 0 0 1 3
3 Live Oak 1 1 0 0 0 1 0 0 0 0 0 0 0
4 Jacksonville 30 25 0 3 2 11 9 5 0 0 1 1 3
5 Leesburg 6 3 0 1 1 0 1 3 0 1 0 2 0
6 St. Petersburg 27 20 0 1 6 5 8 7 0 1 0 2 4
7 Daytona Beach 13 5 0 1 0 1 3 8 0 1 3 3 1
8 Gainesville 5 3 0 1 0 1 1 2 0 0 0 0 2
9 Orlando 50 26 0 2 7 12 5 24 1 5 3 6 9
10 Lakeland 4 2 0 0 0 1 1 2 0 0 0 1 1
11 Miami 37 29 0 2 8 15 4 8 1 1 0 1 5
12 Sarasota 46 42 1 7 15 16 3 4 0 0 0 3 1
13 Tampa 15 10 0 0 0 6 4 5 1 1 0 1 2
14 Panama City 3 3 1 1 0 0 1 0 0 0 0 0 0
15 West Palm Bch 36 32 0 4 11 13 4 4 0 0 0 1 3
16 Florida Keys 1 1 0 0 1 0 0 0 0 0 0 0 0
17 Ft. Lauderdale 42 41 0 7 12 13 9 1 0 0 1 0 0
18 Melbourne 22 12 0 1 2 6 3 10 0 1 0 5 4
19 Ft. Pierce 9 4 0 0 0 3 1 5 0 1 2 0 2
20 Naples 2 2 0 1 0 1 0 0 0 0 0 0 0
21 Ft. Myers 16 8 0 0 0 3 5 8 0 0 0 2 6
22 Port Charlotte 8 4 0 0 0 3 1 4 0 0 1 0 3
23 St. Augustine 1 0 0 0 0 0 0 1 0 0 0 0 1
24 Sanford 7 6 0 2 2 2 0 1 0 0 0 0 1
Statewide Totals 397 289 2 34 70 118 65 108 3 13 11 30 51

2015 Medical Examiners Commission Interim Drug Report Page 24
Frequency of Occurrence of Fentanyl Analogs January – June 2015
Note: While not officially tracked in 2015, several medical examiner offices voluntarily reported data for occurrences of illicit fentanyl analogs.
.
Acetyl Fentanyl 53%
Beta-hydroxythiofentanyl 37%
Butyryl Fentanyl 10%

2015 Medical Examiners Commission Interim Drug Report Page 25
Heroin Deaths January – June 2015
Medical Examiner District & Area of Florida
Total Deaths with Heroin Deaths with Heroin Only Deaths with Heroin in
Combination with Other Drugs
District Area of Florida Total Cause Present Total Cause Present Total Cause Present
1 Pensacola 13 12 1 0 0 0 13 12 1
2 Tallahassee 0 0 0 0 0 0 0 0 0
3 Live Oak 1 1 0 0 0 0 1 1 0
4 Jacksonville 18 15 3 2 2 0 16 13 3
5 Leesburg 1 1 0 0 0 0 1 1 0
6 St. Petersburg 8 7 1 0 0 0 8 7 1
7 Daytona Beach 9 9 0 0 0 0 9 9 0
8 Gainesville 2 2 0 0 0 0 2 2 0
9 Orlando 44 42 2 0 0 0 44 42 2
10 Lakeland 5 5 0 0 0 0 5 5 0
11 Miami 40 36 4 0 0 0 40 36 4
12 Sarasota 34 29 5 0 0 0 34 29 5
13 Tampa 19 17 2 0 0 0 19 17 2
14 Panama City 3 3 0 0 0 0 3 3 0
15 West Palm Bch 63 60 3 9 9 0 54 51 3
16 Florida Keys 0 0 0 0 0 0 0 0 0
17 Ft. Lauderdale 34 33 1 5 5 0 29 28 1
18 Melbourne 4 4 0 0 0 0 4 4 0
19 Ft. Pierce 1 1 0 0 0 0 1 1 0
20 Naples 9 9 0 0 0 0 9 9 0
21 Ft. Myers 22 21 1 0 0 0 22 21 1
22 Port Charlotte 2 2 0 0 0 0 2 2 0
23 St. Augustine 0 0 0 0 0 0 0 0 0
24 Sanford 11 11 0 0 0 0 11 11 0
Statewide Totals 343 320 23 16 16 0 327 304 23
2015 Medical Examiners Commission Interim Drug Report Page 26
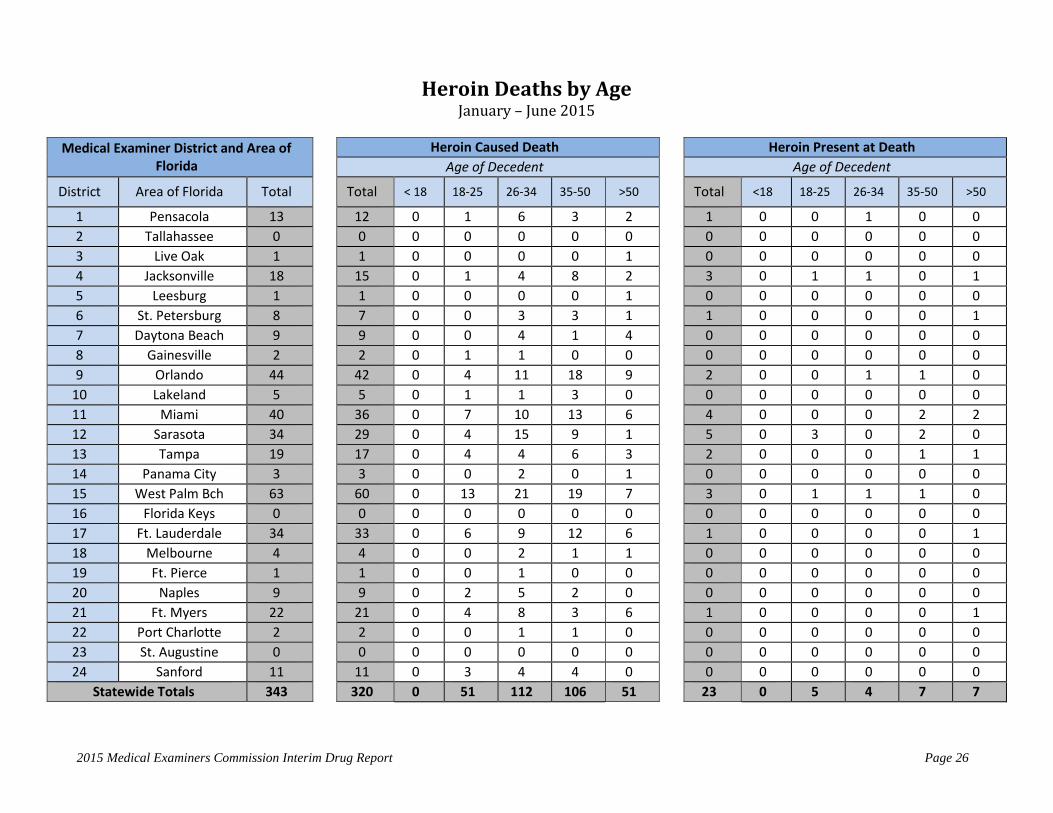
Heroin Deaths by Age January – June 2015
Medical Examiner District and Area of Florida
Heroin Caused Death Heroin Present at Death
Age of Decedent Age of Decedent
District Area of Florida Total Total < 18 18-25 26-34 35-50 >50 Total <18 18-25 26-34 35-50 >50
1 Pensacola 13 12 0 1 6 3 2 1 0 0 1 0 0
2 Tallahassee 0 0 0 0 0 0 0 0 0 0 0 0 0
3 Live Oak 1 1 0 0 0 0 1 0 0 0 0 0 0
4 Jacksonville 18 15 0 1 4 8 2 3 0 1 1 0 1
5 Leesburg 1 1 0 0 0 0 1 0 0 0 0 0 0
6 St. Petersburg 8 7 0 0 3 3 1 1 0 0 0 0 1
7 Daytona Beach 9 9 0 0 4 1 4 0 0 0 0 0 0
8 Gainesville 2 2 0 1 1 0 0 0 0 0 0 0 0
9 Orlando 44 42 0 4 11 18 9 2 0 0 1 1 0
10 Lakeland 5 5 0 1 1 3 0 0 0 0 0 0 0
11 Miami 40 36 0 7 10 13 6 4 0 0 0 2 2
12 Sarasota 34 29 0 4 15 9 1 5 0 3 0 2 0
13 Tampa 19 17 0 4 4 6 3 2 0 0 0 1 1
14 Panama City 3 3 0 0 2 0 1 0 0 0 0 0 0
15 West Palm Bch 63 60 0 13 21 19 7 3 0 1 1 1 0
16 Florida Keys 0 0 0 0 0 0 0 0 0 0 0 0 0
17 Ft. Lauderdale 34 33 0 6 9 12 6 1 0 0 0 0 1
18 Melbourne 4 4 0 0 2 1 1 0 0 0 0 0 0
19 Ft. Pierce 1 1 0 0 1 0 0 0 0 0 0 0 0
20 Naples 9 9 0 2 5 2 0 0 0 0 0 0 0
21 Ft. Myers 22 21 0 4 8 3 6 1 0 0 0 0 1
22 Port Charlotte 2 2 0 0 1 1 0 0 0 0 0 0 0
23 St. Augustine 0 0 0 0 0 0 0 0 0 0 0 0 0
24 Sanford 11 11 0 3 4 4 0 0 0 0 0 0 0
Statewide Totals 343 320 0 51 112 106 51 23 0 5 4 7 7

2015 Medical Examiners Commission Interim Drug Report Page 27
Cocaine Deaths January – June 2015
Medical Examiner District & Area of Florida
Total Deaths with Cocaine Deaths with Cocaine Only Deaths with Cocaine in
Combination with Other Drugs
District Area of Florida Total Cause Present Total Cause Present Total Cause Present
1 Pensacola 37 11 26 3 0 3 34 11 23
2 Tallahassee 9 2 7 2 1 1 7 1 6
3 Live Oak 3 1 2 1 1 0 2 0 2
4 Jacksonville 58 23 35 12 4 8 46 19 27
5 Leesburg 23 17 6 8 8 0 15 9 6
6 St. Petersburg 57 37 20 9 6 3 48 31 17
7 Daytona Beach 20 9 11 3 0 3 17 9 8
8 Gainesville 19 10 9 5 1 4 14 9 5
9 Orlando 96 59 37 16 9 7 80 50 30
10 Lakeland 13 7 6 2 2 0 11 5 6
11 Miami 117 41 76 19 9 10 98 32 66
12 Sarasota 59 44 15 5 3 2 54 41 13
13 Tampa 42 12 30 9 3 6 33 9 24
14 Panama City 9 2 7 2 1 1 7 1 6
15 West Palm Bch 71 44 27 7 6 1 64 38 26
16 Florida Keys 9 2 7 5 2 3 4 0 4
17 Ft. Lauderdale 71 55 16 11 11 0 60 44 16
18 Melbourne 46 28 18 8 4 4 38 24 14
19 Ft. Pierce 22 13 9 2 1 1 20 12 8
20 Naples 5 5 0 1 1 0 4 4 0
21 Ft. Myers 37 9 28 2 0 2 35 9 26
22 Port Charlotte 6 2 4 0 0 0 6 2 4
23 St. Augustine 2 1 1 1 0 1 1 1 0
24 Sanford 9 7 2 2 2 0 7 5 2
Statewide Totals 840 441 399 135 75 60 705 366 339
2015 Medical Examiners Commission Interim Drug Report Page 28
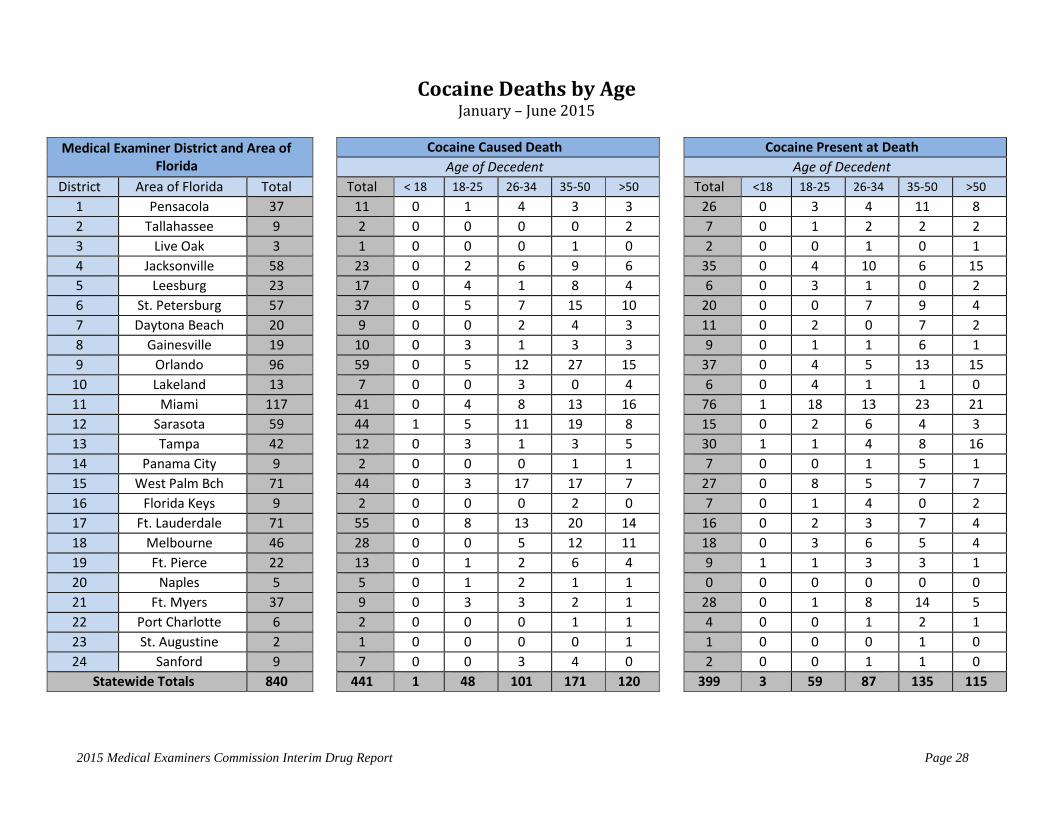
Cocaine Deaths by Age January – June 2015
Medical Examiner District and Area of Florida
Cocaine Caused Death Cocaine Present at Death
Age of Decedent Age of Decedent
District Area of Florida Total Total < 18 18-25 26-34 35-50 >50 Total <18 18-25 26-34 35-50 >50
1 Pensacola 37 11 0 1 4 3 3 26 0 3 4 11 8
2 Tallahassee 9 2 0 0 0 0 2 7 0 1 2 2 2
3 Live Oak 3 1 0 0 0 1 0 2 0 0 1 0 1
4 Jacksonville 58 23 0 2 6 9 6 35 0 4 10 6 15
5 Leesburg 23 17 0 4 1 8 4 6 0 3 1 0 2
6 St. Petersburg 57 37 0 5 7 15 10 20 0 0 7 9 4
7 Daytona Beach 20 9 0 0 2 4 3 11 0 2 0 7 2
8 Gainesville 19 10 0 3 1 3 3 9 0 1 1 6 1
9 Orlando 96 59 0 5 12 27 15 37 0 4 5 13 15
10 Lakeland 13 7 0 0 3 0 4 6 0 4 1 1 0
11 Miami 117 41 0 4 8 13 16 76 1 18 13 23 21
12 Sarasota 59 44 1 5 11 19 8 15 0 2 6 4 3
13 Tampa 42 12 0 3 1 3 5 30 1 1 4 8 16
14 Panama City 9 2 0 0 0 1 1 7 0 0 1 5 1
15 West Palm Bch 71 44 0 3 17 17 7 27 0 8 5 7 7
16 Florida Keys 9 2 0 0 0 2 0 7 0 1 4 0 2
17 Ft. Lauderdale 71 55 0 8 13 20 14 16 0 2 3 7 4
18 Melbourne 46 28 0 0 5 12 11 18 0 3 6 5 4
19 Ft. Pierce 22 13 0 1 2 6 4 9 1 1 3 3 1
20 Naples 5 5 0 1 2 1 1 0 0 0 0 0 0
21 Ft. Myers 37 9 0 3 3 2 1 28 0 1 8 14 5
22 Port Charlotte 6 2 0 0 0 1 1 4 0 0 1 2 1
23 St. Augustine 2 1 0 0 0 0 1 1 0 0 0 1 0
24 Sanford 9 7 0 0 3 4 0 2 0 0 1 1 0
Statewide Totals 840 441 1 48 101 171 120 399 3 59 87 135 115

2015 Medical Examiners Commission Interim Drug Report Page 29
Drug Detected at Death: Cause vs. Present
Cause 29%
Present 71%
Diazepam
Cause 42%
Present 58%
Alprazolam
Cause 52%
Present 48%
Oxycodone

2015 Medical Examiners Commission Interim Drug Report Page 30
Drug Detected at Death: Cause vs. Present
Cause 31%
Present 69%
Hydrocodone
Cause 66%
Present 34%
Methadone
Cause 58%
Present 42%
Morphine

2015 Medical Examiners Commission Interim Drug Report Page 31
Drug Detected at Death: Cause vs. Present
Cause 73%
Present 27%
Fentanyl
Cause 93%
Present 7%
Heroin
Cause 52%
Present 48%
Cocaine

2015 Medical Examiners Commission Interim Drug Report Page 32
Manner of Death for Cases Reported (Accident, Homicide, Natural, Suicide, or Undetermined)
Accident 60%
Homicide 3% Natural
11%
Suicide 25% Undetermined
1%
Alprazolam
Accident 54%
Homicide 3%
Natural 17%
Suicide 25%
Undetermined 1%
Diazepam
Accident 59%
Homicide 3%
Natural 17%
Suicide 19%
Undetermined 2%
Oxycodone

2015 Medical Examiners Commission Interim Drug Report Page 33
Manner of Death for Cases Reported (Accident, Homicide, Natural, Suicide, or Undetermined)
Accident 41%
Homicide 2%
Natural 22%
Suicide 33%
Undetermined 2%
Hydrocodone
Accident 72%
Homicide 1% Natural
13%
Suicide 12%
Undetermined 2%
Methadone
Accident 72%
Homicide 2% Natural
13%
Suicide 11%
Undetermined 2%
Morphine

2015 Medical Examiners Commission Interim Drug Report Page 34
Manner of Death for Cases Reported (Accident, Homicide, Natural, Suicide, or Undetermined)
Accident 81%
Homicide 2%
Natural 6% Suicide
10%
Undetermined 1%
Fentanyl
Accident 94%
Natural 2%
Suicide 3% Undetermined
1%
Heroin
Note: No heroin deaths classified as homicides.
Accident 70%
Homicide 10%
Natural 8%
Suicide 11%
Undetermined 1%
Cocaine

2015 Medical Examiners Commission Interim Drug Report Page 35
Glossary
Amphetamines – A group of synthetic psychoactive drugs called central nervous system (CNS) stimulants. The collective group of amphetamines includes amphetamine, dextroamphetamine, and methamphetamine. Methamphetamine is also known as “meth,” “crank,” “speed,” and “tina.” Methamphetamine is metabolized to amphetamine, and thus, occurrences of amphetamine may represent methamphetamine ingestion rather than amphetamine ingestion.
Benzodiazepines – A family of sedative-hypnotic drugs indicated for the treatment of stress, anxiety, seizures, and alcohol withdrawal. Benzodiazepines are often referred to as “minor tranquilizers.” Xanax (alprazolam) and Valium (diazepam) are the most commonly prescribed drugs in this drug class. Many benzodiazepines are interconverted to one another, making occurrences of these drugs difficult to interpret. Exceptions include alprazolam, clonazepam, lorazepam, and midazolam.
Buprenorphine – A semi-synthetic opioid known as Buprenex, Suboxone, and Subutex indicated for the treatment of opioid addiction and moderate to severe pain.
Cannabinoids – A series of compounds found in the marijuana plant, the most psychoactive of which is THC, a strong, illicit hallucinogen. Street names for this drug are often associated with a geographic area from which it came but also include generic names like “ganja,” “MJ,” “ragweed,” “reefer,” and “grass.”
Carisoprodol – Muscle relaxant indicated for the treatment of pain, muscle spasms, and limited mobility. It is often abused in conjunction with analgesics for enhanced euphoric effect. It is marketed as Soma.
Cathinones – A family of drugs containing one or more synthetic chemicals related to cathinone, an amphetamine-like stimulant found naturally in the Khat plant. They are 'cousins' of the amphetamine family of drugs, which includes amphetamine, methamphetamine, and MDMA (ecstasy). It often goes by the street name of “Molly.”
Cocaine – An illicit stimulant. Powdered cocaine goes by many street names including “C,” “blow,” “snow,” and “nose candy,” while freebase cocaine is mostly commonly known as “crack.”
Ethanol – Ethyl alcohol.
Fentanyl – Synthetic opioid analgesic supplied in transdermal patches and also available for oral, nasal, intravenous, and spinal administration. Fentanyl is also produced illicitly, and currently many fentanyl occurrences represent the ingestion of illicit fentanyl rather than pharmaceutically-manufactured fentanyl.

2015 Medical Examiners Commission Interim Drug Report Page 36
Glossary (Continued)
Flunitrazepam (Rohypnol) – Commonly referred to as a “date rape” drug. It is a sedative-hypnotic drug in the benzodiazepine class. It often goes by the street name “roofies.”
Gamma-Hydroxybutyric Acid (GHB) – A depressant, also known as a “date rape” drug. GHB often goes by the street name “easy lay,” “scoop,” “liquid X,” “Georgia home boy,” and “grievous bodily harm.”
Hallucinogenic Phenethylamines/Piperazines – Includes such drugs as MDMA (Ecstasy, a hallucinogen), MDA (a psychedelic), MDEA (a psychedelic hallucinogenic), and piperazine derivatives. Ecstasy has multiple street names including “E,” “XTC,” “love drug,” and “clarity.” MDMA is often also known by a large variety of embossed logos on the pills such as “Mitsubishis” and “Killer Bees.”
Hallucinogenic Tryptamines – Natural tryptamines are commonly available in preparations of dried or brewed mushrooms, while tryptamine derivatives are sold in capsule, tablet, powder, or liquid forms. Street names include “Foxy-Methoxy,” “alpha-O,” and “5-MEO.”
Halogenated Inhalants – Includes, but are not limited to, halogenated hydrocarbons, such as Freon, and similar halogenated substances typically used illicitly as inhalants.
Heroin – An illicit narcotic derivative. It is a semi-synthetic product of opium. Heroin also has multiple street names including “H,” “hombre,” and “smack.”
Hydrocarbon Inhalants – Includes toluene, benzene, components of gasoline, and other similar hydrocarbons typically used illicitly as inhalants.
Hydrocodone – A narcotic analgesic (pain killer). Vicodin and Lortab are two common drugs containing hydrocodone.
Hydromorphone – A narcotic analgesic (pain killer) used to treat moderate to severe pain. Marketed under the trade name Dilaudid, it is two to eight times more potent than morphine. Commonly used by abusers as a substitute for heroin.
Ketamine – An animal tranquilizer and a chemical relative of PCP. Street names for this drug include “special K,” “vitamin K,” and “cat valium.”
Meperidine – A synthetic narcotic analgesic (pain killer) sold under the trade name Demerol, it is used for pre-anesthesia and the relief of moderate to severe pain.
Methadone – A synthetic narcotic analgesic (pain killer) commonly associated with heroin detoxification and maintenance programs but it is also prescribed to treat severe pain. It has been increasingly prescribed in place of oxycodone for pain management. Dolophine is one form of methadone.

2015 Medical Examiners Commission Interim Drug Report Page 37
Glossary (Continued)
Morphine – A narcotic analgesic (pain killer) used to treat moderate to severe pain. MS (Morphine Sulfate), Kadian, and MS-Contin are the tablet forms; Roxanol is the liquid form. Heroin is metabolized to morphine, and thus, occurrences of morphine may represent heroin ingestion rather than morphine ingestion.
Nitrous Oxide (N2O) – Also known as "laughing gas," this is an inhalant (gas) that produces light anesthesia and analgesia. “Whippets” are a common form of nitrous oxide.
Oxycodone – A narcotic analgesic (pain killer). OxyContin is one form of this drug and goes by the street name “OC.” Percocet, Percodan, Roxicet, Tylox, and Roxicodone also contain oxycodone.
Oxymorphone – A narcotic analgesic (pain killer) that is often prescribed as Opana, Numorphan, and Numorphone.
Phencyclidine (PCP) – An illicit, dissociative anesthetic/hallucinogen. Common street names for this drug include “angel dust,” “ace,” “DOA,” and “wack.”
Sympathomimetic Amines – A group of stimulants including phentermine (an appetite suppressant) and other sympathomimetic amines not tracked elsewhere in this report.
Synthetic Cannabinoids – Synthetic cannabinoids are man-made chemicals that are applied (often sprayed) onto plant material to mimic the effect of delta-9-tetrahydrocannabinol (THC), the psychoactive ingredient in the naturally grown marijuana plant (cannabis sativa). Synthetic cannabinoids, commonly known as “synthetic marijuana,” “Spice,” or “K2,” are often sold in retail outlets as “herbal incense” or “potpourri” and are labeled “not for human consumption.”
Tramadol – A synthetic narcotic analgesic sold under the trade name Ultram and Ultracet. Indications include the treatment of moderate to severe pain. It is a chemical analogue to codeine. Not currently a scheduled drug.
Zolpidem – A prescription medication used for the short-term treatment of insomnia; it is commonly known as Ambien.