florida department of education (fdoe) k-12 public schools
TRANSCRIPT

1
Florida Department of Education (FDOE) K-12 Public Schools
Bureau of Exceptional Education and Student Services (BEESS)
State Advisory Committee for the Education of Exceptional Students (SAC)
Double Tree Hotel
Tallahassee, Florida July 13-14, 2015
Meeting Report
MONDAY, July 13, 2015 The SAC met in regular session with the following persons in attendance: Members (See SAC Membership List 2015, SAC Designee List and SAC Representation Chart, SAC Member Notebook, Tab 2) Barry, Keith Blades, Laurie Cheeseborough, Thea Clay, Sonja Colthorp, Amy Escallon, Enrique Halpert, Mark Jones, Cindy LaBelle, Rich Linley-Harris, Nancy Lopez-Sequenzia, Sarah Mantell, Michelle Miller, Lisa Phillips, Donna Rankin, Tom Roberts, Grace Roth, Terry Rudniski, Catherine Siegel, Ann Stevens, Tracy Tucker, Kara Verra-Tirado, Monica Designees Smith, Courtney (for Johana Hatcher)

2
Hall, Kirk (for Roxana Beardall) Rumph, Laura (for Kelly Rogers) Russell, Cathy (for Laura Harrison) FDOE/DPS/BEESS Representatives Verra-Tirado, Monica, Bureau Chief, BEESS Bishop, Cathy, senior educational program director, BEESS Garrett, Frankie, BEESS Milton, Tonya, program planner/analyst (SAC Liaison), BEESS Katine, April, educational program director (SAC Liaison), BEESS Mallini, Aimee, parent services (SAC Liaison), BEESS Diamond, Heather, coordinator of student services project, University of South Florida
(USF) Metcalf, Heidi, senior educational program director, BEESS Epps, Laurie, Specific Learning Disability, BEESS Brattain, Jessica, Intellectual Disabilities, BEESS Willis-Doxsee, Heather, exceptional student education (ESE) reading specialist, Just
Read Florida/BEESS Guests Margaret Hooper, public policy coordinator, Florida Developmental Disabilities Council Claudia Roberts, parent Skip Forsyth, Homeless Education, Department of Education Aleisa McKinlay, director, Division of Vocational Rehabilitation (VR) Amber Brundage, PK-12 alignment coordinator, Florida PS/RtI Project Beth Hardcastle, regional coordinator, Florida PS/RtI Project Tury Lewis, Region 1 representative, Project 10 Welcome and Introductions, Overview of Agenda and Meeting Materials Roles and Responsibilities/Way of Work Thea Cheeseborough, committee co-chair, welcomed everyone and reviewed the agenda and meeting materials with the committee. April Katine, SAC liaison, reviewed the Way of Work and Roles and Responsibilities with the committee. (See SAC Member Notebook, Agenda, Tab 1; Individuals with Disabilities Education Act [IDEA] SAC Way of Work and Ground Rules and Roles and Responsibilities; SAC Membership List 2014; Open Meetings Law, Tab 2; Meeting Report, Committee Interest Form; Committee Action Form, Tab 10) Workforce Innovations Opportunity Act (WIOA) Aleisa McKinlay, director of the VR shared information about the changes to WIOA that will benefit students with disabilities (SWD) throughout the state. WIOA Requirements
• 15% of the federal allocation set aside for VR services to youth in high school • 50% of the Supported Employment Fund must be used for transition aged youth

3
o 75% of Workforce funds (not VR) for transition aged youth be applied to those out of school
• Emphasis on STEM (i.e., science, technology, engineering and math) exploration WIOA requires VR to use 15% of the annual federal VR allocation to serve youth
• Youth have to be in high school • Specific services are required under WIOA • WIOA describes services for youth in high school as Pre-Employment Transition
Services • Services include current VR services of Career Counseling, Work Readiness and
Work Experience What does this mean for VR? To meet WIOA requirements
• Counselors will begin taking applications at age 15 and beyond for youth in high school
• VR will consistently provide Pre-Employment Transition Services to students in high school
• Pre-Employment Transition Services for youth in high school may be delivered without an Individual Plan for Employment (IPE)
• VR will expand the use of effective transition programs and develop additional services
Vocational Rehabilitation
• 6 service areas • 89 service sites • 12 co-located w/CareerSource centers • 931 staff
Who Do We Serve?
• Chronic medical, 10% • Developmental disabilities,15% • Learning disabilities, 1% • Mental health, 54% • Orthopedic, 12% • Sensory, 7% • Substance abuse, 1%
March 2015 Transition Snapshot Transition Age Youth Cases (16-21)—14,902 Total Caseload—37,664 Preparing for WIOA
• Statewide Transition Training and Supervisors Training • Area Supervisor and Service Fee Code Calls/Updates • VR Provider Training

4
• ESE Directors Call, VISIONS, FACTE, and Family Café • Revisions to the Third Party Cooperative Arrangements (TPCA) and Project
SEARCH • Contracts Revised for Youth in High School
WIOA Pre-Employment Transition Services
• Career Counseling • Workplace Readiness Training • Community-Based Work Experiences • Self-Advocacy Instruction and Peer Mentoring • Postsecondary Educational (PSE) Counseling
Not countable for in-school youth:
• PSE and Training • Placement Services and Supported Employment Services
Current VR Services Meeting WIOA Requirements Career Counseling
• Aptitude and Interest Assessments • Comprehensive and Situational Evaluations • Discovery 1 and 2 • Supported Employment Individual Career Plan
Workplace Readiness Training
• Pre-Placement Training • Miscellaneous Training (e.g., Career Exploration)
Community-Based Work Experience
• On-the-Job Training (OJT) Services • Community Based Work Experiences (e.g., TPCA)
Core Services and Supports for All Youth in High School
• Career Assessment • Vocational Counseling • Pre-Placement Training (Work Readiness) • Work Experiences (OJT)
Intensive Services and Supports for Youth in High School
• Discovery • PSE Programs* • Third Party Cooperative Arrangements • Project SEARCH
* Programs for youth in high school with intellectual or other developmental disabilities served under FAPE as required by IDEA.
5
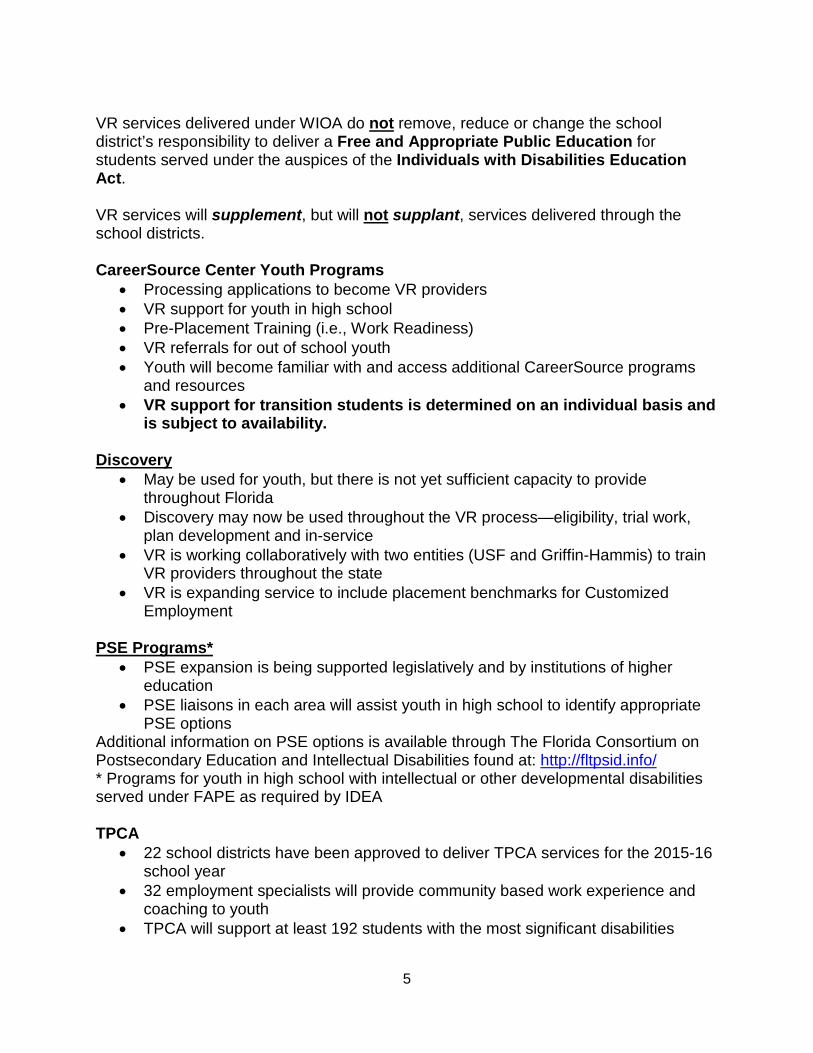
VR services delivered under WIOA do not remove, reduce or change the school district’s responsibility to deliver a Free and Appropriate Public Education for students served under the auspices of the Individuals with Disabilities Education Act. VR services will supplement, but will not supplant, services delivered through the school districts. CareerSource Center Youth Programs
• Processing applications to become VR providers • VR support for youth in high school • Pre-Placement Training (i.e., Work Readiness) • VR referrals for out of school youth • Youth will become familiar with and access additional CareerSource programs
and resources • VR support for transition students is determined on an individual basis and
is subject to availability. Discovery
• May be used for youth, but there is not yet sufficient capacity to provide throughout Florida
• Discovery may now be used throughout the VR process—eligibility, trial work, plan development and in-service
• VR is working collaboratively with two entities (USF and Griffin-Hammis) to train VR providers throughout the state
• VR is expanding service to include placement benchmarks for Customized Employment
PSE Programs*
• PSE expansion is being supported legislatively and by institutions of higher education
• PSE liaisons in each area will assist youth in high school to identify appropriate PSE options
Additional information on PSE options is available through The Florida Consortium on Postsecondary Education and Intellectual Disabilities found at: http://fltpsid.info/ * Programs for youth in high school with intellectual or other developmental disabilities served under FAPE as required by IDEA TPCA
• 22 school districts have been approved to deliver TPCA services for the 2015-16 school year
• 32 employment specialists will provide community based work experience and coaching to youth
• TPCA will support at least 192 students with the most significant disabilities

6
• Students are then able to transition directly into VR Supported Employment (SE) services
Project SEARCH
• 168 youth were served in 21 sites, including hospitals, hotels, government and even a zoo
• 122 youth were employed upon completing the program (72%) • 11 providers delivered hands-on training and coaching • 11 school districts provided on-site academic instruction • Florida has 6 sites with 100% placement and 16 sites with over 60% placement
rate Pre-Placement Training
• Takes place when school is not in session • May be done prior to or in conjunction with OJT • Support services will be provided when needed to participate in Pre-Placement
Training • Transportation • Assistive services or devices
o Is available to youth in high school that have a Regular or Supported Employment IPE
o Requires 20 hours of training be completed for reimbursement (20 additional hours if needed)
o Referral does not have to be accompanied by an Employment or Supported Employment Services referral
o Courses should be limited to 10-12 participants per instructor o Training is structured, formal and interactive with a 30-minute break for
lunch required after 4 hours o Required documentation includes a survey and report o Report will provide some indication of performance throughout the training o Reported performance will provide information counselors use when
determining if an additional 20 hours are needed o Reports will also help counselors to identify needs for postsecondary
training or education Required Curriculum
• Both lecture and hands-on activity • Resume writing and development • Finding and completing job applications online • Interviewing skills and employer contacts • Personal interactions and handling conflict • Navigating the community
Individualized Curriculum Curriculum should be flexible to allow time for:

7
• Topics based on customer need • Topics identified on the referral and through
o Discussion with the customer o The VR counselor o Other support systems
Examples include instruction on: • Grooming, punctuality, attendance, etc. • Payroll deductions, insurance benefits, safety, etc.
Provider Partnership
• Staff will work closely with the local VR providers to identify: o Students who will need training o Providers delivering training (options for customers) o Students’ availability during specific time periods
• VR staff will encourage providers to consider: o Separate morning and afternoon courses o Partnering with local community colleges when additional facilities are
needed o Delivering multiple Pre-Placement Training courses over the summer
months OJT
• For customers with a regular or SE IPE • Does not have to align with the IPE vocational goal • May be done in conjunction with Pre-Placement Training
o Counselors will use OJT to identify and address transportation and assistive technology needs
• Support services (transportation and assistive services or devices) will be provided when needed to participate in OJT
o Focus for youth in high school is on the acquisition of work behaviors, career exploration, and exposure to employers
o OJT will be in community/public work sites and fully integrated o OJT will average 4 to 6 weeks and should take place on multiple days
each week o Takes place when school is not in session
• Is used to develop needed work behaviors • Is not used as training for a specific job • May be paid or unpaid • May be used to explore specific work settings and obtain exposure to various
career fields If the OJT is paid:
• The provider has the option of acting as the “Employer of Record” and signing as the employer on all VR forms
• The worksite or business representative is not required to complete any VR forms
8
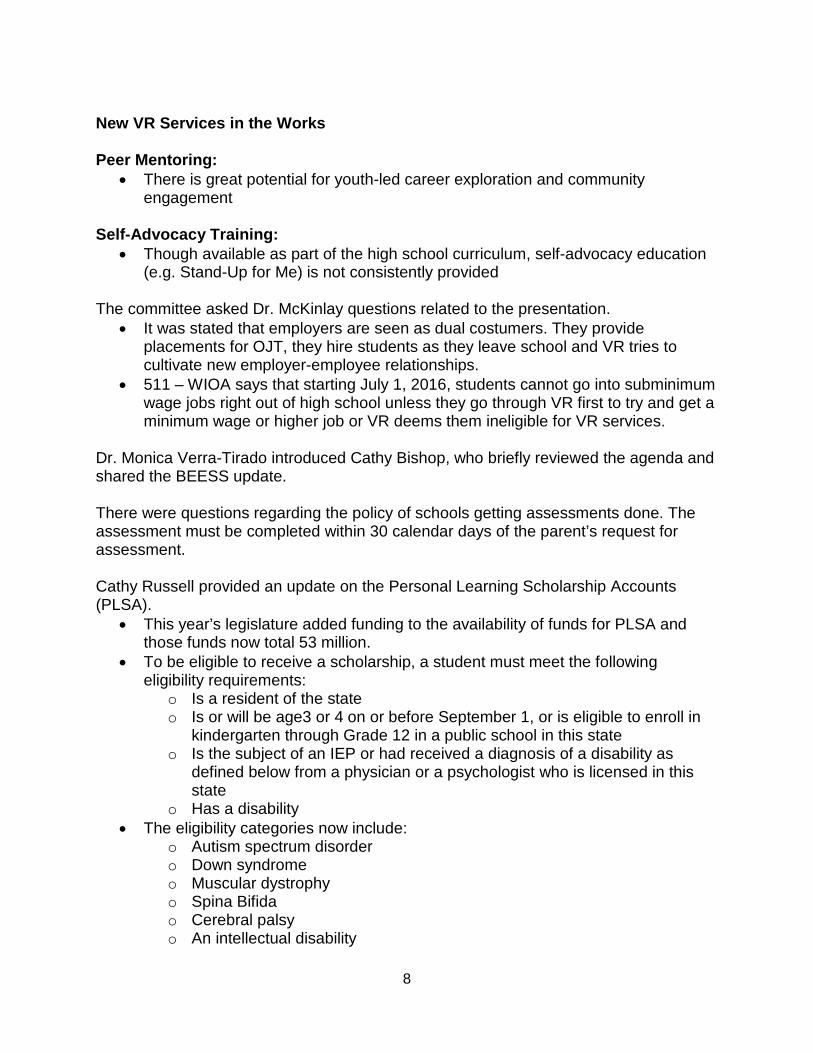
New VR Services in the Works Peer Mentoring:
• There is great potential for youth-led career exploration and community engagement
Self-Advocacy Training:
• Though available as part of the high school curriculum, self-advocacy education (e.g. Stand-Up for Me) is not consistently provided
The committee asked Dr. McKinlay questions related to the presentation.
• It was stated that employers are seen as dual costumers. They provide placements for OJT, they hire students as they leave school and VR tries to cultivate new employer-employee relationships.
• 511 – WIOA says that starting July 1, 2016, students cannot go into subminimum wage jobs right out of high school unless they go through VR first to try and get a minimum wage or higher job or VR deems them ineligible for VR services.
Dr. Monica Verra-Tirado introduced Cathy Bishop, who briefly reviewed the agenda and shared the BEESS update. There were questions regarding the policy of schools getting assessments done. The assessment must be completed within 30 calendar days of the parent’s request for assessment. Cathy Russell provided an update on the Personal Learning Scholarship Accounts (PLSA).
• This year’s legislature added funding to the availability of funds for PLSA and those funds now total 53 million.
• To be eligible to receive a scholarship, a student must meet the following eligibility requirements:
o Is a resident of the state o Is or will be age3 or 4 on or before September 1, or is eligible to enroll in
kindergarten through Grade 12 in a public school in this state o Is the subject of an IEP or had received a diagnosis of a disability as
defined below from a physician or a psychologist who is licensed in this state
o Has a disability • The eligibility categories now include:
o Autism spectrum disorder o Down syndrome o Muscular dystrophy o Spina Bifida o Cerebral palsy o An intellectual disability

9
o Prader-Willi syndrome o Williams syndrome o A student in kindergarten, being a high-risk child, as defined in section
393.063(20)(a), Florida Statutes • The eligible expenses now include:
o Instructional materials o Specialized services by approved providers o Full-time tutoring program o Testing/assessment fees o Contracted services through districts o Curriculum o Tuition in an eligible private school o Virtual program from approved provider o Florida prepaid o Part-time tutoring from eligible provider
Amber Brundage from the Florida PS/RtI Project presented on Early Warning Systems (EWS) in the middle grades related to SWD. Florida’s graduation rate falls in the 70-79% range, which is the middle level compared to the country. What will it take to get us to the 90% range? Five Key Drivers to get to our 2020 goal.
• Closing the opportunity gap for low socioeconomic students • Solving the Big City Challenge • Focusing on Special Education Students • California Counts • Accelerating graduation rates for young men of color
Context for EWS
• In order for students to graduate career, college, and life ready they must: o Successfully navigate academic transitions o Acquire academic enabling behaviors
Attend Behave Complete work
• 50% of future non-graduates readily identifiable as early as sixth grade (Balfanz, Herzog & Mac Iver, 2007)
o EWS provide a mechanism for early identification of those students who signal they are not on-track for on-time graduation (Balfanz & Stenson, 2012)
o Supported by America’s Promise Alliance o My Brother’s Keeper Initiative
The “Promise of Early Warning Systems”

10
• EWS: o Use readily available data typically collected at the school-level o Allow educators to hone-in on key pieces of data to inform decisions o Provide “real-time” data for monitoring o Allow districts to identify patterns, trends and school effectiveness at
keeping students on-track o Identify at-risk students who are likely to experience adverse outcomes
early enough to alter student trajectories (Davis, Herzog, & Legters, 2013) Early Warning Indicators versus EWS
• Early Warning Indicators o Individual predictors and thresholds utilized to indicate student level of risk
or likelihood of a given outcome: Missing more than 10% of instructional time 1+ ISS/OSS Course performance
• EWS o Organized system where:
Struggling learners or students at-risk are identified Interventions are provided- matched to student need with varying
intensity levels Individual and aggregate-level progress is monitored
Infrastructure Necessary to Effectively Utilize EWS
• Development of user-friendly/efficient data system • High quality and accurate data entry • Designated EWS teams with dedicated meeting time
o District o School
• Staff professional development/support for analysis of data • Resource allocation • Multi-tiered system of supports (MTSS) framework • Data-based problem-solving (PS)
History and Research on EWS Middle School EWS Background
• Researchers followed a Philadelphia cohort of almost 13,000 sixth graders for eight years to find middle school predictors of non-graduates (Balfanz, Herzog, & MacIver, 2007)
• Based on two-pronged test—75+% of sixth graders with indicator did not graduate on time AND identified substantial number of future non-graduates:
o Failure of math or English o 20+% absences o one out of school suspension or failing behavior grade
11
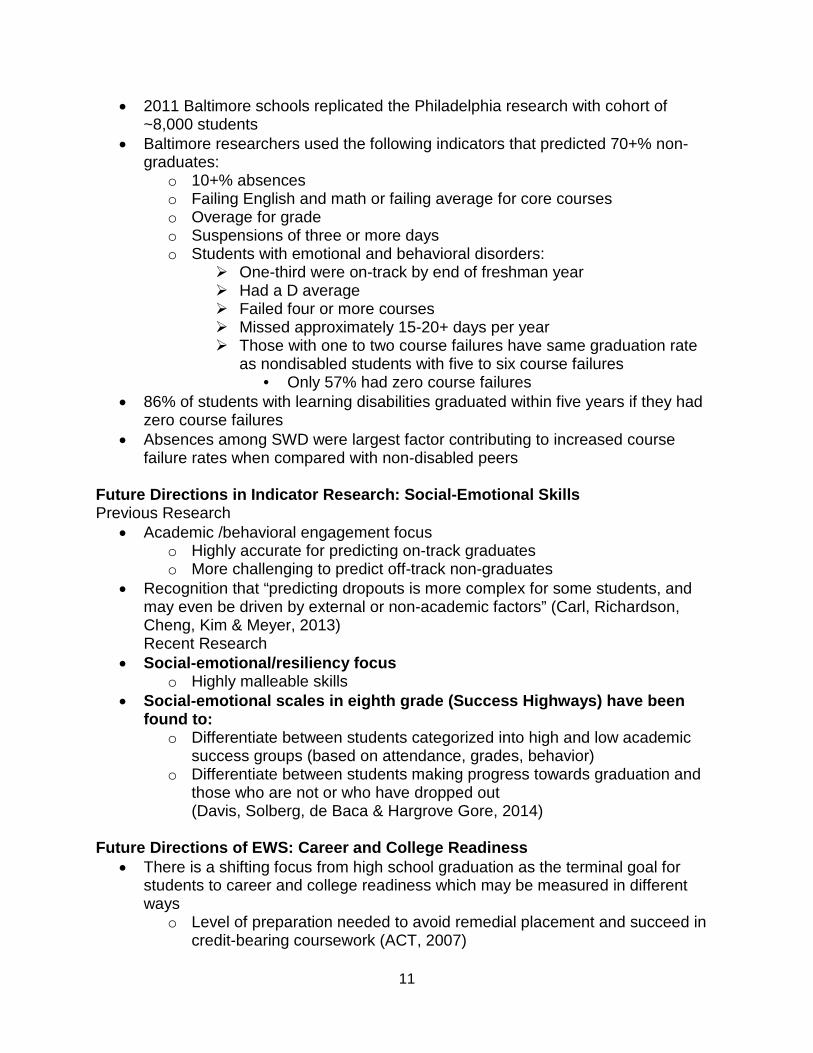
• 2011 Baltimore schools replicated the Philadelphia research with cohort of ~8,000 students
• Baltimore researchers used the following indicators that predicted 70+% non-graduates:
o 10+% absences o Failing English and math or failing average for core courses o Overage for grade o Suspensions of three or more days o Students with emotional and behavioral disorders:
One-third were on-track by end of freshman year Had a D average Failed four or more courses Missed approximately 15-20+ days per year Those with one to two course failures have same graduation rate
as nondisabled students with five to six course failures • Only 57% had zero course failures
• 86% of students with learning disabilities graduated within five years if they had zero course failures
• Absences among SWD were largest factor contributing to increased course failure rates when compared with non-disabled peers
Future Directions in Indicator Research: Social-Emotional Skills Previous Research
• Academic /behavioral engagement focus o Highly accurate for predicting on-track graduates o More challenging to predict off-track non-graduates
• Recognition that “predicting dropouts is more complex for some students, and may even be driven by external or non-academic factors” (Carl, Richardson, Cheng, Kim & Meyer, 2013) Recent Research
• Social-emotional/resiliency focus o Highly malleable skills
• Social-emotional scales in eighth grade (Success Highways) have been found to:
o Differentiate between students categorized into high and low academic success groups (based on attendance, grades, behavior)
o Differentiate between students making progress towards graduation and those who are not or who have dropped out (Davis, Solberg, de Baca & Hargrove Gore, 2014)
Future Directions of EWS: Career and College Readiness
• There is a shifting focus from high school graduation as the terminal goal for students to career and college readiness which may be measured in different ways
o Level of preparation needed to avoid remedial placement and succeed in credit-bearing coursework (ACT, 2007)

12
o Knowledge, skills and behavior necessary to successfully complete a course of study(Duncheon, 2015)
• Developing research is focusing on indicators of “readiness” that may be utilized in EWS
o Cognitive Academic Factors Content knowledge, cognitive skills
o Non-Cognitive Academic Factors Mindsets, behaviors
o Campus Integration Factors College knowledge, relationship to self and others
Middle Grade Indicators of High School and College Readiness
• The Consortium on Chicago School Research released a report in 2014 outlining critical middle grades indicators for high school and college readiness:
o Grades/grade point average (GPA) Strongest predictor of on-track status in high school and earning
high grades • Only those with GPA greater than 3.0 had moderate chance
of earning A’s & B’s in high school • 61% of eighth graders with GPA of at least 3.5 earn A’s and
B’s in 9th • 90% of eighth graders with GPA >3.5 finish eleventh grade
with GPA necessary for a somewhat selective college o Attendance
Improves predictive ability of high school performance beyond grades
Much more predictive of passing high school classes than test scores
Senate Bill (SB) 850
• Overview—SB 850 contains a section on middle school accountability with the use of EWS as mechanism for:
o Identification of at-risk or “off-track” middle school students Provision of intervention for identified students
o Monitoring of intervention effectiveness Individual as well as groups
• Students are considered “off-track” by meeting the criteria for one or more of the following required indicators:
o Attendance below 90% (18+ total days)* Does not differentiate excused or unexcused absences or
absences due to suspensions *Consider time of year
o One or more suspensions (in school or out of school) o Course failure in English language arts (ELA) or math
Semester grades o Level 1 on statewide, standardized assessments in ELA or math

13
Includes all students taking Florida Alternate Assessment • Districts may elect to use other indicators validated:
o Internally o Externally
Reporting Early Warning Indicators in the School Integration Project (SIP)
• Schools containing Grades 6, 7 or 8 must report in the SIP: o The indicators being utilized in the EWS o The number* of off-track students by grade level who meet the criteria for
each indicator o The number* of students who meet the criteria for two or more indicators o A description of intervention strategies implemented to improve
performance of identified students o A description of the strategies used to implement instructional strategies
emphasized by district professional development (PD) plan • These data are reported one time in the SIP, but EWS is utilized throughout the
year *BSI recommends including percentage in addition to numbers
“Child Study Team or Other School Based Team” Requirements
• For all students meeting the criteria for two or more indicators* the school must: o Convene a child study or other school based team formed to meet EWS
requirements meeting to determine appropriate interventions o Provide parents a minimum of 10 days written notice of the meeting
including: Purpose, time, location, opportunity to participate
*Based on 2013-14 data and any additional students during the school year
EWS Implementation What Can Districts, Schools and Parents do to Support Students? Districts and Schools
• Develop prekindergarten through Grade 12 (PreK-12) EWS o Customize to population o Customize to end-user desired features o Customize reports for stakeholders
• Provide the expectation for EWS data use within the context of data-based PS teams and MTSS
• Provide the professional development necessary to build capacity for implementation/utilization
• Provide the infrastructure and resources necessary to sustain implementation and support students:
o Temporal o Fiscal o Human o Material
14
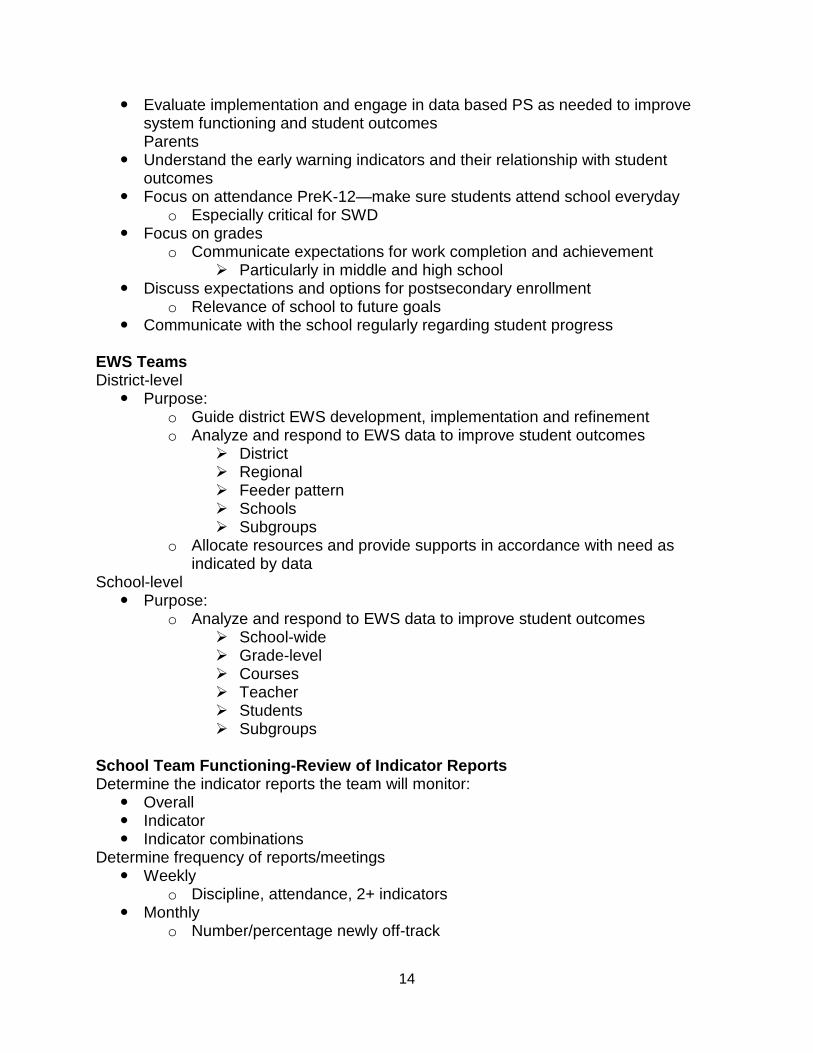
Evaluate implementation and engage in data based PS as needed to improve system functioning and student outcomes Parents
Understand the early warning indicators and their relationship with student outcomes
Focus on attendance PreK-12—make sure students attend school everyday o Especially critical for SWD
Focus on grades o Communicate expectations for work completion and achievement
Particularly in middle and high school Discuss expectations and options for postsecondary enrollment
o Relevance of school to future goals Communicate with the school regularly regarding student progress
EWS Teams District-level
Purpose: o Guide district EWS development, implementation and refinement o Analyze and respond to EWS data to improve student outcomes
District Regional Feeder pattern Schools Subgroups
o Allocate resources and provide supports in accordance with need as indicated by data
School-level Purpose:
o Analyze and respond to EWS data to improve student outcomes School-wide Grade-level Courses Teacher Students Subgroups
School Team Functioning-Review of Indicator Reports Determine the indicator reports the team will monitor:
Overall Indicator Indicator combinations
Determine frequency of reports/meetings Weekly
o Discipline, attendance, 2+ indicators Monthly
o Number/percentage newly off-track

15
o Students with current D’s/F’s September attendance (Olson, 2014)
Quarterly o Course failures o Number/percentage of newly off-track or 2+
By indicator By grade level Student “flow”
Semester o Course failures o Number/percentage of newly off-track or 2+
By indicator By grade level
o Student “flow” Annually
o Beginning of year watch lists Based on previous year indicators
o State assessments o Number/percentage of newly off-track or 2+
By indicator By grade level
o Student “flow” patterns Improving Outcomes for SWD within an MTSS from the Florida PS/RtI Project presented by Beth Hardcastle
MTSS is a framework to ensure successful education outcomes for ALL students by using a data-based PS process to provide and evaluate the effectiveness of multiple tiers of integrated academic, behavior and social-emotional instruction/intervention supports matched to student need in alignment with educational standards. Multi-tiered Support
• Tier 1: Universal Supports—all students • Tier 2: Targeted Intervention—some students • Tier 3: Intensive Interventions—few students
Why this topic?
• Concern that students “get less” after determined eligible for ESE services • Confusion re: “intensive” v. “specialized” instruction • Lack of seamless transition • Persistence of parallel systems/silos • Need for unified MTSS • Data
Assumptions

16
• SWDs should be accessing support/instruction throughout all tiers • Students receiving ESE support are STILL general education students • “High incidence” disabilities (e.g., specific learning disability, Language
Impairment) • PS is a four-step process—response to intervention (RtI) is part of Step 4 • Regardless of eligibility status, a robust Tier 1 improves outcomes for all
students • ESE support should improve general education outcomes • Integrating a system of support means addressing consensus, infrastructure,
Implementation • MTSS as framework for ALL
Meeting the needs of SWD The role of PS
• Step 1: Identify the problem (What do we want students to know and be able to do?)
• Step 2: Problem Analysis—Why do they not know it or are not able to do it? • Step 3: Intervention Design—What are we going to do about it? • Step 4: RtI—Is it working?
“Problem-solving/RtI does not ‘start’ and ‘end’ like the traditional ‘pre-referral’ process. It is an ongoing, cyclical way of work that applies to all students enrolled in school and continues for students who are receiving special education and related services.” Why continue PS? To accomplish the essential goals of ESE:
• To design and provide “specially designed instruction” to better meet the needs of SWD (Coyne, n.d.)
• To close the gap (Ragford & Gallagher, n.d.) • To enhance the quality of intervention and improve outcomes for SWDs (Heller,
Holtzman and Messick, 1982; Reschly, 1988; Reschly & Ysseldyke, 1995 as cited by Reschly & Tilly, 1999 )
Because we have to:
• Shift focus and resources from identification of disabilities to identification of effective intervention/instruction
• Show that the services we provide to SWDs are effective • Engage in the continuous evaluation and improvement of services to each and
every student served (Shinn, et. al., 1999) • Abandon circuitous reasoning (Ysseldyke & Marston, 1999) • Get down to the “real business at hand”—providing quality
intervention/instruction (Shinn, et. al., 1999) To ensure one, fluid MTSS:

17
• Seamless continuation and expansion of current and ongoing instruction/intervention (Coyne et. al., 2004)
• Ongoing assessment of student skills and progress, using the information to show the effects of instruction
• Assessment integrated into ongoing instruction to inform educational decisions • And finally, because… • A “label” provides very little information about instruction
PS within an MTSS
• An MTSS organizes the resources for – Those who respond successfully – Those at risk – SWDs
• The MTSS should facilitate our ability to meet the requirements of IDEA (Simonsen et. al., 2008)
• Meet the needs of all; inform services for student with most intense needs • Reduces barriers of who can provide what type of intervention to whom • Increases intervention options available to better meet needs of SWDs • Mechanisms in place to increase intensity of instruction for SWDs • Promotes acceleration, prevents stagnation
(Coyne, n.d.) The role of PS and the development/implementation of IEPs Specially Designed Instruction Methods used by teachers to instruction SWD
• Educators and parents work together to evaluate student work and evaluation information
• Interventions are developed based on student learning needs • Teachers measure student progress and adjust instruction as needed
We view specially designed instruction as a process…which results from individual and professional PS and decision making. Therefore, to develop a program for a particular child, it is important that evaluators gather information on student performance and progress that can inform decision making.
(Howell & Hazelton, 1999)
PS and IEPs The four-step PS process of Florida’s MTSS is central to the development of an IEP: Problem ID/Analysis: what IEP teams do when they develop “present level” statements Intervention planning/implementation: establishing goals and determining needed services/supports Evaluation: IEP team measures and evaluates progress toward goals and reports to parents What’s the problem?

18
Define problem via discrepancy between expected level of performance and present level of performance. Why is it occurring? Analyze using data to explore why discrepancy exists. Consider factors related to instruction, curriculum, environment, learner (Beech, 2012) What are we going to do about it? Establish measurable annual goals; how progress will be monitored. Identify services and supports student needs; integrity of implementation. Is it working? Monitor student progress to evaluate effectiveness. How will IEP be adjusted to increase progress? (Beech, 2012) www.fldoe.org/ese/pdf/QualityIEPs.pdf
Shifts in Focus • Under IDEA, IEP is no longer the exclusive responsibility of special ed
teacher…shift toward developing IEP for improvement in general education • Performance goals and indicators for SWDs are more closely aligned with goals
for students without disabilities • IEP plays more important role than ever before in provision of services to SWDs • Shift in focus from “opportunity” to outcomes • SWDs not just to “benefit from” gen ed curriculum, but meet gen ed standards • Focus on measurable post-school goals
Best practice strategies
• Commitment to increasing capacity to support a diverse group of students • Commitment to data-based decision-making • A symbiotic relationship between Gen Ed and ESE (Simonsen et. al., 2008) • All educators share basic assumptions and espouse common beliefs about
teaching and learning • Shared assumptions and beliefs are manifested in activities that can be seen—
shared planning, professional learning communities, team teaching, PD (Office of Special Education Programs [OSEP], 2005)
• “The goal of teaching all students to read—can be symbolic, representing a common commitment and a shared responsibility for all students.
• A school community that makes this commitment accepts responsibility for every student
• When taken seriously teaching all students to read means teach each student to read.
• Therefore, when articulating a goal for all, we are compelled to address the needs of each.” (Coyne, Kame’enui and Simmons, 2004)
Best Practices Infrastructure
• Establish systems that facilitate data-based decision making

19
• Create a structure (e.g., a school-based team) that ensures data reviewed • Train staff to effectively prioritize data for review, ask questions of their data and
use data effectively to make decisions • Enroll administrative support
(Simonsen et. al., 2008)
Data Base PS How do you know/ensure that:
• ESE instruction/interventions are planned to improve student performance and rate of progress?
• Support is delivered as intended? • Instruction/interventions are effective? • Parents are involved in supporting interventions? • ESE support is aligned with core instruction? • Powerful classroom instruction for all students—evidence-based and aligned with
standards • Universal assessments include SWDs • Inventory universal assessment data helpful to interdisciplinary team • Common assessments—evaluate the effectiveness of classroom instruction and
to identify students at risk • “Strategic leveraging of personnel, expertise, materials, and scheduling”
(Coyne, n.d.) Develop critical skills/competencies
o PS-interviewing skills o Behavior assessment including curriculum-based measurement (CBM) o Powerful instructional interventions o Powerful behavior change interventions o Relationship skills o Tailoring assessment to identified problem
(Reschly, 2007) • Less dependence on prescribed “programs” and more focus on
effectiveness/fidelity • Shared responsibility • IEP team seen as a type of PS team • Increase options re: screening and progress monitoring tools—CBM, e.g.
Implementation • Teaming structure supports frequent IEP data review • Ready-access to a database to define level of need • Consistent approaches to OPM • IEP goals are streamlined, monitored and evaluated • IEP goals outcome-based
(Radford & Gallagher, n.d.) • Supporting teachers by providing intervention plans that connect IEP goals to
classroom instruction o Refining IEP goals (short-term objectives)

20
o Interventions needed to address these goals o Collect data on student progress (Jung, et. al., 2008)
• IEP as product and process • Entitlement decisions v. teaching decisions • What to teach and how to teach • Basing educational decisions on individual formative data
(Howell & Hazelton, 1999) Implementation
• ESE and related service providers work collaboratively as part of a coherent system in planning and delivering interventions
• Instructional goals, delivery of instruction and services, assessments, PD are aligned
• Gen Ed and ESE teachers and related service providers know and respect each other, and depend on each other in collaborative relationships to best serve their students (OSEP, 2005)
“It is unrealistic to assume that individual teachers, working independently, can implement and sustain the host of research-based practices that we know are necessary to enable all students to reach grade level goals.”
(Coyne, n.d.) Beth Hardcastle Regional Coordinator Florida PS/RtI Project 850-994-5867 [email protected]
TUESDAY, July 14, 2015 Members (See SAC Membership List 2015, SAC Designee List and SAC Representation Chart, SAC Member Notebook, Tab 2) Barry, Keith Blades, Laurie Cheeseborough, Thea Clay, Sonja Colthorp, Amy Ehrli, Hannah Escallon, Enrique Halpert, Mark Jones, Cindy LaBelle, Rich Linley-Harris, Nancy Lopez-Sequenzia, Sarah Mantell, Michelle

21
Miller, Lisa Phillips, Donna Rankin, Tom Roberts, Grace Roth, Terry Rudniski, Catherine Sarah Lopez Sequezia Siegel, Ann Stevens, Tracy Tucker, Kara Verra-Tirado, Monica Designees Smith, Courtney (for Johana Hatcher) Hall, Kirk (for Roxana Beardall) Rumph, Laura (for Kelly Rogers) Russell, Cathy (for Laura Harrison) Guests Tury Lewis FDOE/DPS/BEESS Representatives Monica Verra-Tirado, Bureau Chief, BEESS Tonya Milton, program planner/analyst (SAC Liaison), BEESS April Katine, educational program director (SAC Liaison), BEESS Aimee Mallini, parent services (SAC Liaison), BEESS Heather Diamond, student support services director, University of South Florida (USF) Heidi Metcalf, senior educational program director, BEESS Laurie Epps, Specific Learning Disability, BEESS Jessica Brattain, Intellectual Disabilities, BEESS Heather Willis-Doxsee, exceptional student education (ESE) reading specialist, Just
Read Florida/BEESS 8:30 a.m. - 1:00 p.m.—SAC worked in small groups
Business Meeting – 1 pm
1. Public comment a. Peg Stover called to make a comment about Specific Learning Disabilities
2. Motion was passed to approve the minutes
3. Discussion about recommendation from July subcommittee a. Nancy Linley-Harris spoke on behalf of the subcommittee, which was
concerned about adding a new dropdown box on the IEP to assist families in signing their child up on the APD MEDWAIVER Program, if they are a
22
student with 1 of 6 Disabilities that qualify to be on the State Med waiver Program.
b. Topic was opened up for discussion c. Concerns about retaliation addressed d. Concerns about no connection with resources e. Motion for the subcommittee to continue to work on an informational sheet
and bring it back to SAC in December passed
4. Parent Involvement a. Aimee Mallini b. School level data is related to district monitoring c. Targeting specific schools to help the district overall d. Determining intervention needs
5. K-12 access a. Concerned about teacher certification b. Access points in gen education classes, specific focus on math
6. Postsecondary special education a. Professional development needed for college professors b. Adding assistance for other supports
7. Strategic plan comments a. Indicator one—need to include a key for acronyms b. Need to have parents and students involved or provide input c. How does shared information affect classroom practice?
8. Dr. Monica Verra-Tirado—provided update on strategic plan a. Tab 4 shows three different categories, shifting to compliance and results b. Reading assessments participation, there is a dip in eighth grade c. Participation in National Association for Primary Education d. Dropout/graduation rates
Meeting adjourned