florida department of transportation · 4.4.1 cultural resources ... interchange located on...
TRANSCRIPT
FLORIDA DEPARTMENT OF TRANSPORTATION Planning and Environmental Management Office
INTERCHANGE MODIFICATION REPORT
District 2 1109 South Marion Avenue Lake City, FL 32025-5874
INTERSTATE 10 (SR 8) / SR 200 (US 301) INTERCHANGE
FM No. 428865-1-22-01 Section No. 72270 and 72140
Duval County, Florida
August 2012
DRAFT
i
PROFESSIONAL ENGINEER CERTIFICATE
I hereby certify that I am a registered professional engineer in the State of Florida practicing
with The Corradino Group, a Florida Corporation authorized to operate as an engineering
business, P.E. #7665, by the State of Florida Department of Professional Regulation, Board
of Engineers, and that I have prepared or approved the evaluation, findings, opinions,
conclusions or technical advice hereby reported for:
FM No.: 428865-1-22-01
Project: Interstate 10 (SR 8) / SR 200 (US 301) Interchange Interchange Modification Report
County: Duval
FDOT Project Manager: Brandi Vittur, P.E.
I acknowledge that the procedures and references used to develop the results contained in
this report are standard to the professional practice of transportation engineering as applied
through professional judgment and experience.
SIGNATURE: ____________________________
NAME Ryan Solís-Ríos, PE, PTOE P.E. No.: 63345
FIRM: The Corradino Group
DATE: August 16, 2012
Interstate 10 (SR 8)/ SR 200 (US 301) Interchange
Interchange Modification Report
ii
I-10 / US 301 INTERCHANGEINTERCHANGE MODIFICATION REPORT
TABLE OF CONTENTS
SECTION DESCRIPTION PAGE
EXECUTIVE SUMMARY ........................................................................................................... 1Assessment of FHWA’s Policy on Access to Interstate System ................................................. 3
I. INTRODUCTION .................................................................................................................... 71.1 Application Information ........................................................................................................ 71.2 Background ........................................................................................................................... 71.3 Purpose .................................................................................................................................. 81.4 Project Location .................................................................................................................... 8
II. METHODOLOGY ................................................................................................................ 122.1 Overview ............................................................................................................................. 122.2 Analysis Years .................................................................................................................... 122.3 Travel Demand Forecasting ................................................................................................ 122.4 Adjustment Procedures ....................................................................................................... 132.5 Traffic Factors ..................................................................................................................... 142.6 Traffic Operational Analysis ............................................................................................... 15
III. EXISTING CONDITIONS ................................................................................................. 153.1 Existing Land Use ............................................................................................................... 153.2 Existing Roadway Network ................................................................................................ 17
3.2.1 Functional Classification ............................................................................................. 173.2.2 Typical Section ............................................................................................................ 17
3.3 Alternative Travel Modes ................................................................................................... 213.4 Interchanges ........................................................................................................................ 23
IV. EXISTING OPERATIONAL PERFORMANCE ............................................................. 254.1 Existing Traffic Data ........................................................................................................... 254.2 Level of Service .................................................................................................................. 29
4.2.1 Basic Freeway Segment Analysis ................................................................................ 294.2.2 Ramp Merge/Diverge/Weaving Analysis .................................................................... 304.2.3 Arterial and Intersection Analysis ............................................................................... 34
4.3 Existing Accident Data ....................................................................................................... 394.4 Existing Environmental Constraints ................................................................................... 45
4.4.1 Cultural Resources ....................................................................................................... 454.4.2 Community Services .................................................................................................... 454.4.3 Natural and Biological Features .................................................................................. 484.4.4 Physical Environment .................................................................................................. 51
Interstate 10 (SR 8)/ SR 200 (US 301) Interchange
Interchange Modification Report
iii
V. NEED ...................................................................................................................................... 525.1 Project Corridor Needs ........................................................................................................ 52
5.1.1 Interchange Design and Deficiencies .......................................................................... 525.1.2 Structural ...................................................................................................................... 535.1.3 Safety ........................................................................................................................... 54
5.2 Area Needs .......................................................................................................................... 545.2.1 System Linkage and Area Connectivity ...................................................................... 545.2.2 Access to Freight Activity ........................................................................................... 555.2.3 Transportation Demand ............................................................................................... 555.2.4 Social Demands and Economic Development ............................................................. 555.2.5 Federal, State and Local Government Authority ......................................................... 56
VI. ALTERNATIVES ................................................................................................................ 576.1 No-Build Alternative ........................................................................................................... 576.2 Alternative Travel Modes ................................................................................................... 576.3 Build Alternative ................................................................................................................. 57
6.3.1 Definition of Alternative .............................................................................................. 576.3.2 Preferred Alternative (2020 Opening Year) ................................................................ 596.3.3 Preferred Alternative (2040 Design Year) ................................................................... 62
VII. FUTURE YEAR TRAFFIC ............................................................................................... 657.1 2020 Opening and 2040 Design Year Traffic ..................................................................... 65
VIII. ALTERNATIVES ANALYSIS ........................................................................................ 698.1 Conformance with Transportation Plan .............................................................................. 698.2 Compliance with Policies and Engineering Standards ........................................................ 69
8.2.1 Roadway Design Criteria ............................................................................................. 698.2.2 Design Exceptions and Variations ............................................................................... 69
8.3 Operational Analysis ........................................................................................................... 708.4 Environmental Impacts ....................................................................................................... 89
8.4.1 Cultural Resources ....................................................................................................... 898.4.2 Community Services .................................................................................................... 898.4.3 Natural and Biological Features .................................................................................. 898.4.4 Physical Environment .................................................................................................. 92
8.5 Safety .................................................................................................................................. 928.6 Right-of-Way ...................................................................................................................... 938.7 Alternatives Comparison ..................................................................................................... 938.8 Conceptual Signing Master Plan ......................................................................................... 96
IX. FUNDING PLAN .................................................................................................................. 96
X. RECOMMENDATIONS ....................................................................................................... 97

Interstate 10 (SR 8)/ SR 200 (US 301) Interchange
Interchange Modification Report
iv
LIST OF FIGURES
SECTION DESCRIPTION PAGE
1.1 Study Location Map ........................................................................................................... 9 1.2 Area of Influence Map .................................................................................................... 10 3.1 Existing Land Use Map .................................................................................................... 16 3.2 I-10 Existing Four-Lane Divided Rural Typical Section (West of US 301) .................... 18 3.3 I-10 Existing Four-Lane Divided Rural Typical Section (East of US 301) ..................... 19 3.4 US 301 Existing Four-Lane Divided Rural Typical Section ........................................... 20 3.5 Baldwin Commuter Shuttle Route.................................................................................... 22 3.6 Interchange Deficiencies .................................................................................................. 24 3.7 Northbound US 301 South of I-10 (Photo) ...................................................................... 24 4.1 Existing Lane Geometry and Configurations ................................................................... 26 4.2 2007 AADT Traffic Volumes .......................................................................................... 27 4.3 2007 AM/PM Peak Hour Volumes .................................................................................. 28 4.4 2007 AM/PM Balanced Truck Percentages by Movement .............................................. 32 4.5 2007 AM Level of Service – Existing Conditions ........................................................... 37 4.6 2007 PM Level of Service – Existing Conditions ............................................................ 38 4.7 High Crash Areas ............................................................................................................. 43 4.8 Historic Resources, Archaeological Sites and Known Contaminated Sites ..................... 46 4.9 Community Facilities Adjacent to Study Area ................................................................. 47 4.10 Wetlands Map ................................................................................................................. 49 4.11 Federal Emergency Management Agency Flood Insurance Rate Map ............................ 50 5.1 US 301 Northbound Left-Turn Lane Queue (Photo)........................................................ 53 6.1 2020 Preferred Alternative Lane Geometry and Configurations ..................................... 61 6.2 2040 Concept #1 Lane Geometry and Configurations .................................................... 63 6.3 2040 Concept #2 Lane Geometry and Configurations .................................................... 64 7.1 2020 and 2040 AADT Traffic Volumes ........................................................................... 66 7.2 2020 AM/PM Peak Hour Volumes (DDHV) ................................................................... 67 7.3 2040 AM/PM Peak Hour Volumes (DDHV) ................................................................... 68 8.1 2020 AM Level of Service – No-Build Alternative ......................................................... 79 8.2 2020 PM Level of Service – No-Build Alternative .......................................................... 80 8.3 2040 AM Level of Service – No-Build Alternative ......................................................... 81 8.4 2040 PM Level of Service – No-Build Alternative .......................................................... 82 8.5 2020 AM Level of Service – Preferred Alternative ......................................................... 83 8.6 2020 PM Level of Service – Preferred Alternative .......................................................... 84 8.7 2040 AM Level of Service – Concept #1 ......................................................................... 85 8.8 2040 PM Level of Service – Concept #1 .......................................................................... 86 8.9 2040 AM Level of Service – Concept #2 ......................................................................... 87 8.10 2040 PM Level of Service – Concept #2 .......................................................................... 88 8.11 Wetland Impacts ............................................................................................................... 91
Interstate 10 (SR 8)/ SR 200 (US 301) Interchange
Interchange Modification Report
v
LIST OF TABLES
SECTION DESCRIPTION PAGE
2.1 I-10 Traffic Trends Growth Rates .................................................................................... 13 2.2 Facility Traffic Factors ..................................................................................................... 14 4.1 Basic Freeway Segment Analysis (Interstate 10) – 2007 Existing Conditions ............... 30 4.2 Ramp Merge/Diverge Analysis (Interstate 10/US 301) – 2007 Existing Conditions ...... 33 4.3 Ramp Weaving Analysis (US 301) – 2007 Existing Conditions ...................................... 33 4.4 Intersection Analysis (Signalized Intersections) – 2007 Existing Conditions .................. 34 4.5 Intersection Analysis (Unsignalized Intersections) – 2007 Existing Conditions ............. 35 4.6 Arterial Analysis (US 301) – 2007 Existing Conditions .................................................. 36 4.7 I-10 and US 301 Crash Data Summary ............................................................................ 39 4.8 I-10 Crash Statistics Summary ......................................................................................... 404.9 US 301 Crash Statistics Summary .................................................................................... 41 4.10 I-10 Crash Data by Severity ............................................................................................. 44 4.11 US 301 Crash Data by Severity ........................................................................................ 448.1 Basic Freeway Segment Analysis (Interstate 10) – IMR Alternatives .............................. 71 8.2 Ramp Merge/Diverge Analysis (Interstate 10/US 301) – IMR Alternatives .................... 72 8.3 Ramp Weaving Analysis (US 301) – IMR Alternatives ................................................... 73 8.4 Intersection Analysis (Signalized Intersections) – IMR Alternatives ............................... 74 8.5 Intersection Analysis (Unsignalized Intersections) – IMR Alternatives ........................... 75 8.6 Arterial Analysis (US 301) – IMR Alternatives ................................................................ 77 8.7 Evaluation Matrix .............................................................................................................. 94 9.1 Project Funding Plan ......................................................................................................... 96
LIST OF APPENDICES
APPENDIX DESCRIPTION
A……….. Methodology Letter of Understanding (Original and Revised) B……….. 2007 Highway Capacity Software and Synchro Output Files C……….. I-10 Eastbound Ramps/US 301 Intersection Existing Timing and Phasing Plans D……….. Safety Analysis Evaluation: Crash Data Analysis E……….. Interchange Concepts Considered F……….. 2020 Preferred Alternative Concept Plans G……….. 2040 Preferred Alternative Concept Plans (Concept #1 and Concept #2) H……….. 2020 and 2040 Highway Capacity Software and Synchro Output Files I……….. Conceptual Signing Master Plan

Interstate 10 (SR 8)/ SR 200 (US 301) Interchange
Interchange Modification Report
1
EXECUTIVE SUMMARY
The Florida Department of Transportation (FDOT) District Two is conducting an Interchange Modification Report (IMR) to evaluate roadway and safety improvement alternatives to the Baldwin Interchange located on Interstate 10 (I-10) in Duval County. The interchange is located at the I-10 exit to SR 200 (US 301) within the Town of Baldwin and is commonly referred to as the Baldwin Interchange (see Figure 1.1). US 301 is a four-lane roadway classified as an urban principal arterial and provides access to areas north and south of I-10. I-10 is a four-lane roadway classified as a rural principal arterial west of US 301 and as an urban principal arterial east of US 301. A CSX railroad maintenance yard is located along the east side of US 301.
In April 2006, FDOT completed a master planning study for the I-10 corridor. Geographic limits of the study were the Jefferson/Madison County Line on the west to I-295 in Jacksonville on the east. An I-10/US 301 Interchange Project Development and Environment (PD&E) Study was one of the recommendations outlined in the master plan with the main objectives of improving the capacity of the I-10 transportation corridor and the traffic operations of the US 301 Interchange.
As part of the PD&E Study, FDOT recently completed a Bridge Feasibility Study of the bridge structures within the interchange study limits. The results of this study determined that the I-10 bridge structures over US 301 and the CSX railroad maintenance yard will need to be replaced within the next ten (10) years. As part of the PD&E study and IMR efforts, a Build Alternative was developed by reconfiguring the interchange access to US 301 in order to be able to propose a maintenance of traffic (MOT) plan that will allow the replacement of the bridge structures and the reconstruction of the I-10 mainline profile without closing the existing I-10 through lanes and without future construction throwaway. A phased approach was identified for construction that provides immediate congestion relief and safety benefits and is the alternative for which approval is being sought as the Build Alternative. Since this Build Alternative requires modification to the interstate system access, an IMR was funded by FDOT.
The purpose of this IMR is to provide the required technical documentation for obtaining Federal Highway Administration (FHWA) approval to modify the I-10/US 301 Interchange. Current traffic demands have modified the role of the interchange with a high number of commercial vehicles using the two truck stops immediately south of the interchange as a major servicing point just outside the Jacksonville urban area. The heavy demand for the northbound US 301 to eastbound I-10 on-ramp creates difficult operational conditions and results in a sustained northbound queue for the signalized intersection left-turn (see Figures 3.7 and 5.1). The large portion of trucks in this long queue creates an operational and safety problem for all traffic in the area as the large vehicles obstruct sight distance, move slowly, block driveways, interfere with the median openings and prompt drivers to perform unsafe and unpredictable movements. I-10 and US 301 have an average of twenty-three (23) and twenty-four (24) crashes per year respectively for a total of forty-seven (47) crashes. Theaverage year safety ratios for I-10 and US 301, within the study limits, were found to be 1.46 and 2.28 respectively. Many of the traffic safety concerns relate to turning movements and existing physical conditions that can be addressed by modifying the interstate access and improving the ramp terminals. The objective of the IMR is to evaluate improvements to the existing interchange by developing solutions to current deficiencies and substandard conditions. The analysis years

Interstate 10 (SR 8)/ SR 200 (US 301) Interchange
Interchange Modification Report
2
proposed for this IMR are 2007 existing year, 2020 opening year and 2040 design year. The IMR analyzed the 2020 opening year in order to be consistent with the bridge replacement construction schedule.
After the Department’s review and concurrency of the final evaluation of the interchange concepts, an IMR preferred interchange alternative was identified to move forward in the study. This preferred Build Alternative will increase capacity, improve safety, improve traffic operations and will accommodate the necessary MOT plan to replace the bridge structures and reconstruct the I-10 mainline profile. The Preferred Alternative (see Figure 6.1 and Appendix F) was developed based on the evaluation and analysis of several key evaluation parameters including: environmental considerations, traffic level of service (LOS), safety, MOT, construction cost and right-of-way cost. The proposed interchange modification, for which approval to a change in access is being sought, includes:
1. The construction of a new US 301 northbound to I-10 eastbound on-ramp in the southeast quadrant of the interchange – This new ramp will improve the operations on US 301 by removing the major left-turn movement from the I-10/US 301 eastbound ramp terminal allowing the intersection to operate more efficiently. This new ramp will also allow the heavy truck volume movement to use a directional ramp and merge with the I-10 traffic at a speed commensurate with the I-10 mainline speed eliminating the eastbound speed differentials. This ramp will merge with the ramp coming from the southwest quadrant of the interchange to maintain a single I-10 eastbound merge point location.
2. The reconstruction of the loop ramp in the southwest quadrant of the interchange –This ramp will be reconstructed by removing the existing merge point with I-10 and extending the ramp eastbound separate and parallel to the I-10 mainline until merging with the new ramp in the southeast quadrant of the interchange.
3. The construction of a new two-lane I-10 westbound to US 301 off-ramp in the northeast quadrant of the interchange – The new westbound off-ramp will provide the appropriate length and number of lanes to decelerate before reaching the low design speed loop ramp to access US 301 eliminating the I-10 westbound mainline speed differentials. This design will improve LOS by providing separate ramp connections to access US 301 northbound and southbound.
Two additional projects will be constructed and in place by the design year 2040 within the interchange area (see Figures 6.2 and 6.3).
I-10 Six-Lane Widening Project – The project limits of the widening of I-10 from four lanes to six lanes are from the Baker/Nassau County Line to SR 23. Baldwin Bypass Project – A new four-lane roadway (Baldwin Bypass) will be constructed from south of US 90 to north of the Town of Baldwin. This project currently proposes two distinct concepts to connect with the existing US 301 corridor north of the interchange.
1. T-Intersection just north of New Brandy Branch Road2. Four-Leg Intersection just north of the Interchange

Interstate 10 (SR 8)/ SR 200 (US 301) Interchange
Interchange Modification Report
3
The interchange 2040 Preferred Alternative will be the same as in the opening year 2020 except for minor modifications to accommodate the two projects described above. The interchange 2020 Preferred Alternative is the proposed interchange modification for which approval to a change in access is being sought in this IMR document as part of the IMR interchange proposal process.
The IMR traffic operational analysis results show that all the freeway segments, system merge/diverge ramps and intersections analyzed as part of the IMR Preferred Alternative will operate at LOS D or better by the years 2020 and 2040. By the year 2040, the two proposed intersection concepts along US 301 will preserve an arterial acceptable LOS when comparing to the 2020 Preferred Alternative. In terms of traffic operations, Concept #2 will be a more suitable and practical design when compared to Concept #1.
The IMR Preferred Alternative interchange modifications will add the necessary improvements to enhance traffic operations, safety and interstate access. The IMR Preferred Alternative is the most prudent when compared with the No-Build Alternative for the following reasons:
Meets future growth in travel demand. Meets existing and future high truck traffic demand. Significantly improves LOS, traffic flow and interstate access. Anticipated to reduce crashes related to left-turn maneuvers, sight distance, traffic signal timing, weaving maneuvers, speed differentials and poor intersection geometry. Improves interchange geometric design and access management helping the corridors to be more effective during emergency evacuation events. Helps service the social demands and economic developments of the area. There are no significant environmental impacts.
In addition, the IMR Preferred Alternative will provide the necessary interchange footprint to accommodate an MOT plan to replace the US 301 and CSX bridges without closing the interchange, while maintaining all travel lanes and ramps at all times during construction.
The needs addressed through the IMR Preferred Alternative cannot be addressed through modifications to other interchanges, TSM strategies, or other multimodal improvements. The implementation of this interchange design was found feasible and presents a balance in providing the needed improvements for this area. The Florida Department of Transportation District 2 recommends the Preferred Alternative be approved, as proposed, for a change in interstate access.
Assessment of FHWA’s Policy on Access to Interstate System
The proposed interchange modifications are consistent with the requirements of the FHWA policy on “Access to the Interstate System” (Volume 74, Number 165 of the Federal Register), dated August 27, 2009 and the FDOT “Interchange Justification Procedure”, Topic Number 525-030-160-h, dated September 5, 2008. The FHWA policy requires the following eight (8) points to be addressed:
1. “The need being addressed by the request cannot be adequately satisfied by existing interchanges to the Interstate, and/or local roads and streets in the corridor can neither
Interstate 10 (SR 8)/ SR 200 (US 301) Interchange
Interchange Modification Report
4
provide the desired access, nor can they be reasonably improved (such as access control along surface streets, improving traffic control, modifying ramp terminals and intersections, adding turn bays or lengthening storage) to satisfactorily accommodate the design-year traffic demands (23 CFR 625.2(a)).”
The proposed interchange modifications (Preferred Alternative) are a result of the I-10/US 301 Interchange PD&E Study, currently underway. The PD&E study and IMR efforts clearly demonstrate that the Preferred Alternative will add the necessary improvements to enhance traffic operations, safety and interstate access. In addition, the Preferred Alternative will provide the necessary interchange footprint to accommodate an MOT plan to replace the US 301 and CSX bridges without closing the interchange and maintaining all travel lanes and ramps at all times during construction. The adjacent interchanges west and east are approximately 7.6 and 6.5 miles, respectively, away from US 301. Improvements to these other facilities will not meet the operational and safety needs for this project. The No-Build Alternative fails to fulfill the needs of this project for the area.
2. “The need being addressed by the request cannot be adequately satisfied by reasonable transportation system management (such as ramp metering, mass transit, and HOV facilities), geometric design, and alternative improvements to the Interstate without the proposed change(s) in access (23 CFR 625.2(a)).”
As part of the PD&E study, FDOT recently completed a Bridge Feasibility Study of the bridge structures within the interchange study limits. The results of this study determined that the I-10 bridge structures over US 301 and the CSX railroad maintenance yard will need to be replaced within the next ten (10) years.
As part of the PD&E study and IMR efforts, the Preferred Alternative was developed by reconfiguring the interchange access to US 301 in order to be able to propose an MOT plan that will allow the replacement of the bridge structures and the reconstruction of the I-10 mainline profile without future construction throwaway.
The Preferred Alternative will provide the necessary interchange footprint to accommodate an MOT plan to replace the US 301 and CSX bridges without closing the interchange and maintaining all travel lanes and ramps at all times during construction. A phased approach was identified for construction that provides immediate congestion and safety benefits. Therefore, a TSM Alternative was not considered in this IMR because it fails to fulfill the needs of this project.
3. “An operational and safety analysis has concluded that the proposed change in access does not have a significant adverse impact on the safety and operation of the Interstate facility (which includes mainline lanes, existing, new, or modified ramps, ramp intersections with crossroad) or on the local street network based on both the current and the planned future traffic projections. The analysis shall, particularly in urbanized areas, include at least the first adjacent existing or proposed interchange on either side of the proposed change in access (23 CFR 625.2(a), 655.603(d) and 771.111(f)). The crossroads and the local street network, to at least the first major intersection on either side of the

Interstate 10 (SR 8)/ SR 200 (US 301) Interchange
Interchange Modification Report
5
proposed change in access, shall be included in this analysis to the extent necessary to fully evaluate the safety and operational impacts that the proposed change in access and other transportation improvements may have on the local street network (23 CFR 625.2(a) and 655.603(d)). Requests for a proposed change in access must include a description and assessment of the impacts and ability of the proposed changes to safely and efficiently collect, distribute and accommodate traffic on the Interstate facility, ramps, intersection of ramps with crossroad, and local street network (23 CFR 625.2(a) and 655.603(d)). Each request must also include a conceptual plan of the type and location of the signs proposed to support each design alternative (23 U.S.C. 109(d) and 23 CFR 655.603(d)).”
The operational analysis conducted in this IMR confirmed that the proposed interchange modifications do not adversely impact safety and operation on the interstate facility. When compared with the No-Build Alternative, the Preferred Alternative improves the operations at the merge and diverge areas as well as the cross street ramp terminal intersections. The freeway, ramps and intersections will all operate at an acceptable LOS.
The proposed improvements at the I-10/US 301 Interchange will not impact the traffic operations of the adjacent interchanges due to the lengthy distance from the subject interchange. As part of this interchange proposal and agreed upon in the MLOU, a full interchange analysis was not performed at the adjacent interchanges.
The Preferred Alternative proposes minor signing improvements. Additional signing will be needed to accommodate the new eastbound on-ramp. Signing along I-10 westbound will be modified to direct traffic to the new exit ramp location.
4. “The proposed access connects to a public road only and will provide for all traffic movements. Less than ``full interchanges'' may be considered on a case-by-case basis for applications requiring special access for managed lanes (e.g., transit, HOVs, HOT lanes) or park and ride lots. The proposed access will be designed to meet or exceed current standards (23 CFR 625.2(a), 625.4(a)(2), and 655.603(d)).”
The study limits involve I-10 and US 301 only, both public facilities. A full interchange is provided and the proposed interchange improvements are designated to meet or exceed current standards at the interchange location.
5. “The proposal considers and is consistent with local and regional land use and transportation plans. Prior to receiving final approval, all requests for new or revised access must be included in an adopted Metropolitan Transportation Plan, in the adopted Statewide or Metropolitan Transportation Improvement Program (STIP or TIP), and the Congestion Management Process within transportation management areas, as appropriate, and as specified in 23 CFR part 450, and the transportation conformity requirements of 40 CFR parts 51 and 93.”
The project is consistent with and supports regional land use and transportation plans. The proposed improvements contained in this IMR have resulted from a long-range transportation planning process that included the development of a master plan for the I-10 corridor and the

Interstate 10 (SR 8)/ SR 200 (US 301) Interchange
Interchange Modification Report
6
preparation of the on-going I-10/US 301 Interchange PD&E Study. The proposed interchange improvements are consistent with the development plans for the corridor that have been adopted by the local Metropolitan Planning Organization and is contained in the 2035 LRTP.
6. “In corridors where the potential exists for future multiple interchange additions, a comprehensive corridor or network study must accompany all requests for new or revised access with recommendations that address all of the proposed and desired access changes within the context of a longer-range system or network plan (23 U.S.C. 109(d), 23 CFR 625.2(a), 655.603(d), and 771.111).”
The IMR addresses the existing and future interchange needs for the area. The proposed interchange modifications contained herein were developed based upon a comprehensive interstate network study and are consistent with the I-10 Master Plan Study and the long-term vision for the corridor.
7. “When a new or revised access point is due to a new, expanded, or substantial change in current or planned future development or land use, requests must demonstrate appropriate coordination has occurred between the development and any proposed transportation system improvements (23 CFR 625.2(a) and 655.603(d)). The request must describe the commitments agreed upon to assure adequate collection and dispersion of the traffic resulting from the development with the adjoining local street network and Interstate access point (23 CFR 625.2(a) and 655.603(d)).”
The proposed interchange improvements are required to accommodate the anticipated growth in the region and associated increase in transportation demand. The need for the interstate access modification was identified as part of the regional transportation planning process. The forecasted transportation demand was developed in accordance with this process and was based on approved land use plans and planned transportation system improvements for the region.
8. “The proposal can be expected to be included as an alternative in the required environmental evaluation, review and processing. The proposal should include supporting information and current status of the environmental processing (23 CFR 771.111).”
The IMR was developed in consensus with the on-going I-10/US 301 Interchange PD&E Study. A Categorical Exclusion Type II is anticipated as the appropriate class of action for this study. The PD&E study will include a comprehensive environmental evaluation of the potential impacts of the proposed interchange improvements. The PD&E study is not anticipating any fatal flaws from a planning and environmental perspective. Environmental impacts are expected to be relatively minor and those that do occur can be addressed through reasonable mitigation measures.

Interstate 10 (SR 8)/ SR 200 (US 301) Interchange
Interchange Modification Report
7
I. INTRODUCTION
The Florida Department of Transportation (FDOT) District Two is conducting an Interchange Modification Report to evaluate roadway and safety improvement alternatives to the Baldwin Interchange located on Interstate 10 (I-10) in Duval County. The interchange is located at the I-10 exit to SR 200 (US 301) within the Town of Baldwin and is commonly referred to as the Baldwin interchange. US 301 is a four-lane roadway classified as an urban principal arterial and provides access to areas north and south of I-10. I-10 is a four-lane roadway classified as a rural principal arterial west of US 301 and as an urban principal arterial east of US 301. A CSX railroad maintenance yard is located along the east side of US 301.
1.1 Application Information
The applicant for this Interchange Modification Report (IMR) is:
FDOT District Two 1109 South Marion Avenue Mail Station 2007 Lake City, Florida 32025
1.2 Background
In April 2006, FDOT completed a master planning study for the I-10 corridor. Geographic limits of the study were the Jefferson/Madison County Line on the west to I-295 in Jacksonville on the east. The total project length was approximately 120 miles. The study corridor was subdivided into three (3) segments for specific analysis:
Segment 1: Jefferson/Madison County Line to I-75 (Columbia County) Segment 2: I-75 (Columbia County) to CR 125 (Baker County) Segment 3: CR 125 (Baker County) to I-295 (Duval County)
An I-10/US 301 Interchange Project Development and Environment (PD&E) Study was one of the recommendations outlined in the master plan with the main objectives of improving the capacity of the I-10 transportation corridor and the traffic operations of the US 301 interchange within the specified limits by identifying and implementing viable and appropriate transportation alternatives.
In 2007, FDOT began a PD&E study and IMR to evaluate roadway and safety improvement alternatives to the Baldwin Interchange. The PD&E/IMR Study was initiated as part of the planning process to evaluate interchange concepts that could be implemented as short and long term improvements to alleviate the current and future traffic conditions. A Methodology Letter of Understanding (MLOU) was approved by the Federal Highway Administration (FHWA) in 2007 and later revised and approved in 2012. As part of this study, FDOT completed a Bridge Feasibility Study to widen, through repair or replacement, the existing bridges over the CSX railroad maintenance yard. Various bridge alternatives were evaluated to bring the bridges up to current design standards and widen the typical section. The recommended alternative from the Bridge Feasibility Study was to replace the CSX bridges.

Interstate 10 (SR 8)/ SR 200 (US 301) Interchange
Interchange Modification Report
8
Due to the proximity of the CSX bridges to the US 301 bridges, it was determined that the US 301 bridges will also need to be replaced in order to bring all four bridges to meet vertical clearance criteria and to reconstruct the I-10 mainline within the interchange limits. In order to be able to replace the bridges and maintain the existing number of interstate through lanes at all times during construction, improvements to the interchange access will be needed and must be in place before the replacement of the bridges. A phased approach was identified for construction that provides immediate congestion and safety benefits and is the alternative for which approval is being sought as the Build Alternative. Since this Build Alternative requires modification to the interstate system access, an IMR was funded by FDOT District Two.
North of the interchange, FDOT is conducting a PD&E study to construct a new four-lane roadway (Baldwin Bypass) to provide a US 301 bypass route from south of US 90 to north of the Town of Baldwin. The PD&E study began in 2005 and is anticipated to have a Location Design Concept Acceptance (LDCA) by Summer of 2012. The project is scheduled to be constructed by the year 2035.
1.3 Purpose
I-10 is the primary interstate facility that links all major cities through the Florida Panhandle and is also one of the most important Florida transportation systems. Master planning of major transportation facilities such as I-10 has been essential to ensure the availability of capacity within the transportation network and to support the region’s high growth.
US 301 is considered one of the most important arterials within the State of Florida. US 301 is a popular shortcut between Northeastern Florida and the Gulf Coast region. A high number of commercial vehicles use US 301 as an alternate route from I-75 to I-10 and from I-95 to I-10.
The purpose of this IMR is to provide the required technical documentation for obtaining FHWA approval to modify the I-10/US 301 Interchange. Current traffic demands have modified the role of the interchange with a high number of commercial vehicles using the two truck stops immediately south of the interchange as a major servicing point just outside the Jacksonville urban area. The heavy demand for the northbound US 301 to eastbound I-10 on-ramp creates difficult operational conditions and results in a sustained northbound queue for the signalized intersection left-turn. The large portion of trucks in this long queue creates an operational and safety problem for all traffic in the area as the large vehicles obstruct sight distance, move slowly, block driveways, interfere with the median openings and prompt drivers to perform unsafe and unpredictable movements. The high demand of left-turn vehicles together with the high number of commercial vehicles are contributing to creating interchange congestion and interrupted interchange access. The objective of the IMR is to evaluate improvements to the existing interchange by developing short and long term solutions to current deficiencies and substandard conditions.
1.4 Project Location
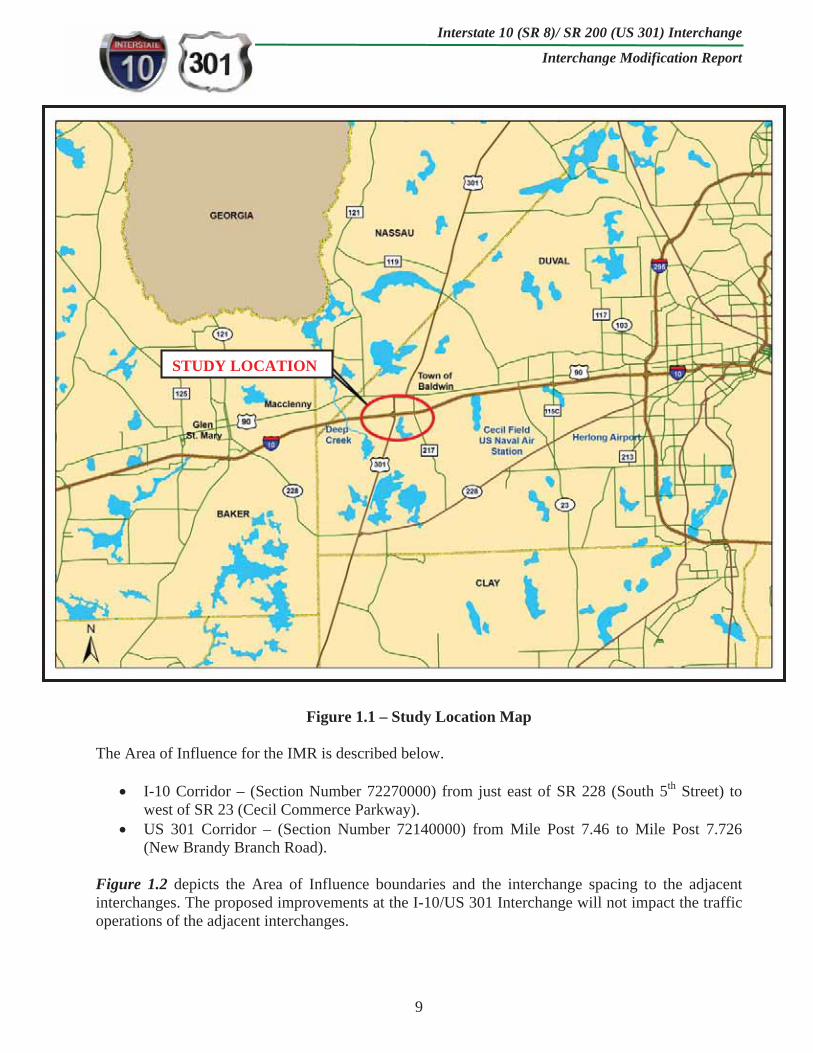
The study area for the I-10/US 301 Interchange IMR is the I-10 corridor from just east of the Nassau/Duval County Line to east of CR 217 (Yellow Water Road) and from 0.6 miles south of I-10 to New Brandy Branch Road along the US 301 corridor in Duval County, Florida (see Figure 1.1).The I-10/US 301 Interchange is located at Mile Post 3.2.
Interstate 10 (SR 8)/ SR 200 (US 301) Interchange
Interchange Modification Report
9
Figure 1.1 – Study Location Map
The Area of Influence for the IMR is described below.
I-10 Corridor – (Section Number 72270000) from just east of SR 228 (South 5th Street) to west of SR 23 (Cecil Commerce Parkway).US 301 Corridor – (Section Number 72140000) from Mile Post 7.46 to Mile Post 7.726 (New Brandy Branch Road).
Figure 1.2 depicts the Area of Influence boundaries and the interchange spacing to the adjacent interchanges. The proposed improvements at the I-10/US 301 Interchange will not impact the traffic operations of the adjacent interchanges.
STUDY LOCATION


Interstate 10 (SR 8)/ SR 200 (US 301) Interchange
Interchange Modification Report
11
The interchanges are listed below:
I-10/SR 228 Interchange – This interchange is in Baker County and is approximately 7.6 miles west of the I-10/US 301 Interchange. I-10/SR 23 Interchange – This interchange is in Duval County and is approximately 6.5 miles east of the I-10/US 301 Interchange.
The interchanges listed above will have insignificant changes in the travel demand due to the lengthy distance from the subject interchange. As part of this interchange proposal, a full interchange analysis was not performed at the adjacent interchanges.
The Area of Influence will include the following intersections along US 301:
I-10/US 301 Eastbound Ramp Terminal I-10/US 301 Westbound Ramp Terminal US 301/New Brandy Branch Road

Interstate 10 (SR 8)/ SR 200 (US 301) Interchange
Interchange Modification Report
12
II. METHODOLOGY
2.1 Overview
The methodology applied in this IMR is documented in the MLOU dated October 2007 and later revised in February 2012. The MLOU, a companion document to this IMR Study, was approved by FDOT District Two, FDOT Central Office Systems Planning and FHWA. The final MLOU was executed on February 23, 2012. The MLOU was revised in 2012 due to changes in the FDOT Work Program and the results from the Bridge Feasibility Study. The MLOU outlines the criteria, assumptions, processes, analyses and documentation requirements for the project. A copy of the two approved MLOUs is attached to this report as Appendix A. The following sections summarize some of the more prominent issues covered under the MLOU.
The traffic projections and volumes used for the interchange traffic analysis were gathered from the I-10 and US 301 Design Traffic Report, companion document to the PD&E study, dated March 2010 and later revised in April 2012. This report documents and discusses the following items:
Traffic Data Collection Peak Hour Volumes Traffic Factors Forecasting Methodology Existing and Projected Annual Average Daily Traffic (AADT) Existing and Projected Directional Design Hour Volumes (DDHV)
The report was later revised in April 2012 in order to include the traffic projections and volumes from the Baldwin Bypass PD&E Study. The Baldwin Bypass project is scheduled to be constructed by the year 2035. Therefore, the only volumes revised in the report were for the design year 2040.
2.2 Analysis Years
The analysis years proposed for this IMR are as follows:
Existing Year: 2007 Opening Year: 2020 Design Year: 2040
The IMR will analyze the opening year in order to be consistent with the bridge replacement construction schedule.
2.3 Travel Demand Forecasting
Future traffic forecast was based on the Northeast Regional Planning Model (NERPM) Version 4, I-10 Master Plan Study, dated April 2006 and area historical growth rates. The NERPM is the approved and validated model for the metropolitan area. The model base and design years of this version are 2005 and 2035. The NERPM4 model covers beyond the western urban boundary including Baker

Interstate 10 (SR 8)/ SR 200 (US 301) Interchange
Interchange Modification Report
13
County. US 301 is the urban/rural boundary along the I-10 corridor. The 2035 total traffic volumes for the I-10 corridor within the study area were analyzed using this version of the model. Based on the 2007 balanced volumes from the I-10 and US 301 Design Traffic Report an average annual growth rate was calculated. The average annual growth rate was found to be 2.23 percent. The forecast was compared to historic traffic counts.
A comparison of this approach and the model projections was performed to provide consistent and logical traffic forecasts. Table 2.1 shows the growth rates and traffic volumes.
Table 2.1 - I-10 Traffic Trends Growth Rates
SiteID Description 2007 Balanced
AADT NERPM4 2035 Total Volume
AnnualGrowth Rate
270135 200 feet west of SR 228 40,000 69,219 1.98%
273134 200 feet east of SR 228 41,600 78,756 2.31%
720109 At CR 217 overpass, east of US 301 51,800 89,276 1.96%
720832 0.5 mile east of Chaffee Road 51,800 134,187 2.95%
Average 2.23%
In order to preserve the I-10 Master Plan Study volume projections, it was determined that the master plan forecasts would be considered in the forecasting effort for this IMR study. The master plan included traffic forecasts for 2020 and 2030. The 2007 traffic counts formed the base year traffic for both forecast methods. The opening year 2020 and design year 2040 traffic volumes were generated as follows:
Grew all 2007 volumes by 2.2%. Held all ramps east of US 301 to the I-10 Master Plan Study volume numbers. In 2040, an independent model run was performed in order to determine how much additional traffic the Baldwin Bypass would attract within the area of influence. The Baldwin Bypass was found to attract approximately 5,000 additional trips. These additional 5,000 trips were added to the already grown 2040 volumes to develop the 2040 forecast.
2.4 Adjustment Procedures
AADT estimates were developed for the entire study area by following the process below:
1) 2007 Average Daily Traffic (ADT) volumes were computed by calculating the arithmetic mean of the 72-hour traffic counts.
2) The computed ADT volumes were converted to AADT by applying the applicable FDOT seasonal adjustment factors and axle correction factors from the 2006 Florida Traffic Information DVD.
3) 2007 AADT assignments for the study were generated by rounding and balancing the estimates that were developed from the steps above.

Interstate 10 (SR 8)/ SR 200 (US 301) Interchange
Interchange Modification Report
14
4) The generated 2007 and forecasted 2020 and 2040 AADT volumes were checked against historical data and the I-10 Master Plan Study forecasts for reasonableness.
DDHV volumes were developed for the entire study area by following the approved processes and techniques consistent with the FDOT’s Project Traffic Forecasting Handbook. Some of the key steps are listed below:
1) The DDHV volumes were computed by multiplying the K30 and D30 traffic factors times the AADT volumes.
2) Traffic data collected for the study area was examined to identify the common AM and PM peak hours.
3) The DDHV volumes were first established for the mainlines and ramps by balancing the calculated volumes. The volumes developed at the intersection approaches from this procedure were used as control values in the subsequent development of the intersection turning movement volumes.
4) The turning movement volumes were then refined by adjusting and balancing the volumes along the arterial segments. The turning movement percentages from the traffic counts were applied to the DDHV volumes to develop the intersection turning movement volumes. This is the FDOT approved procedure from the Project Traffic Forecasting Handbook, Section 2.6, which emphasizes the development of volumes using the K30 and D30 traffic factors.
5) The peak hour volumes developed for the study area were checked for reasonableness. Checks involved comparing directional volumes generated for the peak hours with local knowledge of travel patterns within the study area and observations made during field reviews.
2.5 Traffic Factors
The traffic factors for this study, shown in Table 2.2, were developed by using the following sources and documented in the MLOU:
2007 FDOT Planning Traffic Counts 2008 Florida Traffic Information DVD Recommendations from the I-10 and US 301 Design Traffic Report
Table 2.2 – Facility Traffic Factors
Facility 2007 2020 2040
K30(%)
D30(%)
T24(%)
K30(%)
D30(%)
T24(%)
K30(%)
D30(%)
T24(%)
Interstate 10 (SR 8) 11 57 28 10 55 26 10 55 26
US 301 (SR 200) 11 59 35 10 60 28 10 60 28

Interstate 10 (SR 8)/ SR 200 (US 301) Interchange
Interchange Modification Report
15
2.6 Traffic Operational Analysis
The Highway Capacity Manual (HCM), 2000 Edition, as well as the Highway Capacity Software (HCS) Version 5.5 and Synchro Version 7.0 were used for the operational analysis in this study. Operational analyses were performed on mainline segments, ramp merge/diverge, weaving sections and ramp terminals. The operational analysis also included cross street links and intersection analysis along US 301. The HCS was used for the interstate mainline segments and ramp merge/diverge and weaving sections. Synchro was used for the arterial and intersection analysis including the ramp terminals. This software uses the methodology of the HCM to determine intersection capacity and LOS. This analysis was performed for the existing conditions and the selected Build Alternative. In addition, a preliminary simulation was performed using the SimTraffic software to provide a detailed look at the simulated traffic flow. Due to the rural nature of this project, the need for more complex micro-simulation software modeling like CORSIM was not performed.
III. EXISTING CONDITIONS
3.1 Existing Land Use
The existing land use within the Area of Influence is a mix of agricultural, industrial and residential with isolated commercial uses. The I-10/US 301 Interchange is immediately surrounded by commercial and heavy industrial land uses. The Area of Influence includes undeveloped lands and businesses serving the trucking industry such as truck stops, motels and auto parts stores located directly adjacent to the I-10/US 301 Interchange. Heavy industrial land uses associated with the CSX railroad maintenance yard are located east of the interchange.
The existing land use is mostly industrial to the south of I-10 and low density residential to the north of I-10. As the I-10 corridor has become more densely developed, commercial/industrial land uses have displaced residential development, especially near the interchanges. Figure 3.1 shows the existing land uses within the vicinity of the project area.
Developments of Regional Impacts (DRI) have historically been proposed in the City of Jacksonville along the I-10 corridor in western Duval County. Based on the Northeast Florida Regional Council project list, there are no DRIs within the vicinity of the study area.

Interstate 10 (SR 8)/ SR 200 (US 301) Interchange
Interchange Modification Report
16
Figure 3.1 – Existing Land Use Map

Interstate 10 (SR 8)/ SR 200 (US 301) Interchange
Interchange Modification Report
17
3.2 Existing Roadway Network
3.2.1 Functional Classification
FDOT’s Straight Line Diagrams for Duval County indicate that the section of I-10, just west of US 301, is classified as a four-lane rural principal arterial and east of US 301, including the interchange, is classified as a four-lane urban principal arterial. US 301 is classified as a four-lane urban principal arterial and provides access to areas north and south of I-10. In general, arterial roadways provide direct service between cities and larger towns, which generate and attract a large proportion of the relatively longer trips. The existing speed limit along I-10 is posted at 70 MPH and 45 MPH along US 301 within the study limits. The access management classification within the study limits along I-10 is Class 1 Freeway and along US 301 is Class 3 Restrictive where medians physically prevent vehicle crossing between intersections.
I-10 and US 301 are both part of the Strategic Intermodal System (SIS), Florida Intrastate Highway System (FIHS) and National Highway System (NHS). I-10 is a major highway in the State of Florida and is the main provider of east-west travel in north Florida.
3.2.2 Typical Section
The existing roadway typical section along I-10 varies slightly, consisting primarily of four twelve-foot (12’) wide travel lanes with a sixty four-foot (64’) wide depressed grass median, two eight-foot (8’) inside shoulders (four-foot paved and four-foot unpaved), two twelve-foot (12’) outside shoulders (ten-foot paved and two-foot unpaved) and roadside swales (see Figure 3.2). The existing right-of-way width is 300 feet wide throughout the study limits. The right-of-way is standard throughout the corridor except at the interchanges, where it varies to accommodate entrance and exit ramps. An extended acceleration lane (3,970’) is located along I-10 in the eastbound direction just east of US 301 to help trucks accelerate before merging with the I-10 traffic (seeFigure 3.3).
The existing roadway typical section along US 301 varies slightly, consisting primarily of four twelve-foot (12’) wide travel lanes with a fifty six-foot (56’) wide depressed grass median, two eight-foot (8’) inside unpaved shoulders, two eleven-foot (11’) outside shoulders (four-foot paved and seven-foot unpaved) and roadside swales (see Figure 3.4). The existing right-of-way width varies from 164 to 205 feet wide throughout the study limits. Deceleration and acceleration lanes exist along the median in order to accommodate vehicles turning left across the US 301 corridor to the adjacent business driveways.

Interstate 10 (SR 8)/ SR 200 (US 301) Interchange
Interchange Modification Report
18
Figure 3.2 – I-10 Existing Four-Lane Divided Rural Roadway Typical Section (West of US 301)
EXIS
TIN
G C
ON
DIT
ION
S
4-LA
NE
DIV
IDED
RO
ADW
AY
–TY
PIC
AL
SEC
TIO
N(W
est o
f US
301)
EXIS
TIN
G C
ON
DIT
ION
S
4-LA
NE
DIV
IDED
RO
ADW
AY
–TY
PIC
AL
SEC
TIO
N(W
est o
f US
301)

Interstate 10 (SR 8)/ SR 200 (US 301) Interchange
Interchange Modification Report
19
Figure 3.3 – I-10 Existing Four-Lane Divided Rural Typical Section (East of US 301)
EXIS
TIN
G C
ON
DIT
ION
S
4-LA
NE
DIV
IDED
RO
ADW
AY
–TY
PIC
AL S
ECTI
ON
(Eas
t of U
S 30
1)
EXIS
TIN
G C
ON
DIT
ION
S
4-LA
NE
DIV
IDED
RO
ADW
AY
–TY
PIC
AL S
ECTI
ON
(Eas
t of U
S 30
1)

Interstate 10 (SR 8)/ SR 200 (US 301) Interchange
Interchange Modification Report
20
Figure 3.4 – US 301 Existing Four-Lane Divided Rural Typical Section
EXIS
TIN
G C
ON
DIT
ION
S
4-LA
NE
DIV
IDED
RO
AD
WA
Y –
TYPI
CA
L SE
CTI
ON
EXIS
TIN
G C
ON
DIT
ION
S
4-LA
NE
DIV
IDED
RO
AD
WA
Y –
TYPI
CA
L SE
CTI
ON

Interstate 10 (SR 8)/ SR 200 (US 301) Interchange
Interchange Modification Report
21
3.3 Alternative Travel Modes
No multimodal facilities such as existing bicycle facilities or transit routes exist within the study area. The closest transit route to the study area is located approximately one mile north along US 90 (Beaver Street). The bus route service is called the Baldwin Commuter Shuttle, managed and operated by the Jacksonville Transportation Authority. The Baldwin Commuter Shuttle is an innovative service that combines the benefits of express bus service with the convenience of a door-to-door on-demand service. During the peak morning and afternoon hours, the shuttle will express commuters to and from Baldwin and Macclenny to destinations in downtown Jacksonville, along US 90 (Beaver Street). Figure 3.5 illustrates the bus route, schedule and stops.
Multimodal alternatives such as bus transit, high occupancy vehicle lanes and pedestrians or bicycle improvements will not meet the needs for this project because of the rural conditions and travel patterns within the interchange. Multimodal alternatives will not improve the current and future traffic conditions within the interchange area.


Interstate 10 (SR 8)/ SR 200 (US 301) Interchange
Interchange Modification Report
23
3.4 Interchanges
The existing interchange design is a partial cloverleaf AB type with straight and loop ramps serving all movements located along the west side of the interchange. This configuration was chosen at the time of construction for its relatively small footprint and to avoid conflict with the CSX railroad maintenance yard. The railroad maintenance yard is located along the east side of US 301.
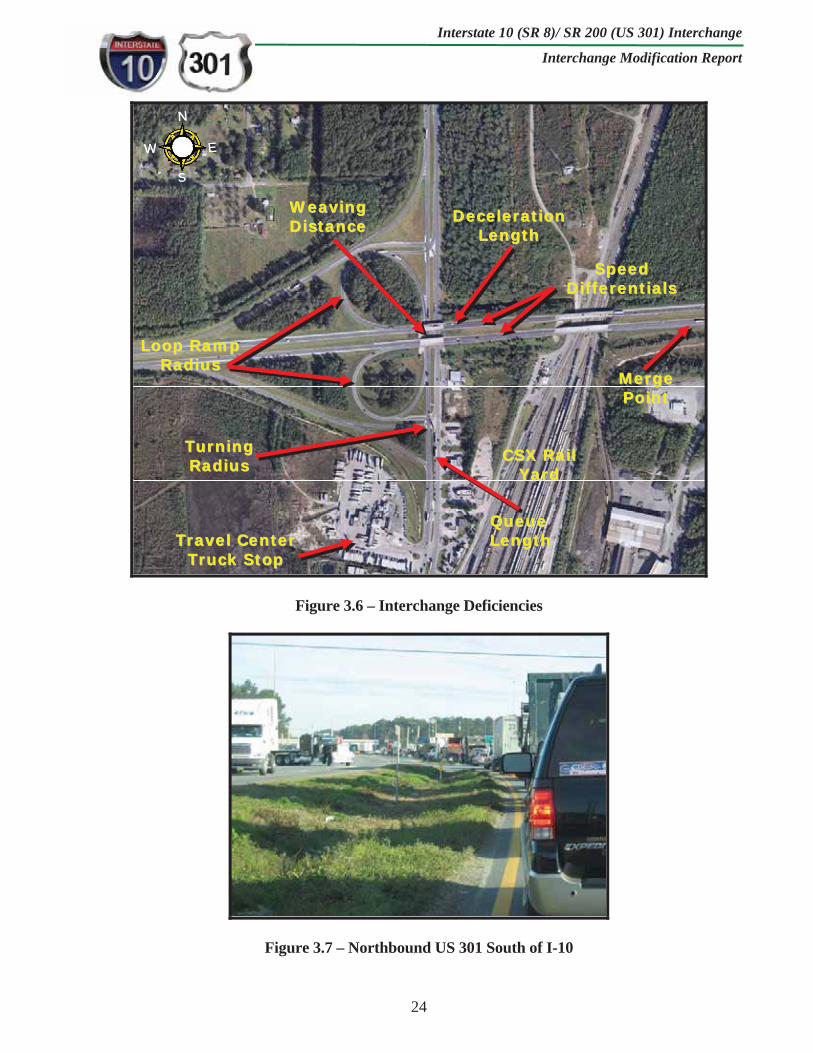
The current interchange does not conform to the current FDOT roadway geometric standards. Some of these deficiencies include (see Figure 3.6):
Substandard loop ramp and turning radii design (low design speed). The geometric design of the loop ramps does not meet current design speed standards. Loop ramps need to be designed with a radius that accommodates a design speed of 50 percent of the mainline design speed, or in this case a 35 MPH design. The existing loop ramps have a minimum radius of 230 feet which correspond with design speeds of 25 MPH based on current standards. Speed differentials within the interchange limits. The change in design speed between the mainline and ramps (entering and exiting) causes a significant difference in the travel speeds of vehicles that decelerate in the I-10 mainline for the exit ramp or are accelerating for the entrance ramp. The merging traffic (especially trucks) from US 301 to eastbound I-10 must climb to achieve the grade at the merge point with I-10, and when on I-10, continue to climb to clear the CSX railroad maintenance yard crossing just east of the existing ramp gore. This upgrade flow contributes to the speed differential between the mainline and ramp traffic. This speed differential increases the density of vehicles in the outside travel lanes within the ramp area of influence. Insufficient I-10 westbound exit ramp deceleration length. The current posted speed of the ramp is 25 MPH with a deceleration length of 880 feet. The change in the design speed causes a significant difference in the travel speeds of vehicles that decelerate in the I-10 mainline for the westbound exit ramp. Insufficient queue storage bay length along US 301. The current storage bays cannot accommodate the heavy demand for the northbound US 301 to eastbound I-10 on-ramp and the median access to the truck stops (see Figure 3.7).Short weaving distance between the loop ramps along US 301 southbound. The current distance between the two loop ramps is approximately 400 feet. Limited access right-of-way along US 301 does not meet current standards. Private driveways are currently located within the two ramp terminals creating poor operational conditions at the ramp terminals and increasing the probability of crashes. Substandard access management along US 301 south of I-10. A total of eleven (11) businesses surround the interchange with only one (1) span wire traffic signal and multiple median crossings that do not meet current spacing criteria. Substandard sight distance along I-10 within the interchange limits. The current I-10 profile within the interchange limits corresponds to a design speed of 55 MPH based on current standards. The posted speed for I-10 is 70 MPH. Substandard vertical bridge clearance under the I-10 bridge structures over US 301. Substandard vertical bridge clearance under the I-10 bridge structures over the CSX railroad yard. Substandard surface deck on the I-10 bridge structures over the CSX railroad yard.
Interstate 10 (SR 8)/ SR 200 (US 301) Interchange
Interchange Modification Report
24
Figure 3.6 – Interchange Deficiencies
Figure 3.7 – Northbound US 301 South of I-10
MMeerrggeePPooiinntt
CCSSXX RRaaiillYYaarrdd
WWeeaavviinnggDDiissttaannccee DDeecceelleerraattiioonn
LLeennggtthh
LLoooopp RRaammppRRaaddiiuuss
TTuurrnniinnggRRaaddiiuuss
QQuueeuueeLLeennggtthhTTrraavveell CCeenntteerr
TTrruucckk SSttoopp
N
S
EW
N
S
EW
SSppeeeeddDDiiffffeerreennttiiaallss

Interstate 10 (SR 8)/ SR 200 (US 301) Interchange
Interchange Modification Report
25
The recommended alternative from the Bridge Feasibility Study was to replace the bridges over the CSX railroad maintenance yard in the next ten (10) years (by 2020). The bridges will need to be replaced due to the following deficiencies:
Substandard vertical bridge clearance Substandard horizontal bridge clearance Substandard surface deck Substructure concrete spallings Substandard vertical curve
Raising the vertical elevation of these bridges to meet current FDOT standards will require the I-10 mainline vertical profile (profile grade line) to be raised east and west of the interchange. Due to the close proximity of the I-10 bridges over US 301 to the bridges over CSX, the change in profile will also require the replacement of the US 301 bridges.
In order to be able to replace the bridges and maintain the existing number of interstate through lanes at all times during construction, improvements to the interchange access will be needed and must be in place before the replacement of the bridges. This IMR documents and addresses the improvements needed to replace the bridges.
IV. EXISTING OPERATIONAL PERFORMANCE
4.1 Existing Traffic Data
The traffic data collection was coordinated with FDOT in order to determine the type and location of the counts for the study. The traffic data collection efforts are documented in the I-10 and US 301 Design Traffic Report, companion document to the PD&E study, dated March 2010 and later revised in April 2012. The data collection for the traffic analysis consisted of taking a field inventory of the number of lanes, lane transitions and traffic counts. Figure 4.1 depicts the existing interchange lane configuration including the number of lanes and intersections. Signal timing data was retrieved from the City of Jacksonville Traffic Operations Division and compared with field operations. Traffic counts and turning movement counts were conducted for the I-10 ramps, intersections and arterial links along US 301 during the middle of an average week (Tuesday, Wednesday and Thursday from September 25 through September 27, 2007) while no special events were occurring. The raw hose and turning movement count data were analyzed using a peak hour frequency analysis to determine which peak hours represented the AM and PM peaks. The AM peak hour was from 6:30-7:30 AM and the PM peak hour was from 4:45-5:45 PM.
As described in Section 2.4, 2007 AADT and DDHV volumes were developed for the entire study area by following the approved processes and techniques consistent with the FDOT’s Project Traffic Forecasting Handbook. The 2007 existing AADT and DDHV volumes are shown on Figures 4.2 and 4.3. The existing traffic data is five years old at the time of this report. In order to decide if new traffic counts were needed for the study, the last five years (2007-2011) of traffic data was obtained from the 2011 Florida Transportation Information (FTI) DVD. The data shows that the 2011 AADT volumes were the same or lower when compared to the 2007 AADT volumes reported in the 2011 FTI. Therefore, new counts were not needed. Figure 4.2 also shows the historic AADT volumes.


Interstate 10 (SR 8)/ SR 200 (US 301) Interchange
Interchange Modification Report
29
4.2 Level of Service
This section presents the analysis results for the existing lane configuration under existing traffic conditions. An existing traffic operational analysis was conducted for the 2007 base condition for the mainlines, ramps, intersections and ramp terminals within the I-10/US 301 Interchange. The first part of the analysis consisted of a basic freeway segment analysis used to determine the current conditions under which the I-10 mainline is operating. Level of Service (LOS) and densities for each analyzed segment were determined as a baseline to compare with proposed modifications to this facility. The second part of the analysis consisted of a ramp merge, diverge and weaving analysis used to determine the current operating conditions of the ramps entering and exiting I-10 and US 301. LOS and densities were also used as measures of effectiveness for this analysis. The third part of the analysis consisted of determining the LOS and delay at each ramp terminal and intersection along US 301. The 2000 HCM classifies roadway capacity based on LOS A through F, where LOS A represents a roadway operating below capacity (free-flow conditions with little or no delays) and LOS F suggests a roadway is operating above design capacity (congested traffic with forced flow conditions at very low operating speeds). The analysis was conducted using the latest versions of the HCS and Synchro.
The FDOT’s Statewide Minimum LOS Standards for the State Highway System were adopted by Administrative Rule in 1992 (Rule Chapter No. 14-94) and are described in the 2009 Quality/Level of Service Handbook. The LOS standard (based on area and facility type) that will be used for the I-10 and US 301 corridors and interchange is LOS D (urban).
4.2.1 Basic Freeway Segment Analysis
The I-10 mainline, within the study area, was divided into four (4) different segments for the purpose of evaluating each segment independently for the existing conditions. The LOS for each segment was determined using the freeway module of the HCS. A summary of the input variables as well as the output obtained from the application are provided as part of Appendix B. Table 4.1 summarizes the most determinant factors that were used as well as the LOS obtained for each one of the segments for the existing condition.

Interstate 10 (SR 8)/ SR 200 (US 301) Interchange
Interchange Modification Report
30
152
2
2
11
11
15
2
Eastbound I-10 (SR 228 to US 301)
Eastbound I-10 (US 301 to SR 23*)
Westbound I-10 (SR 23 to US 301)
Westbound I-10 (US 301 to SR 228) 7.6
7.6
6.5
6.5
2007
2007
2007
2007
Table 4.1 - Basic Freeway Segment AnalysisInterstate 10 (Existing Conditions)
LOSSegment Year # of Lanes
Truck % DDHV (veh/h)
Segment Distance
(mi)
Density Range
(pc/mi/ln)
2,290 (1,870) 19.1 (15.6) C (B)
2,850 (2,330) 23.6 (19.1) C (C)
2,330 (2,850) 19.1 (23.6) C (C)
1,870 (2,290) 15.6 (19.1) B (C)
Note: Density and LOS values are Peak Period Scenarios AM (PM). LOS is interpreted from HCM 2000 for Basic Freeway Segments (Page 23-3). Peak Hour Factor = 0.92 for 2007. Truck % = T24/2 * SR 23 = Cecil Commerce Parkway
The capacity analysis shows that I-10 currently is operating at an acceptable LOS C or better.
4.2.2 Ramp Merge/Diverge/Weaving Analysis
For this analysis, four (4) ramps were analyzed within the I-10/US 301 Interchange. Two (2) ramps were identified along I-10 in the eastbound direction and two (2) in the westbound direction. Also a weaving analysis was performed between the two (2) loop ramp terminals along US 301 in the southbound direction. The LOS for each ramp was determined using the ramp and weaving modules of the HCS. Various assumptions and variables are necessary to run HCS successfully, and these variables must accurately reflect the features of the roadway that affect operations. One of the critical variables required, related specifically to trucks and other large vehicles, is known as passenger car equivalents (PCE). The HCM defines PCE as “The number of passenger cars that are displaced by a single heavy vehicle of a particular type under prevailing roadway, traffic and control conditions”. Reasons PCE’s are critical in this analysis include the fact that trucks are larger and have different operating characteristics compared to cars. The current HCS has a limitation of a maximum of 25% trucks per movement. Based on the traffic data collection and field reviews it was found that some of the ramps and turning movement volumes exceed the 25% HCS limitation. In order to maintain the usage of the software, manual calculation (using HCM 2000 equations) of the heavy vehicle adjustment factors and flow rates (see equations below) were performed and then entered to the HCS ramp and weaving modules for the traffic streams with a truck percentage greater than 25%.
Interstate 10 (SR 8)/ SR 200 (US 301) Interchange
Interchange Modification Report
31
Heavy Vehicle Adjustment Factor = fHV = ______1______ 1 + PT (ET – 1)
Peak 15-minute Flow Rate = Vi = _____ V______ PHF x fHV x fp
Where: PT = Percentage of trucks in the traffic stream ET = Passenger car equivalents for trucks in the traffic stream PHF = Peak hour factor fp = driver population factor
After the flow rates were calculated manually, they were entered directly into the software with the following modifications to the module:
Input volume (DDHV) = Peak 15-minute Flow Rate (calculated above) PHF = 1.0Truck percentage = 0%
The modifications listed above will preserve the input volumes, preventing the software module from calculating the peak 15-minute flow rate for a second time. A summary of the input variables as well as the output obtained from the application are provided as part of Appendix B. In order to understand the high truck movements and truck patterns within the area, a truck percentage by movement was collected during the traffic data collection efforts (see Figure 4.4). Tables 4.2 and 4.3 summarize the most determinant factors that were used as well as the LOS obtained for each ramp for the existing condition.


Interstate 10 (SR 8)/ SR 200 (US 301) Interchange
Interchange Modification Report
33
Note: Density and LOS values are Peak Period Scenarios AM (PM). LOS is interpreted from HCM 2000 for Merge and Diverge Areas (Exhibit 25-4). Peak Hour Factor = 0.92 for 2007.
All system merge and diverge ramps analyzed are currently operating at an acceptable LOS C.
Density Range
(pc/mi/ln)
Table 4.3 - Ramp Weaving Analysis Type AI-10/US 301 Interchange (Existing Conditions)
Segment YearWeaving
# of Lanes
Segment Distance (ft)
Volume Ratio LOS
B (B)Southbound US 301
(Between I-10 WB Loop Ramp and I-10 EB Loop Ramp )
3 4002007 0.85 (0.74) 14.06 (11.20)
Note: Density and LOS values are Peak Period Scenarios AM (PM). LOS is interpreted from HCM 2000 for Weaving Segments (Exhibit 24-2). Peak Hour Factor = 0.92 for 2007.
The 2007 weaving analysis along US 301 (under I-10) shows that it is currently operating at LOS B. However, according to HCS, three-lane Type A segments do not operate well at volume ratios greater than 0.45. Poor operations and some local queuing are expected in such cases.
Arterial weaving is most problematic on street segments associated with large turning volumes. Such volumes are often found near interchanges just like this one where a high number of cars and trucks have been observed entering and exiting I-10 and performing u-turns at the intersections between the southbound weaving area. For example, u-turns were observed north of I-10 by drivers bypassing the northbound left- turn lane lengthy queue south of I-10.
Also intensive truck weaving activity was observed on the segment between the interchange off-ramp terminal and the adjacent signalized intersection due to these u-turns.
DensityRange
(pc/mi/ln)
Table 4.2 - Ramp Merge/Diverge AnalysisI-10/US 301 Interchange (Existing Conditions)
Ramp Junction Year Ramp # of Lanes
I-10 # of
Lanes
Truck%
DDHV(veh/h) LOSRamp
Type
AccelerationDecelerationDistance (ft)
Westbound I-10 (US 301 to I-10)
580 (710)
On-Ramp (Merge)
2Off-Ramp (Diverge)
4 (10)
Off-Ramp (Diverge)
Westbound I-10 (I-10 to US 301)
B (C)
22.8 (18.5) C (B)2007
2007
2007
2007 19.9 (23.7)1 2
Eastbound I-10 (I-10 to US 301) 1 2
1 2Eastbound I-10 (US 301 to I-10)
375
On-Ramp (Merge) 3,970
1 880
8 (32)
13 (15)
38 (17)
500 150 (120)
710 (580)
120 (150)
21.4 (16.8) C (B)
19.3 (24.4) B (C)

Interstate 10 (SR 8)/ SR 200 (US 301) Interchange
Interchange Modification Report
34
4.2.3 Arterial and Intersection Analysis
The Synchro traffic software was used to compute the roadway LOS, based on the HCM methodology. The desired LOS for this study area is LOS D or better. The US 301 overall LOS depends on the intersection and arterial LOS. Intersection LOS corresponds to the average delay experienced by a vehicle passing through a given intersection. Arterial LOS, in this case a four-lane signalized roadway, is a function of the average travel speed through the project segment.
The US 301 LOS analysis included three (3) intersections within the study limits. Figure 4.1graphically shows the existing intersections and lane configurations.
I-10 Eastbound Ramps Signalized Intersection I-10 Westbound Ramps Unsignalized Intersection New Brandy Branch Road Unsignalized Intersection
Tables 4.4-4.5 summarize the operational analysis results for the signalized and unsignalized intersections. Table 4.6 summarizes the arterial analysis. The 2007 LOS calculations were based on the existing timing and phasing configurations along US 301. The existing timing data information was provided by the City of Jacksonville Traffic Operations Division (see Appendix C).
A preliminary simulation was performed using the SimTraffic software to provide a detailed look at the micro-simulation. The SimTraffic simulation model was also developed to verify the operational function of the Synchro model and perform edits and changes to correct input mistakes and accommodate unique features. This effort involved establishing reasonable saturation rates, balanced truck percentages, turning speeds, adjusting the mandatory lanes distances, adjusting lane geometry as well as usage assignment to replicate observed operational behaviors. This process does not imply that the model is completely calibrated. The process to calibrate the Synchro model requires significant time and effort. However, collected field data such as queue lengths and knowledge of vehicular traffic operations was compared to the running of the SimTraffic model. The Synchro model was adjusted as close as possible to match the observed field conditions.
Delay(sec)
552 (549)2007 1.01 (1.00) 42.3 (42.7) D (D)I-10 Eastbound Ramps
Intersection Year Maximum v/c LOS
Table 4.4 - Intersection Analysis - Signalized IntersectionsUS 301 (Existing Conditions)
NB to EB Left-Turn Lane
Queue (ft)
Note: v/c, Delay and LOS values are Peak Period Scenarios AM (PM). LOS is interpreted from HCM 2000 for Signalized Intersections (Exhibit 16-2). Peak Hour Factors from 2007 Traffic Data Collection. 95th percentile volume exceeds capacity, queue is anticipated to be longer after two cycles.

Interstate 10 (SR 8)/ SR 200 (US 301) Interchange
Interchange Modification Report
35
Table 4.4 summarizes the LOS of the US 301 signalized intersection with the I-10 eastbound ramps. This intersection experiences significant queuing in the northbound direction. The critical movement at this intersection is the northbound left-turn movement. This long queue was observed to extend past the current available storage bay blocking access to and from Boxcar Drive and the adjacent driveways causing traffic operational conflicts within the median openings and with the northbound mainline flow. Issues were also observed in the southbound direction where semi-trailer trucks and other vehicles coming from the two major truck stops along the westside of US 301 block the southbound mainline traffic flow while trying to squeeze in into the few to none traffic gaps to merge with the northbound traffic flow.
Approach
Control Delay (sec)
EBLT, NBLT EBLT, NBLT
2007 16.1 (25.0), 8.5 (8.7) C (C), A (A)
EB , NBLT EB , NBLT
2007 11.9 (11.3), 8.3 (8.1) B (B), A (A)New Brandy Branch Road
I-10 Westbound Ramps
Table 4.5 - Intersection Analysis - Unsignalized IntersectionsUS 301 (Existing Conditions)
Intersection Year LOS
Note: v/c, Delay and LOS values are Peak Period Scenarios AM (PM). LOS is interpreted from HCM 2000 for Unsignalized Intersections (Exhibit 17-2). Peak Hour Factors from 2007 Traffic Data Collection. EBLT, NBLT, EB = Eastbound Left Turn, Northbound Left Turn, Eastbound.
Table 4.5 shows that the unsignalized intersections within the interchange area are currently operating at LOS C or better during the peak hour periods.
US 301, within the interchange limits, will experience severe intersection congestion and delays with an anticipated LOS F by the year 2020 if improvements are not considered. The amount of truck traffic is expected to increase due to the closure of the I-10 rest areas just east of US 301 and the current and projected growth of the Jacksonville Port Authority. The rest areas were closed and removed from the corridor to accommodate the new Cecil Commerce Parkway. The expansion of the port and new seaport container facilities are making Jacksonville one of the largest container ports on the east coast. It is estimated that 70% of the containers that come through the port will be handled by trucks.
The only intersection not affected within the study area is New Brandy Branch Road. This is a local rural low volume residential roadway that provides access to a small community.

Interstate 10 (SR 8)/ SR 200 (US 301) Interchange
Interchange Modification Report
36
Average Travel Speed(mph)
2007 Northbound 37.3 (36.6) A (A)
2007 Southbound 25.1 (24.3) C (C)US 301
Table 4.6 - Arterial AnalysisUS 301 (Existing Conditions)
Roadway Year Direction LOS
Note: Speed and LOS values are Peak Period Scenarios AM (PM). LOS is interpreted from HCM 2000 for Suburban Class II Roadway (Exhibit 15-2).
Table 4.6 shows that US 301 is currently experiencing LOS C or better. The arterial LOS in the southbound direction is dictated by the delay at the I-10 eastbound ramps signal. The signal at this ramp intersection is a three-phase operation with the maximum green time assigned to the northbound left-turn movement. The southbound mainline approach is the opposite movement to the critical movement having to wait longer for the green time phase.
Figures 4.5 and 4.6 show a summary of the LOS results for the 2007 existing conditions.


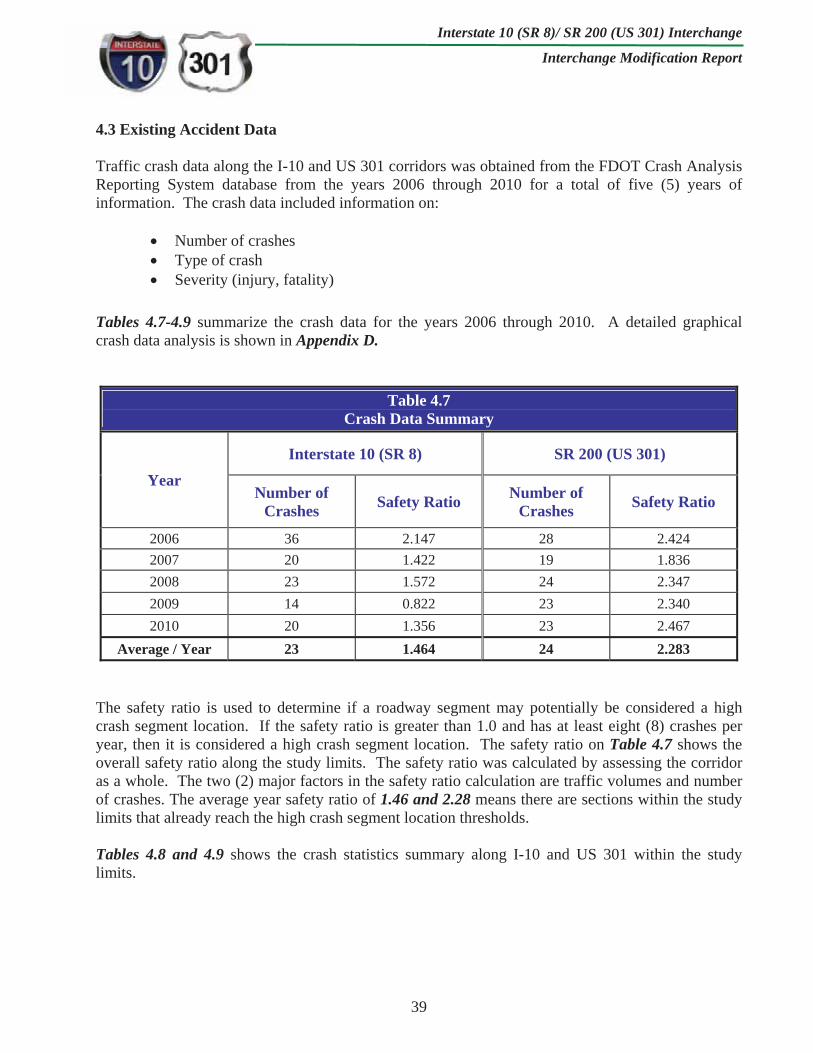
Interstate 10 (SR 8)/ SR 200 (US 301) Interchange
Interchange Modification Report
39
4.3 Existing Accident Data
Traffic crash data along the I-10 and US 301 corridors was obtained from the FDOT Crash Analysis Reporting System database from the years 2006 through 2010 for a total of five (5) years of information. The crash data included information on:
Number of crashes Type of crash Severity (injury, fatality)
Tables 4.7-4.9 summarize the crash data for the years 2006 through 2010. A detailed graphical crash data analysis is shown in Appendix D.
Table 4.7 Crash Data Summary
YearInterstate 10 (SR 8) SR 200 (US 301)
Number of Crashes Safety Ratio Number of
Crashes Safety Ratio
2006 36 2.147 28 2.424 2007 20 1.422 19 1.836 2008 23 1.572 24 2.347 2009 14 0.822 23 2.340 2010 20 1.356 23 2.467
Average / Year 23 1.464 24 2.283
The safety ratio is used to determine if a roadway segment may potentially be considered a high crash segment location. If the safety ratio is greater than 1.0 and has at least eight (8) crashes per year, then it is considered a high crash segment location. The safety ratio on Table 4.7 shows the overall safety ratio along the study limits. The safety ratio was calculated by assessing the corridor as a whole. The two (2) major factors in the safety ratio calculation are traffic volumes and number of crashes. The average year safety ratio of 1.46 and 2.28 means there are sections within the study limits that already reach the high crash segment location thresholds.
Tables 4.8 and 4.9 shows the crash statistics summary along I-10 and US 301 within the study limits.

Interstate 10 (SR 8)/ SR 200 (US 301) Interchange
Interchange Modification Report
40
2006 2007 2008 2009 2010
Rear End 6 5 5 4 2 22 19.47% 4
Head On 1 1 1 0 0 3 2.65% 1
Angle 0 0 2 3 1 6 5.31% 1
Left Turn 0 0 0 0 0 0 0.00% 0
Right Turn 0 0 0 0 0 0 0.00% 0
Sideswipe 9 3 4 2 1 19 16.81% 4
Backed Into 0 0 0 0 0 0 0.00% 0
Collision with Parked Car 0 0 0 0 0 0 0.00% 0
Collision with Pedestrian 0 0 0 0 0 0 0.00% 0
Collisions with Bicycle 0 0 0 0 0 0 0.00% 0
Fixed Object 10 7 5 3 7 32 28.32% 6
Ran Off Road 2 0 1 1 0 4 3.54% 1
Overturned 1 0 1 0 1 3 2.65% 1
Other 7 4 4 1 8 24 21.24% 5
TOTAL CRASHES 36 20 23 14 20 113 100.00% 23
Clear 14 11 9 9 9 52 46.02% 10
Cloudy 10 2 5 1 3 21 18.58% 4
Rain 11 7 9 4 8 39 34.51% 8
Fog 0 0 0 0 0 0 0.00% 0
Other 1 0 0 0 0 1 0.88% 0
Dry 21 11 12 10 11 65 57.52% 13
Wet 12 9 11 4 9 45 39.82% 9
Other 3 0 0 0 0 3 2.65% 0.6
January 2 1 4 1 3 11 9.73% 2
February 4 2 0 1 1 8 7.08% 2
M arch 2 4 3 0 2 11 9.73% 2
April 4 1 1 0 0 6 5.31% 1
M ay 3 1 1 1 3 9 7.96% 2
June 10 1 2 3 0 16 14.16% 3
July 0 1 4 1 4 10 8.85% 2
August 5 0 0 0 2 7 6.19% 1
September 1 2 2 1 1 7 6.19% 1
October 1 2 1 3 0 7 6.19% 1
November 1 3 4 0 1 9 7.96% 2
December 3 2 1 3 3 12 10.62% 2
Sunday 5 2 6 1 1 15 13.27% 3
M onday 7 2 3 2 1 15 13.27% 3
Tuesday 6 2 0 2 3 13 11.50% 3
Wednesday 5 5 4 3 2 19 16.81% 4
Thursday 4 2 5 0 4 15 13.27% 3
Friday 6 5 2 4 3 20 17.70% 4
Saturday 3 2 3 2 6 16 14.16% 3
00:00-06:00 3 4 4 2 1 14 12.39% 3
06:00-09:00 5 3 2 0 4 14 12.39% 3
09:00-11:00 3 3 1 3 2 12 10.62% 2
11:00-13:00 0 2 2 2 1 7 6.19% 1
13:00-15:00 4 2 1 2 3 12 10.62% 2
15:00-18:00 11 3 6 3 6 29 25.66% 6
18:00-24:00 10 3 7 2 3 25 22.12% 5
Table 4.8I-10 Crash Statistics Summary
MP 2.4 to MP 4.31
CRASH TYPE
5-YEA R T OT A L
C R A SH ES
P ER C EN T OF T OT A L
M EA N C R A SH ES P ER YEA R
C H A R A C T ER IST IC S T YP E OF C R A SHN UM B ER OF C R A SH ES
YEA R
HOUR OF DAY
WEATHER CONDITIONS
SURFACE CONDITIONS
M ONTH OF YEAR
DAY OF WEEK

Interstate 10 (SR 8)/ SR 200 (US 301) Interchange
Interchange Modification Report
41
2006 2007 2008 2009 2010
Rear End 5 3 3 6 9 26 22.22% 5
Head On 1 1 0 0 0 2 1.71% 0
Angle 6 5 7 4 3 25 21.37% 5
Left Turn 8 4 1 4 2 19 16.24% 4
Right Turn 0 0 1 0 1 2 1.71% 0
Sideswipe 4 2 2 7 5 20 17.09% 4
Backed Into 1 0 1 0 1 3 2.56% 1
Collision with Parked Car 0 0 0 0 0 0 0.00% 0
Collision with Pedestrian 1 0 2 0 1 4 3.42% 1
Collisions with Bicycle 0 0 0 0 0 0 0.00% 0
Fixed Object 0 0 2 0 0 2 1.71% 0
Ran Off Road 0 0 3 0 0 3 2.56% 1
Overturned 1 0 0 0 0 1 0.85% 0
Other 1 4 2 2 1 10 8.55% 2
TOTAL CRASHES 28 19 24 23 23 117 100.00% 23
Clear 18 12 14 12 15 71 60.68% 14
Cloudy 8 6 8 7 5 34 29.06% 7
Rain 1 1 2 4 3 11 9.40% 2
Fog 1 0 0 0 0 1 0.85% 0
Other 0 0 0 0 0 0 0.00% 0
Dry 25 17 21 19 20 102 87.18% 20
Wet 3 2 3 4 3 15 12.82% 3
Other 0 0 0 0 0 0 0.00% 0
January 2 2 2 2 0 8 6.84% 2
February 0 2 2 1 0 5 4.27% 1
M arch 5 1 2 1 4 13 11.11% 3
April 2 1 2 4 5 14 11.97% 3
M ay 3 1 3 3 3 13 11.11% 3
June 4 3 1 2 2 12 10.26% 2
July 3 2 4 4 1 14 11.97% 3
August 2 2 1 1 0 6 5.13% 1
September 3 1 1 1 2 8 6.84% 2
October 1 1 0 2 2 6 5.13% 1
November 2 1 4 0 3 10 8.55% 2
December 1 2 2 2 1 8 6.84% 2
Sunday 2 4 2 0 6 14 11.97% 3
M onday 6 3 4 4 2 19 16.24% 4
Tuesday 5 4 4 2 2 17 14.53% 3
Wednesday 3 0 5 2 2 12 10.26% 2
Thursday 6 4 4 5 4 23 19.66% 5
Friday 3 3 3 9 5 23 19.66% 5
Saturday 3 1 2 1 2 9 7.69% 2
00:00-06:00 0 1 4 0 0 5 4.27% 1
06:00-09:00 3 4 1 5 0 13 11.11% 3
09:00-11:00 3 1 1 4 1 10 8.55% 2
11:00-13:00 0 2 7 4 7 20 17.09% 4
13:00-15:00 7 4 4 4 8 27 23.08% 5
15:00-18:00 5 4 3 3 2 17 14.53% 3
18:00-24:00 10 3 4 3 5 25 21.37% 5
Table 4.9US 301 Crash Statistics Summary
MP 6.9 to MP 7.726
C H A R A C T ER IST IC S T YP E OF C R A SHN UM B ER OF C R A SH ES 5-YEA R
T OT A L C R A SH ES
P ER C EN T OF T OT A L
M EA N C R A SH ES P ER YEA R
YEA R
DAY OF WEEK
HOUR OF DAY
CRASH TYPE
WEATHER CONDITIONS
SURFACE CONDITIONS
M ONTH OF YEAR

Interstate 10 (SR 8)/ SR 200 (US 301) Interchange
Interchange Modification Report
42
In summary, Tables 4.8 and 4.9 show that fixed object collisions are the most common crashes and account for an average of 28% of the crashes along I-10. Rear-end collisions are the second most common with an average of 19% of the crashes and sideswipe collisions are the third most common with an average of 16.81% of the crashes along I-10. The high percentage of rear-end and sideswipe collisions along a freeway are typical of roadways experiencing heavy traffic congestion and weaving movements similar to the I-10/US 301 Interchange; whereas fixed object collisions are typical of roadways having poor geometry, restricted sight distance, inadequate delineation, inadequate shoulders and/or excessive speed.
Along US 301, rear-end collisions are the most common crashes and account for an average of 22.22% of the crashes. Angle collisions are the second most common with an average of 21.37% of the crashes and sideswipe collisions are the third most common with an average of 17.09% of the crashes along US 301. The high percentage of angle and rear end collisions along arterials are typical of roadways experiencing heavy traffic congestion and inadequate signal timing; whereas sideswipe collisions are typical of roadways experiencing heavy traffic congestion and weaving movements.
Figure 4.7 depicts the high crash areas within the interchange limits.

Interstate 10 (SR 8)/ SR 200 (US 301) Interchange
Interchange Modification Report
43
Figure 4.7 – High Crash Areas
TTrraavveell CCeenntteerrTTrruucckk SSttoopp
N
S
EW
N
S
EW
Legend High Crash Spots
High Crash Segments
PPiilloott TTrruucckkSSttoopp
CCSSXX RRaaiillrrooaadd
GGeerrddaauuAAmmeerriisstteeeell

Interstate 10 (SR 8)/ SR 200 (US 301) Interchange
Interchange Modification Report
44
Tables 4.10 and 4.11 summarize the information on the severity of the crashes in terms of injuries and fatalities.
Table 4.10 I-10 Crash Data by Severity
Year Number of Crashes
Number of Injury
Crashes
Number of Injuries
Number of Fatal
Crashes
Number of Fatalities
2006 36 19 27 0 0 2007 20 10 11 0 0 2008 23 12 28 0 0 2009 14 10 15 0 0 2010 20 5 8 0 0 Total 113 56 89 0 0
Average/Year 23 12 18 0 0
Table 4.10 shows the number of injuries on I-10 had remained relatively constant between the years 2007 and 2009, with a significant increase in the years 2006 and 2008, and a significant decrease in the year 2010. The same can be said with regards to the number of injury crashes. The average number of accidents per year over the 5-year period is twenty-three (23) crashes with eighteen (18) injuries.
Table 4.11 US 301 Crash Data by Severity
Year Number of Crashes
Number of Injury
Crashes
Number of Injuries
Number of Fatal
Crashes
Number of Fatalities
2006 28 14 20 1 1 2007 19 6 10 0 0 2008 24 4 6 1 1 2009 23 4 9 0 0 2010 23 6 7 1 1 Total 117 34 52 3 3
Average/Year 24 7 11 1 1
Table 4.11 shows the number of injuries on US 301 has been decreasing between the years 2006-2008. The number of injury crashes has remained relatively constant between the years 2007-2010. The same can be said with regards to the number of fatal crashes in years 2006, 2008, and 2010. The average number of accidents per year over the 5-year period is twenty-four (24) crashes with eleven (11) injuries and one (1) fatality.

Interstate 10 (SR 8)/ SR 200 (US 301) Interchange
Interchange Modification Report
45
4.4 Existing Environmental Constraints
This section presents a desktop screening and summary of pertinent existing conditions environmental information within the study area. Information of these environmental elements will be expanded and analyzed further in more detail during the PD&E study.
4.4.1 Cultural Resources
There are no historic resources or archaeological sites located within the project study limits. Figure 4.8 shows those facilities located closest to the study area.
4.4.2 Community Services
There are no community service facilities located within the project study limits. Figure 4.9shows those facilities located closest to the study area. The facilities serve residents within the study area, but are all located outside the project study limits. Consequently, none of these facilities are expected to pose a Section 4(f) involvement from the proposed project.
Emergency Evacuation The Florida Division of Emergency Management has designated I-10 as a primary emergency evacuation route. I-10 has been modified to be able to convert all the lanes to travel in the westbound direction under hurricane evacuation conditions.

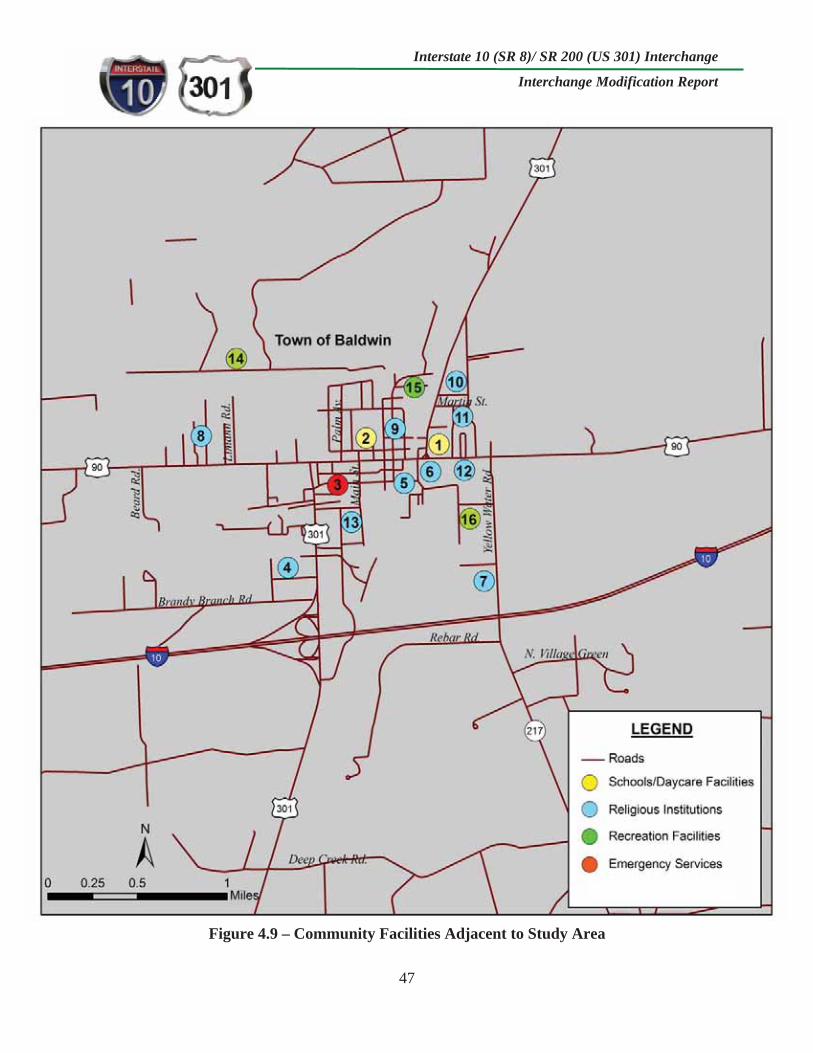
Interstate 10 (SR 8)/ SR 200 (US 301) Interchange
Interchange Modification Report
47
Figure 4.9 – Community Facilities Adjacent to Study Area

Interstate 10 (SR 8)/ SR 200 (US 301) Interchange
Interchange Modification Report
48
4.4.3 Natural and Biological Features
WetlandsWetlands within the study area were identified through the interpretation of current color aerial photographs (Aerials Express, 2010), St. Johns River Water Management District (SJRWMD) Land Use and Land Cover, United States Fish and Wildlife Service (USFWS) National Wetlands Inventory Map, Natural Resources Conservation Service (NRCS) Soils Survey of Jacksonville, Duval County, Florida and from wetland data previously collected for other studies in the area.
A handful of isolated wetland areas have been identified along the north side of the interchange and along the I-10 and US 301 corridors. Initial comments received from various agencies through the Environmental Screening Tool (EST) of the Efficient Transportation Decision Making (ETDM) process calls attention to these wetlands. These wetlands include forested and vegetated non-forested communities. Based on interpretive mapping, these wetlands primarily appear to be hydrologically isolated depressions not associated with named wetland systems. A wetlands map is included in Figure 4.10.
Water Quality The project is contained entirely in the St. Johns River Water Management District (SJRWMD) Planning Unit 2A. Unit 2A is the upper St. Mary’s River Unit of the St. Mary’s River Basin and outfalls into Deep Creek, a tributary of the St. Mary’s River. All waters in the St. Mary’s Basin are considered Class III. Water quality criteria for Class III waters should support the designated uses of recreation and the propagation and maintenance of a healthy, well-balanced population of fish and wildlife. Deep Creek is not listed as an impaired water body, therefore does not have established total maximum daily loads (TMDL). A TMDL is the maximum amount of a given pollutant that a waterbody can assimilate and remain healthy, such that all of its designated uses are met. However, FDOT requires that all stormwater management systems be designed to keep post development nitrogen and phosphorous discharge amounts below existing conditions.
FloodplainsThe proposed project limits fall within Flood Zone X as shown in the Federal Emergency Management Agency (FEMA) Flood Insurance Rate Map (FIRM) community panel number 1200770025E (see Figure 4.11). Flood Zone X corresponds to areas outside the 500-year flood and as such, no floodplain compensation will be required.

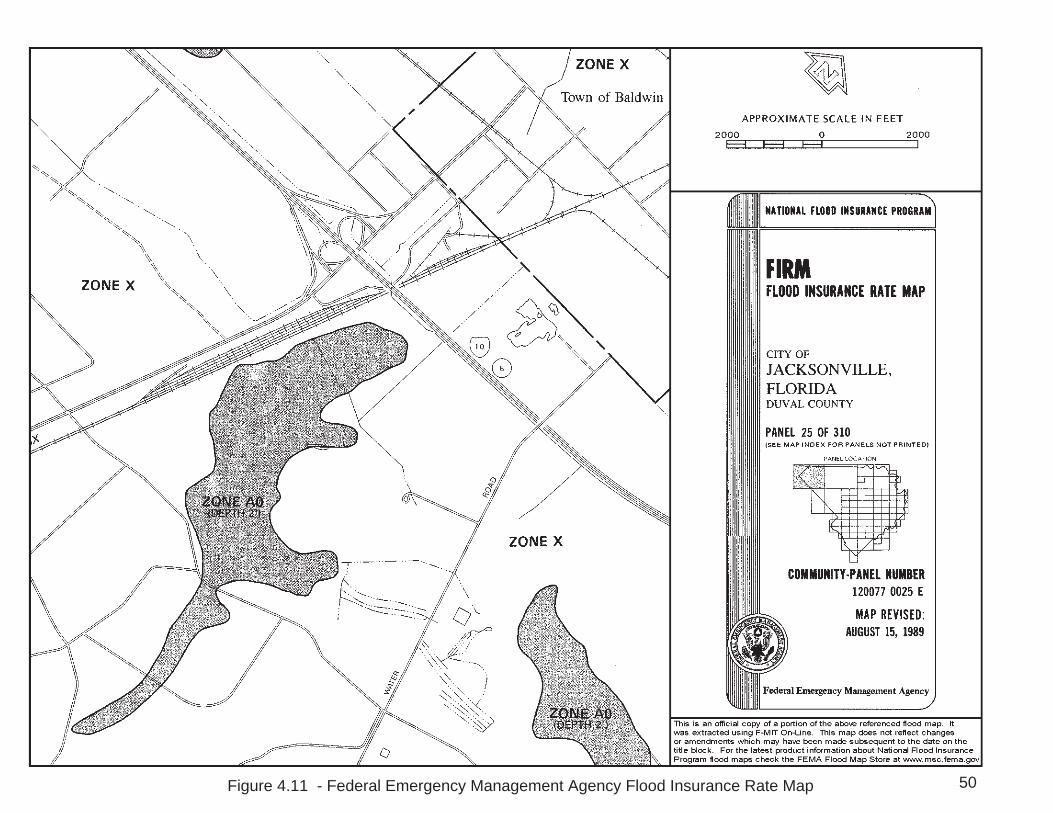
Figure 4.11 - Federal Emergency Management Agency Flood Insurance Rate Map 50

Interstate 10 (SR 8)/ SR 200 (US 301) Interchange
Interchange Modification Report
51
Threatened and Endangered Species The I-10/US 301 Interchange study area was evaluated for the potential presence of threatened and endangered species. Inquiries were made with the USFWS, Florida Fish and Wildlife Conservation Commission (FWC) and Florida Natural Areas Inventory (FNAI). In addition, database searches were conducted specifically for bald eagle nest and bird rookery locations.
1. U.S. Fish and Wildlife Service. Information on federally listed species for Duval County was obtained from the internet website of the USFWS Endangered Species Field Office in Jacksonville, FL (http://northflorida.fws.gov). A request was also submitted to Mr. Dave Hankla of USFWS to provide listed species information for the project area. This was followed with correspondence with Ms. Candace Martino and Todd Mecklenborg of USFWS.
2. Florida Fish and Wildlife Conservation Commission. A request was submitted in 2007 to Mr. Mike Abbott of FWC in regard to the occurrence of listed species in the project area. Ms. Jan Stearns of FWC responded with the requested information. Strategic Habitat Conservation Areas (SHCA) “hotspots” were reviewed. FWC Geographic Information System (GIS) data was also reviewed to determine the location of nearby wood stork rookeries and their Critical Foraging Area (CFA).
3. Florida Natural Areas Inventory (FNAI). In 2008, FNAI was contacted to request a standard Data Report for the project. FNAI responded, listing element occurrence records from their database.
Based on responses from the regulatory agencies and review of available data, no federally listed wildlife species are documented within the study area. There are no critical habitats, Core Foraging Areas (CFA), or Strategic Habitat Conservation Areas, as defined by USFWS, within the project corridor.
4.4.4 Physical Environment
AirThe project is located in Duval County which is in attainment of the National Ambient Air Quality Standards (NAAQS).
NoiseThe majority of land uses within the study limits are commercial, agricultural or heavy industrial.None of these land uses are considered to be noise sensitive. The low-density residential area along Brandy Branch Road and the Baldwin Inn located south of I-10 and west of US 301 are potential noise sensitive sites. However, only those homes south of Brandy Branch lie within the project study limits.

Interstate 10 (SR 8)/ SR 200 (US 301) Interchange
Interchange Modification Report
52
ContaminationA desktop screening assessment of the area located four (4) known suspected contaminated sites within the project study limits (see Figure 4.8):
CSX railroad maintenance yard facility north of I-10CSX railroad maintenance yard facility south of I-10, east of US 301 Travel Center and Pilot truck stops located south of I-10, west of US 301 Eight (8) private commercial parcels located south of I-10, east of US 301
V. NEED
5.1 Project Corridor Needs
The I-10/US 301 Interchange is deficient in terms of design criteria, capacity, ability to serve as an effective evacuation route and ability to accommodate future growth within the study area. Improvements are needed to address these deficiencies.
5.1.1 Interchange Design and Deficiencies
The existing interchange design is a partial cloverleaf AB type with straight and loop ramps serving all movements located on the west side of the interchange. This configuration was chosen at the time of construction for its relatively small footprint and to avoid conflict with the CSX railroad maintenance yard. The railroad maintenance yard is located along the east side of US 301. Two (2) major truck stops have been developed along US 301 in the southwest quadrant of the interchange. Traffic congestion has significantly increased in recent years with police and fire rescue representatives reporting numerous conflicts and crash incidents within the study area. Current traffic demands have modified the role of the interchange with a high number of commercial vehicles using the two (2) truck stops immediately south of the interchange as a major servicing point just outside the Jacksonville urban area. The heavy demand for the northbound US 301 to eastbound I-10 on-ramp creates difficult operational conditions that result in a sustained northbound queue for the signalized intersection left-turn (see Figure 5.1). The large portion of trucks in this queue create a highly dangerous situation for all traffic in the area as the large vehicles obstruct sight distance, move very slowly, block driveways, interfere with the median openings and prompt drivers to perform unsafe and unpredictable movements.
As documented in Section 3.4 of this report, the I-10/US 301 Interchange has several design deficiencies based on the current FDOT standards. These are summarized below:
Substandard loop ramp and turning radii design (low design speed). Speed differentials within the interchange limits. Insufficient I-10 westbound exit ramp deceleration length. Insufficient queue storage bay lengths along US 301. Short weaving distance between the loop ramps along US 301 southbound. Limited access right-of-way along US 301 does not meet current standards.

Interstate 10 (SR 8)/ SR 200 (US 301) Interchange
Interchange Modification Report
53
Substandard access management along US 301 south of I-10. Substandard sight distance along I-10 within the interchange limits. Substandard vertical bridge clearance under the I-10 bridge structures over US 301. Substandard vertical bridge clearance under the I-10 bridge structures over CSX railroad yard. Substandard surface deck on the I-10 bridge structures over the CSX railroad yard.
Figure 5.1 - US 301 Northbound Left-Turn Lane Queue (Looking South)
5.1.2 Structural
FDOT completed a Bridge Feasibility Study to widen, through repair or replacement, the existing bridges over the CSX railroad maintenance yard. Various bridge alternatives were evaluated to bring the bridges up to current design standards and widen the typical section. The recommended alternative from the Bridge Feasibility Study was to replace the CSX bridges. Due to the closely spaced CSX bridges to the US 301 bridges, it was determined that the US 301 bridges will also need to be replaced in order to bring all four (4) bridges to meet vertical clearance criteria and to reconstruct the I-10 mainline within the interchange limits. A preliminary maintenance of traffic evaluation determined that the current roadway footprint could not accommodate an acceptable maintenance of traffic plan that will maintain all lanes open during construction. In order to be able to replace the bridges and maintain the existing number of interstate through lanes at all times during construction, improvements to the interchange access will be needed and must be in place prior to the replacement of the bridges.

Interstate 10 (SR 8)/ SR 200 (US 301) Interchange
Interchange Modification Report
54
5.1.3 Safety
I-10 and US 301 have an average of twenty-three (23) and twenty-four (24) crashes per year respectively for a total of forty-seven (47) crashes. Along I-10, fixed object, rear-end and sideswipe collisions are the most common crashes. The high percentages of rear-end and sideswipe collisions along a freeway are typical of roadways experiencing heavy traffic congestion and weaving movements similar to the I-10/US 301 Interchange; whereas fixed object collisions are typical of roadways having poor geometry, restricted sight distance, inadequate delineation, inadequate shoulders and/or excessive speed.
Along US 301, rear-end, angle and sideswipe collisions are the most common crashes. The high percentages of angle and rear-end collisions along an arterial are typical of roadways experiencing heavy traffic congestion and inadequate signal timing; whereas sideswipe collisions are typical of roadways experiencing heavy traffic congestion and weaving movements.
The average year safety ratios for I-10 and US 301, within the study limits, were 1.46 and 2.28 respectively. A safety ratio greater than 1.0 and at least eight (8) crashes per year are indicators that these particular segments and locations of roadways had experienced crash rates comparable to statewide averages for similar roadways. Many of the traffic safety concerns relate to turning movements and existing physical conditions that can be addressed by modifying the interstate access and improving the ramp terminals. A detailed review of the crash data is presented in Section 4.3.
5.2 Area Needs
5.2.1 System Linkage and Area Connectivity
I-10 and US 301 are both part of the Strategic Intermodal System (SIS), Florida Intrastate Highway System (FIHS) and National Highway System (NHS). I-10 is a major highway in the State of Florida and is the main provider of east-west travel in north Florida. East of the project limits, I-10 also provides regional connectivity with Cecil Commerce Parkway, Interstate 295 and Interstate 95 which are used by many drivers accessing or passing through the northeast Florida region. The existing I-10/US 301 Interchange provides interstate access to local and regional traffic. Some of the regional traffic includes vehicles and commercial trucks traveling from as far as Gainesville, Waldo, Hawthorne, Lawtey and Starke. A high number of commercial vehicles use US 301 as an alternate route from I-75 to I-10 and from I-95 to I-10.
The Florida Division of Emergency Management has designated I-10 as a primary emergency evacuation route. I-10 has been modified to be able to convert all the lanes to travel in the westbound direction under hurricane evacuation conditions.

Interstate 10 (SR 8)/ SR 200 (US 301) Interchange
Interchange Modification Report
55
5.2.2 Access to Freight Activity
The I-10 corridor is part of the Florida’s SIS, and provides direct/indirect connections to:
Two public airports; Cecil Field and Jacksonville International AirportTwo rail lines operated by CSX Transportation One deep-water port, the Port of Jacksonville (JAXPORT) Other SIS corridors; I-75, I-95, I-295, US 301 and the First Coast Outer Beltway
As of 2007, the daily truck volumes are currently as high as 28% and 35% along the I-10 and US 301 corridors respectively. The amount of truck traffic is expected to increase due to the recent closure of the I-10 rest areas just east of US 301 and the current and projected growth of the Jacksonville Port Authority.
The expansion of the port and new seaport container facilities are making Jacksonville one of the largest container ports on the east coast. It is estimated that 70% of the containers that come through the port will be handled by trucks.
5.2.3 Transportation Demand
Long-range transportation planning forecasts developed by the North Florida Transportation Planning Organization (NFTPO) indicate that growth in travel demand will continue. In 2007, this section of I-10 west of US 301 had 38,800 vehicles per day AADT with a LOS B and 49,000 vehicles per day east of US 301 with a LOS C. These traffic volumes are expected to grow, exceeding 85,200 vehicles per day with a LOS D by 2040 west of US 301 and 100,400 east of US 301 with a LOS F under the existing number of lanes. The eastbound on-and off-ramps currently exceed their capacity carrying a range of 15-38% truck traffic during peak hours. These two ramps are the critical movements of this interchange with existing and projected poor LOS by movement. Other segments along the I-10 corridor east of US 301 will increase at an even faster rate.
5.2.4 Social Demands and Economic Development
The study area and its surroundings currently have nine (9) major traffic generators that utilize this interchange daily.
Winn-Dixie Distribution Center Publix Distribution Center Michaels Distribution Center Jacksonville Electric Authority Generating Station Wal-Mart Distribution Center Wal-Mart Super Center Gerdau Ameristeel Pilot Truck Stop Travel Center Truck Stop

Interstate 10 (SR 8)/ SR 200 (US 301) Interchange
Interchange Modification Report
56
Along with these major generators, commercial land uses are located just south of the interchange.
Approximately five (5) miles east of the interchange is the former Cecil Field Naval Air Station (NAS), currently being redeveloped into the Cecil Commerce Center (CCC). The CCC will include a variety of mixed-use developments and is anticipated to trigger considerable residential and commercial development in Western Duval County.
5.2.5 Federal, State and Local Government Authority
This IMR is consistent with the approved I-10 Master Plan Study and is consistent with the current adopted 2035 NFTPO LRTP in Duval County and Local Government Comprehensive Plans (LGCP).
Planned and Programmed Development in the Project Area
The following area projects are included in the 2035 Long Range Transportation Plan:
I-10/SR 23 (Cecil Commerce Parkway) Interchange – The interchange construction is complete and open to traffic. The only component still under construction is the widening of I-10 within the interchange limits. The construction is scheduled to be completed by 2015. SR 23 (Cecil Commerce Parkway) – The widening of SR 23 from two lanes to four lanes from NW 103rd Street to New World Avenue is scheduled to be constructed by 2020. New World Avenue is one of the main roadways that provide access to the Cecil Commerce Center. I-10 – The widening of I-10 from four lanes to six lanes from US 301 to SR 23 is scheduled to be constructed by 2025. The widening of I-10 from four lanes to six lanes from the Baker/Nassau County Line to US 301 is scheduled to be constructed by 2030. US 301 – A new four-lane roadway (Baldwin Bypass) is planned to be constructed from south of US 90 to north of the Town of Baldwin. The proposed project will provide a bypass route on US 301 that will avoid traffic congestion and delays caused by the existing co-location of US 301 with US 90 and the two existing at-grade CSX railroad crossings within the Town of Baldwin in Duval County. The project is scheduled to be constructed by 2035. The widening of US 301 from two lanes to four lanes from north of the Town of Baldwin to the Duval/Nassau County Line is scheduled to be constructed by 2035.

Interstate 10 (SR 8)/ SR 200 (US 301) Interchange
Interchange Modification Report
57
VI. ALTERNATIVES
6.1 No-Build Alternative
The No-Build Alternative proposes to keep the existing roadways and interchange configuration into the future without improvements. No traffic capacity, operation, or safety improvements would be implemented throughout the corridors. The effect associated with this alternative includes the acceptance of existing congested traffic conditions. Also, travel demand and truck traffic will increase in future years, given the continued growth and new roadway projects in the area. This alternative is considered to be viable during the public hearing and final selection phase to serve as a comparison to the study proposed alternative.
The No-Build Alternative has a number of positive aspects, since it would not require expenditure of public funds for design, right-of-way acquisition, construction or utility relocation. Traffic would not be disrupted due to construction, therefore, avoiding inconveniences to local residents and businesses. Also, there would be no direct or indirect impacts to the environment, the socio-economic characteristics, community cohesion, or system linkage of the area.
However, the No-Build Alternative fails to fulfill the needs of this project for the area. If no improvements are made, the I-10/US 301 Interchange and surrounding area will experience heavy congestion during the peak hours and will operate at undesirable levels of service. The congestion within the area will cause additional impacts to these roadways. Such impacts may include excessive delays in travel time, poor interstate access, large reduction of average travel speeds, excess fuel consumption from idling vehicles, increased air pollutants (particularly hydrocarbons and carbon monoxide) and a potential increase in rear-end, left-turn and sideswipe collisions.
6.2 Alternative Travel Modes
No multimodal facilities such as existing bicycle facilities or transit routes exist within the study area. Multimodal alternatives such as bus transit, high occupancy vehicle lanes and pedestrians or bicycle improvements will not meet the needs for this project because of the rural land use conditions and travel patterns within the interchange. Multimodal alternatives will not improve the current and future traffic conditions within the interchange area. Therefore, alternative travel modes were not considered in this IMR because it fails to fulfill the needs of this project.
6.3 Build Alternative
6.3.1 Definition of Alternative
The No-Build and Transportation Systems Management (TSM) Alternatives will not provide adequate traffic capacity or operational improvements to the interchange. TSM alternatives are comprised of minor improvement options that are typically developed to alleviate specific traffic

Interstate 10 (SR 8)/ SR 200 (US 301) Interchange
Interchange Modification Report
58
congestion/safety problems, or to get the maximum utilization out of the existing facility by improving operational efficiency. TSM alternatives may include improvements to the mainlines and interchange such as adding auxiliary lanes, lanes to access ramps, turn-lanes at the ramp terminals, signal optimization and increasing turn-lane storage on the cross streets.
As discussed in previous sections, the I-10 bridge structures over US 301 and CSX railroad maintenance yard will need to be replaced within the next ten (10) years. As part of the PD&E study and IMR efforts, a Build Alternative was developed by reconfiguring the interchange access to US 301 in order to be able to propose a maintenance of traffic (MOT) plan that will allow the replacement of the bridge structures and the reconstruction of the I-10 mainline profile without future construction throwaway. Therefore, a TSM Alternative was not considered in this IMR because it fails to fulfill the needs of this project.
Various interchange concepts were considered during the early stages of the PD&E study. The interchange concepts evaluation mainly focused on addressing long-term improvements under 2040 design year conditions. The concepts were evaluated in a general manner and analyzed in order to select a preferred alternative. The concepts were categorized based on the interchange needs for the area, type of interstate access and number of lanes. The selection of the appropriate criteria and standards was influenced by safety features, traffic volumes and composition, levels of service, environmental impacts and interstate design. Some of the interchange improvements considered included:
Flyover ramps Reduction of interstate access points Removal of loop ramps Increase of loop ramp radiuses design Additional ramps Ramp merging Relocation of ramp gores away from the mainline interchange vertical curves Additional interchange capacity Redistribution of traffic entering and exiting the interstate Intersection urbanization
Appendix E depicts the interchange concepts considered as part of the PD&E study.
After the Department’s review and concurrency of the final evaluation of the interchange concepts, an IMR preferred interchange alternative was identified to move forward in the study. The preferred Build Alternative will increase capacity, improve safety, improve traffic operations and will accommodate the necessary MOT plan to replace the bridge structures and reconstruct the I-10 mainline profile.

Interstate 10 (SR 8)/ SR 200 (US 301) Interchange
Interchange Modification Report
59
6.3.2 Preferred Alternative (2020 Opening Year)
The interchange Preferred Alternative (see Figure 6.1) will consist of the following elements and improvements:
Eastbound Ramps o Reconstruct the loop ramp in the southwest quadrant to improve the ramp geometrics
and maintain a single I-10 eastbound merge point location. This ramp will service the traffic traveling from US 301 southbound to I-10 eastbound. Once the loop ramp reaches the I-10 profile, it will continue eastbound separate and parallel to the I-10 mainline. The ramp will cross over US 301 on a separate bridge structure. The ramp will continue eastbound and will cross over the CSX railroad maintenance yard on a separate bridge structure. After crossing CSX, the ramp will merge with the new southeast quadrant eastbound on-ramp as a two-lane ramp. After merging, the ramp will continue eastbound as a two-lane ramp. The two-lane ramp will become a one-lane ramp before merging with I-10 just west of the CR 217 overpass.
o Construct a new two-lane on-ramp in the southeast quadrant. This ramp will service the traffic traveling from US 301 northbound to I-10 eastbound. This new ramp will improve the ramp terminal traffic operations by relocating the existing US 301 northbound to I-10 eastbound movement from a left-turn lane controlled by a signal to a free-flow through-right turn lane.
o Realign the eastbound off-ramp to accommodate the new loop ramp design in the southwest quadrant and improve the eastbound off-ramp terminal from a single-lane left-turn lane to a dual left-turn lane. This ramp will service the traffic traveling from I-10 eastbound to US 301 northbound and southbound.
Westbound Ramps
o Construct a new two-lane off-ramp in the northeast quadrant. This ramp will service the traffic traveling from I-10 westbound to US 301 northbound and southbound. After the two-lane off-ramp diverges from I-10, a downstream one-lane ramp peels off to the north to provide access to US 301 northbound. The two-lane off-ramp will continue westbound and cross over CSX and US 301 on separate bridge structures. After crossing over US 301, the two-lane ramp turns into a loop ramp intersecting with US 301 southbound. This two-lane ramp will be controlled by a traffic signal eliminating the southbound weaving section between the two southbound ramp terminals along US 301. This new ramp design will improve the ramp terminal traffic operations by relocating the existing I-10 westbound to US 301 northbound movement from a left-turn lane controlled by a stop sign or traffic signal to a right turn lane controlled by a yield sign. This design will also improve traffic operations by eliminating the I-10 westbound

Interstate 10 (SR 8)/ SR 200 (US 301) Interchange
Interchange Modification Report
60
mainline speed differentials and providing additional queuing areas during the peak periods.
o Urbanize the US 301 southbound to I-10 westbound right-turn lane. This improvement will replace the existing rural high speed entrance ramp with an exclusive right-turn lane controlled by a traffic signal at the ramp terminal intersection.
o Realign the westbound on-ramp near the ramp terminal to accommodate the new loop ramp design in the northwest quadrant and the urbanization of the US 301 southbound right-turn lane. This ramp will service the traffic traveling from US 301 northbound and southbound to I-10 westbound.
US 301 Improvements o Close the full median opening at Boxcar Drive. o Close the full median opening at the Baldwin Inn Hotel. o Extend the storage of all the left-turn lanes within the study area.
Appendix F contains the interchange 2020 Preferred Alternative conceptual plans.
The 2020 Preferred Alternative will provide the necessary interchange footprint to accommodate a future MOT plan to replace the US 301 and CSX bridges without closing the interchange and maintaining all travel lanes and ramps at all times during construction. The new bridges will be constructed to meet the required vertical and horizontal clearances per FDOT standards. As Figure 6.1 shows, replacing the bridges will require a change in profile along I-10. The 2020 Preferred Alternative interchange concept was designed with the idea of relocating and constructing the eastbound merge and westbound diverge gores outside of the new limits of the I-10 profile (profile grade line) to minimize construction throwaway and simplify the MOT phases. By relocating the gores away from the interchange, the future I-10 MOT plan will be able to use the existing shoulders, eastbound acceleration and westbound deceleration lane areas left behind from the existing conditions, within the interchange limits, to accommodate the necessary lane shifts and MOT phases to demolish the existing bridges and construct the new bridges.
The interchange 2020 Preferred Alternative is the proposed interchange modification for which approval to a change in access is being sought in this IMR document as part of the IMR interchange proposal process.


Interstate 10 (SR 8)/ SR 200 (US 301) Interchange
Interchange Modification Report
62
6.3.3 Preferred Alternative (2040 Design Year)
Two additional projects will be constructed and in place by the design year 2040 within the interchange area (see Figures 6.2 and 6.3).
I-10 Six-Lane Widening Project – The widening of I-10 from four lanes to six lanes from US 301 to SR 23 is scheduled to be constructed by the year 2025. The widening of I-10 from four lanes to six lanes from the Baker/Nassau County Line to US 301 is scheduled to be constructed by the year 2030.
Baldwin Bypass Project – A new four-lane roadway (Baldwin Bypass) will be constructed from south of US 90 to north of the Town of Baldwin. The project is scheduled to be constructed by the year 2035. This project currently proposes two distinct concepts to connect with the existing US 301 corridor north of the interchange.
1. T-Intersection just north of New Brandy Branch Road – This new intersection is the southern begin/end of the Baldwin Bypass Corridor intersecting with the existing US 301 corridor as a signalized intersection. Traffic wanting to access the Baldwin Bypass from I-10 will exit at the I-10/US 301 Interchange continue north and turn left at the T-intersection.
2. Four-Leg Intersection just north of the Interchange – In this concept, the Baldwin Bypass Corridor will be constructed to have a seamless connection with the US 301 corridor to and from the south and the I-10/US 301 Interchange. US 301 to and from the north will be realigned north of the interchange to end at the Baldwin Bypass near the New Brandy Branch Road area as a four-leg signalized intersection. The new intersection will provide access to US 301, New Brandy Branch Road and the Baldwin Bypass. Traffic wanting to access the Baldwin Bypass from I-10 will exit at the I-10/US 301 Interchange and continue north through the new intersection. Traffic from I-10 with the Town of Baldwin as their destination will exit at the I-10/US 301 Interchange continue north and turn right at the new four-leg intersection.
The interchange 2040 Preferred Alternative will be the same as in the opening year 2020 except for the following interchange modifications to accommodate the two projects described above.
The new southeast quadrant eastbound on-ramp will be extended and widened to two lanes before merging with I-10. The two-lane ramp will merge with I-10 just west of the CR 217 overpass. The CR 217 overpass will be replaced by the I-10 six-lane project in order to accommodate the six-lane typical section and the two-lane on-ramp acceleration lanes. The acceleration lanes will end east of the CR 217 overpass providing ample distance for trucks and vehicles to merge with the I-10 eastbound traffic. In Concept #2, the I-10 westbound to US 301 northbound ramp terminal will be widened to two lanes and will be controlled by a traffic signal. This improvement is needed due to the close proximity and proposed intersection spacing between the ramp terminal and the new Baldwin Bypass intersection to the north.
Appendix G contains the interchange 2040 Preferred Alternative conceptual plans.


Interstate 10 (SR 8)/ SR 200 (US 301) Interchange
Interchange Modification Report
65
VII. FUTURE YEAR TRAFFIC
7.1 2020 Opening and 2040 Design Year Traffic
As previously discussed in Section 2.3, the future traffic forecast was based on the Northeast Regional Planning Model (NERPM) Version 4, I-10 Master Plan Study, (dated April 2006) and area historical growth rates. Based on the 2007 balanced volumes from the I-10 and US 301 Design Traffic Report, an average annual growth rate was calculated. The average annual growth rate was found to be 2.23 percent. The forecast was compared to historic traffic counts. A comparison of this approach and the model projections was performed to provide consistent and logical traffic forecasts. In order to preserve the I-10 Master Plan Study volume projections, it was determined that the master plan forecasts would be considered in the forecasting effort for this IMR study. The master plan included traffic forecasts for 2020 and 2030. The 2007 traffic counts formed the base year traffic for both forecast methods. The opening year 2020 and design year 2040 traffic volumes were generated as follows:
Grew all 2007 volumes by 2.2%. Held all ramps east of US 301 to the I-10 Master Plan Study volume numbers. In 2040, an independent model run was performed in order to determine how much additional traffic the Baldwin Bypass would attract within the area of influence. The Baldwin Bypass was found to attract approximately 5,000 additional trips. These additional 5,000 trips were added to the already grown 2040 volumes to develop the 2040 forecast.
As previously discussed in Section 2.4, 2020 and 2040 AADT estimates were developed for the entire study area. DDHV volumes were also developed for the entire study area by following the approved processes and techniques consistent with the FDOT’s Project Traffic Forecasting Handbook. The traffic factors utilized for obtaining the future traffic peak hour volumes are listed in Table 2.2.
The 2020 and 2040 projected AADT and DDHV volumes are shown on Figures 7.1 through 7.3.


Interstate 10 (SR 8)/ SR 200 (US 301) Interchange
Interchange Modification Report
69
VIII. ALTERNATIVES ANALYSIS
8.1 Conformance with Transportation Plan
This IMR is consistent with the following studies:
I-10 Master Plan Study I-10/US 301 PD&E Study Baldwin Bypass PD&E Study I-10 Six-Lane Widening Adopted 2035 NFTPO LRTP in Duval County
The Preferred Alternative was designed to conform to all approved transportation plans, land use plans and programs.
8.2 Compliance with Policies and Engineering Standards
Design and operational standards are well defined for Florida’s roadway facilities. Design standards and criteria provide the framework for evaluating current geometric and operational deficiencies and future designs to meet mobility needs. Specifically, they help establish the roadway typical section, cross-sections and acceptable interchange configurations.
8.2.1 Roadway Design Criteria
Design controls and standards used to develop typical sections, horizontal and vertical alignments and other design features for the I-10/US 301 Interchange follow the criteria specified by the FDOT for state roadways. The design criteria used were based on the design parameters outlined in the following references:
2004 American Association of State Highway and Transportation Officials (AASHTO), A Policy on Geometric Design of Highways and Streets, Fourth Edition 2009 FHWA, Manual on Uniform Traffic Control Devices (MUTCD) 2010 FDOT, Design Standards for Design, Construction, Maintenance and Utility Operations on the State Highway Systems 2011 FDOT, Plans Preparation Manual (PPM), Volumes I & II
8.2.2 Design Exceptions and Variations
The Preferred Alternative will require a Design Variation for the reduction of the border width. According to Volume I, Chapter 2 of the FDOT Plans Preparation Manual, Table 2.5.3, it is the Department’s policy to provide a minimum border width of 94 feet for a limited access facility.
Interstate 10 (SR 8)/ SR 200 (US 301) Interchange
Interchange Modification Report
70
The proposed border width ranges within the interchange limited access study limits of the Preferred Alternative are listed below:
Southwest Quadrant – From 20-94 feet Southeast Quadrant – From 29-94 feet Northwest Quadrant – From 35-94 feet Northeast Quadrant – From 54-94 feet
A border width less than the required minimum will not affect the operational characteristics, but will provide a significant benefit to the Department by reducing the right-of-way cost. The reduced border width will not impact drainage or safety.
8.3 Operational Analysis
This section presents the analysis results for the alternatives considered under the opening year 2020 and design year 2040 projected traffic conditions. The methodology and criteria used for this analysis are the same as the existing conditions traffic operational analysis. The purpose of this analysis is to combine the design traffic estimates with the physical roadway characteristics of the alternatives considered to determine the projected LOS. This analysis also helps to define the design details, such as intersection layouts, typical sections and number of lanes.
The operational analysis compares the No-Build Alternative with the Preferred Build Alternatives. This IMR is analyzing and comparing the alternatives for the opening year 2020 in order to be consistent with the bridge replacement construction schedule of the I-10 bridges over US 301 and CSX. This IMR is also analyzing and comparing the alternatives for the design year 2040 in order to be consistent with the improvements from the I-10 six-lane widening project and the Baldwin Bypass PD&E Study. The operational analysis will determine if the proposed improvements will provide better traffic operations and acceptable LOS when compared with the No-Build Alternative.
The following tables show the LOS for the interchange alternatives considered for the opening year 2020 and design year 2040. Figures 8.1-8.10 summarize the LOS results. HCS and Synchro input variables as well as the outputs obtained from the applications are provided as part of Appendix H.
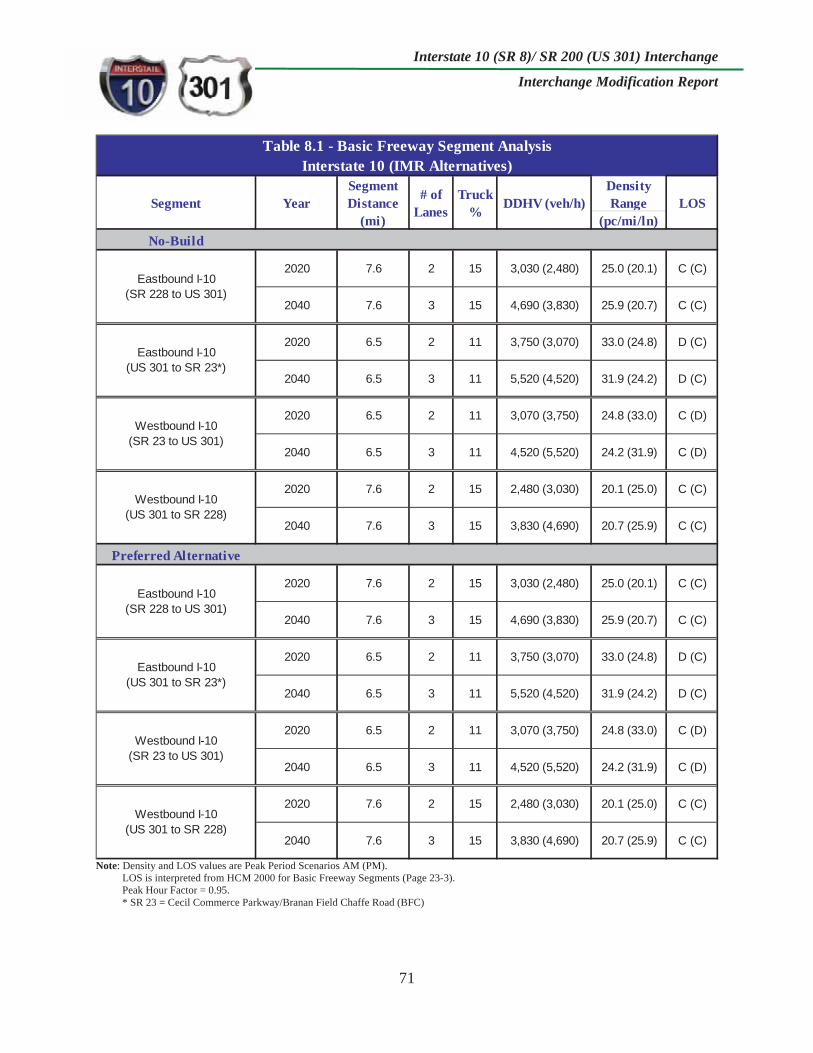
Interstate 10 (SR 8)/ SR 200 (US 301) Interchange
Interchange Modification Report
71
Density Range
(pc/mi/ln)No-Build
2020 7.6 2 15 3,030 (2,480) 25.0 (20.1) C (C)
2040 7.6 3 15 4,690 (3,830) 25.9 (20.7) C (C)
2020 6.5 2 11 3,750 (3,070) 33.0 (24.8) D (C)
2040 6.5 3 11 5,520 (4,520) 31.9 (24.2) D (C)
2020 6.5 2 11 3,070 (3,750) 24.8 (33.0) C (D)
2040 6.5 3 11 4,520 (5,520) 24.2 (31.9) C (D)
2020 7.6 2 15 2,480 (3,030) 20.1 (25.0) C (C)
2040 7.6 3 15 3,830 (4,690) 20.7 (25.9) C (C)
Preferred Alternative
2020 7.6 2 15 3,030 (2,480) 25.0 (20.1) C (C)
2040 7.6 3 15 4,690 (3,830) 25.9 (20.7) C (C)
2020 6.5 2 11 3,750 (3,070) 33.0 (24.8) D (C)
2040 6.5 3 11 5,520 (4,520) 31.9 (24.2) D (C)
2020 6.5 2 11 3,070 (3,750) 24.8 (33.0) C (D)
2040 6.5 3 11 4,520 (5,520) 24.2 (31.9) C (D)
2020 7.6 2 15 2,480 (3,030) 20.1 (25.0) C (C)
2040 7.6 3 15 3,830 (4,690) 20.7 (25.9) C (C)
Eastbound I-10 (US 301 to SR 23*)
Westbound I-10 (SR 23 to US 301)
Westbound I-10 (US 301 to SR 228)
Eastbound I-10 (SR 228 to US 301)
Eastbound I-10 (US 301 to SR 23*)
Westbound I-10 (SR 23 to US 301)
Westbound I-10 (US 301 to SR 228)
Eastbound I-10 (SR 228 to US 301)
Table 8.1 - Basic Freeway Segment AnalysisInterstate 10 (IMR Alternatives)
Segment YearSegment Distance
(mi)
# of Lanes
Truck % DDHV (veh/h) LOS
Note: Density and LOS values are Peak Period Scenarios AM (PM). LOS is interpreted from HCM 2000 for Basic Freeway Segments (Page 23-3). Peak Hour Factor = 0.95. * SR 23 = Cecil Commerce Parkway/Branan Field Chaffe Road (BFC)
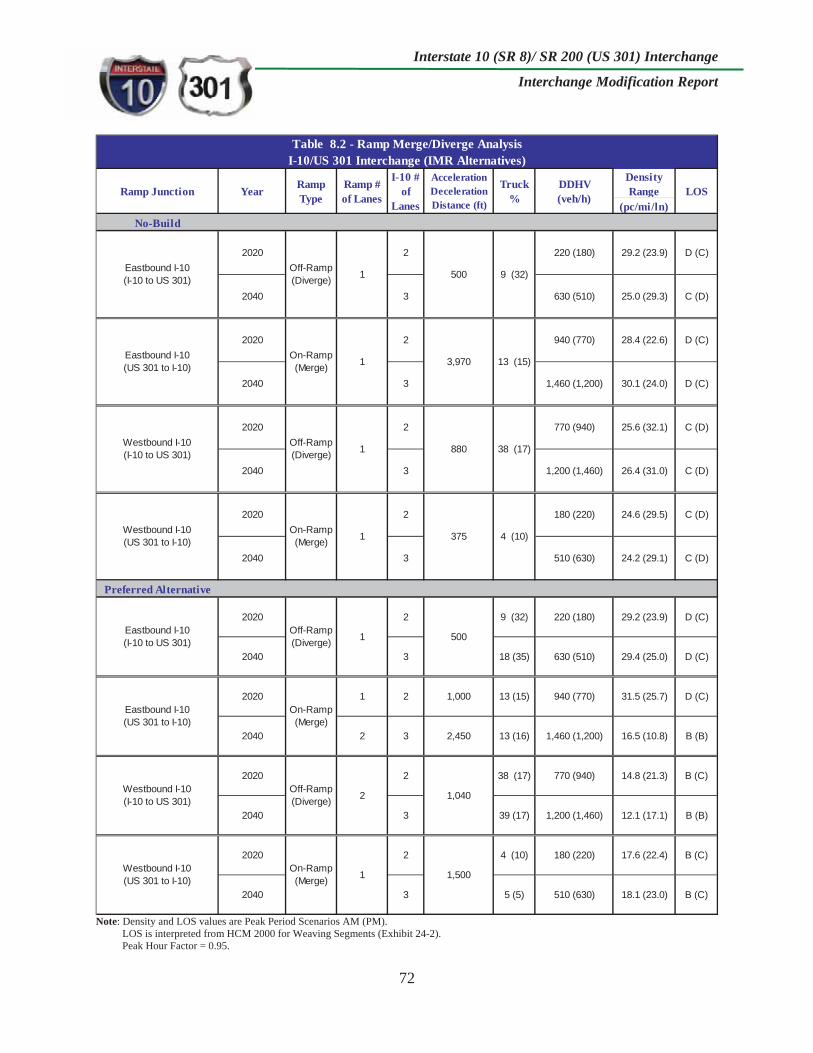
Interstate 10 (SR 8)/ SR 200 (US 301) Interchange
Interchange Modification Report
72
Density Range
(pc/mi/ln)No-Build
2020 2 220 (180) 29.2 (23.9) D (C)
2040 3 630 (510) 25.0 (29.3) C (D)
2020 2 940 (770) 28.4 (22.6) D (C)
2040 3 1,460 (1,200) 30.1 (24.0) D (C)
2020 2 770 (940) 25.6 (32.1) C (D)
2040 3 1,200 (1,460) 26.4 (31.0) C (D)
2020 2 180 (220) 24.6 (29.5) C (D)
2040 3 510 (630) 24.2 (29.1) C (D)
Preferred Alternative
2020 2 9 (32) 220 (180) 29.2 (23.9) D (C)
2040 3 18 (35) 630 (510) 29.4 (25.0) D (C)
2020 1 2 1,000 13 (15) 940 (770) 31.5 (25.7) D (C)
2040 2 3 2,450 13 (16) 1,460 (1,200) 16.5 (10.8) B (B)
2020 2 38 (17) 770 (940) 14.8 (21.3) B (C)
2040 3 39 (17) 1,200 (1,460) 12.1 (17.1) B (B)
2020 2 4 (10) 180 (220) 17.6 (22.4) B (C)
2040 3 5 (5) 510 (630) 18.1 (23.0) B (C)
DDHV (veh/h) LOS
I-10/US 301 Interchange (IMR Alternatives)Table 8.2 - Ramp Merge/Diverge Analysis
Ramp Junction Year Ramp Type
Ramp # of Lanes
I-10 # of
Lanes
Acceleration Deceleration Distance (ft)
Truck %
Eastbound I-10 (I-10 to US 301)
Off-Ramp (Diverge) 1 500 9 (32)
Eastbound I-10 (US 301 to I-10)
On-Ramp (Merge) 1 3,970 13 (15)
4 (10)
Westbound I-10 (I-10 to US 301)
Off-Ramp (Diverge) 1 880 38 (17)
Eastbound I-10 (I-10 to US 301)
Off-Ramp (Diverge) 1 500
Westbound I-10 (US 301 to I-10)
On-Ramp (Merge) 1 375
Westbound I-10 (US 301 to I-10)
On-Ramp (Merge) 1 1,500
Eastbound I-10 (US 301 to I-10)
On-Ramp (Merge)
Westbound I-10 (I-10 to US 301)
Off-Ramp (Diverge) 2 1,040
Note: Density and LOS values are Peak Period Scenarios AM (PM). LOS is interpreted from HCM 2000 for Weaving Segments (Exhibit 24-2). Peak Hour Factor = 0.95.

Interstate 10 (SR 8)/ SR 200 (US 301) Interchange
Interchange Modification Report
73
Table 8.1 shows that all the freeway segments analyzed will operate at LOS D or better by the year 2020 and year 2040 for both alternatives. The future demand along I-10 is projected to increase between the current year and the design year. The 2035 Long Range Transportation Plan and the 2035 SIS Cost Feasible Plan list the future widening of I-10 from four to six lanes between the Baker/Nassau County Line and SR 23 (Cecil Commerce Parkway). As Table 8.1shows, the I-10 six-lane widening project will preserve an acceptable LOS along the corridor between the 2020 opening year and the 2040 design year.
Table 8.2 shows that all the system merge and diverge ramps analyzed will operate at LOS D or better by the year 2020 and year 2040 for both alternatives. The future demand for access between I-10 and US 301 is projected to increase between the current year and the design year.
Improving the westbound off-ramp to two lanes will improve the LOS from LOS D to LOS B by the year 2040. This improvement will eliminate the westbound speed differentials between the off-ramp and I-10 mainline traffic. The relocated eastbound on-ramp will alleviate the traffic congestion and speed differentials between the on-ramp and I-10 eastbound mainline traffic. This interchange modification will improve the LOS from LOS D to LOS B by the year 2040.
These ramp improvements will not only improve the interchange ramp operations and access, they will also improve the operations of the I-10 mainline by providing sufficient acceleration and deceleration lanes away from the interchange limits on level ground and ahead of the overpass crest vertical curves. These improvements will reduce the turbulence and speed differentials within the interchange limits.
Density Range
(pc/mi/ln)
No Build2020 0.86 (0.74) 18.93 (15.70) B (B)
2040 0.82 (0.76) 34.41 (26.15) D (C)
Preferred AlternativeThe preferred alternative proposes to eliminate the weaving segment.
Table 8.3 - Ramp Weaving Analysis Type AI-10/US 301 Interchange (IMR Alternatives)
Segment YearWeaving
# of Lanes
Segment Distance (ft)
Volume Ratio LOS
Southbound US 301 (Between I-10 WB Loop Ramp
and I-10 EB Loop Ramp )4003
Note: Density and LOS values are Peak Period Scenarios AM (PM). LOS is interpreted from HCM 2000 for Weaving Segments (Exhibit 24-2). Peak Hour Factor = 0.95.
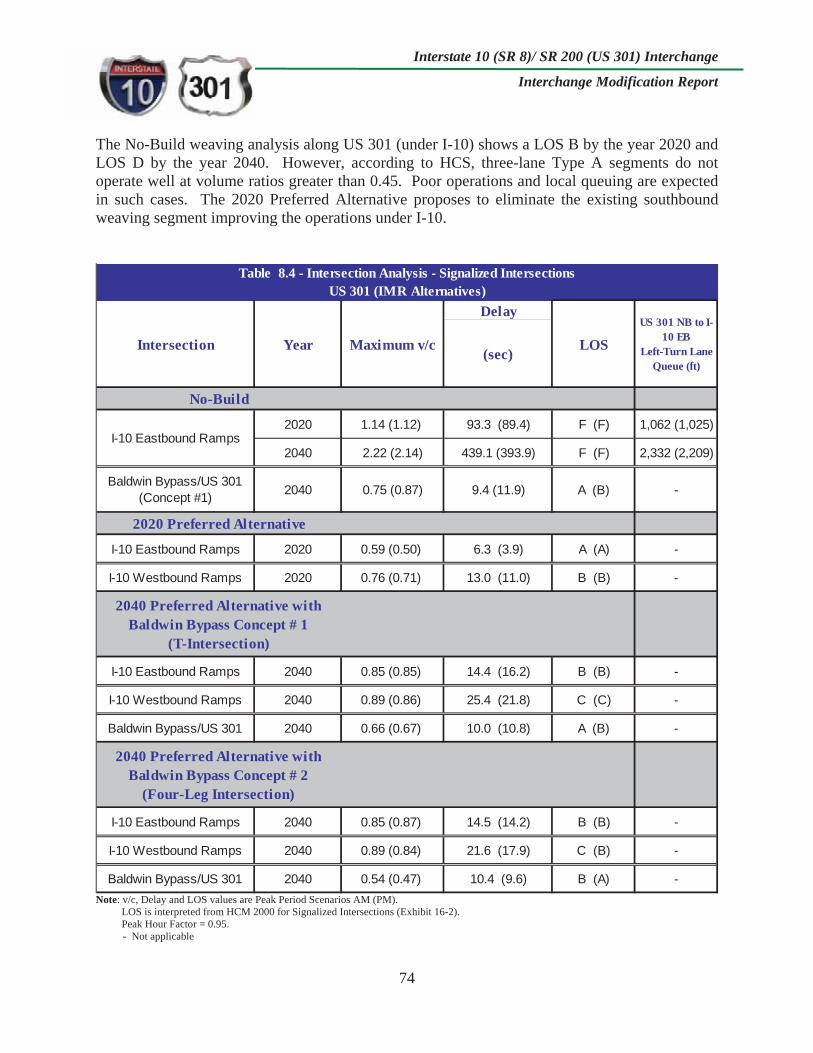
Interstate 10 (SR 8)/ SR 200 (US 301) Interchange
Interchange Modification Report
74
The No-Build weaving analysis along US 301 (under I-10) shows a LOS B by the year 2020 and LOS D by the year 2040. However, according to HCS, three-lane Type A segments do not operate well at volume ratios greater than 0.45. Poor operations and local queuing are expected in such cases. The 2020 Preferred Alternative proposes to eliminate the existing southbound weaving segment improving the operations under I-10.
Delay
(sec)
2020 1.14 (1.12) 93.3 (89.4) F (F) 1,062 (1,025)
2040 2.22 (2.14) 439.1 (393.9) F (F) 2,332 (2,209)
Baldwin Bypass/US 301(Concept #1) 2040 0.75 (0.87) 9.4 (11.9) A (B) -
I-10 Eastbound Ramps 2020 0.59 (0.50) 6.3 (3.9) A (A) -
I-10 Westbound Ramps 2020 0.76 (0.71) 13.0 (11.0) B (B) -
I-10 Eastbound Ramps 2040 0.85 (0.85) 14.4 (16.2) B (B) -
I-10 Westbound Ramps 2040 0.89 (0.86) 25.4 (21.8) C (C) -
Baldwin Bypass/US 301 2040 0.66 (0.67) 10.0 (10.8) A (B) -
I-10 Eastbound Ramps 2040 0.85 (0.87) 14.5 (14.2) B (B) -
I-10 Westbound Ramps 2040 0.89 (0.84) 21.6 (17.9) C (B) -
Baldwin Bypass/US 301 2040 0.54 (0.47) 10.4 (9.6) B (A) -
Table 8.4 - Intersection Analysis - Signalized IntersectionsUS 301 (IMR Alternatives)
US 301 NB to I-10 EB
Left-Turn Lane Queue (ft)
Intersection Year Maximum v/c LOS
I-10 Eastbound Ramps
2020 Preferred Alternative
2040 Preferred Alternative with Baldwin Bypass Concept # 1
(T-Intersection)
2040 Preferred Alternative with Baldwin Bypass Concept # 2
(Four-Leg Intersection)
No-Build
Note: v/c, Delay and LOS values are Peak Period Scenarios AM (PM). LOS is interpreted from HCM 2000 for Signalized Intersections (Exhibit 16-2). Peak Hour Factor = 0.95.
- Not applicable

Interstate 10 (SR 8)/ SR 200 (US 301) Interchange
Interchange Modification Report
75
ApproachControl Delay (sec)
EBLT, NBLT EBLT, NBLT
2020 24.4 (> 100.0), 9.1 (9.6) C (F), A (A)
2040 >100.0 (>100.0), 11.7 (11.4) F (F), B (B)
EB , NBLT EB , NBLT
2020 13.0 (12.7), 8.8 (8.6) B (B), A (A)
2040 34.0 (28.4), 12.2 (11.3) D (D), B (B)
2020
EB , NBLT EB , NBLT
2020 14.0 (14.3), 8.7 (8.5) B (B), A (A)
EB , NBLT EB , NBLT
2040 39.2 (47.3), 11.9 (11.0) E (E), B (B)
2040
The preferred alternative proposes to signalize this intersection by the year 2020.
2040 Preferred Alternative with Baldwin Bypass Concept # 2
(Four-Leg Intersection)
New Brandy Branch RoadThis concept proposes to relocate this intersection to the north and combine it with the Baldwin Bypass signalized
intersection by the year 2040.
New Brandy Branch Road
2020 Preferred Alternative
2040 Preferred Alternative with Baldwin Bypass Concept # 1
(T-Intersection)
New Brandy Branch Road
I-10 Westbound Ramps
New Brandy Branch Road
No-Build
I-10 Westbound Ramps
Table 8.5 - Intersection Analysis - Unsignalized IntersectionUS 301 (IMR Alternatives)
Intersection Year LOS
Note: v/c, Delay and LOS values are Peak Period Scenarios AM (PM). LOS is interpreted from HCM 2000 for Unsignalized Intersections (Exhibit 17-2). Peak Hour Factor = 0.95. EBLT, NBLT, EB = Eastbound Left Turn, Northbound Left Turn, Eastbound
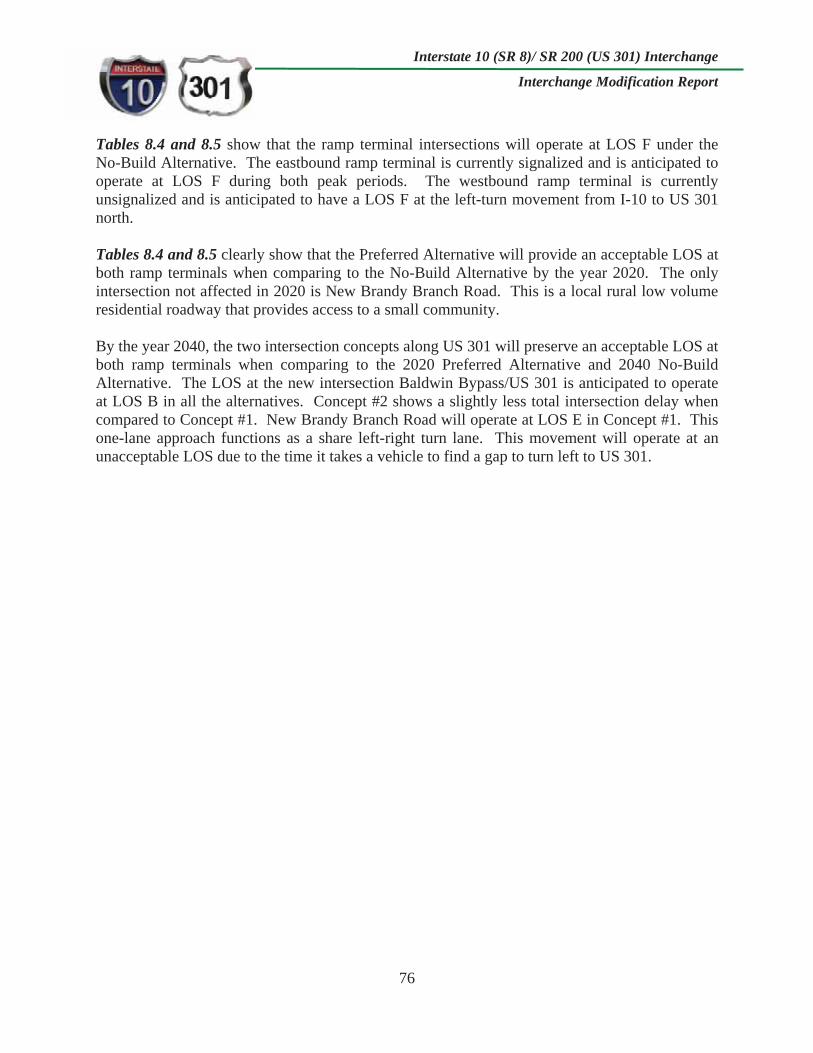
Interstate 10 (SR 8)/ SR 200 (US 301) Interchange
Interchange Modification Report
76
Tables 8.4 and 8.5 show that the ramp terminal intersections will operate at LOS F under the No-Build Alternative. The eastbound ramp terminal is currently signalized and is anticipated to operate at LOS F during both peak periods. The westbound ramp terminal is currently unsignalized and is anticipated to have a LOS F at the left-turn movement from I-10 to US 301 north.
Tables 8.4 and 8.5 clearly show that the Preferred Alternative will provide an acceptable LOS at both ramp terminals when comparing to the No-Build Alternative by the year 2020. The only intersection not affected in 2020 is New Brandy Branch Road. This is a local rural low volume residential roadway that provides access to a small community.
By the year 2040, the two intersection concepts along US 301 will preserve an acceptable LOS at both ramp terminals when comparing to the 2020 Preferred Alternative and 2040 No-Build Alternative. The LOS at the new intersection Baldwin Bypass/US 301 is anticipated to operate at LOS B in all the alternatives. Concept #2 shows a slightly less total intersection delay when compared to Concept #1. New Brandy Branch Road will operate at LOS E in Concept #1. This one-lane approach functions as a share left-right turn lane. This movement will operate at an unacceptable LOS due to the time it takes a vehicle to find a gap to turn left to US 301.
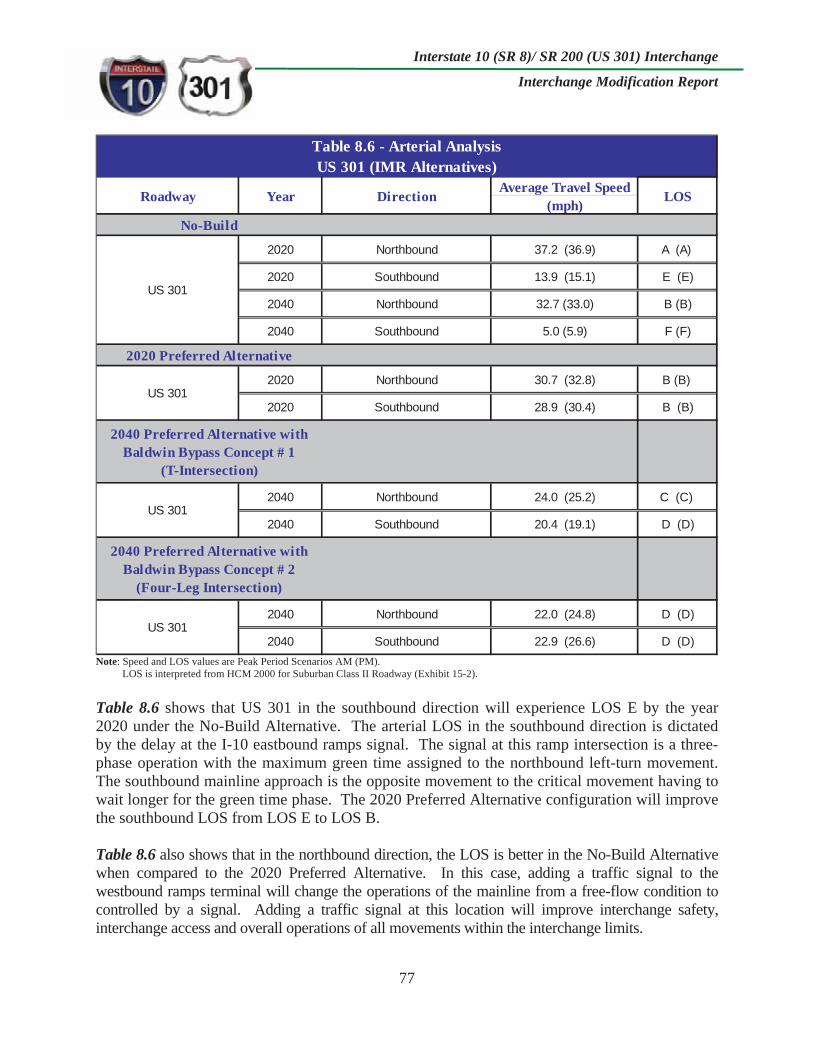
Interstate 10 (SR 8)/ SR 200 (US 301) Interchange
Interchange Modification Report
77
Average Travel Speed(mph)
2020 Northbound 37.2 (36.9) A (A)
2020 Southbound 13.9 (15.1) E (E)
2040 Northbound 32.7 (33.0) B (B)
2040 Southbound 5.0 (5.9) F (F)
2020 Northbound 30.7 (32.8) B (B)
2020 Southbound 28.9 (30.4) B (B)
2040 Northbound 24.0 (25.2) C (C)
2040 Southbound 20.4 (19.1) D (D)
2040 Northbound 22.0 (24.8) D (D)
2040 Southbound 22.9 (26.6) D (D)
2040 Preferred Alternative with Baldwin Bypass Concept # 1
(T-Intersection)
US 301
2040 Preferred Alternative with Baldwin Bypass Concept # 2
(Four-Leg Intersection)
US 301
US 301
Table 8.6 - Arterial AnalysisUS 301 (IMR Alternatives)
Roadway Year Direction LOS
US 301
2020 Preferred Alternative
No-Build
Note: Speed and LOS values are Peak Period Scenarios AM (PM). LOS is interpreted from HCM 2000 for Suburban Class II Roadway (Exhibit 15-2).
Table 8.6 shows that US 301 in the southbound direction will experience LOS E by the year 2020 under the No-Build Alternative. The arterial LOS in the southbound direction is dictated by the delay at the I-10 eastbound ramps signal. The signal at this ramp intersection is a three-phase operation with the maximum green time assigned to the northbound left-turn movement. The southbound mainline approach is the opposite movement to the critical movement having to wait longer for the green time phase. The 2020 Preferred Alternative configuration will improve the southbound LOS from LOS E to LOS B.
Table 8.6 also shows that in the northbound direction, the LOS is better in the No-Build Alternative when compared to the 2020 Preferred Alternative. In this case, adding a traffic signal to the westbound ramps terminal will change the operations of the mainline from a free-flow condition to controlled by a signal. Adding a traffic signal at this location will improve interchange safety, interchange access and overall operations of all movements within the interchange limits.

Interstate 10 (SR 8)/ SR 200 (US 301) Interchange
Interchange Modification Report
78
By the year 2040, the two proposed intersection concepts along US 301 will preserve an arterial acceptable LOS when comparing to the 2020 Preferred Alternative and 2040 No-Build Alternative. Concept #1 shows a slightly higher average travel speed in the northbound direction when compared to Concept #2. This slight difference is mainly due to the proposed number of signalized intersections. Concept #1 proposes two northbound signalized intersections; I-10 eastbound ramps and Baldwin Bypass T-Intersection. Concept #2 proposes three northbound signalized intersections; I-10 eastbound ramps, I-10 westbound ramps and Baldwin Bypass Four-way Intersection. Therefore, having an additional intersection within the same area reduces the overall arterial speed. However, Concept #2 shows a slightly higher average travel speed in the southbound direction when compared to Concept #1. This slight difference is due to the proposed intersection design at the Baldwin Bypass. When comparing the T-intersection in Concept #1 with the Four-way intersection in Concept #2, the Four-way intersection will eliminate the right-turn movement (Baldwin Bypass southbound to US 301 southbound) controlled by a signal in Concept #1 with a free-flow through movement. The overall difference between the two 2040 concepts is minor.
In terms of traffic operations, Concept #2 will be a more suitable and practical design when compared to Concept #1 based on the following:
Better Truck Route – Seamless connection between I-10 and the Baldwin Bypass corridor. No Weaving Maneuvers – No need for the northbound traffic from I-10 to weave over to continue along the Baldwin Bypass, reducing the chances of sideswipe crashes. Access Management – Eliminates the median opening between the I-10 westbound ramp terminal and the next intersection to the north, reducing the chances of angle and left-turn crashes. Critical Movement – The critical movement north of the interchange is traffic traveling between I-10 and the Baldwin Bypass. Therefore, the Baldwin Bypass will operate as the main corridor.
Figures 8.1-8.10 show a summary of the LOS results for the 2020 No-Build Alternative, 2020 Preferred Alternative, 2040 Concept #1 and 2040 Concept #2.
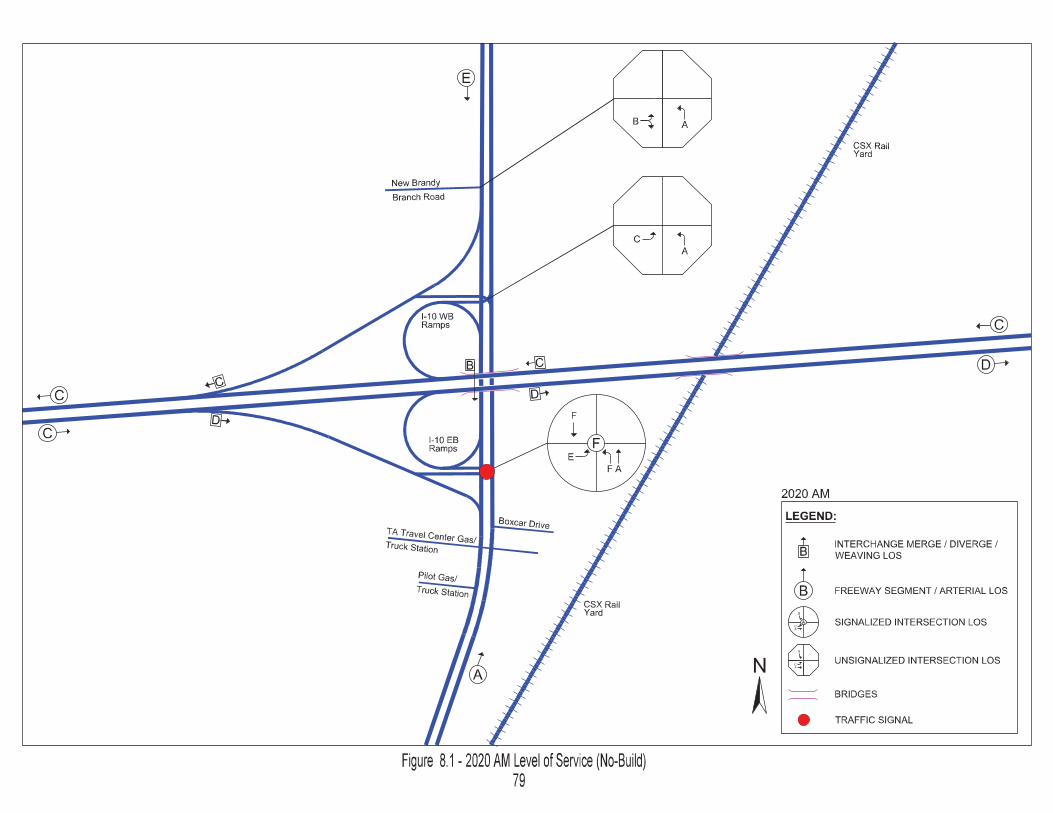

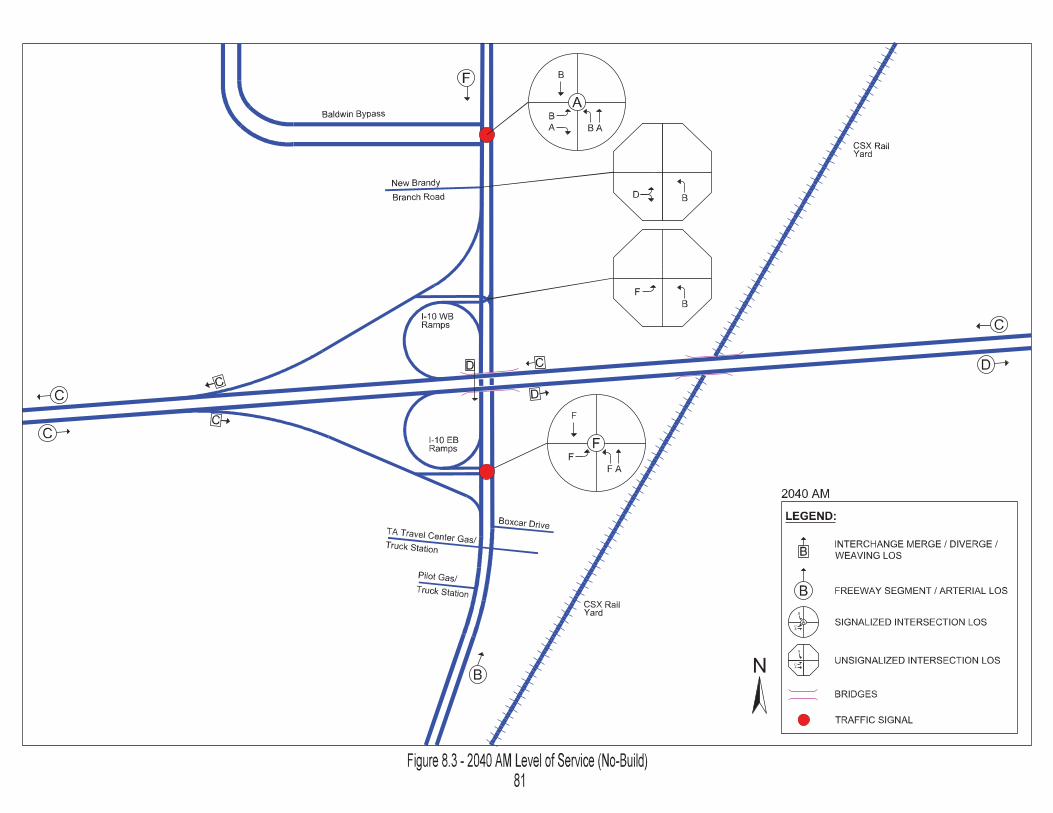


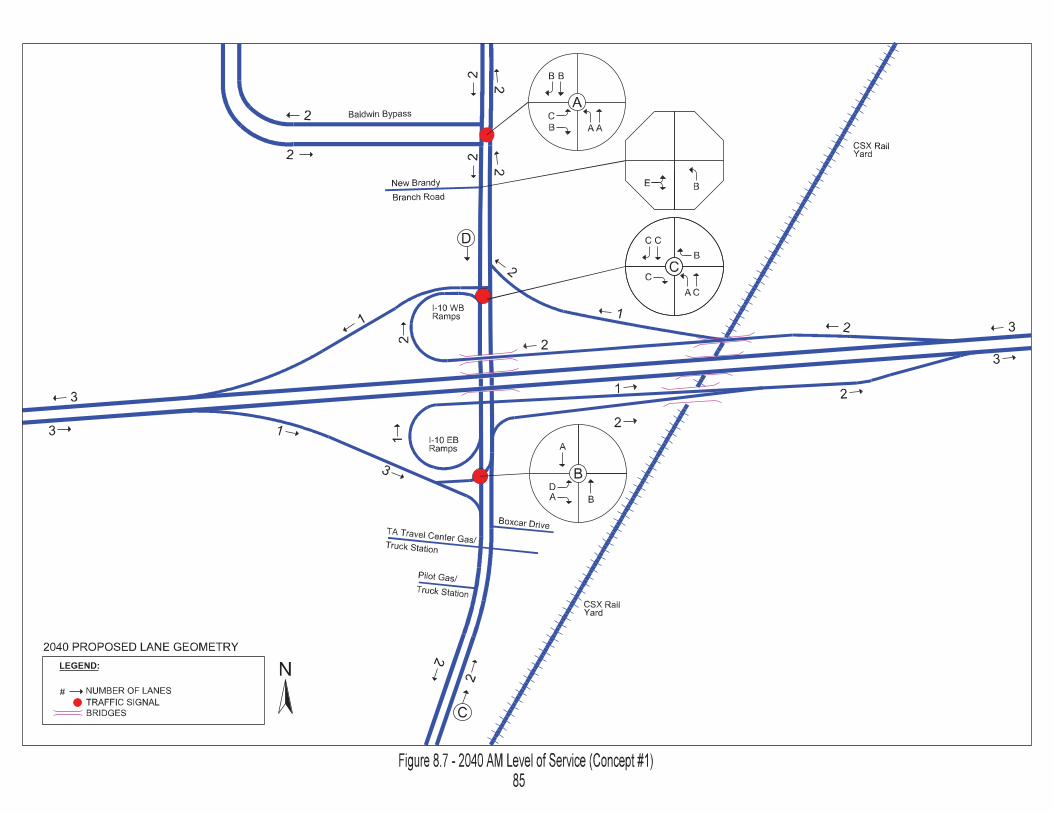

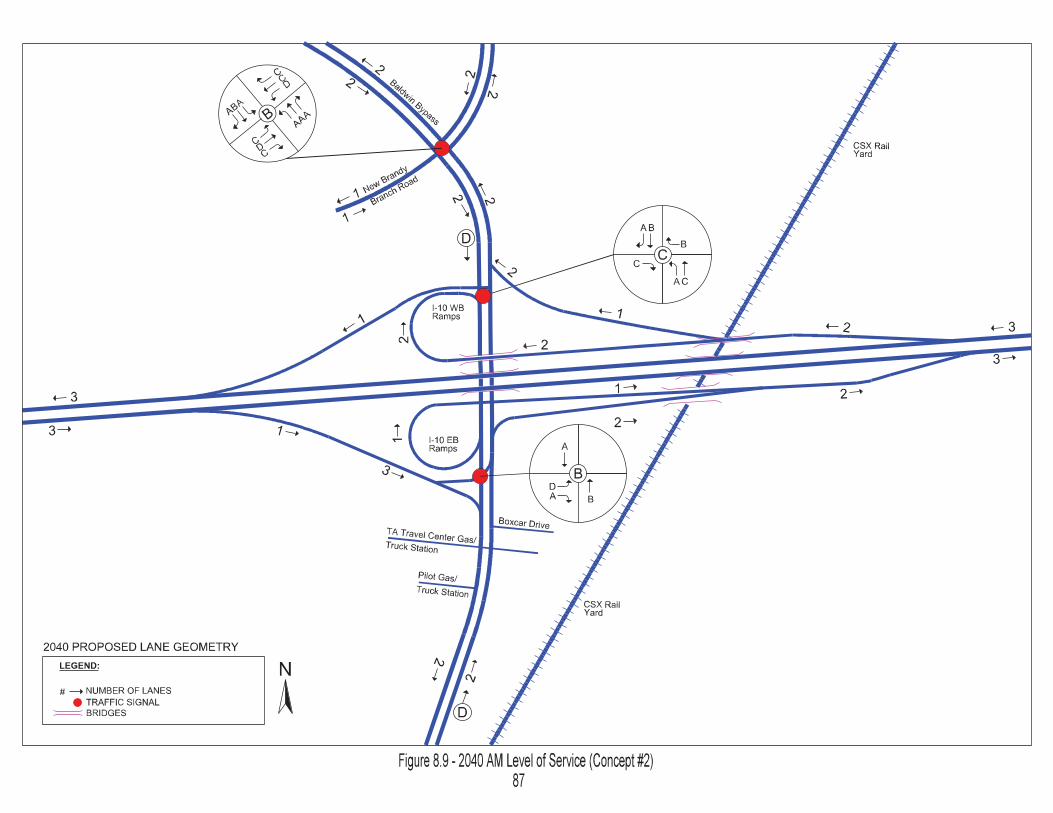


Interstate 10 (SR 8)/ SR 200 (US 301) Interchange
Interchange Modification Report
89
8.4 Environmental Impacts
This section documents the potential environmental impacts resulting from the Preferred Alternative interchange improvements. Information of these environmental elements will be expanded and analyzed further in more detail during the PD&E study.
8.4.1 Cultural Resources
There are no historic resources or archaeological sites located within the project study limits.
8.4.2 Community Services
There are no community service facilities located within the project study limits.
8.4.3 Natural and Biological Features
WetlandsWetlands and other surface waters exist within the interchange study limits. The Preferred Alternative impacts some or all of these wetlands and other surface waters. However, based on the findings of the PD&E study, the improvements are not likely to have significant impacts given the relative low quality of these wetlands and the extent of the potential impacts. The wetland impacts should be permittable in accordance with the regulatory programs of the United States Army Corps of Engineers (USACOE) and SJRWMD. Direct wetland impacts were quantified for those wetlands and other surface waters which occur within the boundaries of the Preferred Alternative (see Figure 8.11).
The other surface waters found within the interchange limits are ditches. Based on this IMR preliminary level of review, it is uncertain whether or not these areas demonstrate characteristics, such as a mean high water mark or utilization by a threatened or endangered species that would cause the regulatory agencies to require mitigation. The potential impacts included these areas in the mitigation cost estimate calculations. These impacts may be subject to change should the regulatory agencies determine mitigation is unnecessary.
Direct wetland impacts also included any wetlands which would be partially impacted, where the remaining wetland would then potentially total less than one-half acre. The IMR Preferred Alternative appears to directly impact 1.31 acres of other surface waters. Based on aerial photography, the surface waters appear to primarily consist of forested communities. The quality of these surface waters may be considered diminished by their immediate proximity to the existing roadway right-of-way as well as other adjacent development making them readily permittable.

Interstate 10 (SR 8)/ SR 200 (US 301) Interchange
Interchange Modification Report
90
Indirect or non-dredge and fill wetland impacts were quantified for those wetlands (not to include ditches) located within 300 feet of the outside of the proposed right-of-way line. Non-dredge and fill wetland impacts were not presumed in areas where the right-of-way line remained unchanged and construction was confined to the existing right-of-way.
The distance of 300 feet is based on current methodology used by the SJRWMD to assess non-dredge and fill wetland impacts (increased noise, light, pollution, etc.) from major roadway projects. It is possible that this distance may be more or less, based on policy in place at the time of permitting. This distance may be subject to review by the regulatory agencies. Non-dredge and fill wetland impacts of 0.29 acres were presumed within the IMR Preferred Alternative. The regulatory agencies only require mitigation for a percentage of the total acreage, quantified in the form of “functional loss” using the Wetland Rapid Assessment Methodology (WRAP). Mitigation is not typically required for wetlands that are deemed isolated and are less than one-half acre in size.
Based on aerial interpretation, some of the wetlands that will potentially be indirectly impacted may be considered as such. For this reason, only those functional loss units associated with wetlands requiring mitigation, specifically 1.31 units for the IMR Preferred Alternative, have been included in the mitigation cost estimate.
Assuming that the wetland impacts are to be mitigated at $100,000 (Section 373.4137 F.S.) per acre of direct wetland impact and per unit of functional loss for non-dredge and fill wetland impacts, an estimated mitigation cost of $131,000 was calculated for the IMR Preferred Alternative.
In conclusion, the proposed interchange improvements should have no adverse impact on wetland functions and values. The wetland impacts should be permittable with the appropriate compensatory mitigation.

Interstate 10 (SR 8)/ SR 200 (US 301) Interchange
Interchange Modification Report
91
Figure 8.11 – Wetland Impacts
Threatened and Endangered Species The proposed interchange improvements have been evaluated for the potential to impact federally listed Threatened and Endangered species or their designated Critical Habitat. Based on this assessment, the interchange improvements are unlikely to adversely impact any federally listed species due to the type and quality of the habitats within the study area. The wood stork has a moderate probability of occurring in the study area on an incidental basis for feeding. The flatwoods salamander, red-cockaded woodpecker and eastern indigo snake have a low probability of occurring in the study area.
In addition to the federally listed species considered as a part of the project, the corridor also was evaluated for the occurrence of additional species that receive protection from the State of Florida. No rookeries or nesting of protected birds are known or documented to occur in the project area. The Florida pine snake and gopher frog typically occur as commensal species in gopher tortoise burrows and suitable habitat for the gopher tortoise does not occur. One documented occurrence of black bear was noted by FWC for roadkill on the eastern side of the existing interchange.
In conclusion, the proposed interchange improvements should have no adverse impact on federally listed species. No federally listed species have been documented or observed in the study area, nor are they anticipated to occur given the lack of suitable habitat or Critical Habitat for these species.

Interstate 10 (SR 8)/ SR 200 (US 301) Interchange
Interchange Modification Report
92
8.4.4 Physical Environment
Air Quality The proposed project is located in Duval County, which is designated as being in attainment for all of the NAAQS under the criteria provided in the Clean Air Act. Therefore, the Clean Air Act conformity requirements do not apply to the project.
NoiseThe majority of land uses within the study limits are commercial, agricultural and/or heavy industrial. None of these land uses are considered to be noise sensitive. The low-density residential area along Brandy Branch Road and the Baldwin Inn located south of I-10 and west of US 301 are potential noise sensitive sites. However, only those homes south of Brandy Branch Road lie within the project study limits.
ContaminationA desktop screening assessment of the study area located four (4) known suspected contaminated sites within the project study limits (see Figure 4.8):
CSX railroad maintenance yard facility north of I-10CSX railroad maintenance yard facility south of I-10, east of US 301 Travel Center and Pilot truck stops located south of I-10, west of US 301 Eight (8) private commercial parcels located south of I-10, east of US 301
The PD&E study will further analyze and define the impacts to these suspected contaminated sites.
8.5 Safety
Safety for this project will be enhanced with the construction of the Preferred Alternative. The new ramp in the southeast quadrant of the interchange will improve the ramp terminal traffic operations by relocating the existing US 301 northbound to I-10 eastbound movement from a left-turn lane controlled by a signal to a free-flow through-right-turn lane. Relocating this movement will eliminate the sustained northbound queue improving sight distance, traffic flow as well as providing more gaps for vehicles entering and exiting the adjacent driveways and median openings. By improving traffic flow and providing more gaps, drivers will be less likely to perform unsafe and unpredictable movements. The westbound ramps proposed improvements will enhance the ramp terminal traffic operations by adding a traffic signal, additional exclusive turn lanes, queue storage and by eliminating the southbound weaving section between the ramp terminals. This design will also eliminate the I-10 westbound mainline speed differentials. The Preferred Alternative will significantly improve the intersection and arterial LOS from failing LOS conditions in the No-Build Alternative to acceptable LOS conditions. Access management along US 301 will also be improved by extending the median left-turn lane bays and modifying the existing median openings.

Interstate 10 (SR 8)/ SR 200 (US 301) Interchange
Interchange Modification Report
93
The loop ramp in the southwest quadrant will have a significant reduction in traffic with the construction of the new southeast quadrant on-ramp. The existing loop ramp currently experiences speed differential problems at the gore area due to the high traffic volumes and loop ramp low speed design. Most of the traffic traveling from US 301 to I-10 eastbound are semi-trailer trucks. This new on-ramp design provides the appropriate length to accelerate and reach higher speeds before merging with the I-10 mainline traffic.
The Preferred Alternative is anticipated to reduce the following type of crash collisions:
Rear-end and sideswipe collisions by improving traffic flow, eliminating weaving maneuvers and reducing speed differentials. Guardrail collisions by improving interchange geometry and sight distance. Left-turn collisions by relocating the critical interchange left-turn movements to right-turn movements. Angle collisions by improving intersection geometry and signal timing.
As discussed in Section 5.2.1, I-10 has been designated as a primary emergency evacuation route. The Preferred Alternative proposed improvements will enhance the interstate access helping the interchange and corridor successfully operate during any future evacuation events.
8.6 Right-of-Way
A right-of-way cost was determined based on the proposed geometry of the Preferred Alternative. The right-of-way acquisition is located east of US 301 (see Appendix G). The cost includes property, support and administrative costs. The parcels impacted are commercial, vacant and permanent easements. These right-of-way takes are necessary in order to accommodate the new eastbound on-ramp and westbound off-ramp east of US 301. The right-of-way takes will also allow the extension of the limited access line to an area past the on- and off-ramps to access I-10. The number of parcels impacted and estimated right-of-way cost are summarized in Table 8.7.
8.7 Alternatives Comparison
An evaluation matrix comparing the No-Build Alternative with the Preferred Alternative is provided in Table 8.7.
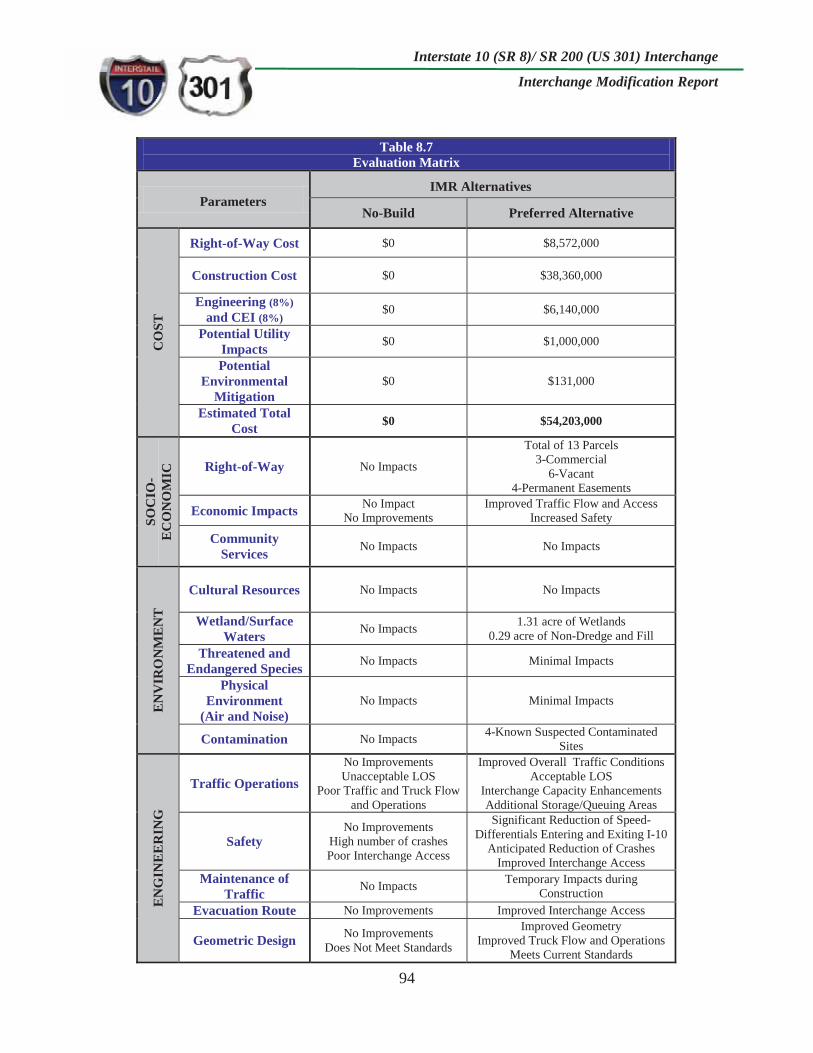
Interstate 10 (SR 8)/ SR 200 (US 301) Interchange
Interchange Modification Report
94
Table 8.7 Evaluation Matrix
Parameters IMR Alternatives
No-Build Preferred Alternative
CO
ST
Right-of-Way Cost $0 $8,572,000
Construction Cost $0 $38,360,000
Engineering (8%)and CEI (8%)
$0 $6,140,000
Potential Utility Impacts $0 $1,000,000
Potential Environmental
Mitigation $0 $131,000
Estimated Total Cost $0 $54,203,000
SOC
IO-
EC
ON
OM
IC Right-of-Way No Impacts
Total of 13 Parcels 3-Commercial
6-Vacant 4-Permanent Easements
Economic Impacts No Impact No Improvements
Improved Traffic Flow and Access Increased Safety
Community Services No Impacts No Impacts
EN
VIR
ON
ME
NT
Cultural Resources No Impacts No Impacts
Wetland/Surface Waters No Impacts 1.31 acre of Wetlands
0.29 acre of Non-Dredge and Fill Threatened and
Endangered Species No Impacts Minimal Impacts
Physical Environment
(Air and Noise) No Impacts Minimal Impacts
Contamination No Impacts 4-Known Suspected Contaminated Sites
EN
GIN
EE
RIN
G
Traffic Operations No Improvements Unacceptable LOS
Poor Traffic and Truck Flow and Operations
Improved Overall Traffic Conditions Acceptable LOS
Interchange Capacity Enhancements Additional Storage/Queuing Areas
Safety No Improvements
High number of crashes Poor Interchange Access
Significant Reduction of Speed- Differentials Entering and Exiting I-10
Anticipated Reduction of Crashes Improved Interchange Access
Maintenance of Traffic No Impacts Temporary Impacts during
Construction Evacuation Route No Improvements Improved Interchange Access
Geometric Design No Improvements Does Not Meet Standards
Improved Geometry Improved Truck Flow and Operations
Meets Current Standards

Interstate 10 (SR 8)/ SR 200 (US 301) Interchange
Interchange Modification Report
95
Implementation of the Preferred Alternative will significantly improve the overall safety and operations within the study area when compared to the No-Build Alternative.
The IMR Preferred Alternative will correct the following existing interchange deficiencies:
Substandard loop ramp and turning radii design (Northwest Quadrant) o The I-10 westbound off-ramp gore area will be relocated to east of US 301 and
the CSX railroad crossing. This new at-grade location will be able to accommodate a higher design speed (50 MPH) off-ramp design from I-10 away from the interchange crest vertical curve.
o The existing left-turn movement was relocated to the northeast quadrant of the interchange as a right-turn movement.
o The loop ramp radius will be increased from 250 feet to 270 feet. Substandard loop ramp and turning radii design (Southwest Quadrant)
o The loop ramp radius will be increased from 230 feet to 272 feet. Speed differentials within the interchange limits
o The new eastbound on-ramp location will provide the appropriate length for vehicles to accelerate and reach higher speeds before merging with the I-10 mainline traffic.
o The new westbound off-ramp will provide the appropriate length and number of lanes for vehicles to decelerate before reaching the low design speed loop ramp to access US 301.
Insufficient I-10 westbound exit ramp deceleration length o The off-ramp will be widened from one to two lanes. o The deceleration length will be increased from 880 feet to 1,040 feet.
Insufficient queue storage bay lengths along US 301 o The existing US 301 northbound to I-10 eastbound movement will be relocated
from a left-turn lane controlled by a signal to a free-flow through-right turn lane. o The full median openings at Boxcar Drive and Baldwin Inn Hotel will be
removed. o The storage bay length of all the left-turn lanes will be extended within the study
limits. Short weaving distance between the loop ramps along US 301 southbound
o The auxiliary lane (third lane between the loop ramps) will be removed by eliminating the free-flow right movement from the westbound ramp terminal.
o The right-turn lane will be widened from one to two lanes and will be controlled by a traffic signal.
Limited access right-of-way along US 301 does not meet current standards o Limited access right-of-way will be acquired along the east side of US 301 to
meet current standards and protect interchange operations. Substandard access management along US 301 south of I-10
o Access management along US 301 will be improved by extending the median left-turn lane bays and modifying the existing median openings.
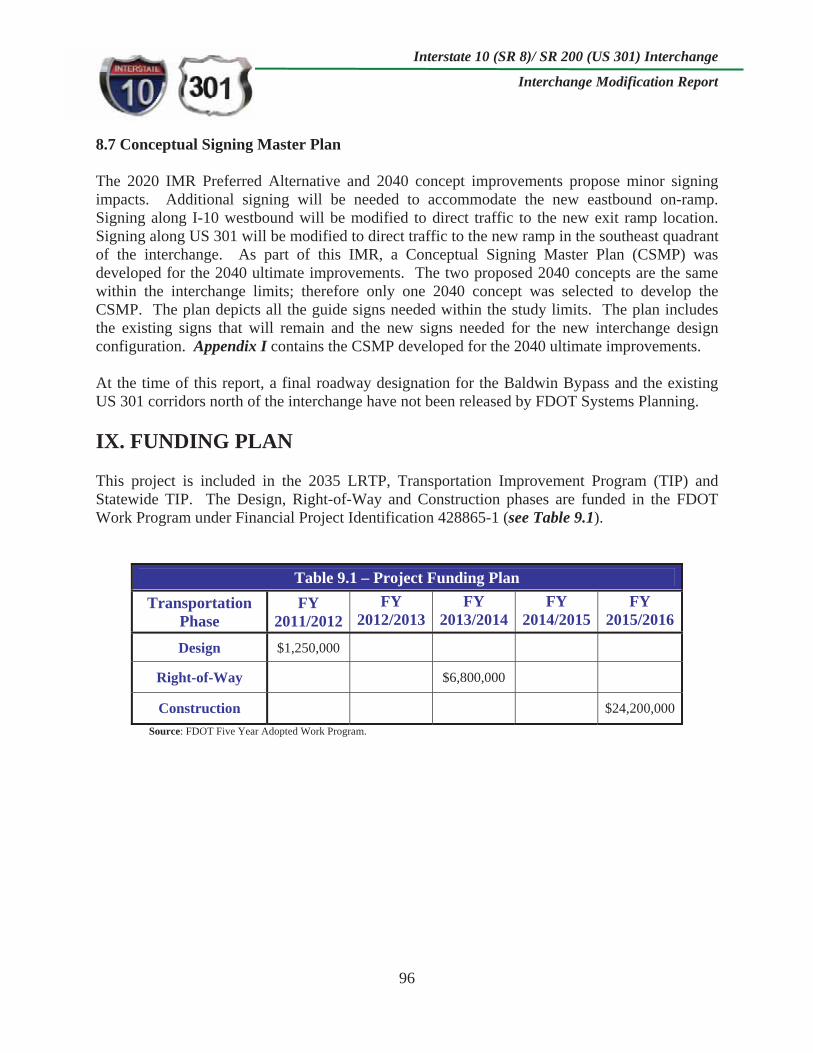
Interstate 10 (SR 8)/ SR 200 (US 301) Interchange
Interchange Modification Report
96
8.7 Conceptual Signing Master Plan
The 2020 IMR Preferred Alternative and 2040 concept improvements propose minor signing impacts. Additional signing will be needed to accommodate the new eastbound on-ramp. Signing along I-10 westbound will be modified to direct traffic to the new exit ramp location. Signing along US 301 will be modified to direct traffic to the new ramp in the southeast quadrant of the interchange. As part of this IMR, a Conceptual Signing Master Plan (CSMP) was developed for the 2040 ultimate improvements. The two proposed 2040 concepts are the same within the interchange limits; therefore only one 2040 concept was selected to develop the CSMP. The plan depicts all the guide signs needed within the study limits. The plan includes the existing signs that will remain and the new signs needed for the new interchange design configuration. Appendix I contains the CSMP developed for the 2040 ultimate improvements.
At the time of this report, a final roadway designation for the Baldwin Bypass and the existing US 301 corridors north of the interchange have not been released by FDOT Systems Planning.
IX. FUNDING PLAN
This project is included in the 2035 LRTP, Transportation Improvement Program (TIP) and Statewide TIP. The Design, Right-of-Way and Construction phases are funded in the FDOT Work Program under Financial Project Identification 428865-1 (see Table 9.1).
Table 9.1 – Project Funding Plan Transportation
PhaseFY
2011/2012FY
2012/2013FY
2013/2014FY
2014/2015FY
2015/2016
Design $1,250,000
Right-of-Way $6,800,000
Construction $24,200,000 Source: FDOT Five Year Adopted Work Program.

Interstate 10 (SR 8)/ SR 200 (US 301) Interchange
Interchange Modification Report
97
X. RECOMMENDATIONS
The IMR Preferred Alternative was developed based on the evaluation and analysis of several key evaluation parameters including: environmental considerations, traffic LOS, safety, maintenance of traffic, construction cost and right-of-way cost. This alternative will add the necessary improvements to enhance traffic operations, safety and interstate access. The IMR Preferred Alternative is the most prudent when compared with the No-Build Alternative for the following reasons:
Meets future growth in travel demand. Meets existing and future high truck traffic demand. Significantly improves LOS, traffic flow and interstate access. Anticipated to reduce crashes related to left-turn maneuvers, sight distance, traffic signal timing, weaving maneuvers, speed differentials and poor intersection geometry. Improves interchange geometric design and access management helping the corridors to be more effective during emergency evacuation events. Helps service the social demands and economic developments of the area. There are no significant environmental impacts.
In addition, the IMR Preferred Alternative will provide the necessary interchange footprint to accommodate an MOT plan to replace the US 301 and CSX bridges without closing the interchange and maintaining all travel lanes and ramps at all times during construction.
By the year 2040, the two proposed intersection concepts along US 301 will preserve an arterial acceptable LOS when comparing to the 2020 Preferred Alternative. In terms of traffic operations, Concept #2 will be a more suitable and practical design when compared to Concept #1 based on the following:
Better Truck Route– Seamless connection between I-10 and the Baldwin Bypass corridor. No Weaving Maneuvers – No need for the northbound traffic from I-10 to weave over to continue along the Baldwin Bypass, reducing the chances of sideswipe crashes. Access Management – Eliminates the median opening between the I-10 westbound ramp terminal and the next intersection to the north, reducing the chances of angle and left-turn crashes. Critical Movement – The critical movement north of the interchange is traffic traveling between I-10 and the Baldwin Bypass. Therefore, the Baldwin Bypass will operate as the main corridor.

Interstate 10 (SR 8)/ SR 200 (US 301) Interchange
Interchange Modification Report
98
Based on the evaluation conducted and documented in this Interchange Modification Report, it is clear that the Preferred Alternative will meet the overall project objectives of this interchange study. These objectives are:
Evaluate future geometric improvements in terms of safety, capacity, operations and interstate access. Identify existing deficiencies in the area. Improve the mobility of the I-10 and US 301 users.
The needs addressed through the Preferred Alternative cannot be addressed through modifications to other interchanges, TSM strategies, or other multimodal improvements. The implementation of this interchange design was found feasible and presents a balance in providing the needed improvements for this area. The Florida Department of Transportation District 2 recommends the Preferred Alternative be approved, as proposed, for a change in interstate access.