florida 1/1/2015 workers compensation rate filing · office & clerical –2.1% –59.1% goods...
TRANSCRIPT
© Copyright 2014 National Council on Compensation Insurance, Inc. All Rights Reserved.
Florida 1/1/2015Workers Compensation Rate FilingKirt Dooley, FCAS, MAAAOctober 14, 2014
1
© Copyright 2014 National Council on Compensation Insurance, Inc. All Rights Reserved.
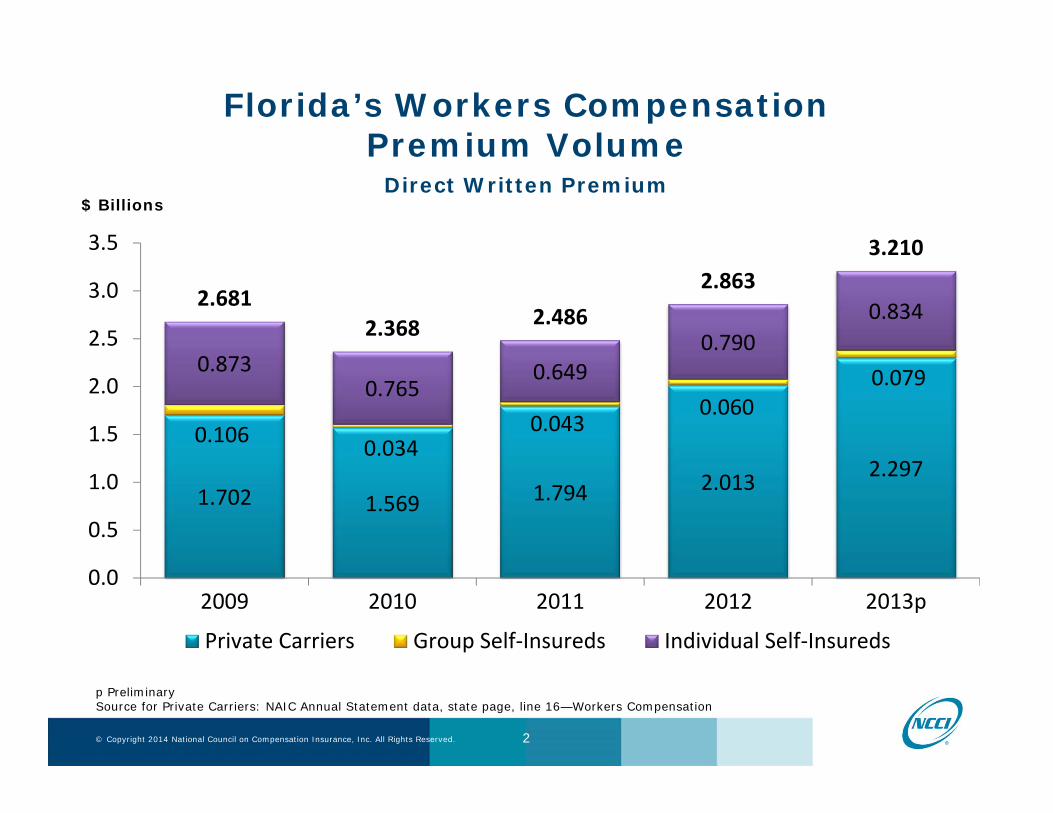
1.702 1.569 1.794 2.013 2.2970.106 0.034
0.0430.060
0.0790.8730.765
0.6490.790
0.8342.6812.368 2.486
2.8633.210
0.0
0.5
1.0
1.5
2.0
2.5
3.0
3.5
2009 2010 2011 2012 2013p
Private Carriers Group Self‐Insureds Individual Self‐Insureds
Florida’s Workers Compensation Premium Volume
Direct Written Premium$ Billions
p PreliminarySource for Private Carriers: NAIC Annual Statement data, state page, line 16—Workers Compensation
2
© Copyright 2014 National Council on Compensation Insurance, Inc. All Rights Reserved.
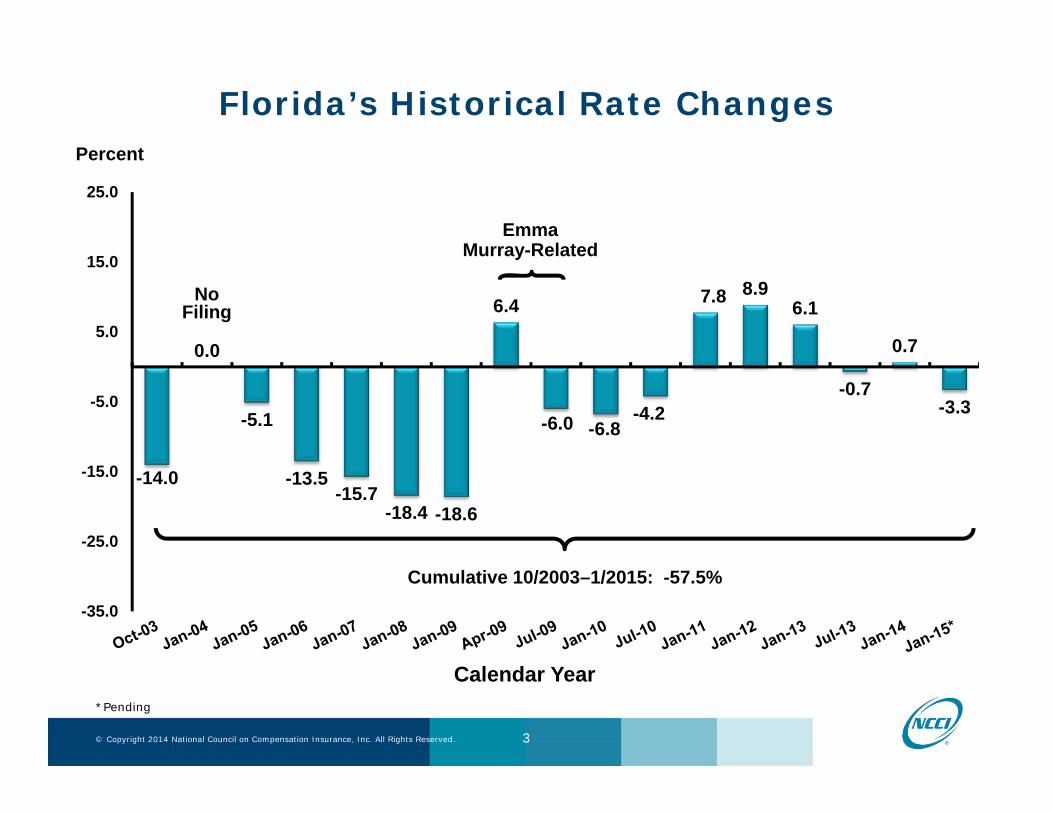
Florida’s Historical Rate Changes
-14.0
0.0
-5.1
-13.5-15.7
-18.4 -18.6
6.4
-6.0 -6.8-4.2
7.8 8.96.1
-0.7
0.7
-3.3
-35.0
-25.0
-15.0
-5.0
5.0
15.0
25.0
Percent
No Filing
Cumulative 10/2003–1/2015: -57.5%
Calendar Year
EmmaMurray-Related
*Pending
3
© Copyright 2014 National Council on Compensation Insurance, Inc. All Rights Reserved.
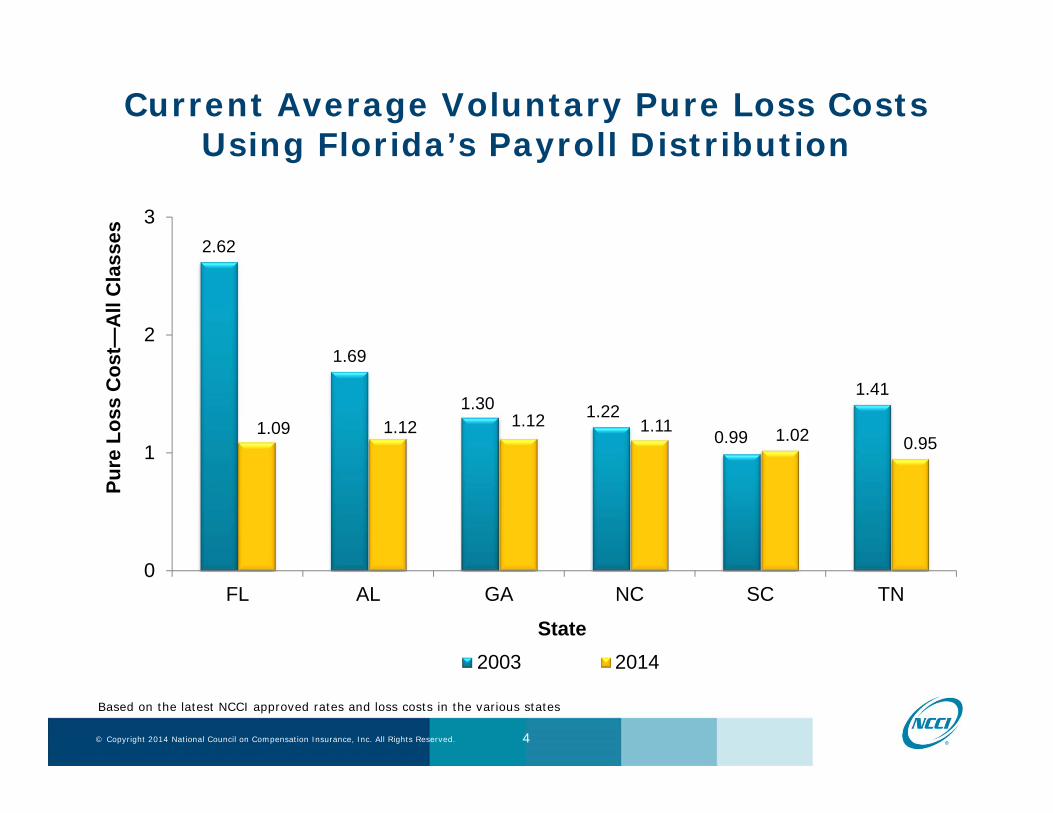
Current Average Voluntary Pure Loss Costs Using Florida’s Payroll Distribution
2.62
1.69
1.30 1.220.99
1.41
1.09 1.12 1.12 1.11 1.02 0.95
0
1
2
3
FL AL GA NC SC TN
Pure
Los
s C
ost—
All
Cla
sses
State2003 2014
Based on the latest NCCI approved rates and loss costs in the various states
4

© Copyright 2014 National Council on Compensation Insurance, Inc. All Rights Reserved. 5
Workers Compensation Premium Rate Ranking
Premium Rate Index per $100 of Payroll
0.88
1.82
3.48
0.0
1.0
2.0
3.0
ND IN AR MA VA NV UT DC WV OR CO KY KS MS AZ TX MD MI OH GA WY NE AL FL HI NC SD IA WI TN MONM RI MNWA SC PA ID ME NH MT LA DE VT IL OK AK NY NJ CT CA
Source: 2014 Oregon Workers’ Compensation Premium Rate Ranking SummaryIndexes based on rates in effect on January 1, 2014
FL Ranking24th lowest (out of 51)

© Copyright 2014 National Council on Compensation Insurance, Inc. All Rights Reserved.
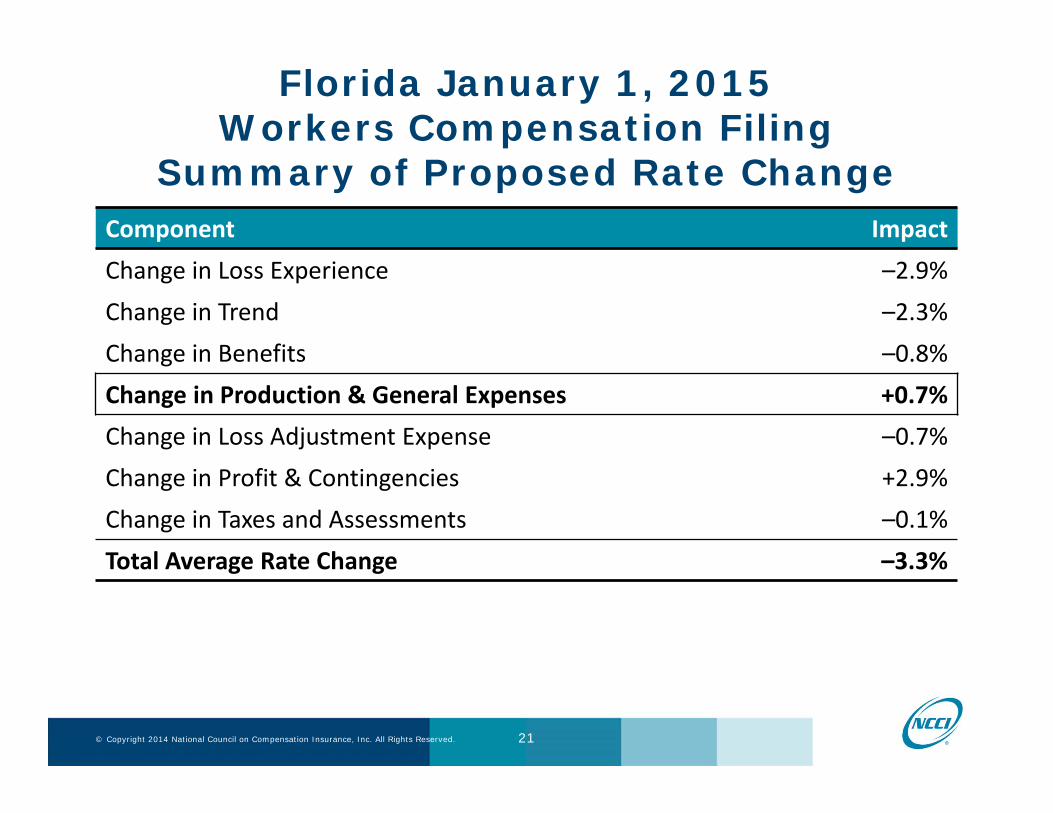
Florida January 1, 2015Workers Compensation Filing
Summary of Proposed Rate ChangeComponent ImpactChange in Loss Experience –2.9%Change in Trend –2.3%Change in Benefits –0.8%Change in Production & General Expenses +0.7%Change in Loss Adjustment Expense –0.7%Change in Profit & Contingencies +2.9%Change in Taxes and Assessments –0.1%Total Average Rate Change –3.3%
6
© Copyright 2014 National Council on Compensation Insurance, Inc. All Rights Reserved.
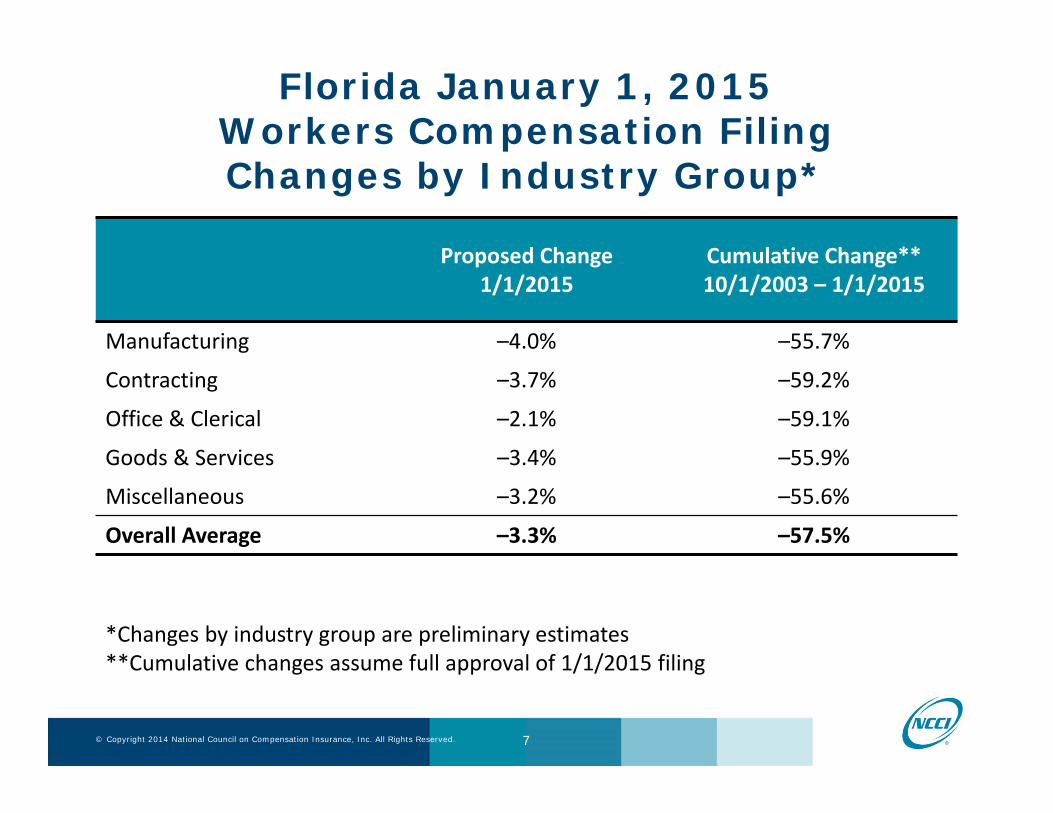
Proposed Change1/1/2015
Cumulative Change** 10/1/2003 – 1/1/2015
Manufacturing –4.0% –55.7%
Contracting –3.7% –59.2%
Office & Clerical –2.1% –59.1%
Goods & Services –3.4% –55.9%
Miscellaneous –3.2% –55.6%
Overall Average –3.3% –57.5%
Florida January 1, 2015 Workers Compensation FilingChanges by Industry Group*
7
*Changes by industry group are preliminary estimates**Cumulative changes assume full approval of 1/1/2015 filing

© Copyright 2014 National Council on Compensation Insurance, Inc. All Rights Reserved.
Florida January 1, 2015Workers Compensation Filing
Summary of Proposed Rate ChangeComponent ImpactChange in Loss Experience –2.9%Change in Trend –2.3%Change in Benefits –0.8%Change in Production & General Expenses +0.7%Change in Loss Adjustment Expense –0.7%Change in Profit & Contingencies +2.9%Change in Taxes and Assessments –0.1%Total Average Rate Change –3.3%
8
© Copyright 2014 National Council on Compensation Insurance, Inc. All Rights Reserved.
Experience Period
Two policy years are again used as the experience base in this year’s filing This is consistent with the last three filings
Policy year data reflects a more accurate matching of losses and premium
Use of two calendar-accident years would have resulted in a change of –3.4%
9

© Copyright 2014 National Council on Compensation Insurance, Inc. All Rights Reserved.
Loss Development
Average of paid and paid + case loss development Consistent with previous Florida filings Neither method clearly superior to the other Makes use of all available information
Three-year average development factors Consistent with last four Florida filings Loss development factors relatively stable
No changes to methodology with a material impact on the overall rate level change
10

© Copyright 2014 National Council on Compensation Insurance, Inc. All Rights Reserved.
Florida January 1, 2015Workers Compensation Filing
Summary of Proposed Rate ChangeComponent ImpactChange in Loss Experience –2.9%Change in Trend –2.3%Change in Benefits –0.8%Change in Production & General Expenses +0.7%Change in Loss Adjustment Expense –0.7%Change in Profit & Contingencies +2.9%Change in Taxes and Assessments –0.1%Total Average Rate Change –3.3%
11
© Copyright 2014 National Council on Compensation Insurance, Inc. All Rights Reserved.
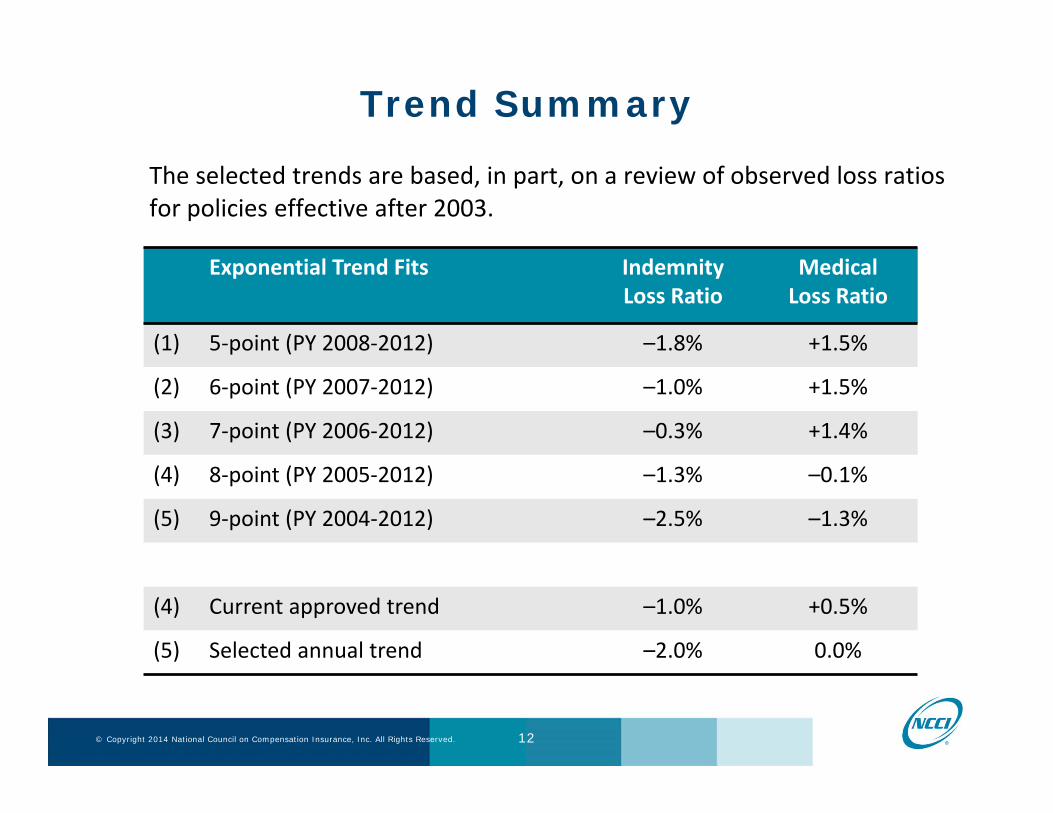
Trend Summary
The selected trends are based, in part, on a review of observed loss ratios for policies effective after 2003.
Exponential Trend Fits Indemnity Loss Ratio
Medical Loss Ratio
(1) 5‐point (PY 2008‐2012) –1.8% +1.5%
(2) 6‐point (PY 2007‐2012) –1.0% +1.5%
(3) 7‐point (PY 2006‐2012) –0.3% +1.4%
(4) 8‐point (PY 2005‐2012) –1.3% –0.1%
(5) 9‐point (PY 2004‐2012) –2.5% –1.3%
(4) Current approved trend –1.0% +0.5%
(5) Selected annual trend –2.0% 0.0%
12
© Copyright 2014 National Council on Compensation Insurance, Inc. All Rights Reserved.
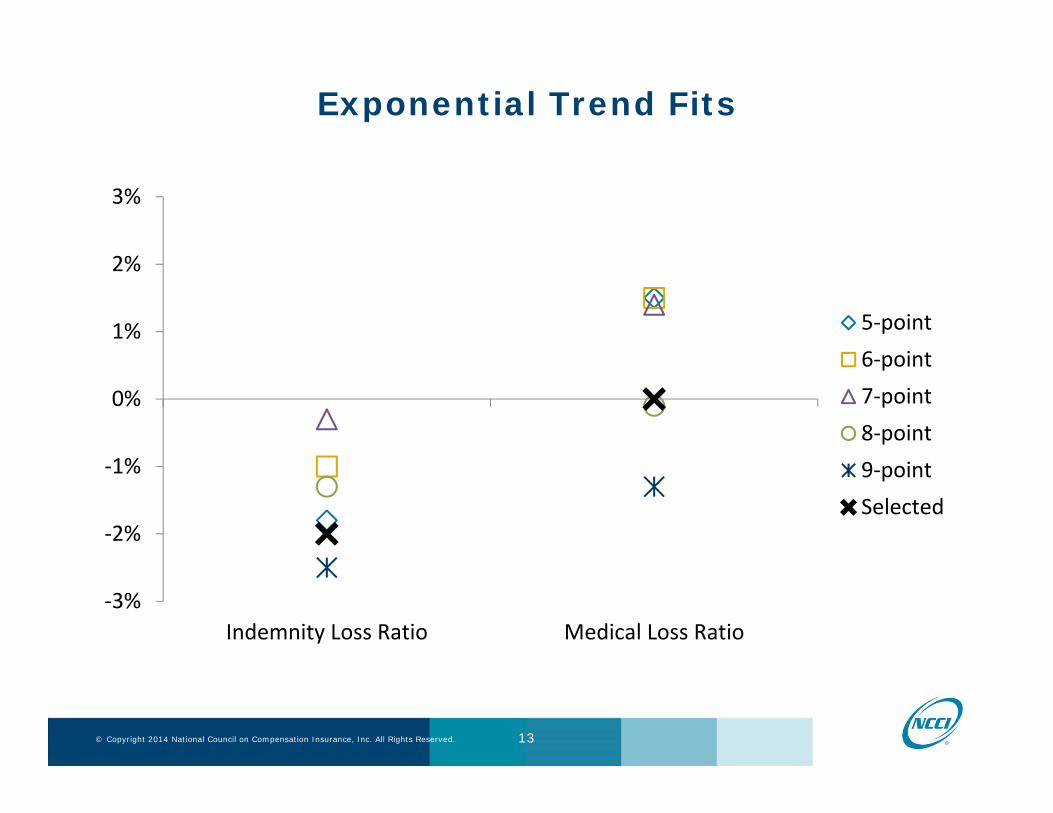
Exponential Trend Fits
‐3%
‐2%
‐1%
0%
1%
2%
3%
Indemnity Loss Ratio Medical Loss Ratio
5‐point6‐point7‐point8‐point9‐pointSelected
13

© Copyright 2014 National Council on Compensation Insurance, Inc. All Rights Reserved.
0.0
0.1
0.2
0.3
0.4
0.5
1998 1999 2000 2001 2002 2003 2004 2005 2006 2007 2008 2009 2010 2011 2012
Loss Ratio
Policy Year
Florida’s Indemnity Loss RatioStandard CoverageAverage of Paid and Paid+Case
Based on NCCI’s financial data developed to ultimate and adjusted to the current level.
14

© Copyright 2014 National Council on Compensation Insurance, Inc. All Rights Reserved.
Projected
0.00
0.05
0.10
0.15
0.20
0.25
0.30
2004 2005 2006 2007 2008 2009 2010 2011 2012 2013 2014 2015
Loss Ratio
Policy Year
Florida’s Indemnity Loss RatioStandard CoverageAverage of Paid and Paid+Case
Based on NCCI’s financial data developed to ultimate and adjusted to the current level.
15

© Copyright 2014 National Council on Compensation Insurance, Inc. All Rights Reserved.
Florida’s Medical Loss RatioStandard CoverageAverage of Paid and Paid+Case
Based on NCCI’s financial data developed to ultimate and adjusted to the current level.
0.2
0.3
0.4
0.5
0.6
0.7
1998 1999 2000 2001 2002 2003 2004 2005 2006 2007 2008 2009 2010 2011 2012
Loss Ratio
Policy Year
16

© Copyright 2014 National Council on Compensation Insurance, Inc. All Rights Reserved.
Florida’s Medical Loss RatioStandard CoverageAverage of Paid and Paid+Case
Based on NCCI’s financial data developed to ultimate and adjusted to the current level.
Projected
0.20
0.25
0.30
0.35
0.40
0.45
0.50
2004 2005 2006 2007 2008 2009 2010 2011 2012 2013 2014 2015
Loss Ratio
Policy Year
17

© Copyright 2014 National Council on Compensation Insurance, Inc. All Rights Reserved.
Florida’s Total Loss Ratio (Excl. LAE)Standard CoverageAverage of Paid and Paid+Case
Based on NCCI’s financial data developed to ultimate and adjusted to the current level.
Proposed Rates
8-Point Exponential Fit
0.00
0.10
0.20
0.30
0.40
0.50
0.60
0.70
0.80
2004 2005 2006 2007 2008 2009 2010 2011 2012 2013 2014 2015
Loss
Rat
io
Policy Year
The proposed rates assume that future loss experience will improve
18

© Copyright 2014 National Council on Compensation Insurance, Inc. All Rights Reserved.
Florida January 1, 2015Workers Compensation Filing
Summary of Proposed Rate ChangeComponent ImpactChange in Loss Experience –2.9%Change in Trend –2.3%Change in Benefits –0.8%Change in Production & General Expenses +0.7%Change in Loss Adjustment Expense –0.7%Change in Profit & Contingencies +2.9%Change in Taxes and Assessments –0.1%Total Average Rate Change –3.3%
19

© Copyright 2014 National Council on Compensation Insurance, Inc. All Rights Reserved.
Benefit Change
Revisions to the Florida Workers’ Compensation Reimbursement Manual for Hospitals Service categories affected: Hospital Inpatient Hospital Outpatient Surgical Implants
Estimated impact on medical costs = –1.1% Estimated impact on overall costs = –0.8%
20
© Copyright 2014 National Council on Compensation Insurance, Inc. All Rights Reserved.
Florida January 1, 2015Workers Compensation Filing
Summary of Proposed Rate ChangeComponent ImpactChange in Loss Experience –2.9%Change in Trend –2.3%Change in Benefits –0.8%Change in Production & General Expenses +0.7%Change in Loss Adjustment Expense –0.7%Change in Profit & Contingencies +2.9%Change in Taxes and Assessments –0.1%Total Average Rate Change –3.3%
21

© Copyright 2014 National Council on Compensation Insurance, Inc. All Rights Reserved.
Florida January 1, 2015Workers Compensation Filing
Summary of Proposed Rate ChangeComponent ImpactChange in Loss Experience –2.9%Change in Trend –2.3%Change in Benefits –0.8%Change in Production & General Expenses +0.7%Change in Loss Adjustment Expense –0.7%Change in Profit & Contingencies +2.9%Change in Taxes and Assessments –0.1%Total Average Rate Change –3.3%
22

© Copyright 2014 National Council on Compensation Insurance, Inc. All Rights Reserved.
Florida January 1, 2015Workers Compensation Filing
Summary of Proposed Rate ChangeComponent ImpactChange in Loss Experience –2.9%Change in Trend –2.3%Change in Benefits –0.8%Change in Production & General Expenses +0.7%Change in Loss Adjustment Expense –0.7%Change in Profit & Contingencies +2.9%Change in Taxes and Assessments –0.1%Total Average Rate Change –3.3%
23

© Copyright 2014 National Council on Compensation Insurance, Inc. All Rights Reserved.
Profit & Contingencies Provision
In order to generate a total rate of return commensurate with the industry’s cost of capital, the indicated P&C provision is 6.6% Based on an economic internal rate of return
analysis Excludes anticipated policyholder dividends Cost of capital is approximately 10.5%
Targeted P&C provision increased from 2.5% to 4.5% in the proposed filing
24

© Copyright 2014 National Council on Compensation Insurance, Inc. All Rights Reserved.
Profit & Contingencies Provision
In past filings, NCCI limited the targeted P&C provision to 2.5% Unprecedented economic conditions have caused
interest rates to remain near historic lows for an extended period This is expected to negatively impact the
insurance industry’s investment income for the foreseeable future
In light of these conditions, NCCI is no longer limiting the targeted P&C provision to 2.5%
25

© Copyright 2014 National Council on Compensation Insurance, Inc. All Rights Reserved.
Florida January 1, 2015Workers Compensation Filing
Summary of Proposed Rate ChangeComponent ImpactChange in Loss Experience –2.9%Change in Trend –2.3%Change in Benefits –0.8%Change in Production & General Expenses +0.7%Change in Loss Adjustment Expense –0.7%Change in Profit & Contingencies +2.9%Change in Taxes and Assessments –0.1%Total Average Rate Change –3.3%
26

© Copyright 2014 National Council on Compensation Insurance, Inc. All Rights Reserved.
Florida January 1, 2015Workers Compensation Filing Summary Over the past several years, total loss experience
has been relatively stable A stable system still requires minor periodic
adjustments to the average rate level Full approval is important to help maintain stable
rates going forward
27