floods – flood hazard assesment
TRANSCRIPT
FLOODS – FLOOD HAZARD ASSESMENT
By Niki EVELPIDOU
Introduction
The term flood refers to the overflow of water onto usually dry land. Flooding results when the water level rises and overflows the banks or leeves of a river, or when high ocean waters wash over the coast (Encyclopedia of Weather and Natural Disasters, 2008). This rise of the water level and thus the increase in water volume is primarily due to the influence of weather phenomena.
Weather conditions are responsible for the increase of the water volume in a geological system (e.g. drainage system, coastal system). In the case of a river, the water added is offered in the form of precipitation, namely rainfall, while in the case of the coast, high waves are caused by storm waves (storm surges) and are associated with cyclonic weather systems (cyclones).
There are two main types of floods distinguished according to their geographical distribution:
• inland floods: produced by precipitation, • coastal floods: produced by the combined action of the sea and/or
precipitation. These phenomena occur only during extremely sea level rising. However, coastal areas are mainly affected by inland floods.
Floods occur frequently in some parts of the world. While for some areas, yearly flooding is necessary to sustain crops, for other areas flooding spells disaster.
Fluvial floods
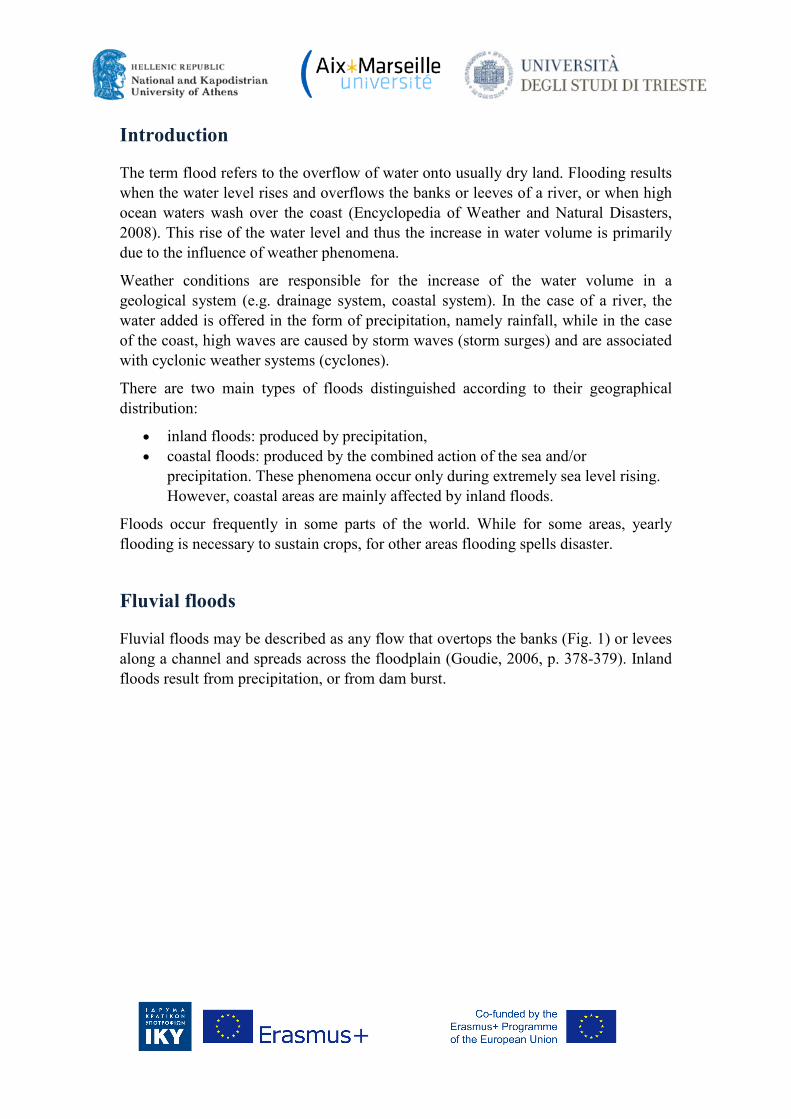
Fluvial floods may be described as any flow that overtops the banks (Fig. 1) or levees along a channel and spreads across the floodplain (Goudie, 2006, p. 378-379). Inland floods result from precipitation, or from dam burst.
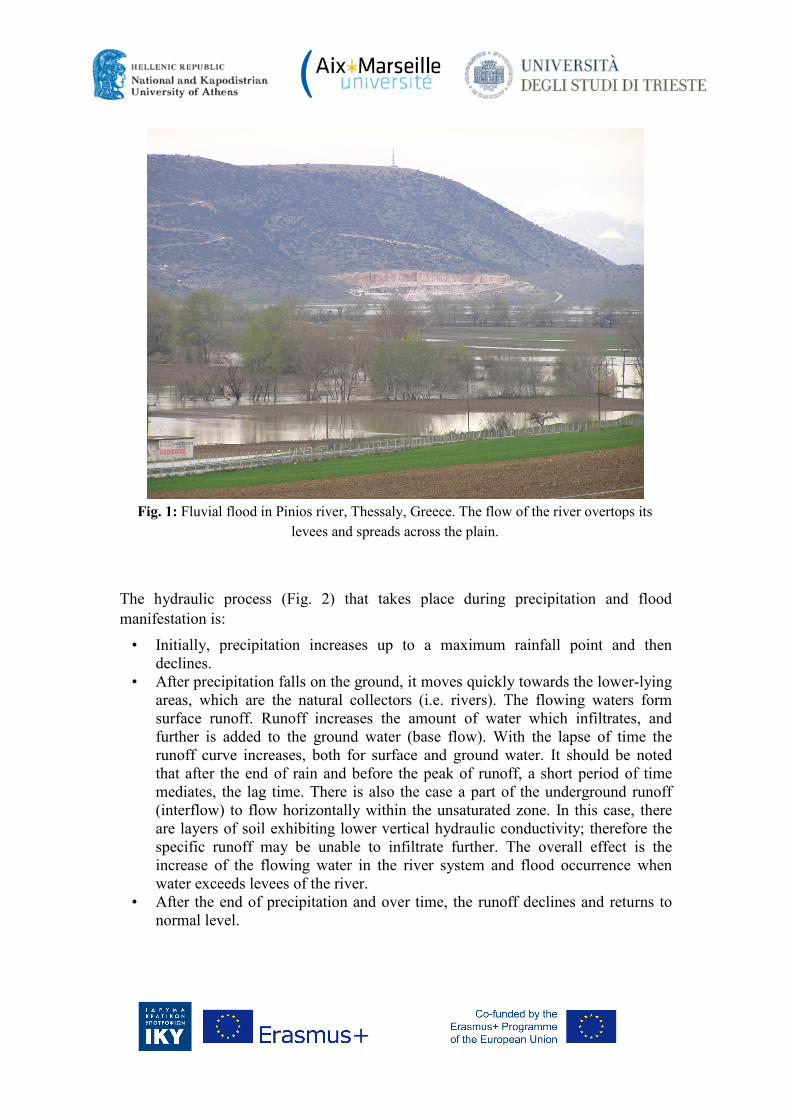
The hydraulic process (Fig. 2) that takes place during precipitation and flood manifestation is:
• Initially, precipitation increases up to a maximum rainfall point and then declines.
• After precipitation falls on the ground, it moves quickly towards the lower-lying areas, which are the natural collectors (i.e. rivers). The flowing waters form surface runoff. Runoff increases the amount of water which infiltrates, and further is added to the ground water (base flow). With the lapse of time the runoff curve increases, both for surface and ground water. It should be noted that after the end of rain and before the peak of runoff, a short period of time mediates, the lag time. There is also the case a part of the underground runoff (interflow) to flow horizontally within the unsaturated zone. In this case, there are layers of soil exhibiting lower vertical hydraulic conductivity; therefore the specific runoff may be unable to infiltrate further. The overall effect is the increase of the flowing water in the river system and flood occurrence when water exceeds levees of the river.
• After the end of precipitation and over time, the runoff declines and returns to normal level.
Fig. 1: Fluvial flood in Pinios river, Thessaly, Greece. The flow of the river overtops its
levees and spreads across the plain.
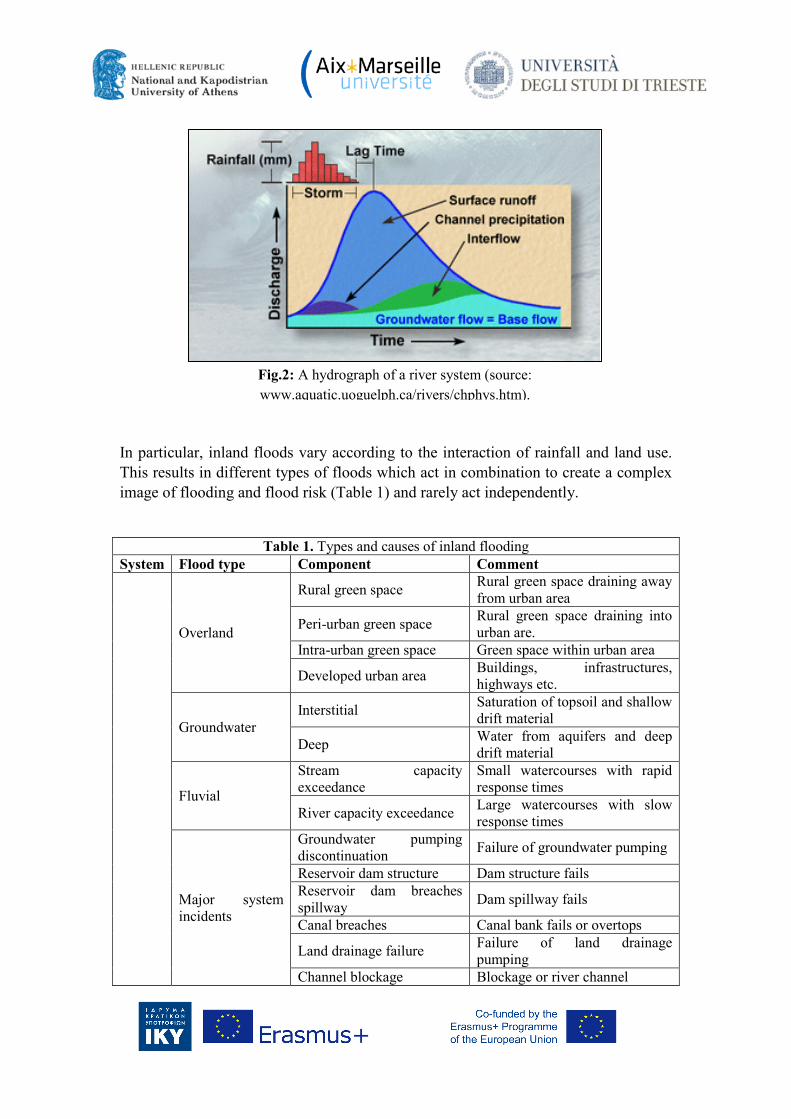
In particular, inland floods vary according to the interaction of rainfall and land use. This results in different types of floods which act in combination to create a complex image of flooding and flood risk (Table 1) and rarely act independently.
Table 1. Types and causes of inland flooding
System Flood type Component Comment
Overland
Rural green space Rural green space draining away from urban area
Peri-urban green space Rural green space draining into urban are.
Intra-urban green space Green space within urban area
Developed urban area Buildings, infrastructures, highways etc.
Groundwater Interstitial Saturation of topsoil and shallow
drift material
Deep Water from aquifers and deep drift material
Fluvial
Stream capacity exceedance
Small watercourses with rapid response times
River capacity exceedance Large watercourses with slow response times
Major system incidents
Groundwater pumping discontinuation Failure of groundwater pumping
Reservoir dam structure Dam structure fails Reservoir dam breaches spillway Dam spillway fails
Canal breaches Canal bank fails or overtops
Land drainage failure Failure of land drainage pumping
Channel blockage Blockage or river channel
Fig.2: A hydrograph of a river system (source: www.aquatic.uoguelph.ca/rivers/chphys.htm).
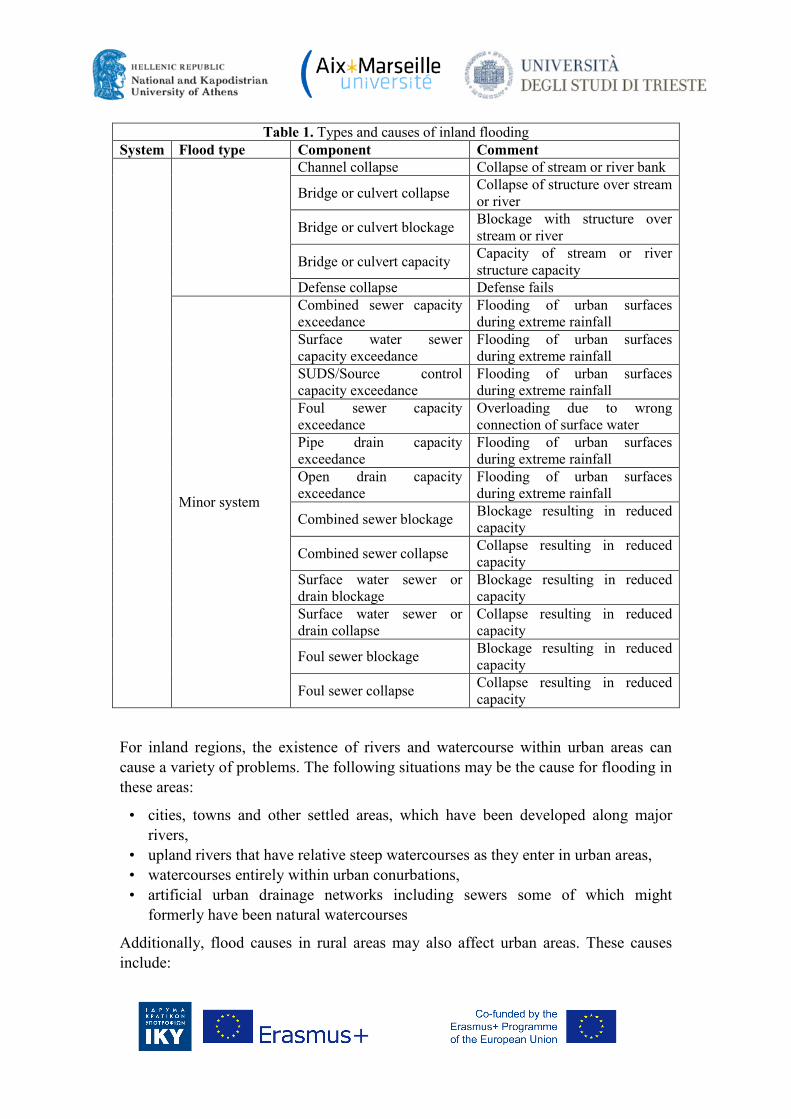
Table 1. Types and causes of inland flooding System Flood type Component Comment
Channel collapse Collapse of stream or river bank
Bridge or culvert collapse Collapse of structure over stream or river
Bridge or culvert blockage Blockage with structure over stream or river
Bridge or culvert capacity Capacity of stream or river structure capacity
Defense collapse Defense fails
Minor system
Combined sewer capacity exceedance
Flooding of urban surfaces during extreme rainfall
Surface water sewer capacity exceedance
Flooding of urban surfaces during extreme rainfall
SUDS/Source control capacity exceedance
Flooding of urban surfaces during extreme rainfall
Foul sewer capacity exceedance
Overloading due to wrong connection of surface water
Pipe drain capacity exceedance
Flooding of urban surfaces during extreme rainfall
Open drain capacity exceedance
Flooding of urban surfaces during extreme rainfall
Combined sewer blockage Blockage resulting in reduced capacity
Combined sewer collapse Collapse resulting in reduced capacity
Surface water sewer or drain blockage
Blockage resulting in reduced capacity
Surface water sewer or drain collapse
Collapse resulting in reduced capacity
Foul sewer blockage Blockage resulting in reduced capacity
Foul sewer collapse Collapse resulting in reduced capacity
For inland regions, the existence of rivers and watercourse within urban areas can cause a variety of problems. The following situations may be the cause for flooding in these areas:
• cities, towns and other settled areas, which have been developed along major rivers,
• upland rivers that have relative steep watercourses as they enter in urban areas, • watercourses entirely within urban conurbations, • artificial urban drainage networks including sewers some of which might
formerly have been natural watercourses
Additionally, flood causes in rural areas may also affect urban areas. These causes include:
• surcharges in water levels due to natural or man-made obstructions in the flood path (e.g. bridges),
• dam failure, • landslides and mudflows • inappropriate urban development (excessive encroachment in the floodway) • ice jams, • rapid snowmelt, • deforestation of drainage basins
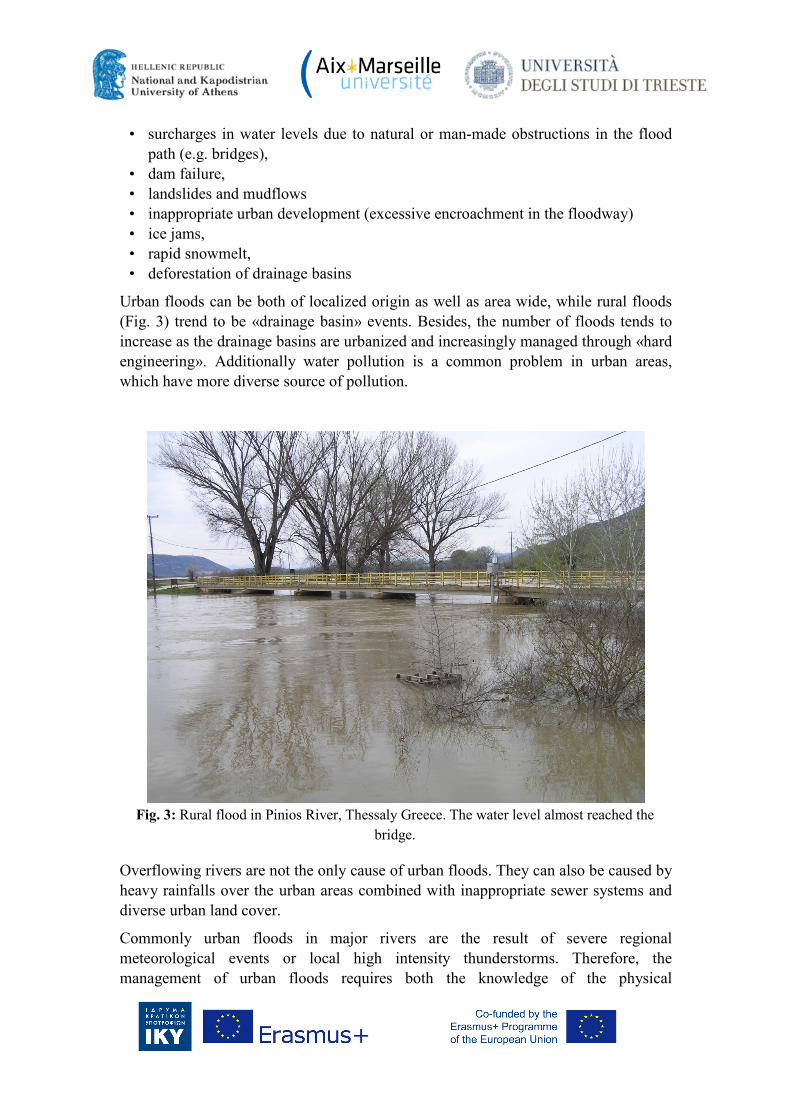
Urban floods can be both of localized origin as well as area wide, while rural floods (Fig. 3) trend to be «drainage basin» events. Besides, the number of floods tends to increase as the drainage basins are urbanized and increasingly managed through «hard engineering». Additionally water pollution is a common problem in urban areas, which have more diverse source of pollution.
Overflowing rivers are not the only cause of urban floods. They can also be caused by heavy rainfalls over the urban areas combined with inappropriate sewer systems and diverse urban land cover.
Commonly urban floods in major rivers are the result of severe regional meteorological events or local high intensity thunderstorms. Therefore, the management of urban floods requires both the knowledge of the physical
Fig. 3: Rural flood in Pinios River, Thessaly Greece. The water level almost reached the
bridge.
characteristics of specific flood events and an understanding of urban hydro-meteorological issues. Urban flooding therefore requires special attention due to its sheer complexity, as it incorporates social, economic, institutional and technical parameters.
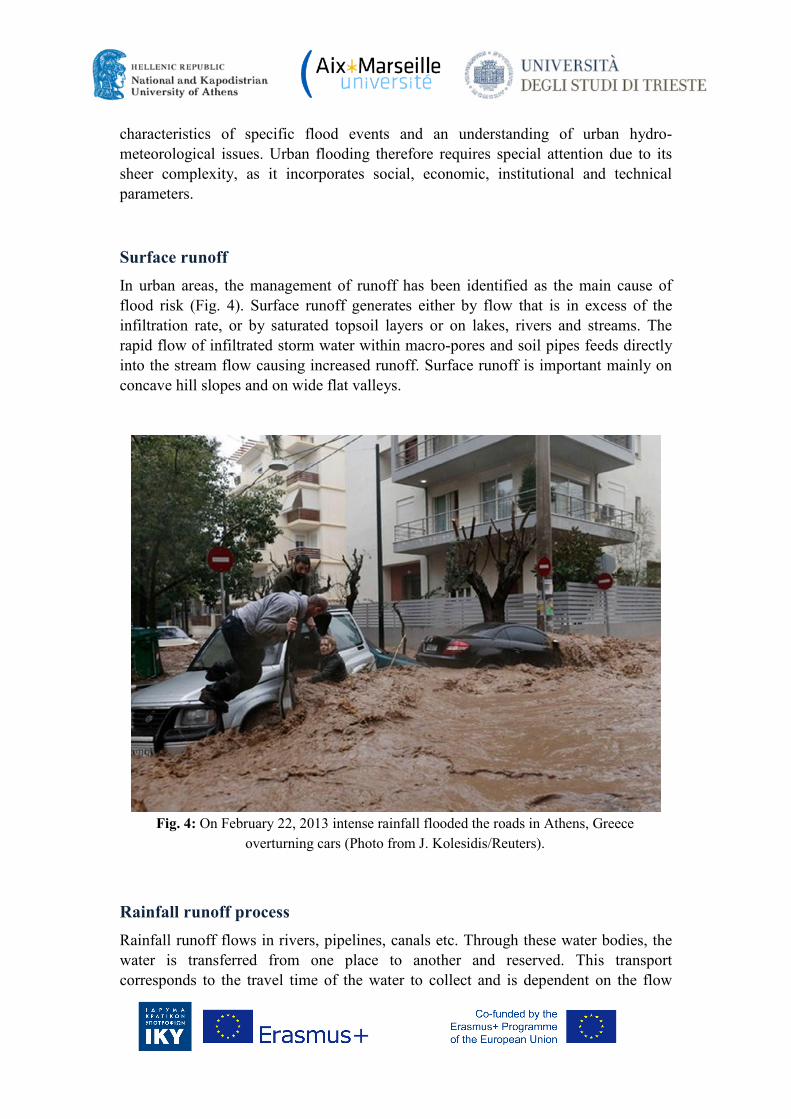
Surface runoff In urban areas, the management of runoff has been identified as the main cause of flood risk (Fig. 4). Surface runoff generates either by flow that is in excess of the infiltration rate, or by saturated topsoil layers or on lakes, rivers and streams. The rapid flow of infiltrated storm water within macro-pores and soil pipes feeds directly into the stream flow causing increased runoff. Surface runoff is important mainly on concave hill slopes and on wide flat valleys.
Rainfall runoff process Rainfall runoff flows in rivers, pipelines, canals etc. Through these water bodies, the water is transferred from one place to another and reserved. This transport corresponds to the travel time of the water to collect and is dependent on the flow
Fig. 4: On February 22, 2013 intense rainfall flooded the roads in Athens, Greece
overturning cars (Photo from J. Kolesidis/Reuters).
velocity and length of the watercourse. The flow velocity is influenced by the gradient of the bed of the water body, the water depth and the flow resistance. Retention corresponds to the temporary accumulation of water during its transport. This takes place either during heavy rain falls and the river itself is filled with water or when overbank flow occurs. Especially in physical rivers the retention has a strong effect on the propagation of the flood wave. In wide floodplains, soil and vegetation cause high flow resistance impacting positively on addressing the impending flood. They dampen the flood wave and attenuate its peak. Nevertheless, this impact is very complex and not fully understood.
Retention process of water within storm-water pipes and drainage channels is of minor significance during storm, where compact cross sections produce a nearly constant flow velocity. Moreover, the travel time of water depends on the shape of the channel i.e. if the channel is straight and if its surface is smooth. Thus, the flow acceleration decreases the transport time and the flood waves generating from flood with in storm-water pipe networks and channels. Especially, in storms they reach the downstream without attenuation and much faster than flood waves in physical rivers.
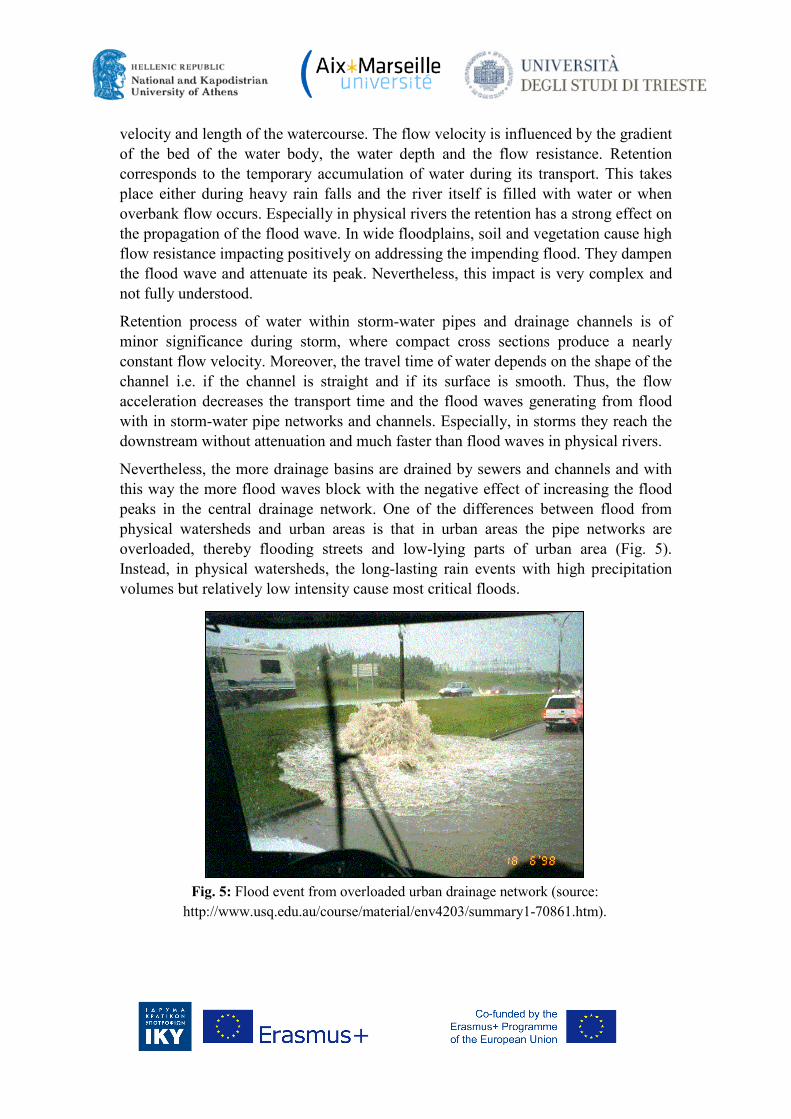
Nevertheless, the more drainage basins are drained by sewers and channels and with this way the more flood waves block with the negative effect of increasing the flood peaks in the central drainage network. One of the differences between flood from physical watersheds and urban areas is that in urban areas the pipe networks are overloaded, thereby flooding streets and low-lying parts of urban area (Fig. 5). Instead, in physical watersheds, the long-lasting rain events with high precipitation volumes but relatively low intensity cause most critical floods.
Fig. 5: Flood event from overloaded urban drainage network (source:
http://www.usq.edu.au/course/material/env4203/summary1-70861.htm).
Because of the distinctive differences in the flood waves, their accumulation in the river is hard to determinate. Thus, it is it becomes difficult to take measures to reduce floods in urban rivers.
Ground water flow Groundwater flows underground and fill the pores and cavities of the saturated zone. 60% to 80% of the long-term flow volume in the rivers is a result of groundwater discharge. Between interflow and surface runoff, the interflow is much slower process and it can takes years before the infiltrated precipitation water can reach to surface. Furthermore the outflow of groundwater into river systems persists during long period of rain.
During floods, rapid changes in ground water outflow can be observed. The new infiltrated water can raise the groundwater table during heavy rain fall. In this way, it increases the hydraulic pressure in aquifer and in areas where ground water is very close to surface. As a result ground water recharges in the surface drainage network. Thereby, it carried the renewal of ground water, with the new infiltrated water enters into aquifer and the old outflows along the river. Probably the main characteristic of groundwater flooding is long duration (weeks and months), which is controlled by the ground water hydraulic conditions and aquifer properties.
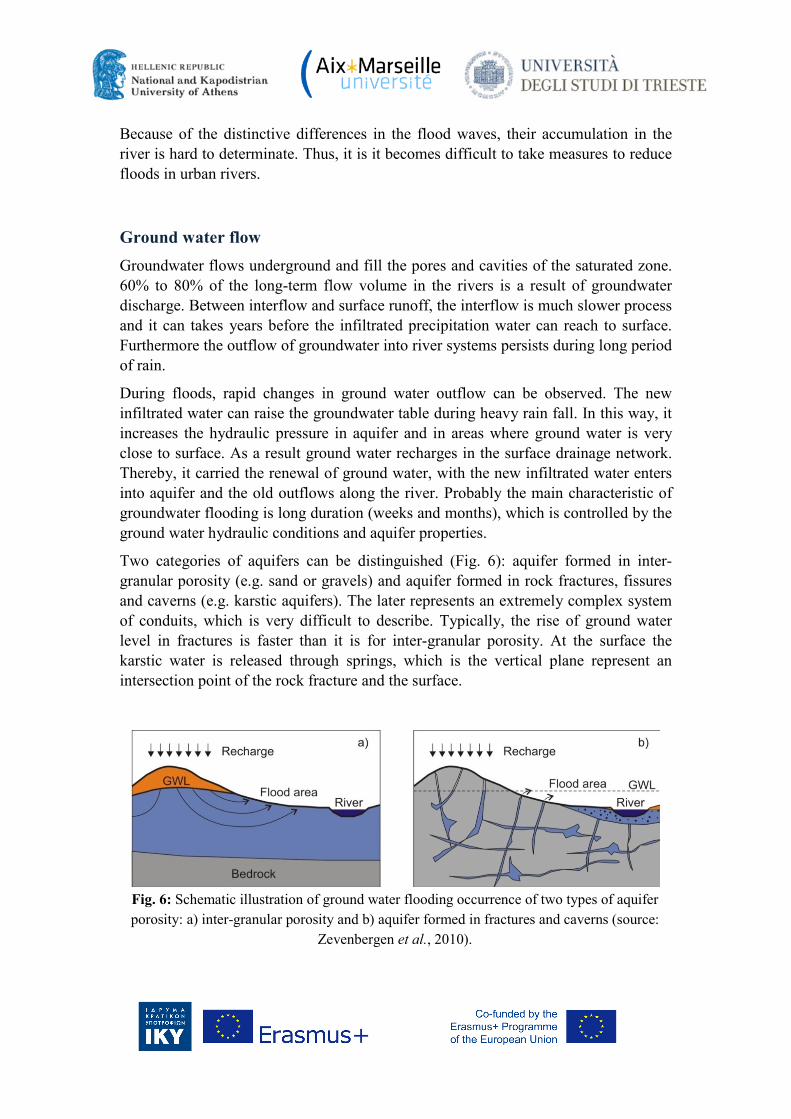
Two categories of aquifers can be distinguished (Fig. 6): aquifer formed in inter-granular porosity (e.g. sand or gravels) and aquifer formed in rock fractures, fissures and caverns (e.g. karstic aquifers). The later represents an extremely complex system of conduits, which is very difficult to describe. Typically, the rise of ground water level in fractures is faster than it is for inter-granular porosity. At the surface the karstic water is released through springs, which is the vertical plane represent an intersection point of the rock fracture and the surface.
Fig. 6: Schematic illustration of ground water flooding occurrence of two types of aquifer porosity: a) inter-granular porosity and b) aquifer formed in fractures and caverns (source:
Zevenbergen et al., 2010).
The aquifer recharge is of great importance in understanding how floods are created. In urban areas an additional source of aquifer recharge occurs through leakage from water distribution and sewage systems.
Prediction of ground water floods is extremely difficult because of the uncertainty of time and space scale groundwater flow and recharge process. Prediction models should integrate all relevant processes such as flow in saturated and unsaturated media, interaction of surface runoff and ground water flow, ground water interaction with sewage and water distribution systems etc. Recently a few models have been proposed for the simulation of groundwater regimes in urban areas.
On the other hand, groundwater in urban areas is affected by the surface land use changes. They reduce ground water recharge as they prevent the infiltration of surface water. Hence, the overall amount of ground water declines. Thus, the groundwater table is lowered while the surface runoff increases. In dry periods rivers draining urban areas have lower runoff than rural streams and at times they may become totally dry because of the reduction of ground water amount.
Categories of flooding The different types or rivers, watercourses, runoff regimes, flow progress and land uses combined with surface morphology generate various categories of flood occurrences. Generally flood events affecting the urban areas originate from six main causes:
1. in mountain areas, the effects of heavy, warm spring rains on winter snow causing sudden melting
2. regional weather systems that are blocked by high pressure systems and produce widespread heavy rain over large section of major river systems
3. flash floods in hilly and mountainous regions. Drainage areas of streams along with streams entering urban areas often cause serious damages to infrastructure. Flash floods and the runoff of small catchments may exceed periodic maximum discharge.
4. sort duration and high intensity thunderstorm- lead local flooding on small streams entirely within the urban areas. Cities experience the impacts of occasional thunderstorm rains. These events are predicted to rise in frequency because of increased development and intensification of storm events associated with the effects of climate changes.
5. sewer flooding due to blocked sewer overflows or surcharging though manhole covers. Flooding from sewers occurs when the rivers into which storm waters overflow are so high that the storm water cannot escape or when the sewers are not large enough to cope with all the water flowing into them upstream. Commonly low-lying urban areas close to rivers suffer from the overflowing of sewers, rather than overtopping of river banks.
6. groundwater flooding can be a result of prolonged heavy rainfall in certain geological conditions. In these conditions ground water flooding may be a real problem, especially where groundwater levels fluctuate widely. Unlike ground water flood events may last weeks or even months, surface water flood occurrences are usually of relative short duration. Such kind of flooding may follow wet period so normally dry springs at that time overflow and overwhelm all drainage systems.
Causes and effects of urban floods Urban floods results from intense, localized, often sort duration rain fall events and consequent surface runoff over impermeable surfaces which over load the hydraulic capacity of the urban drainage system.
The underlying geology and soil type affect the quality and the rate of infiltration. Urbanization changes the physical drainage regime, thus increasing the hazard of flooding in depressions and other areas where surface water runoff naturally collects.
Surface runoff is affected as follows: • increase runoff volumes due to reduced rain water infiltration and
evapotranspiration • increase the speed of runoff, due to hydraulic improvements of conveyance
channels • reducing the catchment response time by restricting absorption and
interception, and thereby increasing the maximum rainfall intensity causing the peak discharge.
It is estimated that urbanization increases the mean annual flood from 1.8 to 8 times, and 100-year flood from 1.8 to 3.8 times. Indicatively the economic cost in renovating a house after a flood event is between 10,000 and 50,000 Euros.
Hydrological models The term hydrological model refers to a wide range of mathematical transformations using field data and reasonable assumptions on physical mechanisms, to quantify the hydrologic variables that interest in practical applications (Efstratiadis et al., 2009).
Many models have been developed for river catchments throughout the world, with various degrees of complexity, from simple empirical formulae or correlations to the complex mathematical models representing all phases of the water balance of a river basin.
In the 80s, the engineering using simple hydraulic models, which could be solved with the help of a single calculator and complex questions that require high accuracy could be answered with physical models. Nowadays, the numerical flow models are solved by means of a computer. The model sequence starting from one-dimensional
linear pattern models continues dimensional models of water and results in three-dimensional integrated mathematical models.
The choice of a specific model depends on the type of information required and how the results are to be applied. The number and types of assumptions within a model, the kind of data need and the level of complexity are important factors when deciding which model to use. Simulated runoff as a result of a hydrological model can be used further as input into hydraulic models to simulate floodplains which is particularly important for urban areas.
Flood risk Risk, hazard and vulnerability define the magnitude of natural disasters. The risk is the product of the combination of hazard and vulnerability (Risk = Hazard x Vulnerability). Hazard is associated with the destructive phenomenon, natural or anthropogenic. Vulnerability represents the sensitivity of a system to expose to risk. The combination of these two elements is the risk, i.e. the probability of a catastrophic event occurs from a predefined or otherwise causes (Lewis, 1999).
Generally, there are many different definitions of vulnerability, but for the necessities of the flood management, it concerns the connection of human with his environment, as well as with existing social, administrative and cultural authorities. The risk is the level that changes caused by a flood, could damage a system and community. In this case, vulnerability is mainly characteristic of society, and is an indication of a possible disaster. Therefore vulnerability of an area depends on the applied urban design to prevent the impending disaster. Urban design reflect the type of risk (instantaneously or gradually flood), the spatial and temporal scale and the specificity of the study area.
The flood hazard associated with likelihood of occurring of an intense or long duration rainfall which will cause damage. The degree of resistance and vulnerability of the natural or urban environment will be seen when this environment suffered damage or not. In areas completely covered by forest, flooding is a natural event, not a disaster.
Flood risk greatly threatens mainly lowland areas and those located near estuaries. The degraded natural environment is a major cause of increased flood risk, such as deforestation or lack of vegetation cover in river basins. In lowland and deltaic areas, flood waters of streams rapidly deposit the transported materials. Thereby flood risk increases in these areas.
Flood risk is commonly a combination of the probability and consequences of flooding. Natural phenomena are essential for the creation of natural hazards and their evolution in risk and the probability of disaster carried out by human exposure to them. Nowadays, the risk is an integral part of human life and daily activities, whether
it is the threat of life from a traffic accident, or the threat of pollution. Nobody is possible to live in a totally secure environment and exposed to the slightest risk.
Risk assessment aims to produce results that can be repeatedly applied to various communities. Since risk becomes understanding and its assessment completed, decisions for risk management should be taken. The management includes administrative, political and economic actions, which are carried out to determine whether and how a particular kind of risk should be reduced to a certain level and with what cost.
In the field of flood risk management, the first analyzes of vulnerability were associated with the flood risk, made in the USA and UK and began in the 70s (Penning-Rowsell and Chatterton, 1977). Since that time, researchers have worked upon the socio-economic analyzes related to vulnerability and damages from floods such as the Flood Hazard Research Centre (Middlesex University in UK). In 2007, University Institute for Environment and Human Security (UNU-EHS) presented a report on social vulnerability (Warner et al., 2007).
The requirement for a complete flood risk management approach at watershed level has been documented by the European natural disaster management policy with the Flood Directive 2007/60/EC. This Directive on the assessment and management of flood risks entered into force on 26 November 2007. This Directive now requires all Member States to assess if all water courses and coast lines are at risk from flooding, to map the flood extent and assets and humans at risk in these areas and to take adequate and coordinated measures to reduce this flood risk. With this Directive also reinforces the rights of the public to access this information and to have a say in the planning process (European Council, 2007).
Flood hazard mapping
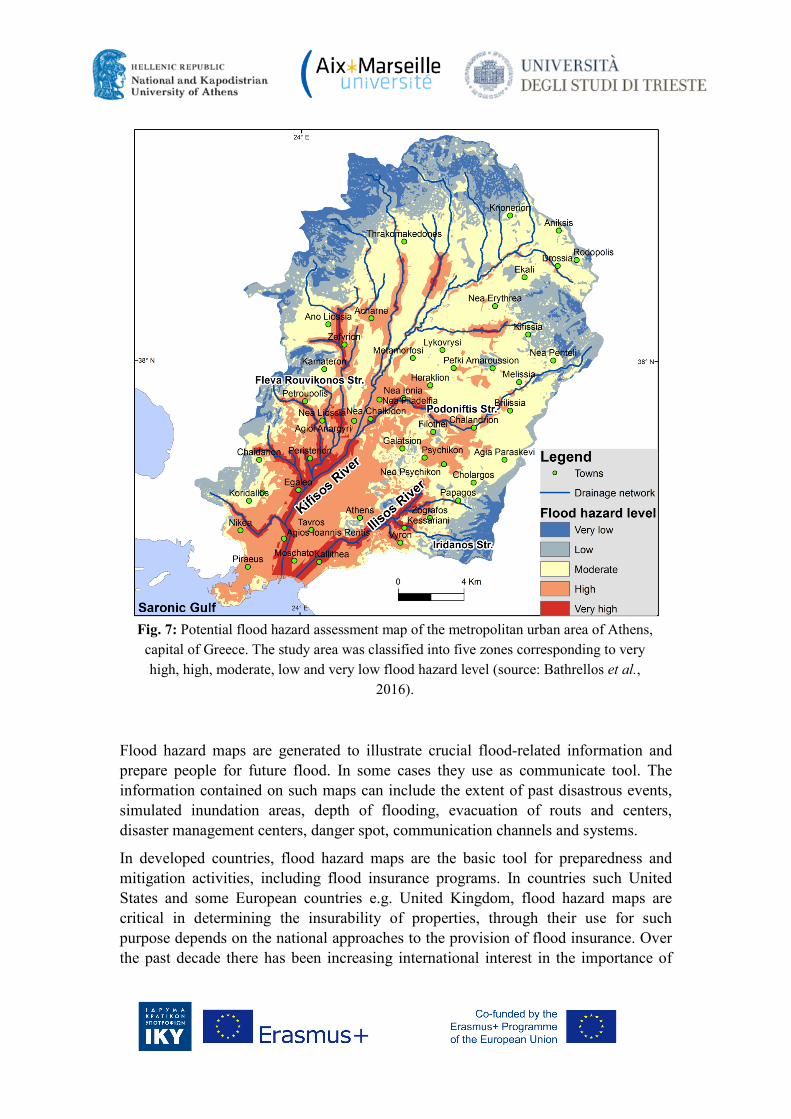
Flood hazard mapping is an important tool for mitigation of floods and a necessary step for government policies on urban planning worldwide. Flood hazard maps classify the various parts of land surface according to the degree of actual or potential flood hazard (Fig. 7). They help the planners manage better the sites for urban development and recognize areas that probably need flood protection measures.
Flood hazard maps are generated to illustrate crucial flood-related information and prepare people for future flood. In some cases they use as communicate tool. The information contained on such maps can include the extent of past disastrous events, simulated inundation areas, depth of flooding, evacuation of routs and centers, disaster management centers, danger spot, communication channels and systems.
In developed countries, flood hazard maps are the basic tool for preparedness and mitigation activities, including flood insurance programs. In countries such United States and some European countries e.g. United Kingdom, flood hazard maps are critical in determining the insurability of properties, through their use for such purpose depends on the national approaches to the provision of flood insurance. Over the past decade there has been increasing international interest in the importance of
Fig. 7: Potential flood hazard assessment map of the metropolitan urban area of Athens,
capital of Greece. The study area was classified into five zones corresponding to very high, high, moderate, low and very low flood hazard level (source: Bathrellos et al.,
2016).
developing meaningful financial risk-sharing arrangements such as insurance and reinsurance against disasters, through imaginative public/private partnerships.
The effectiveness of flood hazard maps depends not just on the accuracy of the information contained with them but also on the level of understanding. Experience has shown that when communities have a better understanding of the potential disaster in their area they are better able to prepare the respond. Flood hazard information also assists authorities and communities in making decisions about future building and land use development proposals and the potential risks associated with flooding.
Internationally, increasing attention is being paid to the development of flood hazard maps. Exploratory analysis through United Nations Environment Program (UNEP) and the University of Grenoble has demonstrated that global approaches to flood hazard mapping is possible with the increasing availability of basin descriptors proving regional flood frequency forecasts. Thus, these data combined with the globally available elevation data, can be used to map inundation patterns associated with 100-year floods. Studies have already carried out for North and South America and Mozambique. Increasingly processed, satellite imagery is being combined with historical events and GIS spatial database to indicate areas prone to flooding from catastrophic events such as storm, surges, tsunamis and intense rainfall events.
In Bangladesh, these approaches have assisted in the planning for river works for flood countermeasures to protect urban and industrial areas. In Caribbean since 2001, efforts have been made to improve the identification of flood hazards. Caribbean agencies together with Japanese and Canadians have been working to develop multi-hazard maps and vulnerability assessments that show inundation as result of differing hazard return events. In Nicaragua flood hazard maps developed in conjunction with international bodies have been developed for use by central government agencies and municipal authorities to assist them in their planning.
Europe as a result of rising concerns over the social and economic impact of flood hazard has developed the Flood Directive which sets out specific requirements for flood mapping and zoning. Competent authorities use these zones to identify avoidance measures. The probabilities of flooding associated with these zones are also used as a starting point for the appraisal of measures to alleviate flooding. The zones for flood hazard are:
• floods with low probability, or extreme event scenarios; • floods with a medium probability (likely return period 100years); • floods with a high probability, where appropriate.
The flood hazard maps should be enhanced to flood risk maps by including the following information: a) the indicative number of inhabitants potentially affected, b) type of economic activity of the area potentially affected, c) installations which might cause accidental pollution in case of flooding and potentially affected protected areas. Other information which the Member State considers useful, such as indication of
areas where floods with a high content of transported sediments and debris floods can occur and information on other significant sources of pollution.
The hazard mapping in the south of Germany was part of the European funded INTERREG IIIB project SAFER. Due to international cooperation with relevant stakeholders and authorities as well as successful exchange with other European partners the project’s experience in the mapping process can be taken as the best practice example. Generally, flood hazard maps of the project use scenarios based on characteristics of an area and describe the specific flooding situations of different types of inland water bodies and costal zones. The maps indicate for various recurrence intervals where overflows occur and to what extent.
Prediction models of fluvial floods Numerous models can be applied to predict fluvial flooding and consequently flood risk assessment. They provide in a GIS environment, flood risk information and are useful for the flood protection planning in areas prone to floods. The models will be discussed below, were developed in the context of the SMARTeST project, which was funded under the European Union’s FP7 Research Programme. This research project supports the implementation of the new EU flood risk management policy of “Living with Floods”. According to EU policy (EC 2007/60) flood risk management is the appropriate strategy to cope with this increasing flood risk rather than traditional flood defense strategies which try to reduce the flood risk. The models will be described in this section are FLORETO-KALYPSO and HOWAD-Prevent.
FLORETO-KALYPSO
These model asses the flood risk and damage and is an advisory tool in the process of strategic flood resilience planning. It consists of two separate models which can be used individually, the FLORETO (FLOod REsilient TOol) and KALYPSO.
FLORETO is an open source tool, enabling and performing flood resilient planning at the individual property scale. It has been implemented as a web (browser) based open source and may therefore be used free of charge.
KALYPSO is an open source platform for flood risk assessment and management according to EU 2007/60/EC. It includes the hydrologic model Kalypso, Kalypso WSPM, Kalypso1D/2D, Kalypso Flood and Kalypso Risk.
The input data processed by FLORETO-KALYPSO model concern: flood parameters (water depth, flow velocities and annual values), information about the built environment such as building materials, contents (e.g. furniture, electrical appliances) building renovation costs after significant flooding and available damage curves of specific types of buildings. Moreover, medium-scale input data required are: the land use and economic values of the buildings and facilities.
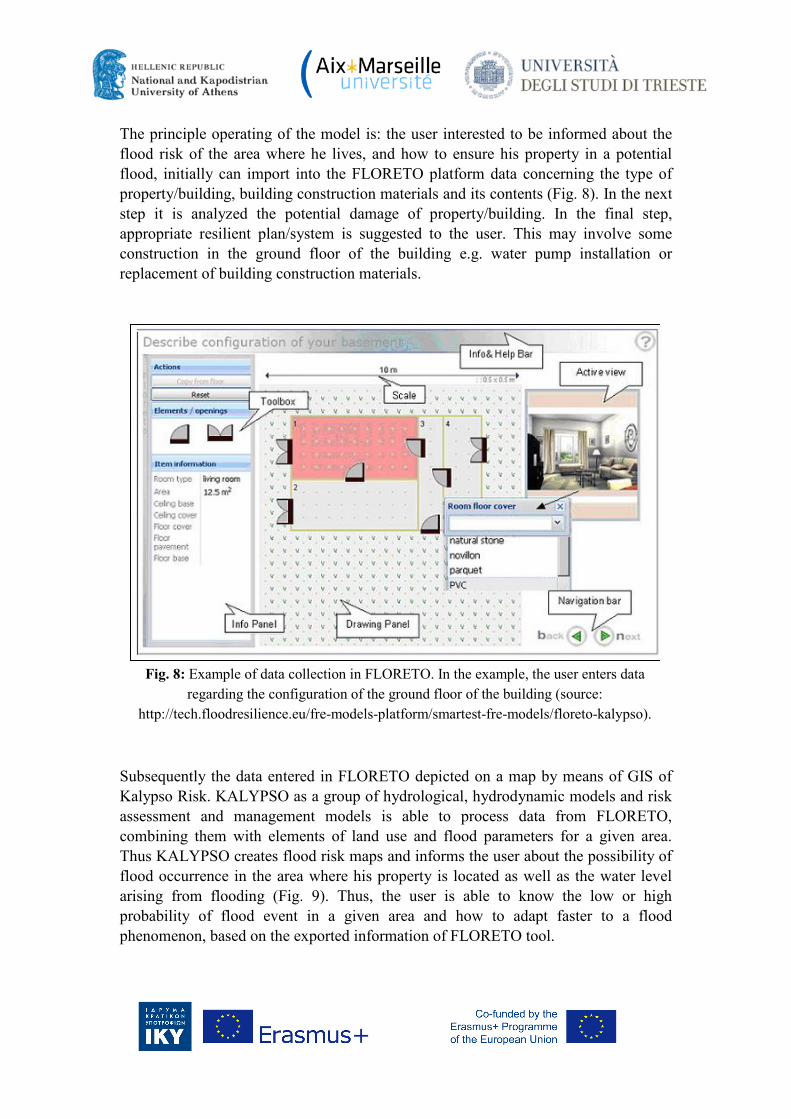
The principle operating of the model is: the user interested to be informed about the flood risk of the area where he lives, and how to ensure his property in a potential flood, initially can import into the FLORETO platform data concerning the type of property/building, building construction materials and its contents (Fig. 8). In the next step it is analyzed the potential damage of property/building. In the final step, appropriate resilient plan/system is suggested to the user. This may involve some construction in the ground floor of the building e.g. water pump installation or replacement of building construction materials.
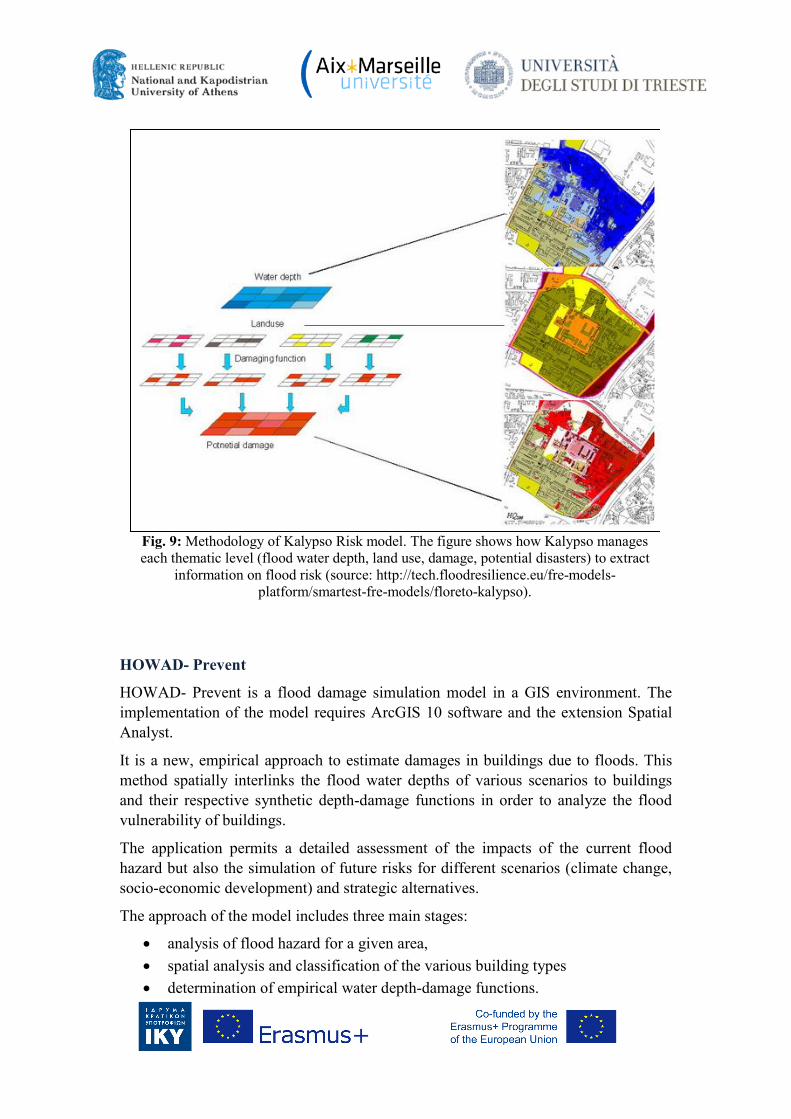
Subsequently the data entered in FLORETO depicted on a map by means of GIS of Kalypso Risk. KALYPSO as a group of hydrological, hydrodynamic models and risk assessment and management models is able to process data from FLORETO, combining them with elements of land use and flood parameters for a given area. Thus KALYPSO creates flood risk maps and informs the user about the possibility of flood occurrence in the area where his property is located as well as the water level arising from flooding (Fig. 9). Thus, the user is able to know the low or high probability of flood event in a given area and how to adapt faster to a flood phenomenon, based on the exported information of FLORETO tool.
Fig. 8: Example of data collection in FLORETO. In the example, the user enters data
regarding the configuration of the ground floor of the building (source: http://tech.floodresilience.eu/fre-models-platform/smartest-fre-models/floreto-kalypso).
HOWAD- Prevent
HOWAD- Prevent is a flood damage simulation model in a GIS environment. The implementation of the model requires ArcGIS 10 software and the extension Spatial Analyst.
It is a new, empirical approach to estimate damages in buildings due to floods. This method spatially interlinks the flood water depths of various scenarios to buildings and their respective synthetic depth-damage functions in order to analyze the flood vulnerability of buildings.
The application permits a detailed assessment of the impacts of the current flood hazard but also the simulation of future risks for different scenarios (climate change, socio-economic development) and strategic alternatives.
The approach of the model includes three main stages:
• analysis of flood hazard for a given area, • spatial analysis and classification of the various building types • determination of empirical water depth-damage functions.
Fig. 9: Methodology of Kalypso Risk model. The figure shows how Kalypso manages each thematic level (flood water depth, land use, damage, potential disasters) to extract
information on flood risk (source: http://tech.floodresilience.eu/fre-models-platform/smartest-fre-models/floreto-kalypso).
Based on hydraulic, hydrodynamic and groundwater flow models, in combination with different flood scenarios, which include forward-looking statements as a result of climate change, flood risk is derived for the region of interest of the user. Then, using field work data, along with GIS and remote sensing data is performed the recognition of building types that are located in the study area. The different types of buildings are classified into specific categories. In the next step the damage of each type of building is calculated according to the databases of the model and the depth-damage functions are developed and validated for different types of flooding. The last step includes calculating the damage costs per building in a particular area of interest, as well as the overall cost of the damages in the study area. The results of the model processing are presented either as flood damage maps at building or area level or attributed in the form of graphs which depict the damage per building type or per flood scenario.
Coastal floods
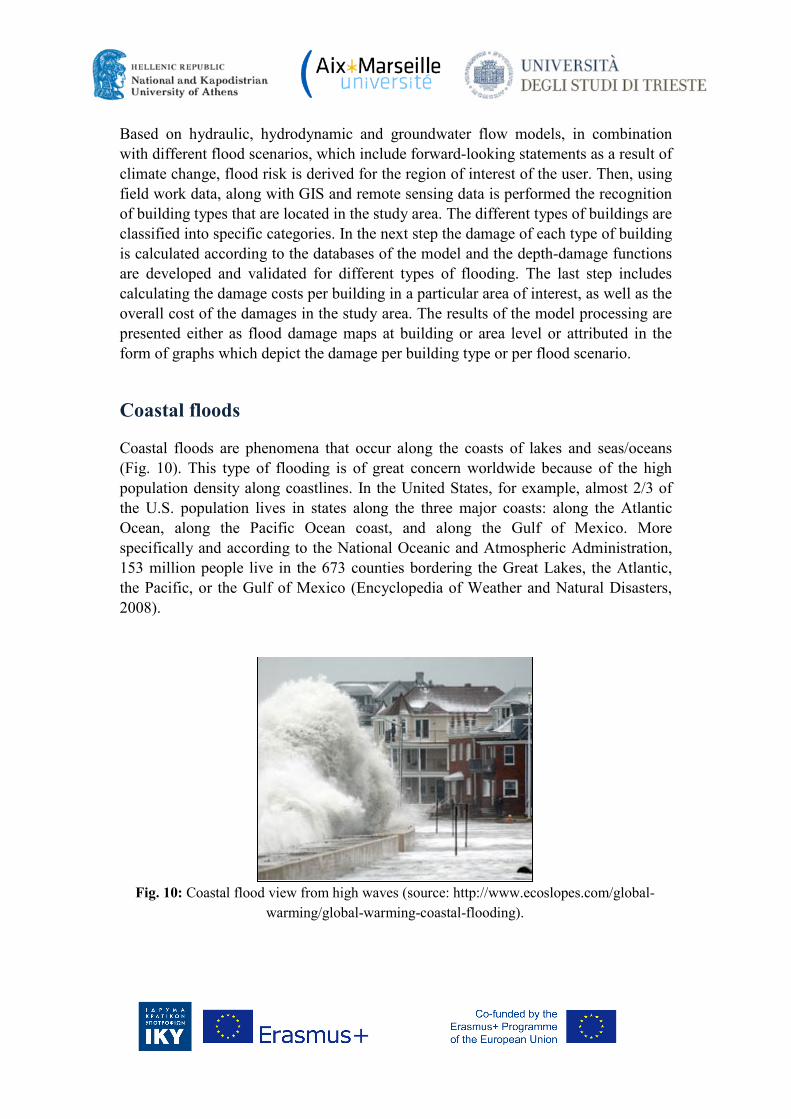
Coastal floods are phenomena that occur along the coasts of lakes and seas/oceans (Fig. 10). This type of flooding is of great concern worldwide because of the high population density along coastlines. In the United States, for example, almost 2/3 of the U.S. population lives in states along the three major coasts: along the Atlantic Ocean, along the Pacific Ocean coast, and along the Gulf of Mexico. More specifically and according to the National Oceanic and Atmospheric Administration, 153 million people live in the 673 counties bordering the Great Lakes, the Atlantic, the Pacific, or the Gulf of Mexico (Encyclopedia of Weather and Natural Disasters, 2008).
Fig. 10: Coastal flood view from high waves (source: http://www.ecoslopes.com/global-
warming/global-warming-coastal-flooding).
There are two main causes of coastal flooding: high waters and the subsidence, or lowering, of coastal lands. Although, in the most cases of flooding in coastal areas due to inland floods.
Coastal flooding due to high water level The high level of sea water caused by phenomena associated with the weather and the astronomical position of the moon relative to the Earth. More specifically, the factors contribute to coastal flood events are:
Severe weather events create meteorological conditions that drive up the water level, creating a storm surge. These conditions include strong winds and low atmospheric pressure that can be caused by tropical cyclones, such as hurricanes.
Large waves whether driven by local winds or swell from distant storms. They raise average coastal water levels and can cause large and damaging waves to reach land. However, huge recorded ocean wave is tsunami caused by a submarine earthquake, subsidence or volcanic eruption. The tsunami wave may increase in height to become a fast moving wall of turbulent water several meters high. It can travel at speeds up to 965 Km/h and its height ranges from a few up to 30 meters before it hits land (Encyclopedia of Weather and Natural Disasters, 2008).
Seasonal heating and cooling of the sea water and the ocean circulation contribute to larger scale regional and ocean scale variations. These fluctuations are generally about 0.1 - 0.3m but in some cases may range up to 1 m (Davidson-Arnott, 2010).
High tide levels cause intense rising of sea level and are originated by normal variations in the astronomical tide cycle.
Global average sea level rise is due to rise of sea level because of Holocene interglacial period. Sea level rose by about 130 m during the several millennia that followed the end of the Last Glacial Maximum-LGM (18,000 years ago). The rate of sea level rise was very rapid until 7,000 years ago, and stabilized to its present level about 5,000 ago. The instrumental record of modern sea level change shows evidence for onset of sea level rise during the 19th century. Estimates for the 20th century show that global average sea level rose at a rate of about 2.0 mm/ yr (Kemp et al., 2011). Studies predict a sea level rise of about 0.5m by 2100. Human activities have enhanced the sea level rise by adding greenhouse gases to the atmosphere. These additional greenhouse gases very likely increase the Earth’s average temperature, resulting the rapid melting of polar ice caps and adding large volumes of water into the sea.
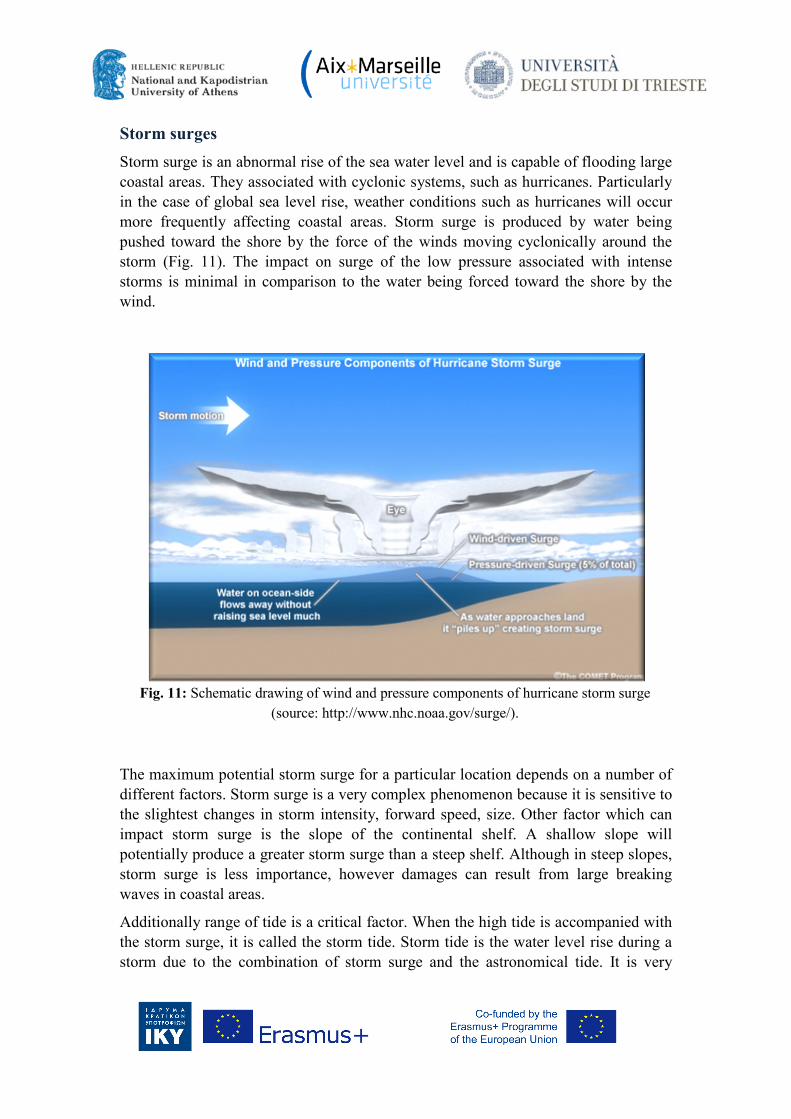
Storm surges Storm surge is an abnormal rise of the sea water level and is capable of flooding large coastal areas. They associated with cyclonic systems, such as hurricanes. Particularly in the case of global sea level rise, weather conditions such as hurricanes will occur more frequently affecting coastal areas. Storm surge is produced by water being pushed toward the shore by the force of the winds moving cyclonically around the storm (Fig. 11). The impact on surge of the low pressure associated with intense storms is minimal in comparison to the water being forced toward the shore by the wind.
The maximum potential storm surge for a particular location depends on a number of different factors. Storm surge is a very complex phenomenon because it is sensitive to the slightest changes in storm intensity, forward speed, size. Other factor which can impact storm surge is the slope of the continental shelf. A shallow slope will potentially produce a greater storm surge than a steep shelf. Although in steep slopes, storm surge is less importance, however damages can result from large breaking waves in coastal areas.
Additionally range of tide is a critical factor. When the high tide is accompanied with the storm surge, it is called the storm tide. Storm tide is the water level rise during a storm due to the combination of storm surge and the astronomical tide. It is very
Fig. 11: Schematic drawing of wind and pressure components of hurricane storm surge
(source: http://www.nhc.noaa.gov/surge/).
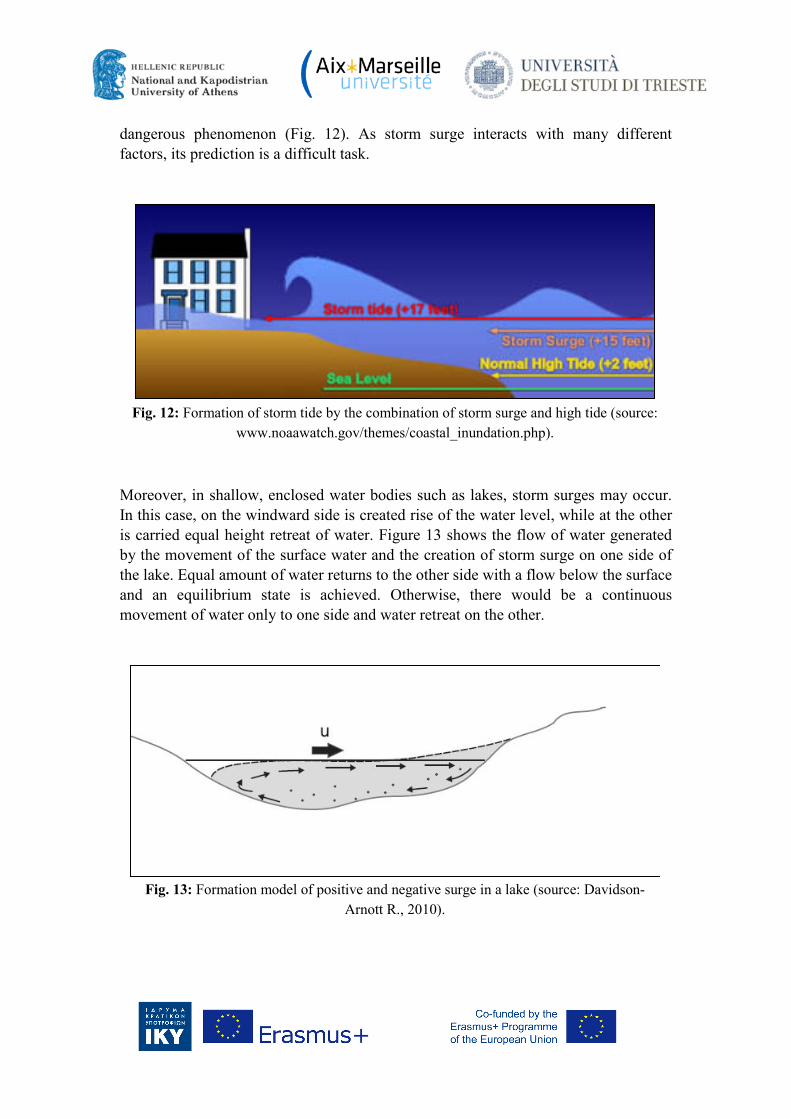
dangerous phenomenon (Fig. 12). As storm surge interacts with many different factors, its prediction is a difficult task.
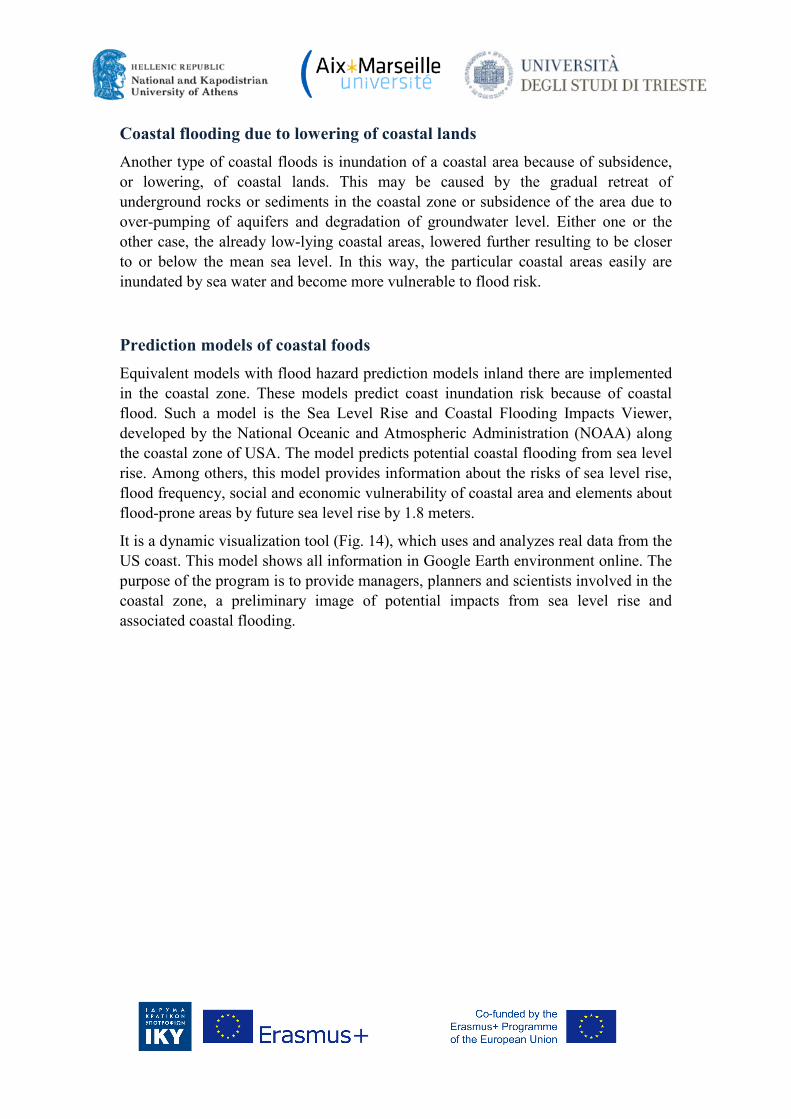
Moreover, in shallow, enclosed water bodies such as lakes, storm surges may occur. In this case, on the windward side is created rise of the water level, while at the other is carried equal height retreat of water. Figure 13 shows the flow of water generated by the movement of the surface water and the creation of storm surge on one side of the lake. Equal amount of water returns to the other side with a flow below the surface and an equilibrium state is achieved. Otherwise, there would be a continuous movement of water only to one side and water retreat on the other.
Fig. 13: Formation model of positive and negative surge in a lake (source: Davidson-
Arnott R., 2010).
Fig. 12: Formation of storm tide by the combination of storm surge and high tide (source:
www.noaawatch.gov/themes/coastal_inundation.php).
Coastal flooding due to lowering of coastal lands Another type of coastal floods is inundation of a coastal area because of subsidence, or lowering, of coastal lands. This may be caused by the gradual retreat of underground rocks or sediments in the coastal zone or subsidence of the area due to over-pumping of aquifers and degradation of groundwater level. Either one or the other case, the already low-lying coastal areas, lowered further resulting to be closer to or below the mean sea level. In this way, the particular coastal areas easily are inundated by sea water and become more vulnerable to flood risk.
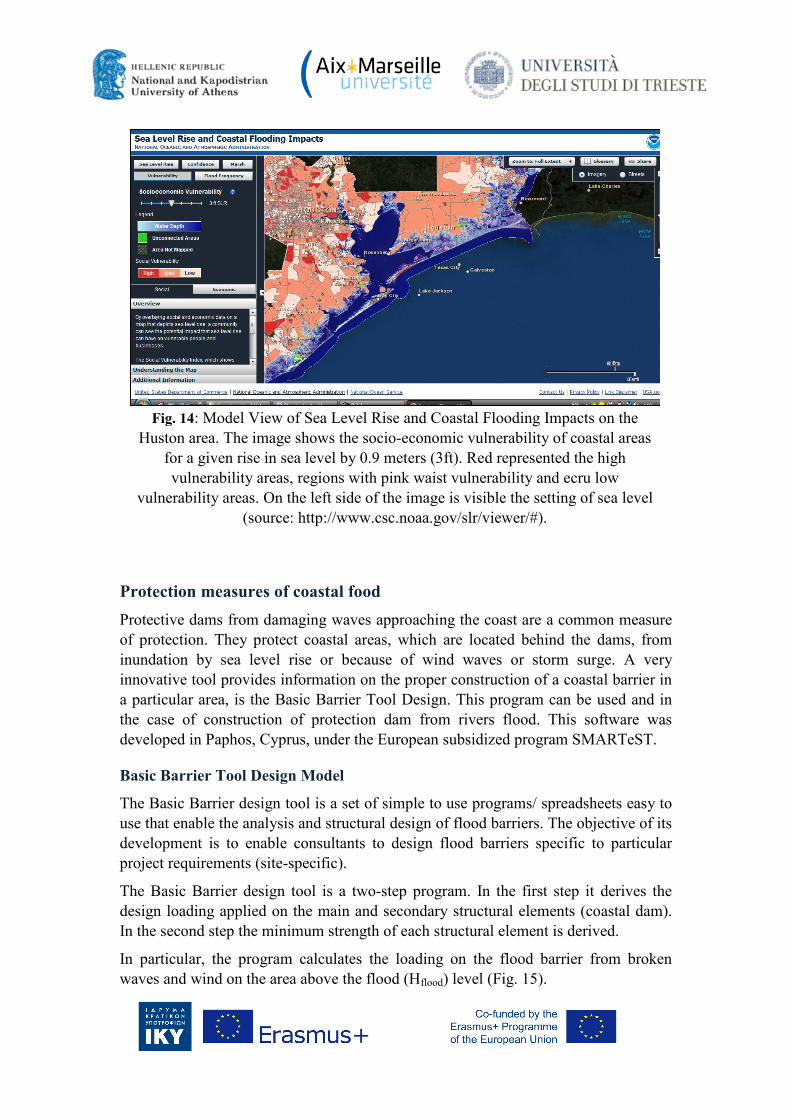
Prediction models of coastal foods Equivalent models with flood hazard prediction models inland there are implemented in the coastal zone. These models predict coast inundation risk because of coastal flood. Such a model is the Sea Level Rise and Coastal Flooding Impacts Viewer, developed by the National Oceanic and Atmospheric Administration (NOAA) along the coastal zone of USA. The model predicts potential coastal flooding from sea level rise. Among others, this model provides information about the risks of sea level rise, flood frequency, social and economic vulnerability of coastal area and elements about flood-prone areas by future sea level rise by 1.8 meters.
It is a dynamic visualization tool (Fig. 14), which uses and analyzes real data from the US coast. This model shows all information in Google Earth environment online. The purpose of the program is to provide managers, planners and scientists involved in the coastal zone, a preliminary image of potential impacts from sea level rise and associated coastal flooding.
Protection measures of coastal food Protective dams from damaging waves approaching the coast are a common measure of protection. They protect coastal areas, which are located behind the dams, from inundation by sea level rise or because of wind waves or storm surge. A very innovative tool provides information on the proper construction of a coastal barrier in a particular area, is the Basic Barrier Tool Design. This program can be used and in the case of construction of protection dam from rivers flood. This software was developed in Paphos, Cyprus, under the European subsidized program SMARTeST.
Basic Barrier Tool Design Model
The Basic Barrier design tool is a set of simple to use programs/ spreadsheets easy to use that enable the analysis and structural design of flood barriers. The objective of its development is to enable consultants to design flood barriers specific to particular project requirements (site-specific).
The Basic Barrier design tool is a two-step program. In the first step it derives the design loading applied on the main and secondary structural elements (coastal dam). In the second step the minimum strength of each structural element is derived.
In particular, the program calculates the loading on the flood barrier from broken waves and wind on the area above the flood (Hflood) level (Fig. 15).
Fig. 14: Model View of Sea Level Rise and Coastal Flooding Impacts on the
Huston area. The image shows the socio-economic vulnerability of coastal areas for a given rise in sea level by 0.9 meters (3ft). Red represented the high vulnerability areas, regions with pink waist vulnerability and ecru low
vulnerability areas. On the left side of the image is visible the setting of sea level (source: http://www.csc.noaa.gov/slr/viewer/#).
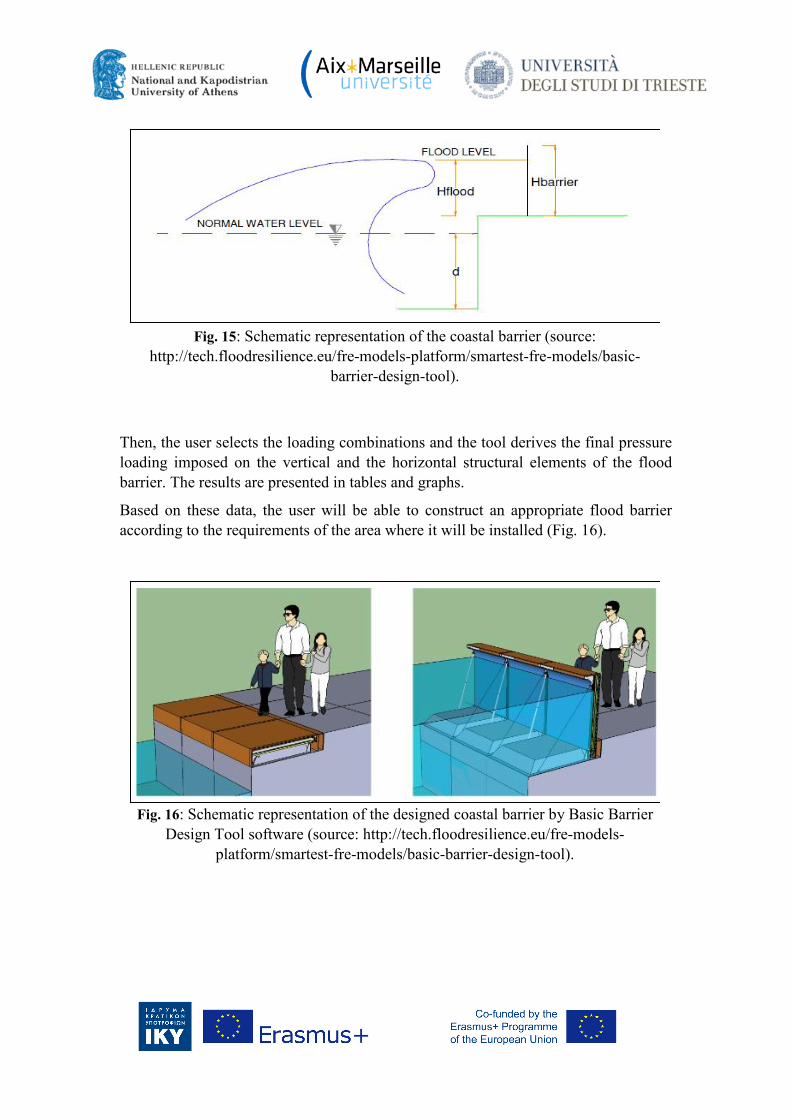
Then, the user selects the loading combinations and the tool derives the final pressure loading imposed on the vertical and the horizontal structural elements of the flood barrier. The results are presented in tables and graphs.
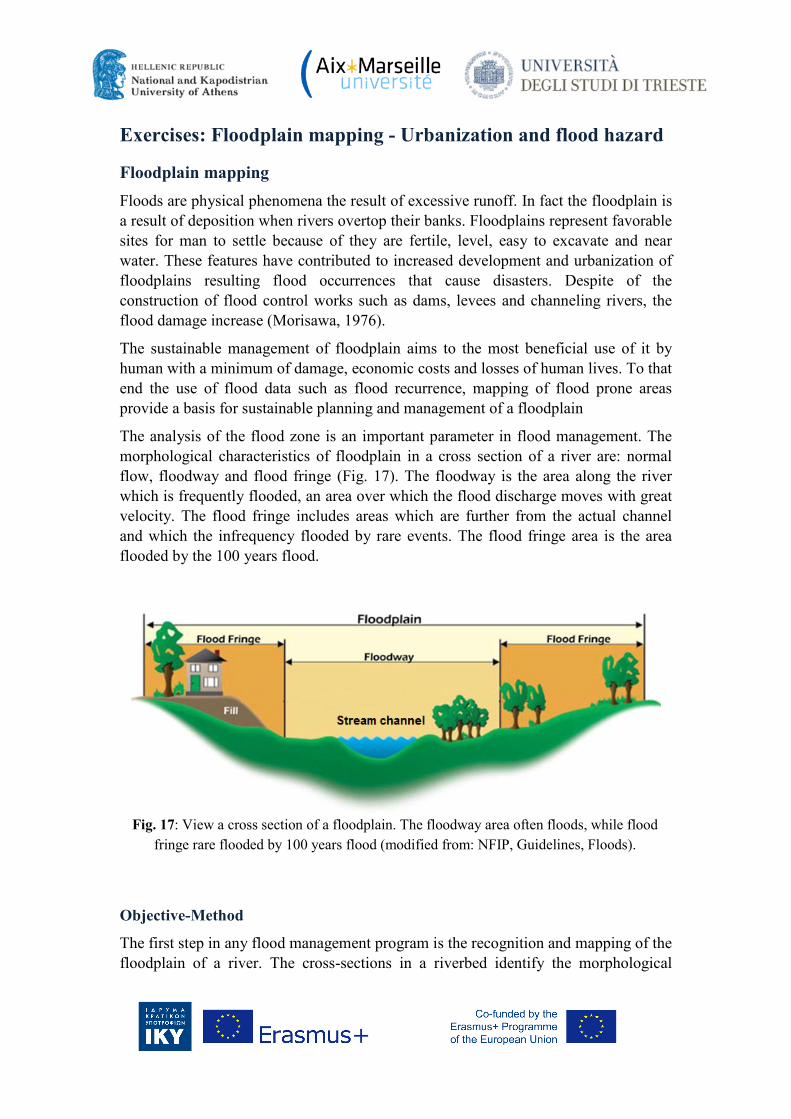
Based on these data, the user will be able to construct an appropriate flood barrier according to the requirements of the area where it will be installed (Fig. 16).
Fig. 16: Schematic representation of the designed coastal barrier by Basic Barrier
Design Tool software (source: http://tech.floodresilience.eu/fre-models-platform/smartest-fre-models/basic-barrier-design-tool).
Fig. 15: Schematic representation of the coastal barrier (source:
http://tech.floodresilience.eu/fre-models-platform/smartest-fre-models/basic-barrier-design-tool).
Exercises: Floodplain mapping - Urbanization and flood hazard
Floodplain mapping Floods are physical phenomena the result of excessive runoff. In fact the floodplain is a result of deposition when rivers overtop their banks. Floodplains represent favorable sites for man to settle because of they are fertile, level, easy to excavate and near water. These features have contributed to increased development and urbanization of floodplains resulting flood occurrences that cause disasters. Despite of the construction of flood control works such as dams, levees and channeling rivers, the flood damage increase (Morisawa, 1976).
The sustainable management of floodplain aims to the most beneficial use of it by human with a minimum of damage, economic costs and losses of human lives. To that end the use of flood data such as flood recurrence, mapping of flood prone areas provide a basis for sustainable planning and management of a floodplain
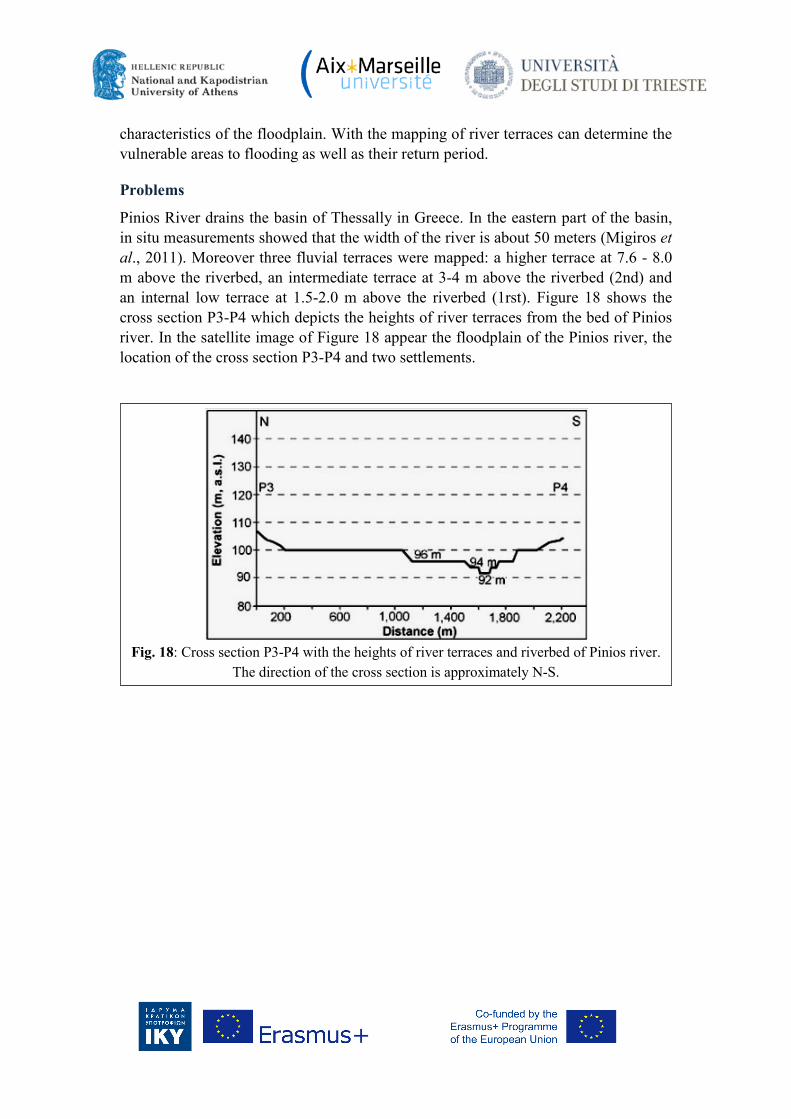
The analysis of the flood zone is an important parameter in flood management. The morphological characteristics of floodplain in a cross section of a river are: normal flow, floodway and flood fringe (Fig. 17). The floodway is the area along the river which is frequently flooded, an area over which the flood discharge moves with great velocity. The flood fringe includes areas which are further from the actual channel and which the infrequency flooded by rare events. The flood fringe area is the area flooded by the 100 years flood.
Objective-Method
The first step in any flood management program is the recognition and mapping of the floodplain of a river. The cross-sections in a riverbed identify the morphological
Fig. 17: View a cross section of a floodplain. The floodway area often floods, while flood
fringe rare flooded by 100 years flood (modified from: NFIP, Guidelines, Floods).
characteristics of the floodplain. With the mapping of river terraces can determine the vulnerable areas to flooding as well as their return period.
Problems
Pinios River drains the basin of Thessally in Greece. In the eastern part of the basin, in situ measurements showed that the width of the river is about 50 meters (Migiros et al., 2011). Moreover three fluvial terraces were mapped: a higher terrace at 7.6 - 8.0 m above the riverbed, an intermediate terrace at 3-4 m above the riverbed (2nd) and an internal low terrace at 1.5-2.0 m above the riverbed (1rst). Figure 18 shows the cross section P3-P4 which depicts the heights of river terraces from the bed of Pinios river. In the satellite image of Figure 18 appear the floodplain of the Pinios river, the location of the cross section P3-P4 and two settlements.
Fig. 18: Cross section P3-P4 with the heights of river terraces and riverbed of Pinios river.
The direction of the cross section is approximately N-S.
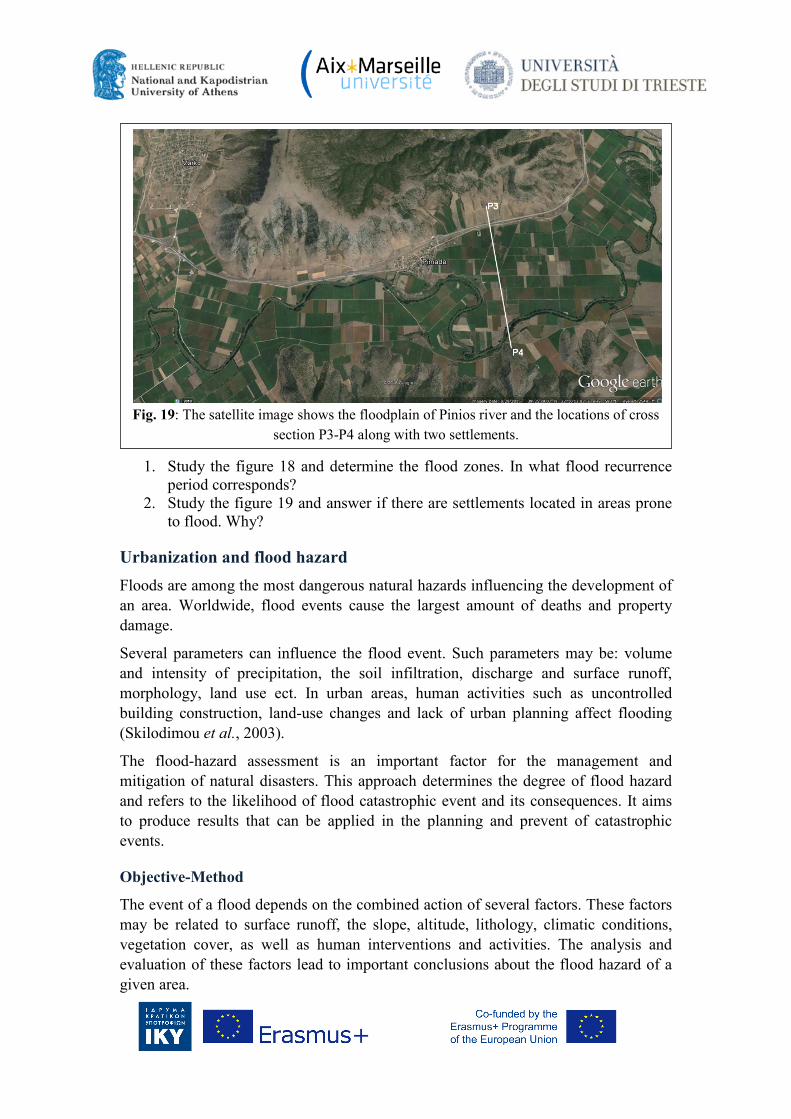
1. Study the figure 18 and determine the flood zones. In what flood recurrence
period corresponds? 2. Study the figure 19 and answer if there are settlements located in areas prone
to flood. Why?
Urbanization and flood hazard Floods are among the most dangerous natural hazards influencing the development of an area. Worldwide, flood events cause the largest amount of deaths and property damage.
Several parameters can influence the flood event. Such parameters may be: volume and intensity of precipitation, the soil infiltration, discharge and surface runoff, morphology, land use ect. In urban areas, human activities such as uncontrolled building construction, land-use changes and lack of urban planning affect flooding (Skilodimou et al., 2003).
The flood-hazard assessment is an important factor for the management and mitigation of natural disasters. This approach determines the degree of flood hazard and refers to the likelihood of flood catastrophic event and its consequences. It aims to produce results that can be applied in the planning and prevent of catastrophic events.
Objective-Method
The event of a flood depends on the combined action of several factors. These factors may be related to surface runoff, the slope, altitude, lithology, climatic conditions, vegetation cover, as well as human interventions and activities. The analysis and evaluation of these factors lead to important conclusions about the flood hazard of a given area.
Fig. 19: The satellite image shows the floodplain of Pinios river and the locations of cross
section P3-P4 along with two settlements.
Problems
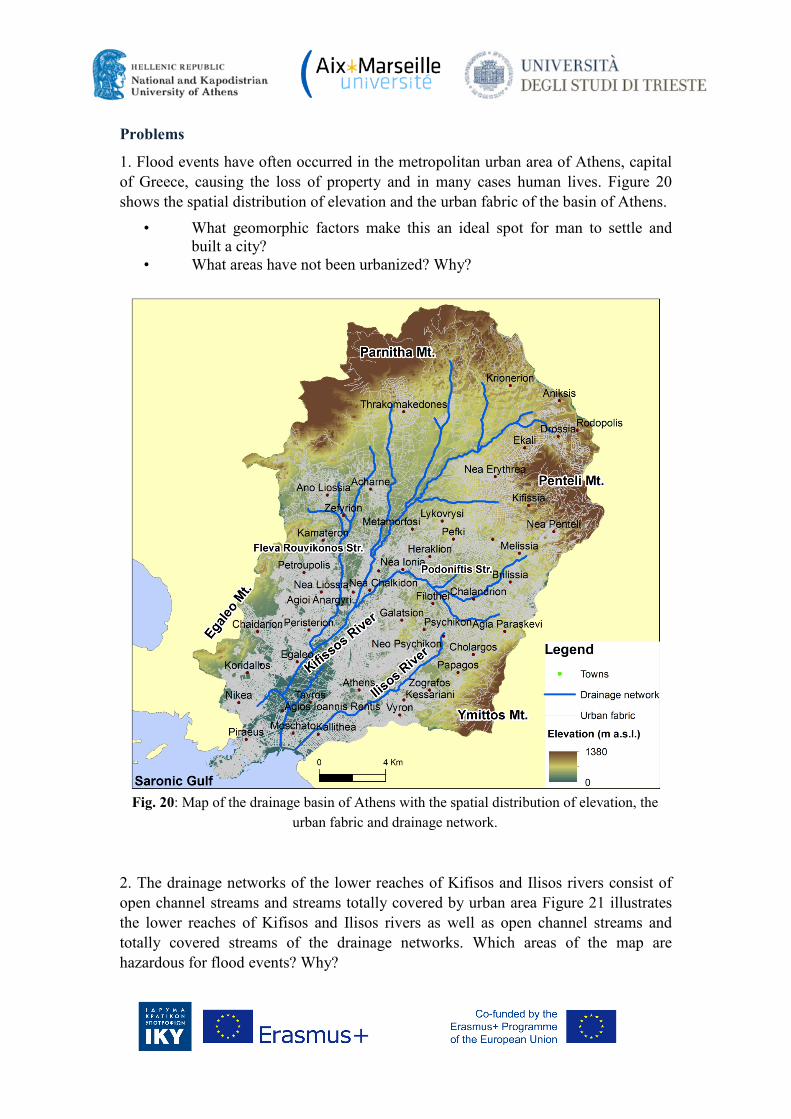
1. Flood events have often occurred in the metropolitan urban area of Athens, capital of Greece, causing the loss of property and in many cases human lives. Figure 20 shows the spatial distribution of elevation and the urban fabric of the basin of Athens.
• What geomorphic factors make this an ideal spot for man to settle and built a city?
• What areas have not been urbanized? Why?
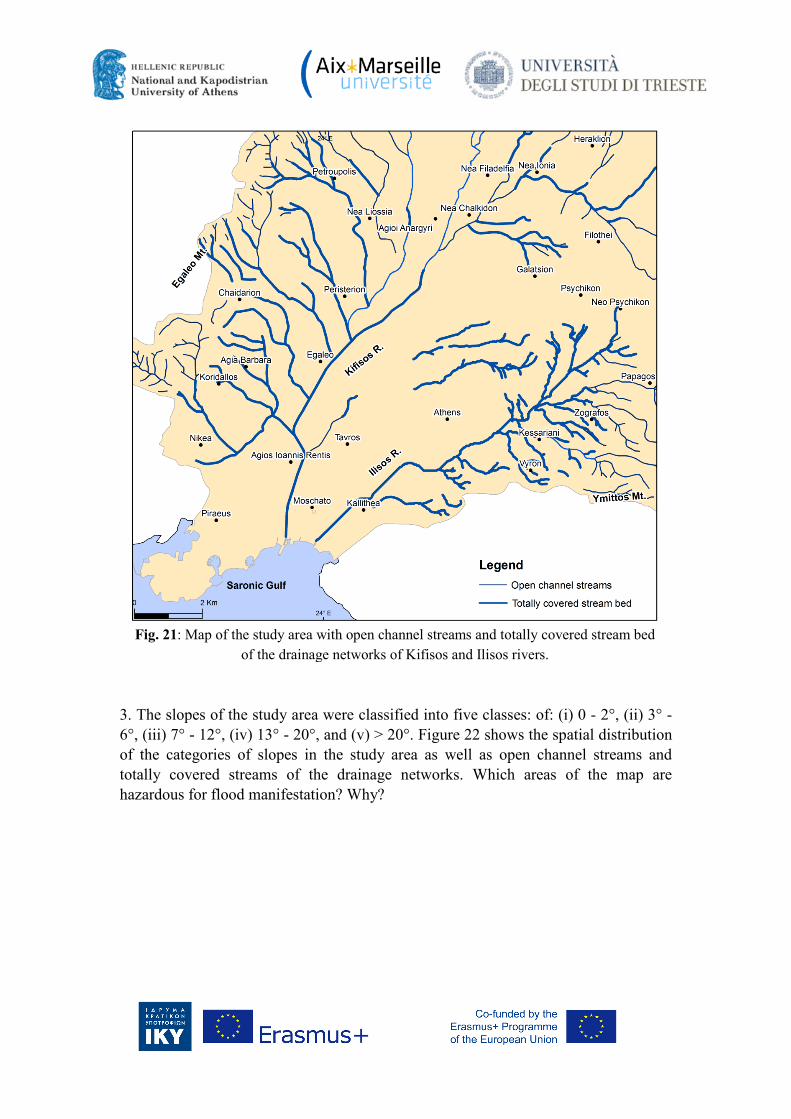
2. The drainage networks of the lower reaches of Kifisos and Ilisos rivers consist of open channel streams and streams totally covered by urban area Figure 21 illustrates the lower reaches of Kifisos and Ilisos rivers as well as open channel streams and totally covered streams of the drainage networks. Which areas of the map are hazardous for flood events? Why?
Fig. 20: Map of the drainage basin of Athens with the spatial distribution of elevation, the
urban fabric and drainage network.
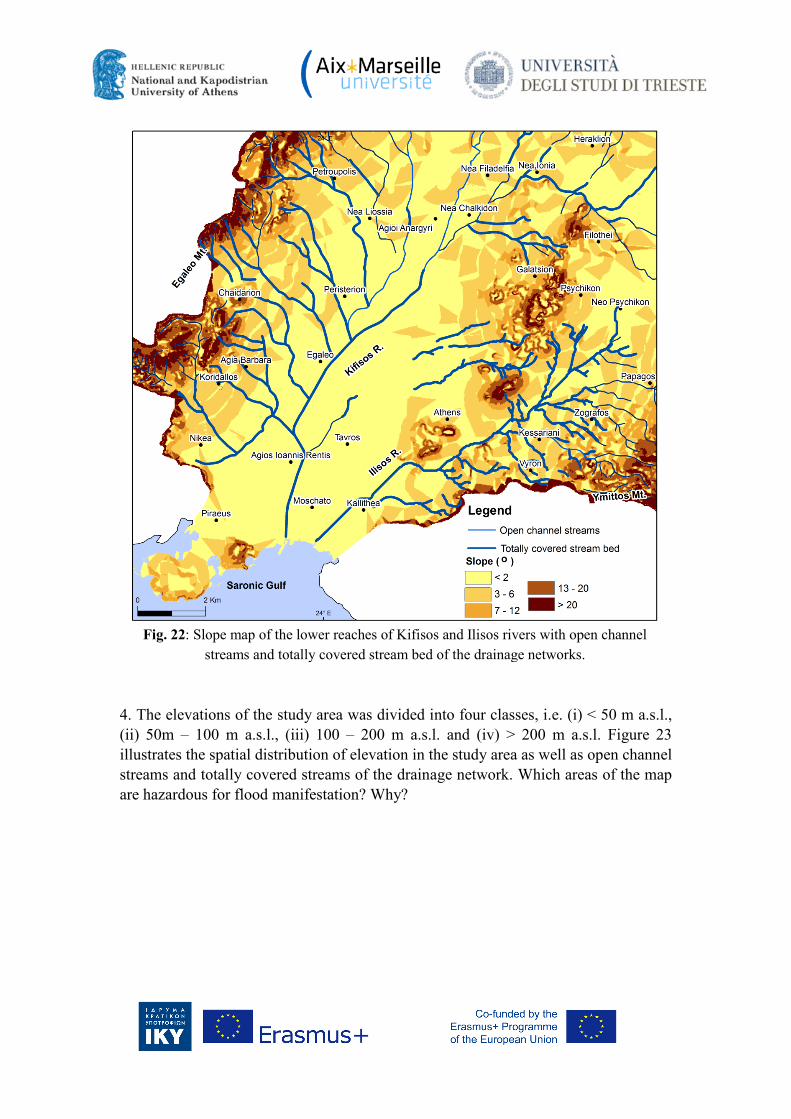
3. The slopes of the study area were classified into five classes: of: (i) 0 - 2°, (ii) 3° - 6°, (iii) 7° - 12°, (iv) 13° - 20°, and (v) > 20°. Figure 22 shows the spatial distribution of the categories of slopes in the study area as well as open channel streams and totally covered streams of the drainage networks. Which areas of the map are hazardous for flood manifestation? Why?
Fig. 21: Map of the study area with open channel streams and totally covered stream bed
of the drainage networks of Kifisos and Ilisos rivers.
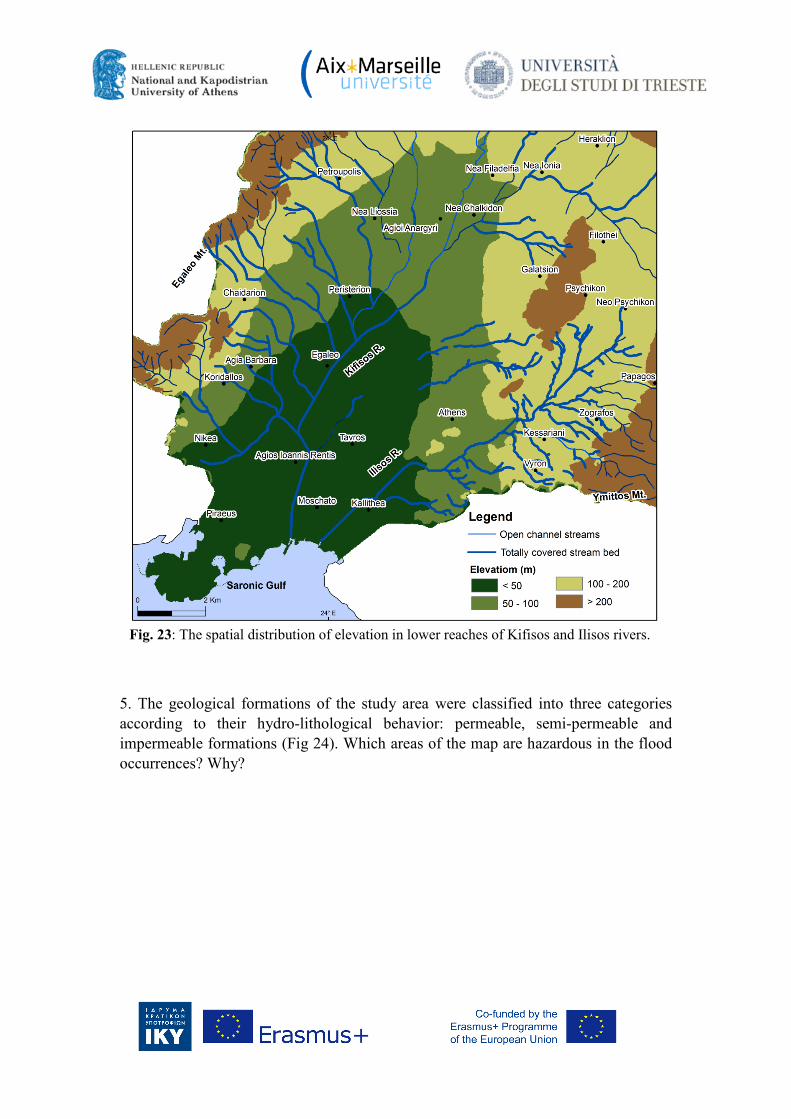
4. The elevations of the study area was divided into four classes, i.e. (i) < 50 m a.s.l., (ii) 50m – 100 m a.s.l., (iii) 100 – 200 m a.s.l. and (iv) > 200 m a.s.l. Figure 23 illustrates the spatial distribution of elevation in the study area as well as open channel streams and totally covered streams of the drainage network. Which areas of the map are hazardous for flood manifestation? Why?
Fig. 22: Slope map of the lower reaches of Kifisos and Ilisos rivers with open channel
streams and totally covered stream bed of the drainage networks.
5. The geological formations of the study area were classified into three categories according to their hydro-lithological behavior: permeable, semi-permeable and impermeable formations (Fig 24). Which areas of the map are hazardous in the flood occurrences? Why?
Fig. 23: The spatial distribution of elevation in lower reaches of Kifisos and Ilisos rivers.
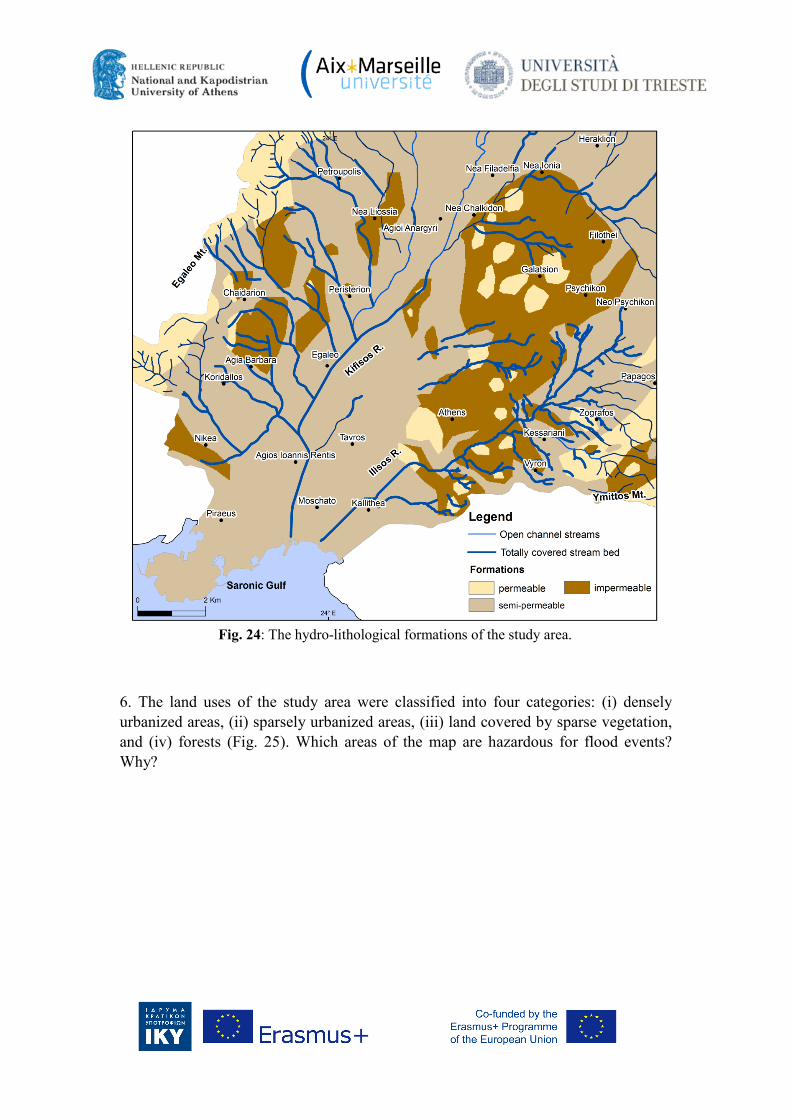
6. The land uses of the study area were classified into four categories: (i) densely urbanized areas, (ii) sparsely urbanized areas, (iii) land covered by sparse vegetation, and (iv) forests (Fig. 25). Which areas of the map are hazardous for flood events? Why?
Fig. 24: The hydro-lithological formations of the study area.
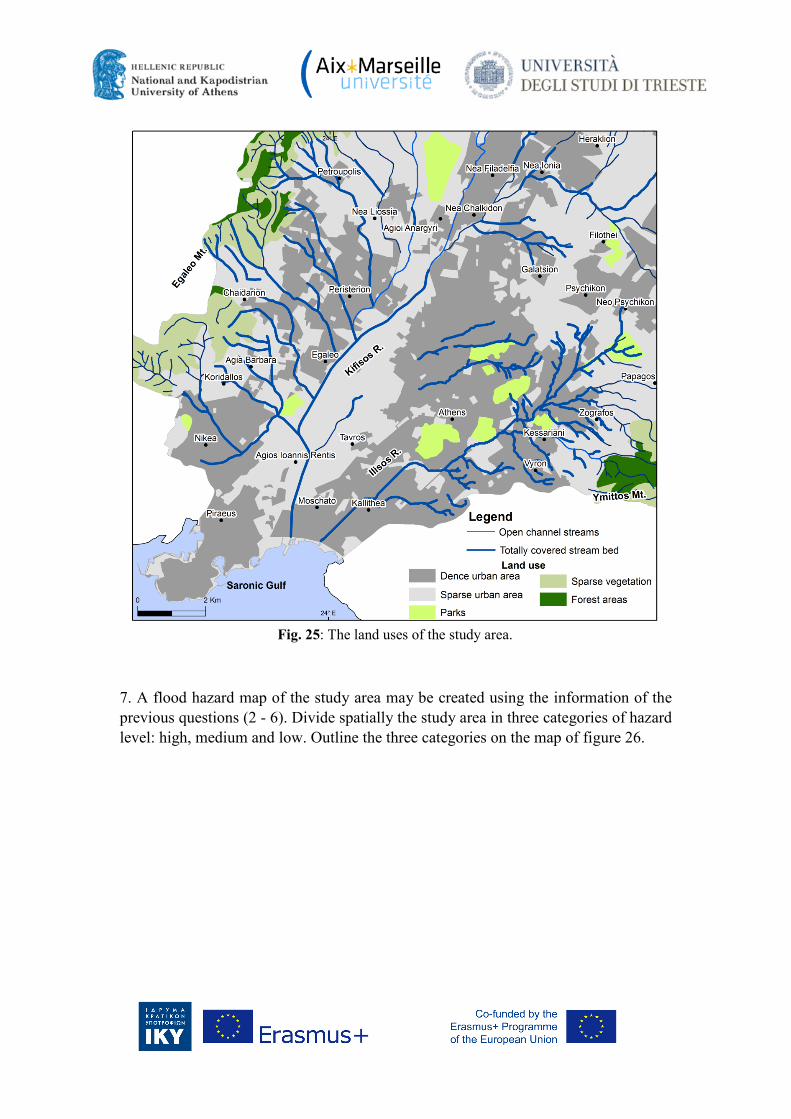
7. A flood hazard map of the study area may be created using the information of the previous questions (2 - 6). Divide spatially the study area in three categories of hazard level: high, medium and low. Outline the three categories on the map of figure 26.
Fig. 25: The land uses of the study area.
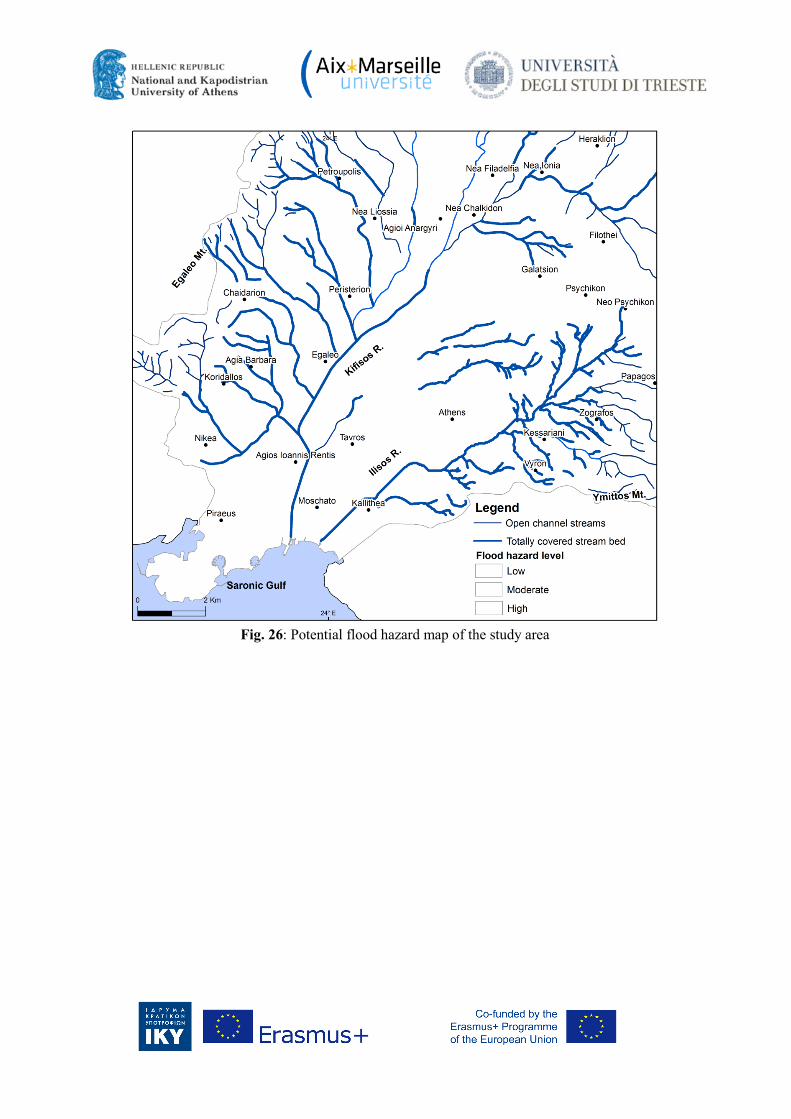
Fig. 26: Potential flood hazard map of the study area
References
Bathrellos, G.D., Karymbalis, E., Skilodimou, H.D., Gaki-Papanastassiou, K., Baltas, E.A., 2016. Urban flood hazard assessment in the basin of Athens Metropolitan city, Greece. Environmental Earth Sciences 75(4), 1-14. http://link.springer.com/article/10.1007/s12665-015-5157-1
Davidson-Arnott, R., 2010. Introduction to Coastal Processes and Geomorphology. Cambridge University Press: New York, pp. 139-180.
Efstratiadis, A., Rozos, E. Koukouvinos A., 2009. HYDROGEIOS: Hydrological and hydrogeological simulation. Department of Water Resources and Environmental Engineering, Faculty of Civil Engineering, National Technical University of Athens pp. 5, 10, 12.
Goudie, S.A., (Ed.) 2006. Encyclopedia of Geomorphology. New York: Taylor & Francis Group.
Anaxos, Inc., 2008. Encyclopedia of Weather and Natural Disasters. Detroit: Thomson Gale. http://www.encyclopedia.com/article-1G2-3044900019/flood.html.
European Council, 2007. EU Directive of the European Parliament and of the European Council on the assessment and management of flood risks (2007/60/EU).
Kemp, A.C., Horton, B.P., Donnelly, J.P., Mann, M.E., Vermeer, M., Rahmstorf, S., 2011. Climate related sea-level variations over the past two millennia. Proceedings of the National Academy of Sciences 108, 11017–11022. http://www.pnas.org/content/108/27/11017.short
Lewis J., 1999. Development in Disaster-prone Places: Studies of Vulnerability. London: IT Publications.
Migiros, G., Bathrellos, G., Skilodimou, H., Karamousalis, T., 2011. Pinios (Peneus) River (Central Greece): hydrological—geomorphological elements and changes during the quaternary. Open Geosciences 3(2), 215-228. http://www.degruyter.com/view/j/geo.2011.3.issue-2/s13533-011-0019-1/s13533-011-0019-1.xml
Morisawa M., 1976. Geomorphology laboratory manual. New York: Wiley & Sons.
NIFP, 2013. Floodplain management Guidebook (5th edition). FEMA.
Penning-Rowsell, E. C., Chatterton, J.B., 1977. The benefits of flood alleviation: A manual of assessment techniques. Aldershot: Gower Technical Press.
Skilodimou, H., Livaditis, G., Bathrellos, G., Verikiou-Papaspiridakou, E., 2003. Investigating the flooding events of the urban regions of Glyfada and Voula, Attica, Greece: a contribution to Urban Geomorphology. Geografiska Annaler 85(2), 197–204. http://onlinelibrary.wiley.com/doi/10.1111/1468-0459.00198/abstract
Warner, K., Bouwer, L.M., Ammann, W., 2007. Financial services and disaster risk
finance: Examples from the community level. Environmental Hazards 7(1), 32-39.
Zevenbergen, C., Cashman, A., Evelpidou, N., Pasche, E., Garvin, S., Ashley, R., 2010. Urban Flood Management. Taylor & Francis Group
Web pages
• http://tech.floodresilience.eu/fre-models-platform/smartest-fre-models • https://coast.noaa.gov/digitalcoast/tools/slr.html
• http://www.noaawatch.gov/themes/coastal_inundation.php • http://www.nhc.noaa.gov/surge/ • http://www.ecoslopes.com/global-warming/global-warming-coastal-flooding • http://www.usq.edu.au/course/material/env4203/summary1-70861.htm • www.aquatic.uoguelph.ca/rivers/chphys.htm • www.exit210.gr/topics/plimmires-athina • https://www.youtube.com/watch?v=kYUpkPTcqPY • http://www.dailymail.co.uk/news/article-2282815/Athens-floods-One-dead-
thousands-stranded-Athens-battered-biggest-storm-50-YEARS.html